Exhibit 99.2

Second Quarter 2025 Earnings Supplement August 13, 2025
Important Disclosure 2 This presentation is intended to provide general
information only and is not, and should not be considered, as an offer to purchase or sell the Company’s securities, or a proposal to receive such offers. In addition, this presentation is not an offer to the public of the Company’s securities.
By attending or viewing this presentation, each attendee (“Attendee”) agrees that he or she (i) has read this disclaimer, (ii) is bound by the restrictions set out herein, (iii) is permitted, in accordance with all applicable laws, to receive
such information, (iv) is solely responsible for his or her own assessment of the business and financial position of the Company and (v) will conduct his or her own analysis and be solely responsible for forming the Attendee's view of the
potential future performance of the Company’s business. This presentation includes projections, guidance, forecasts, estimates, assessments and other information pertaining to future events and/or matters, whose materialization is uncertain
and is beyond the Company’s control, and which constitute forward looking statements (within the meaning of Section 27A of the Securities Act of 1933, as amended, Section 21E of the Securities Exchange Act of 1934, as amended, and the Israeli
Securities Law, 5728-1968). Many of the forward-looking statements contained in this presentation can be identified by the use of forward-looking words such as “anticipate,” “believe,” “could,” “expect,” “should,” “plan,” “intend,” “estimate”
and “potential,” among others. Forward-looking statements include, but are not limited to, expectations and evaluations relating to the Company’s business and financial targets and strategy, the integration of the Company’s technology in
various systems and industries, the advantages of the Company’s existing and future products, timetables regarding completion of the Company’s developments and the Company’s intentions in relation to various industries, the Company’s intentions
in relation to the creation of collaborations and engagements in licensing agreements, production and distribution in various countries, and other statements regarding our intent, belief or current expectations. Forward-looking statements are
based on our management’s beliefs and assumptions and on information currently available to our management. Such statements are subject to risks and uncertainties, and actual results may differ materially from those expressed or implied in the
forward-looking statements due to various factors, including, but not limited to: our expectations regarding general market conditions, including as a result of the COVID-19 pandemic and other global economic trends; changes in consumer tastes
and preferences; fluctuations in inflation, interest rates and exchange rates in the global economic environment; the availability of qualified personnel and the ability to retain such personnel; changes in commodity costs, labor, distribution
and other operating costs; our ability to implement our growth strategy; changes in government regulation and tax matters; other factors that may affect our financial condition, liquidity and results of operations; general economic, political,
demographic and business conditions in Israel, including the ongoing war in Israel that began on October 7, 2023 and global perspectives regarding that conflict; the success of operating initiatives, including advertising and promotional
efforts and new product and concept development by us and our competitors; factors relating to acquisitions made by the Company, including our ability to effectively and efficiently integrate acquired businesses into our existing business; and
other risk factors discussed under “Risk Factors” in our annual report on Form 20-F filed with the SEC on March 4 , 2025 (our “Annual Report"). The preceding list is not intended to be an exhaustive list of all of our forward-looking
statements. The forward-looking statements are based on our beliefs, assumptions and expectations of future performance, taking into account the information currently available to us. These statements are only estimates based upon our current
expectations and projections about future events. There are important factors that could cause our actual results, levels of activity, performance or achievements to differ materially from the results, levels of activity, performance or
achievements expressed or implied by the forward-looking statements. In particular, you should consider the risks provided under “Risk Factors” in our Annual Report. You should not rely upon forward-looking statements as predictions of future
events. Although we believe that the expectations reflected in the forward-looking statements are reasonable, we cannot guarantee that future results, levels of activity, performance and events and circumstances reflected in the forward-looking
statements will be achieved or will occur. Each forward-looking statement speaks only as of the date of the particular statement. Except as required by law, we undertake no obligation to update publicly any forward-looking statements provided
in this presentation for any reason, to conform these statements to actual results or to changes in our expectations. In addition, the presentation includes data published by various bodies, and data provided to the Company in the framework
of cooperation engagements, concerning the industry, competitive position and markets in which the Company operates, whose content was not independently verified by the Company, such that the Company is not responsible for the accuracy or
completeness of such date or whether the data is up-to-date, and Company takes no responsibility for any reliance on such data. Management estimates contained in this presentation are derived from publicly available information released by
independent industry analysts and other third-party sources, as well as data from the Company's internal research, and are based on assumptions made by the Company upon review of such data, and the Company's experience in, and knowledge of, the
industry and markets in which the Company operates. Although the Company believes these management estimates are reasonable, projections, assumptions and estimates of the future performance of the industry in which the Company operates and the
Company's future performance are necessarily subject to uncertainty and risk due to a variety of factors, including those described above. These and other factors could cause results to differ materially from those expressed in the estimates
made by independent parties and by the Company. Industry publications, research, surveys and studies generally state that the information they provide has been obtained from sources believed to be reliable, but that the accuracy and
completeness of such information is not guaranteed. Forecasts and other forward-looking information obtained from these sources are subject to the same qualifications and uncertainties as the other forward-looking statements in this
presentation. In addition to various operational metrics and financial measures in accordance with accounting principles generally accepted under International Financial Reporting Standards, or IFRS, this presentation contains Adjusted
EBITDA, Free Cash Flow and Adjusted OPEX, each a non-IFRS financial measure provided to help evaluate our past results and future prospects. Please refer to the appendix for of this presentation for a definition of Adjusted EBITDA, Free Cash
Flow and Adjusted OPEX as well as reconciliations of Adjusted EBITDA to net income (loss), Free Cash Flow to operating cash and Adjusted OPEX to OPEX. Due to the inherent difficulty in forecasting and quantifying the amounts of certain items
that are necessary for such reconciliation, the Company is not able, without unreasonable effort, to provide a reconciliation of forward-looking Adjusted EBITDA to IFRS net income (loss), in particular because items such as finance expenses and
issuance and acquisition costs used to calculate projected net income (loss) vary dramatically based on actual events. Therefore, the Company is not able to forecast on an IFRS basis with reasonable certainty all deductions needed in order to
provide an IFRS calculation of projected net income (loss) at this time. The amount of these deductions may be material and therefore could result in projected IFRS net income (loss) being materially less than projected Adjusted EBITDA
(non-IFRS). The Company and its licensors have proprietary rights to trademarks used in this presentation. Solely for convenience, trademarks and trade names referred to in this presentation may appear without the “®” or “TM” symbols, but
the lack of such references is not intended to indicate, in any way, that the Company will not assert, to the fullest extent possible under applicable law, its rights or the rights of the applicable licensor to these trademarks and trade names.
This presentation also contains trademarks, trade names and service marks of other companies, which are the property of their respective owners and are used here for reference purposes only. Such use of other parties’ trademarks, trade names or
service marks should not be construed to imply a relationship with, or an endorsement or sponsorship of the Company, by any other party.

Today’s Presenters 3 Yair Nechmad CEO & Co-Founder Sagit Manor CFO

Simplifying commerce and payments for retailers, driving growth while
optimizing operations and enhancing consumer engagement Our Mission Vending Amusement Self-Service Kiosks Laundromats Car Wash & Air Vac Kiddie Rides Food Trucks Restaurants Micro Markets EV Energy Massage Chair Parking 4

Q2 2025 Highlights 5
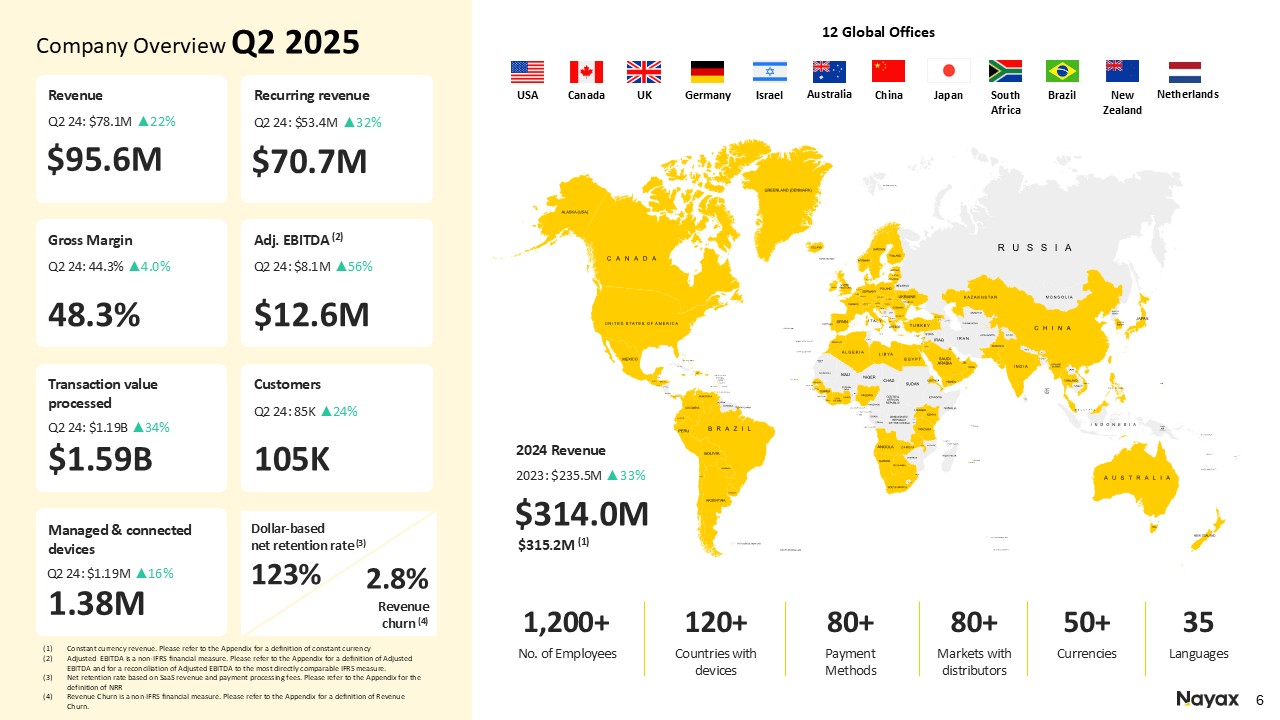
12 Global Offices No. of Employees 1,200+ Countries with
devices 120+ Payment Methods 80+ Markets with distributors 80+ Currencies 50+ Languages 35 Company Overview Q2 2025 Revenue $95.6M Q2 24: $78.1M ▲22% Recurring revenue $70.7M Q2 24: $53.4M ▲32% Gross Margin 48.3% Q2 24:
44.3% ▲4.0% Adj. EBITDA (2) $12.6M Q2 24: $8.1M ▲56% Transaction value processed $1.59B Customers 105K Managed & connected devices 1.38M Revenue churn (4) 2.8% Q2 24: $1.19B ▲34% Q2 24: 85K ▲24% Dollar-basednet retention rate
(3) 123% Q2 24: $1.19M ▲16% Constant currency revenue. Please refer to the Appendix for a definition of constant currency Adjusted EBITDA is a non-IFRS financial measure. Please refer to the Appendix for a definition of Adjusted EBITDA and
for a reconciliation of Adjusted EBITDA to the most directly comparable IFRS measure. Net retention rate based on SaaS revenue and payment processing fees. Please refer to the Appendix for the definition of NRR Revenue Churn is a non-IFRS
financial measure. Please refer to the Appendix for a definition of Revenue Churn. Canada USA UK Israel Germany Australia China Japan South Africa Brazil New Zealand Netherlands 2024 Revenue $314.0M $315.2M
(1) 2023: $235.5M ▲33%
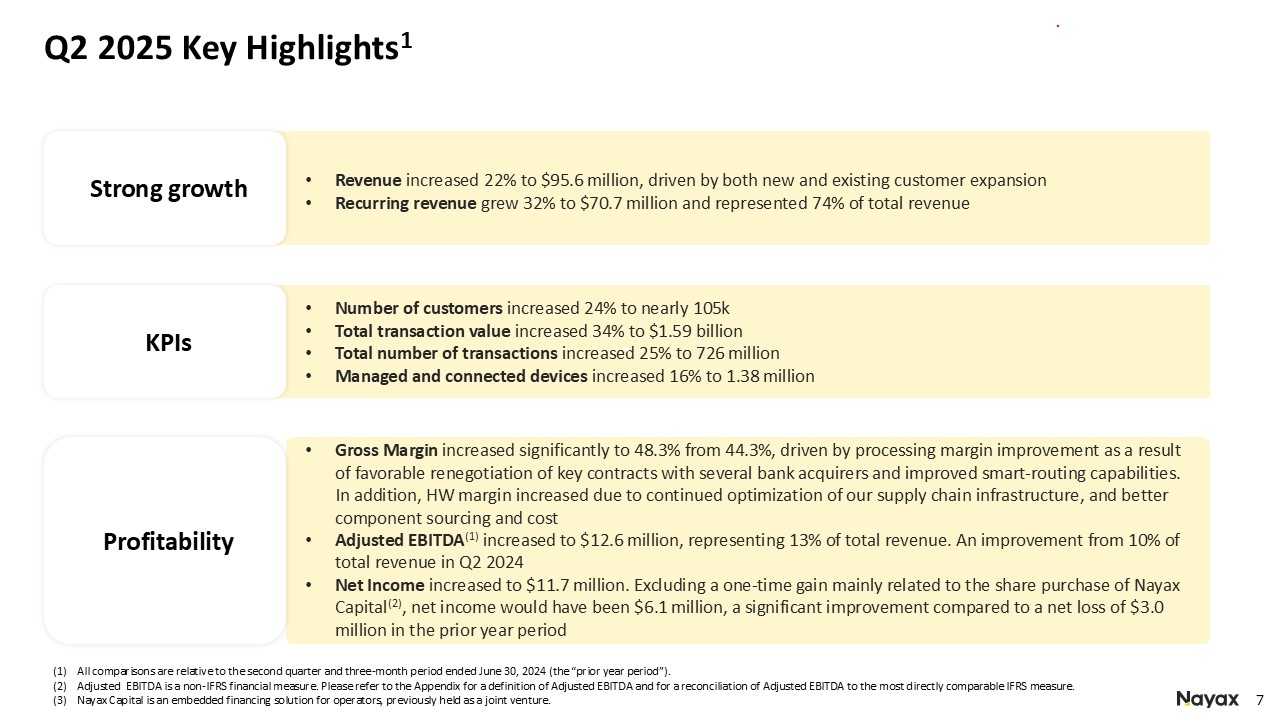
Strong growth Q2 2025 Key Highlights1 Revenue increased 22% to $95.6 million,
driven by both new and existing customer expansion Recurring revenue grew 32% to $70.7 million and represented 74% of total revenue Number of customers increased 24% to nearly 105k Total transaction value increased 34% to $1.59
billion Total number of transactions increased 25% to 726 million Managed and connected devices increased 16% to 1.38 million KPIs Profitability Gross Margin increased significantly to 48.3% from 44.3%, driven by processing margin
improvement as a result of favorable renegotiation of key contracts with several bank acquirers and improved smart-routing capabilities. In addition, HW margin increased due to continued optimization of our supply chain infrastructure, and
better component sourcing and cost Adjusted EBITDA(1) increased to $12.6 million, representing 13% of total revenue. An improvement from 10% of total revenue in Q2 2024 Net Income increased to $11.7 million. Excluding a one-time gain mainly
related to the share purchase of Nayax Capital(2), net income would have been $6.1 million, a significant improvement compared to a net loss of $3.0 million in the prior year period All comparisons are relative to the second quarter and
three-month period ended June 30, 2024 (the “prior year period”). Adjusted EBITDA is a non-IFRS financial measure. Please refer to the Appendix for a definition of Adjusted EBITDA and for a reconciliation of Adjusted EBITDA to the most
directly comparable IFRS measure. Nayax Capital is an embedded financing solution for operators, previously held as a joint venture.
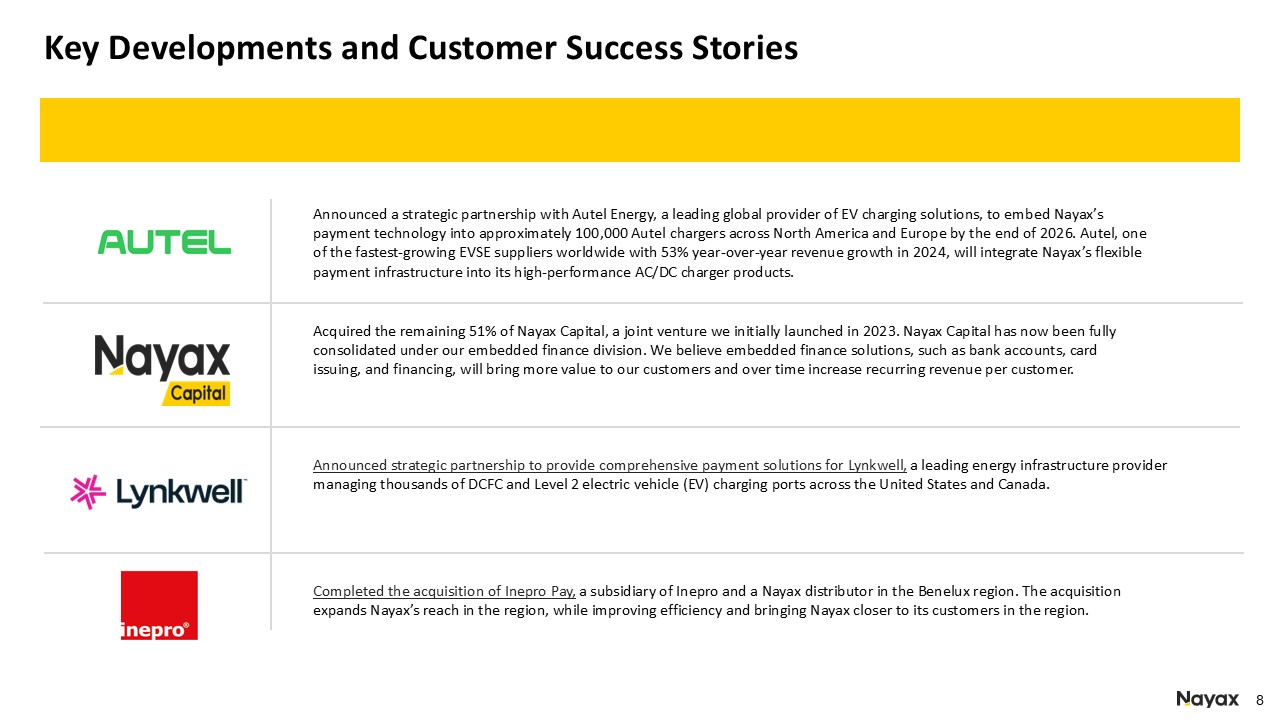
Key Developments and Customer Success Stories Announced a strategic partnership
with Autel Energy, a leading global provider of EV charging solutions, to embed Nayax’s payment technology into approximately 100,000 Autel chargers across North America and Europe by the end of 2026. Autel, one of the fastest-growing EVSE
suppliers worldwide with 53% year-over-year revenue growth in 2024, will integrate Nayax’s flexible payment infrastructure into its high-performance AC/DC charger products. Acquired the remaining 51% of Nayax Capital, a joint venture we
initially launched in 2023. Nayax Capital has now been fully consolidated under our embedded finance division. We believe embedded finance solutions, such as bank accounts, card issuing, and financing, will bring more value to our customers and
over time increase recurring revenue per customer. Completed the acquisition of Inepro Pay, a subsidiary of Inepro and a Nayax distributor in the Benelux region. The acquisition expands Nayax’s reach in the region, while improving efficiency
and bringing Nayax closer to its customers in the region. Announced strategic partnership to provide comprehensive payment solutions for Lynkwell, a leading energy infrastructure provider managing thousands of DCFC and Level 2 electric
vehicle (EV) charging ports across the United States and Canada.
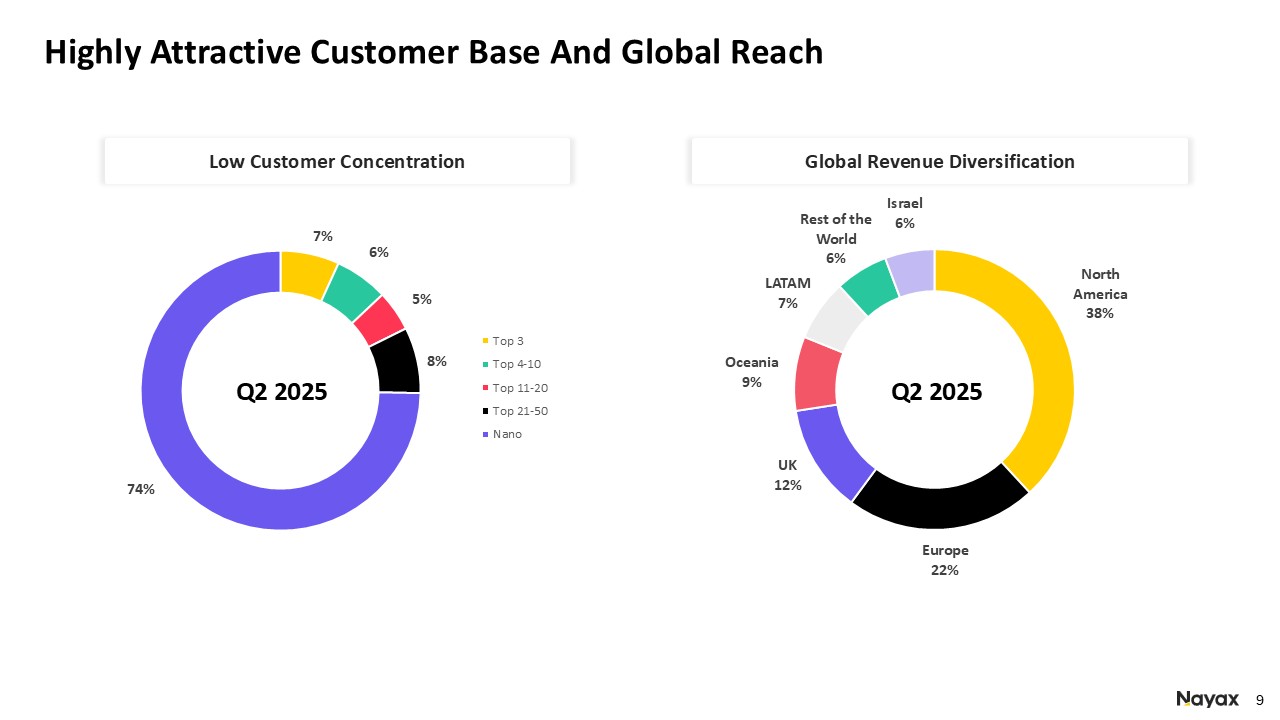
Highly Attractive Customer Base And Global Reach Low Customer
Concentration Global Revenue Diversification Q2 2025 Q2 2025
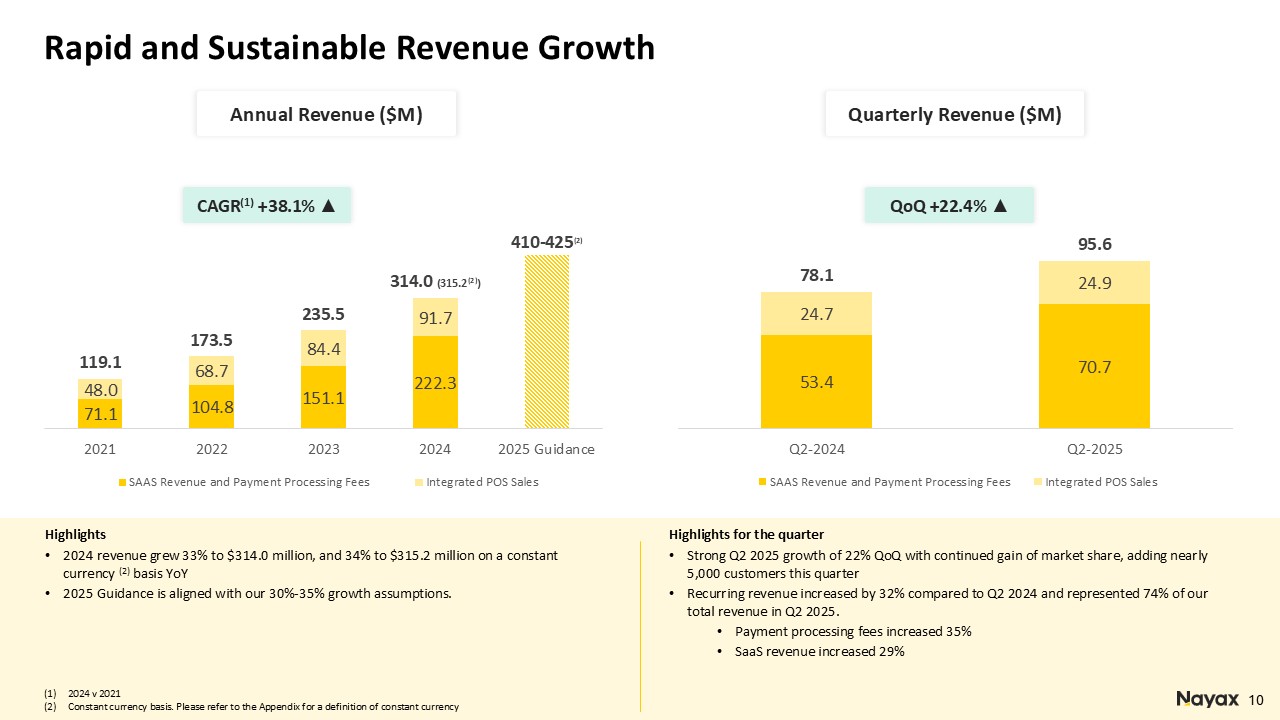
Rapid and Sustainable Revenue Growth Highlights 2024 revenue grew 33% to $314.0
million, and 34% to $315.2 million on a constant currency (2) basis YoY 2025 Guidance is aligned with our 30%-35% growth assumptions. 2024 v 2021 Constant currency basis. Please refer to the Appendix for a definition of constant
currency CAGR(1) +38.1% ▲ 10 Annual Revenue ($M) Quarterly Revenue ($M) QoQ +22.4% ▲ Highlights for the quarter Strong Q2 2025 growth of 22% QoQ with continued gain of market share, adding nearly 5,000 customers this quarter Recurring
revenue increased by 32% compared to Q2 2024 and represented 74% of our total revenue in Q2 2025. Payment processing fees increased 35% SaaS revenue increased 29%
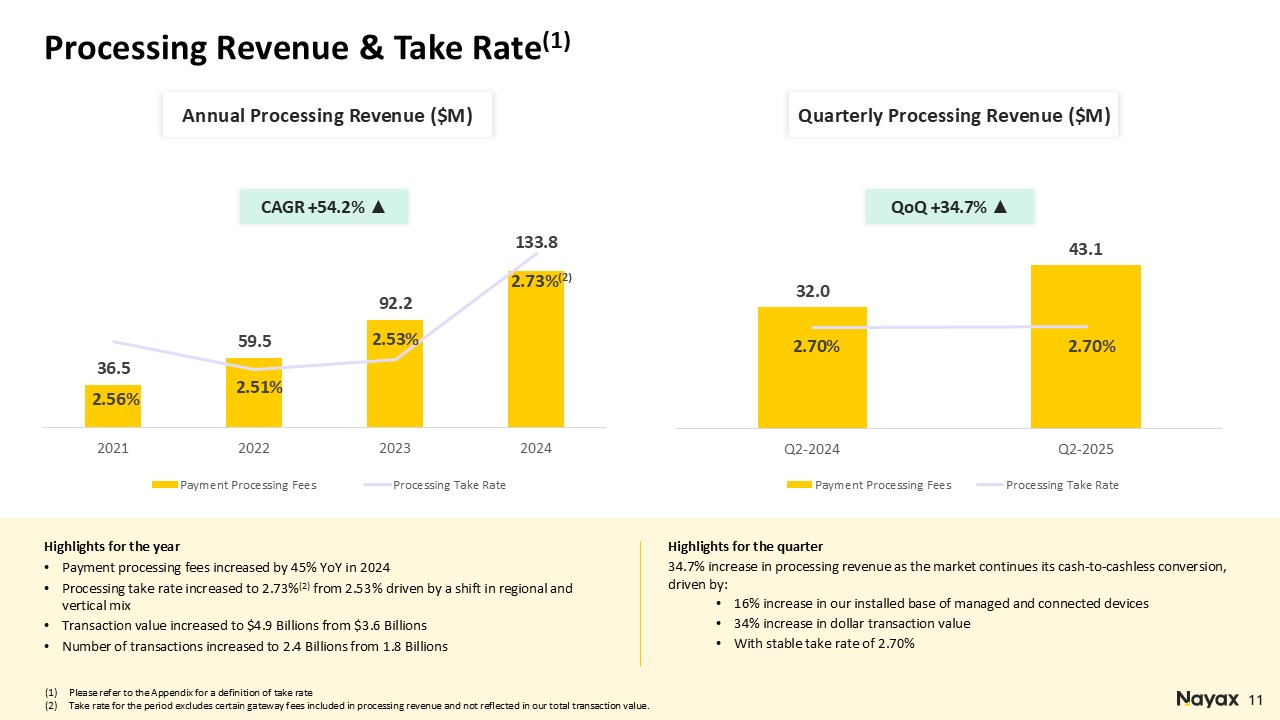
Processing Revenue & Take Rate(1) CAGR +54.2% ▲ 11 Annual Processing
Revenue ($M) Quarterly Processing Revenue ($M) QoQ +34.7% ▲ Please refer to the Appendix for a definition of take rate Take rate for the period excludes certain gateway fees included in processing revenue and not reflected in our total
transaction value. Highlights for the year Payment processing fees increased by 45% YoY in 2024 Processing take rate increased to 2.73%(2) from 2.53% driven by a shift in regional and vertical mix Transaction value increased to $4.9
Billions from $3.6 Billions Number of transactions increased to 2.4 Billions from 1.8 Billions Highlights for the quarter 34.7% increase in processing revenue as the market continues its cash-to-cashless conversion, driven by: 16%
increase in our installed base of managed and connected devices 34% increase in dollar transaction value With stable take rate of 2.70%
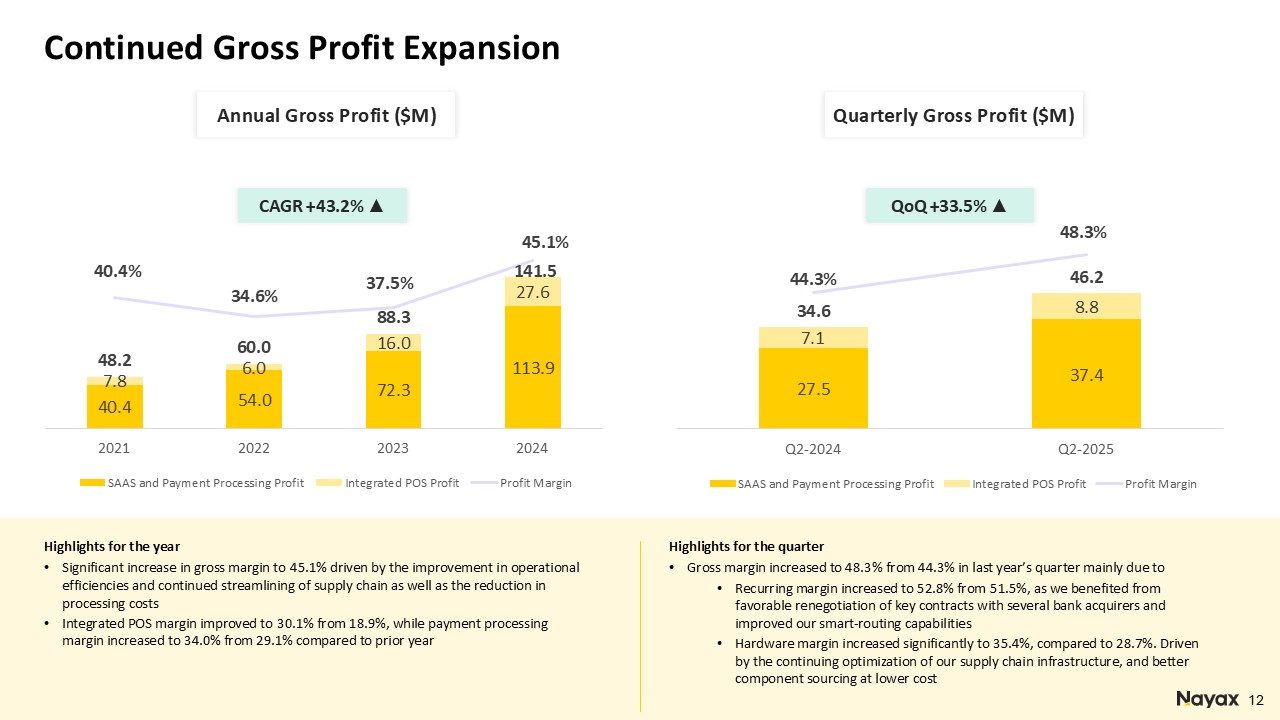
Continued Gross Profit Expansion CAGR +43.2% ▲ 12 Annual Gross Profit
($M) Quarterly Gross Profit ($M) QoQ +33.5% ▲ Highlights for the year Significant increase in gross margin to 45.1% driven by the improvement in operational efficiencies and continued streamlining of supply chain as well as the reduction in
processing costs Integrated POS margin improved to 30.1% from 18.9%, while payment processing margin increased to 34.0% from 29.1% compared to prior year Highlights for the quarter Gross margin increased to 48.3% from 44.3% in last year’s
quarter mainly due to Recurring margin increased to 52.8% from 51.5%, as we benefited from favorable renegotiation of key contracts with several bank acquirers and improved our smart-routing capabilities Hardware margin increased
significantly to 35.4%, compared to 28.7%. Driven by the continuing optimization of our supply chain infrastructure, and better component sourcing at lower cost
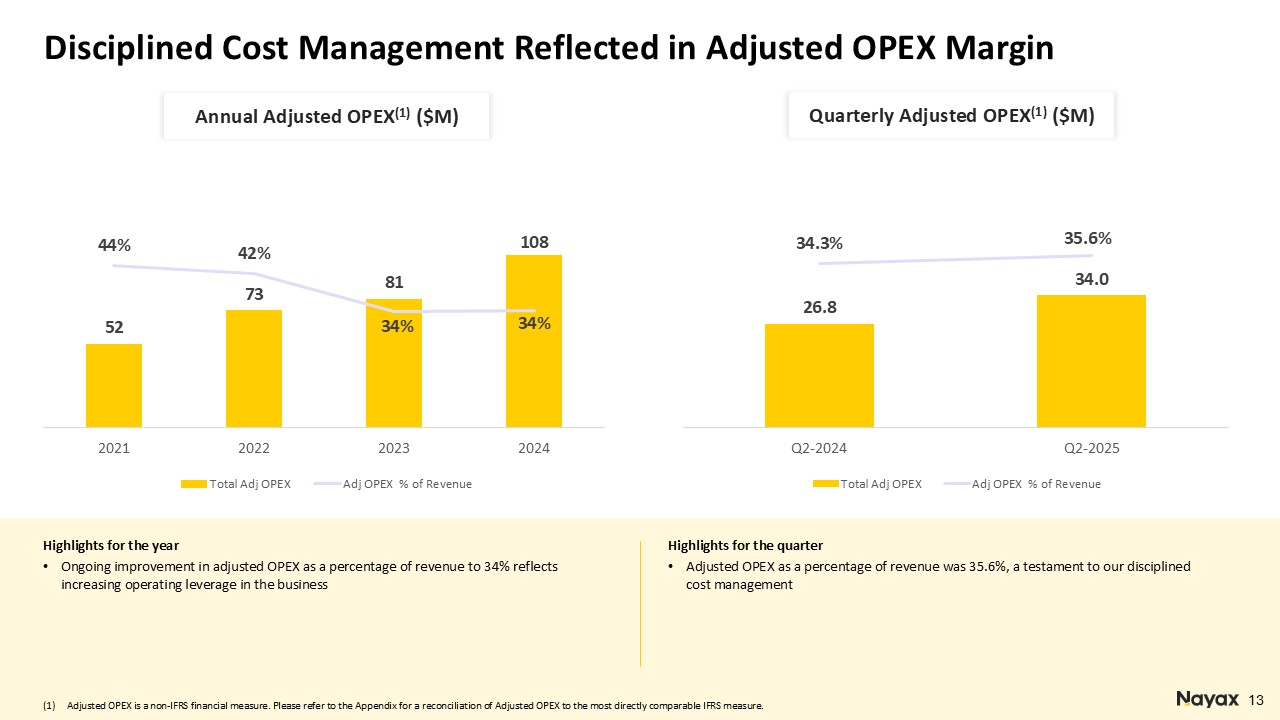
Disciplined Cost Management Reflected in Adjusted OPEX Margin 13 Annual Adjusted
OPEX(1) ($M) Quarterly Adjusted OPEX(1) ($M) Highlights for the year Ongoing improvement in adjusted OPEX as a percentage of revenue to 34% reflects increasing operating leverage in the business Highlights for the quarter Adjusted OPEX
as a percentage of revenue was 35.6%, a testament to our disciplined cost management Adjusted OPEX is a non-IFRS financial measure. Please refer to the Appendix for a reconciliation of Adjusted OPEX to the most directly comparable IFRS
measure.
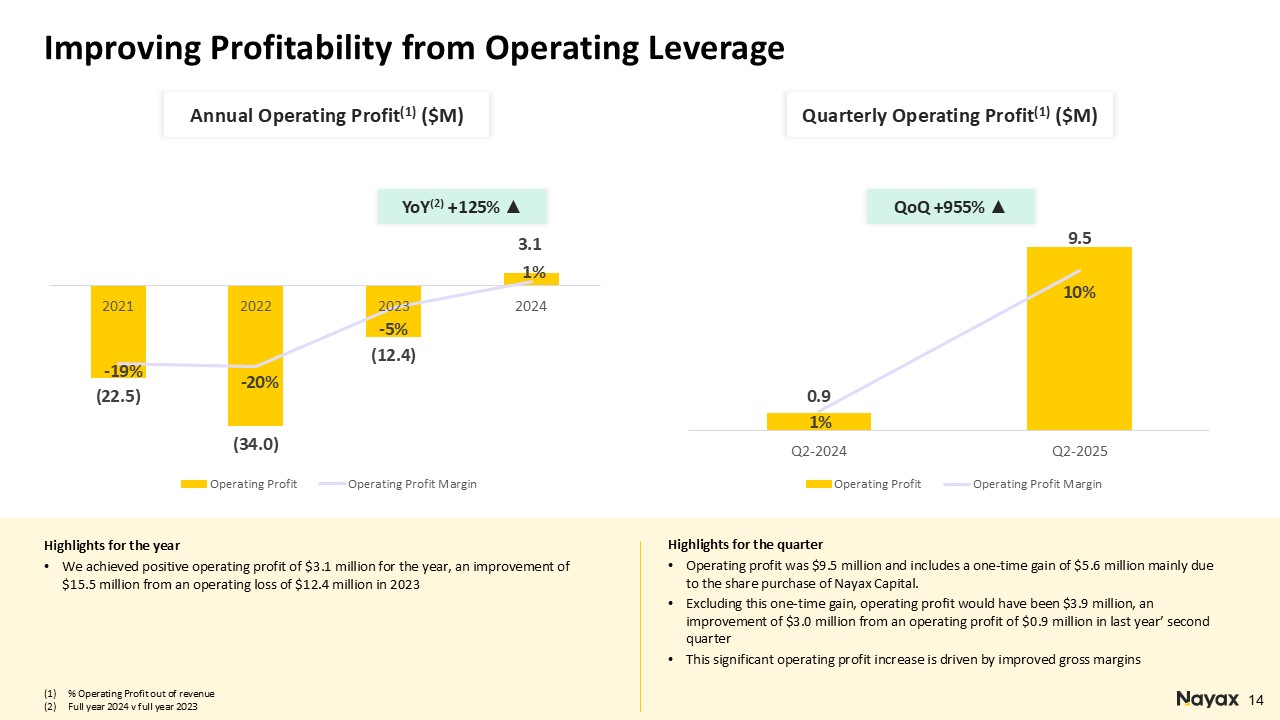
Improving Profitability from Operating Leverage YoY(2) +125% ▲ 14 Annual
Operating Profit(1) ($M) Quarterly Operating Profit(1) ($M) QoQ +955% ▲ % Operating Profit out of revenue Full year 2024 v full year 2023 Highlights for the year We achieved positive operating profit of $3.1 million for the year, an
improvement of $15.5 million from an operating loss of $12.4 million in 2023 Highlights for the quarter Operating profit was $9.5 million and includes a one-time gain of $5.6 million mainly due to the share purchase of Nayax Capital.
Excluding this one-time gain, operating profit would have been $3.9 million, an improvement of $3.0 million from an operating profit of $0.9 million in last year’ second quarter This significant operating profit increase is driven by
improved gross margins
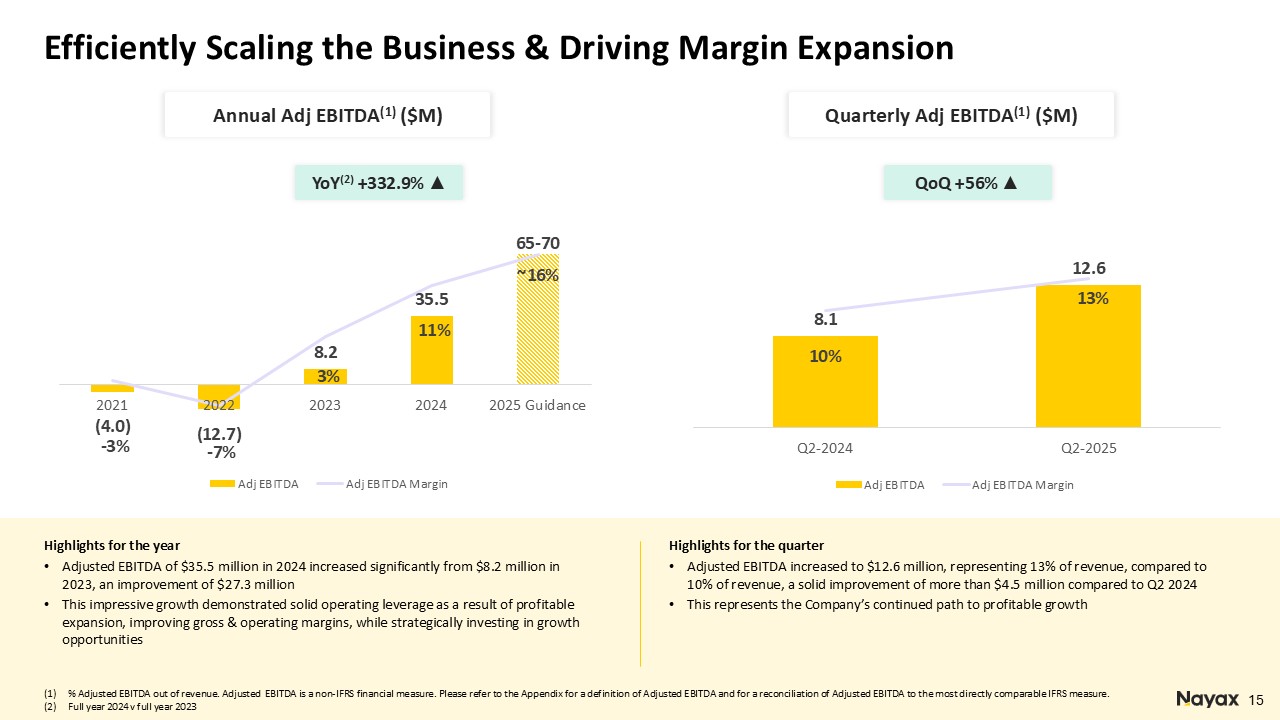
Efficiently Scaling the Business & Driving Margin Expansion YoY(2) +332.9% ▲
15 Annual Adj EBITDA(1) ($M) Quarterly Adj EBITDA(1) ($M) QoQ +56% ▲ % Adjusted EBITDA out of revenue. Adjusted EBITDA is a non-IFRS financial measure. Please refer to the Appendix for a definition of Adjusted EBITDA and for
a reconciliation of Adjusted EBITDA to the most directly comparable IFRS measure. Full year 2024 v full year 2023 Highlights for the year Adjusted EBITDA of $35.5 million in 2024 increased significantly from $8.2 million in 2023, an
improvement of $27.3 million This impressive growth demonstrated solid operating leverage as a result of profitable expansion, improving gross & operating margins, while strategically investing in growth opportunities Highlights for the
quarter Adjusted EBITDA increased to $12.6 million, representing 13% of revenue, compared to 10% of revenue, a solid improvement of more than $4.5 million compared to Q2 2024 This represents the Company’s continued path to profitable
growth
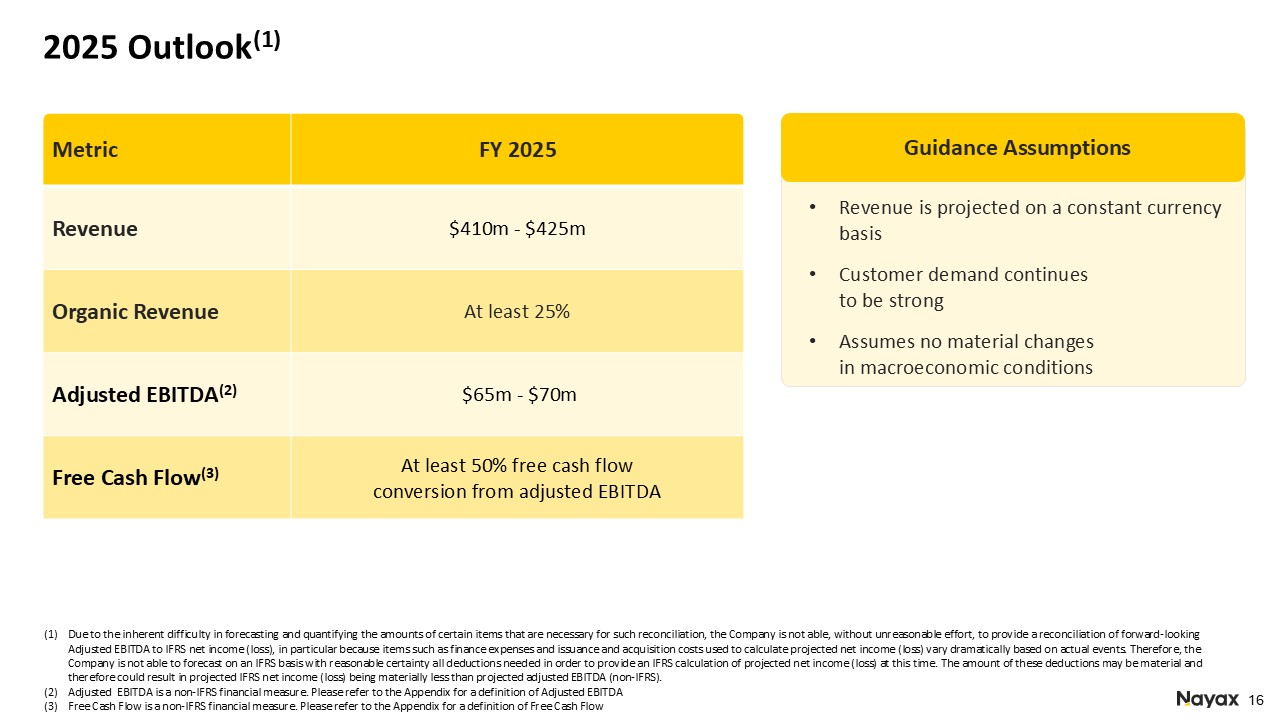
2025 Outlook(1) Guidance Assumptions Revenue is projected on a constant currency
basis Customer demand continues to be strong Assumes no material changes in macroeconomic conditions Metric FY 2025 Revenue $410m - $425m Organic Revenue At least 25% Adjusted EBITDA(2) $65m - $70m Free Cash Flow(3) At least 50%
free cash flow conversion from adjusted EBITDA Due to the inherent difficulty in forecasting and quantifying the amounts of certain items that are necessary for such reconciliation, the Company is not able, without unreasonable effort, to
provide a reconciliation of forward-looking Adjusted EBITDA to IFRS net income (loss), in particular because items such as finance expenses and issuance and acquisition costs used to calculate projected net income (loss) vary dramatically based
on actual events. Therefore, the Company is not able to forecast on an IFRS basis with reasonable certainty all deductions needed in order to provide an IFRS calculation of projected net income (loss) at this time. The amount of these
deductions may be material and therefore could result in projected IFRS net income (loss) being materially less than projected adjusted EBITDA (non-IFRS). Adjusted EBITDA is a non-IFRS financial measure. Please refer to the Appendix for a
definition of Adjusted EBITDA Free Cash Flow is a non-IFRS financial measure. Please refer to the Appendix for a definition of Free Cash Flow
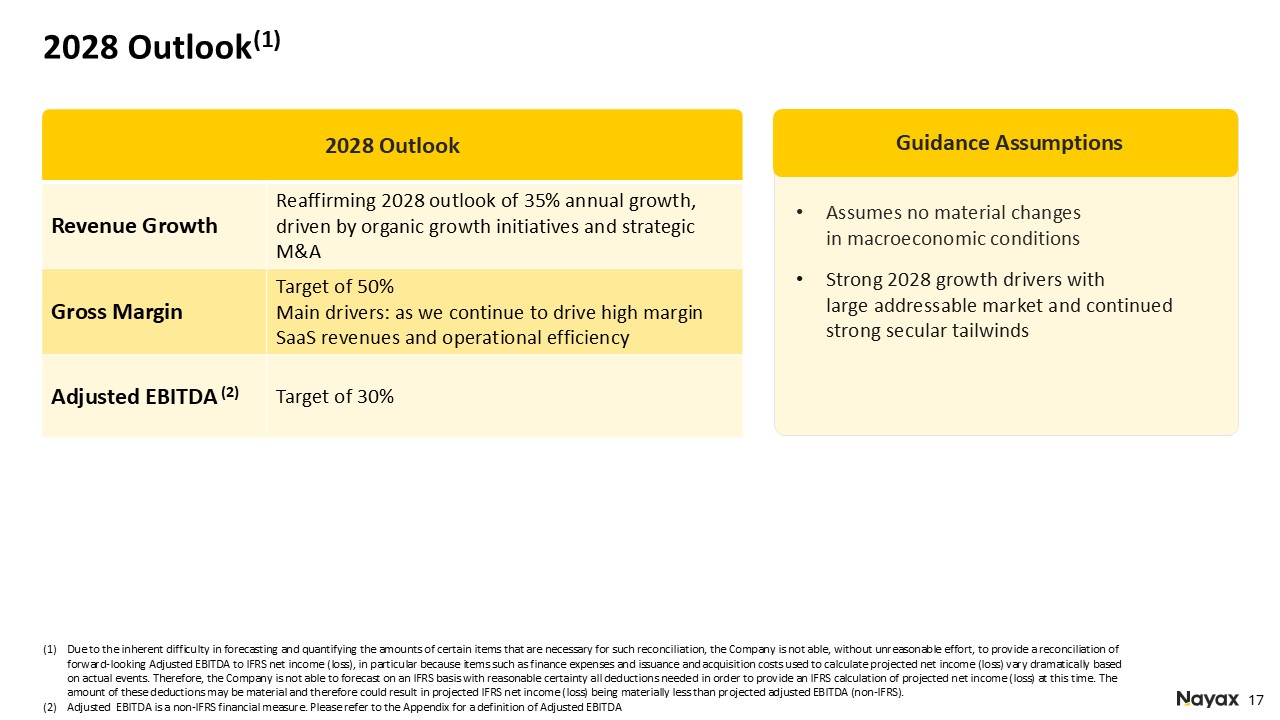
Assumes no material changes in macroeconomic conditions Strong 2028 growth
drivers with large addressable market and continued strong secular tailwinds Due to the inherent difficulty in forecasting and quantifying the amounts of certain items that are necessary for such reconciliation, the Company is not able,
without unreasonable effort, to provide a reconciliation of forward-looking Adjusted EBITDA to IFRS net income (loss), in particular because items such as finance expenses and issuance and acquisition costs used to calculate projected net
income (loss) vary dramatically based on actual events. Therefore, the Company is not able to forecast on an IFRS basis with reasonable certainty all deductions needed in order to provide an IFRS calculation of projected net income (loss) at
this time. The amount of these deductions may be material and therefore could result in projected IFRS net income (loss) being materially less than projected adjusted EBITDA (non-IFRS). Adjusted EBITDA is a non-IFRS financial measure. Please
refer to the Appendix for a definition of Adjusted EBITDA 2028 Outlook Revenue Growth Reaffirming 2028 outlook of 35% annual growth, driven by organic growth initiatives and strategic M&A Gross Margin Target of 50%Main drivers: as we
continue to drive high margin SaaS revenues and operational efficiency Adjusted EBITDA (2) Target of 30% Guidance Assumptions 2028 Outlook(1)

Appendix 18
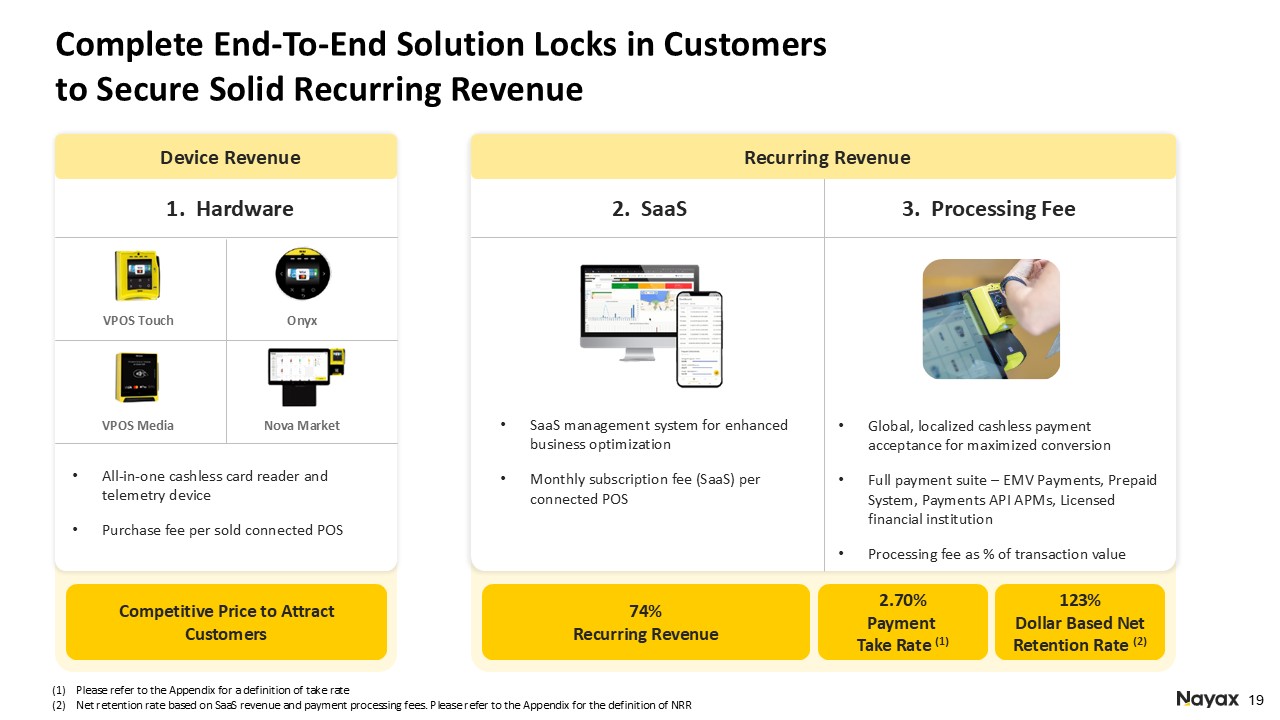
Complete End-To-End Solution Locks in Customers to Secure Solid Recurring
Revenue Device Revenue VPOS Touch All-in-one cashless card reader and telemetry device Purchase fee per sold connected POS Onyx VPOS Media Nova Market Competitive Price to Attract Customers 1. Hardware 2. SaaS 3. Processing Fee 74%
Recurring Revenue 2.70% Payment Take Rate (1) 123% Dollar Based Net Retention Rate (2) SaaS management system for enhanced business optimization Monthly subscription fee (SaaS) per connected POS Global, localized cashless payment
acceptance for maximized conversion Full payment suite – EMV Payments, Prepaid System, Payments API APMs, Licensed financial institution Processing fee as % of transaction value Please refer to the Appendix for a definition of take
rate Net retention rate based on SaaS revenue and payment processing fees. Please refer to the Appendix for the definition of NRR Recurring Revenue
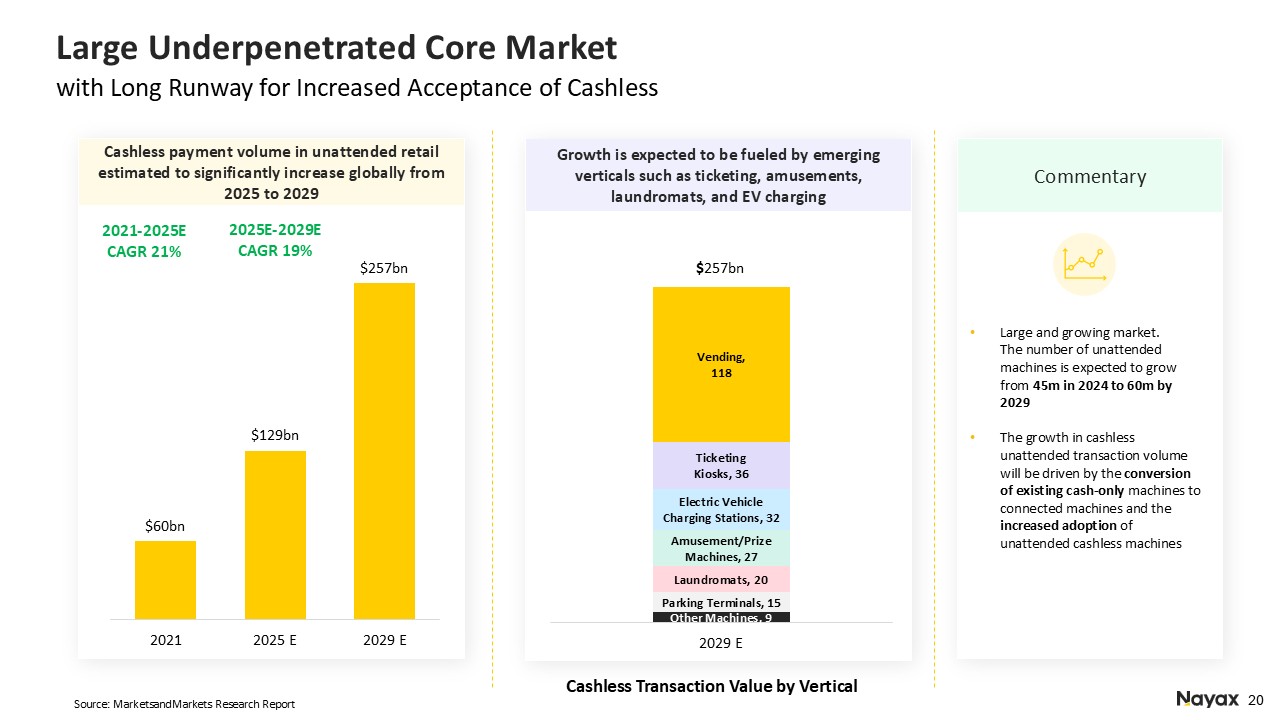
Large Underpenetrated Core Market with Long Runway for Increased Acceptance of
Cashless Source: MarketsandMarkets Research Report Growth is expected to be fueled by emerging verticals such as ticketing, amusements, laundromats, and EV charging Cashless Transaction Value by Vertical $257bn Large and growing market.
The number of unattended machines is expected to grow from 45m in 2024 to 60m by 2029 The growth in cashless unattended transaction volume will be driven by the conversion of existing cash-only machines to connected machines and the increased
adoption of unattended cashless machines Cashless payment volume in unattended retail estimated to significantly increase globally from 2025 to 2029 Commentary 2021-2025E CAGR 21% 2025E-2029E CAGR 19%
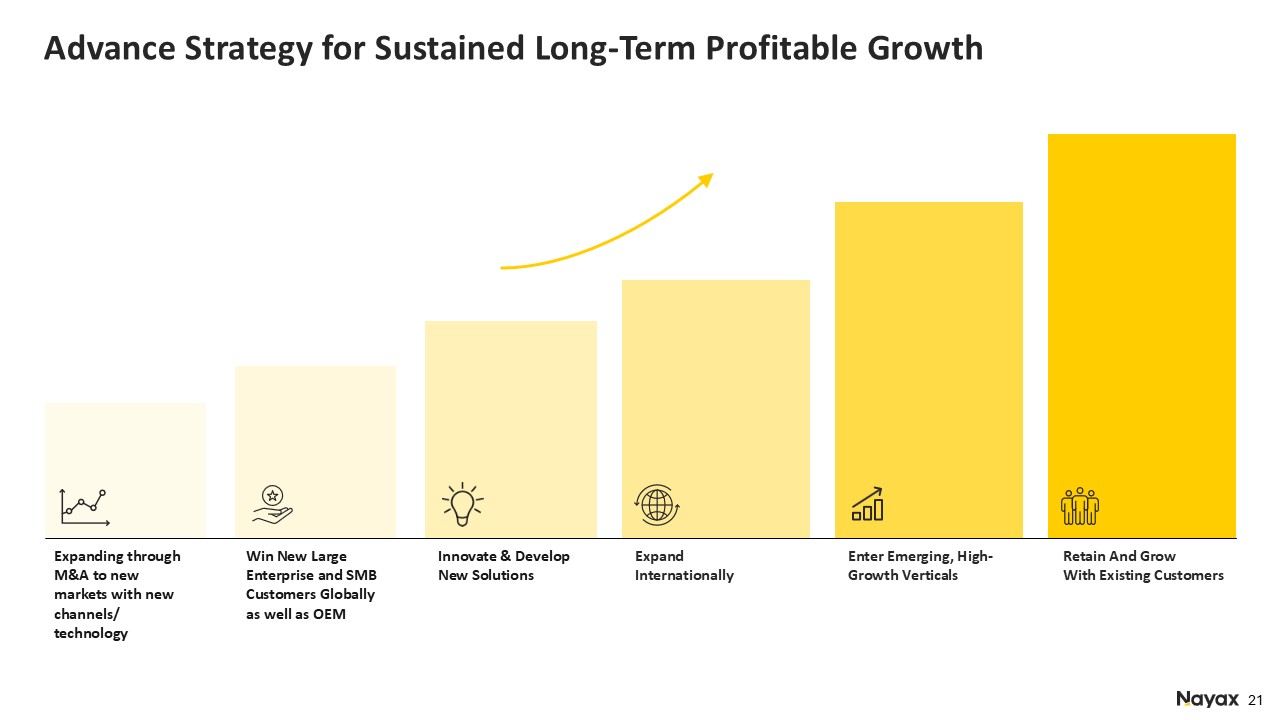
Advance Strategy for Sustained Long-Term Profitable
Growth Expand Internationally Enter Emerging, High-Growth Verticals Retain And Grow With Existing Customers Innovate & Develop New Solutions Win New Large Enterprise and SMB Customers Globally as well as OEM Expanding through
M&A to new markets with new channels/ technology
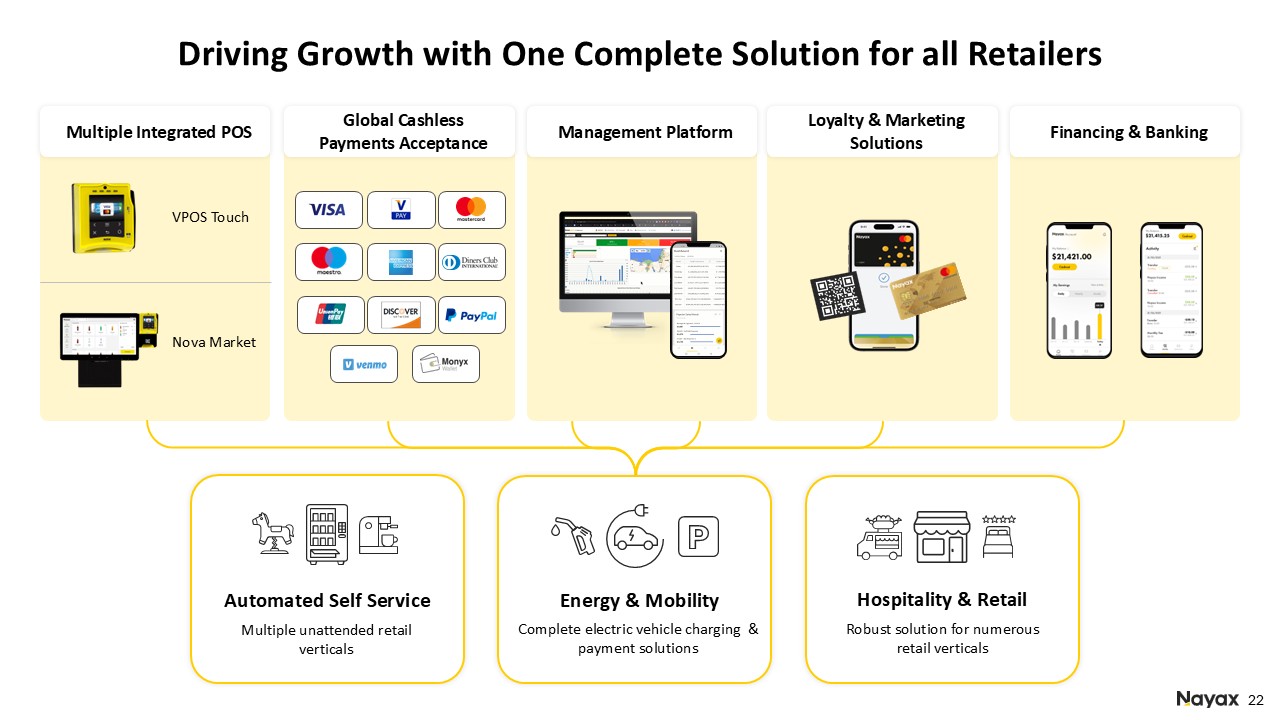
Driving Growth with One Complete Solution for all Retailers Global Cashless
Payments Acceptance Multiple Integrated POS VPOS Touch Nova Market Management Platform Loyalty & Marketing Solutions Financing & Banking Multiple unattended retail verticals Automated Self Service Hospitality &
Retail Robust solution for numerous retail verticals Complete electric vehicle charging & payment solutions Energy & Mobility
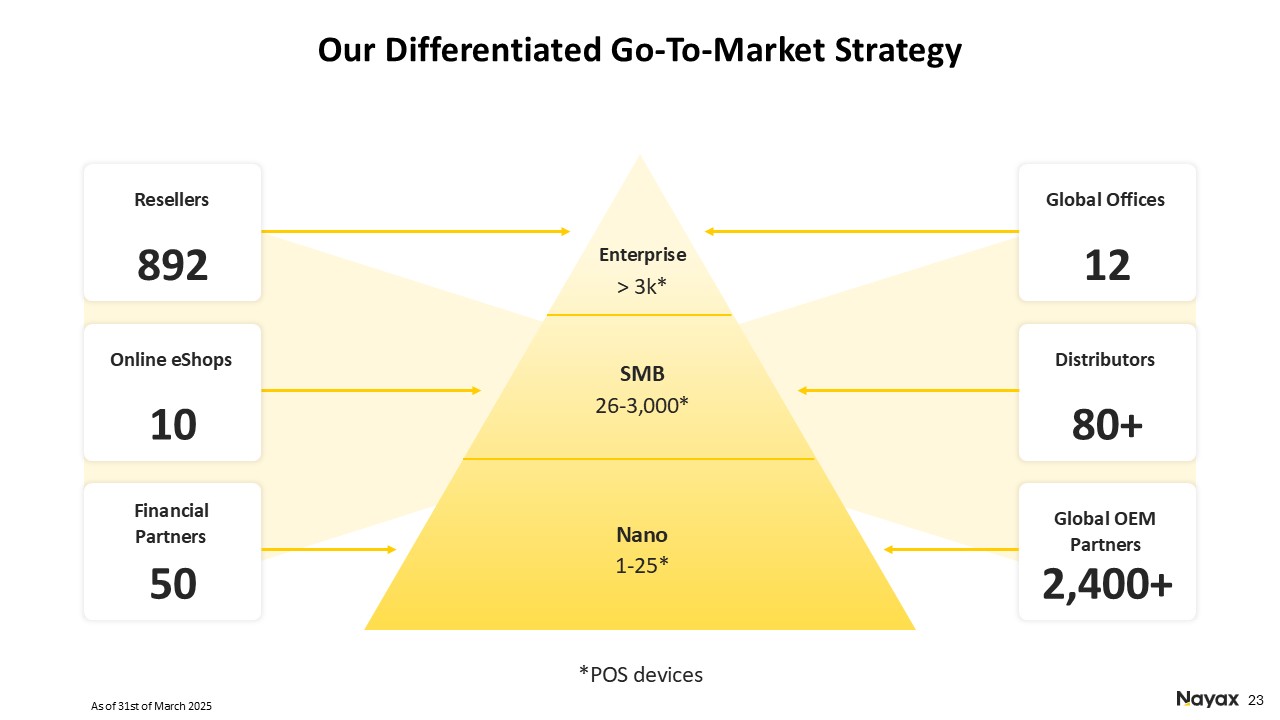
Our Differentiated Go-To-Market Strategy Global Offices 12 *POS
devices Distributors 80+ Global OEM Partners 2,400+ Resellers 892 Online eShops 10 Financial Partners 50 Nano 1-25* SMB 26-3,000* Enterprise > 3k* As of 31st of March 2025
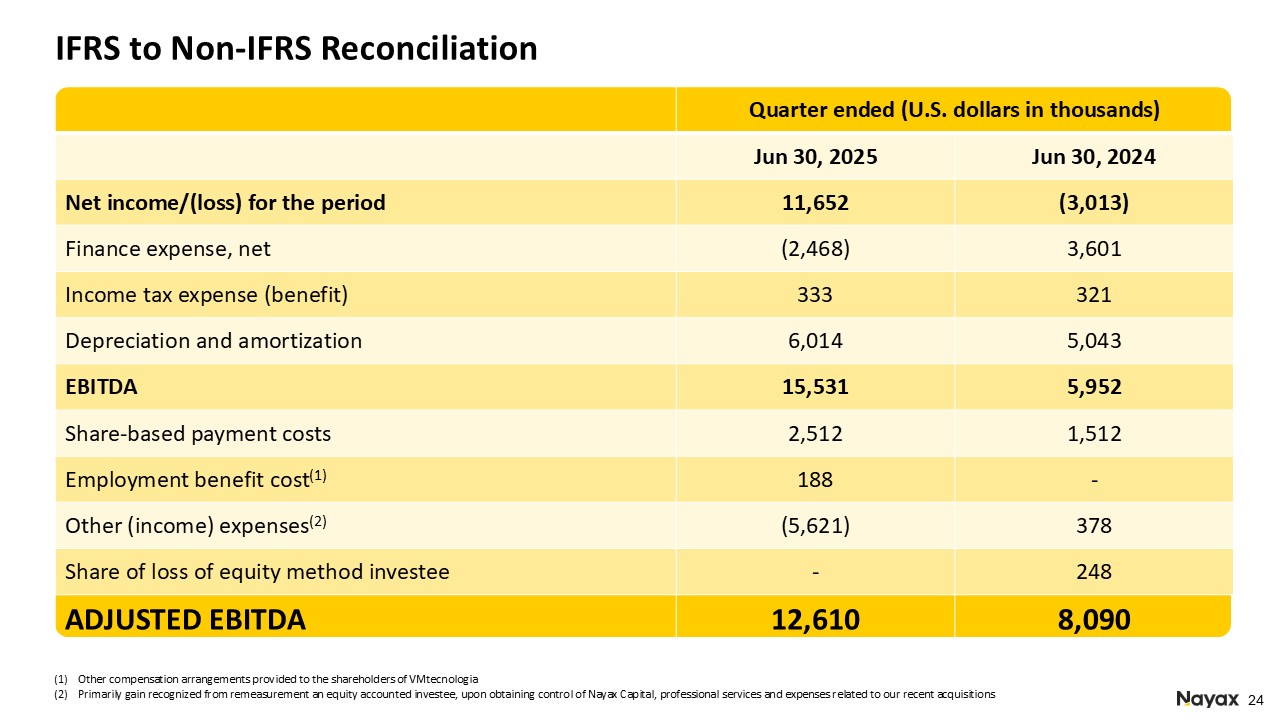
IFRS to Non-IFRS Reconciliation Other compensation arrangements provided to the
shareholders of VMtecnologia Primarily gain recognized from remeasurement an equity accounted investee, upon obtaining control of Nayax Capital, professional services and expenses related to our recent acquisitions Quarter ended (U.S. dollars
in thousands) Jun 30, 2025 Jun 30, 2024 Net income/(loss) for the period 11,652 (3,013) Finance expense, net (2,468) 3,601 Income tax expense (benefit) 333 321 Depreciation and
amortization 6,014 5,043 EBITDA 15,531 5,952 Share-based payment costs 2,512 1,512 Employment benefit cost(1) 188 - Other (income) expenses(2) (5,621) 378 Share of loss of equity method investee - 248 ADJUSTED
EBITDA 12,610 8,090
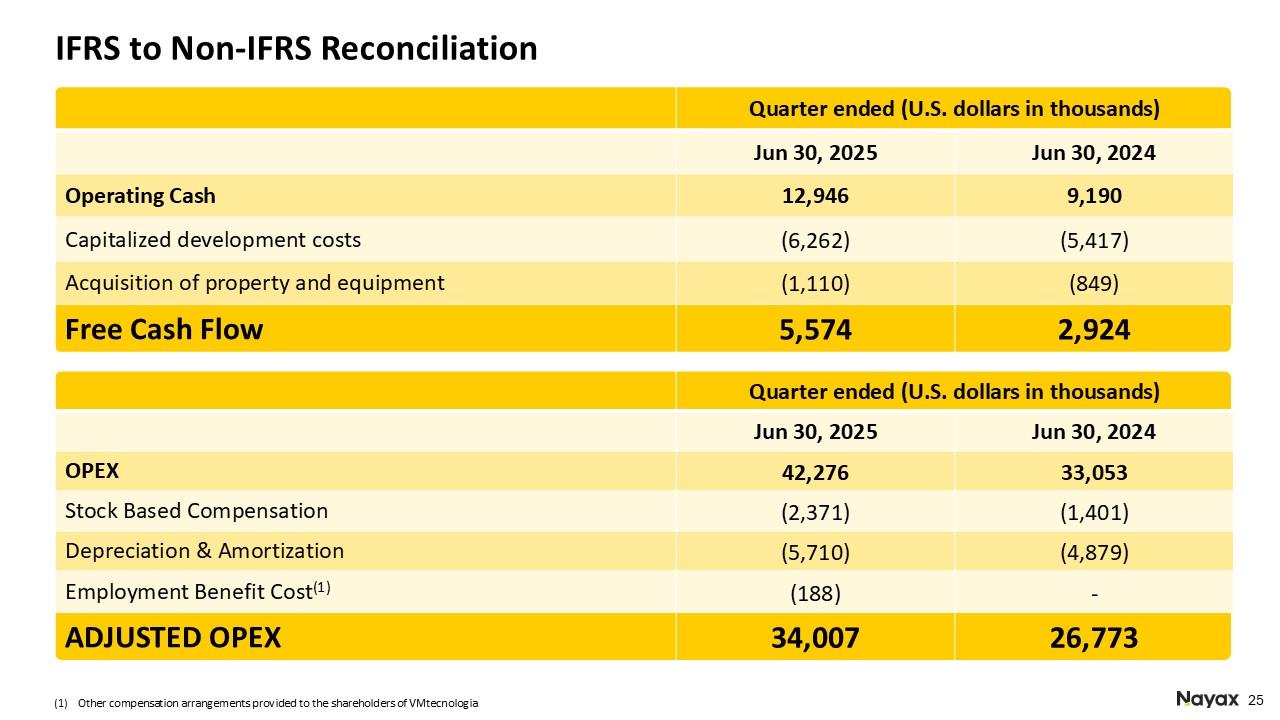
Quarter ended (U.S. dollars in thousands) Jun 30, 2025 Jun 30,
2024 OPEX 42,276 33,053 Stock Based Compensation (2,371) (1,401) Depreciation & Amortization (5,710) (4,879) Employment Benefit Cost(1) (188) - ADJUSTED OPEX 34,007 26,773 IFRS to Non-IFRS Reconciliation Quarter ended (U.S.
dollars in thousands) Jun 30, 2025 Jun 30, 2024 Operating Cash 12,946 9,190 Capitalized development costs (6,262) (5,417) Acquisition of property and equipment (1,110) (849) Free Cash Flow 5,574 2,924 Other compensation
arrangements provided to the shareholders of VMtecnologia
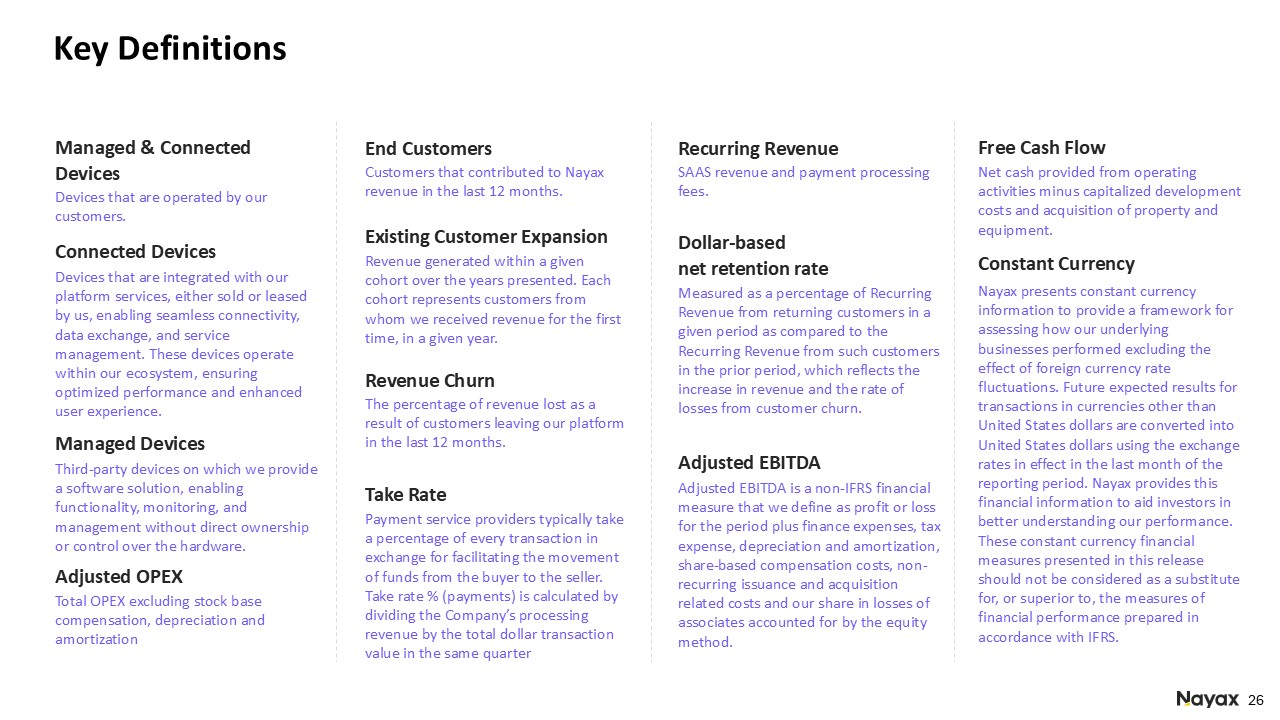
Key Definitions Measured as a percentage of Recurring Revenue from returning
customers in a given period as compared to the Recurring Revenue from such customers in the prior period, which reflects the increase in revenue and the rate of losses from customer churn. Dollar-based net retention rate Nayax presents
constant currency information to provide a framework for assessing how our underlying businesses performed excluding the effect of foreign currency rate fluctuations. Future expected results for transactions in currencies other than United
States dollars are converted into United States dollars using the exchange rates in effect in the last month of the reporting period. Nayax provides this financial information to aid investors in better understanding our performance. These
constant currency financial measures presented in this release should not be considered as a substitute for, or superior to, the measures of financial performance prepared in accordance with IFRS. Constant Currency Adjusted EBITDA is a
non-IFRS financial measure that we define as profit or loss for the period plus finance expenses, tax expense, depreciation and amortization, share-based compensation costs, non-recurring issuance and acquisition related costs and our share in
losses of associates accounted for by the equity method. Adjusted EBITDA Devices that are integrated with our platform services, either sold or leased by us, enabling seamless connectivity, data exchange, and service management. These devices
operate within our ecosystem, ensuring optimized performance and enhanced user experience. Connected Devices Devices that are operated by our customers. Managed & Connected Devices Customers that contributed to Nayax revenue in the
last 12 months. End Customers SAAS revenue and payment processing fees. Recurring Revenue The percentage of revenue lost as a result of customers leaving our platform in the last 12 months. Revenue Churn Revenue generated within a given
cohort over the years presented. Each cohort represents customers from whom we received revenue for the first time, in a given year. Existing Customer Expansion Net cash provided from operating activities minus capitalized development costs
and acquisition of property and equipment. Free Cash Flow Third-party devices on which we provide a software solution, enabling functionality, monitoring, and management without direct ownership or control over the hardware. Managed
Devices Total OPEX excluding stock base compensation, depreciation and amortization Adjusted OPEX Payment service providers typically take a percentage of every transaction in exchange for facilitating the movement of funds from the buyer
to the seller. Take rate % (payments) is calculated by dividing the Company’s processing revenue by the total dollar transaction value in the same quarter Take Rate

Aaron Greenberg Chief Strategy Officer ir@nayax.com IR Contact Thank
You! ir.nayax.com Website