Exhibit 99.1
OPC ENERGY LTD.
Report of the Board of Directors regarding the Company’s Matters
for the six‑month and three‑month periods ended June 30, 2025
The Board of Directors of OPC Energy Ltd. (hereinafter – “the Company”) is pleased to present herein the Report of the Board of Directors
regarding the activities of the Company and its investee companies (hereinafter together – “the Group”), as at June 30, 2025 and for the six‑month and three‑month periods then ended (the Period of the Report”).
Except for the data reviewed in the Company’s consolidated financial statements as at June 30, 2025 (hereinafter – “the Interim Statements”) that
is included in this report below, the data appearing in the Report of the Board of Directors has not been audited or reviewed by the Company’s auditing CPAs.
This Report of the Board of Directors is submitted on the assumption that the interim reports and all parts of the Company’s
Periodic Report for 2024, which was published on March 12, 2025 (Reference No.: 2025‑01‑016318) (“the Periodic Report for 2024”), are before the reader and references to the Company’s reports include the information presented therein by means of
reference.
1
OPC Energy Ltd.
Report of the Board of Directors
| 1. |
Executive Summary1
|
| Main financial parameters (in millions of shekels) |
|
For the
|
For the
|
|||||||||||||||||||||||||
|
Six Months Ended
|
Three Months Ended
|
|||||||||||||||||||||||||
|
June 30
|
June 30
|
|||||||||||||||||||||||||
|
2025
|
2024
|
%
|
2025
|
2024
|
%
|
|||||||||||||||||||||
|
|
|
|||||||||||||||||||||||||
|
Consolidated
|
EBITDA after proportionate consolidation
|
733
|
573
|
28
|
%
|
323
|
241
|
34
|
%
|
|||||||||||||||||
|
|
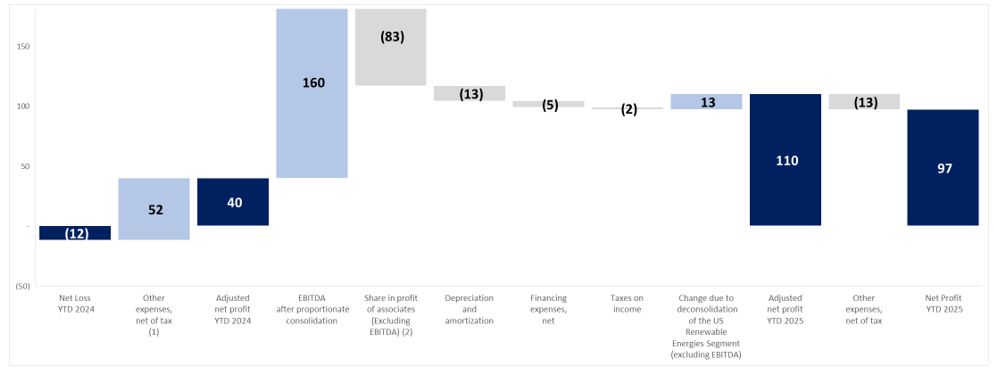
Net income (loss)
|
97
|
(12
|
)
|
908
|
%
|
4
|
(27
|
)
|
115
|
%
|
|||||||||||||||
|
|
Adjusted net income (loss)
|
110
|
40
|
175
|
%
|
9
|
(31
|
)
|
129
|
%
|
||||||||||||||||
|
|
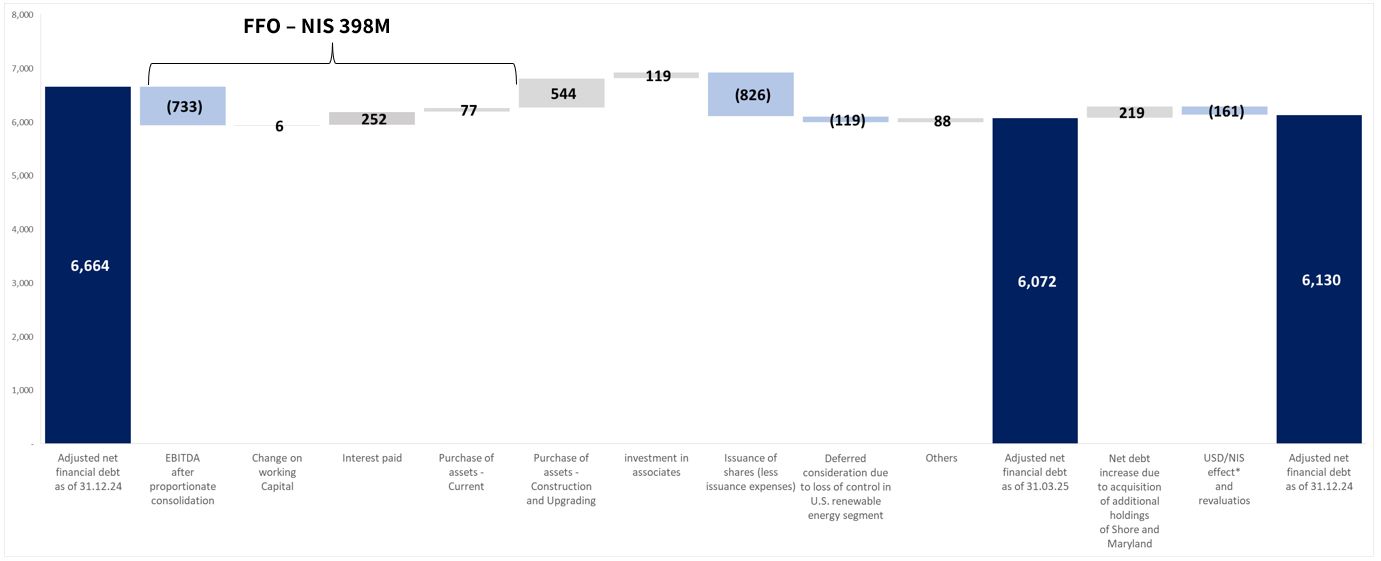
FFO |
398
|
327
|
22
|
%
|
74
|
38
|
95
|
%
|
|||||||||||||||||
|
Israel
|
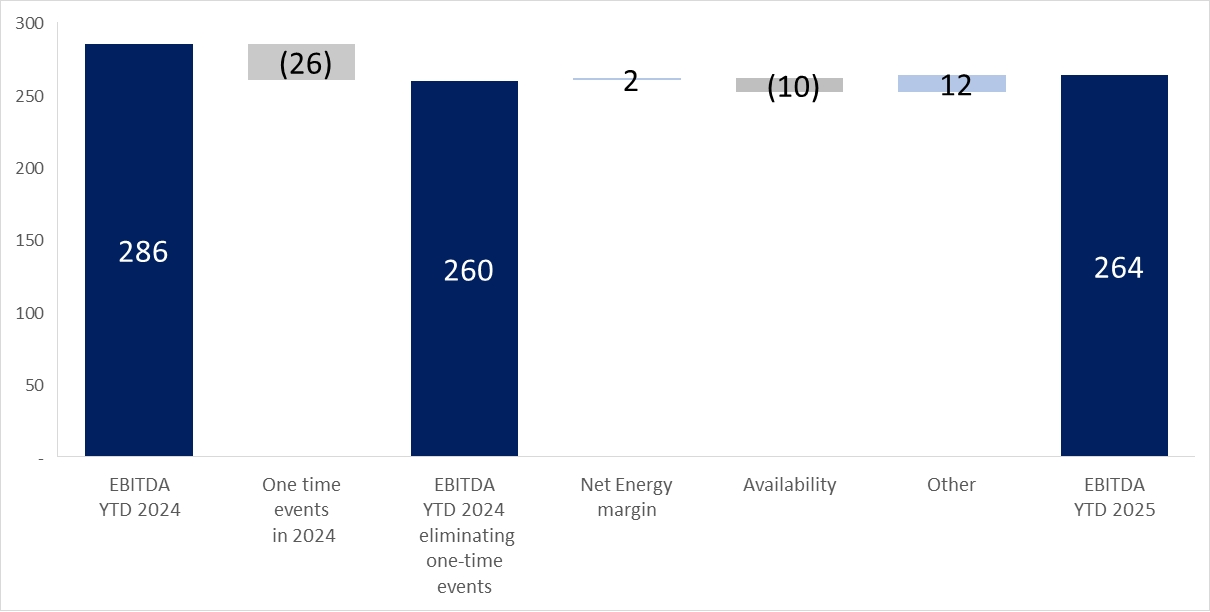
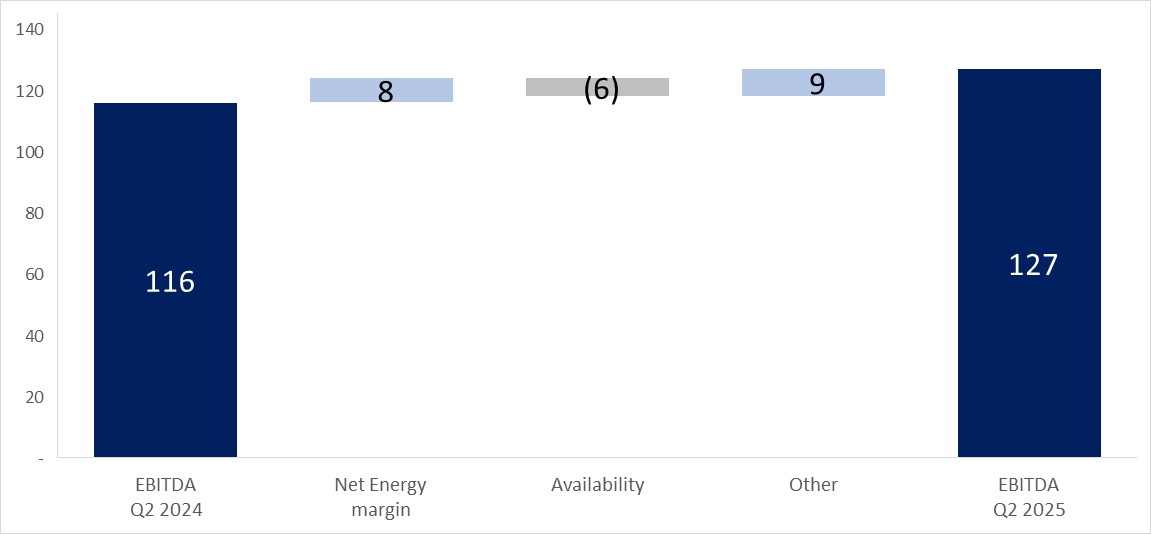
EBITDA
|
264
|
286
|
(8
|
)%
|
127
|
116
|
9
|
%
|
|||||||||||||||||
|
|
FFO |
194
|
238
|
(18
|
)%
|
6
|
9
|
(33
|
)%
|
|||||||||||||||||
|
U.S.
|
EBITDA after proportionate consolidation |
480
|
295
|
63
|
%
|
201
|
130
|
55
|
%
|
|||||||||||||||||
|
|
FFO
|
242
|
144
|
68
|
%
|
89
|
54
|
65
|
%
|
|||||||||||||||||
|
|
|
|||||||||||||||||||||||||
|
|
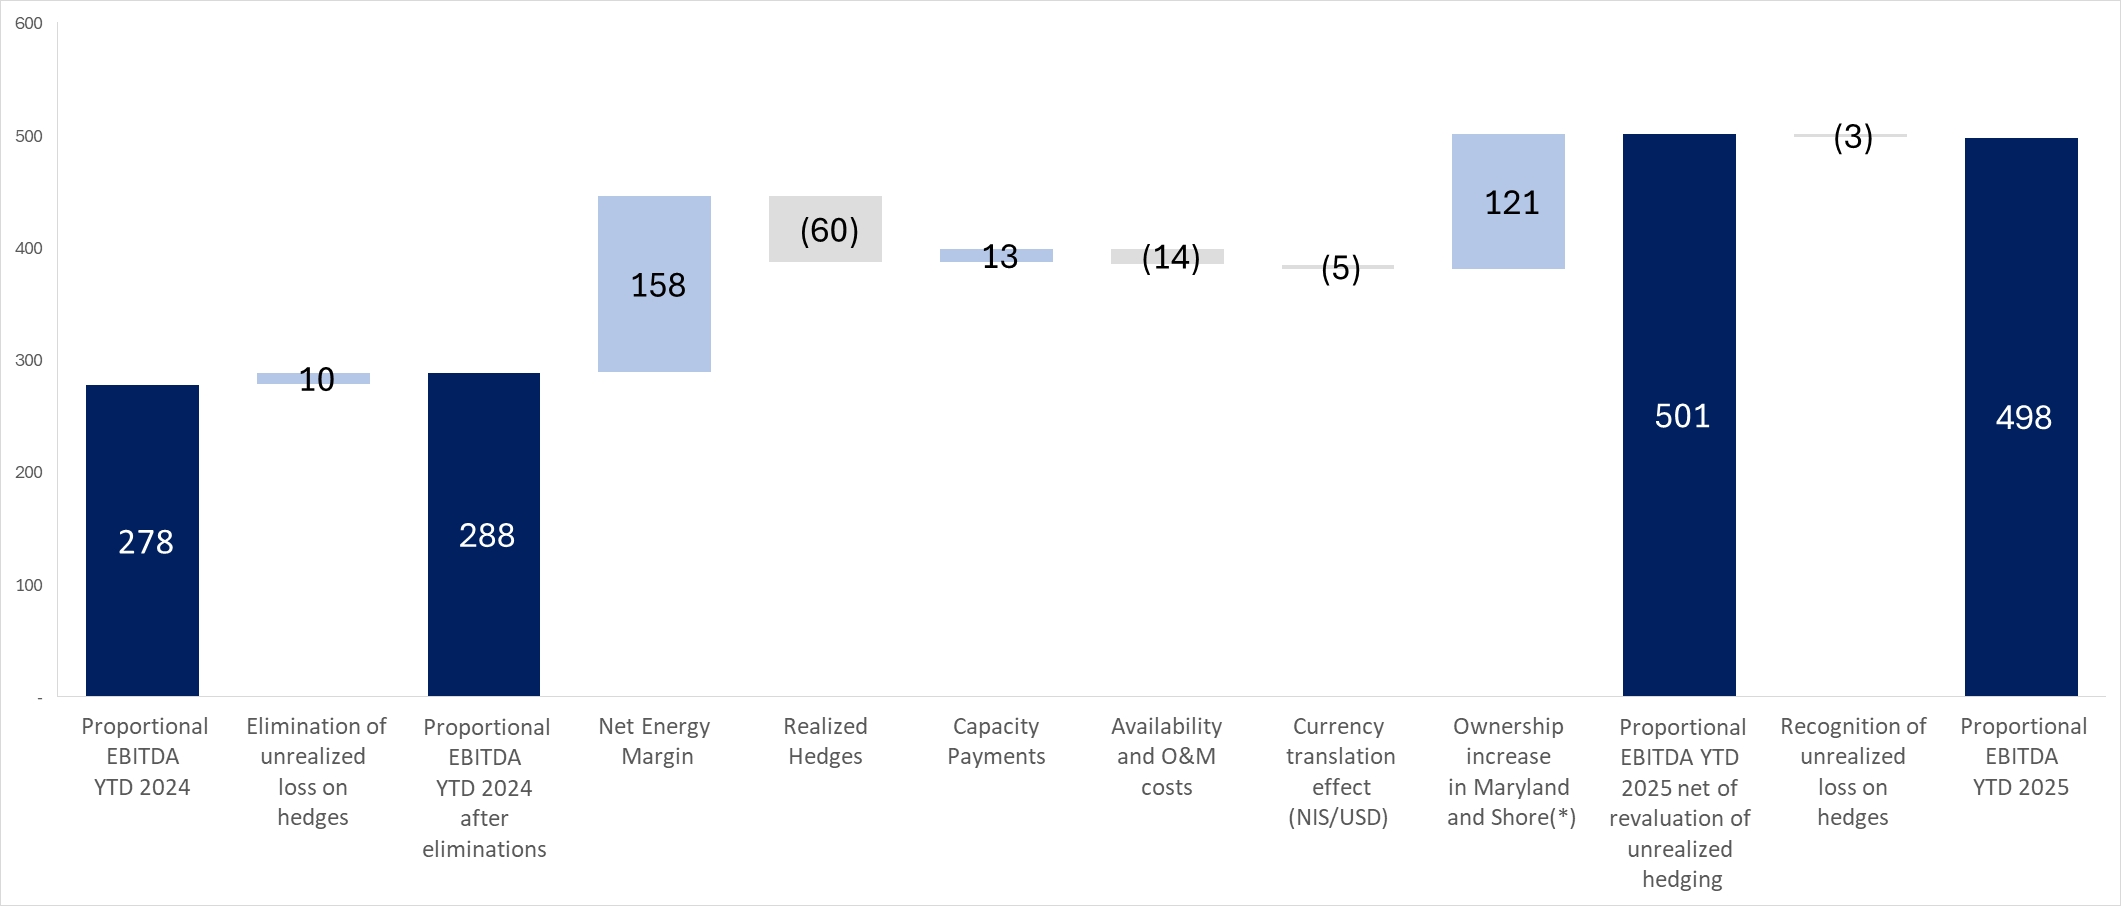
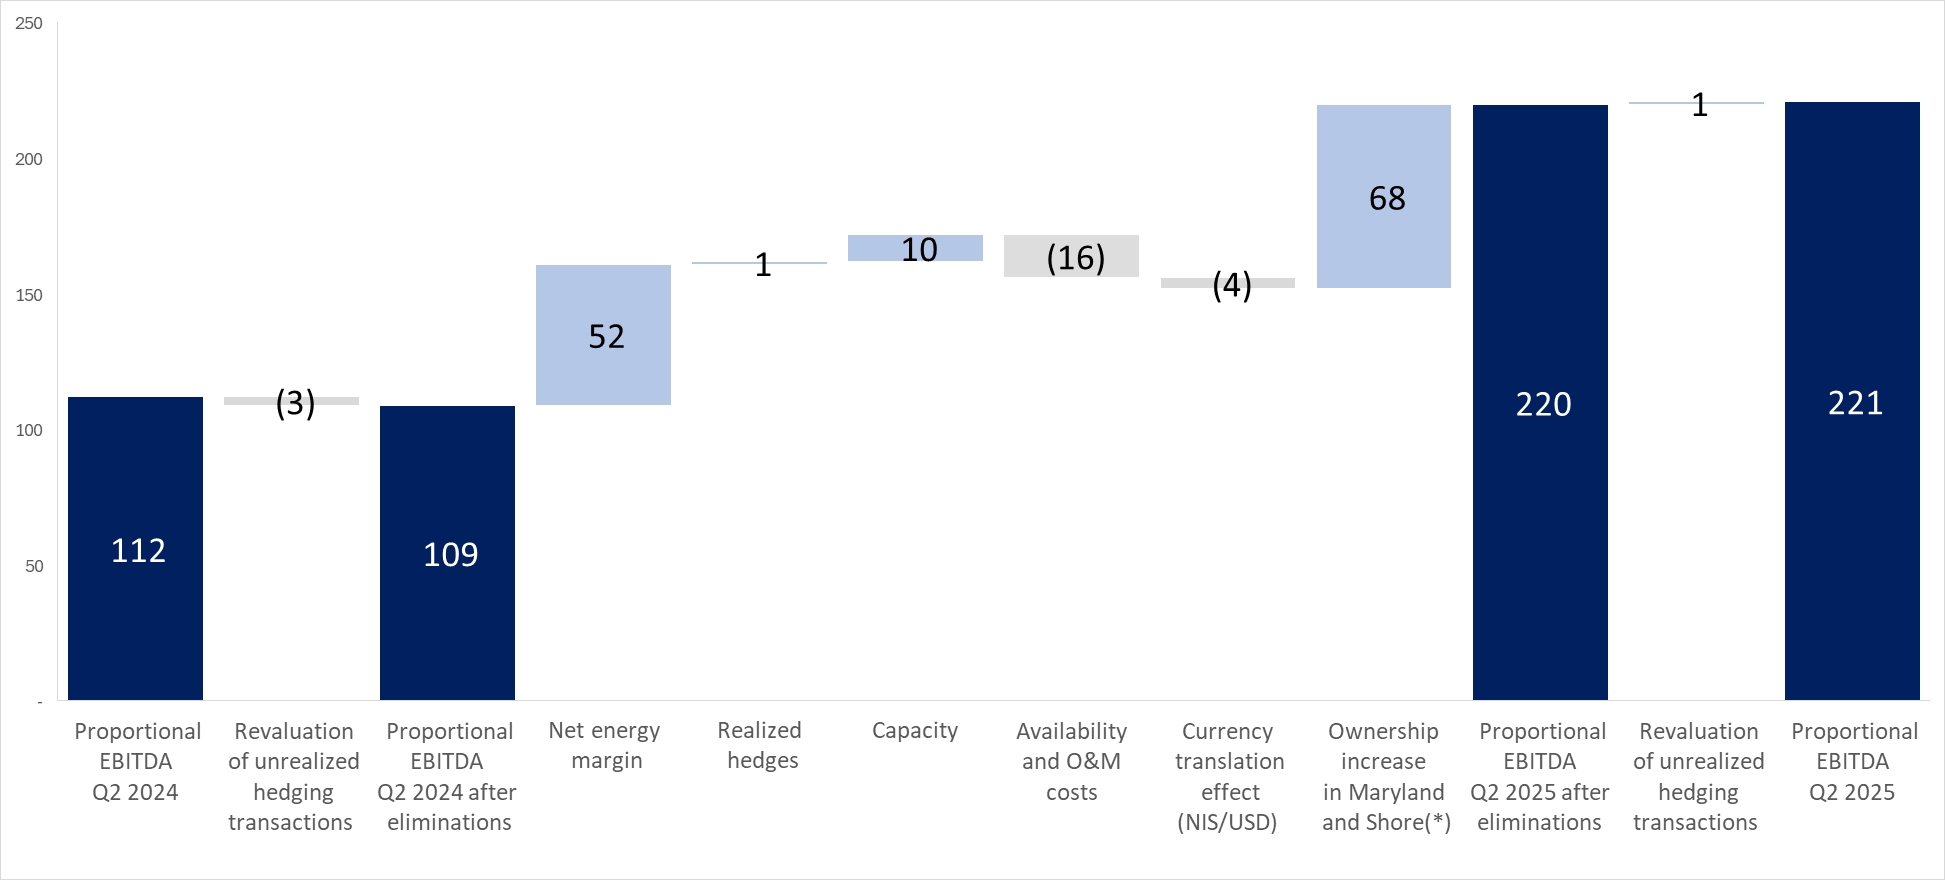
EBITDA after proportionate consolidation – energy transition |
498
|
278
|
79
|
%
|
221
|
112
|
97
|
%
|
|||||||||||||||||
|
|
||||||||||||||||||||||||||
|
|
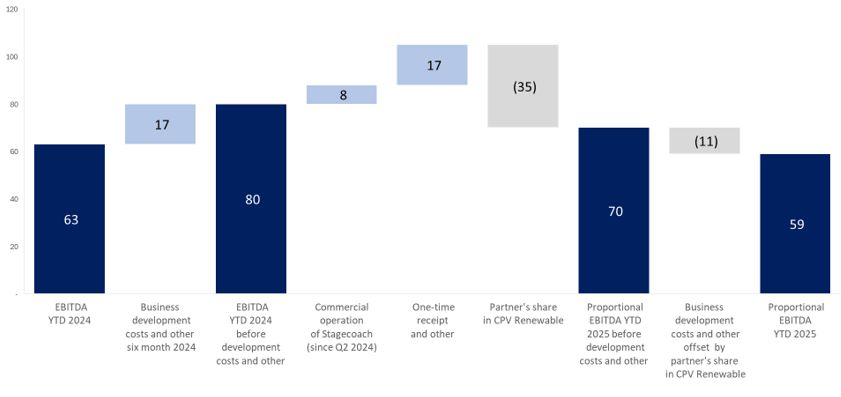
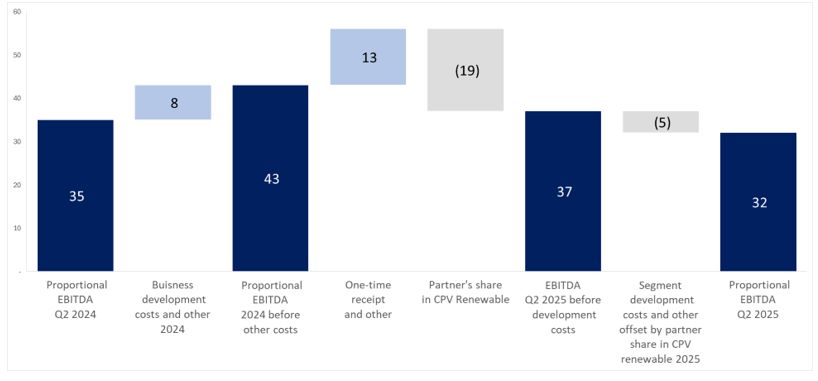
EBITDA after proportionate consolidation – renewable energies |
59
|
63
|
(6
|
)%
|
32
|
35
|
(9
|
)%
|
|||||||||||||||||
| * |
EBITDA, EBITDA after proportionate consolidation, adjusted net income and FFO are not recognized in accordance with IFRS – for definitions and the manner of their calculation – see Sections 4B and
4G below.
|
| 1 |
The Executive Summary below is presented solely for convenience and it is not a substitute for reading the full detail (including with reference to the matters referred to in the
Summary) as stated in this report with all its parts (including warnings relating to “forward‑looking” information as it is defined in the Securities Law, 1968 (“the Securities Law”), definitions or explanations with respect to the indices
for measurement of the results and including the information included by means of reference, as applicable). This Summary includes estimates, plans and assessment of the Company, which constitute “forward‑looking” information regarding which
there is no certainty they will materialize and the readers are directed to the detail presented in this report below.
|
2
OPC Energy Ltd.
Report of the Board of Directors
| 1. |
Executive Summary (Cont.)
|
Main developments in the second quarter and thereafter
| Israel |
Hadera 2 project – on August 10, 2025, as part of an additional discussion regarding National Infrastructures Plan 20B (NIP 20B) the
government of Israel approved construction of a power plant in Hadera. For details – see Section 6A(2) below.
|
|
|
Ramat Beka project – in May 2025, Electricity Authority published a bilateral market regulation for generation and storage
facilities in accordance with which the project is expected to operate. Accordingly, the Company is making technical feasibility studies along with economic optimization with reference to the size of the project, particularly the scope of
the storage therein. For details see Section 6A(2) below.
|
|
Increase in the list of projects under development in the area of renewable energy – in addition to the Ramat Beka project, as at the approval date of the
report the list of projects in the renewable energy area with integrated storage is estimated at a cumulative about 0.4 gigawatts and 1.8 gigawatts per hour. For details see Section 6A(2) below.
|
|
|
Financing in Israel – in July 2025, OPC Israel signed an additional bank financing agreement, in the aggregate amount of about NIS 400 million, on terms
similar to those of the agreements it signed in 2024 and in the beginning of 2025. The company’s share is expected to be used mainly for repayment of its debentures. For details – see Note 6A(1) to the Interim Statements.
|
3
OPC Energy Ltd.
Report of the Board of Directors
| 1. |
Executive Summary (Cont.)
|
Main developments in the second quarter and thereafter (Cont.)
|
U.S.
|
Basin Ranch project in Texas (combined cycle power plant with a capacity of 1.35 gigawatts) advancing toward an investment decision
and start of construction in the second half of 2025 – for financing the share of the CPV Group in the shareholders’ equity required for construction of the project, as at the approval date of the report the Company had completed
issuance of equity, as stated below, and the CPV Group is carrying on advanced negotiations with Bank Leumi for taking out a loan, in the amount of about $300 million. For details – see Section 6B(2) below.
|
|
|
Capacity auctions in the PJM market for the period June 2026 through May 2028 – in April 2025, the FERC approved for PJM minimum
and maximum ceiling (collar) prices for the next two capacity auctions. In July 2025, the results of a capacity auction for the period from June 1, 2026 through May 31, 2027 were published at a price that reflects the price ceiling
determined of $329 for MW/day. For details – see Section 3.3M below.
|
||
|
Approval of the “One Big Beautiful Bill” and change of the tax benefit arrangements in the energy area – for details regarding
the legislation and the estimates of the CPV Group regarding the possible impacts thereof on its business activities, particularly in the area of renewable energy – see Section 3.1C below.
|
||
|
Completion of transaction for increase in the holdings in the Shore power plant in the area of Energy Transition in the U.S.
– in April 2025, acquisition of an additional 20% of the Shore power plant was completed such that as at the approval date of the report CPV’s holding is about 89%. For details – see Note 9C(1) to the Interim Statements.
|
||
|
Oregon project (combined cycle power plant with a capacity of 1.45 gigawatts in the preliminary development stage) - was chosen in May 2025 by PJM for
advancement in an accelerated connection process as part of a RRI (Reliability Resource Initiative). For additional details – see Section 6B(3) below.
|
||
|
Group
headquarters
|
Raising of capital – in June 2025 the Company completed raising of capital in the aggregate scope (gross) of about NIS 850
million (about $245 million). The proceeds of the issuance are earmarked for provision of part of the share of the CPV Group in the shareholders’ equity required for construction of the Basin Ranch project2. For details – see
Section 6B(2) below and Note 6D to the Interim Statements.
|
|
|
Credit rating – in May 2025, Midroog determined an initial rating of A1.il with a stable rating outlook for the Company and its
debentures. In addition, in May 2025 S&P Maalot raised the Company’s credit rating to ilA with a stable rating outlook and the credit rating of its debentures to ilA+. For details – see Section 9C below.
|
For additional developments with respect to the Company’s activities (including potential developments in the Company’s business) and updates
relating to the “Nation as a Lioness” mission – see Sections 10 and 3.1B, respectively.
2 If and to the extent a final decision is made with respect to investment in the project (as at the date of the
report all the preconditions for start of the construction had been fulfilled) and/or for the Company’s needs as will be decided from time to time by the Board of Directors. It is emphasized that use of the issuance
proceeds to provide part of the share of the CPV Group in the shareholders’ equity required for the project, as stated, includes “forward‑looking” information, as it is defined in the Securities Law, which is based on the Company’s estimates as at
the approval date of the report and there is no certainty regarding the realization thereof.
4
OPC Energy Ltd.
Report of the Board of Directors
| 1. |
Executive Summary (Cont.)
|
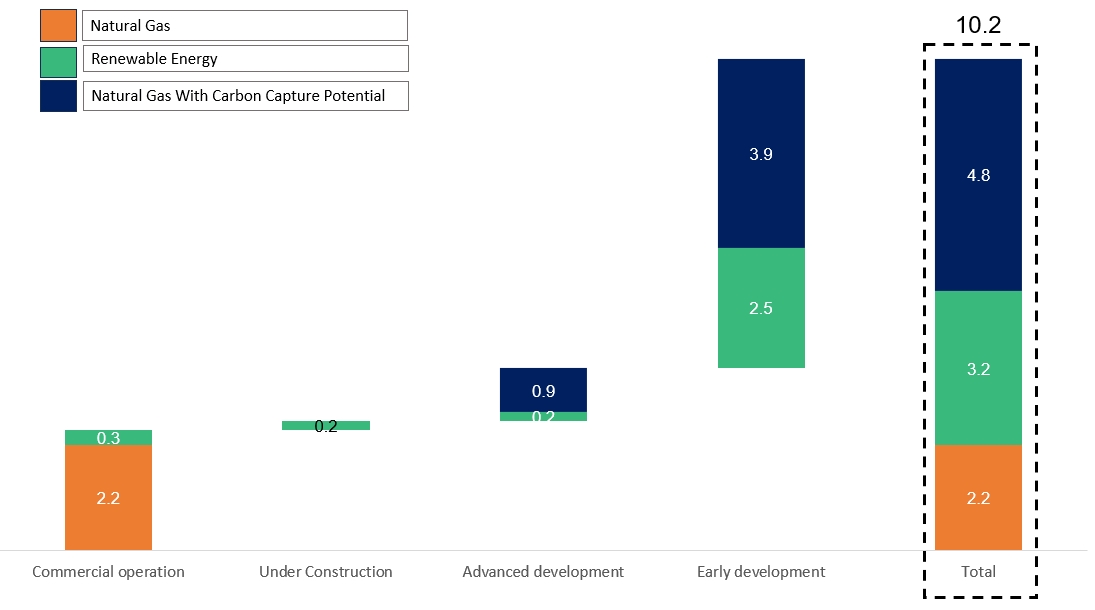
Portfolio of about 13.7 GW and about 4.6 GWh of storage (for details – see Section 6 below)
United States (1)
| (1) |
The projects are presented in accordance with the relative share of the CPV Group in each project.
|
5
OPC Energy Ltd.
Report of the Board of Directors
| 1. |
Executive Summary (Cont.)
|
Portfolio of about 12.8 GW and about 5.5 GWh of storage (for details – see Section 5 below) (Cont.)
Israel (3)
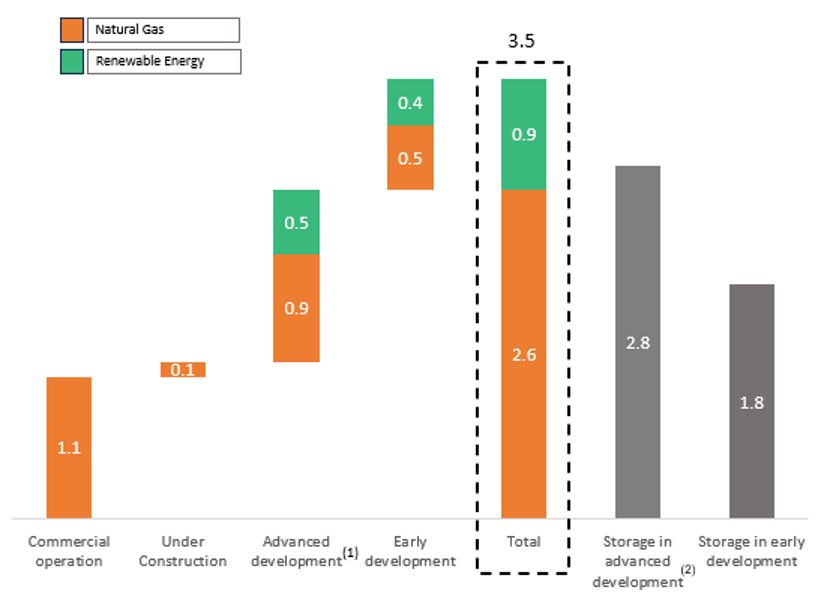
| (1) |
The above chart does not include the Hadera 2 project, with a capacity of 850 megawatts, in light of the Government’s decision to approve the plan. For details – see Section 6A(2)
below and Section 7.3.13.4 of Part A to the Periodic Report for 2024.
|
| (2) |
For additional details regarding a possible increase in the scope of the energy in the Ramat Beka project – see Section 6A(2) below.
|
| (3) |
At this preliminary stage, not including a project covered by an agreement with Migdal, as detailed in Section 6A(2) below.
|
That stated with respect to the development stages, capacities and/or expectations regarding construction of the development projects in Israel and in the
U.S. constitutes “forward‑looking” information as it is defined in the Securities Law, which is based on the Company’s estimates at the approval date of the report and regarding which there is no certainty they will be realized. Ultimately, there
could be changes in the characteristics of the projects and/or delays or changes due to regulatory, operating, commercial factors and/or realization of one or more of the risk factors to which the Company is exposed, as stated in Part A of the
Periodic Report for 2024. Advancement of the development projects (or any one of them) is subject to the discretion of the Company’s competent organs and existence (fulfillment) of additional conditions, as stated in Part A of the Periodic Report
for 2024.
6
OPC Energy Ltd.
Report of the Board of Directors
| 2. |
Brief description of the areas of activity
|
The Company is a public company the securities of which are listed for trade on the Tel Aviv Stock Exchange Ltd.
For details regarding the Group’s activity segments in the Period of the Report – see Part 2 of the Report of the Board of Directors that is
included in the Periodic Report for 2024 (“the Report of the Board of Directors for 2024”) and Note 25 to the annual financial statements.
| 3. |
Main Developments in the Business Environment
|
| 3.1 |
General
|
| A. |
Macro‑economic environment (particularly inflation and interest) – for details regarding the business and macro‑economic environment in which the Group companies operate, significant changes
that occurred in 2024 and the impact thereof on the Group’s activities – see Section 3.1A to the Report of the Board of Directors for 2024.
|
Regarding the interest in Israel, in the interest decisions of Bank of Israel in 2025, the interest rate remained unchanged at
the level of 4.5%. Pursuant to the latest projection published by Bank of Israel, the interest rate is expected to decline to an average of 3.75% in the second quarter of 2026.
Regarding the interest in the U.S., since the beginning of 2025 there have been no additional interest rate reductions. Pursuant
to the latest projection published by the U.S. Federal Reserve Bank, the interest rate is expected to decline to an average in the range of 3.75%–4% during 2025.
Set forth below is data with reference to the currency exchange rate, Consumer Price Index (CPI) in Israel and in the U.S., the
interest rates of Bank of Israel and the interest rates of the Fed in U.S.:
|
Dollar/shekel exchange rate *
|
2025
|
2024
|
Change
|
|||||||||
|
At the end of the previous year
|
3.647
|
3.627
|
0.6
|
%
|
||||||||
|
On June 30
|
3.372
|
3.759
|
(10.3
|
)%
|
||||||||
|
On March 31
|
3.718
|
3.681
|
1.0
|
%
|
||||||||
|
Average January – June
|
3.598
|
3.694
|
(2.6
|
)%
|
||||||||
|
Average April – June
|
3.583
|
3.725
|
(3.8
|
)%
|
||||||||
| * |
The dollar/shekel exchange rate shortly before the approval date of the report (on August 8, 2025) is 3.435.
|
7
OPC Energy Ltd.
Report of the Board of Directors
| 3. |
Main Developments in the Business Environment (Cont.)
|
| 3.1 |
General (Cont.)
|
| A. |
(Cont.)
|
|
Israeli
|
U.S.
|
Bank of Israel
|
Federal
|
|||||||||
|
CPI
|
CPI
|
interest rate
|
interest rate
|
|||||||||
|
On August 11, 2025
|
117.3
|
322.6
|
4.5%
|
4.25%–4.50%
|
||||||||
|
On June 30, 2025
|
116.9
|
321.2
|
4.5%
|
4.25%–4.50%
|
||||||||
|
On March 31, 2025
|
115.4
|
319.1
|
4.5%
|
4.25%–4.50%
|
||||||||
|
On December 31, 2024
|
115.1
|
315.5
|
4.5%
|
4.25%–4.50%
|
||||||||
|
On June 30, 2024
|
113.4
|
314.1
|
4.5%
|
5.25%–5.50%
|
||||||||
|
On March 31, 2024
|
111.6
|
310.3
|
4.5%
|
5.25%–5.50%
|
||||||||
|
On December 31, 2023
|
111.3
|
307.1
|
4.75%
|
5.25%–5.50%
|
||||||||
|
Change in the first half of 2025
|
1.6%
|
2.3%
|
0%
|
0%
|
||||||||
|
Change in the first half of 2024
|
1.9%
|
2.3%
|
(0.25%)
|
0%
|
||||||||
|
Change in the second quarter of 2025
|
1.3%
|
1.2%
|
0%
|
0%
|
||||||||
|
Change in the second quarter of 2024
|
1.6%
|
1.3%
|
0%
|
0%
|
For details regarding credit linked to the CPI or to prime – see Section 9B below to the Report of the Board of Directors for
2024, and Note 14B to the annual financial statements. For additional details regarding impacts of the changes in the macro‑economic environment on the results of the Group’s activities – see Section 11 to the Report of the Board of Directors for
2024.
| B. |
Domestic and geopolitical instability in the defense (security) situation in Israel – further to that stated in Section 6.1.1 of Part A of the Periodic Report for 2024, during of the period of
the report, the security instability in Israel increased with a rekindling of the fighting, including calling up of military reserves and missiles from the Yemenite terrorist organizations.
|
Additionally, in June 2025, an additional worsening of the
geopolitical situation started upon the outbreak of widespread military combat between Israel and Iran (“the Nation as a Lioness” mission”), which included airstrikes by Iran, closing of the aviation routes, a general emergency situation on the
Israeli Homefront and a significant rise in the regional tensions. On June 24, 2025, a ceasefire with Iran was declared, which as at the approval date of the report is still in effect. Nonetheless, as at the approval date of the report the combat
situation in Gaza and attacks by terrorist organizations from Yemen are still continuing and the situation in Israel continues to be characterized by significant geopolitical uncertainty.
At the same time, significant uncertainty is ongoing regarding the consequences of the continuing war situation on macro‑economic and financial factors in Israel, including
the Israeli capital market.
8
OPC Energy Ltd.
Report of the Board of Directors
| 3. |
Main Developments in the Business Environment (Cont.)
|
| 3.1 |
General (Cont.)
|
| B. |
(Cont.)
|
During the Nation as a Lioness mission the natural gas reservoirs (including Energean's Karish reservoir) were completely shut down and acquisitions of natural gas for the
Group’s power plants were made mainly from the Tamar reservoir (which was shut down for a relatively short time) along with isolated use of diesel oil; there was a certain decrease in the demand for electricity – which was partly temporary against
the background of suspension of the economic activities during the mission and is, in part, still continuing as at the approval date of the report due to physical damage to the generation facilities of a significant industrial customer; and force majeure notifications were received from suppliers and contractors, which mainly relate to the Sorek 2 project, which is under construction.
As at the approval date of the report, the said mission did not have a significant impact on the results of the operations in Israel, and in the Company’s estimation, if
there is no rekindling of the fighting the timetables for the expected resumption of full activities of the said industrial customer will be maintained and the suppliers and contractors from outside of Israel will return and shipments of equipment
for performance of work in Israel will resume. The said mission is not expected to have a material impact on the activities in Israel3.
It is noted that as a group operating in Israel, the said rekindling of the fighting, expansion of the scope of the combat
and/or a worsening of the defense situation in Israel could unfavorably affect its activities, operating results and liquidity, including due to impacts, as stated, on the Group’s suppliers (such as maintenance contractors, gas suppliers and
construction contractors) and significant customers and/or macro‑economic factors and the capital market. The said impacts could apply to both the level of the Company’s projects in Israel (maintenance of the active projects and construction work on
the projects that have not yet started their activities) and the level of the Company’s business activities. For additional details – see Sections 6.1.1 of Part A of the Periodic Report for 2024.
3 The Company’s estimates with respect to the impacts of the Nation as a Lioness
Mission and return to routine activities constitutes “forward‑looking” information as it is defined in the Securities Law, regarding which there is no certainty it will be realized. Ultimately, delays in return to routine activities of suppliers,
equipment shipments and arrival of work teams to Israel (for whatever reason) and return to routine activities of the Company’s customer could have a material negative impact on the Company, cause delays in execution of projects and/or involve
additional costs.
9
OPC Energy Ltd.
Report of the Board of Directors
| 3. |
Main Developments in the Business Environment (Cont.)
|
| 3.1 |
General (Cont.)
|
| C. |
Changes in government policies (including with respect to tariffs) and passage of the One Big Beautiful Bill in the U.S. – further to that stated in Section 3.1C of the Report of the Board of
Directors for 2024, the policy changes against the background of entry into office of the Trump administration have created and are continuing to create uncertainty along with opportunities in the energy sector in the U.S.
|
Since his entry into the position in January 2025, President Trump has issued executive orders promoting the production of fossil fuels, including with respect to natural gas
and LNG and laws have been passed and Executive Orders or directives could be issued for reduction of government support in the area of renewable energies, among other things, as detailed below and in Section 8.1.4O of Part A of the Periodic Report
for 2024.
Furthermore, as at the date of the report, President Trump has imposed tariffs (some of which have been updated and are expected
to continue to be updated later on) on import of equipment and raw materials (including, steel and solar panels) into the U.S., and is carrying on negotiations with respect to new trade agreements with foreign countries, in such a manner that at the
present time there is uncertainty regarding the full extent of the impacts of the said orders or new trade agreements on the cost of the equipment for the projects. It is noted that the said update of the Customs’ duty could affect the equipment
costs (both in the areas of renewable‑energy and natural‑gas) and trigger disruptions in the supply chain and, ultimately, lead to an increase in the construction or maintenance costs of projects4.
On July 4, 2025, a comprehensive federal law known as the “One Big Beautiful Bill” (hereinafter in this Section – “the Law”) was
passed into law, which includes, among other things, legislative changes in all that relating to the set of federal tax benefits, which are mainly relevant to the renewable energy activities of the CPV Group in the U.S.
In brief and as relevant, pursuant to the provisions of the Law and the “safe harbor” rules (lenient threshold conditions),
renewable energy projects (sun and wind) will be required to start the construction (as this term will be defined by the U.S. Treasury Department, as detailed below) no later than July 4, 2026 (12 months from the approval date of the Law) and to
complete it no later than the end of 4 years from then or if their construction starts after July 4, 2026 to complete it no later than the end of 2027 – this being in order to comply with the conditions for receipt of the tax benefits (ITC and PTC).
The benefits of entitled projects could range between 30% and 50% of the cost of the project.
In addition, the Law provides new rules for a Foreign Entity of Concern (FEOC), which prevent receipt of tax benefits for
projects that acquire equipment or operate under a financial structure that provides “effective control” to parties in the countries defined in the Law (China, North Korea, Russia and Iran). These restrictions do not apply to projects the
construction of which starts before the end of 2025. The Law restricts the possibility of transferring the credit to a third party (transferability) if the receiving party is considered an FEOC.
| 4 |
That stated in this Section above constitutes “forward‑looking” information, as it is defined in the Securities Law, which is based solely on the Company’s estimates as at the approval date of the report,
which are subject to uncertainty and changes that are not under the Company’s control. The policies (present or additional) of the U.S. government could have a negative impact on advancement and/or benefits with respect to renewable
energy projects (particularly, renewable energies) and the costs of equipment, services and shipping for the projects and power plants in the U.S. In addition, such changes could have macro impacts on the Company’s activity markets.
|
10
OPC Energy Ltd.
Report of the Board of Directors
| 3. |
Main Developments in the Business Environment (Cont.)
|
| 3.1 |
General (Cont.)
|
| C. |
(Cont.)
|
Additionally, the Law increased the value of the tax benefit under Section Q45 for re‑use of carbon for purposes of increasing the production of crude oil or another
generation process (“enhanced oil recovery”), from $65 to $85 per ton and left unchanged (at $85 per ton) the tax benefits for carbon dioxide that is separated out (for further details in connection with the benefits under the IRA Law – see
Section 8.10 of Part A of the Periodic Report for 2024).
Also, the Law restores the possibility of deducting as an expense the full cost of the investment in qualifying assets, as they
are defined in the Law, as a depreciation expense in respect of assets acquired or placed into service after January 19, 2025.
Further to that stated above with reference to the entitlement to tax benefits for renewable energies pursuant to the Law, on July 7, 2025, an Executive Order was published
instructing the U.S. Treasury Department to examine and publish within 45 days updated and possibly stricter directives with respect to the definition of “commencement of construction” in all that relating to the Law and application of the safe
harbor rules for projects the start of their construction is expected to take place up to July 4, 2026. As detailed above, such that projects would be considered “under construction” only if construction has already been completed of a significant
part (as it will be defined) of the project and will be subject to stricter conditions.
As at the approval date of the report, the CPV Group is continuing to monitor the changes being advanced by the Trump Administration, including with respect to updated
directives of the U.S. Treasury Department that are expected to be published up to August 18, 2025, and to examine their impacts. For additional details – see Sections 8.1.3.1 and 8.1.4O of Part A of the Periodic Report for 2024.
In the estimation of the CPV Group, as at the approval date of the report: (A) regarding the activities of the CPV Group in
the natural gas area, including future potential for addition of carbon capture, the said directives should have a positive impact on the general sentiment, the business environment and the investment feasibility of the investments, among other
things against the background of the improvement in the tax benefits under Section Q45, as detailed above; (B) regarding the activities of the CPV Group in the renewable energies area, the Law and the said directives are not expected to have a
negative impact on its active projects, its projects under construction and some of its projects in the advanced development stage that should be entitled to tax benefits under the new legislation. Concerning some of the projects in the advanced
development stage and projects in the initial development stage that will not be entitled to tax benefits under the new legislation, in the estimation of the CPV Group as at the approval date
of the report, continuing demand for electricity from renewable energy should support an increase in the electricity prices along with a possible decline in the equipment prices and possible changes in government policies, could fully or partly
compensate for the impact of cancellation of the tax benefits and, thus, reduce the impact of the Law on the economic worthwhileness of the said projects. Nonetheless, there could be delays in the development of projects in such a manner that the
Law could have an unfavorable impact on the projected start dates of the construction5.
| 5 |
That stated above regarding the absence of a negative impact of the new legislation on the list of projects in the advanced development stage, and relating to the demand for renewable energies and an
increase in prices (and scope), a decline in the equipment prices and/or reduction of the impacts of the Law on renewable energy projects, constitutes “forward‑looking” information as it is defined in the Securities Law, which is
based on the estimates of the CPV Group as at the approval date of the report and on an assumption regarding high demand for renewable energies on the part of significant consumers, and regarding which there is no certainty they will
be realized or the manner of their realization. As at the approval date of the report, the manner of the impact of the new legislation on the renewable energy sector in the U.S. has not yet been fully clarified and understood at this
stage. Therefore, as part of the process of internalizing the legislation (including updates, if any, or changes in other regulations) there could be changes in the sector the results of which will be different than the said
estimates, including changes that could have a significant negative impact on the activities, including on projects of the CPV Group in the area. As at the approval date of the report, the estimates described with reference to the
impacts of the legislation on the CPV Group are not final and the CPV Group is continuing to examine these impacts. Accordingly, the said estimates are subject to changes (including due to specific circumstances of the projects on the
list of the awaiting projects of the CPV Group).
|
11
OPC Energy Ltd.
Report of the Board of Directors
| 3. |
Main Developments in the Business Environment (Cont.)
|
| 3.2 |
Activities in Israel
|
| D. |
Update of the electricity tariffs – in January 2025, a decision of the Electricity Authority entered into effect regarding update of the tariff for 2025 for consumers of electricity from the
Electric Company. Pursuant to the decision, the weighted‑average generation component was updated to 29.39 agurot per kilowatt hour – a decline of about 2.2% in the weighted‑average generation component with reference to the generation
component in effect at the end of 2024, this being mainly as a result of a decrease in the Electric Company’s generation cost due to a reduction in the use of coal and a forecasted decline in the Electric Company’s natural‑gas price. In
addition, there was a non‑recurring recognition of surplus receipts from sale of the Eshkol power plant, which led to a reduction in the generation component.
|
It is noted that the results of the Group’s activities in Israel are materially impacted by changes in the electricity
generation component tariff, in such a manner that an increase in the electricity generation component has a positive impact on the Group’s results, and vice‑versa6.
Set forth below is data regarding the annual weighted‑average generation component (the prices are denominated in agurot per
kilowatt hours):
|
Period
|
2025
|
2024
|
Change
|
|||||||||
|
January–June average
|
29.39
|
30.12
|
(2.4
|
)%
|
||||||||
|
April–June average
|
29.39
|
30.07
|
(2.2
|
)%
|
||||||||
| E. |
Update of the decision regarding regulation of conventional generation units – further to that stated in Section 7.3.4 of Part A of the Periodic Report for 2024, on March 26,
2025, the Electricity Authority published a decision – “Update of the Decision regarding Regulation of Conventional Generation Units” (“the Decision”). As part of the Decision, the Electricity Authority increased the quota to four
additional generation units and extended the validity of the decision up to the end of June 2027. The availability tariff determined runs from 3.05 agurot to 3.31 agurot based on the date of the financial closing. In addition, an incentive
of 0.5 agurot was provided for the first unit that reaches a financial closing – this being only for units located in the northern part of Gush Dan (central Israel), as well as an incentive of 0.75% of the availability tariff for every
month of acceleration of the commercial operation prior to December 31, 2029. It is noted that the Company is taking action such that the Hadera 2 project will operate (subject to its construction and completion) under this regulation, as
detailed in Section 6A(2) below.
|
| 6 |
That stated regarding the impact of changes in the generation component on the Company’s results, is subject to changes, among other things, as a result of determination of the periodic
generation component and/or the manner of its application between the hourly demand hours’ brackets, operational factors and/or existence of one or more of the risk factors to which the Company is exposed, as stated in Section 19.2 of Part A
of the Periodic Report for 2024. For additional details regarding the generation component – see section 7.2.3 of Part A of the Periodic Report for 2024.
|
12
OPC Energy Ltd.
Report of the Board of Directors
| 3. |
Main Developments in the Business Environment (Cont.)
|
| 3.2 |
Activities in Israel (Cont.)
|
| F. |
Regulation for undertakings in transactions for sale of availability in high‑voltage solar generation facilities with integrated storage – further to the hearing described in Section 7.3.5 of
Part A of the Periodic Report for 2024, on May 20, 2025, the Electricity Authority published a decision regarding a bilateral regulation for generation and storage facilities connected to or integrated in the transmission network. The
regulation will apply from January 1, 2026 to renewable energy generation facilities with integrated storage (it was provided that the facility must with a storage capacity to installed generation capacity ratio that does not exceed 7), which
will receive tariff approval up to June 1, 2027 or for a quota of up to 2,000 megawatts.
|
Pursuant to the decision, the possibility was given to renewable energy generation facilities including integrate storage to sign availability transactions with virtual
suppliers. The capacity transaction will give the supplier the right to acquire energy every hour at the half‑hour “SMP” market price up to the amount of the capacity certificate the supplier acquired from the generator. The availability stated in
the capacity certificate will be determined in accordance with the adjustment coefficient (capacity credit). The adjustment coefficient for a renewable energy facility with integrated storage of 4 and 5 hours of unloading, will receive tariff
approval as part of the initial quota of the regulation at the rate of 60% and 67%, respectively, up to 2036. A storage facility, as stated, will operate in the energy market based on the central loading method. A generator, except for an
independent storage generator that does not allocate all the capacity stated in its capacity certificate will be entitled to request from the System Operator to receive a capacity tariff of NIS 0.0175 divided by the adjustment coefficient provided
to the generator, unlinked, in respect of the capacity not allocated the supplier, provided the generator will not be able to allocate this capacity to a private supplier during 12 months. It is noted that the Ramat Beka project, which is in the
advanced development stage, is expected to operate under this regulation (subject to its completion and operation). As part of the decision, the Electricity Authority also provided a quota for independent storage facilities and facilities for
restoration of waste.
| G. |
Hearing regarding integration of existing private conventional generators connected to the transmission network in the bilateral market regulation – on June 26, 2025, the Electricity Authority
published a hearing that proposes regulating the rules for integration of existing private conventional generators that are connected to the transmission network, as part of the bilateral regulation that was determined as part of Decision
71101 (a decision regarding a bilateral regulation for generation and storage facilities connected to or integrated in the transmission network, as detailed in Section F. above). The hearing provides that the regulation will apply to
generators that own conventional generation units for which an availability tariff has been provided based on the tariffs table 6.5 1–A, and that are not permitted to designate capacity or to sell energy to a private supplier or to a yard
consumer based on the tariffs table 6.5 1–B (power plants that were sold as part of the reform of Israel Electric Company and the Etgal and Zomet power plants that were constructed under Regulation 914).
|
Pursuant to the hearing, the relevant generators will be given the right to issue availability certificates, in a scope that
will not deviate from 92% of the plant’s capacity, to suppliers that will acquire energy for their customers from the System Operator at SMP prices without capacity payments – this being up to December 31, 2029, and after this date the Electricity
Authority will adjust the coefficient in accordance with the situation in the market. During the next two years, 4–8 competitive processes are expected to be held in the scope of 2,000–3,000 megawatts, where in every process a uniform transition
tariff will be determined that will be paid by all the generators to the System Operator, for every kilowatt that will be transferred to the regulation.
13
OPC Energy Ltd.
Report of the Board of Directors
| 3. |
Main Developments in the Business Environment (Cont.)
|
| 3.2 |
Activities in Israel (Cont.)
|
| G. |
(Cont.)
|
As part of every competitive process, the Electricity Authority will determine a minimum transition tariff that will not be
published to the public, which will be determined prior to the date of submission of the bids. In addition, it will be possible to submit bids for a capacity of not less than 50 megawatts and the total capacity that will be allotted to any one player
may not exceed half of the quota.
Generators will be able to return to the original regulation at the end of 12 months from the date of transfer of the capacity,
subject to advance notice of 30 days. The Electricity Authority might determine that a generator that returned capacity to its original arrangement starting from January 1, 2030, will be entitled to availability payments that are lower than its
original availability payments.
Subject to a final decision, the Regulation is expected to enter into effect in January 2026 after completion of the first
competitive process having a scope of 350 megawatts.
It is noted that the Zomet power plant, which operates under Regulation 914 (as detailed in Sections 7.3.3.2 and 7.13 of Part A
of the Periodic Report for 2024) is permitted to operate under this Regulation (to the extent it is finally recorded in a decision and subject to final regulations), where based on the hearing, Zomet’s original capacity tariff will remain unchanged.
It is emphasized, that as at the approval date of the report, the aforementioned proposed regulation is not final and is subject
to changes and completion of the decision processes in respect thereto. As at the approval date of the report, depending on the final arrangements that will be determined, if determined, Zomet will examine its possibilities under the said Regulation.
In the Company’s estimation, as at the approval date of the report, the above‑mentioned hearing (if recorded in a decision and
subject to the final arrangements) could have a positive impact on Zomet in a case where it chooses to operate under this Regulation, since an operating format is involved that does not exist in the present Regulation applicable to Zomet, as stated7.
Nonetheless, the planned competitive processes in a significant scope, as stated above, are expected to increase the competition in the supply sector for the Company in the area of its activities.
7 The Company’s estimates with reference to the impact of the hearing is “forward‑looking”
information as it is defined in the Securities Law, which is based on the Company’s initial estimates regarding the arrangements included in the hearing, the realization of which is uncertain. Ultimately, the impacts could be different, among other
things, as a result of the market conditions, results of competitive processes, regulatory changes/factors that impact the electricity market and/or the final arrangements that will be determined, to the extent they actually enter into effect, which
are not dependent on the Company. It is also clarified that a decision has not yet been made regarding the transition of Zomet to an operating format under the Regulation, as stated, which is subject to, among other things, examination of the final
conditions of the arrangement (should it actually enter into effect), the market conditions and the Company’s decision based on its discretion.
14
OPC Energy Ltd.
Report of the Board of Directors
| 3. |
Main Developments in the Business Environment (Cont.)
|
| 3.2 |
Activities in Israel (Cont.)
|
| H. |
Decision regarding determination of the value of the land of the Eshkol site – assessment of the Electricity Authority – as part of the decision, it was determined that the value of the land
of the Eshkol site that will be recognized by Israel Electric Company in the framework of sale of the site will be NIS 1,740 million. As part of update of the electricity tariff for 2025, the amount of NIS 508 million was recognized by the
Electricity Authority. Recognition of the rest of the amount, totaling NIS 1,232 million, plus interest and linkage differences, will be spread out by Israel Electric Company in the framework of the updated tariff over the next 3 years.
|
| I. |
Hearing for examination of alternatives regarding the manner and scope of preserving Units 1–4 on the Orot Rabin site – based on the principles of the energy policies from 2021, it was determined that Units 1–4 in the Orot Rabin
power plant will be preserved up to the end of 2025 in order to maintain the reliability and uninterrupted supply of the electricity in times of emergency. The Minister of Energy and Infrastructures (“the Minister of Energy”) requested to
examine the continued preservation and activity of the coal‑powered units in a case of a lack of natural gas. The Electricity Authority examined two preservation formats – cold and hot – and compared between them and a closing down
alternative, while analyzing costs, benefits and risks. It was found that even though the operating and environmental costs are higher, hot preservation permits a quicker response in times of emergency and saves up to NIS 4 billion per day
in avoidance of power outages. Therefore, the Electricity Authority decided to preserve the units in the not preservation format starting from January 1, 2026 and for a period of three years only, while advancing additional back‑up
solutions for the energy sector in anticipation of closing down the units at the end of the period.
|
| J. |
Continued increase of activities in the market for supply to household customers and small businesses – further to that stated in Section 7.6.5 of Part A of the Periodic Report for 2024, as part of diversification of the mix of
the customers of OPC Israel and further to the undertaking with Partner Communications Ltd. in 2024, in the period of the report an agreement was signed with an additional large retail company.
|
For additional details regarding developments of the Group’s activities in Israel – see Section 6 below.
15
OPC Energy Ltd.
Report of the Board of Directors
| 3. |
Main Developments in the Business Environment (Cont.)
|
| 3.3 |
Activities in the U.S.
|
| K. |
Electricity and natural gas prices
|
The results of the activities of the CPV Group are impacted to a significant extent by the electricity
prices in effect in the areas in which the Group’s power plants operate. The main factors impacting the electricity prices are demand for electricity, available generation capacity (supply) and the natural gas price in the area in which the power
plant operates.
With respect to the “energy transition” activity, in general, the natural gas price is significant in
determination of the price of the electricity in most of the regions in which the power plants of the CPV Group operate that are powered by natural gas. For the most part, in the existing production mix, over time, to the extent the natural‑gas
prices are higher, the marginal energy prices will also be higher, and will have a positive impact on the energy margins of the CPV Group due to the high efficiency of the power plants it owns compared with other power plants operating in the
relevant activity markets (the impact could be different between the projects taking into account their characteristics and the area (region) in which they are located)8.
Electricity prices
The following table summarizes the average electricity prices in each of the regions in which the power
plants in the area of energy transition activities of the CPV Group are active (the prices are denominated in dollars per megawatt hour)*:
|
For the
|
For the
|
|||||||||||||||||||||||
|
Six Months Ended
|
Three Months Ended
|
|||||||||||||||||||||||
|
Region
|
June 30
|
June 30
|
||||||||||||||||||||||
|
(Power Plant)
|
2025
|
2024
|
Change
|
2025
|
2024
|
Change
|
||||||||||||||||||
|
PJM West (Shore, Maryland)
|
48.09
|
31.72
|
52
|
%
|
42.35
|
30.83
|
37
|
%
|
||||||||||||||||
|
New York Zone G (Valley)
|
64.75
|
34.43
|
88
|
%
|
40.93
|
28.64
|
43
|
%
|
||||||||||||||||
|
Mass Hub (Towantic)
|
71.56
|
36.60
|
96
|
%
|
40.01
|
29.28
|
37
|
%
|
||||||||||||||||
|
PJM AEP Dayton (Fairview)
|
44.22
|
29.10
|
52
|
%
|
40.58
|
28.63
|
42
|
%
|
||||||||||||||||
|
PJM ComEd (Three Rivers)
|
33.16
|
24.29
|
37
|
%
|
31.10
|
22.42
|
39
|
%
|
||||||||||||||||
|
ERCOT West Hub (Basin Ranch)**
|
31.42
|
30.88
|
2
|
%
|
31.60
|
31.23
|
1
|
%
|
||||||||||||||||
| * |
Based on Day‑Ahead prices as published by the relevant ISO.
|
| ** |
As at the approval date of the report, a final investment decision with respect to the Basin Ranch project had not yet been made and its construction had not yet started.
|
It is noted that the actual electricity prices of the power plants of the CPV Group could be higher or
lower than the regional price shown in the above table due to the existence of a Power Basis (the difference between the power plant’s specific electricity price and the regional price). The Power Basis is a function of transmission constraints,
local cost of electricity generation, local demand for electricity, losses in the transmission lines and additional factors. For details regarding the Power Basis – see Section 3.3K of the Report of the Board of Directors for 2024.
| 8 |
That stated constitutes merely a general estimate that could be subject to changes due to projects characteristics or factors and events that are not under the control of the CPV Group.
|
16
OPC Energy Ltd.
Report of the Board of Directors
| 3. |
Main Developments in the Business Environment (Cont.)
|
| 3.3 |
Activities in the U.S. (Cont.)
|
| K. |
Electricity and natural gas prices (Cont.)
|
Electricity prices (Cont.)
In the period of the report and in the second quarter of 2025, there was a significant increase in the
electricity prices compared with the corresponding periods last year, which in the estimation of the CPV Group derives mainly from an increase in the natural‑gas prices against the background lower‑than‑average temperatures in the first quarter of
2025 along with higher‑than‑average temperatures in the second quarter of 2025 in the areas in which the power plants of the CPV Group are located.
Natural gas prices
Set forth below are the average natural gas prices in each of the main markets in which the power plants of
the CPV Group operate (the prices are denominated in dollars per MMBtu)*:
|
For the six months ended
|
For the three months ended
|
|||||||||||||||||||||||
|
Region
|
June 30
|
June 30
|
||||||||||||||||||||||
|
(Power Plant)
|
2025
|
2024
|
Change
|
2025
|
2024
|
Change
|
||||||||||||||||||
|
Texas Eastern M‑3 (Shore, Valley – 70%)
|
4.43
|
2.21
|
101
|
%
|
2.47
|
1.53
|
61
|
%
|
||||||||||||||||
|
Transco Zone 5 North (Maryland)
|
4.37
|
2.94
|
49
|
%
|
2.62
|
2.27
|
15
|
%
|
||||||||||||||||
|
Dominion South Pt (Valley – 30%)
|
3.02
|
1.66
|
82
|
%
|
2.32
|
1.45
|
60
|
%
|
||||||||||||||||
|
Algonquin City Gate (Towantic)
|
7.32
|
2.97
|
147
|
%
|
2.86
|
1.68
|
70
|
%
|
||||||||||||||||
|
Texas Eastern M‑2 (Fairview)**
|
3.08
|
1.72
|
79
|
%
|
2.35
|
1.42
|
66
|
%
|
||||||||||||||||
|
Chicago City Gate (Three Rivers)
|
3.43
|
2.25
|
52
|
%
|
2.86
|
1.65
|
73
|
%
|
||||||||||||||||
|
Waha (Basin Ranch)***
|
1.42
|
0.28
|
407
|
%
|
1.02
|
(0.59
|
)
|
273
|
%
|
|||||||||||||||
| * |
Source: The Day‑Ahead prices at gas Midpoints as reported in Platt’s Gas Daily. It is clarified that the actual gas prices of the power plants of the CPV Group could be significantly different.
|
| ** |
Commencing from the third quarter of 2025, Fairview will start acquiring natural gas that is priced based on the Texas Eastern M‑3 transmission region. For additional details – see Appendix A below.
|
| *** |
As at the approval date of the report, a final investment decision with respect to the Basin Ranch project had not yet been made and its construction had not yet started.
|
In the estimation of the CPV Group, the significant increase in the natural gas prices in the period of the
report and in the second quarter of 2025, compared with the corresponding periods last year, is mainly due to the weather conditions described above, which led to a significant rise in demand for natural gas and an increase in the price in the
regions in which the power plants of the CPV Group operate.
Regarding the distribution region for natural gas in Waha Texas, which is expected to serve as the supply
source for the Basin Ranch project, is characterized by variable levels of production of natural gas as a function of the desired levels of production of the crude oil by the producers, which are impacted by the competitive environment in the fuel
market (the natural gas constitutes a by‑product), and transmission and transport limitations of natural gas from the region.
17
OPC Energy Ltd.
Report of the Board of Directors
| 3. |
Main Developments in the Business Environment (Cont.)
|
| 3.3 |
Activities in the U.S. (Cont.)
|
| K. |
Electricity and natural gas prices (Cont.)
|
Natural gas prices (Cont.)
The corresponding periods last year were characterized by a significant surplus supply of natural gas
against the background of the scope of the fuel production and transport limitations as stated (which were resolved in part in the period of the report due to operation of a new natural gas pipeline in the region), and low price‑levels compared with
the other power plants of the CPV Group respectively. Therefore, the rate of increase of the natural gas prices in the period of the report and in the second quarter of 2025 compared with the corresponding periods last year, when measured against the
other power plants of the CPV Group, is unusually high.
Electricity margin in the operating markets of the CPV Group (Spark Spread)
Spark Spread is the difference between the price of the electricity in the relevant area (zone) and the
price of the natural gas used for generation of the electricity in the relevant area (zone) (it is clarified that RGGI is not included in calculation of the Spark Spread but rather in the energy margin as detailed in Section 4F below).
The Spark Spread is calculated based on the following formula:
Spark Spread ($/MWh) = price of the electricity ($/MWh) – [the gas price ($/MMBtu) x thermal conversion
ratio (heat rate) (MMBtu/MWh)]
Set forth below are the average Spark Spread margins for each of the main markets in which the power plants
of the CPV Group are operating (the prices are denominated in dollars per megawatt/hour)*:
|
For the
|
For the
|
|||||||||||||||||||||||
|
Six Months Ended
|
Three Months Ended
|
|||||||||||||||||||||||
|
June 30
|
June 30
|
|||||||||||||||||||||||
|
Power Plant9
|
2025
|
2024
|
Change
|
2025
|
2024
|
Change
|
||||||||||||||||||
|
Shore
|
17.52
|
16.47
|
6
|
%
|
25.31
|
20.27
|
25
|
%
|
||||||||||||||||
|
Maryland
|
17.94
|
11.43
|
57
|
%
|
24.27
|
15.17
|
60
|
%
|
||||||||||||||||
|
Valley
|
37.10
|
20.32
|
83
|
%
|
24.20
|
18.25
|
33
|
%
|
||||||||||||||||
|
Towantic
|
23.98
|
17.30
|
39
|
%
|
21.42
|
18.36
|
17
|
%
|
||||||||||||||||
|
Fairview
|
24.20
|
17.92
|
35
|
%
|
25.31
|
19.40
|
30
|
%
|
||||||||||||||||
|
Three Rivers
|
10.87
|
9.67
|
12
|
%
|
12.51
|
11.70
|
7
|
%
|
||||||||||||||||
|
Basin Ranch**
|
22.19
|
29.06
|
(24
|
)%
|
24.97
|
35.07
|
(29
|
)%
|
||||||||||||||||
| * |
Based on electricity prices as shown in the above table, with assuming a thermal conversion ratio (heat rate) of 6.9 MMBtu/MWh for Maryland, Shore and Valley, and a thermal conversion ratio of 6.5
MMBtu/MWh for Three Rivers, Fairview, Towantic and Basin Ranch. It is clarified that the actual energy margins of the power plants of the CPV Group could be significantly different due to, among other things, the existence of Power Basis and
a different breakdown in the scope of the electricity sold in the peak and off‑peak hours in CPV’s power plants and that shown above (which was calculated in the above table based on the assumption of generation in all the hours of the
24‑hour period).
|
| ** |
As at the approval date of the report, a final investment decision with respect to the Basin Ranch project had not yet been made and its construction had not yet started.
|
9 For additional details regarding the energy
margin of the CPV Group – see Section 4F below.
18
OPC Energy Ltd.
Report of the Board of Directors
| 3. |
Main Developments in the Business Environment (Cont.)
|
| 3.3 |
Activities in the U.S. (Cont.)
|
| K. |
Electricity and natural gas prices (Cont.)
|
Electricity margin in the operating markets of the CPV Group (Spark Spread) (Cont.)
In the period of the report and in the second quarter of 2025, there was a significant increase in the
electricity margins (Spark Spread) in all the active power plants of the CPV Group, compared with the corresponding periods last year, stemming mainly from a relative advantage of the said power plants compared with the market – both the natural gas
prices relative to the gas indices on which the electricity prices are based in the activity markets, as well as the heat rate coefficient and their high efficiency compared with the market (that is, to the extent the gas prices are higher the
marginal energy prices will also be higher and will favorably impact the electricity margins of the CPV Group’s power plants).
Regarding the electricity margins in the ERCOT market, they were different than the said trend of
increases, due to the fact that the pricing of the electricity in the ERCOT West Hub region does not depend directly on the pricing of the natural gas in the WAHA region, which was significantly impacted, as stated above, by the surplus supply and
natural‑gas transmission restrictions in the corresponding periods last year, which contributed to the low price levels of the natural gas in WAHA in 2024.
It is noted that the hedging plans of the electricity margins in the power plants of the CPV Group that are
powered by natural gas is intended to reduce the fluctuations of the CPV Group’s electricity margin resulting from changes in the natural gas and electricity prices in the energy market. For details regarding hedging agreements of the electricity
margin with respect to the active power plants of the CPV Group – see Section 4F below. Regarding the Netback gas agreements and agreements for sale of electricity at a fixed price for hedging a significant part of the capacity of the Basin Ranch
power plant – see Section 6B(2), below).
For details regarding a forecast of the EOX company of electricity and natural gas prices up to the end of
2025 and for 2026–2027 – see Appendix A below.
19
OPC Energy Ltd.
Report of the Board of Directors
| 3. |
Main Developments in the Business Environment (Cont.)
|
| 3.3 |
Activities in the U.S. (Cont.)
|
| L. |
Tax on carbon emissions (RGGI)
|
Regional Greenhouse Gas Initiative (RGGI) is a joint effort of the states of Connecticut, Delaware, Maine,
Maryland, Massachusetts, New Hampshire, New Jersey, New York, Rhode Island and Vermont to determine quotas and to reduce the emissions of carbon dioxide from the energy sector. The RGGI regulation requires the power plants running on fossil fuels to
hold, through public tenders or commerce in a secondary market, gas‑emission quotas for purposes of offsetting emissions of carbon dioxide for every facility. Pursuant to the RGGI regulation, an independent market supervisor provides supervision of
the tenders for gas‑emission quotas, as well as activities in the secondary market, in order to assure the integrity of and confidence in the market. The RGGI regulation applies to 4 of the 6 power plants of the CPV Group in the Energy Transition
segment: Maryland, Shore, Valley and Towantic. With respect to the legal proceeding underway in Pennsylvania (the location of the Fairview power plant) in connection with application of RGGI and the possible significance of the matter – see
Section 8.1.4B of Part A of the Periodic Report for 2024.
Set forth below is a summary of the prices of the gas‑emission quotas (carbon emission tax) from the RGGI tenders. In general,
the tenders take place four times a year, in March, June, September and December.
|
Average for the
|
Average for the
|
|||||||||||||||||||||||
|
Six Months Ended
|
Three Months Ended
|
|||||||||||||||||||||||
|
June 30
|
June 30
|
|||||||||||||||||||||||
|
2025
|
2024
|
Change
|
2025
|
2024
|
Change
|
|||||||||||||||||||
|
Price of carbon emission tax in the RGGI
|
||||||||||||||||||||||||
|
tenders ($ per short ton / 2,000 pounds)*
|
19.91
|
15.44
|
29
|
%
|
19.76
|
16.00
|
24
|
%
|
||||||||||||||||
|
Cost of the carbon emission tax (in terms
|
||||||||||||||||||||||||
|
of gas cost) ($ per MMBtu)**
|
1.19
|
0.92
|
29
|
%
|
1.18
|
0.95
|
24
|
%
|
||||||||||||||||
| * |
The prices of the carbon emissions tax are presented under the assumption that the price of the tender that is held prior to a certain quarter represents the price of the carbon emissions tax for the
subsequent quarter. For example, the tender held in December 2024 will represent the price for the first quarter of 2025. It is noted that the actual price of the carbon emissions tax could be different than the tender prices as a result of
transactions made in the secondary market.
|
| ** |
The cost of the carbon emissions tax (in terms of gas cost) is calculated under the assumption of emissions of carbon dioxide with a reference (ratio) of 119 lbs./MMBtu. It is noted that the actual
carbon dioxide emissions ratio varies between the different power plants, and in the estimation of the CPV Group a ratio of 119 lbs./MMBtu is a representative ratio for power plants running on natural gas.
|
In the period of the report and in the second quarter of 2025 compared with the corresponding periods last year, there was a
significant increase in prices of the carbon emissions tax, which in the estimation of the CPV Group was mostly impacted by an increase in demand of institutional entities for purposes of commercial and hedging activities, and release of all the gas
emission quotas from the cost containment reserve in the first quarter of 2024.
It is noted that release of quotas with respect to emission of gas from a reservoir that acted to moderate costs in the first
quarter of 2025 did not have a significant impact on prices of carbon emissions in the tender that was held in June 2025.
20
OPC Energy Ltd.
Report of the Board of Directors
| 3. |
Main Developments in the Business Environment (Cont.)
|
| 3.3 |
Activities in the U.S. (Cont.)
|
| M. |
Capacity revenues
|
Capacity is a component that is paid by regulatory bodies that manage demand and loads (system operators)
to electricity generators, with respect to their ability to generate energy at the required times for purposes of reliability of the system. This revenue component is an additional component, separate and apart from the component based on the energy
prices (which is paid in respect of sale of the electricity). Definition of the capacity component, as stated, including entitlement to revenue for seeing to availability of the electricity, including provisions regarding bonus or penalty payments,
are governed by the tariffs determined by the ISO of every market. Accordingly, NY‑ISO, PJM and ISO‑NE publish mandatory public auctions for determination of the capacity tariffs. It is noted that, in the nature of things, an increase in the capacity
prices favorably impacts CPV’s results, and vice‑versa. The extent of the impact on the overall results changes as a function of the energy margins, which is the most significant component of the gross profit (margin for generation of the electricity
and the sale thereof) – this being taking into account that the weight of the capacity component is usually lower than the weight of the energy margin component. In the ERCOT market (in Texas) there is no mechanism for capacity payments to power
plants compared with the NYISO, PJM and ISO‑NE markets. For additional details regarding ERCOT – see Section N. below.
PJM market
In the PJM market, the capacity payments vary between the market’s sub‑regions, as a function of local supply and demand and
transmission capabilities.
Set forth below are the capacity tariffs in the sub‑regions that are relevant to the CPV Group’s power plants and in the general
market (the prices are denominated in dollars per megawatt per day).
|
Sub-Region
|
CPV Plants10
|
2026/2027
|
2025/2026
|
2024/2025
|
2023/2024
|
|
PJM RTO
|
329.17
|
269.92
|
28.92
|
34.13
|
|
|
PJM COMED
|
Three Rivers
|
329.17
|
269.92
|
28.92
|
34.13
|
|
PJM MAAC
|
Fairview, Maryland, Maple Hill
|
329.17
|
269.92
|
49.49
|
49.49
|
|
PJM EMAAC
|
Shore
|
329.17
|
269.92
|
54.95
|
49.49
|
Source: PJM
10 The Three Rivers power plant, which commenced commercial operation in July 2023, is entitled to
capacity payments, from this date.
21
OPC Energy Ltd.
Report of the Board of Directors
| 3. |
Main Developments in the Business Environment (Cont.)
|
| 3.3 |
Activities in the U.S. (Cont.)
|
| M. |
Capacity revenues (Cont.)
|
Results of capacity auctions in the PJM market for the period from June 2025 through May 2027
In July 2024, PJM published the results of auctions on capacity prices for the period from June 2025 through May 2026.
The significant increase in the capacity tariff in the auction, as shown in the above table, relates to, among other things, the
forecast of an increase in demand, an increase in the reserves required and a decline in the total supply as a result of requirements and a change in the manner of calculating capacities and load capability of the generation sources by PJM. The
change in the manner of calculating availability capacities of the power plants caused a decrease in the availability capacity that is provided for sale in most of the power plants operating in the PJM market. The impact of the said change on the
natural‑gas power plants, including those of the CPV Group operating in the energy transition area, is a decline in the availability capacity provided for sale from about 96% to about 79%.
In the estimation of the CPV Group, as a result of the increase in the capacity tariff, the addition to its revenues from
capacity from all its power plants, as at the approval date of the report, in the PJM market for the period from June 2025 through May 2026 compared with the period from June 2024 through May 2025 is estimated at about $98 million11.
In September 2024, complaints were filed with the FERC in order to make certain changes in the upcoming capacity auctions in the
PJM market. In response, PJM proposed a postponement of the auction that was originally scheduled for December 2024 by about six months in order to permit the making of changes to the rules of the auctions.
In February 2025, the FERC approved proposals of PJM for changes in the framework of the capacity market, which are aimed at
reducing the pricing fluctuations between the auctions. The amendments include: (A) continued use of gas turbines as a representative index for the demand curve; (B) inclusion of RMR (reliability must run) units – the planned sources for scrap remain
for purposes of assurance of reliability in the auctions in the capacity market as an alternative source of supply; (C) determination of a uniform penalty rate for inferior performances for all the generation sources; (D) increase of the flexibility
regarding submission of bids; and (E) cancellation of the automatic exemptions from the bid requirement for certain types of sources.
In April 2025, FERC approved determination of maximum and minimum price ceilings (collar) of $329 per MW/day and $177 per
MW/day, respectively, for the next two capacity auctions, subject to minor adjustments.
| 11 |
That stated in this Section regarding the estimation of the CPV Group constitutes “forward‑looking” information as it is defined in the Securities Law, with respect to which there
is no certainty it will materialize. Ultimately, the revenues of the CPV Group from availability could be different (even significantly) as a result of, among other things, regulatory changes (including appeal or other processes in the PJM
market or relating to other authorities), operating factors, changes in the business environment and/or existence of one or more of the risk factors the CPV Group is exposed to.
|
22
OPC Energy Ltd.
Report of the Board of Directors
| 3. |
Main Developments in the Business Environment (Cont.)
|
| 3.3 |
Activities in the U.S. (Cont.)
|
| M. |
Capacity revenues (Cont.)
|
Results of capacity auctions in the PJM market for the period from June 2025 through May 2027
(Cont.)
In July 2025, PJM published the results of capacity price offers for the period June 2026 and up to May 2027 where the price was
determined based on the maximum price of $329.17 per MW/day, which reflects an increase of about 22% compared with the capacity price in the prior auction for the 2025/2026 period. According to PJM’s publications, the theoretical price derived from
the results of the tender, with no maximum ceiling, which as stated was set in the tender, would have been $388.57 per megawatt/day. In addition, the capacity coefficient for the power plants was updated, resulting in a reduction in the available
capacity provided for sale by the CPV Group’s natural gas-fired power plants – from approximately 79% to around 74%.
In the estimation of the CPV Group, as a result of the increase in the capacity tariff, the addition to its
capacity revenues from all the power plants it holds as at the approval date of the report in the PJM market for the period from June 2026 and up to May 2027, compared with the period from June 2025 up to May 2026, is estimated at about $18 million.
Subject to additional changes in timetables, if any, as at the approval date of the report, the next capacity auction of PJM for
the 2027/2028 capacity year is planned for December 2025.
NYISO market
Similar to the PJM market, in the NYISO market capacity payments are made in the framework of a central mechanism for
acquisition of capacity. In the NYISO market, there are a number of submarkets, wherein there could be various capacity demands as a function of local supply and demand and transmission capability. NYISO makes seasonal auctions every spring for the
upcoming summer (the months of May through October) and in the fall for the upcoming winter (the months of November through April). In addition, there are supplemental monthly auctions for the balance of the capacity not sold in the seasonal
auctions. The power plants are permitted to assure the capacity tariffs in the seasonal auction, the monthly auction or through bilateral sales.
Set forth below are the capacity prices determined in the seasonal auctions in the NYISO market (the prices are denominated in
dollars per megawatt per day):
|
Sub-Area
|
CPV
Plants
|
Summer
2025
|
Winter 2024/2025
|
Summer
2024
|
|
NYISO
Rest of the Market
|
–
|
153.26
|
66.30
|
168.91
|
|
Lower Hudson Valley
|
Valley
|
153.26
|
66.30
|
168.91
|
Source: NYISO – the Company’s processing in order to convert from dollars for kilowatt per month to dollars for megawatt per
day.
It is noted that the Valley power plant is located in Area G (Lower Hudson Valley) and the actual capacity prices for the Valley
power plants are impacted by the seasonal auctions, the monthly auctions and the SPOT prices, with variable capacity prices every month, as well as bilateral agreements with energy suppliers in the market.
23
OPC Energy Ltd.
Report of the Board of Directors
| 3. |
Main Developments in the Business Environment (Cont.)
|
| 3.3 |
Activities in the U.S. (Cont.)
|
| M. |
Capacity revenues (Cont.)
|
ISO‑NE market
The Towantic power plant, which operates in this market, participated for the first time in a capacity auction for 2018–2019 at
a price of $313.97 MW/day and determination of the tariff for seven years in respect of 725 megawatts linked to the Handy-Whitman Price Index, which will apply up to May 2025.
Similar to the PJM market, in the ISO‑NE market capacity payments are made as part of a central mechanism for acquisition of
capacity. In the ISO‑NE market, there are a number of submarkets, in which there should be capacity requirements that differ as a function of local supply and demand and transport capacity. ISO‑NE executes forward auctions for a period of one year,
commencing from June 1, three years from the year of the auction. In addition, there are supplementary monthly and annual auctions for the balance of the capacity not sold in the forward auctions. The power plants are permitted to guarantee the
capacity payments in the forward auctions, the supplementary auctions or through bilateral sales.
It is noted that the ISO‑NE market is in the midst of a comprehensive reform process with respect to the structure of the
capacity market. Pursuant to the new format, a transition will be made from the model of a tender three years in advance, similar to that used in the PJM market, to a “prompt auction” model, which is based on a seasonal distribution – summer and
winter – in accordance with the NYISO model. During the transition period, the FERC approved suspension of holding the three‑year tenders, up to implementation of the structural change. The planned date for entry of the new model into effect is April
2028, for the capacity supply period between June 2028 and May 2029.
Set forth below are the capacity payments determined in the sub‑regions that are relevant to the Towantic power plant (the
prices are denominated in dollars per megawatt per day):
|
Sub-Region
|
CPV Power Plants
|
2027/2028
|
2026/2027
|
2025/2026
|
|
ISO-NE
Rest of the Market
|
Towantic
|
117.70
|
85.15
|
85.15
|
Source: NE‑ISO – the Company’s processing in order to convert from dollars for kilowatt per month to dollars for megawatt per
day.
It is noted that the actual capacity prices for the Towantic power plant are impacted by forward auctions, supplementary annual
auctions, monthly auctions with capacity prices that change every month and bilateral agreements with energy suppliers in the market.
| N. |
Additional information regarding the ERCOT market in Texas (Basin Ranch project)
|
Further to that stated in Section 6B2(2) of the Report of the Board of Directors for 2024 and the Immediate Report published on
June 9, 2025 (Reference No.: 2025‑01‑041243) relating to the Basin Ranch project in Texas, set forth below is additional information regarding the activity market in which the project is expected to operate (for further details regarding the project
– see Section 6B(2) below):
24
OPC Energy Ltd.
Report of the Board of Directors
| 3. |
Main Developments in the Business Environment (Cont.)
|
| 3.3 |
Activities in the U.S. (Cont.)
|
| N. |
Additional information regarding the ERCOT market in Texas (Basin Ranch project) (Cont.)
|
ERCOT manages the transmission of the electricity for more than 27 million consumers in the State of Texas, which constitutes
about 90% of the consumption of electricity in Texas. ERCOT operates as an independent system operator (ISO) and is responsible for the reliability of the electricity grid and operation of the competitive wholesale electricity market.
ERCOT is singular in that it operates solely within the borders of Texas, under local Texas regulation (PUCT), and is not
subject to the Federal Energy Regulatory Commission (FERC). In general, ERCOT operates independently from electricity transmission systems in west and east Texas.
ERCOT has a competitive wholesale electricity market, which includes a Day‑Ahead market and a Real‑Time market for sale of
electricity and accompanying services. Nonetheless, there is no market mechanism covering capacity payments to power plants, in contrast with the markets in PJM, NYISO and ISO‑NE.
As at the approval date of the report, in the ERCOT electricity market there has been significant growth and continuing demand –
this being due to, among other things, an rapid increase in the population of Texas, expansion of the industrial activities, and an increase in the demand for electricity from energy‑intensive segments, such as, data centers, the oil and gas industry
and mining of cryptographic coins.
In the recent years, the maximum demand for electricity in the ERCOT system reached new record highs, and the forecasts
published by ERCOT indicate an average annual growth rate of 13.6% in the demand for energy up to 203112.
It is noted that the ERCOT market is characterized by relatively high fluctuations in prices compared with the other markets in
which the CPV Group operates, and it does not include, as stated above, guaranteed payments for capacity.
12 Source: Report “Capacity, Demand and Reserves (CDR) in ERCOT Region, 2026-2030”, dated May 16, 2025.
25
OPC Energy Ltd.
Report of the Board of Directors
| 4. |
Analysis of the results of operations for the six months ended June 30, 2025 (in millions of NIS)
|
The Group’s activities in Israel and the United States are subject to seasonal fluctuations.
In Israel, the TAOZ tariffs are supervised (controlled) and published by the Electricity Authority. Generally, the electricity tariffs in
Israel in the summer and the winter are higher than those in the transition seasons. It is noted that acquisition of the gas, which constitutes the main cost in this activity area, is not impacted by seasonality of the TAOZ (or the demand hours’
brackets).
In the United States, the electricity tariffs are not supervised (controlled) and are impacted by the demand for electricity, which is
generally high in periods in which the weather is cold or hot compared with the average (generally in the summer and the winter seasons) and they are materially impacted by the natural gas prices, which are usually higher in the winter compared with
the annual average and depending on the weather. In addition, in connection with renewable energy projects, in wind projects the wind speeds tend to be higher in the winter and lower in the summer, whereas in solar projects the radiation from the sun
tends to be higher in the spring and summer months and lower in the fall and winter months.
| A. |
Statement of income
|
|
For the Six Months Ended
|
||||||||
|
Section
|
June 30
|
|||||||
|
*2025
|
2024
|
|||||||
|
Revenues from sales and provision of services (1)
|
1,361
|
1,311
|
||||||
|
Cost of sales and provision of services (without depreciation and amortization) (2)
|
(1,040
|
)
|
(911
|
)
|
||||
|
Depreciation and amortization
|
(121
|
)
|
(155
|
)
|
||||
|
Gross profit
|
200
|
245
|
||||||
|
Share in earnings of associated companies
|
212
|
86
|
||||||
|
Compensation for loss of income
|
–
|
26
|
||||||
|
Administrative and general expenses
|
(148
|
)
|
(119
|
)
|
||||
|
Business development expenses
|
(6
|
)
|
(22
|
)
|
||||
|
Other expenses, net
|
(16
|
)
|
(52
|
)
|
||||
|
Operating income
|
242
|
164
|
||||||
|
Financing expenses, net
|
(119
|
)
|
(149
|
)
|
||||
|
Income before taxes on income
|
123
|
15
|
||||||
|
Taxes on income expenses
|
(26
|
)
|
(27
|
)
|
||||
|
Net income (loss) for the period**
|
97
|
(12
|
)
|
|||||
|
Attributable to:
|
||||||||
|
The Company’s shareholders
|
71
|
2
|
||||||
|
Holders of non‑controlling interests
|
26
|
(14
|
)
|
|||||
| * |
Commencing from November 2024, as a result of loss of discontinuance of consolidation of CPV Renewable and transition to the equity method of accounting, the Company has discontinued consolidation in
the consolidated financial statements of the results of the renewable energy segment in the U.S.
|
| ** |
For an analysis of the change in the net income and a definition and analysis of the change in the adjusted net income – see Section 4G below.
|
26
OPC Energy Ltd.
Report of the Board of Directors
| 4. |
Analysis of the results of operations for the six months ended June 30, 2025 (in millions of NIS) (Cont.)
|
| A. |
Statement of income (Cont.)
|
| (1) |
Changes in revenues:
|
|
Revenues
|
For the
|
Board’s Explanations
|
|||||||
|
Six Months
|
|||||||||
|
Ended
|
|||||||||
|
June 30
|
|||||||||
|
2025
|
2024
|
||||||||
|
Revenues in Israel
|
|||||||||
|
Revenues from sale of energy to private customers
|
559
|
605
|
A decrease, in the amount of about NIS 27 million, stemming from a decline in the consumption of customers compared
with the corresponding quarter last year, mainly in light of the “Nation as a Lioness” mission and a decline, of about NIS 18 million, stemming from a decrease in the tariff for the generation component compared with the corresponding period
last year.
|
||||||
|
Revenues from sale of energy to the System Operator and to other suppliers
|
104
|
96
|
|||||||
|
Revenues in respect of capacity payments
|
70
|
88
|
Most of the decrease stems from a decline in the availability of the Zomet power plant compared with the corresponding
period last year. For additional details – see Section 4C below.
|
||||||
|
Revenues from sale of energy at cogeneration tariff
|
49
|
25
|
Most of the increase stems from maintenance work at the Hadera power plant in the corresponding period last year.
|
||||||
|
Revenues from sale of steam
|
31
|
30
|
|||||||
|
Other revenues
|
–
|
23
|
The decrease derives from discontinuance of the consolidation of Gnrgy at the end of second quarter of 2024.
|
||||||
|
Total revenues from sale of energy and others in Israel (without infrastructure services)
|
813
|
867
|
|||||||
|
Revenues from private customers in respect of infrastructure services
|
262
|
207
|
The increase stems mainly from an average increase in the tariffs, at the rate of about 40%.
|
||||||
|
Total revenues in Israel
|
1,075
|
1,074
|
|||||||
|
Revenues in the U.S.
|
|||||||||
|
Revenues from sale of electricity from renewable energy
|
–
|
125
|
The decrease derives mainly from discontinuance of consolidation of the renewable energies segment in November 2024,
and transition to the equity method of accounting. For additional details – see Note 23E to the annual financial statements.
|
||||||
|
Revenues from sale of electricity (retail) activities and others
|
286
|
112
|
The increase stems mainly from an increase in the scope of the retail activities.
|
||||||
|
Total revenues in the U.S.
|
286
|
237
|
|||||||
|
Total revenues
|
1,361
|
1,311
|
|||||||
27
OPC Energy Ltd.
Report of the Board of Directors
| 4. |
Analysis of the results of operations for the six months ended June 30, 2025 (in millions of NIS) (Cont.)
|
| A. |
Statement of income (Cont.)
|
| (2) |
Changes in the cost of sales and provision of services (not including depreciation and amortization):
|
|
Cost of Sales and
Services
|
For the
Six Months
|
Board’s Explanations
|
|||||||
|
Ended
|
|||||||||
|
June 30
|
|||||||||
|
2025
|
2024
|
||||||||
|
Cost of sales in Israel
|
|||||||||
|
Natural gas and diesel oil
|
335
|
331
|
|||||||
|
Expenses in respect of acquisition of energy
|
86
|
117
|
Most of the decrease stems from maintenance work performed at the Rotem and Hadera power plants in the corresponding
period last year.
|
||||||
|
Cost of transmission of gas
|
27
|
28
|
|||||||
|
Salaries and related expenses
|
20
|
21
|
|||||||
|
Operating expenses
|
58
|
57
|
|||||||
|
Other expenses
|
–
|
18
|
Most of the decrease stems from discontinuance of the consolidation of Gnrgy at the end of the second quarter of 2024.
|
||||||
|
Total cost of sales in Israel without infrastructure services
|
526
|
572
|
|||||||
|
Expenses in respect of infrastructure services
|
262
|
207
|
For details – see the explanation of the change in the revenues in respect of infrastructure services.
|
||||||
|
Total cost of sales in Israel
|
788
|
779
|
|||||||
|
Cost of sales and services in the U.S.
|
|||||||||
|
Cost of sales in respect of sale of electricity from renewable energy
|
–
|
42
|
The decrease stems from discontinuance of consolidation of the renewable energies segment in November 2024 and
transition to the equity method of accounting. For additional details – see Note 23E to the annual financial statements.
|
||||||
|
Cost of sales in respect of sale of electricity (Retail) and others
|
252
|
90
|
The increase stems mainly from an increase in the scope of the retail activities.
|
||||||
|
Total cost of sales and provision of services in the U.S.
|
252
|
132
|
|||||||
|
Total cost of sales and provision of services
|
1,040
|
911
|
|||||||
28
OPC Energy Ltd.
Report of the Board of Directors
| 4. |
Analysis of the results of operations for the six months ended June 30, 2025 (in millions of NIS) (Cont.)
|
| B. |
EBITDA, FFO and net cash flows after debt service
|
| 1. |
EBITDA indices
|
“EBITDA in the consolidated financial statements”13: net income (loss) for the period before
depreciation and amortization, financing expenses or income, net, taxes on income and other income (expenses), net.
“EBITDA after proportionate consolidation”: – “EBITDA in the consolidated financial statements” less the share of the
income (loss) of associated companies and plus a proportionate consolidation of the EBITDA of the associated companies based on the rate of the holdings of the CPV Group therein.
It is clarified that starting from 2024, the Company no longer includes in its financial statements the “adjusted EBITDA after
proportionate consolidation” index due to immateriality and, accordingly, irrelevance of the adjustments in respect of changes in fair value of derivative financial instruments and items not in the ordinary course of the Group’s business. For the
period of the report and the corresponding period last year, these adjustments totaled an aggregate amount of about NIS 3 million and about NIS 10 million, respectively.
| 2. |
“FFO” (funds from operations) – with respect to active projects – cash flows from current operating activities for the period (including changes in working capital) and less investments in
property, plant and equipment and periodic maintenance costs that are not included in the operating activities and less net interest payments. With respect to the rest of the Group’s activities – cash flows from current operating activities
for the period (including changes in working capital) and less net interest payments (to the extent they do not relate to projects under construction). It is clarified that investments in property, plant and equipment (under construction
and/or in development) including the net interest payments in respect thereof, are not included in FFO.
|
| 3. |
“Net cash flows after service of project debt” – the “FFO” less/plus payment of principal in respect of financial debt and/or taking out of project debt and non‑project debt (loans and/or
debentures), and after adjustments for a change in other credit from banks and a change in cash, including cash restricted for debt service and deposits (including to secure transactions hedging electricity margins).
|
The said indices are not recognized in accordance with International Financial Reporting Standards (IFRS) as
indices for measurement of financial performances and are not intended to be considered a replacement for gross profit or loss and operating income, cash flows from operation activities or other terms relating to operating performances or liquidity
indices in accordance with IFRS.
| 13 |
It is clarified that the compensation for loss of income is included in EBITDA in the consolidated statements.
|
29
OPC Energy Ltd.
Report of the Board of Directors
| 4. |
Analysis of the results of operations for the six months ended June 30, 2025 (in millions of NIS) (Cont.)
|
| B. |
EBITDA, FFO and net cash flows after debt service (Cont.)
|
It is noted that the EBITDA indices are intended to present an approximate of the free cash flows from the Group’s operating
activities or to present cash available for distribution of dividends or other uses (particularly in light of provisions of the project financing agreements for some of the Group’s power plants), since such cash may be used for debt service, capital
investments, working capital and other liabilities. Moreover, the EBITDA indices are characterized by restrictions that limit the use thereof as indices for analyzing the Company’s profitability, since they do not take into account certain income and
expenses deriving from the Company’s business that could have a material impact on its net income or loss, such as depreciation expenses, financing expenses or income and taxes on income.
The Company believes that the data items “EBITDA after proportionate consolidation” and “FFO”14 provide useful and
transparent information to investors when reviewing the Company’s operating performances and current cash flows and when comparing such performances to performances of other companies in the same sector or in other industries (having different
capital structures, different levels of debt and/or different income tax rates) as well as when comparing performances between periods. It is noted that the “EBITDA after proportionate consolidation” data item also serves the Company’s management
when analyzing the Company’s performances.
The data item “net cash flows after debt service” provides additional information regarding the Group’s net cash flows that are
available for its use for purposes of growth and making of new investments, along with distribution of dividends to the shareholders (subject to compliance with the provisions of law, the trust certificates and non‑project financing agreements and in
accordance with the Group’s policies).
EBITDA calculations in the consolidated statement, including EBITDA after proportionate consolidation (in millions of NIS):
|
For the
Six Months Ended
|
||||||||
|
June 30
|
||||||||
|
2025
|
2024
|
|||||||
|
Revenues from sales and provision of services
|
1,361
|
1,311
|
||||||
|
Cost of sales (without depreciation and amortization)
|
(1,040
|
)
|
(911
|
)
|
||||
|
Share in income of associated companies
|
212
|
86
|
||||||
|
Compensation for lost revenues
|
–
|
26
|
||||||
|
Administrative and general expenses (without depreciation and amortization)
|
(140
|
)
|
(112
|
)
|
||||
|
Business development expenses
|
(6
|
)
|
(22
|
)
|
||||
|
Consolidated EBITDA
|
387
|
378
|
||||||
|
Elimination of the share in income of associated companies
|
(212
|
)
|
(86
|
)
|
||||
|
Plus – Group’s share of the EBITDA after proportionate consolidation of
|
||||||||
|
associated companies in the Energy Transition segment (1)
|
500
|
281
|
||||||
|
Plus – Group’s share of the EBITDA after proportionate consolidation of
|
||||||||
|
activities in the renewable energies segment in the U.S. (2)*
|
58
|
–
|
||||||
|
EBITDA after proportionate consolidation
|
733
|
573
|
||||||
| * |
Due to completion of an investment transaction in the area of renewable energies in the U.S. in November 2024, starting from this date the data of this segment is calculated on the basis of a
proportionate consolidation (instead of a full consolidation up to that time) where the share of the CPV Group is about 66.7%.
|
| 14 |
It is noted that other companies might define EBITDA and FFO indices differently.
|
30
OPC Energy Ltd.
Report of the Board of Directors
| 4. |
Analysis of the results of operations for the six months ended June 30, 2025 (in millions of NIS) (Cont.)
|
| B. |
EBITDA, FFO and net cash flows after debt service (Cont.)
|
| (1) |
Calculation of the Group’s share in the EBITDA after proportionate consolidation, FFO and net cash flows after service of project debt of associated companies in the Energy Transition segment (in
millions of NIS):
|
|
For the six months ended June 30, 2025
|
Fairview
|
Towantic
|
Maryland
|
Shore
(1)(2) |
|
Valley
|
Three
Rivers
|
Total
|
||||||||||||||||||||
|
Rate of holdings of the CPV Group
|
25%
|
|
26%
|
|
75%
|
|
89%
|
|
50%
|
|
10%
|
|
||||||||||||||||
|
Revenues from sales of energy
|
159
|
164
|
366
|
217
|
313
|
41
|
1,260
|
|||||||||||||||||||||
|
Cost of natural gas
|
80
|
116
|
183
|
137
|
134
|
25
|
675
|
|||||||||||||||||||||
|
Carbon emissions tax (RGGI)
|
–
|
17
|
60
|
26
|
40
|
–
|
143
|
|||||||||||||||||||||
|
Cost of sales – other expenses (without
|
||||||||||||||||||||||||||||
|
depreciation and amortization)
|
1
|
2
|
11
|
5
|
3
|
–
|
22
|
|||||||||||||||||||||
|
Gain (loss) on realization of transactions
|
||||||||||||||||||||||||||||
|
hedging the electricity margins
|
7
|
(2
|
)
|
12
|
24
|
(12
|
)
|
11
|
40
|
|||||||||||||||||||
|
Net energy margin
|
85
|
27
|
124
|
73
|
124
|
27
|
460
|
|||||||||||||||||||||
|
Revenues from capacity payments
|
13
|
53
|
28
|
32
|
27
|
4
|
157
|
|||||||||||||||||||||
|
Other income
|
3
|
9
|
12
|
6
|
1
|
1
|
32
|
|||||||||||||||||||||
|
Gross profit
|
101
|
89
|
164
|
111
|
152
|
32
|
649
|
|||||||||||||||||||||
|
Fixed costs (without depreciation and
|
||||||||||||||||||||||||||||
|
amortization)
|
6
|
10
|
28
|
38
|
35
|
7
|
124
|
|||||||||||||||||||||
|
Administrative and general expenses
|
||||||||||||||||||||||||||||
|
(without depreciation and amortization)
|
3
|
2
|
6
|
6
|
4
|
1
|
22
|
|||||||||||||||||||||
|
Loss from revaluation of unrealized
|
||||||||||||||||||||||||||||
|
hedging transactions
|
(2
|
)
|
–
|
–
|
–
|
–
|
(1
|
)
|
(3
|
)
|
||||||||||||||||||
|
Group’s share in EBITDA after
|
||||||||||||||||||||||||||||
|
proportionate consolidation in the
|
||||||||||||||||||||||||||||
|
Energy Transition segment
|
90
|
77
|
130
|
67
|
113
|
23
|
500
|
|||||||||||||||||||||
|
Group’s share in FFO
|
62
|
46
|
86
|
(24
|
)
|
73
|
14
|
257
|
||||||||||||||||||||
|
Group’s share in net cash flows after flows
|
||||||||||||||||||||||||||||
|
service of project debt (3)
|
29
|
42
|
33
|
(241
|
)
|
(1
|
)
|
8
|
(130
|
)
|
||||||||||||||||||
| (1) |
At the Shore power plant – gas transmission costs (totaling in the period of the report of about NIS 23 million) are classified in accordance with IFRS 16 as depreciation expenses and, accordingly,
are not included in the EBITDA.
|
| (2) |
The net cash flows after service of the project debt in Shore includes partial repayment of debt that was made as part of the refinancing made in February 2025. For additional details – see
Section 9A(7) below.
|
| (3) |
It is pointed out that the financing agreements of the CPV Group include arrangements for mechanisms of the “cash sweep” type, in the framework of which all or part of the free cash flows of the
projects is designated for repayment of loan principal on a current basis along with a predetermined minimum repayment schedule relating to every long‑term loan. Accordingly, there could be an acceleration of execution of repayments upon
occurrence of certain events and there are also restrictions on distributions to shareholders.
|
| * |
For details regarding transactions for acquisition of additional holdings in the Shore and Maryland power plants in the fourth quarter of 2024 and the second quarter of 2025 – see Note 24C to the
annual financial statements and Note 9C(1) to the Interim Statements.
|