Shareholder Report
|
6 Months Ended |
|
Jun. 30, 2025
USD ($)
Holding
|
|---|
| Shareholder Report [Line Items] |
|
|
| Document Type |
N-CSRS
|
|
| Amendment Flag |
false
|
|
| Registrant Name |
BNY Mellon Sustainable U.S. Equity Portfolio, Inc.
|
|
| Entity Central Index Key |
0000890064
|
|
| Entity Investment Company Type |
N-1A
|
|
| Document Period End Date |
Jun. 30, 2025
|
|
| C000005026 [Member] |
|
|
| Shareholder Report [Line Items] |
|
|
| Fund Name |
BNY Mellon Sustainable U.S. Equity Portfolio, Inc.
|
|
| Class Name |
Initial Shares
|
|
| No Trading Symbol Flag |
true
|
|
| Annual or Semi-Annual Statement [Text Block] |
This semi-annual shareholder report contains important information about BNY Mellon Sustainable U.S. Equity Portfolio, Inc. (the “Fund”) for the period of January 1, 2025 to June 30, 2025.
|
|
| Shareholder Report Annual or Semi-Annual |
semi-annual shareholder report
|
|
| Additional Information [Text Block] |
You can find additional information about the Fund at www.bny.com/investments/us/en/intermediary/products/variable-products.html#funds-table-tabs1. You can also request this information by calling 1-800-373-9387 (inside the U.S. only) or by sending an e-mail request to info@bny.com.
|
|
| Additional Information Phone Number |
1-800-373-9387
|
|
| Additional Information Email |
info@bny.com
|
|
| Additional Information Website |
www.bny.com/investments/us/en/intermediary/products/variable-products.html#funds-table-tabs1
|
|
| Expenses [Text Block] |
What were the Fund’s costs for the last six months ? (based on a hypothetical $10,000 investment)
| Share Class |
Costs of a $10,000 investment |
Costs paid as a percentage of a $10,000 investment |
| Initial Shares |
$34 |
0.67%* |
|
|
| Expenses Paid, Amount |
$ 34
|
|
| Expense Ratio, Percent |
0.67%
|
[1] |
| Net Assets |
$ 385,000,000
|
|
| Holdings Count | Holding |
46
|
|
| Investment Company Portfolio Turnover |
13.72%
|
|
| Additional Fund Statistics [Text Block] |
KEY FUND STATISTICS (AS OF 6/30/25 )
Fund Size (Millions) |
Number of Holdings |
Portfolio Turnover |
| $385 |
46 |
13.72% |
|
|
| Holdings [Text Block] |
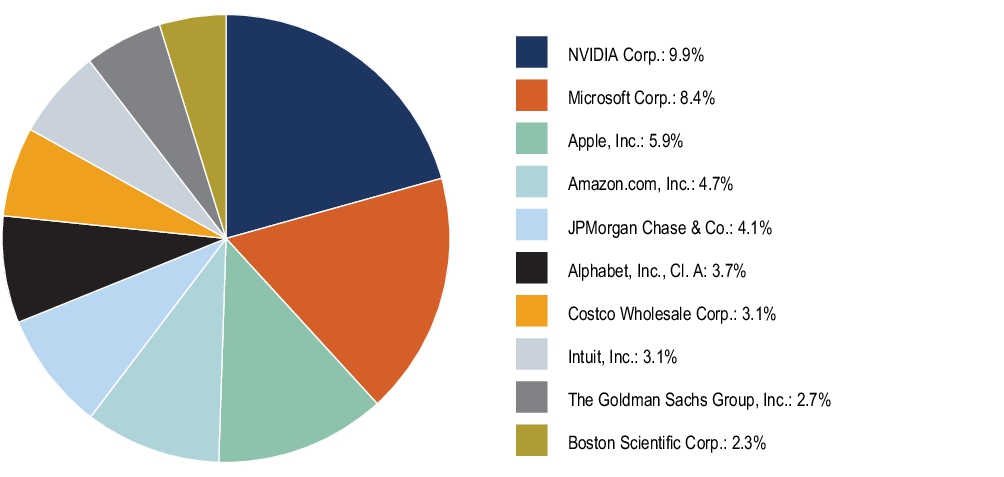
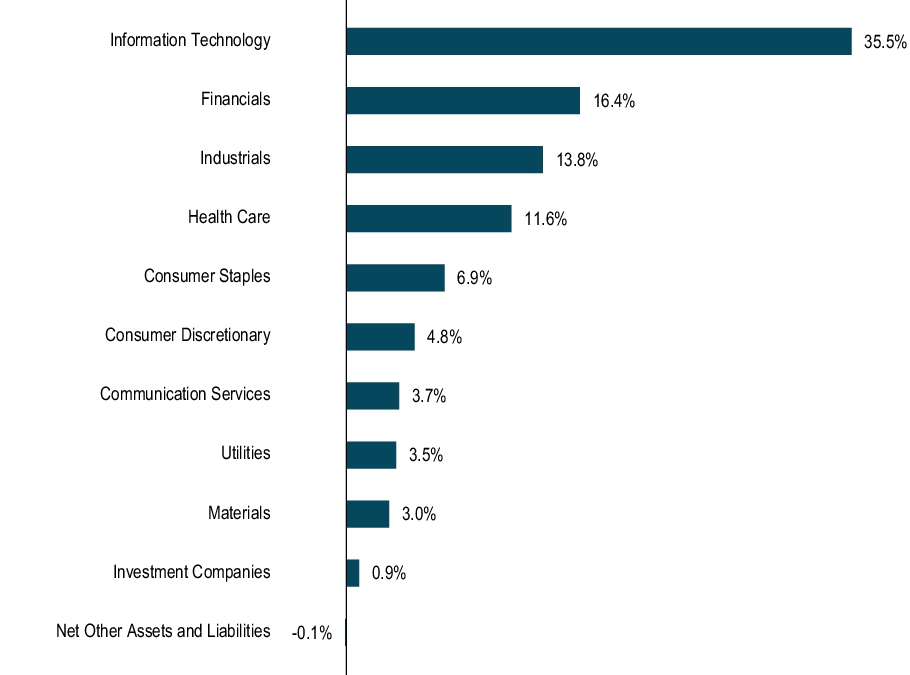
Portfolio Holdings (as of 6/30/25 ) Top Ten Holdings (Based on Net Assets) * * Excludes money market funds or other short-term securities held for the investment of cash and cash collateral for securities loaned, if any. Sector Allocation (Based on Net Assets)
|
|
| Largest Holdings [Text Block] |
Top Ten Holdings (Based on Net Assets) * * Excludes money market funds or other short-term securities held for the investment of cash and cash collateral for securities loaned, if any.
|
|
| C000005027 [Member] |
|
|
| Shareholder Report [Line Items] |
|
|
| Fund Name |
BNY Mellon Sustainable U.S. Equity Portfolio, Inc.
|
|
| Class Name |
Service Shares
|
|
| No Trading Symbol Flag |
true
|
|
| Annual or Semi-Annual Statement [Text Block] |
This semi-annual shareholder report contains important information about BNY Mellon Sustainable U.S. Equity Portfolio, Inc. (the “Fund”) for the period of January 1, 2025 to June 30, 2025.
|
|
| Shareholder Report Annual or Semi-Annual |
semi-annual shareholder report
|
|
| Additional Information [Text Block] |
You can find additional information about the Fund at www.bny.com/investments/us/en/intermediary/products/variable-products.html#funds-table-tabs1. You can also request this information by calling 1-800-373-9387 (inside the U.S. only) or by sending an e-mail request to info@bny.com.
|
|
| Additional Information Phone Number |
1-800-373-9387
|
|
| Additional Information Email |
info@bny.com
|
|
| Additional Information Website |
www.bny.com/investments/us/en/intermediary/products/variable-products.html#funds-table-tabs1
|
|
| Expenses [Text Block] |
What were the Fund’s costs for the last six months ? (based on a hypothetical $10,000 investment)
| Share Class |
Costs of a $10,000 investment |
Costs paid as a percentage of a $10,000 investment |
| Service Shares |
$47 |
0.92%* |
|
|
| Expenses Paid, Amount |
$ 47
|
|
| Expense Ratio, Percent |
0.92%
|
[2] |
| Net Assets |
$ 385,000,000
|
|
| Holdings Count | Holding |
46
|
|
| Investment Company Portfolio Turnover |
13.72%
|
|
| Additional Fund Statistics [Text Block] |
KEY FUND STATISTICS (AS OF 6/30/25 )
Fund Size (Millions) |
Number of Holdings |
Portfolio Turnover |
| $385 |
46 |
13.72% |
|
|
| Holdings [Text Block] |
Portfolio Holdings (as of 6/30/25 ) Top Ten Holdings (Based on Net Assets) * * Excludes money market funds or other short-term securities held for the investment of cash and cash collateral for securities loaned, if any. Sector Allocation (Based on Net Assets)
|
|
| Largest Holdings [Text Block] |
Top Ten Holdings (Based on Net Assets) * * Excludes money market funds or other short-term securities held for the investment of cash and cash collateral for securities loaned, if any.
|
|
|
|