
Endeavour Silver Corp.
Management’s Discussion & Analysis
For the Three Months and Six Months Ended June 30, 2025 and 2024
| MANAGEMENT'S DISCUSSION AND ANALYSIS FOR THE PERIOD ENDED JUNE 30, 2025 |
This Management Discussion and Analysis (“MD&A”) should be read in conjunction with the condensed consolidated interim financial statements of Endeavour Silver Corp. (“Endeavour” or “the Company”) for the period ended June 30, 2025 and the related notes contained therein, which were prepared in accordance with IAS 34 – Interim financial reporting of the International Financial Reporting Standards (“IFRS”) as issued by the International Accounting Standards Board. The Company uses certain non-IFRS financial measures in this MD&A as described under “Non‑IFRS Measures”. Additional information relating to the Company, including the most recent Annual Information Form (the “Annual Information Form”), is available on SEDAR+ at www.sedarplus.com, and the Company’s most recent annual report on Form 40-F has been filed with the U.S. Securities and Exchange Commission (the “SEC”) on EDGAR at www.sec.gov. This MD&A contains “forward-looking statements” that are subject to risk factors set out in a cautionary note contained herein. All dollar ($) amounts are expressed in United States (“$”) dollars and tabular amounts are expressed in thousands of U.S. dollars unless Canadian dollars (CAN$) or Mexican pesos (MXN) are otherwise indicated. This MD&A is dated as of August 12, 2025, and all information contained is current as of August 12, 2025, unless otherwise stated.
Cautionary Note to U.S. Investors Regarding Mineral Reserves and Resources
This MD&A has been prepared in accordance with the requirements of Canadian provincial securities laws, which differ from the requirements of U.S. securities laws. As a result, the Company reports the mineral reserves and resources of the projects it has an interest in according to Canadian standards. Canadian reporting requirements for disclosure of mineral properties are governed by National Instrument 43-101 - Standards of Disclosure for Mineral Projects ("NI 43-101"). NI 43-101 is a rule developed by the Canadian Securities Administrators that establishes standards for all public disclosure an issuer makes of scientific and technical information concerning mineral projects. These standards differ from the requirements of the SEC that are applicable to domestic United States reporting companies under subpart 1300 of Regulation S-K ("S-K 1300") under the Exchange Act. As an issuer that prepares and files its reports with the SEC pursuant to the Multijurisdictional Disclosure System, the Company is not subject to the requirements of S-K 1300. Any mineral reserves and mineral resources reported by the Company in accordance with NI 43-101 may not qualify as such under or differ from those prepared in accordance with S-K 1300. Accordingly, information included or incorporated by reference in this MD&A concerning descriptions of mineralization and estimates of mineral reserves and resources under Canadian standards may not be comparable to similar information made public by United States companies subject to the reporting and disclosure requirements of S-K 1300.
Forward-Looking Statements
This MD&A contains “forward-looking statements” within the meaning of the U.S. Securities Litigation Reform Act of 1995, as amended and “forward-looking information” within the meaning of applicable Canadian securities legislation. Such forward‑looking statements and information include, but are not limited to, statements regarding the development of the Terronera Project (as defined herein), including: anticipated timing; The Company’s areas of focus for the Terronera Project, estimated Terronera Project economics; Terronera Project’s forecasted operations, costs and expenditures; the reliability of mineral resource estimates; the continuation of exploration and mining operations; the Company’s future production and cost guidance announcements; mineral resource estimations and life of mine plans; planned expansions, exploration and drilling activities, and the Company’s areas of focus for each; the Company’s plans for drilling and technical work; Endeavour’s annual outlook including anticipated performance in 2025, including production and cost guidance and financial results, silver and gold grades and recoveries, cash costs per ounce (“oz”), anticipated operating costs, planned capital expenditures and sustaining capital the price of gold and silver, planned capital allocation; working capital; the Company’s capital requirements and the adequacy of the operating cash flow and existing working capital to meet capital requirements and the timing and results of various activities. Forward-looking statements are frequently characterized by words such as “plan”, “expect”, “forecast”, “project”, ”intend”, ”believe”, ”anticipate”, “outlook” and other similar words, or statements that certain events or conditions “may” or “will” occur. Forward‑ looking statements are based on the opinions and estimates of management at the dates the statements are made, and are subject to a variety of risks and uncertainties and other factors that could cause actual events or results to differ materially from those projected in the forward-looking statements.
The Company does not intend to, and does not assume any obligation to, update such forward-looking statements or information, other than as required by applicable law. Forward-looking statements or information involve known and unknown risks, uncertainties and other factors and are based on assumptions that may cause the actual results, level of activity, performance or achievements of the Company and its operations and related timeframes to be materially different from those expressed or implied by such statements. Such factors and assumptions include, among others: the ongoing effects of inflation and supply chain issues on project economics; fluctuations in the prices of silver and gold; fluctuations in the currency markets (particularly the Mexican peso, Chilean peso, Canadian dollar, Peruvian sol, and U.S. dollar); fluctuations in interest rates; effects of inflation changes in national and local governments, legislation, taxation, controls, regulations and political or economic developments in Canada, Peru and Mexico; operating or technical difficulties in mineral exploration, development and mining activities; risks and hazards of mineral exploration, development and mining (including, but not limited to environmental hazards, industrial accidents, unusual or unexpected geological conditions, pressures, cave-ins and flooding); inadequate insurance, or inability to obtain insurance; availability of and costs associated with mining inputs and labour; the speculative nature of mineral exploration and development; diminishing quantities or grades of mineral reserves as properties are mined; risks in obtaining necessary licenses and permits; challenges to the Company’s title to properties; as well as those factors described under “Risk Factors” in the Company’s Annual Information Form and in the Company’s prospectus dated May 27, 2025. Although the Company has attempted to identify important factors that could cause actual results to differ materially from those contained in forward-looking statements or information, there may be other factors that cause results to be materially different from those anticipated, described, estimated, assessed or intended. There can be no assurance that any forward-looking statements or information will prove to be accurate as actual results and future events could differ materially from those anticipated in such statements or information. Accordingly, readers should not place undue reliance on forward-looking statements or information.
Certain forward-looking statements and information in this MD&A may be considered "financial outlook" within the meaning of applicable Canadian securities legislation. Financial outlook is presented in this MD&A for the purpose of assisting investors and others in understanding certain key elements of the Company's financial results and business plan, as well as the objectives, strategic priorities and business outlook of the Company, and in obtaining a better understanding of the Company's anticipated operating environment. Readers are cautioned that such financial outlook may not be appropriate for other purposes.
Qualified Person
The scientific and technical information contained in this MD&A relating to the Company's mines and mineral projects has been reviewed and approved by Dale Mah, B.Sc., P.Geo., Vice President Corporate Development of Endeavour, a Qualified Person within the meaning of NI 43-101.
Table of Contents
OVERVIEW OF THE BUSINESS
The Company is engaged in silver mining in Mexico and related activities including property acquisition, exploration, development, mineral extraction, processing, refining and reclamation. The Company is also engaged in exploration activities in Chile and Nevada, USA. The Company's operations are comprised of the Guanaceví and Bolañitos mines located in Durango, Mexico and Guanajuato, Mexico respectively. The Company is developing the Terronera project located in Jalisco State, Mexico (the "Terronera Project"). The Company is advancing several other exploration projects in order to achieve its goal to become a premier senior producer in the silver mining sector.
On May 1, 2025, the Company completed the acquisition of all outstanding shares of Compañia Minera Kolpa S.A. (“Minera Kolpa” or “Kolpa”), a privately held silver-focused polymetallic mining company located in Huancavelica, Peru. The total consideration was approximately $134.3 million, comprising $78.0 million in cash, $48.4 million in Endeavour common shares, and up to $10 million in contingent payments based on mineral resource expansion targets (the “Transaction”), valued at $7.9 million at the date of the acquisition. As part of the Transaction, Endeavour also assumed $25.8 million in debt.
The Company's common shares are listed on the Toronto Stock Exchange (TSX: EDR) and the New York Stock Exchange (NYSE: EXK).
OPERATING HIGHLIGHTS
| Three Months Ended June 30 | Q2 2025 Highlights | Six Months Ended June 30 | ||||
| 2025 | 2024 | % Change | 2025 | 2024 | % Change | |
| Production | ||||||
| 1,483,736 | 1,312,572 | 13% | Silver ounces produced | 2,689,529 | 2,772,578 | (3%) |
| 7,755 | 10,549 | (26%) | Gold ounces produced | 16,093 | 20,682 | (22%) |
| 3,503 | - | - | Lead tonnes produced | 3,503 | - | - |
| 2,316 | - | - | Zinc tonnes produced | 2,316 | - | - |
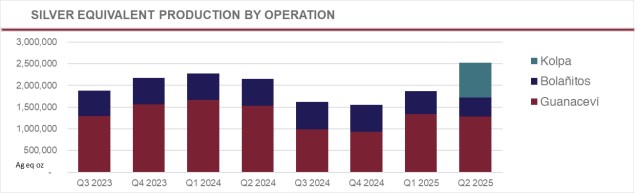
| 2,528,562 | 2,156,453 | 17% | Silver equivalent ounces produced(1) | 4,401,401 | 4,427,130 | (1%) |
| 15.35 | 13.43 | 14% | Cash costs per silver ounce(2) | 15.59 | 13.30 | 17% |
| 25.25 | 20.48 | 23% | Total production costs per ounce(2) | 24.79 | 19.65 | 26% |
| 25.16 | 23.13 | 9% | All-in sustaining costs per ounce (2) | 24.85 | 22.24 | 12% |
| 303,828 | 218,989 | 39% | Processed tonnes | 513,335 | 440,783 | 16% |
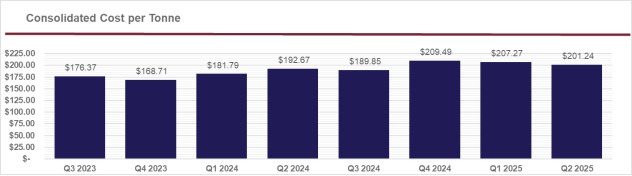
| 142.00 | 140.36 | 1% | Direct operating costs per tonne(2) | 142.30 | 137.65 | 3% |
| 201.24 | 192.68 | 4% | Direct costs per tonne(2) | 203.70 | 187.19 | 9% |
| Financial | ||||||
| 85.3 | 58.3 | 46% | Revenue from operations ($ millions) | 148.8 | 122.0 | 22% |
| 1,455,680 | 1,217,569 | 20% | Silver ounces sold | 2,679,364 | 2,973,663 | (10%) |
| 7,706 | 9,887 | (22%) | Gold ounces sold | 16,244 | 20,767 | (22%) |
| 32.95 | 28.94 | 14% | Realized silver price per ounce | 32.52 | 25.71 | 26% |
| 3,320 | 2,374 | 40% | Realized gold price per ounce | 3,110 | 2,238 | 39% |
| 3.3 | - | - | Pre-production revenue ($ millions) | 3.3 | - | - |
| 85,711 | - | - | Pre-production silver equivalent ounces sold(1) | 85,711 | - | - |
| (20.5) | (14.0) | (46%) | Net earnings (loss) ($ millions) | (53.4) | (15.2) | (251%) |
| (9.2) | (1.0) | (841%) | Adjusted net earnings (loss) ($ millions)(2) | (9.4) | (0.7) | (1,227%) |
| 7.7 | 10.2 | (24%) | Mine operating earnings ($ millions) | 20.6 | 21.9 | (6%) |
| 22.9 | 18.9 | 21% | Mine operating cash flow before taxes ($ millions)(2) | 45.0 | 39.5 | 14% |
| 14.4 | 8.1 | 78% | Operating cash flow before working capital changes(2) | 22.7 | 18.3 | 24% |
| 1.4 | (2.3) | 162% | EBITDA ($ millions)(2) | (16.7) | 11.3 | (248%) |
| 10.8 | 11.9 | (10%) | Adjusted EBITDA ($ millions)(2) | 25.9 | 28.1 | (8%) |
| (15.3) | 64.5 | (124%) | Working capital ($ millions) (2) | (15.3) | 64.5 | (124%) |
| Shareholders | ||||||
| (0.07) | (0.06) | (17%) | Earnings (loss) per share - basic ($) | (0.20) | (0.06) | (233%) |
| (0.03) | (0.00) | (100%) | Adjusted earnings (loss) per share - basic ($)(2) | (0.03) | (0.00) | (100%) |
| 0.05 | 0.03 | 67% | Operating cash flow before working capital changes per share(2) | 0.08 | 0.08 | 0% |
| 283,534,276 | 242,889,679 | 17% | Weighted average shares outstanding | 272,987,662 | 235,201,630 | 16% |
(1) Silver equivalents are calculated using an 80:1 (Ag:Au) ratio, 60:1 (Ag:Pb) ratio, 85:1 (Ag:Zn) ratio and 300:1 (Ag:Cu) ratio.
(2) Non-IFRS measure. For a description of how these measures are calculated and a reconciliation of these measures to the most directly comparable measures specified, defined or determined under IFRS and presented in the Company's financial statements, refer to "Non-IFRS Measures".
The above highlights are key measures used by management, however they should not be the sole measures used in determining the performance of the Company's operations.
REVIEW OF OPERATING RESULTS
Consolidated Production Results from Operations for the Three Months and Six Months Ended June 30, 2025 and 2024
|
Three Months Ended June 30 |
CONSOLIDATED |
Six Months Ended June 30 |
||||
|
2025 |
2024 |
% Change |
|
2025 |
2024 |
% Change |
|
303,828 |
218,989 |
39% |
Ore tonnes processed |
513,335 |
440,783 |
16% |
|
1,483,736 |
1,312,572 |
13% |
Total silver ounces produced |
2,689,529 |
2,772,578 |
(3%) |
|
7,755 |
10,549 |
(26%) |
Total gold ounces produced |
16,093 |
20,682 |
(22%) |
|
3,503 |
- |
- |
Total lead tonnes produced |
3,503 |
- |
- |
|
2,316 |
- |
- |
Total zinc tonnes produced |
2,316 |
- |
- |
|
58 |
- |
- |
Total copper tonnes produced |
58 |
- |
- |
|
2,528,562 |
2,156,453 |
17% |
Silver equivalent ounces produced(1) |
4,401,401 |
4,427,130 |
(1%) |
|
15.35 |
13.43 |
14% |
Cash costs per silver ounce(2) |
15.59 |
13.30 |
17% |
|
25.25 |
20.48 |
23% |
Total production costs per ounce(2) |
24.79 |
19.65 |
26% |
|
25.16 |
23.13 |
9% |
All in sustaining costs per ounce (2) |
24.85 |
22.24 |
12% |
|
142.00 |
140.36 |
1% |
Direct operating costs per tonne(2) |
142.30 |
137.65 |
3% |
|
201.24 |
192.68 |
4% |
Direct costs per tonne(2) |
203.70 |
187.19 |
9% |
(1) Silver equivalents are calculated using an 80:1 (Ag:Au) ratio, 60:1 (Ag:Pb) ratio, 85:1 (Ag:Zn) ratio and 300:1 (Ag:Cu) ratio (or $30/oz silver, $2,400/oz gold, $1,800/tonne lead, $2,550/tonne zinc and $9,000/tonne copper)
(2) Non-IFRS measure. For a description of how these measures are calculated and a reconciliation of these measures to the most directly comparable measures specified, defined or determined under IFRS and presented in the Company's financial statements, refer to "Non-IFRS Measures".
(1) Silver equivalents are calculated using an 80:1 (Ag:Au) ratio, 60:1 (Ag:Pb) ratio, 85:1 (Ag:Zn) ratio and 300:1 (Ag:Cu) ratio
Consolidated Production
Three months ended June 30, 2025 (compared to the three months ended June 30, 2024)
Consolidated silver production during Q2 2025 was 1,483,736 oz, representing a 13% increase compared to 1,312,572 oz in Q2 2024. The increase in silver production was primarily due to the addition of the Kolpa mine, which was acquired on May 1, 2025, and contributed 380,638 oz of silver. Kolpa also added new base metal outputs, including 3,503 tonnes of lead, 2,316 tonnes of zinc, and 58 tonnes of copper, none of which were present in the comparative period. Consolidated plant throughput for the quarter was 303,828 tonnes, up 39% from 218,989 tonnes in Q2 2024. The average silver grade was 172 gpt, down from 208 gpt, and the average gold grade was 0.9 gpt, down from 1.37 gpt. The lower grades are due to differences between planned and actual grades and from accessing different areas in the mine, particularly at Bolañitos, which also experienced lower throughput due to rebuilding a mill motor stator and replacing the primary crusher to the replacement of the main mill grinder. As a result, Bolañitos saw 10% lower silver production and 34% lower gold production.
Gold production totaled 7,755 oz, 26% lower than the same period in 2024. This decline was driven by the 34% drop at Bolañitos as noted above, and a 16% decrease at Guanaceví.
Six months ended June 30, 2025 (compared to the six months ended June 30, 2024)
Consolidated silver production for the six months ended June 30, 2025, was 2,689,529 oz, 3% lower than the same period in 2024. Gold production totaled 16,093 oz, 22% lower than the same period in 2024. Plant throughput was 513,335 tonnes, 16% higher than the first six months of 2024.
The increase in throughput was primarily due to the addition of the Kolpa mine, acquired on May 1, 2025. Despite the higher throughput, consolidated production was lower due to the anticipated decline in average silver and gold grades, 8% and 13% lower respectively, at both Bolañitos and Guanaceví. Consolidated production and grade were in line with guidance and with the mine plan.
Consolidated Operating Costs
Three months ended June 30, 2025 (compared to the three months ended June 30, 2024)
Direct operating costs per tonne in Q2 2025 increased to $142.00, slightly higher than $140.36 in Q2 2024. This metric was impacted by higher costs per tonne at Bolañitos with lower throughput as a result of maintenance for the replacement of the main mill grinder and the addition of Kolpa which has higher direct operating costs per tonne and was offset by lower costs at Guanaceví.
Consolidated cash costs per oz, net of by-product credits, were 14% higher in Q2 2025 at $15.35 per oz, compared with Q2 2024, driven by an increase in costs at Bolañitos and Guanaceví from lower production, and partially offset by the addition of Kolpa which at $11.81 per oz decreases the average cash cost.
All-In-Sustaining Costs (“AISC”) in Q2 2025 was $25.16 per silver oz in Q2 2025, 9% higher compared to $23.13 in Q2 2024, predominantly due to the addition of Kolpa which at $25.66 increased average AISC and a slight increase of AISC at Guanaceví.
Six months ended June 30, 2025 (compared to the six months ended June 30, 2024)
Direct operating costs per tonne in Q2 2025 increased to $142.30, from $137.65 in Q2 2024. This metric is impacted by higher costs per tonne at Kolpa and lower costs per tonne at Bolanitos and Guanaceví similar to the Q2 2025 period.
Consolidated cash costs per ounce, net of by-product credits, were 17% higher in Q2 2025 at $15.59 per oz, compared with Q2 2024, driven by an increase in costs at Bolañitos and Guanaceví, predominantly due to lower oz produced, partially offset by the addition of Kolpa which at $11.81 per oz decreases the average cash costs.
AISC in the first half of 2025 at $24.85 per ounce, was 12% higher than the first half of 2024, driven by increase in underlying costs as noted above.
GUANACEVÍ OPERATIONS
The Guanaceví operation is currently producing from two underground silver-gold mines along a five kilometre ("km") length of the prolific Santa Cruz vein. Guanaceví provides steady employment to 580 employees and engages over 230 contractors.
In July 2019, the Company acquired a 10 year right to explore and exploit the El Porvenir and El Curso concessions from Ocampo Mining SA de CV ("Ocampo"), a subsidiary of Grupo Frisco. The Company agreed to meet certain minimum production targets from the properties, subject to various terms and conditions, and pay Ocampo a $12 fixed per tonne production payment plus a floating net smelter return royalty based on the silver spot price. The Company pays a 4% royalty on sales below $15.00 per silver oz, 9% above $15.00 per silver oz, 13% above $20.00 per silver oz, and a maximum of 16% above $25 per silver oz.
Production Results for the Three Months and Six Months Ended June 30, 2025 and 2024
|
Three Months Ended June 30 |
GUANACEVÍ |
Six Months Ended June 30 |
||||
|
2025 |
2024 |
% Change |
|
2025 |
2024 |
% Change |
|
96,834 |
112,897 |
(14%) |
Ore tonnes processed |
199,272 |
227,901 |
(13%) |
|
362 |
364 |
(1%) |
Average silver grade (g/t) |
354 |
383 |
(8%) |
|
88.6 |
90.4 |
(2%) |
Silver recovery (%) |
88.6 |
90.1 |
(2%) |
|
997,875 |
1,195,753 |
(17%) |
Total silver ounces produced |
2,013,202 |
2,531,495 |
(20%) |
|
994,882 |
1,192,165 |
(17%) |
Payable silver ounces produced |
2,007,163 |
2,523,900 |
(20%) |
|
1.28 |
1.29 |
(1%) |
Average gold grade (g/t) |
1.29 |
1.27 |
2% |
|
89.7 |
90.4 |
(1%) |
Gold recovery (%) |
91.3 |
89.6 |
2% |
|
3,562 |
4,243 |
(16%) |
Total gold ounces produced |
7,551 |
8,367 |
(10%) |
|
3,551 |
4,230 |
(16%) |
Payable gold ounces produced |
7,529 |
8,341 |
(10%) |
|
1,282,853 |
1,535,161 |
(16%) |
Silver equivalent ounces produced(1) |
2,617,300 |
3,200,854 |
(18%) |
|
19.91 |
17.17 |
16% |
Cash costs per silver ounce(2) |
19.82 |
16.52 |
20% |
|
26.55 |
22.69 |
17% |
Total production costs per ounce(2) |
26.60 |
21.18 |
26% |
|
26.81 |
24.53 |
9% |
All in sustaining costs per ounce (2) |
26.65 |
23.17 |
15% |
|
147.11 |
174.34 |
(16%) |
Direct operating costs per tonne(2) |
166.30 |
172.68 |
(4%) |
|
325.40 |
269.36 |
21% |
Direct costs per tonne(2) |
317.75 |
264.70 |
20% |
(1) Silver equivalents are calculated using an 80:1 (Ag:Au) ratio.
(2) Non-IFRS measure. For a description of how these measures are calculated and a reconciliation of these measures to the most directly comparable measures specified, defined or determined under IFRS and presented in the Company's financial statements, refer to "Non-IFRS Measures".
Guanaceví Production Results
Three months ended June 30, 2025 (compared to the three months ended June 30, 2024)
During the second quarter of 2025, the Guanaceví mine processed 96,834 tonnes of ore, in line with the mine plan, but 14% lower than the same period of 2024. The average silver grade was 362 g/t in Q2 2025, slightly lower than 364 g/t in Q2 2024. Silver recovery was 88.6%, 2% lower than the prior year period. The lower milled tonnes combined with slightly lower silver grades and recovery resulted in 17% lower total silver production of 997,875 ounces, compared to 1,195,753 ounces in Q2 2024.
This decline in throughput in combination with a slight decrease in average gold grade and gold recovery, resulted in 16% lower gold production, with total gold ounces produced at 3,562, down from 4,243 ounces in Q2 2024. Changes in grade and recovery reflect expected variations to differences between planned and actual grades and from accessing different areas in the mine.
Six months ended June 30, 2025 (compared to the six months ended June 30, 2024)
Silver production at the Guanaceví mine during the six months ended June 30, 2025, was 2,013,202 oz, 20% lower than the 2,531,495 oz produced in the same period of 2024, and gold production was 7,551 oz, 10% lower than the 8,367 oz produced in 2024. Silver production was lower due to the plant throughput being 13% lower in line with the mine plan, the lower average realized grade and the slightly lower recoveries during first half of 2025 compared to 2024. Gold production was 10% lower due to the 13% lower throughput, partially offset by slightly higher recoveries and grades in the current period.
Guanaceví Operating Costs
Three months ended June 30, 2025 (compared to the three months ended June 30, 2024)
Direct operating costs per tonne for the three months ended June 30, 2025, were $147.11, 16% lower than $174.34 in same period in 2024 due to the fact that the third-party purchases contributed more to the overall throughput. Including royalty and special mining duty costs, direct costs per tonne rose by 21% to $325.40 in Q2 2025 compared with $269.36 in Q2 2024. This increase in direct cost per tonne is caused by the higher value of third-party material purchases, which have become more expensive on a per tonne basis with the higher metal prices. The purchase of local purchased material contributed $103.14 per tonne during Q2, 2025 compared to $44.67 per tonne in Q2 2024; the volume of purchased material was higher at 20,597 tonnes compared to 19,816 tonnes in the same period in 2024. Total royalty expense increased from $5.6 million in 2024 to $6.2 million , royalty expense being included in cost per tonne and cost per oz metrics. Royalty expense has increased due to the higher realized silver prices, partially offset by lower volume of silver ounces sold in the period.
Cash costs per silver ounce were 16% higher at $19.91 in Q2 2025 compared to $17.17 for the same period in 2024 and total production costs per ounce were $26.55, 17% higher compared to $22.69 in Q2 2024, mostly due to the 17% lower silver production. Total AISC per ounce also rose by 9% to $26.81 compared to $24.53 in Q2 2024, again primarily due to the lower silver production.
Six months ended June 30, 2025 (compared to the six months ended June 30, 2024)
Direct operating costs per tonne for the six months ended June 30, 2025, were 4% lower at $166.30 compared with $172.68 in the same period in 2024. Including royalty and special mining duty costs, direct costs per tonne were 20% higher at $317.75 compared with $264.70 in the same period in 2024. The purchased material contributed $79.56 per tonne during the first half of 2025 compared to $32.62 per tonne in the same period of 2024 due to the higher metal prices and higher volume. During the six months ended June 30, 2025 the Company purchased 39,336 tonnes of purchased material compared to 32,545 tonnes in 2024. Royalty expenses increased from $11.9 million in 2024 to $12.3 million in the first half of 2025, royalty expense being included in cost per tonne and cost per oz metrics, due to the higher realized silver prices, partially offset by lower volume of silver ounces sold in the period.
Cash costs per oz, net of by-product credits, for the six months ended June 30, 2025, were 20% higher at $19.82 compared to $16.52 for the same period in 2024, driven by the higher direct costs per tonne and lower silver production as noted above. AISC per oz were also 15% higher at $26.65 per oz for the six months ended June 30, 2025, due to the same cost drivers.
BOLAÑITOS OPERATIONS
The Bolañitos operation encompasses three underground silver-gold mines and a flotation plant. Bolañitos provides steady employment for over 510 employees and engages 190 contractors.
Production Results for the Three Months and Six Months June 30, 2025 and 2024
|
Three Months Ended June 30 |
BOLAÑITOS |
Six Months Ended June 30 |
||||
|
2025 |
2024 |
% Change |
|
2025 |
2024 |
% Change |
|
88,098 |
106,092 |
(17%) |
Ore tonnes processed |
195,167 |
212,882 |
(8%) |
|
45 |
41 |
10% |
Average silver grade (g/t) |
57 |
42 |
36% |
|
82.4 |
83.4 |
(1%) |
Silver recovery (%) |
82.8 |
84.5 |
(2%) |
|
105,223 |
116,819 |
(10%) |
Total silver ounces produced |
295,689 |
241,083 |
23% |
|
100,183 |
111,296 |
(10%) |
Payable silver ounces produced |
281,260 |
229,869 |
22% |
|
1.68 |
2.06 |
(19%) |
Average gold grade (g/t) |
1.54 |
2.00 |
(23%) |
|
88.3 |
89.6 |
(1%) |
Gold recovery (%) |
88.3 |
89.9 |
(2%) |
|
4,193 |
6,306 |
(34%) |
Total gold ounces produced |
8,542 |
12,315 |
(31%) |
|
4,086 |
6,139 |
(33%) |
Payable gold ounces produced |
8,298 |
11,976 |
(31%) |
|
440,678 |
621,292 |
(29%) |
Silver equivalent ounces produced(1) |
979,070 |
1,226,276 |
(20%) |
|
(17.26) |
(26.67) |
35% |
Cash costs per silver ounce(2) |
(9.75) |
(22.03) |
56% |
|
8.92 |
(3.19) |
380% |
Total production costs per ounce(2) |
10.04 |
2.82 |
255% |
|
7.04 |
8.15 |
(14%) |
All in sustaining costs per ounce (2) |
10.98 |
11.98 |
(8%) |
|
131.06 |
104.20 |
26% |
Direct operating costs per tonne(2) |
115.56 |
100.14 |
15% |
|
137.72 |
111.07 |
24% |
Direct costs per tonne(2) |
121.69 |
104.21 |
17% |
(1) Silver equivalents are calculated using an 80:1 (Ag:Au) ratio.
(2) Non-IFRS measure. For a description of how these measures are calculated and a reconciliation of these measures to the most directly comparable measures specified, defined or determined under IFRS and presented in the Company's financial statements, refer to "Non-IFRS Measures".
Bolañitos Production Results
Three months ended June 30, 2025 (compared to the three months ended June 30, 2024)
During the second quarter of 2025, the Bolañitos mine processed 88,098 tonnes of ore, 17% lower than 106,092 tonnes in the same period of 2024. Lower throughput was offset by 10% higher average silver grade achieved, resulting in 10% lower silver production of 105,223 oz. Bolañitos plant throughput was lower following essential maintenance for the repair of the ball mill motor stator and primary crusher replacement.
Gold grade was 19% lower at 1.68 gpt, and in combination with 17% lower throughput and 1% lower gold recovery, resulted in 34% lower total gold ounces produced at 4,193 compared to the same period in 2024. The fluctuations in silver and gold grades are due to differences between planned and actual grades and from accessing different areas of the mine.
Six months ended June 30, 2025 (compared to the six months ended June 30, 2024)
Silver production at the Bolañitos mine was 295,689 oz during the six months ended June 30, 2025, 23% higher than the same period of 2024. Gold production during the six months was 31% lower at 8,542 oz compared to the same period in 2024.
Plant throughput for the six months ended June 30, 2025, was 8% lower at 195,167 tonnes, for the reasons noted above, with average silver grades 36% higher at 57 gpt silver driving the 23% higher silver production. However average gold grades were 23% lower at 1.54 gpt gold, driving the 31% lower gold production.
Bolañitos Operating Costs
Three months ended June 30, 2025 (compared to the three months ended June 30, 2024)
Cash costs per silver ounce were negative $17.26, compared to negative $26.67 achieved in Q2 2024, predominantly due to the 34% lower gold production which has resulted in a lower by-product credit as well as due to the 10% lower silver production. For the same reason, total production costs per ounce increased to $8.92 per oz from negative $3.19 per oz. AISC per ounce decreased to $7.04 per oz compared to $8.15 per oz due to the lower sustaining capital expenditures, general and administrative expenses and lower mine site exploration costs compared to the same period of 2024.
Six months ended June 30, 2025 (compared to the six months ended June 30, 2024)
Cash costs per silver ounce were negative $9.75, compared to negative $22.03 in Q2 2024, predominantly due to the 31% lower gold production which has resulted in a lower by-product credit, in addition to slightly higher direct operating costs and partially offset by 23% higher silver production in the first half of the year in 2025. For the same reasons, total production costs per ounce increased to $10.04 from $2.82. AISC per ounce decreased to $10.98 compared to $11.98 due to the lower sustaining capital expenditures, general and administrative expenses and lower mine site exploration compared to the same period of 2024.
KOLPA OPERATIONS
Kolpa, was acquired by Endeavour Silver in May 2025 and is located in the Huachocolpa region of Huancavelica, about 490 kilometers southeast of Lima. Peru, a key mining jurisdiction, ranks as the world's third largest silver producer. In 2024, Kolpa processed approximately 685,000 tonnes, yielding 2.0 million ounces of silver, along with 19,820 tonnes lead, 12,554 tonnes zinc and 518 tonnes copper. In silver-equivalent terms, this amounted to a total production of 5.1 million ounces (Moz). The Kolpa mine produces three types of concentrate and receives payment for other contained minerals, including gold and antimony. Kolpa provides steady employment for over 670 employees and engages 1,370 contractors.
The Company has filed a technical report prepared in accordance with NI 43-101 entitled, “Technical Report on the Huachocolpa Uno Mine Property, Huancavelica Province, Peru” (the “ Current Technical Report ”). The Current Technical Report has an effective date of December 31, 2024, and was prepared by Allan Armitage, Ph. D., P. Geo., Ben Eggers, MAIG, P.Geo., Henri Gouin, P.Eng. each of SGS Geological Services, and by Dale Mah, P.Geo., and Donald Gray, SME-RM of Endeavour.
The Current Technical Report contains a historical mineral resource estimate (the “ Historical Estimate ”), originally disclosed in a technical report titled “Huachocolpa Uno Preliminary Economic Assessment” dated May 7, 2024. The Historical Estimate is not considered current and is not being relied upon by the Company. A qualified person has not done sufficient work to classify the Historical Estimate as current mineral resources. The Company is not treating the Historical Estimate as current mineral resources, has not verified this information and is not relying on it.
The Company plans to prepare a current mineral resource estimate for Kolpa in 2026. As such, the Company has not provided production guidance for 2025.
Production Results for the Three Months and Six Months June 30, 2025 and 2024
|
Three Months Ended June 30(3) |
KOLPA |
Six Months Ended June 30(3) |
||||
|
2025 |
2024 |
% Change |
|
2025 |
2024 |
% Change |
|
118,896 |
- |
- |
Ore tonnes processed |
118,896 |
- |
- |
|
111.40 |
- |
- |
Average silver grade (g/t) |
111.40 |
- |
- |
|
89.4 |
- |
- |
Silver recovery (%) |
89.4 |
- |
- |
|
380,638 |
- |
- |
Total silver ounces produced |
380,638 |
- |
- |
|
359,347 |
- |
- |
Payable silver ounces produced |
359,347 |
- |
- |
|
3.13 |
- |
- |
Average Pb grade (%) |
3.13 |
- |
- |
|
94.3 |
- |
- |
Lead recovery (%) |
94.3 |
- |
- |
|
3,503 |
- |
- |
Total lead tonnes produced |
3,503 |
- |
- |
|
3,318 |
- |
- |
Payable lead tonnes produced |
3,318 |
- |
- |
|
2.25 |
- |
- |
Average Zn grade (%) |
2.25 |
- |
- |
|
86.4 |
- |
- |
Zinc recovery (%) |
86.4 |
- |
- |
|
2,316 |
- |
- |
Total zinc tonnes produced |
2,316 |
- |
- |
|
1,957 |
- |
- |
Payable zinc tonnes produced |
1,957 |
- |
- |
|
0.22 |
- |
- |
Average Cu grade (%) |
0.22 |
- |
- |
|
22.1 |
- |
- |
Copper recovery (%) |
22.1 |
- |
- |
|
58 |
- |
- |
Total copper tonnes produced |
58 |
- |
- |
|
55 |
- |
- |
Payable copper tonnes produced |
55 |
- |
- |
|
805,032 |
- |
- |
Silver equivalent ounces produced(1) |
805,032 |
- |
- |
|
11.81 |
- |
- |
Cash costs per silver ounce(2) |
11.81 |
- |
- |
|
26.20 |
- |
- |
Total production costs per ounce(2) |
26.20 |
- |
- |
|
25.66 |
- |
- |
All in sustaining costs per ounce(2) |
25.66 |
- |
- |
|
145.95 |
- |
- |
Direct operating costs per tonne(2) |
145.95 |
- |
- |
|
147.20 |
- |
- |
Direct costs per tonne(2) |
147.20 |
- |
- |
(1) Silver equivalents are calculated using an 60:1 (Ag:Pb) ratio, 85:1 (Ag:Zn) ratio and 300:1 (Ag:Cu) ratio.
(2) Non-IFRS measure. For a description of how these measures are calculated and a reconciliation of these measures to the most directly comparable measures specified, defined or determined under IFRS and presented in the Company's financial statements, refer to "Non-IFRS Measures".
(3) The production results for the three and six months ended June 30, 2025, show only two months of operations, following its acquisition on May 1, 2025. As the asset was not owned or operated by the Company during the comparative periods in 2024, no corresponding data is presented for those periods. As such, year-over-year comparisons are not applicable and should be interpreted accordingly.
Kolpa Production Results
Two months ended June 30, 2025
During the two months ended June 30, 2025, the Kolpa mine processed 118,896 tonnes of ore. The average silver grade was 111.4 g/t with a recovery of 89.4%, resulting in silver production of 380,638 oz. Lead production totaled 3,503 tonnes, based on an average grade of 3.13% and a recovery of 94.3%. Zinc production was 2,316 tonnes, with an average grade of 2.25% and a recovery of 86.4%. Copper production reached 58 tonnes, with an average grade of 0.22% and a recovery of 22.1%. Production was in line with management’s expectations, and historical performance.
Kolpa Operating Costs
Two months ended June 30, 2025
During the two months ended June 30, 2025, Kolpa’s cash costs were $11.81 per silver ounce. Inclusive of depreciation and share based compensation, total production costs totaled $26.20 per ounce. All in sustaining costs included additional $5.0 million of exploration, general and administrative and other costs as well as sustaining capital expenditure totaling $25.66 per oz. Costs were in line with management’s expectations.
TERRONERA PROJECT
The Terronera Project, located 40 km northeast of Puerto Vallarta in the state of Jalisco, Mexico, features a high-grade silver-gold mineral resource in the Terronera vein. The start of wet commissioning announced May 6, 2025, and ramp-up of Terronera continues to progress rapidly. Plant throughput continues to increase as adjustments and modifications are made to increase performance. In June, the throughput averaged 1,232 tonnes per day (tpd), with a peak single-day throughput of 1,987 tpd. For the month of July, a total of 57,080 tonnes were milled at Terronera, an average of 1,841 tonnes per day (tpd). Current milling rates range between 1,900 and 2,000 tpd at the end of July 2025 as adjustments to improve recoveries are ongoing in the grinding and flotation circuits. In the second half of July 2025, silver and gold recoveries have averaged 71% and 67%, respectively, while processing lower grade material.
After successfully processing lower-grade material to address bottlenecks and system issues, the plant has now shifted its focus to refining operations, including processing higher grade ore to achieve planned metal recoveries as while optimization efforts continue. The introduction of higher-grade material is expected to directly enhance recoveries. As higher recoveries are attained, the focus will shift to increasing the milling rate to sustain the designed throughput of 2,000 tpd.
During Q2, underground mine has continued with development and stope preparation. Surface stockpiles totaled approximately 50,255 tonnes grading 232 gpt AgEq on June 30, 2025. As of the end of June, Terronera had produced and sold a cumulative 598 tonnes of concentrate, generating $3.3 million in revenue.
EXPLORATION AND EVALUATION
At Guanaceví, the Company drilled 1,434 meters across 5 holes at a total expense of $0.3 million, focusing on underground diamond drilling in the El Curso mine, specifically targeting the La Cruz area between Milache and El Curso. During Q2 2025, geological mapping was carried out across multiple claims including San Pablo, La Guirnalda, Puerto del Aire, and La Sombra de San Pedro, while infrastructure work progressed with the completion of drill pad access in El Martir, the enlargement of a ramp drill station, and a new drill station proposed for the Alondra-Porvenir 2 area.
At Bolañitos, the Company drilled 2,587 meters across 13 holes at a total expense of $0.2 million, primarily focused on surface diamond drilling in the La Luz North area, targeting the La Luz, La Paz, and San Bernabé veins. Geological mapping and topographical surveying were conducted across multiple zones, including La Paz, Lucita, and the road connecting La Luz North to the Bolañitos processing plant.
At Terronera, the Company drilled 1,213 meters across 10 holes at a total expense of $0.2 million, primarily focused on underground diamond drilling in the La Luz vein area. During Q2 2025, geological mapping and underground sampling advanced across multiple zones including Real, La Cadena, and Quiteria, while drilling returned high-grade intercepts in both the La Luz and El Muro veins. The Company also continued working on infrastructure improvements such as water well rehabilitation and road development.
At Kolpa, the Company drilled a total of 5,006 meters across 28 holes at a total expense of $1.0 million, conducting both surface and underground exploration in the Poderosa Oeste and Bienaventurada areas. The program yielded multiple high-grade intercepts across several veins, confirming the mineral potential of both zones and supporting continued resource development in the district.
At Pitarrilla, the Company continued to advance the project with significant exploration and development activities throughout Q2 2025. A total of 3,662 meters of drilling across nine holes was completed, with total exploration expenditures of $1.6 million. Development work included ramp extension, underground infrastructure improvements, and surface support such as road improvements and electrical substation maintenance. During the quarter, underground drilling in the Danna-Victoria-Palmito area returned high-grade intercepts, while surface work focused on clearing key areas for ramp and plant infrastructure. Environmental and community efforts included monthly hydrogeological monitoring and progress on land access agreements with local stakeholders. Technical study work, which commenced in Q1 2025, included geotechnical site investigation, waste rock pad project, and preparation of regulatory submissions along with advancing tailing facility design, metallurgical test work and hydrogeological investigations.
In Chile, the Company drilled 1,547 meters across four holes at the Anastasia project, targeting the Jimena and Quillay veins, with total expenditures of $0.4 million. Exploration also progressed at the Aida, Genesis, and Catalina projects through environmental permitting, geochemical and spectral studies, and community engagement.
Exploration activities continued at Parral, with expenditures totaling $0.1 million focused on the Veta Colorada Mine and infrastructure maintenance. Work included ongoing pump monitoring and minor underground support. Additionally, the Company recorded $0.7 million in holding costs related to concessions and properties across its broader exploration portfolio.
The Company remains focused on advancing its core projects, with Pitarrilla as a main priority, while maintaining targeted exploration at Guanaceví, Bolañitos, Kolpa and Terronera. Drilling and technical work planned for 2025 are intended to refine resource estimates and guide development strategies across key assets.
CONSOLIDATED FINANCIAL RESULTS
Three months ended June 30, 2025 (compared to the three months ended June 30, 2024)
Revenue of $88.6 million in Q2 2025, net of $1.5 million of smelting and refining costs has substantially increased in comparison to $58.3 million, net of $0.4 million of smelting and refining costs, in Q2 2024. Gross sales of $90.1 million in Q2 2025 represent 53% increase over the gross sales of $58.7 million for the same period in 2024. Gross sales have increased predominantly due to the $24.9 million of revenue from Kolpa and $3.4 million of revenue from Terronera with the remaining $3.1 million increase caused by a 14% increase in realized price of silver and 40% increase in realized price of gold, and partially offset by lower production from Bolañitos and Guanaceví.
During Q2 2025, the Company sold 1,483,311 oz silver and 8,431 oz gold (inclusive of 27,631 oz of silver and 725 oz from pre-production at Terronera), for realized prices of $32.95 and $3,320 per oz, respectively, compared to sales of 1,217,569 oz silver and 9,887 oz gold, for realized prices of $28.94 and $2,374 per oz, respectively, in the same period of 2024. For the three months ended June 30, 2025, the realized prices of silver were within 3% and gold within 1% of the London Fix prices; and silver and gold London Fix prices averaged $33.65 and $3,284 per oz, respectively. Additionally, the company recorded $6.7 million from sales of lead, $5.6 million from sales of Zinc, $0.6 million from sales of copper and $0.4 million from sales of other metals including antimony.
Cost of sales for Q2 2025 was $80.9 million, an increase of 68% over the cost of sales of $48.1 million for Q2 2024. The increase in the cost of sales compared to the prior period was driven by $21.5 million from Kolpa and $9.2 million increase from Terronera. The Company’s mine operating earnings were $7.7 million in Q2 2025 lower than the comparative period (Q2 2024 – $10.2 million) predominantly due to Terronera’s mine operating loss of $5.9 million during the ramp-up.
Exploration, evaluation and development expenses were $4.9 million compared to $4.3 million incurred in the same period of 2024 primarily due to the additional exploration expenditures in Q2 2025 on advancing the Pitarrilla Project. General and administrative expenses of $7.6 million in Q2 2025 were higher compared to the $4.2 million incurred for the same period of 2024 primarily due to the $3.6 million acquisition costs of Minera Kolpa. As a result, the Company incurred operating loss of $4.8 million (Q2 2024 – earnings of $1.7 million).
The Company incurred a foreign exchange gain of $0.7 million in Q2 2025 compared to a loss of $4.0 million in Q2 2024 due to changes in U.S. dollar value of foreign currency monetary balances at the end of the period. As at June 30, 2025, due to the revaluation of the Mexican peso forward contracts and gold forward swap contracts, the Company recognized a loss on derivative contracts of $10.0 million, primarily from the loss on revaluation of the gold forward swap contracts of $12.9 million, partially offset by $2.9 million revaluation gain on Mexican peso forward contracts.
The Company incurred $1.1 million in finance charges primarily from interest on loans related to mobile equipment and accretion of reclamation and rehabilitation liabilities, compared to $0.3 million in the same period in 2024. Additionally, in Q2 2025 the Company recognized $0.7 million in investment and other income primarily as a result of the interest earned on cash and cash equivalents. These losses, partially offset by the interest income, contributed to a loss before taxes for Q2 2025 of $14.6 million (Q2 2024 – loss of $11.3 million).
Income tax expense was $5.9 million in Q2 2025 compared to $2.7 million in Q2 2024. The $5.9 million tax expense is comprised of $9.1 million expense in current income tax (Q2 2024 – expense of $2.9 million) and a recovery of $3.2 million in deferred income tax (Q2 2024 – recovery of $0.2 million). The current income tax expense consists of $1.7 million expense in special mining duty taxes and $7.4 million expense of current income taxes. The deferred income tax recovery of $3.2 million is derived from changes in temporary timing differences between accounting and tax recognition, primarily related to the precious metals prepayment obligation. After these tax charges, the Company realized a net loss for the period of $20.5 million (Q2 2024 – net loss of $14.0 million).
The Company’s adjusted net loss was $9.2 million in Q2 2025, compared to an adjusted loss of $1.0 million in Q2 2024, largely due to the $5.9 million operating loss from Terronera during the ramp-up phase and higher depreciation and tax costs. Adjusted net earnings (loss) is a Non-IFRS measure. For a description of how these measures are calculated and a reconciliation of these measures to the most directly comparable measures specified, defined or determined under IFRS and presented in the Company’s financial statements, refer to “Non-IFRS Measures”.
As at June 30, 2025, the Company’s finished goods inventory included 280,265 oz of silver and 1,526 oz of gold, compared to 250,383 oz silver and 1,168 oz gold at March 31, 2025. The cost allocated to these finished goods was $11.5 million as at June 30, 2025, compared to $8.1 million at March 31, 2025. As at June 30, 2025, the finished goods inventory fair market value was $15.1 million, compared to $12.2 million at March 31, 2025.
Six months ended June 30, 2025 (compared to the six months ended June 30, 2024)
During the first six months of 2025, the Company's mine operating earnings were $20.6 million (2024 - $21.9 million) on revenue of $152.1 million (2024 - $122.0 million) with cost of sales of $131.5 million (2024 - $100.1 million). Higher revenue was offset by higher cost of sales for the period, primarily due to the higher depreciation caused by declining life of mine in existing operations, in combination with $5.9 million operating loss at Terronera during ramp-up and somewhat reduced production at Bolañitos and Guanaceví.
During the six months ended June 30, 2025, the Company had operating loss of $0.8 million (2024 - earnings of $5.0 million) after exploration, evaluation and development costs of $9.5 million (2024 - $8.6 million) and general and administrative expense of $11.9 million (2024 - $8.3 million), whose increase is largely caused by the Kolpa acquisition costs which are ineligible to be capitalized.
The loss before taxes for the period was $42.4 million (2024 -$7.1 million) after finance costs of $1.6 million (2024 - $0.6 million), a foreign exchange loss of $0.3 million (2024 - loss of $2.8 million), investment and other income of $2.1 million (2024 - $0.6 million), and a loss on derivatives of $41.9 million (2024 - $9.3 million). The Company realized a net loss for the period of $53.4 million (2024 - net loss of $15.2 million) after an income tax expense of $11.0 million (2024 - $8.1 million).
Revenue of $152.1 million, net of $2.0 million of smelting and refining costs, increased by 25% compared to $122.0 million, net of $0.9 million of smelting and refining costs, in 2024. Gross sales of $154.1 million in the period represent a 25% increase over $122.9 million for the same period in 2024.
The increase in revenue was driven primarily by the addition of $24.9 million from Kolpa and $3.4 million from Terronera as well as a 27% increase in realized silver prices and a 39% increase in realized gold prices, partially offset with a 9% decrease in silver and 18% gold ounces sold. During the period, the Company sold 2,706,995 oz silver and 16,696 oz gold (inclusive of 27,631 oz of silver and 725 oz from pre-production), for realized prices of $32.52 and $3,110 per oz, respectively, compared to sales of 2,973,663 oz silver and 20,767 oz gold, for realized prices of $25.71 and $2,238 per oz, respectively, in the same period of 2024.
For the six months ended June 30, 2025, the realized prices of silver and gold were within 1% of the London Fix spot prices. Silver and gold London Fix spot prices averaged $32.76 and $3,072 per oz, respectively, during the six months ended June 30, 2025
As at June 30, 2025, the Company’s finished goods inventory included 280,265 oz of silver and 1,526 oz of gold, compared to 280,693 oz of silver and 1,516 oz of gold at December 31, 2024. The cost allocated to these finished goods was $11.5 million at June 30, 2025, up from $7.2 million at December 31, 2024. The fair market value of finished goods inventory was $15.1 million at June 30, 2025, compared to $12.1 million at December 31, 2024.
Cost of sales for the six months ended June 30, 2025, totaled $131.5 million, a 31% increase over $100.1 million in the same period of 2024. This increase was primarily driven by $22.6 million in cost of sales in Kolpa, as well as by $9.2 million in Terronera.
Exploration and evaluation expenses were $9.5 million, consistent with $8.6 million incurred in the same period of 2024. General and administrative expenses of $11.9 million for the six months ended June 30, 2025 were 43% higher compared to the $8.3 million incurred for the same period of 2024, primarily due to the Kolpa business acquisition costs which are ineligible to be capitalized.
The Company incurred a foreign exchange loss of $0.3 million during six months ended June 30, 2025, compared to a foreign exchange loss of $2.8 million in 2024 due to less volatility in Mexican Peso. The Company incurred $1.6 million in finance charges primarily from interest on loans and partially due to interest on leases, accretion of reclamation and rehabilitation liabilities and unwinding of the discounted contingent liability recorded on acquisition of Kolpa. These finance charges are in comparison to $0.6 million for the same period in 2024. The Company recognized $2.1 million in investment and other income compared to $0.6 million in investment and other income in 2024, resulting from recognizing an $1.6 million in interest income (2024 – $1.3 million), unrealized gain on marketable securities of $0.3 million (2024 – loss of $1.3 million) and $0.2 million in other income (2024 – $0.6 million).
Income tax expense was $11.0 million in Q2, 2025 compared to $8.1 million in Q2, 2024. The $11.0 million tax expense is comprised of $14.4 million in current income tax expense (2024 - $8.6 million) and $3.4 million in deferred income tax recovery (2024 - deferred tax expense $0.4 million). The current income tax expense consists of $3.1 million in special mining duty taxes and $11.3 million of income taxes. The deferred income tax recovery of $3.4 million is derived from changes in temporary differences between the timing of deductions for accounting purposes compared to deductions for tax purposes.
KEY ECONOMIC TRENDS
Precious Metal Price Trends
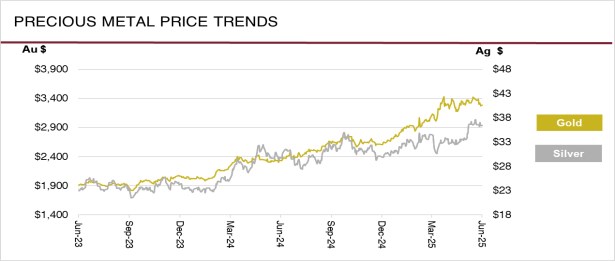
The prices of silver and gold are a critical factor in determining profitability and cash flow from operations. The financial performance of the Company has been, and is expected to continue to be, closely linked to the prices of silver and gold.
During six months ended June 30, 2025, the average price of silver was $32.76 per ounce, with silver trading between $29.41 and $37.16 per oz based on the London Fix silver price. This compares to an average of $26.13 per oz for the six months ended June 30, 2024, with a low of $22.09 and a high of $32.01 per oz. For the six months ended June 30, 2025, the Company realized an average price of $32.52 per silver oz compared with $25.71 per oz for the six months ended June 30, 2024.
During six months ended June 30, 2025, the average price of gold was $3,071 per oz, with gold trading between $2,633 and $3,433 per oz based on the London Fix PM gold price. This compares to an average of $2,209 per oz for the six months ended June 30, 2024, with a low of $1,985 and a high of $2,427 per oz. For the six months ended June 30, 2025, the Company realized an average price of $3,110 per oz compared with $2,238 per oz for the six months ended June 30, 2024.
Several factors drove the largest annual rise in gold price since 2010. Global tensions, including conflicts in Ukraine and the Middle East, expectation of slower economic growth, concerns over U.S. trade policies, and tariffs pushed investors and central banks toward gold to diversify away from the U.S. dollar and fiat currencies. These dynamics propelled gold to record highs, with prices reaching an all-time peak of $3,500 per ounce in April 2025. Silver has historically followed the price movement in gold and we expect this correlation to continue. Beyond the safe haven characteristic of silver, there has been a growing sense of optimism in the silver market, driven by industrial demand and supply constraints. The global push towards electrification, renewable energy, and electric vehicles (EVs), is expected to increase the demand for silver in industrial applications. Silver plays an indispensable role in solar panels, batteries, and other key technologies, positioning it as a strategic metal in the clean energy transition. Over this same period of industrial demand growth, the silver market has faced supply-demand deficits in recent years, with exploration, new discoveries and new production not keeping pace with mine depreciation. A lack of new major projects coming online, is creating a supply-demand imbalance that has supported the rise of silver price since the beginning of 2023.
Currency Fluctuations
The Company's operations in Q2 2025 were located in Mexico and Peru therefore a significant portion of operating costs and capital expenditures are denominated in Mexican pesos and Peruvian soles. The Company's corporate activities are based in Vancouver, Canada with a portion of these expenditures being denominated in Canadian dollars.
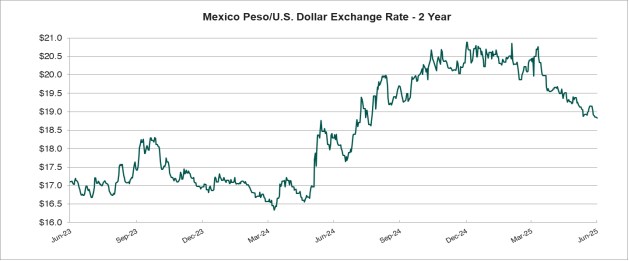
During six months ended June 30, 2025, the Mexican peso weakened against the U.S. dollar. The average foreign exchange rate was $19.95 Mexican pesos per U.S. dollar, with the peso trading within a range of $18.83 to $20.88. This compares to the same period in 2024 where the peso traded at an average of $16.93 Mexican pesos per U.S. dollar, and a range of $16.34 to $17.32 Mexican pesos per U.S. dollar.
Cost Trends
The Company's profitability is subject to industry-wide cost pressures on development and operating costs with respect to labour, energy, consumables and capital expenditures. Underground mining is labour intensive and approximately 33% of the Company's production costs are directly tied to labour. To mitigate the impact of higher labour and consumable costs, the Company focuses on continuous improvement by promoting more efficient use of materials and supplies and by pursuing more advantageous pricing while increasing performance and without compromising operational integrity. During the year ended December 31, 2024, costs continued to be impacted by inflationary and industry costs pressures, offset by downward pressure from a weaker Mexican peso. Higher metal prices in Q2 2025 drove a substantially higher cost of purchased third party material, higher royalties and higher special mining duty, which combined with the decrease in own mined material and lower plant throughput resulted in higher cost per tonne. Additionally, 1% higher special mining duty rate enacted by the Mexico government from January 1, 2025, contributed to higher special mining duty costs in 2025. The increase in cost per tonne was partially offset by incorporating Kolpa operations in period May 1, 2025, to June 30, 2025, as Kolpa has lower cost per tonne in comparison to Guanaceví and Bolañitos.
ANNUAL OUTLOOK
2025 Production and Cost Guidance
In 2025, Guanaceví and Bolañitos silver production is expected to range from 4.5 to 5.2 million oz and gold production is expected to be between 30,500 to 34,000 oz. for total silver equivalent production to between 7.0 and 7.9 million oz using an 80:1 silver:gold ratio. During Q2 2025, the Company produced 2.5 million silver equivalent oz and in first half of 2025 the Company produced 4.4 million silver equivalent oz, in line with guidance.
As noted on Page 10, the Kolpa mine has not defined a current mineral resource as per national instrument 43-101 and therefore has not provided production for 2025.
Production guidance for the Terronera mine will be issued upon the declaration of commercial production, expected in Q3 2025.
|
|
|
Guanaceví |
Bolañitos |
|
Tonnes per day |
Tpd |
1,000 - 1,100 |
1,100 - 1,200 |
|
Silver production |
M oz |
3.9 - 4.4 |
0.6 - 0.8 |
|
Gold production |
k oz |
11.0 - 13.5 |
19.5 - 20.5 |
|
Silver Eq production1 |
M oz |
4.8 - 5.5 |
2.2 - 2.4 |
(1) Silver equivalent production is calculated using an 80:1 silver:gold ratio.
Consolidated cash costs and AISC (excluding Terronera and Kolpa) in 2025 were estimated to be $16.00-$17.00 per oz silver and $25.00-26.00 per oz silver, respectively, net of gold by-product credits. Consolidated cash costs (excluding Terronera and Kolpa) on a per ounce basis were expected to be higher in 2025 compared to 2024, primarily due to lower silver production from these mines as they enter their final years of production, and a lower estimated gold price. AISC were expected to be slightly higher in 2025 than realized in 2024 as higher levels of sustaining capital will be required with costs being borne by lower silver production.
| Cash costs, net of by-product credits1 | $/oz | $16.00 - $17.00 |
| AISC, net of by-product credits1 | $/oz | $25.00 - $26.00 |
| Sustaining capital1 budget | $M | $33.6 |
| Exploration & Corporate capital budget | $M | $2.6 |
(1) Non-IFRS measure. For a description of how these measures are calculated and a reconciliation of these measures to the most directly comparable measures specified, defined or determined under IFRS and presented in the Company's financial statements, refer to "Non-IFRS Measures".
Operating mines
At Guanaceví, 2025 plant throughput is estimated to range from 1,000 tonnes per day (tpd) to 1,100 tpd and average 1,060 tpd with material mined mainly from the Porvenir Cuatro extension on the El Curso concessions. The El Curso concessions were leased from a third party with no upfront costs, but with significant royalty payments on production. Mine grades in 2025 were expected to be slightly lower and recoveries are expected to be similar to 2024. Cash costs per ounce, AISC per ounce and direct costs on a per tonne basis are expected to be slightly higher in 2025 compared to 2024 due to the lower metal production and lower gold by-product credits from the lower gold price estimate.
In 2025, plant throughput at Bolañitos was expected to range from 1,100 tpd to 1,200 tpd and average 1,170 tpd, sourcing material from the Plateros-La Luz, Lucero-Karina and Bolañitos-San Miguel vein systems. Mine grades were expected to be higher for silver and lower for gold and recoveries are expected to be similar to 2024. Cash costs per oz, AISC and direct costs on a per tonne basis are expected to be higher in 2025 compared to 2024. Ounce metrics were expected to be higher due to lower gold by-product credits driven by the lower gold price estimate, and higher costs on a per tonne basis. Direct costs per tonne were expected to be higher due to the lower throughput.
At Kolpa during the two months ended June 30, 2025, plant throughput was 1,949 tpd while designated mill capacity is 2,000 tpd. Throughput and costs during this two month period ended June 30, 2025 were in line with management's expectations. The Company is currently evaluating an expansion of the mill capacity to 2,500 tpd.
Consolidated Operating Costs
Direct operating costs per tonne were estimated to be $130-$140. Direct costs, which include royalties and special mining duties, and take account of the impact of the higher Mexico mining taxes enacted at the start of 2025, are estimated to be in the range of $175-$185 per tonne.
Management made the following assumptions in calculating its 2025 cost forecasts: $27.50 per oz silver price, $2,200 per oz gold price, 18:1 Mexican peso per US dollar exchange rate, and a 4% Mexican annual inflation rate.
2025 Planned Capital Expenditures
|
|
Sustaining Mine Development |
Sustaining Other |
Total Sustaining |
Growth Capital |
Total |
|
Guanaceví |
$12.7 million |
$6.6 million |
$19.3 million |
- |
$19.3 million |
|
Bolañitos |
$9.7 million |
$4.6 million |
$14.3 million |
- |
$14.3 million |
|
Kolpa |
$3.0 million |
$15.0 million |
$18.0 million |
$12.5 million |
$30.5 million |
|
Pitarrilla |
- |
- |
- |
$9.1 million |
$9.1 million |
|
Exploration |
- |
- |
- |
$2.4 million |
$2.4 million |
|
Corporate |
- |
- |
- |
$0.2 million |
$0.2 million |
Terronera Capital Expenditures
As at June 30, 2025, the Company had invested $338 million for the construction cost of the Terronera Project. The final costs of building the mine in July are being accumulated and will be announced in due course.
Sustaining Capital Investments
In 2025, Endeavour planned to invest $33.6 million in sustaining capital at its two operating mines and an additional $18.0 million in Minera Kolpa, inclusive of amounts already spent in the first half of 2025. At assumed metal prices, the sustaining capital investments are expected to be paid out of operating cash flow. For the first half of 2025, sustaining capital totaled $14.2 million.
At Guanaceví, $19.3 million was planned to be invested in capital projects, the largest of which being 5.3 kilometers of mine development at El Curso and Milache for an estimated $12.7 million. An additional $2.8 million was to be invested in mine infrastructure and equipment. A further $1.8 million was to be invested in the plant and tailings storage facility, including further work on the tailing facility expansion. The remaining $2.0 million was to be spent on various surface infrastructure or equipment. For the first half of 2025, capital projects totaled $8.2 million.
At Bolañitos, $14.3 million will be invested in capital projects, including $9.7 million for 6.7 kilometers of mine development to access resources in the Plateros-La Luz, Lucero-Karina, and Bolañitos-San Miguel areas. An additional $4.6 million will go to upgrade the mining fleet, plant improvements and to support site infrastructure. For the first half of 2025, capital projects totaled $3.6 million.
At Kolpa, for the period May to December 2025, sustaining capital is estimated to be $18.0 million which includes $7.6 million expansion of the tailings dam, $2.7 million allocated for mine infrastructure, $2.0 million for stockpile storage improvements, $1.3 million for ventilation systems and $4.4 million on various projects. For the period May 1, 2025 to June 30, 2025, capital projects at Kolpa totaled $6.5 million.
The Company also planned to spend $2.6 million to maintain exploration concessions, acquire mobile exploration equipment and cover corporate infrastructure. For the period from May 1, 2025 to June 30, 2025, this sustaining capital expenditure totaled $0.5 million.
LIQUIDITY AND CAPITAL RESOURCES
The Company has historically funded its acquisition, exploration and development activities through equity financings, debt facilities and convertible debentures. In recent years, the Company has financed most of its acquisition, exploration, development and operating activities from production cash flows, treasury, equity offerings and debt. The Company may choose to undertake equity, debt, convertible debt or other financings, on an as-needed basis, in order to facilitate its growth.
Management of the Company believes that operating cash flow and existing working capital will be sufficient to cover capital requirements and meet its short-term obligations for at least the next twelve months. The Company continues to assess financing alternatives, including equity or debt or a combination of both, to fund future growth, including the development of the Terronera Project.
| Expressed in thousands of US dollars | As at June 30, 2025 | As at December 31, 2024 | |
| Current assets | $197,877 | $157,647 | |
| Current liabilities | 213,226 | 78,866 | |
| Working capital | ($15,349) | $78,781 | |
As at June 30, 2025, the Company had working capital deficit of $15.3 million (December 31, 2024 – working capital surplus $78.8 million). The $94.1 million decrease in working capital was primarily due to the $97.5 million fixed asset additions at Terronera using working capital (both cash and current loans) for the completion of construction, commissioning and ramp up. Management expects the working capital deficit to improve and become a working capital surplus over the next twelve months, through settlement of the portion of the gold forward swaps and due to Terronera becoming a cash generating entity in the upcoming periods. As of June 30, working capital was positively impacted by the reclassification of $31.3 million of Terronera’s IVA receivables (presented as non-current as of December 31, 2024) from non-current to current upon becoming eligible and being submitted for reimbursement during Q2 2025, as well as $17.8 million additional IVA receivables recognized during the six months period ended June 30, 2025. The working capital balance was negatively affected by the reclassification to current of derivatives liability being settled in the twelve months after the balance sheet date.
Three months ended June 30, 2025 (compared to the three months ended June 30, 2024)
Cash flow provided by operating activities
During Q2 2025, operating activities generated cash flow of $21.6 million compared to $12.4 million in Q2 2024. Cash flow provided by operations before working capital changes was $14.4 million in Q2 2025, compared to $8.1 million in Q2 2024. While Q2 2025 operating losses were $6.5 million higher than Q2 2024, operating cash flow before working capital adjustments was higher, mainly due to a precious metals prepayment of $13.5 million at Guanaceví in Q2 2025, a new prepayment facility set up during the period.
Cash flow used by investing activities
During Q2 2025, investing activities used net cash of $125.5 million compared to $54.9 million in Q2 2024. Payments for mineral properties, plant and equipment totaled $54.2 million in Q2 2025 compared to $55.8 million in Q2 2024 as construction costs at Terronera were more intense during the comparative period. Q2 2025 included $72.8 million in net cash used for the Kolpa Acquisition, which was not present in the comparative period.
Of the $54.2 million invested in mineral properties, plants and equipment, $41.1 million was at Terronera, primarily on equipment and infrastructure. Additionally, $6.5 million was invested at Kolpa, $6.0 million of which was part of capacity expansion and another $0.5 million related to equipment and infrastructure. At Guanaceví the Company invested $4.8 million, $4.2 million was spent on mine development, at Bolañitos $1.7 million, $1.1 million of which was related to mine development, and the remaining capital expenditures were related to Pitarrilla, exploration sites or administrative investments.
Cash flow provided by financing activities
Financing activities for the three months period ended June 30, 2025, provided $91.2 million, compared to $75.6 million in the same period of 2024. The largest changes were due to: $35 million from the copper stream prepayment executed in Q2 2025; $31.9 million higher public equity offerings; offset by $45 million lower drawdowns on loans payable. Furthermore, during Q2 2025, the Company paid $5.8 million in debt service costs, compared to $1.2 million in Q2 2024.
Six months ended June 30, 2025 (compared to the six months ended June 30, 2024)
Cash flow provided by operating activities
During the six months ended June 30, 2025, operating activities generated cash flow of $24.9 million compared to $17.0 million in the same period of 2024. Cash flow provided by operations before working capital was $22.7 million in 2025, compared to $18.3 million in 2024. While 2025 operating loss was $5.8 million lower than 2024 operating earnings, operating cash flow before working capital adjustments was higher, mainly due to a precious metals prepayment of $13.5 million at Guanaceví in Q2 2025, a new prepayment facility set up during the period.
Cash flow used by investing activities
During the six months ended June 30, 2025, investing activities used net cash of $166.1 million compared to $96.7 million in 2024. Payments for mineral properties, plant and equipment totaled $95.7 million in 2025 compared to $100.7 million in 2024, primarily due to lower spending on Terronera during 2025 compared to 2024 as construction was more intense. The first six months of 2025 included $72.8 million in net cash used for the Kolpa acquisition, which was not present in the comparative period.
Of the $95.7 million invested in mineral properties, plants and equipment, $76.0 million was at Terronera, primarily on equipment and infrastructure. Additionally, $6.5 million was invested at Kolpa, $6.0 million of which was part of capacity expansion and another $0.5 million related to equipment and infrastructure. At Guanaceví the Company invested $8.2 million of which $6.7 million was spent on mine development. At Bolañitos the Company invested $3.6 million, $2.5 million of which was related to mine development. The remaining capital expenditures were related to Pitarrilla, exploration sites or administrative investments.
Cash flow provided by financing activities
Financing activities for the six months ended June 30, 2025, provided $86.7 million, compared to $112.4 million in the same period of 2024. The biggest changes were those noted above regarding the movements in the second quarter; in addition to these during the first six months of 2025, the Company paid $10.3 million in debt service costs, compared to $2.6 million in the same period in 2024, as the balance of the debt was greater during the current period.
Equity financings
On April 8, 2025, the Company completed a bought deal equity offering for the issuance of a total of 11,600,000 common shares at a price of $3.88 per share, which raised net cash proceeds of $45 million. On April 16, 2025 the underwriters exercised their over-allotment option with additional issuance of 1,285,000 common shares at a price of $3.88 per share. The Company has received gross proceeds of $50.0 million, less commission of $2.8 million and recognized $0.6 million of other transaction costs related to the financing as share issuance costs, which have been presented net within share capital. The Company used the net proceeds of the offering to fund the purchase price of Minera Kolpa.
| Use of proceeds (thousands) | |||
| Net proceeds received | $ | 46,562 | |
| Purchase Minera Kolpa | 46,562 | ||
| Allocated to working capital | $ | - |
On November 27, 2024 the Company completed a bought deal equity offering for the issuance of a total of 15,825,000 common shares at a price of $4.60 per share, which raised gross proceeds of $72,795,000 (the "November 2024 Financing").
For the November 2024 Financing, the net proceeds as at June 30, 2025 have been used as follows:
| Use of proceeds (thousands) | |||
| Net proceeds received | $ | 68,582 | |
| Advancing Pitarrilla project | 5,130 | ||
| Allocated to working capital | $ | 63,452 |
Debt financings
On October 6, 2023, the Company, through its wholly-owned subsidiary Terronera Precious Metals, S.A. de C.V. entered into a credit agreement with Société Generale and ING Capital LLC (together with ING Bank N.V.) for a senior secured debt facility for up to $120 million (the "Debt Facility"). On June 23, 2025, the credit agreement was amended and restated to include a third tranche of $15 million bringing the total debt facility to $135 million. The third tranche is due in repayments over the 12 months following the quarter end.
The Debt Facility includes certain restrictive covenants with respect to the use of the loan proceeds, including restrictions on transferring funds out of the Terronera entity. These restrictions are not expected to have any impact on the Company's ability to meet its obligations.
Contingencies
The Company has a number of disputes with the Mexican tax authorities as disclosed in the MD&A for the year ended December 31, 2024, which are currently being addressed in the Mexican court process, and judgment is employed to assess the likelihood of outcomes in favour of the Company and recognition of any liabilities. The Company is also required to use judgement to determine certain tax treatments in calculating income tax expense and IVA recoverable. A number of these judgements are subject to various uncertainties. From time to time, Mexican authorities may apply, re-interpret legislation or disregard precedents and it is possible that these uncertainties may be resolved unfavorably for the Company.
Capital Requirements
As of June 30, 2025, the Company held $52.2 million in cash and $15.3 million in working capital deficit. The Company may be required to raise additional funds through future debt or equity financings in order to carry out other business plans.
Contractual Obligations
The Company had the following undiscounted contractual obligations at June 30, 2025:
| Payments due by period (in thousands of US dollars) | ||||||||||||||||
| Contractual Obligations | Total | Less than 1 year | 1 - 3 years | 3 - 5 years | More than 5 years | |||||||||||
| Capital asset purchases | $ | 3,447 | $ | 3,447 | $ | - | $ | - | $ | - | ||||||
| Loans payable | 206,343 | 58,975 | 85,801 | 61,567 | - | |||||||||||
| Lease liabilities | 2,801 | 1,650 | 1,039 | 112 | - | |||||||||||
| Other contracts | 379 | 134 | 235 | 10 | - | |||||||||||
| Reclamation obligations | 28,323 | - | 3,247 | 8,858 | 16,218 | |||||||||||
| Total | $ | 241,293 | $ | 64,206 | $ | 90,322 | $ | 70,547 | $ | 16,218 | ||||||
FINANCIAL INSTRUMENTS AND FAIR VALUE MEASUREMENTS
As at June 30, 2025, the carrying and fair values of the Company's financial instruments by category were as follows:
| As at June 30, 2025 | As at December 31, 2024 | |||||||||||
| Expressed in thousands of US dollars | Carrying value | Estimated Fair value |
Carrying value | Estimated Fair value |
||||||||
| Financial assets: | ||||||||||||
| Cash and cash equivalents | $ | 52,200 | $ | 52,200 | $ | 106,434 | $ | 106,434 | ||||
| Other investments | 595 | 595 | 1,070 | 1,070 | ||||||||
| Trade and other receivables | 16,482 | 16,482 | 3,665 | 3,665 | ||||||||
| Derivative assets | 3,652 | 3,652 | - | - | ||||||||
| Loan receivable | 2,506 | 2,506 | 2,556 | 2,556 | ||||||||
| Total financial assets | $ | 75,435 | $ | 75,435 | $ | 113,725 | $ | 113,725 | ||||
| Financial liabilities: | ||||||||||||
| Accounts payable, accrued liabilities and other current liabilities | $ | 103,411 | $ | 103,411 | $ | 53,943 | $ | 53,943 | ||||
| Derivative liabilities | 71,271 | 71,271 | 26,859 | 26,859 | ||||||||
| Copper stream liability | 35,815 | 35,815 | - | - | ||||||||
| Contingent payment | 8,119 | 8,119 | - | - | ||||||||
| Loans payable | 161,606 | 161,606 | 120,236 | 120,236 | ||||||||
| Total financial liabilities | $ | 380,222 | $ | 380,222 | $ | 201,038 | $ | 201,038 | ||||
Fair value hierarchy
Fair value is the price that would be received to sell an asset or paid to transfer a liability in an orderly transaction between market participants at the measurement date. The fair value hierarchy establishes three levels to classify the inputs to valuation techniques used to measure fair value. Level 1 inputs are quoted prices (unadjusted) in active markets for identical assets or liabilities. Level 2 inputs are quoted prices in markets that are not active, quoted prices for similar assets or liabilities in active markets, inputs other than quoted prices that are observable for the asset or liability (for example, interest rate and yield curves observable at commonly quoted intervals, forward pricing curves used to value currency and commodity contracts and volatility measurements used to value option contracts), or inputs that are derived principally from or corroborated by observable market data or other means. Level 3 inputs are unobservable (supported by no or little market activity). The fair value hierarchy gives the highest priority to Level 1 inputs and the lowest priority to Level 3 inputs.
Assets and liabilities as at June 30, 2025 that measured at fair value on a recurring basis include:
| As at June 30, 2025 | ||||||||||||
| Expressed in thousands of US dollars | Total | Level 1 | Level 2 | Level 3 | ||||||||
| Financial Assets: | ||||||||||||
| Other investments | $ | 595 | $ | 532 | $ | - | $ | 63 | ||||
| Trade receivables | 12,329 | - | 12,329 | - | ||||||||
| Derivative assets | 3,652 | - | 3,652 | - | ||||||||
| Total financial assets | $ | 16,576 | $ | 532 | $ | 15,981 | $ | 63 | ||||
| Financial Liabilities: | ||||||||||||
| Cash-settled deferred share units | $ | 5,049 | $ | 5,049 | $ | - | $ | - | ||||
| Copper stream liability | 35,815 | - | - | 35,815 | ||||||||
| Contingent payment | 8,119 | - | - | 8,119 | ||||||||
| Derivative liabilities | 71,271 | - | 71,271 | - | ||||||||
| Total financial liabilities | $ | 120,254 | $ | 5,049 | $ | 71,271 | $ | 43,934 | ||||
Other investments
The Company holds marketable securities classified as Level 1 and Level 3 in the fair value hierarchy. The fair values of Level 1 investments are determined based on a market approach reflecting the closing price of each particular security at the reporting date. The closing price is a quoted market price obtained from the stock exchange that is the principal active market for the particular security, being the market with the greatest volume and level of activity for the assets. For Level 3 investments, which consist of share purchase warrants where inputs are not observable, they have an estimated value determined by using an option pricing model. Changes in fair value on available for sale marketable securities are recognized in earnings or loss.
Trade receivables
The trade receivables consist of receivables from provisional silver and gold sales from the Bolañitos mine. The fair value of receivables arising from concentrate sales contracts that contain provisional pricing mechanisms is determined using the appropriate quoted closing price on the measurement date from the exchange that is the principal active market for the particular metal. As such, these receivables, which meet the definition of an embedded derivative, are classified within Level 2 of the fair value hierarchy.
Derivative assets
The Company also hedged a portion of the estimated remaining capital and operating expenditures incurred in Mexican Pesos. The fair value of the foreign exchange forward contracts is determined using mark-to-market values provided by counterparties. These valuations are based on observable market inputs, including spot rate, forward foreign exchange rates and interest rate curves. Accordingly, the instruments are classified as Level 2 in the fair value hierarchy.
Deferred share units (“DSUs”)
The Company has a cash settled DSU plan whereby DSUs may be granted to independent directors of the Company in lieu of compensation in cash or stock options. The DSUs vest immediately and are redeemable for cash based on the market value of the units at the time of a director's retirement. The DSUs are classified as Level 1 in the fair value hierarchy. The liability is determined based on a market approach reflecting the closing price of the Company's common shares at the reporting date. Changes in fair value are recognized in general and administrative expenses.
Copper stream liability
The Company entered into a copper stream agreement on copper produced from Kolpa. Under the copper stream agreement, Company received a $35 million prepayment used to finance the cash consideration of Kolpa acquisition on May 1, 2025. The copper stream liability is classified as level 3 in the fair value hierarchy and measured at fair value through profit or loss. The stream is valued using a discounted cash flow model based on current market and operational assumptions. The key unobservable inputs used in the valuation include a discount rate of 8.6%, reflecting credit risk and asset-specific risk, a copper price forecasts, based on observable forward price curves over the expected production term. The valuation involves significant management’s judgment related to the life-of-mine production schedule, including expected output timing and volumes.
Derivative liabilities
Company holds certain gold forward swap contracts to hedge against the fluctuation in gold prices. The fair value of the gold forward swap contracts is determined using mark-to-market values provided by counterparties. These valuations are based on observable market inputs, including gold spot price, forward price curve and interest rate curves. Accordingly, the instruments are classified as Level 2 in the fair value hierarchy.
Financial Instrument Risk Exposure and Risk Management
The Company is exposed to a variety of financial instrument related risks. The board of directors approves and monitors the risk management process. The types of risk exposure and the way in which such exposure is managed is provided as follows:
Credit Risk
The Company is exposed to credit risk on its bank accounts, accounts receivable and loan receivable. Credit risk exposure on bank accounts is limited through maintaining the Company's balances with high-credit quality financial institutions, maintaining investment policies, assessing institutional exposure and continual discussion with external advisors. Value-added tax receivables are generated on the purchase of supplies and services to produce silver, which are refundable from the Mexican government. Trade receivables are generated on the sale of concentrate inventory to reputable metal traders. The loan receivable is related to the remaining proceeds for the sale of the El Compas mine to Grupo ROSGO. There has been no indication of a change in the creditworthiness of the counterparty to the loan receivable since the initial recognition.
Liquidity Risk
Liquidity risk is the risk that the Company will not be able to meet its financial obligations as they come due. The Company manages its liquidity risk by continually monitoring forecasted and actual cash flows. The Company has in place a planning and budgeting process to help determine the funds required to support its normal operating requirement and development plans. The Company aims to maintain sufficient liquidity to meet its short-term business requirements, taking into account its anticipated cash flows from operations, its holdings of cash and cash equivalents, and its committed and anticipated liabilities.
The Company's Mexican subsidiaries pay IVA on the purchase and sale of goods and services. The net amount paid is recoverable but is subject to review and assessment by the tax authorities. The Company regularly files the required IVA returns and all supporting documentation with the tax authorities, however a smaller portion of IVA refund requests are from time to time denied based on the alleged lack of compliance of certain formal requirements and information returns by the Company's third-party suppliers. The Company takes necessary legal action on the delayed refunds as well as any denied refunds. The Company is in regular contact with the tax authorities in respect of its IVA filings and believes that the full amount of its IVA receivables will ultimately be received; however, the timing of recovery of these amounts and the nature and extent of any adjustments to the Company's IVA receivables remains uncertain.
Market Risk
The significant market risk exposures to which the Company is exposed are foreign currency risk, interest rate risk, and commodity price risk.
Foreign Currency Risk - The Company's operations in Mexico, Peru and Canada make it subject to foreign currency fluctuations. Certain of the Company's operating expenses are incurred in Mexican pesos, Peruvian sol and Canadian dollars; therefore, the fluctuation of the U.S. dollar in relation to these currencies will consequently have an impact upon the profitability of the Company and may also affect the value of the Company's assets and the amount of shareholders' equity. The Company also hedged a portion of the estimated remaining capital and operating expenditures incurred in Mexican Pesos. As of June 30, 2025, the Company had $49.8 million Mexican Peso forward contracts with weighted average rate 20.70 pesos for US dollar settling between July 2025 and December 2026. Interest rate contracts. On July 10th, 2025, the Company entered into additional Mexican Peso forward contracts with exposure of $12 million and weighted average rate 18.57 pesos for US dollar settling between Dec 2025 and June 2026.
As at June 30, 2025, the Company has revalued the forward contracts to their respective fair values and as a result recorded a gain of $6.0 million on the Mexican Peso contracts in the condensed consolidated interim statement of earnings and loss for the six months period ended June 30, 2025.
Interest Rate Risk – The interest rate risk is the risk that the fair value or the future cash flows of a financial instrument will fluctuate because of changes in market interest rates. The interest rate on the Debt Facility as well as the loans payable held by Kolpa are variable, and based on the exposure as of June 30, 2025, a 1% change in interest rate would result in an increase or decrease of interest costs of $1.6 million per year. The Company holds a fixed for variable interest rate swap in the amount of $8.3 million, maturing in April 2026. As of June 30, 2025, all of the Company’s outstanding equipment financing obligations bear interest at fixed rates and are therefore not exposed to changes in future cash flows attributable to changes in market interest rates.
The Company is exposed to interest rate risk on its cash and cash equivalents. The cash and cash equivalent interest earned is based on bank account interest rates which may fluctuate. Based on the exposure as of June 30, 2025, a 1% change in the interest rates would result in an increase or decrease of approximately $0.5 million in interest earned by the Company. The Company has not entered into any derivative contracts to manage the interest rate risk.
Commodity Price Risk - The Company is subject to commodity price risk related to silver, gold, lead, zinc, and copper. Fluctuations in the market prices of these metals can have a direct and immediate impact on the valuation of related financial instruments, non-financial assets, and overall net earnings. Gold and silver prices have historically fluctuated significantly and are affected by numerous factors outside of the Company's control, including, but not limited to, industrial and retail demand, central bank lending, forward sales by producers and speculators, levels of worldwide production, short-term changes in supply and demand because of speculative hedging activities and certain other factors.
At June 30, 2025, there are 13,666 oz of silver and 657 oz of gold as well as trivial amounts of base metals, which do not have a final settlement price and the estimated revenues have been recognized at current market prices. As at June 30, 2025, with other variables unchanged, a 10% decrease in the market value of silver and gold would result in a reduction of revenue and the associated receivable of $0.3 million.
On May 1, 2025, concurrently with the acquisition of Minera Kolpa shares, Endeavour entered into a ten year $35 million copper stream agreement with Versamet Royalties Corporation to help fund the cash portion of the Kolpa acquisition. Under the terms of the stream:
This agreement includes security over the acquired entity and provides Versamet the right of first refusal on future streaming arrangements.
In connection with the Debt Facility, on March 28, 2024, the Company entered into gold forward swap contracts for a portion of the expected gold sales in the first three years of production, to hedge against the fluctuation in gold prices. The Company amended the forward swap contracts during six months ended June 30, 2025, which will settle from August 2025 to June 2027 with revised forward price of $2,311 per ounce of gold.
In June 2025 in relation to the amendment to the Debt Facility, the Company implemented un-margined zero cost collars for 968,000 ounces of silver with a price range of $31 to $42, settling over the period from September 2025 to June 2026.
OUTSTANDING SHARE DATA
As of August 12, 2025, the Company had the following securities issued, issuable and outstanding:
As at June 30, 2025, the Company's issued share capital was $948 million (December 31, 2024 - $851 million), representing 289,830,993 common shares (December 31, 2024 - 262,323,863), and the Company had options outstanding to purchase 3,412,501 common shares (December 31, 2024 - 3,181,491) with a weighted average exercise price of CAD$4.59 (December 31, 2024 - CAD$4.13).
The Company considers the items included in the consolidated statement of shareholders' equity as capital. The Company's objective when managing capital is to safeguard its ability to continue as a going concern so that it can continue to provide returns for shareholders and benefits for other stakeholders. The Company manages the capital structure and makes adjustments to it in light of changes in economic conditions and the risk characteristics of the underlying assets. In order to maintain or adjust the capital structure, the Company may issue new shares through private placements, prospectus offerings, convertible debentures, asset acquisitions or return capital to shareholders. The Company is not subject to externally imposed capital requirements.
CHANGES IN ACCOUNTING POLICIES AND CRITICAL ACCOUNTING ESTIMATES
Accounting standards adopted during the period:
The material accounting policies applied in the Company's condensed consolidated interim financial statements for the three and six months ended June 30, 2025 are the same as those applied in the Company's annual audited consolidated financial statements as at and for the year ended December 31, 2024.
Critical Accounting Estimates
The preparation of financial statements requires the Company to make estimates that affect the reported amounts of assets and liabilities and disclosure of contingent assets and liabilities at the date of the financial statements and the reported amounts of revenues and expenses during the reporting period. Significant areas requiring the use of management's judgment relate to the determination of mineralized reserves and resources, plant and equipment lives, estimating the fair values of financial instruments and derivatives, impairment of non-current assets, reclamation and rehabilitation provisions, recognition of deferred tax assets, and assumptions used in determining the fair value of share-based compensation.
CONTROLS AND PROCEDURES
Disclosure Controls and Procedures
The Company's officers and management are responsible for establishing and maintaining disclosure controls and procedures for the Company. Disclosure controls and procedures are designed to provide reasonable assurance that material information required to be disclosed by the Company under securities legislation is recorded, processed, summarized and reported within the applicable time periods and to ensure that required information is gathered and communicated to the Company's management, including the Chief Executive Officer (CEO) and Chief Financial Officer (CFO) as is appropriate to permit timely decisions regarding public disclosure. There are inherent limitations to the effectiveness of any system of disclosure controls and procedures. Accordingly, even effective disclosure controls and procedures can only provide reasonable assurance of achieving their control objectives.
Changes in Internal Control over Financial Reporting
Management, including the CEO and CFO, has evaluated the Company's internal controls over financial reporting to determine whether any changes occurred during the period that have materially affected, or are reasonably likely to materially affect, the Company's internal controls over financial reporting.
During the three and six months ended June 30, 2025, there have been no significant changes in internal control over financial reporting that have materially affected, or are reasonably likely to materially affect, the Company's internal control over financial reporting.
QUARTERLY RESULTS AND TRENDS
The following table presents selected financial information for each of the most recent eight quarters:
| Table in thousands of U.S. dollars except for share numbers and per share amounts |
2025 | 2024 | 2023 | |||||
| Q2 | Q1 | Q4 | Q3 | Q2 | Q1 | Q4 | Q3 | |
| Gross Sales | $90,138 | $63,934 | $42,746 | $53,939 | $58,708 | $64,218 | $51,005 | $49,926 |
| Smelting and refining costs included in revenue | 1,541 | 436 | 536 | 495 | 448 | 493 | 506 | 494 |
| Total Revenue | 88,597 | 63,498 | 42,210 | 53,444 | 58,260 | 63,725 | 50,499 | 49,432 |
| Direct production costs | 59,249 | 35,173 | 25,404 | 28,705 | 33,703 | 36,705 | 32,817 | 34,020 |
| Royalties | 6,458 | 6,243 | 3,661 | 5,151 | 5,648 | 6,408 | 5,105 | 4,821 |
| Mine operating cash flow before taxes | 22,890 | 22,082 | 13,145 | 19,588 | 18,909 | 20,612 | 12,577 | 10,591 |
| Share-based compensation | 136 | 34 | 55 | 73 | 74 | 79 | 44 | 44 |
| Depreciation | 15,010 | 9,206 | 5,346 | 7,032 | 8,639 | 8,877 | 7,181 | 7,855 |
| Mine operating earnings (loss) | $7,744 | $12,842 | $7,744 | $12,483 | $10,196 | $11,656 | $5,352 | $2,692 |
| Basic earnings (loss) per share | ($0.07) | ($0.13) | $0.00 | ($0.07) | ($0.06) | ($0.01) | $0.01 | ($0.01) |
| Diluted earnings (loss) per share | ($0.07) | ($0.13) | $0.00 | ($0.07) | ($0.06) | ($0.01) | $0.01 | ($0.01) |
| Weighted shares outstanding | 283,534,276 | 262,323,863 | 252,169,924 | 246,000,878 | 242,899,679 | 227,503,581 | 196,018,623 | 194,249,283 |
| Net earnings (loss) | ($20,455) | ($32,907) | $1,025 | ($17,300) | ($14,007) | ($1,194) | $3,049 | ($2,328) |
| Depreciation | 15,116 | 9,561 | 5,706 | 7,352 | 8,933 | 9,135 | 7,458 | 7,771 |
| Finance costs | 846 | 184 | 294 | 357 | 103 | 135 | 164 | 170 |
| Current income tax | 9,094 | 5,279 | (162) | 4,523 | 2,878 | 5,667 | 207 | 2,250 |
| Deferred income tax (recovery) | (3,199) | (214) | (2,507) | (512) | (163) | (233) | (2,544) | 888 |
| EBITDA | $1,402 | ($18,097) | $4,356 | ($5,580) | ($2,256) | $13,510 | $8,334 | $8,751 |
The following table presents selected production and costs information for each of the most recent eight quarters:
| 2025 | 2024 | 2023 | ||||||
| Q2 | Q1 | Q4 | Q3 | Q2 | Q1 | Q4 | Q3 | |
| Processed tonnes | 303,828 | 209,507 | 165,591 | 175,065 | 218,989 | 221,794 | 220,464 | 214,270 |
| Guanaceví | 96,834 | 102,438 | 58,798 | 67,094 | 112,897 | 115,004 | 110,781 | 103,345 |
| Bolañitos | 88,098 | 107,069 | 106,793 | 107,971 | 106,092 | 106,790 | 109,683 | 110,925 |
| Kolpa | 118,896 | - | - | - | - | - | - | - |
| Silver ounces | 1,483,736 | 1,205,793 | 824,529 | 874,717 | 1,312,572 | 1,460,006 | 1,406,423 | 1,148,735 |
| Guanaceví | 997,875 | 1,015,327 | 718,797 | 768,905 | 1,195,753 | 1,335,742 | 1,271,679 | 1,041,211 |
| Bolañitos | 105,223 | 190,466 | 105,732 | 105,812 | 116,819 | 124,263 | 134,744 | 107,524 |
| Kolpa | 380,638 | - | - | - | - | - | - | - |
| Silver equivalent ounces(1) | 2,528,562 | 1,872,833 | 1,550,529 | 1,617,925 | 2,156,453 | 2,270,676 | 2,175,063 | 1,875,855 |
| Guanaceví | 1,282,853 | 1,334,447 | 928,557 | 995,146 | 1,535,161 | 1,665,648 | 1,569,359 | 1,294,091 |
| Bolañitos | 440,678 | 538,386 | 621,972 | 622,779 | 621,292 | 605,028 | 605,704 | 581,764 |
| Kolpa | 805,032 | - | - | - | - | - | - | - |
| Cash costs per oz (2) | $15.35 | $15.89 | $13.68 | $11.35 | $13.43 | $13.19 | $12.54 | $17.94 |
| Guanaceví | $19.91 | $19.73 | $20.25 | $19.59 | $17.17 | $15.94 | $14.95 | $20.47 |
| Bolañitos | ($17.26) | ($5.60) | ($33.11) | ($51.38) | ($26.67) | ($17.69) | ($11.23) | ($7.68) |
| Kolpa | $11.81 | - | - | - | - | - | - | - |
| AISC per oz (2) | $25.16 | $24.48 | $27.33 | $25.82 | $23.13 | $21.44 | $21.48 | $29.64 |
| Guanaceví | $26.81 | $26.50 | $32.40 | $30.83 | $24.53 | $21.96 | $21.50 | $29.06 |
| Bolañitos | $7.04 | $13.16 | ($8.78) | ($12.31) | $8.15 | $15.59 | $21.27 | $35.54 |
| Kolpa | $25.66 | - | - | - | - | - | - | - |
| Direct costs per tonne (2) | $201.24 | $207.27 | $209.49 | $189.85 | $192.68 | $181.77 | $168.71 | $176.37 |
| Guanaceví | $325.40 | $310.52 | $365.23 | $330.55 | $269.36 | $260.13 | $239.76 | $264.10 |
| Bolañitos | $137.72 | $108.49 | $123.73 | $102.42 | $111.07 | $97.39 | $96.94 | $94.63 |
| Kolpa | $147.20 | - | - | - | - | - | - | - |
(1) Silver equivalent production is calculated using an 80:1 (Ag:Au) ratio, 60:1 (Ag:Pb) ratio, 85:1 (Ag:Zn) ratio, and 300:1 (Ag:Cu) ratio.
(2) Cash cost per oz, AISC per oz and direct costs per tonne are non-IFRS measures.
NON-IFRS MEASURES
Non-IFRS and Other Financial Measures and Ratios
We have included certain non-IFRS financial measures and ratios in this MD&A, as discussed below. We believe that these measures, in addition to conventional measures prepared in accordance with IFRS, provide investors an improved ability to evaluate the underlying performance of the Company. The non-IFRS measures and ratios are intended to provide additional information and should not be considered in isolation or as a substitute for measures of performance prepared in accordance with IFRS. These financial measures and ratios do not have any standardized meaning prescribed under IFRS, and therefore may not be comparable to other issuers.
Non-IFRS financial measures are defined in National Instrument 52-112 - Non-GAAP and Other Financial Measures Disclosure ("NI 52-112") as a financial measure disclosed that (a) depicts the historical or expected future financial performance, financial position or cash flow of an entity, (b) with respect to its composition, excludes an amount that is included in, or includes an amount that is excluded from, the composition of the most directly comparable financial measure disclosed in the primary financial statements of the entity, (c) is not disclosed in the financial statements of the entity, and (d) is not a ratio, fraction, percentage or similar representation.
A non-IFRS ratio is defined by 52-112 as a financial measure disclosed that (a) is in the form of a ratio, fraction, percentage or similar representation, (b) has a non-IFRS financial measure as one or more of its components, and (c) is not disclosed in the financial statements.
Working capital is a non-IFRS measure that is a common measure of liquidity but does not have any standardized meaning. The most directly comparable measure prepared in accordance with IFRS is current assets and current liabilities. Working capital is calculated by deducting current liabilities from current assets. Working capital should not be considered in isolation or as a substitute from measures prepared in accordance with IFRS. The measure is intended to assist readers in evaluating our liquidity.
| Expressed in thousands of US dollars | As at June 30, 2025 | As at December 31, 2024 | ||||
| Current assets | $ | 197,877 | $ | 157,647 | ||
| Current liabilities | 213,226 | 78,866 | ||||
| Working capital | ($15,349 | ) | $ | 78,781 |
Adjusted earnings and adjusted earnings per share are non-IFRS measures that supplement information to the Company's consolidated financial statements. The Company believes that, in addition to the conventional measures prepared in accordance with IFRS, the Company and certain investors and analysts use this information to evaluate the Company's underlying core operating performance. The presentation of adjusted earnings and adjusted earnings per share is not meant to be a substitute for net income and net income per share presented in accordance with IFRS, but rather should be evaluated in conjunction with such IFRS measures.
The Company defines the adjusted earnings as net income adjusted to include certain non-cash and unusual items, and items that in the Company's judgement are subject to volatility as a result of factors which are unrelated to the Company's operation in the period. Certain items that become applicable in a period may be adjusted for, with the Company retroactively presenting comparable periods with an adjustment for such items and, conversely, items no longer applicable may be removed from the calculation. During the current period, the Company has included unrealized foreign exchange (gain) loss, (gain) loss on derivatives, changes in the fair value of its investments in marketable securities and change in fair value of cash settled DSUs and made retroactive adjustments to prior periods for the same.
The following table provides a detailed reconciliation of net income as reported in the Company's financial statement to adjusted earnings and adjusted earnings per share.
| Expressed in thousands US dollars | Three Months Ended June 30 | Six Months Ended June 30 | ||||||||||
| 2025 | 2024 | 2025 | 2024 | |||||||||
| Net earnings (loss) for the period per financial statements | ($20,455 | ) | ($14,007 | ) | ($53,362 | ) | ($15,201 | ) | ||||
| Unrealized foreign exchange (Gain) loss | (2,802 | ) | 2,196 | (2,527 | ) | 2,332 | ||||||
| (Gain) loss on derivatives & copper stream valuation | 10,088 | 9,253 | 42,019 | 9,253 | ||||||||
| Acquisition costs | 3,602 | - | 3,602 | - | ||||||||
| Change in fair value of investments | (178 | ) | 425 | (321 | ) | 1,286 | ||||||
| Change in fair value of cash settled DSUs | 582 | 1,159 | 1,220 | 1,624 | ||||||||
| Adjusted net earnings (loss) | ($9,163 | ) | ($974 | ) | ($9,369 | ) | ($706 | ) | ||||
| Basic weighted average share outstanding | 283,534,276 | 242,889,679 | 272,987,662 | 235,201,630 | ||||||||
| Adjusted net earnings (loss) per share | ($0.03 | ) | ($0.00 | ) | ($0.03 | ) | ($0.00 | ) | ||||
Mine operating cash flow before taxes is a non-IFRS measure that does not have a standardized meaning prescribed by IFRS and therefore may not be comparable to similar measures presented by other issuers. Mine operating cash flow is calculated as revenue minus direct production costs and royalties. Mine operating cash flow is used by management to assess the performance of the mine operations, excluding corporate and exploration activities, and is provided to investors as a measure of the Company's operating performance.
| Expressed in thousands US dollars | Three Months Ended June 30 | Six Months Ended June 30 | ||||||||||
| 2025 | 2024 | 2025 | 2024 | |||||||||
| Mine operating earnings per financial statements | $ | 7,744 | $ | 10,196 | $ | 20,586 | $ | 21,852 | ||||
| Share-based compensation | 136 | 74 | 170 | 153 | ||||||||
| Depreciation | 15,010 | 8,639 | 24,216 | 17,516 | ||||||||
| Mine operating cash flow before taxes | $ | 22,890 | $ | 18,909 | $ | 44,972 | $ | 39,521 | ||||
Operating cash flow before working capital changes per share is a non-IFRS measure that does not have a standardized meaning prescribed by IFRS and therefore may not be comparable to similar measures presented by other issuers. Operating cash flow per share is calculated by dividing cash from operating activities by the weighted average shares outstanding. Operating cash flow per share is used by management to assess operating performance on a per share basis, irrespective of working capital changes and is provided to investors as a measure of the Company's operating performance.
| Expressed in thousands US dollars | Three Months Ended June 30 | Six Months Ended June 30 | ||||||||||
| (except for per share amounts) | 2025 | 2024 | 2025 | 2024 | ||||||||
| Cash from (used in) operating activities per financial statements | $ | 21,564 | $ | 12,367 | $ | 24,927 | $ | 16,950 | ||||
| Net changes in non-cash working capital per financial statements | 7,192 | 4,301 | 2,207 | (1,350 | ) | |||||||
| Operating cash flow before working capital changes | $ | 14,372 | $ | 8,066 | $ | 22,720 | $ | 18,300 | ||||
| Basic weighted average shares outstanding | 283,534,276 | 242,889,679 | 272,987,662 | 235,201,630 | ||||||||
| Operating cash flow before working capital changes per share | $ | 0.05 | $ | 0.03 | $ | 0.08 | $ | 0.08 | ||||
EBITDA is a non-IFRS financial measure, which excludes the following from net earnings:
Adjusted EBITDA excludes the following additional items from EBITDA:
Adjusted EBITDA per share is calculated by dividing Adjusted EBITDA by the basic weighted average number of shares outstanding for the period.
Management believes EBITDA is a valuable indicator of the Company's ability to generate liquidity by producing operating cash flow to fund working capital needs, service debt obligations, and fund capital expenditures.
Management uses EBITDA for this purpose. EBITDA is also frequently used by investors and analysts for valuation purposes whereby EBITDA is multiplied by a factor or "EBITDA multiple" based on an observed or inferred relationship between EBITDA and market values to determine the approximate total enterprise value of a Company.
EBITDA is intended to provide additional information to investors and analysts. It does not have any standardized definition under IFRS and should not be considered in isolation or as a substitute for measures of operating performance prepared in accordance with IFRS. EBITDA excludes the impact of cash costs of financing activities and taxes, and the effects of changes in operating working capital balances, and therefore is not necessarily indicative of operating profit or cash flow from operations as determined by IFRS. Other companies may calculate EBITDA and Adjusted EBITDA differently.
Certain items that become applicable in a period may be adjusted for, with the Company retroactively presenting comparable periods with an adjustment for such items and, conversely, items no longer applicable may be removed from the calculation.
| Expressed in thousands US dollars | Three Months Ended June 30 | Six Months Ended June 30 | ||||||||||
| 2025 | 2024 | 2025 | 2024 | |||||||||
| Net earnings (loss) for the period per financial statements | ($20,455 | ) | ($14,007 | ) | ($53,362 | ) | ($15,201 | ) | ||||
| Depreciation - cost of sales | 15,010 | 8,639 | 24,216 | 17,516 | ||||||||
| Depreciation - exploration, evaluation and development | 4 | 188 | 254 | 347 | ||||||||
| Depreciation - general & administration | 102 | 106 | 207 | 205 | ||||||||
| Finance costs | 846 | 103 | 1,030 | 238 | ||||||||
| Current income tax expense | 9,094 | 2,878 | 14,373 | 8,545 | ||||||||
| Deferred income tax expense (recovery) | (3,199 | ) | (163 | ) | (3,413 | ) | (396 | ) | ||||
| EBITDA | $ | 1,402 | ($2,256 | ) | ($16,695 | ) | $ | 11,254 | ||||
| Share based compensation | 1,681 | 1,162 | 2,197 | 2,332 | ||||||||
| Unrealized foreign exchange (gain) loss | (2,802 | ) | 2,196 | (2,527 | ) | 2,332 | ||||||
| (Gain) loss on derivatives & copper stream valuation | 10,088 | 9,253 | 42,019 | 9,253 | ||||||||
| Change in fair value of investments | (178 | ) | 425 | (321 | ) | 1,286 | ||||||
| Change in fair value of cash settled DSUs | 582 | 1,159 | 1,220 | 1,624 | ||||||||
| Adjusted EBITDA | $ | 10,773 | $ | 11,939 | $ | 25,893 | $ | 28,081 | ||||
| Basic weighted average shares outstanding | 283,534,276 | 242,889,679 | 272,987,662 | 235,201,630 | ||||||||
| Adjusted EBITDA per share | $ | 0.04 | $ | 0.05 | $ | 0.09 | $ | 0.12 | ||||
Cash costs per silver oz, total production costs per oz, direct operating costs per tonne and direct costs per tonne are measures developed by precious metals companies in an effort to provide a comparable standard; however, there can be no assurance that the Company's reporting of these non-IFRS measures and ratios are similar to those reported by other mining companies. Cash costs per oz, total production costs per oz and direct costs per tonne are measures used by the Company to manage and evaluate operating performance at each of the Company's operating mining units. They are widely reported in the silver mining industry as a benchmark for performance, but do not have a standardized meaning and are disclosed in addition to IFRS measures. Direct operating costs include mining, processing (including smelting, refining, transportation and selling costs) and direct overhead at the operation sites. Direct costs include all direct operating costs plus royalties and special mining duty. Cash costs include all direct costs less by-product gold sales and changes in finished gold inventories.
Total production costs include all cash costs plus depreciation, changes in depreciation in finished goods inventory and site share-based compensation. Cash costs per silver ounce and total production costs per ounce are calculated by dividing cash costs and total production costs by the payable silver ounces produced. Direct operating cost per tonne and direct costs per tonne are calculated by dividing direct operating costs and direct costs by the number of processed tonnes. The following tables provide a detailed reconciliation of these measures to the Company's direct production costs, as reported in its consolidated financial statements.
| Expressed in thousands of US dollars | Three Months Ended June 30, 2025 |
|||||||||||
| Guanaceví | Bolañitos | Kolpa | Total | |||||||||
| Direct production costs per financial statements | $ | 23,058 | $ | 11,594 | $ | 16,301 | $ | 50,953 | ||||
| Purchase of the third-party material | (9,988 | ) | - | - | (9,988 | ) | ||||||
| Smelting and refining costs included in revenue | - | 345 | 1,088 | 1,433 | ||||||||
| Opening finished goods | (4,763 | ) | (1,328 | ) | (610 | ) | (6,701 | ) | ||||
| Closing finished goods | 5,939 | 935 | 574 | 7,448 | ||||||||
| Direct operating costs | 14,246 | 11,546 | 17,353 | 43,145 | ||||||||
| Purchase of the third-party material | 9,988 | - | - | 9,988 | ||||||||
| Royalties | 6,197 | 164 | - | 6,361 | ||||||||
| Special mining duty (1) | 1,079 | 423 | 148 | 1,650 | ||||||||
| Direct costs | 31,510 | 12,133 | 17,501 | 61,144 | ||||||||
| By-products sales | (11,635 | ) | (13,962 | ) | (13,275 | ) | (38,872 | ) | ||||
| Opening by-products inventory fair market value | 2,232 | 1,410 | 544 | 4,186 | ||||||||
| Closing by-products inventory fair market value | (2,302 | ) | (1,310 | ) | (526 | ) | (4,138 | ) | ||||
| Cash costs net of by-products | 19,805 | (1,729 | ) | 4,244 | 22,320 | |||||||
| Depreciation | 6,315 | 2,747 | 5,157 | 14,219 | ||||||||
| Share-based compensation | 66 | 46 | 24 | 136 | ||||||||
| Opening finished goods depreciation | (1,618 | ) | (384 | ) | (134 | ) | (2,136 | ) | ||||
| Closing finished goods depreciation | 1,843 | 214 | 125 | 2,182 | ||||||||
| Total production costs | $ | 26,411 | $ | 894 | $ | 9,416 | $ | 36,721 | ||||
| Expressed in thousands of US dollars | Three Months Ended June 30, 2024 |
|||||||||||
| Guanaceví | Bolañitos | Kolpa | Total | |||||||||
| Direct production costs per financial statements | $ | 23,001 | $ | 10,702 | - | $ | 33,703 | |||||
| Purchase of the third-party material | (5,043 | ) | - | - | (5,043 | ) | ||||||
| Smelting and refining costs included in revenue | - | 447 | - | 447 | ||||||||
| Opening finished goods | (2,314 | ) | (651 | ) | - | (2,965 | ) | |||||
| Closing finished goods | 4,038 | 557 | - | 4,595 | ||||||||
| Direct operating costs | 19,682 | 11,055 | - | 30,737 | ||||||||
| Purchase of the third-party material | 5,043 | - | - | 5,043 | ||||||||
| Royalties | 5,556 | 92 | - | 5,648 | ||||||||
| Special mining duty (1) | 129 | 637 | - | 766 | ||||||||
| Direct costs | 30,410 | 11,784 | - | 42,194 | ||||||||
| By-products sales | (8,622 | ) | (14,852 | ) | - | (23,474 | ) | |||||
| Opening by-products inventory fair market value | 871 | 851 | - | 1,722 | ||||||||
| Closing by-products inventory fair market value | (2,187 | ) | (751 | ) | - | (2,938 | ) | |||||
| Cash costs net of by-products | 20,472 | (2,968 | ) | - | 17,504 | |||||||
| Depreciation | 5,965 | 2,674 | - | 8,639 | ||||||||
| Share-based compensation | 60 | 14 | - | 74 | ||||||||
| Opening finished goods depreciation | (771 | ) | (219 | ) | - | (990 | ) | |||||
| Closing finished goods depreciation | 1,326 | 144 | - | 1,470 | ||||||||
| Total production costs | $ | 27,052 | ($355 | ) | - | $ | 26,697 | |||||
| Expressed in thousands of US dollars | Three Months Ended June 30, 2025 |
|||||||||||
| Guanaceví | Bolañitos | Kolpa | Total | |||||||||
| Throughput tonnes | 96,834 | 88,098 | 118,896 | 303,828 | ||||||||
| Payable silver ounces | 994,882 | 100,183 | 359,347 | 1,454,412 | ||||||||
| Cash costs per silver ounce | $ | 19.91 | ($17.26 | ) | $ | 11.81 | $ | 15.35 | ||||
| Total production costs per ounce | $ | 26.55 | $ | 8.92 | $ | 26.20 | $ | 25.25 | ||||
| Direct operating costs per tonne | $ | 147.11 | $ | 131.06 | $ | 145.95 | $ | 142.00 | ||||
| Direct costs per tonne | $ | 325.40 | $ | 137.72 | $ | 147.20 | $ | 201.24 | ||||
| Expressed in thousands of US dollars | Three Months Ended June 30, 2024 |
|||||||||||
| Guanaceví | Bolañitos | Kolpa | Total | |||||||||
| Throughput tonnes | 112,897 | 106,092 | - | 218,989 | ||||||||
| Payable silver ounces | 1,192,165 | 111,296 | - | 1,303,461 | ||||||||
| Cash costs per silver ounce | $ | 17.17 | ($26.67 | ) | - | $ | 13.43 | |||||
| Total production costs per ounce | $ | 22.69 | ($3.19 | ) | - | $ | 20.48 | |||||
| Direct operating costs per tonne | $ | 174.34 | $ | 104.20 | - | $ | 140.36 | |||||
| Direct costs per tonne | $ | 269.36 | $ | 111.07 | - | $ | 192.68 | |||||
| Expressed in thousands of US dollars | Six Months Ended June 30, 2025 |
|||||||||||
| Guanaceví | Bolañitos | Kolpa | Total | |||||||||
| Direct production costs per financial statements | $ | 48,502 | $ | 21,323 | $ | 16,301 | $ | 86,126 | ||||
| Purchase of the third-party material | (15,854 | ) | - | - | (15,854 | ) | ||||||
| Smelting and refining costs included in revenue | - | 781 | 1,088 | 1,869 | ||||||||
| Opening finished goods | (5,448 | ) | (485 | ) | (610 | ) | (6,543 | ) | ||||
| Closing finished goods | 5,939 | 935 | 574 | 7,448 | ||||||||
| Direct operating costs | 33,139 | 22,554 | 17,353 | 73,046 | ||||||||
| Purchase of the third-party material | 15,854 | - | - | 15,854 | ||||||||
| Royalties | 12,263 | 341 | - | 12,604 | ||||||||
| Special mining duty (1) | 2,063 | 854 | 148 | 3,065 | ||||||||
| Direct costs | 63,319 | 23,749 | 17,501 | 104,569 | ||||||||
| By-products sales | (24,426 | ) | (25,954 | ) | (13,275 | ) | (63,655 | ) | ||||
| Opening by-products inventory fair market value | 3,185 | 772 | 544 | 4,501 | ||||||||
| Closing by-products inventory fair market value | (2,302 | ) | (1,310 | ) | (526 | ) | (4,138 | ) | ||||
| Cash costs net of by-products | 39,776 | (2,743 | ) | 4,244 | 41,277 | |||||||
| Depreciation | 12,884 | 5,384 | 5,157 | 23,425 | ||||||||
| Share-based compensation | 86 | 60 | 24 | 170 | ||||||||
| Opening finished goods depreciation | (1,188 | ) | (92 | ) | (134 | ) | (1,414 | ) | ||||
| Closing finished goods depreciation | 1,843 | 214 | 125 | 2,182 | ||||||||
| Total production costs | $ | 53,401 | $ | 2,823 | $ | 9,416 | $ | 65,640 | ||||
| Expressed in thousands of US dollars | Six Months Ended June 30, 2024 |
|||||||||||
| Guanaceví | Bolañitos | Kolpa | Total | |||||||||
| Direct production costs per financial statements | $ | 49,887 | $ | 20,521 | $ | - | $ | 70,408 | ||||
| Purchase of the third-party material | (7,435 | ) | - | - | (7,435 | ) | ||||||
| Smelting and refining costs included in revenue | - | 940 | - | 940 | ||||||||
| Opening finished goods | (7,137 | ) | (699 | ) | - | (7,836 | ) | |||||
| Closing finished goods | 4,038 | 557 | - | 4,595 | ||||||||
| Direct operating costs | 39,353 | 21,319 | - | 60,672 | ||||||||
| Purchase of the third-party material | 7,435 | - | - | 7,435 | ||||||||
| Royalties | 11,888 | 168 | - | 12,056 | ||||||||
| Special mining duty (1) | 1,650 | 697 | - | 2,347 | ||||||||
| Direct costs | 60,326 | 22,184 | - | 82,510 | ||||||||
| By-products sales | (19,353 | ) | (27,117 | ) | - | (46,470 | ) | |||||
| Opening by-products inventory fair market value | 2,909 | 619 | - | 3,528 | ||||||||
| Closing by-products inventory fair market value | (2,187 | ) | (751 | ) | - | (2,938 | ) | |||||
| Cash costs net of by-products | 41,695 | (5,065 | ) | - | 36,630 | |||||||
| Depreciation | 11,780 | 5,736 | - | 17,516 | ||||||||
| Share-based compensation | 122 | 31 | - | 153 | ||||||||
| Opening finished goods depreciation | (1,459 | ) | (197 | ) | - | (1,656 | ) | |||||
| Closing finished goods depreciation | 1,326 | 144 | - | 1,470 | ||||||||
| Total production costs | $ | 53,464 | $ | 649 | $ | - | $ | 54,113 | ||||
| Expressed in thousands of US dollars | Six Months Ended June 30, 2025 |
|||||||||||
| Guanaceví | Bolañitos | Kolpa | Total | |||||||||
| Throughput tonnes | 199,272 | 195,167 | 118,896 | 513,335 | ||||||||
| Payable silver ounces | 2,007,163 | 281,260 | 359,347 | 2,647,770 | ||||||||
| Cash costs per silver ounce | $ | 19.82 | ($9.75 | ) | $ | 11.81 | $ | 15.59 | ||||
| Total production costs per ounce | $ | 26.60 | $ | 10.04 | $ | 26.20 | $ | 24.79 | ||||
| Direct operating costs per tonne | $ | 166.30 | $ | 115.56 | $ | 145.95 | $ | 142.30 | ||||
| Direct costs per tonne | $ | 317.75 | $ | 121.69 | $ | 147.20 | $ | 203.70 | ||||
| Expressed in thousands of US dollars | Six Months Ended June 30, 2024 |
|||||||||||
| Guanaceví | Bolañitos | Kolpa | Total | |||||||||
| Throughput tonnes | 227,901 | 212,882 | - | 440,783 | ||||||||
| Payable silver ounces | 2,523,900 | 229,869 | - | 2,753,769 | ||||||||
| Cash costs per silver ounce | $ | 16.52 | ($22.03 | ) | - | $ | 13.30 | |||||
| Total production costs per ounce | $ | 21.18 | $ | 2.82 | - | $ | 19.65 | |||||
| Direct operating costs per tonne | $ | 172.68 | $ | 100.14 | - | $ | 137.65 | |||||
| Direct costs per tonne | $ | 264.70 | $ | 104.21 | - | $ | 187.19 | |||||
(1) Special mining duty is an EBITDA royalty tax presented as a current income tax in accordance with IFRS.
| Expressed in thousands of US dollars | June 30, 2025 | |||||||||||
| Guanaceví | Bolañitos | Kolpa | Total | |||||||||
| Closing finished goods | 5,939 | 935 | 574 | 7,448 | ||||||||
| Closing finished goods depreciation | 1,843 | 214 | 125 | 2,182 | ||||||||
| Finished goods inventory | $ | 7,782 | $ | 1,149 | $ | 699 | $ | 9,630 | ||||
| Expressed in thousands of US dollars | June 30, 2024 | |||||||||||
| Guanaceví | Bolañitos | Kolpa | Total | |||||||||
| Closing finished goods | 4,038 | 557 | - | 4,595 | ||||||||
| Closing finished goods depreciation | 1,326 | 144 | - | 1,470 | ||||||||
| Finished goods inventory | $ | 5,364 | $ | 701 | $ | - | $ | 6,065 | ||||
AISC per oz and all-in costs per oz are measures developed by the World Gold Council (and used as a standard of the Silver Institute) in an effort to provide a comparable standard within the precious metal industry; however, there can be no assurance that the Company's reporting of these non-IFRS measures are similar to those reported by other mining companies. These measures are used by the Company to manage and evaluate operating performance at each of the Company's operating mining units and consolidated group, and are widely reported in the silver mining industry as a benchmark for performance, but do not have a standardized meaning and are disclosed in addition to IFRS measures. The following tables provide a detailed reconciliation of these measures to the Company's cost of sales, as reported in the Company's consolidated financial statements.
| Expressed in thousands of US dollars | Three Months Ended June 30, 2025 |
|||||||||||
| Guanaceví | Bolañitos | Kolpa | Total | |||||||||
| Cash costs net of by-products | $ | 19,805 | ($1,729 | ) | $ | 4,244 | $ | 22,320 | ||||
| Operations share-based compensation | 66 | 46 | 24 | 136 | ||||||||
| Corporate general and administrative | 1,074 | 323 | 4,755 | 6,152 | ||||||||
| Acquisition costs | - | - | (3,602 | ) | (3,602 | ) | ||||||
| Corporate share-based compensation | 756 | 274 | 323 | 1,353 | ||||||||
| Reclamation - amortization/accretion | 159 | 90 | 41 | 290 | ||||||||
| Mine site expensed exploration | 29 | 27 | 1,036 | 1,092 | ||||||||
| Equipment loan payments | - | - | 66 | 66 | ||||||||
| Capital expenditures sustaining | 4,781 | 1,675 | 2,332 | 8,788 | ||||||||
| All-In-Sustaining Costs | $ | 26,670 | $ | 706 | $ | 9,219 | $ | 36,595 | ||||
| Acquisition costs | 3,602 | |||||||||||
| Growth exploration, evaluation and development | 3,633 | |||||||||||
| Growth capital expenditures | 45,362 | |||||||||||
| All-In-Costs | $ | 89,192 | ||||||||||
| Expressed in thousands of US dollars | Three Months Ended June 30, 2024 |
|||||||||||
| Guanaceví | Bolañitos | Kolpa | Total | |||||||||
| Cash costs net of by-products | $ | 20,472 | ($2,968 | ) | - | $ | 17,504 | |||||
| Operations share-based compensation | 60 | 14 | - | 74 | ||||||||
| Corporate general and administrative | 2,263 | 910 | - | 3,173 | ||||||||
| Corporate share-based compensation | 684 | 277 | - | 961 | ||||||||
| Reclamation - amortization/accretion | 101 | 73 | - | 174 | ||||||||
| Mine site expensed exploration | 341 | 335 | - | 676 | ||||||||
| Equipment loan payments | 78 | 67 | - | 145 | ||||||||
| Capital expenditures sustaining | 5,245 | 2,199 | - | 7,444 | ||||||||
| All-In-Sustaining Costs | $ | 29,244 | $ | 907 | $ | - | $ | 30,151 | ||||
| Growth exploration, evaluation and development | 3,299 | |||||||||||
| Growth capital expenditures | 48,367 | |||||||||||
| All-In-Costs | $ | 81,817 | ||||||||||
| Expressed in thousands of US dollars | Three Months Ended June 30, 2025 |
|||||||||||
| Guanaceví | Bolañitos | Kolpa | Total | |||||||||
| Throughput tonnes | 96,834 | 88,098 | 118,896 | 303,828 | ||||||||
| Payable silver ounces | 994,882 | 100,183 | 359,347 | 1,454,412 | ||||||||
| Silver equivalent production (ounces) | 1,282,853 | 440,678 | 805,032 | 2,528,562 | ||||||||
| All-in-Sustaining cost per ounce | $ | 26.81 | $ | 7.04 | $ | 25.66 | $ | 25.16 | ||||
| Expressed in thousands of US dollars | Three Months Ended June 30, 2024 |
|||||||||||
| Guanaceví | Bolañitos | Kolpa | Total | |||||||||
| Throughput tonnes | 112,897 | 106,092 | - | 218,989 | ||||||||
| Payable silver ounces | 1,192,165 | 111,296 | - | 1,303,461 | ||||||||
| Silver equivalent production (ounces) | 1,535,161 | 621,292 | - | 2,156,453 | ||||||||
| All-in-Sustaining cost per ounce | $ | 24.53 | $ | 8.15 | - | $ | 23.13 | |||||
| Expressed in thousands of US dollars | Six Months Ended June 30, 2025 |
|||||||||||
| Guanaceví | Bolañitos | Kolpa | Total | |||||||||
| Cash costs net of by-products | $ | 39,776 | ($2,743 | ) | $ | 4,244 | $ | 41,277 | ||||
| Operations share-based compensation | 86 | 60 | 24 | 170 | ||||||||
| Corporate general and administrative | 3,750 | 1,403 | 4,755 | 9,908 | ||||||||
| Acquisition costs | - | - | (3,602 | ) | (3,602 | ) | ||||||
| Corporate share-based compensation | 1,050 | 393 | 323 | 1,766 | ||||||||
| Reclamation - amortization/accretion | 307 | 175 | 41 | 523 | ||||||||
| Mine site expensed exploration | 299 | 201 | 1,036 | 1,536 | ||||||||
| Equipment loan payments | - | - | 66 | 66 | ||||||||
| Capital expenditures sustaining | 8,227 | 3,600 | $ | 2,332 | 14,159 | |||||||
| All-In-Sustaining Costs | $ | 53,495 | $ | 3,089 | $ | 9,219 | $ | 65,803 | ||||
| Acquisition costs | 3,602 | |||||||||||
| Growth exploration, evaluation and development | 7,408 | |||||||||||
| Growth capital expenditures | 81,576 | |||||||||||
| All-In-Costs | $ | 158,389 | ||||||||||
| Expressed in thousands of US dollars | Six Months Ended June 30, 2024 |
|||||||||||
| Guanaceví | Bolañitos | Kolpa | Total | |||||||||
| Cash costs net of by-products | $ | 41,695 | ($5,065 | ) | $ | - | $ | 36,630 | ||||
| Operations share-based compensation | 122 | 31 | - | 153 | ||||||||
| Corporate general and administrative | 4,467 | 1,711 | - | 6,178 | ||||||||
| Corporate share-based compensation | 1,374 | 527 | - | 1,901 | ||||||||
| Reclamation - amortization/accretion | 203 | 150 | - | 353 | ||||||||
| Mine site expensed exploration | 463 | 649 | - | 1,112 | ||||||||
| Equipment loan payments | 206 | 287 | - | 493 | ||||||||
| Capital expenditures sustaining | 9,961 | 4,465 | - | 14,426 | ||||||||
| All-In-Sustaining Costs | $ | 58,491 | $ | 2,755 | $ | - | $ | 61,246 | ||||
| Growth exploration, evaluation and development | 6,823 | |||||||||||
| Growth capital expenditures | 86,272 | |||||||||||
| All-In-Costs | $ | 154,341 | ||||||||||
| Expressed in thousands of US dollars | Six Months Ended June 30, 2025 |
|||||||||||
| Guanaceví | Bolañitos | Kolpa | Total | |||||||||
| Throughput tonnes | 199,272 | 195,167 | 118,896 | 513,335 | ||||||||
| Payable silver ounces | 2,007,163 | 281,260 | 359,347 | 2,647,770 | ||||||||
| Silver equivalent production (ounces) | 2,617,300 | 979,070 | 805,032 | 4,401,401 | ||||||||
| All-in-Sustaining cost per ounce | $ | 26.65 | $ | 10.98 | $ | 25.66 | $ | 24.85 | ||||
| Expressed in thousands of US dollars | Six Months Ended June 30, 2024 |
|||||||||||
| Guanaceví | Bolañitos | Kolpa | Total | |||||||||
| Throughput tonnes | 227,901 | 212,882 | - | 440,783 | ||||||||
| Payable silver ounces | 2,523,900 | 229,869 | - | 2,753,769 | ||||||||
| Silver equivalent production (ounces) | 3,200,854 | 1,226,276 | - | 4,427,129 | ||||||||
| All-in-Sustaining cost per ounce | $ | 23.17 | $ | 11.98 | - | $ | 22.24 | |||||
| Expressed in thousands of US dollars | Three Months Ended June 30 | Six Months Ended June 30 | ||||||||||
| 2025 | 2024 | 2025 | 2024 | |||||||||
| Capital expenditures sustaining | $ | 8,788 | $ | 7,444 | $ | 14,159 | $ | 14,426 | ||||
| Growth capital expenditures | 45,362 | 48,367 | 81,576 | 86,272 | ||||||||
| Property, plant and equipment expenditures per Consolidated Statement of Cash Flows | $ | 54,150 | $ | 55,811 | $ | 95,735 | $ | 100,698 | ||||
| Expressed in thousands of US dollars | Three Months Ended June 30 | Six Months Ended June 30 | ||||||||||
| 2025 | 2024 | 2025 | 2024 | |||||||||
| Mine site expensed exploration | $ | 1,092 | $ | 676 | $ | 1,536 | $ | 1,112 | ||||
| Growth exploration, evaluation and development | 3,633 | 3,299 | 7,408 | 6,823 | ||||||||
| Total exploration, evaluation and development | 4,725 | 3,975 | 8,944 | 7,935 | ||||||||
| Exploration, evaluation and development depreciation | 4 | 188 | 254 | 347 | ||||||||
| Exploration, evaluation and development share-based compensation | 193 | 127 | 262 | 278 | ||||||||
| Exploration, evaluation and development expense | $ | 4,922 | $ | 4,290 | $ | 9,460 | $ | 8,560 | ||||
| Expressed in thousands of US dollars | Three Months Ended June 30 | Six Months Ended June 30 | ||||||||||
| 2025 | 2024 | 2025 | 2024 | |||||||||
| Gross silver sales | $ | 48,873 | $ | 35,234 | $ | 88,024 | $ | 76,456 | ||||
| Silver ounces sold | 1,483,311 | 1,217,569 | 2,706,995 | 2,973,663 | ||||||||
| Realized silver price per ounce | $ | 32.95 | $ | 28.94 | $ | 32.52 | $ | 25.71 | ||||
1) inclusive of 27,631 oz of silver from pre-production at Terronera
| Expressed in thousands of US dollars | Three Months Ended June 30 | Six Months Ended June 30 | ||||||||||
| 2025 | 2024 | 2025 | 2024 | |||||||||
| Gross gold sales | $ | 27,989 | $ | 23,474 | $ | 52,772 | $ | 46,470 | ||||
| Gold ounces sold | 8,431 | 9,887 | 16,969 | 20,767 | ||||||||
| Realized gold price per ounce | $ | 3,320 | $ | 2,374 | $ | 3,110 | $ | 2,238 | ||||
2) inclusive of 725 oz of gold from pre-production at Terronera
| Expressed in thousands of US dollars | Three Months Ended June 30 | Six Months Ended June 30 | ||||||||||
| 2025 | 2024 | 2025 | 2024 | |||||||||
| Gross lead sales | $ | 6,735 | - | $ | 6,735 | - | ||||||
| Lead tonnes sold | 3,344 | - | 3,344 | - | ||||||||
| Realized lead price per tonne | $ | 2,014 | - | $ | 2,014 | - | ||||||
| Expressed in thousands of US dollars | Three Months Ended June 30 | Six Months Ended June 30 | ||||||||||
| 2025 | 2024 | 2025 | 2024 | |||||||||
| Gross Zinc sales | $ | 5,622 | - | $ | 5,622 | - | ||||||
| Zinc tonnes sold | 1,974 | - | 1,974 | - | ||||||||
| Realized zinc price per tonne | $ | 2,847 | - | $ | 2,847 | - | ||||||
| Expressed in thousands of US dollars | Three Months Ended June 30 | Six Months Ended June 30 | ||||||||||
| 2025 | 2024 | 2025 | 2024 | |||||||||
| Gross Copper sales | $ | 561 | - | $ | 561 | - | ||||||
| Copper tonnes sold | 57 | - | 57 | - | ||||||||
| Realized copper price per tonne | $ | 9,820 | - | $ | 9,820 | - | ||||||