Exhibit (d)
OESTERREICHISCHE KONTROLLBANK AKTIENGESELLSCHAFT
REPUBLIC OF AUSTRIA
This description of Oesterreichische Kontrollbank Aktiengesellschaft (OeKB or the Bank) and the Republic of Austria (Austria or the Republic) is dated August 12, 2025 and appears as Exhibit (d) to OeKBs Annual Report on Form 18-K/A for the fiscal year ended December 31, 2024.
THIS DOCUMENT (OTHERWISE THAN AS PART OF A PROSPECTUS CONTAINED IN A REGISTRATION STATEMENT FILED UNDER THE U.S. SECURITIES ACT OF 1933) DOES NOT CONSTITUTE AN OFFER TO SELL OR THE SOLICITATION OF AN OFFER TO BUY ANY OF OeKBS SECURITIES. THE DELIVERY OF THIS DOCUMENT AT ANY TIME DOES NOT IMPLY THAT THE INFORMATION HEREIN IS CORRECT AS OF ANY TIME SUBSEQUENT TO ITS DATE.
Page | ||||
2 | ||||
2 | ||||
3 | ||||
7 | ||||
7 | ||||
10 | ||||
132 | ||||
132 | ||||
132 | ||||
132 | ||||
133 | ||||
133 | ||||
134 | ||||
141 | ||||
144 | ||||
145 | ||||
146 | ||||
150 | ||||
155 | ||||
157 | ||||
165 | ||||
165 |
In this description, all monetary amounts are expressed in euro (EUR or ) unless otherwise specified. Other currencies are abbreviated as follows:
Abbreviation |
Currency |
Abbreviation |
Currency | |||
AUD | Australian dollar | NOK | Norwegian krone | |||
CAD | Canadian dollar | NZD | New Zealand dollar | |||
CHF | Swiss franc | PLN | Polish zloty | |||
CZK | Czech koruna | RON | Romanian leu | |||
DKK | Danish krone | RUB | Russian ruble | |||
GBP | British Pound Sterling | SEK | Swedish krona | |||
HKD | Hong Kong dollar | TRY | Turkish lira | |||
HRK | Croatian kuna | dollar or USD | United States dollar | |||
HUF | Hungarian forint | ZAR | South African rand | |||
JPY | Japanese yen |
1
Solely for the convenience of the reader, except where expressly indicated, certain financial information with respect to OeKB has been translated from euro into dollars at the rate of 1.0389 dollars to the euro, the foreign exchange reference rate published by the European Central Bank on December 31, 2024, the last trading day of the year. Other financial information has been translated at specified rates of exchange in effect at the ends of the periods indicated or on the specified dates. These conversions should not be construed as representations that the euro amounts could have been or could be converted into dollars at that or any other rate. For further information with respect to exchange rates, including the average rates of exchange between the euro and the dollar since 2019, see Republic of AustriaForeign ExchangeExchange Rates of the Euro.
OESTERREICHISCHE KONTROLLBANK AKTIENGESELLSCHAFT
The Bank was established in 1946 under the Austrian Stock Corporation Act (Aktiengesetz) to provide services outside routine commercial banking functions to the Austrian economy. The Banks activities include the administration of export guarantees (as agent of the Republic) and the financing of Austrian exports. Its registered and head office is located at Am Hof 4, A-1010 Vienna, Austria.
In 1950, the Bank became involved in the financing and promotion of Austrian exports. Since the original adoption of the Export Promotion Act in 1964, which was replaced on June 1, 1981 by the Export Guarantees Act of 1981, and which has since been amended (as so amended, the Export Guarantees Act), the Bank has acted as the sole agent of Austria for the administration of guarantees issued by Austria under this Act covering commercial, political and foreign exchange risks in connection with Austrian exports. The Bank also provides medium- and long-term financing to banks and foreign importers for export transactions, the repayment of which is guaranteed by Austria under the Export Guarantees Act. Substantially all borrowings by the Bank in connection with export loan financing are guaranteed either as to principal and interest, as to foreign exchange risk or as to both by Austria under the Export Financing Guarantees Act of 1981, as amended (the Export Financing Guarantees Act). See BusinessExport ServicesExport Loan Financing by the BankSources of Funds for Export Financing. The Bank also engages in certain other financial activities including the organization and administration of domestic bond issues, in particular bond offerings by the Republic. CCP Austria Abwicklungsstelle für Börsengeschäfte GmbH, or CCP.A, a joint venture between the Bank and the Vienna Stock Exchange, operates the clearing system of the Vienna Stock Exchange. Since September 12, 2015, the Banks subsidiary OeKB CSD GmbH, or OeKB CSD, operates the business of the Austrian central securities depository (Wertpapiersammelbank) which before was operated by the Bank for five decades. It was transferred to OeKB CSD from the Bank due to regulatory requirements. OeKB CSD is a company with limited liability and acts as central securities depository for Austria pursuant to the Austrian Securities Deposit Act. The Bank does not accept deposits from the general public or engage in general lending or other commercial banking activities. In 2008, the Bank, on behalf of the Republic, established the Oesterreichische Entwicklungsbank AG to assist developing countries in establishing private industry. See BusinessExport ServicesAdministration of Export Guarantees of the Republic.
The total capitalization of the OeKB Group at December 31, 2024 was as follows:
(Thousands of euros)(1) |
(Thousands of dollars)(2) |
|||||||
Long-term indebtedness(3) |
||||||||
Deposits from banks |
408,702 | 424,601 | ||||||
Deposits from customers |
0 | 0 | ||||||
Debt securities issued |
16,165,998 | 16,794,855 | ||||||
|
|
|
|
|||||
Total long-term indebtedness |
16,574,700 | 17,219,456 | ||||||
Equity |
941,246 | 977,860 | ||||||
|
|
|
|
|||||
Total long-term capitalization |
17,515,946 | 18,197,316 | ||||||
Short-term indebtedness |
||||||||
Payables to banks |
549,081 | 570,440 | ||||||
Payables to customers |
1,083,502 | 1,125,650 | ||||||
Debt securities issued |
12,678,907 | 13,172,116 | ||||||
|
|
|
|
|||||
Total short-term capitalization |
14,311,490 | 14,868,207 | ||||||
|
|
|
|
|||||
Total capitalization |
31,827,436 | 33,065,523 |
2
(Dollar amounts may not add due to rounding.)
(1) | The line items listed in this table have been extracted from the consolidated financial statements of the OeKB Group, which were prepared in accordance with International Financial Reporting Standards (IFRS) as adopted by the EU, and the additional requirements pursuant to §§ 245a UGB (Austrian Commercial Code) and 59a BWG (Austrian Banking Act). |
(2) | The amounts in this column have been translated into dollars at the exchange rate specified in the paragraph following the Table of Contents hereof. |
(3) | Refers to indebtedness with a remaining maturity of more than one year from the balance sheet date. |
The Bank has completed the following public issues from January 1, 2025 to August 12, 2025: GBP 500,000,000 4.500% Guaranteed Notes due October 22, 2029, USD 1,250,000,000 4.500% Guaranteed Notes due January 24, 2030, USD 1,5000,000 4.000% Guaranteed Notes due May 28, 2028 and GBP 50,000,000 Reopening of GBP 300,000,000 4.000% Guaranteed Notes due June 27, 2029.
The Banks main business includes the administration of guarantees issued by the Republic for export transactions pursuant to the Export Guarantees Act. These guarantees (Export Guarantees) are not liabilities of the Bank. All claims on Export Guarantees are paid from funds of Austria. The Banks balance sheet is comprised principally of export loan financing. The Bank conducts its export loan financing activities, which relate exclusively to the refinancing of receivables covered either by Export Guarantees or, to a lesser extent, by private credit insurance and other means, for its own account.
Since the portion of exports for which the Bank administers Export Guarantees or provides export loan financing in relation to total Austrian exports is relatively low, and the demand for Export Guarantees and export loan financing relative to total export volumes tends to increase in economically difficult times, changes in Austrias export volume typically only have a limited impact on the Banks operations.
The Bank also performs several significant functions in the Austrian capital markets. In this field, through CCP Austria Abwicklungsstelle für Börsengeschäfte GmbH, a joint venture with the Vienna Stock Exchange, and the operation of Austrias central securities depository by its subsidiary OeKB CSD GmbH, the Bank exercises a central function in the custody and administration of securities and endeavors to improve existing services for the banking community, the Vienna Stock Exchange and capital markets participants.
In 2008, based on an amendment of the Export Guarantees Act, the Bank established, on behalf of the Republic, Oesterreichische Entwicklungsbank AG (Austrian Development Bank; the Development Bank), to be responsible for acquiring participations, granting loans and other financing measures and providing assistance, designed in agreement with the Ministry of Finance, to developing countries in establishing private industry. The Development Bank is a wholly owned subsidiary of the Bank.
3
In 2019, the Bank acquired 68.75% of the shares in Österreichische Hotel- und Tourismusbank Gesellschaft m.b.H. (ÖHT), a special-purpose bank for financing and promoting investments in tourism. Raiffeisen ÖHT Beteiligungs GmbH holds the remaining 31.25% of the shares in ÖHT.
In response to the war in Ukraine and the related negative impacts on the Austrian export industry, OeKB in cooperation with the Ministry of Finance set up an additional EUR 1 billion special credit line in April 2022 under which exporters can apply to OeKB for financings of up to 10 percent (large enterprises) or 15 percent (small and medium-sized enterprises) of their export turnover.
Export Services
Administration of Export Guarantees of the Republic
Pursuant to the Export Guarantees Act, the Bank acts as the Republics sole agent for the administration of Export Guarantees. Except in cases in which the Bank itself is to be the beneficiary of an Export Guarantee, the Bank processes and performs a credit analysis of applications for Export Guarantees. All Export Guarantees must be authorized by the Republic and are issued and administered by the Bank on behalf of the Republic. During 2024, the Bank, as agent of the Republic, issued 943 Export Guarantees covering export transactions with a total value of EUR 5.6 billion (USD 5.8 billion), and on December 31, 2024, the total value of all export transactions covered by Export Guarantees amounted to EUR 29.1 billion (USD 30.2 billion). In December 2022, the validity of the Export Guarantees Act was extended until December 31, 2027. Guarantees already issued under the Export Guarantees Act at that time will not be affected by its expiration.
Under the Export Guarantees Act, the Austrian Government could initiate a procurement procedure in which other institutions with an appropriate banking license within the European Economic Area would be eligible to compete with the Bank to become the Republics sole agent for the administration of Export Guarantees. In such event:
| the Bank will remain the sole agent of the Republic for as long as no other party has been awarded an agency contract pursuant to the prescribed procurement procedure; |
| the Austrian Government is required to inform the Bank at least two years prior to initiating a procurement procedure for awarding a new agency contract to one of the tendering institutions, which will include the Bank; and |
| in case a new agent is appointed, any export guarantees and export financing transactions pending at that time will continue to be administered by the Bank and credit operations to raise the required funds will continue to be guaranteed by the Republic. |
The Bank is a member of the Berne Union (International Union of Credit and Investment Insurers), which consists of 86 export credit and investment insurers from 67 countries.
Risks Covered by Export Guarantees. Liabilities assumed by the Republic under the Export Guarantees Act take the form of guarantees for the due performance of contracts by the foreign contracting parties, or guarantees by aval on bills of exchange whose discount proceeds are applied to financing export transactions. The Export Guarantee scheme is comprised of 12 types of guarantees. The most significant is the guarantee for tied financial credits, which represented EUR 4.6 billion or 16.0% of total guarantees outstanding as of December 31, 2024.
Other significant Export Guarantees are guarantees for the acquisition of accounts receivable (EUR 1.1 billion or 3.7% of total guarantees outstanding as of December 31, 2024) and guarantees for direct deliveries and services (EUR 2.1 billion or 7.1% of total guarantees outstanding as of December 31, 2024).
Payments under Export Guarantees. The 1981 regulation of the Minister of Finance under the Export Guarantees Act (the Regulation) provides that Austria will pay claims against it under Export Guarantees upon recognition of its liability (in cases of both matured claims and claims that mature after Austria recognizes its liability) in accordance with the payment schedule established in the underlying contract. The Regulation also provides acceleration of a payment schedule against Austria under an Export Guarantee. The Regulation permits Austria to deny liability under an Export Guarantee under certain circumstances, mainly in cases of fraud or misrepresentation in connection with the issuance of such guarantee or failure to comply with the guarantees conditions. In 2024, Austria, as guarantor, paid gross claims amounting to EUR 210 million (2023: EUR 125 million), while recoveries totaled EUR 40 million (2023: EUR 51 million).
4
Maximum Liability of Austria on Export Guarantees. The Export Guarantees Act establishes a ceiling of EUR 40.0 billion (USD 41.6 billion) on the liability of Austria under outstanding Export Guarantees. As of December 31, 2024, the total liability of Austria assumed in the form of Export Guarantees amounted to EUR 29.1 billion (USD 30.2 billion) or 72.7% of the maximum authorized liability. When calculating the extent of utilization, the basic amounts (maximum amount of guarantee less the lowest rate of retention to be borne by the beneficiary) outstanding under the guarantees and the total financing requirements reported in the case of guarantees by aval on bills of exchange are included.
Export Loan Financing by the Bank. In addition to the Banks role as sole agent for the administration of the Republics export guarantee program under the Export Guarantees Act, the Bank makes loans directly to banks including the shareholders of the Bank (Refinancing Loans) in order to permit such institutions to finance export loans made directly by them.
Export Loans and Commitments. The following table sets forth the aggregate principal amount of refinancing of tied loans, the acquisition of accounts receivable and of guarantees by aval, outstanding as of December 31 in each of the last five years:
2020 | 2021 | 2022 | 2023 | 2024 | ||||||||||||||||||||
(Billions of euros) |
(Billions of dollars) |
||||||||||||||||||||||
Tied loans |
3.35 | 3.16 | 2.91 | 2.70 | 2.75 | 2.86 | ||||||||||||||||||
Acquisitions of accounts receivable |
0.07 | 0.07 | 0.06 | 0.07 | 0.07 | 0.07 | ||||||||||||||||||
Guarantees by aval |
17.48 | 16.47 | 17.13 | 17.17 | 17.09 | 17.75 | ||||||||||||||||||
Other refinancing contracts |
2.18 | 2.09 | 2.03 | 2.09 | 2.32 | 2.41 | ||||||||||||||||||
|
|
|
|
|
|
|
|
|||||||||||||||||
Total |
23.08 | 21.79 | 22.13 | 22.03 | 22.23 | 23.09 | ||||||||||||||||||
|
|
|
|
|
|
|
|
Of the total export financing outstanding as of December 31, 2024, EUR 7.96 billion (USD 8.27 billion) were to banks which are shareholders of the Bank. Moreover, we assume commitments to grant export financing. As of December 31, 2024, the balance of export financing not yet granted which we were contractually obligated to make was EUR 3.0 billion (USD 3.1 billion). This balance was scheduled to be drawn down as follows:
(Millions of euros) |
(Millions of dollars) |
|||||||
Through December 31, |
||||||||
2025 |
2,536 | 2,635 | ||||||
2026 |
293 | 304 | ||||||
2027 |
192 | 199 | ||||||
2028 |
10 | 10 | ||||||
|
|
|
|
|||||
Total |
3,031 | 3,149 |
All of these undisbursed amounts may be cancelled in whole or in part at the option of the potential borrower, but the aggregate amount of cancellations to date has been insignificant. The timing of the draw-downs of these undisbursed amounts may change from time to time due to late deliveries, construction delays or other reasons.
Terms and Conditions of Export Financing. The credits to banks require a guarantee for the transaction or right underlying the financing. The guarantee must comply with the provisions of the Export Financing Guarantees Act. In the course of issuing guarantees, sustainability issues are a major point to be considered whereby the OECD recommendations for environmental and social due diligence for officially supported export credits (Common Approaches) serve as important guidelines. In addition, both the rights arising from the guarantees and the underlying receivables (export or other receivables) must, as a rule, be assigned as security.
5
The maximum repayment term for commercial export credits that fall within the scope of the OECD Arrangement on Officially Supported Export Credits (OECD Arrangement), whose participants agree to abide by certain rules with respect to the provision of officially supported export credits, is generally 10 years. Longer maximum terms are possible for conventional power plants (a maximum of 12 years), project finance (a maximum of 14 years) and renewable energy, climate protection and water projects (a maximum of 18 years). The currently applicable interest rates can be found on our website. Information on our website is not part of or incorporated by reference into this report.
The Banks Export Financing Scheme is a refinancing source for domestic and foreign credit institutions. To be eligible such institutions must meet our creditworthiness criteria, fulfill the legal requirements regarding the transactions to be financed and satisfy our conditions for uniform financing procedures. The uniform financing procedure conditions particularly apply to collateral management.
In issuing credits under the Export Financing Scheme, the Bank observes the applicable guidelines, directives and regulations of international agreements on the Organization for Economic Cooperation and Development (OECD), the EU and the Berne Union.
Sources of Funds for Export Financing. The principal sources of funds for our export financing activities are borrowings and issuances of debt securities, both in Austria and abroad. See Financial StatementsConsolidated balance sheet of OeKB Group and notes 22 and 23 to the Financial Statements.
The Export Financing Guarantees Act authorizes the Minister of Finance to issue on behalf of Austria unconditional guarantees of Austria for the payment of principal and interest on borrowings incurred by the Bank for the purpose of financing export transactions, including export loans, or for the purpose of refinancing such borrowings. In addition, pursuant to Sec. 1 Para. 2 Lit. b of the Export Financing Guarantees Act, Austria is authorized to provide indemnification in the case of foreign currency borrowings, so that we shall not have to pay more principal and interest expressed in euro than contemplated at the time of the borrowing on the basis of then prevailing exchange rates. The Export Financing Guarantees Act provides that Austrias guarantees may only be issued if, after giving effect to such issuance, the aggregate liability for payments of principal under all guarantees then in effect does not exceed the maximum outstanding aggregate amount which currently stands at EUR 40.0 billion (USD 41.6 billion). In December 2022, the validity of the Export Financing Guarantees Act was extended until December 31, 2028. Guarantees of Austria issued prior to such date will not be affected by the expiration of the Act. An amount equal to 10% of the euro equivalent of the outstanding guaranteed principal is added in computing the aggregate amount of such liability in view of the exchange rate risk. As of December 31, 2024, the total amount of outstanding liabilities of Austria under the Export Financing Guarantees Act was EUR 27.5 billion (USD 28.6 billion).
Payment of principal and interest on most foreign currency borrowings of the Bank is covered by Austrias guarantees under the Export Financing Guarantees Act. Austria has indemnified the Bank against foreign exchange risks in connection with substantially all foreign currency borrowings by the Bank. As of December 31, 2024, the total of outstanding borrowings denominated in currencies other than euro by the Bank amounted to EUR 24.7 billion (USD 25.7 billion). As of December 31, 2024, the total amount of outstanding borrowings denominated in euro by the Bank amounted to EUR 2.8 billion (USD 2.9 billion).
Services for the Capital Market and the Energy Market
Domestic Capital Markets Activities. We are a central provider of highly specialized services and infrastructure for the Austrian capital market. These services are used by financial service providers, issuers, investors, the Republic of Austria and the Austrian Financial Markets Authority, among others. Further to the provision of financial data and acting as the auction, paying and calculating agent for Austrian government bonds, the Bank since 2007 has acted as an Officially Appointed Mechanism for regulated information according to the European Transparency Directive and the Austrian Stock Exchange Act. It also acts as the National Numbering Agency and provides support services in connection with the allocation of LEI codes.
Processing of Austrian government bond and Austrian Treasury Bill auctions is effectuated via ADAS (Austrian Direct Auction System), an in-house developed electronic auction system, as a neutral intermediary between the auction participants and the Austrian Treasury representing the Republic of Austria.
6
Furthermore, the Bank is entrusted with the function of a reporting office in accordance with the Austrian Investment Fund Act 2011 and the Capital Markets Act 2019. In this function, it maintains an issue calendar for all securities and investments offered in Austria and acts as a depository for fund and securities prospectuses and as a data provider for the national supervisory authority and the Prospectus Notification Portal of the European Securities and Markets Authority (ESMA). Additionally, the Bank collects tax data for funds and calculates and publishes the capital yield tax.
Stock exchange trading, clearing and settlement. Pursuant to a decree of the Vienna Stock Exchange Council, we have been the clearing agency for the Vienna Stock Exchange since 1949. On November 5, 1999, trading on the Vienna Stock Exchange was entrusted to the Xetra trading system of the Deutsche Börse AG. Until January 31, 2005, we continued to clear and settle the transactions on the Vienna Stock Exchange even after the introduction of the German trading system. As of February 1, 2005, we transferred these activities to CCP Austria Abwicklungsstelle für Börsengeschäfte GmbH, a joint venture between the Bank and the Vienna Stock Exchange.
Central Securities Depositary. Since July 1, 1965, we have acted as the central depositary for securities in Austria. Depositors can open collective securities depositary accounts and benefit from the attendant advantages (simplification of securities custody, administration and transfer). Account holders include all members of the Vienna Stock Exchange, brokers and clearing institutions as well as foreign and domestic credit and financial institutions. In our capacity as central depositary, we have also entered into agreements with other central depositaries in order to ease cross-border settlement of securities transactions. Such agreements exist with the German, Dutch, French and Italian central depositaries, as well as with the Euroclear System (Euroclear) and Clearstream Banking S.A., Luxembourg (Clearstream Luxembourg). On September 12, 2015, we spun off our central depositary activities into a wholly owned subsidiary, OeKB CSD GmbH, in order to comply with the EU regulation on central securities depositories.
Competence Center for the Energy Market. In 2001, we took advantage of the deregulation of the electricity energy markets in Austria to develop a new business segment. The Bank performs the functions of financial clearing and risk management for imbalance energy (the difference between the contracts entered into by market participants on the basis of forecasts and the actual consumption/production of energy, which has to be consumed or generated by market participants). In 2003, we assumed the equivalent function for the gas energy market. Since 2013 OeKB offers services for spot trading with electricity and gas as a General Clearing Member (GCM) of European Commodity Clearing (ECC).
Other Services
Non-Export Loan Activities. As of December 31, 2024, the Banks non-export loans totaled EUR 0.40 million (USD 0.42 million). All of these loans were made to OeKB employees.
Information Services. Furthermore, the segment Other Services encompasses our information services which deliver studies, analyses, or concise summaries on global financial and economic developments mainly to business enterprises, domestic and foreign financial service providers as well as scientific and research institutions.
Our business is managed by a Board of Executive Directors. Our Supervisory Board appoints the members of the Board of Executive Directors for terms of up to five years. The current members of our Board of Executive Directors are Angelika Sommer-Hemetsberger and Helmut Bernkopf.
During the financial year 2024, we had an average of 471 employees (including part-time employees on a proportionate basis, corresponding to the extent of their employment). On December 31, 2024, we had 481 employees (including part-time employees on a proportionate basis).
SHAREHOLDERS AND SUPERVISORY BOARD
On December 31, 2024, our share capital was EUR 130 million, divided into 880,000 ordinary no-par value shares, all of which are issued and fully paid. The shares are in registered form.
7
Our share capital is owned by leading Austrian banks and financial institutions as follows:
Name of Shareholder |
% of Share Capital |
|||
CABET-Holding-GmbH, Vienna (UniCredit Bank Austria Group) |
24.750 | % | ||
UniCredit Bank Austria AG, Vienna |
16.140 | % | ||
Erste Bank der oesterreichischen Sparkassen AG, Vienna |
12.890 | % | ||
Schoellerbank Aktiengesellschaft, Vienna |
8.260 | % | ||
AVZ GmbH, Vienna |
8.250 | % | ||
Raiffeisen Bank International Aktiengesellschaft, Vienna |
8.120 | % | ||
P.S.K. Beteiligungsverwaltung GmbH, Vienna |
5.090 | % | ||
Raiffeisen OeKB Beteiligungsgesellschaft mbH (Raiffeisen Group), Vienna |
5.000 | % | ||
Oberbank AG, Linz |
3.890 | % | ||
Beteiligungsholding 5000 GmbH, Innsbruck |
3.055 | % | ||
BKS Bank AG, Klagenfurt |
3.055 | % | ||
Volksbank Wien AG, Vienna |
1.500 | % | ||
100.000 | % |
A substantial portion of our business is with our shareholders and their affiliates and with various other organizations with which the members of our Supervisory Board and our Board of Executive Directors are affiliated as directors, officers or otherwise. We do not consider the Bank to be a competitor of its shareholders or of other Austrian banks and credit institutions. We generally do not initiate transactions, whether or not they involve related parties, without consultation with our shareholders through their representatives on our Supervisory Board. When we do transact business with our shareholders, we do so on an arms-length basis. See Business.
Our Supervisory Board currently consists of the following members elected by the shareholders of the Bank:
Name |
Principal Occupation | |
Dieter Hengl Chairperson |
General Director and Chair of the Board, UniCredit Bank Austria AG, Vienna | |
Marie Valerie Brunner 1st Vice-Chairperson |
Director and Member of the Board, Raiffeisen Bank International Aktiengesellschaft, Vienna | |
Ilinka Kajgana 2nd Vice-Chairperson |
Chief Risk Officer and Member of the Board, Erste Bank der oesterreichischen Sparkassen AG, Vienna | |
Sabine Abfalter |
Member of the Board, Raiffeisen Bank International Aktiengesellschaft, Vienna | |
Rainer Borns |
Member of the Board, Volksbank Wien AG, Vienna | |
Rainer Hackl |
Head of Department Strategic Credit & Integrated Risk, UniCredit Bank Austria AG, Vienna | |
Christine Hartlieb-Götz |
Chief Operating Officer, UniCredit Leasing (Austria) GmbH, Vienna | |
Robert Konrad |
Head Group Transaction Banking, Erste Group Bank AG, Vienna | |
Marion Kristen |
Head of STEF & EXIN, Managing Director, UniCredit Bank Austria AG, Vienna | |
Herbert Pichler |
Member of the Board, Privatstiftung zur Verwaltung von Anteilsrechten, Vienna | |
Friedrich Spandl |
Managing Director, BAWAG P.S.K., Vienna | |
Herta Stockbauer |
Member of the Board, BKS Bank AG, Klagenfurt | |
Hans Unterdorfer |
Chief Corporates Officer, Erste Bank der oesterreichischen Sparkassen AG, Vienna | |
Robert Wieselmayer |
Member of the Board, Card Complete Service Bank AG, Vienna | |
Janine Wukovits |
Head of Legal Governance and Digitalisation, UniCredit Bank Austria AG, Vienna |
8
In addition, Austrian law requires that our employees be represented on the Supervisory Board by delegates elected to four-year terms by the Staff Council. These delegates have the right to vote on substantially all questions at meetings of the Supervisory Board. The employee delegates on the Supervisory Board are: Martin Krull, Christina Schadauer, Sophie Clemente Palma, Elisabeth Halys, Christoph Seper, Markus Tichy and Evelyn Ulrich- Hell.
The Supervisory Board reports to the shareholders on the Banks management and financial condition. The authorization of certain transactions by the Board of Executive Directors, including borrowing and lending by the Bank in excess of certain amounts, is subject to approval by the Supervisory Board. With respect to our borrowing and lending activities, the Supervisory Board has delegated this function to an Executive Committee consisting of the following persons:
Dieter Hengl |
Chairman of the Supervisory Board | |
Marie Valerie Brunner |
1st Vice-Chairman of the Supervisory Board | |
Martin Krull |
Employee delegate on the Supervisory Board |
As required by the Austrian Stock Corporation Act (Aktiengesetz), the Supervisory Board has appointed a committee for the examination and preparation of the approval of the annual financial statements (Ausschuss zur Prüfung und Vorbereitung der Feststellung des Jahresabschlusses) which consists of the chairman and the 1st vice-chairman of the Supervisory Board and the chairman of the works council (Betriebsratsvorsitzender).
State Commissioners/Representatives
Pursuant to the Austrian Banking Act of 1993 (Bankwesengesetz), the Minister of Finance of Austria must appoint a State Commissioner and a Deputy State Commissioner for most banks, including OeKB. The State Commissioners are entitled to participate in the meetings of the shareholders and of the Supervisory Board of the Bank and must object to resolutions which in their view violate the laws or regulations of Austria. The objection of a State Commissioner suspends the effectiveness of such resolutions until the determination by the Financial Markets Authority as to their validity. In addition, the Export Financing Guarantees Act authorizes the Minister of Finance to appoint a Representative and a Deputy Representative who are charged with protecting the interests of Austria in connection with the guarantees assumed by Austria under the Act. These Representatives are entitled to examine all books and records of the Bank and to participate without vote in all deliberations of the Bank relating to borrowings by the Bank which are the subject of guarantees of Austria under the Export Financing Guarantees Act.
The names of the current State Commissioners/Representatives under both statutes and the positions they hold in the Austrian Government are as follows:
Harald Waiglein, State Commissioner/Representative |
Head of Directorate General IIIEconomic Policy, Financial Markets and Customs Duties, Austrian Federal Ministry of Finance | |
Johann Kinast, Deputy State Commissioner/Representative |
Head of Unit III/8Export Guarantees and Debt Rescheduling, Austrian Federal Ministry of Finance |
9
Index to Financial Statements
10
OeKB Group consolidated financial statements 2024
The Notes are an integral part of the total comprehensive income for the year, the balance sheet, the consolidated statement of changes in equity, and the cash flow.
Consolidated statement of comprehensive income of OeKB Group
Income statement
thousand |
Notes | 2024 | 2023 | |||||||||
Interest income calculated using the effective interest method |
762,272 | 713,060 | ||||||||||
Other interest income |
202,733 | 159,782 | ||||||||||
Interest income |
965,004 | 872,842 | ||||||||||
Interest expenses calculated using the effective interest method |
(355,246 | ) | (372,141 | ) | ||||||||
Other interest expenses |
(475,760 | ) | (376,953 | ) | ||||||||
Interest expenses |
(831,006 | ) | (749,094 | ) | ||||||||
|
|
|
|
|||||||||
Net interest income |
6 | 133,999 | 123,748 | |||||||||
Fee and commission income |
72,415 | 67,480 | ||||||||||
Fee and commission expenses |
(24,223 | ) | (24,273 | ) | ||||||||
|
|
|
|
|||||||||
Net fee and commission income |
7 | 48,193 | 43,206 | |||||||||
Net credit risk provisions |
8 | (280 | ) | 682 | ||||||||
Net gain or loss on financial instruments measured at fair value through profit or loss |
9 | 343 | (1,016 | ) | ||||||||
Net gain or loss on the derecognition of financial instruments not measured at fair value through profit or loss |
10 | (4 | ) | (3 | ) | |||||||
Current income from investments in other unconsolidated companies |
11 | 3,359 | 2,569 | |||||||||
Share of profit or loss of equity-accounted investments, net of tax |
20 | 5,550 | 11,137 | |||||||||
Administrative expenses |
12 | (111,621 | ) | (104,615 | ) | |||||||
Other operating income |
9,220 | 8,215 | ||||||||||
Other operating expenses |
(2,939 | ) | (3,051 | ) | ||||||||
Other operating income |
13 | 6,281 | 5,164 | |||||||||
|
|
|
|
|||||||||
Profit before tax |
85,819 | 80,872 | ||||||||||
Income tax |
14 | (18,323 | ) | (16,842 | ) | |||||||
|
|
|
|
|||||||||
Profit for the year |
67,496 | 64,029 | ||||||||||
|
|
|
|
|||||||||
Attributable to owners of the parent |
65,706 | 62,386 | ||||||||||
Attributable to non-controlling interests |
1,791 | 1,643 |
11
Other comprehensive income/(expense) and total comprehensive income/(expense)
thousand |
Notes | 2024 | 2023 | |||||||||
Items that will not be reclassified into the income statement in future |
||||||||||||
Actuarial gains/losses on defined benefit plans |
24 | 3,089 | (13,296 | ) | ||||||||
Equity-accounted investments - Share of net other comprehensive income |
20 | 12 | (415 | ) | ||||||||
Net gain or loss from the fair value measurement of investments in other unconsolidated companies (FVOCI) |
(826 | ) | 1,712 | |||||||||
Tax effects |
14 | (508 | ) | 2,796 | ||||||||
|
|
|
|
|||||||||
Other comprehensive income, net of tax |
1,767 | (9,204 | ) | |||||||||
|
|
|
|
|||||||||
Total comprehensive income/(expenses) |
69,263 | 54,826 | ||||||||||
|
|
|
|
|||||||||
Attributable to owners of the parent |
67,466 | 53,218 | ||||||||||
Attributable to non-controlling interests |
1,797 | 1,607 |
Earnings per share
2024 | 2023 | |||||||
Profit for the year attributable to owners of the parent, in thousand |
65,706 | 62,386 | ||||||
Average number of shares outstanding |
880,000 | 880,000 | ||||||
|
|
|
|
|||||
Earnings per share, in |
74.67 | 70.89 | ||||||
|
|
|
|
As in the previous year, there were no exercisable conversion or option rights at 31 December 2024. The diluted earnings per share correspond to the undiluted earnings per share (see Note 2).
12
Consolidated balance sheet of OeKB Group
Assets
thousand |
Notes | 31 Dec 2024 | 31 Dec 2023 | |||||||||
Cash and cash equivalents |
16 | 939,737 | 497,877 | |||||||||
Loans and advances to banks |
17 | 20,801,429 | 21,918,340 | |||||||||
Loans and advances to customers |
17 | 2,243,855 | 2,282,332 | |||||||||
Other financial assets |
18 | 2,679,490 | 2,606,100 | |||||||||
Derivative financial instruments |
19 | 890,020 | 463,801 | |||||||||
Guarantees pursuant to § 1(2b) AFFG |
19 | 6,912,883 | 7,117,500 | |||||||||
Equity-accounted investments |
20 | 72,544 | 73,592 | |||||||||
Property, equipment, and intangible assets |
21 | 24,532 | 24,789 | |||||||||
Current tax assets |
| 663 | ||||||||||
Deferred tax assets |
25 | 53,434 | 46,539 | |||||||||
Other assets |
11,177 | 11,398 | ||||||||||
|
|
|
|
|||||||||
Balance sheet total |
34,629,102 | 35,042,931 | ||||||||||
|
|
|
|
Liabilities and equity
thousand |
Notes | 31 Dec 2024 | 31 Dec 2023 | |||||||||
Deposits from banks* |
22 | 957,783 | 1,139,829 | |||||||||
Deposits from customers* |
22 | 1,083,502 | 1,134,417 | |||||||||
Debt securities issued |
23 | 28,844,905 | 28,008,847 | |||||||||
Derivative financial instruments |
19 | 972,025 | 2,148,639 | |||||||||
Provisions |
24 | 122,899 | 129,647 | |||||||||
Current tax liabilities |
10,313 | 8,423 | ||||||||||
Other liabilities |
26 | 45,835 | 51,718 | |||||||||
EFS interest rate stabilisation provision |
27 | 1,650,594 | 1,499,465 | |||||||||
Equity attributable to owners of the parent |
922,771 | 903,705 | ||||||||||
Attributable to non-controlling interests |
18,476 | 18,241 | ||||||||||
Total equity |
28 | 941,246 | 921,946 | |||||||||
|
|
|
|
|||||||||
Balance sheet total |
34,629,102 | 35,042,931 | ||||||||||
|
|
|
|
* | These accounts were presented as Payables to Customers and Payables to Banks in the prior year. |
13
Consolidated statement of changes in equity of OeKB Group
The amounts of subscribed share capital and capital reserves shown in the following tables are the same as those reported in the financial statements of Oesterreichische Kontrollbank Aktiengesellschaft.
More information on equity is provided in Note 28.
Consolidated statement of changes in equity 2024
thousand |
Notes | Subscribed share capital |
Capital reserves |
Retained earnings |
IAS 19 - Reserve |
FVOCI - Reserve |
Equity attributable to owners of the parent |
Non- controlling interests |
Total equity | |||||||||||||||||||||||||||
As at 1 Jan 2024 |
28 | 130,000 | 3,347 | 776,134 | (26,519 | ) | 20,744 | 903,706 | 18,241 | 921,946 | ||||||||||||||||||||||||||
Profit for the year |
| | 65,706 | | | 65,706 | 1,791 | 67,496 | ||||||||||||||||||||||||||||
Other comprehensive income/(expense) |
| | | 2,386 | (626 | ) | 1,761 | 6 | 1,767 | |||||||||||||||||||||||||||
|
|
|
|
|
|
|
|
|
|
|
|
|
|
|
|
|||||||||||||||||||||
Total comprehensive income/(expenses) |
| | 65,706 | 2,386 | (626 | ) | 67,466 | 1,797 | 69,263 | |||||||||||||||||||||||||||
Dividend payments |
28 | | | (48,400 | ) | | | (48,400 | ) | (1,562 | ) | (49,963 | ) | |||||||||||||||||||||||
|
|
|
|
|
|
|
|
|
|
|
|
|
|
|
|
|||||||||||||||||||||
As at 31 Dec 2024 |
130,000 | 3,347 | 793,439 | (24,133 | ) | 20,119 | 922,771 | 18,476 | 941,246 | |||||||||||||||||||||||||||
|
|
|
|
|
|
|
|
|
|
|
|
|
|
|
|
Consolidated statement of changes in equity 2023
thousand |
Notes | Subscribed share capital |
Capital reserves |
Retained earnings |
IAS 19 - Reserve |
FVOCI - Reserve |
Equity attributable to owners of the parent |
Non- controlling interests |
Total equity | |||||||||||||||||||||||||||
As at 1 Jan 2023 |
28 | 130,000 | 3,347 | 746,466 | (16,032 | ) | 19,425 | 883,207 | 17,415 | 900,620 | ||||||||||||||||||||||||||
Profit for the year |
| | 62,386 | | | 62,386 | 1,643 | 64,029 | ||||||||||||||||||||||||||||
Other comprehensive income/(expense) |
| | | (10,488 | ) | 1,320 | (9,168 | ) | (36 | ) | (9,204 | ) | ||||||||||||||||||||||||
|
|
|
|
|
|
|
|
|
|
|
|
|
|
|
|
|||||||||||||||||||||
Total comprehensive income/(expenses) |
| | 62,386 | (10,488 | ) | 1,320 | 53,218 | 1,607 | 54,826 | |||||||||||||||||||||||||||
Dividend payments |
28 | | | (32,718 | ) | | | (32,718 | ) | (781 | ) | (33,499 | ) | |||||||||||||||||||||||
|
|
|
|
|
|
|
|
|
|
|
|
|
|
|
|
|||||||||||||||||||||
As at 31 Dec 2023 |
130,000 | 3,347 | 776,134 | (26,519 | ) | 20,744 | 903,706 | 18,241 | 921,946 | |||||||||||||||||||||||||||
|
|
|
|
|
|
|
|
|
|
|
|
|
|
|
|
14
Consolidated statement of cash flows of OeKB Group
thousand |
Notes | 2024 | 2023 | |||||||||
Profit before tax |
85,819 | 80,872 | ||||||||||
Non-cash items included in profit, and adjustments to reconcile profit with cash flows from operating activities |
||||||||||||
Depreciation on property and equipment |
21 | 3,687 | 3,452 | |||||||||
Amortisation on intangible assets |
21 | 2,258 | 1,944 | |||||||||
Change in provisions |
24 | 5,412 | 23,197 | |||||||||
Change in loan loss provisions (ECL) |
8 | 897 | 535 | |||||||||
Change in the EFS interest rate stabilisation provision |
27 | 151,129 | 13,061 | |||||||||
Change in guarantees pursuant to § 1(2b) AFFG |
19 | 204,617 | (919,060 | ) | ||||||||
Unrealised gains/losses from the measurement of other financial assets measured at fair value through profit or loss and not assigned to the EFS |
9 | (217 | ) | 644 | ||||||||
Net gain or loss from the derecognition of loans and advances measured at amortised cost |
10 | 4 | 3 | |||||||||
Share of profit or loss of equity-accounted investments, net of tax |
20 | (5,550 | ) | (11,137 | ) | |||||||
Unrealised gains/losses from foreign currency differences on financial instruments not assigned to the EFS |
9 | 126 | 372 | |||||||||
Other non-cash items |
(557,802 | ) | (308,258 | ) | ||||||||
|
|
|
|
|||||||||
Subtotal for non-cash adjustments |
(109,620 | ) | (1,114,374 | ) | ||||||||
Change in operating assets and liabilities after adjustment for non-cash components |
||||||||||||
Proceeds from the redemption of |
||||||||||||
Loans and advances to banks |
17 | 21,059,245 | 23,045,872 | |||||||||
Loans and advances to customers |
17 | 2,642,515 | 3,292,413 | |||||||||
Payments for the purchase of |
||||||||||||
Loans and advances to banks |
17 | (19,900,549 | ) | (23,703,808 | ) | |||||||
Loans and advances to customers |
17 | (2,622,111 | ) | (3,061,071 | ) | |||||||
Proceeds from |
||||||||||||
Deposits from banks |
22 | 4,915,454 | 5,342,458 | |||||||||
Deposits from customers |
22 | 2,548,994 | 2,291,710 | |||||||||
Debt securities issued |
23 | 36,551,639 | 40,810,967 | |||||||||
Repayments from the redemption of |
||||||||||||
Deposits from banks |
22 | (4,981,913 | ) | (5,156,406 | ) | |||||||
Deposits from customers |
22 | (2,599,926 | ) | (2,397,579 | ) | |||||||
Debt securities issued |
23 | (37,285,515 | ) | (39,279,300 | ) | |||||||
Lease liabilities |
21 | (1,018 | ) | (391 | ) | |||||||
Other assets from operating activities |
(6,011 | ) | (2,584 | ) |
15
thousand |
Notes | 2024 | 2023 | |||||||||
Other liabilities from operating activities |
(3,994 | ) | 8,125 | |||||||||
Interest received |
1,075,844 | 921,272 | ||||||||||
Interest paid |
(718,678 | ) | (729,117 | ) | ||||||||
Dividends received from investments in other unconsolidated companies |
11 | 3,359 | 2,569 | |||||||||
Dividends received from equity-accounted investments |
20 | 6,610 | 5,200 | |||||||||
Income tax paid |
(15,620 | ) | (12,993 | ) | ||||||||
|
|
|
|
|||||||||
Net cash from operating activities |
558,706 | 262,963 | ||||||||||
|
|
|
|
|||||||||
Proceeds from the redemption and disposal of |
||||||||||||
Other financial assets |
18 | 471,050 | 379,364 | |||||||||
Other financial assets - Other unconsolidated companies |
18 | 36 | | |||||||||
Payments for the purchase of Other financial assets - Other unconsolidated companies |
18 | | | |||||||||
of Other financial assets |
18 | (533,039 | ) | (426,584 | ) | |||||||
of Property, equipment, and intangible assets |
21 | (4,930 | ) | (3,907 | ) | |||||||
|
|
|
|
|||||||||
Net cash from investing activities |
(66,883 | ) | (51,128 | ) | ||||||||
Dividend payments |
28 | (49,963 | ) | (33,500 | ) | |||||||
|
|
|
|
|||||||||
Net cash from financing activities |
(49,963 | ) | (33,500 | ) | ||||||||
|
|
|
|
Consolidated statement of cash flows of OeKB Group
thousand |
31 Dec 2024 |
31 Dec 2023 |
||||||
Cash and cash equivalents at beginning of period |
497,877 | 319,542 | ||||||
Net cash from operating activities |
558,706 | 262,963 | ||||||
Net cash from investing activities |
(66,883 | ) | (51,128 | ) | ||||
Net cash from financing activities |
(49,963 | ) | (33,500 | ) | ||||
|
|
|
|
|||||
Cash and cash equivalents at end of period |
939,737 | 497,877 | ||||||
|
|
|
|
Further details on cash and cash equivalents and additional information on the change in the presentation of the cash flows are provided in Note 29 and Note 1.
16
Notes to the consolidated financial statements of OeKB Group
Note 1 General information
Oesterreichische Kontrollbank Aktiengesellschaft (OeKB) is a special-purpose bank with its registered office in 1010 Vienna, Am Hof 4, Austria, and was founded in 1946. OeKB is a public interest entity pursuant to § 189a 1 lit a UGB (Uniform Commercial Code).
OeKB Group comprises Oesterreichische Kontrollbank Aktiengesellschaft, Oesterreichische Entwicklungs-bank AG (OeEB), OeKB CSD GmbH (OeKB CSD), Österreichische Hotel- und Tourismusbank Gesellschaft m.b.H. (OeHT), CCP Austria Abwicklungsstelle für Börsengeschäfte GmbH (CCPA), and OeKB EH Beteiligungs-und Management AG (Acredia Versicherung AG), see also Note 38 Scope of consolidation.
Because of the unique nature of the business model of OeKB Group, the operating principles and relevant legal regulations are explained in this section to allow a better understanding of these consolidated financial statements.
OeKB Group is a group of special-purpose banks that act as service providers for the export industry, capital market (incl. the energy market), and tourism economy.
The OeKB Group business model consists of
| Export guarantees and guarantees by aval |
| Export financing and financing as a development bank of the Republic of Austria |
| Capital Market Services |
| Tourism promotion and financing. |
Export guarantees/Guarantees by aval
In this business, OeKB acts as an agent in the name of and for the account of the Republic of Austria. OeKB is responsible here for the bank- specific handling of guarantee applications, the administrative and technical processing of the guarantee agreements, and for enforcing the rights of the Republic of Austria from guarantee claims. OeKB receives a processing commission for this off-balance-sheet business segment on the basis of an agency agreement.
Legal basis: Liability according to the Export Guarantees Act (AusfFG)
According to the AusfFG, the Federal Minister of Finance is authorised until 31 December 2027 to assume guarantees in the name of the Republic of Austria for the proper fulfilment of transactions by foreign counter-parties and for the enforcement of the rights of export companies that directly or indirectly improve Austrias current account. These transactions and rights relate to projects abroad especially in the areas of environmental protection, waste disposal, and infrastructure whose realisation by domestic or foreign companies is in Austrias interests. According to § 7 AusfFG, the guarantee fee and all claims paid shall be collected by the agent of the federal government (OeKB) and credited regularly to an account of the federal government opened at the authorised agent of the federal government. Pursuant to § 8a AusfFG, OeKB will remain responsible for the processing of these guarantees (export guarantees/guarantees by aval) until the conclusion of a new agency contract.
OeKB is entitled to an adequate fee for the administration of these export guarantees (shown in fee and commission income from guarantee business, Note 7).
17
The tasks of the Austrian development bank are specified in § 9 AusfFG. Oesterreichische Entwicklungsbank AG has been commissioned to fulfil these responsibilities, and is obligated to follow the objectives and principles of Austrias development policy as set forth in the Development Cooperation Act (EZA-G). OeEBs business activities are also oriented towards the provisions of the EZA-G.
Bridging guarantees (§ 2[2]7 in conjunction with § 6a[2] ABBAG-G) for large enterprises
OeKB was handling the processing of bridging guarantees for large enterprises under the governments 19 billion corona aid fund as an agent of COVID-19-Finanzierungsagentur des Bundes GmbH (COFAG). The corona aid fund was part of the corona support measures enacted by the federal government to ensure the survival of Austrian businesses. The goal was to rapidly provide financing for Austrian companies suffering serious liquidity bottlenecks due to the corona crisis. The COFAG bridging guarantee was one of the measures that was being financed from the corona aid fund. It was issued for bullet loans extended by banks to companies to bridge their liquidity gaps. The guarantee from the Republic of Austria covered 90% of the loan amount. An appropriate fee is paid for the administration of these bridging guarantees (shown in fee and commission income from guarantee business, Note 7). It has been no longer possible to apply for new bridging guarantees since July 2022, meaning that this product is slowly phasing out.
Export Financing Scheme (EFS)
OeKB Group acts as a contractor to the Republic of Austria in significant business segments. The Republic of Austria also issues extensive guarantees for the protection of OeKB and its creditors. OeKB Group engages in no retail business and accepts no savings deposits. As an agent of the Republic of Austria, it provides refinancing to banks and financial institutions at attractive terms, and these institutions then extend this financing to their customers as export loans (delivery, purchase, and investment financing and export acceptance credit, financing of export induced domestic investments, and financing of lease arrangements of domestic exporters).
The majority of the loans and advances to banks and customers in the EFS feature a guarantee from the Republic of Austria pursuant to the AusfFG. Because of this, OeKB Group is not exposed to significant credit risk, and only minor loan loss provisions need to be formed in connection with the EFS. Because of these guarantees, the claims are subject to uniform conditions depending on the time at which the refinancing agreements were concluded. These uniform refinancing interest rates, which are published on the OeKB website, are derived from the OeKBs credit spreads. The credit spreads of OeKB are in turn dependent on the credit spreads of the Republic of Austria due to the creditor guarantee pursuant to § 1(2a) AFFG. The Export Financing Guarantees Act also permits export financing based on other guarantees and insurance policies.
In order to assist Austrian companies in overcoming the COVID-19 crisis, operating financing was extended to exporters in collaboration with the BMF in the form of special Kontrollbank refinancing facilities. The original budget that was allocated in the amount of 2 billion was increased to 3 billion due to the high demand. This assistance programme is currently expiring. The income generated in this context is recognised in net interest income (Note 6).
The Ukraine war is creating a challenging situation for Austrian companies. To support the Austrian exporters that are being impacted by this armed conflict, OeKB was offering additional credit facilities (framework 1 billion) in the form of the supplementary Kontrollbank refinancing facility (short-term working-capital loans) at the behest of the BMF. These financing facilities are currently limited to a term of no more than 2 years.
18
Aside from this scheme, OeKB Group only engages in significant lending activities in connection with tourism financing and as development bank and thus only generates significant interest income in these business segments. This means that the income of OeKB Group aside from the income generated by proprietary investments results primarily from fees and commissions for the services rendered to customers and clients.
The majority of the refinancing needed for the Export Financing Scheme is raised on the international money and capital markets, where OeKB is a respected and established issuer thanks to the guarantees provided by the federal government. Exchange rate risks exist for the most part only in connection with these long- and short-term debt securities issued. The risks are largely secured by the exchange rate guarantees of the Republic of Austria pursuant to § 1(2b) AFFG on an individual transaction basis. This means that OeKB Group bears no significant exchange rate risk from the EFS. The calculation and settlement of these exchange rate positions is conducted in agreement with the Federal Ministry of Finance (BMF) for each individual transaction. The foreign currency strategy is implemented in coordination with the BMF as part of an ongoing portfolio strategy. In some cases, the transactions are refinanced in the same currency and the exchange rates that apply to maturing liabilities are immediately applied to newly issued debt. Because of the importance and relevance of this receivable for all parties, it is being reported in a separate item (guarantees pursuant to § 1 [2b] AFFG).
Legal basis: Federal law on the financing of transactions and rights (Export Financing Guarantees Act AFFG)
Pursuant to § 1 AFFG, the Federal Minister of Finance is authorised until 31 December 2028 to issue guarantees in the name of the Republic of Austria for credit operations (bonds, loans, lines of credit, and other obligations) conducted by the authorised agent of the federal government pursuant to § 5(1) AusfFG (OeKB).
The guarantees are issued:
| to the benefit of the creditor of the agent authorised by the federal government (OeKB) for the fulfilment of its obligations under credit operations (§ 1[2a] AFFG); |
| to the benefit of the authorised agent of the federal government (OeKB) to guarantee a specific exchange rate between the euro and another currency (exchange rate risk) for the fulfilment of obligations under credit operations for the period of time during which the proceeds from the credit operation are used for financing in euros (§ 1[2b] AFFG). |
The fee provisions for the issue of guarantees by the Republic of Austria pursuant to the AFFG specify a (minimum) guarantee fee that depends on the volume of the outstanding borrowings in the Export Financing Scheme.
The EFS interest rate stabilisation provision is based on the specific purpose of and risks associated with the EFS, which is maintained as a separate accounting entity under the authorisation as an agent of the federal government under the AFFG (see § 1[1] AFFG in conjunction with § 5[1] AusfFG). It contains the surpluses from charged interest (interest income) and the net gains or losses from the measurement of the financial instruments in the EFS at fair value (net gain or loss on financial instruments measured at fair value through profit or loss). OeKB was commissioned by the Federal Ministry of Finance in 1968 to collect proceeds generated under the EFS in a separate account and to use them solely for financing the EFS as needed. This was implemented through the formation of the EFS interest rate stabilisation provision and through the annual resolutions of OeKBs Supervisory Board. The proceeds generated under the EFS cannot be accessed by the owners now or in future and may only be used by management for the purposes of the EFS. This provision reflects the fact that the proceeds from the EFS do not accrue to OeKB but are instead to be kept in
19
the EFS for the covering of risks (including in relation to the obligation to continue operating in the event that the agency agreement pursuant to § 8a AusfFG is terminated). The Federal tax office for corporations in Vienna has acknowledged the EFS interest rate stabilisation provision as a deductible debt item in so far as it is used for decreasing the effective refinancing interest rate for the EFS.
In coordination with the Federal Ministry of Finance, OeKB has decided to report the EFS interest rate stabilisation provision separately due to its specific nature (see Note 27).
Services as development bank
OeEB works on behalf of the Federal Ministry of Finance to improve living conditions for people in developing and emerging countries. The legal basis for these activities is largely defined in the Export Guarantees Act (see also Legal basis: Liability according to the Export Guarantees Act [AusfFG]). As a public agent, OeEB provides financing at near-market terms but can assume a higher degree of economic risk than commercial banks thanks to comprehensive guarantees from the Republic of Austria. OeEB acquires stakes in companies in developing and emerging countries on a fiduciary basis using federal funds and reinforces the resulting development policy effects with flanking measures. In the field of Technical Assistance Advisory, OeEB provides special financing to strengthen the development policy effects, in particular to lay the groundwork for and accompany equity investments with federal funds and investment financing from OeEB.
Services for the capital market and energy market
OeKB Group offers a wide range of services for the Austrian capital market. These include the office for the issue of government bonds of the Republic of Austria through auction, the payment and calculation office for government bonds of the Republic of Austria, the notification office pursuant to the KMG, OAM Issuer Info (storage medium for securities exchange information), ISIN code assignment, and financial data service the collection and sale of master, schedule, and price data for financial instruments, fund services (platform for data exchange), and a LEI service partnership. As part of the business activities of OeKB CSD, central depository services are offered pursuant to the EU CSD Regulation (Regulation [EU] No 909/2014). These services include the acceptance of securities from issuers for safekeeping and administration, the execution of booking orders to settle securities transactions, and the handling of payments from issuers to satisfy the claims evidenced in the securities.
Related to the core competencies in the capital market, services are also provided for the Austrian energy market. These energy market services include financial clearing and risk management services for the settlement agents in the Austrian gas and electricity market. OeKB is also active as a general clearing member on European Commodity Clearing AG (ECC), and in this capacity handles collateral management and financial processing for non-clearing members. OeKB is also admitted to eSett as a settlement bank and thus supports its customers in their trading activities on the electricity market in the Nordic countries of Denmark, Finland, Norway, and Sweden.
Services for the tourism financing and promotion services
OeHT acts as a tourism and leisure economy agency that is an Austrian funding entity and a bank. The funding awarded by OeHT is provided by public authorities. The core task of OeHT is financing investment projects by SMEs in the Austrian tourism and leisure industry. The unique feature of financing through OeHT is the federal promotion measures that are part of every offered financing product. It handles the tourism promotion operations of the federal government on behalf of the Federal Ministry for Labour and Economy. These promotion measures can take the form of guarantees, cash contributions, or subsidised interest rates.
20
OeHT is a partner institution of the European Investment Bank (EIB), which is headquartered in Luxembourg. As part of the ERDF (European Regional Development Fund), OeHT acts as the intermediary for several provinces in connection with the award of subsidised loans for tourism promotion projects. Since the onset of the COVID-19 crisis in 2020, OeHT has also been administering the Austrian promotion programmes for tourism, and leisure companies. This programme is currently expiring and the contracts are being wound down on a continuous basis. An appropriate fee is paid for the administration of these promotion programmes (shown in fee and commission income from guarantee business, Note 7).
Accounting principles
The consolidated financial statements of OeKB Group were prepared in accordance with the International Financial Reporting Standards (IFRS) as adopted by the European Union on the basis of IAS Regulation (EC) No 1606/2002. The requirements of § 59a BWG and § 245a UGB were met.
The Executive Board of OeKB is responsible for preparing the consolidated financial statements and group management report, which was signed by the Executive Board on 7 March 2025. These were acknowledged by the Supervisory Board of OeKB based on the Audit Committees recommendation.
Details about the recognition and measurement principles of OeKB Group (aside from the explanations in chapter Export Financing Scheme), including the changes made to these during the year, can be found in Note 2.
The reporting currency and functional currency of these consolidated financial statements and of OeKB Group is the euro. All amounts are indicated in thousands of euros unless specified otherwise. The tables may contain rounding differences.
In preparing its consolidated financial statements, OeKB Group orients itself towards the most important characteristics of the business model and towards the presentations of its peer organisations and the proposals of major, internationally active financial auditors on the preparation of consolidated financial statements for banks according to IFRS, which makes the consolidated financial statements easier for investors to compare.
Uncertainty in judgements and assumptions
The preparation of consolidated financial statements in accordance with the IFRS requires the Executive Board to make judgements and assumptions about future developments that can have an impact on the reported value of assets and liabilities, the disclosure of other obligations at the balance sheet date, and the reporting of earnings and expenses during the financial year.
Areas where this is necessary are:
| The assessment of the business model in which the assets are held and the assessment of whether the contractual terms of the financial asset solely represent capital payments and interest on the outstanding principal. Note 2 |
| The parameters that are used for fair value measurement are based in part on forward-looking assumptions that may fluctuate. Note 3 |
| Specifying the term of a lease: determining whether the ability to exercise termination options is sufficiently assured. Note 21 |
21
| The assessment of whether the credit risk of the financial asset has increased significantly since the first-time recognition and inclusion of forward-looking information for the determination of the expected credit loss as used to identify the impairment of financial assets. The determination of the LGD (loss given default) and the PD (probability of default) in the calculation of the impairment. Note 37 |
| Assumptions are made about the discount rate, retirement age, life expectancy, staff turnover, and future remuneration growth for the measurement of the existing pension and termination benefit obligations. Note 24 |
| The recognised amount of deferred tax assets is based on the assumption that sufficient taxable revenue will be generated in future. Note 25 |
| Assessment are made regularly as to whether obligations that are not reported on the balance sheet arising from guarantees and other commitments must be reported on the balance sheet. Note 33 |
The estimates and assumptions upon which they are based are assessed on a regular basis and conform with the respective standards. The estimates are based on past experience and other factors such as plans, expectations as at the reporting date, and projections of future events. The actual results can deviate from the assumptions and estimates when the actual conditions develop differently than was expected on the reporting date. Changes are taken into account as they occur.
Note 2 Accounting and measurement principles
New standards and amendments to be applied for the first time in 2024
With regard to new or amended standards and interpretations, only those that apply to the business activities of OeKB Group are listed with explanations.
Standards and amendments to be applied for the first time in 2024 |
First-time |
Adoption | ||||
IAS 1 (Amendment) | Classification of financial liabilities as non-current and current | 1 Jan 2024 | Yes | |||
IFRS 16 (Amendment) | Subsequent measurement under sale and leaseback arrangements | 1 Jan 2024 | Yes | |||
IAS 1 (Amendment) | Classification as current liabilities through covenants | 1 Jan 2024 | Yes | |||
IAS 7 and IFRS 7 (Amendment) | Supplier financing agreements | 1 Jan 2024 | Yes |
IAS 1 Classification of liabilities as current or non-current
These amendments to IAS 1 Presentation of Financial Statements are intended to provide greater clarity in the classification of liabilities as current or non-current. The core aspect is the term fulfilment.
The amendments have no effects on the consolidated financial statements of OeKB Group.
22
IFRS 16 Subsequent measurement of a lease liability under a sale and leaseback transaction
The amendments require the subsequent measurement of lease liabilities from a sale and leaseback transaction in a manner that ensures no profit or loss is recognised in relation to the retained right of use. Leasing arrangements that are not classified as sale and leaseback transactions are not covered by this amendment.
As the Group has concluded no sale and leaseback agreements, the amendments have no effects on the consolidated financial statements.
IAS 1 Classification as a current liability through covenants
The amendments pertain to the classification of liabilities as current or non-current liabilities that are subject to certain covenants. Covenants are terms in credit agreements that, when violated, can result in a loan being called due. The amendments in IAS 1 clarify that liabilities (debts) can only be classified as non-current if there is a right to defer repayment on or before the reporting date. Rights that cannot be exercised until after the reporting date shall not be taken into account as of the reporting date.
As OeKB Group has concluded no such contracts, the amendments have no effects on the consolidated financial statements.
IAS 7 and IFRS 7 Supplier financing agreements
The amendments pertain to disclosure rules relating to supplier financing agreements also known as supply chain financing, financing of trade payables, or reverse factoring agreements.
As the Group has concluded no such contracts, the amendments have no effects on the consolidated financial statements.
New standards and interpretations that are not yet being applied
A number of new standards and amendments to standards that were adopted by the EU are to be applied in the first financial year beginning after 31 December 2024, though earlier application is possible.
New and amended standards and interpretations |
Effective date |
Adoption | ||||
IAS 21 (Amendment) | Lack of exchangeability | 1 Jan 2025 | Yes | |||
IFRS 9 and IFRS 7 (Amendment) | Classification and measurement of financial instruments | 1 Jan 2026 | No | |||
IFRS 9 and IFRS 7 (Amendment) | Contracts referencing nature-dependent electricity | 1 Jan 2026 | No | |||
Amendments to IFRS | Annual improvements project vol. 11 for IFRS 1, IFRS 7, IFRS 9, | 1 Jan 2026 | No | |||
IFRS 10, and IAS 7 | ||||||
IFRS 18 (New) | Presentation and disclosure of information in financial statements | 1 Jan 2027 | No | |||
IFRS 19 (New/draft) | Subsidiaries without public accountability disclosures | 1 Jan 2027 | No |
23
IAS 21 Lack of exchangeability
The amendment contains guidelines and specifies when a currency is exchangeable and how the exchange rate is to be determined when it is not exchangeable. IAS 21 had not yet contained explicit rules on which exchange rate a company is required to use if the rate on the reporting date is not observable. A currency qualifies as exchangeable as soon as a company is able to exchange this currency for another currency at the time of measurement and for a specific purpose, via markets or exchange mechanisms that create enforceable rights and obligations without undue delay. A currency is not exchangeable as soon as a company can only obtain an insignificant quantity of the other currency.
As soon as the currency is not exchangeable at the time of measurement, the preparer of the financial statements estimates the rate on the reporting date as the exchange rate that would have applied for an orderly exchange transaction between market participants under the prevailing economic conditions. If this is not observable, the new rules also permit alternate estimation methods. These can be an adjustment of an observable exchange rate if this satisfies the preconditions of an orderly exchange and the transaction reflecting the economic conditions.
The preparer of the financial statements who determined the lack of exchangeability must provide information in the statements that allows the reader to assess how the lack of exchangeability of a currency impacts or may impact the financial performance, financial position, and cash flows of the company.
The amendments are to be applied (prospectively) to periods beginning on or after 1 January 2025, with early application being permitted. All effects of the first-time application of the amendments will be recognised as adaptations of the opening balance of the retained earnings if the company reports foreign currency transactions. If the company uses a different reporting currency than its functional currency, it recognises the cumulative amount of the translation differences in equity.
OeKB Group reports solely in its own functional currency. Financial assets and liabilities in foreign currencies result primarily from currencies in a highly liquid market (OeKB instrument issue currencies such as USD). If there are financial assets and liabilities in foreign currencies in less-liquid markets, these are generally related to the management of cash accounts (demand deposits) at OeKB Group, and the associated exchange rate fluctuations generally have no material impacts on the income statement of OeKB Group but are borne by the business partners of the Group.
IFRS 9 and IFRS 7 Classification and measurement of financial instruments
The adopted amendments contain a clarification of the classification of financial assets that are associated with environmental, social, and corporate governance (ESG) characteristics and similar characteristics and how such ESG characteristics in financial instruments impact subsequent recognition, in other words recognition at amortised cost or at fair value. Subsequent recognition depends on the characteristics of the cash flows of the financial asset. With the amendments, the IASB intends to clarify how the contractual cash flows of corresponding instruments are to be assessed in this context.
In addition, the amendment addresses the fulfilment of liabilities via electronic payment systems. The focus of this was problems with the application of the derecognition requirements in IFRS 9 relating to financial assets and financial liabilities in the event of electronic fund transfers. The amendments clarify at what time a financial asset or financial liability is derecognised. In addition to this, an option is introduced that allows a company to derecognise a financial liability before it delivers cash on the day of fulfilment provided that certain criteria are met.
24
With the amendments, the IASB also introduced additional disclosure requirements in terms of investments in equity instruments that are recognised at fair value through other comprehensive income and for financial instruments with certain characteristics (such as ESG objectives).
The Group has established a working group to evaluate the effects of the amendments. However, we anticipate that the amendments will have no effects on the consolidated financial statements. In addition, the provisions have not yet been adopted by the EU.
IFRS 9 and IFRS 7 Contracts referencing nature-dependent electricity
Contracts on renewable energy aim to ensure the stability of and access to renewable electricity sources. These generally involve so-called Power Purchase Agreements (PPA), which can be structured as contracts with physical electricity delivery or as virtual PPAs. The markets for electricity from renewable sources have unique characteristics. These particular market characteristics caused problems with the application of the current accounting rules, especially with long-term contracts.
As OeKB Group has no such contracts, the amendments will have no effects on the consolidated financial statements. In addition, the provisions have not yet been adopted by the EU.
Annual improvements project vol. 11
In general, the annual improvements are limited to amendments that either clarify the wording of an IFRS standard or correct relatively minor unintended consequences, mistakes, or conflicts between requirements in the standards. The amendments contained in the annual improvements pertain to:
| IFRS 1 First-time application of the International Financial Reporting Standards Recognition of hedging transactions by a first-time adopter |
| IFRS 7 Financial instruments Disclosures: |
| Gain or loss on derecognition |
| Disclosure of differences between fair value and transaction price |
| Disclosures on credit risk |
| IFRS 9 Financial instruments: |
| Derecognition of lease liabilities |
| Transaction price |
| IFRS 10 Consolidated financial statements Determination of a de facto agent |
| IAS 7 Statement of cash flows Cost method |
OeKB Group anticipates no material effects on the consolidated financial statements from the amendments. In addition, the provisions have not yet been adopted by the EU.
IFRS 18 Presentation and disclosure of information in financial statements
The primary objective of IFRS 18 is to improve the assessment of the performance of a company by increasing comparability in the depictions and will replace IAS 1 Presentation of Financial Statements. For this, there are new requirements for the income statement as to which expenses and which income must be assigned to the following, newly defined categories:
25
| Operating; |
| Investing; |
| Financing. |
The previous structuring options will no longer apply. Mandatory subtotals must be shown after the first two sections. These principles must be applied in the case of a non-specific business model. In the case of a specific business model as for OeKB Group (financial services provider, company with investment activities), the details of the disclosures differ.
In the cash flow statement, the presentation options for received and paid dividends will no longer apply, and interest and the operating profit will be prescribed as the starting point for the application of the indirect method.
Another goal of IFRS 18 is to provide useful company-specific information (publicly communicated performance indicators that are not specified in the reporting standard). To this end, there are requirements for whether and what notes information must be provided. It also adds new requirements for the principles of aggregation and disaggregation in the disclosures in the notes.
In the first year of application, the figures for the previous year must be adapted. A reconciliation table must be provided in the notes for the adaptation of the income statement.
OeKB Group will set up a working group for this to evaluate the need for adaptations and the effects on the presentation of the consolidated financial statements. The provisions have not yet been adopted by the EU.
IFRS 19 Subsidiaries without public accountability Disclosures
The new standard allows certain subsidiaries to apply the IFRS accounting standards with reduced information in the notes. IFRS 19 can be applied by a subsidiary if
| the subsidiary itself is not subject to public accountability and |
| its parent company prepares consolidated financial statements according to the IFRS. |
Public accountability applies in particular if the subsidiary has listed equity or debt instruments on a public market.
If a subsidiary applies the full IFRS in its separate or consolidated financial statements, the optional application of IFRS 19 significantly reduces the scope of information to be provided in the notes compared with the other IFRS standards. However, the rules for the recognition, measurement, and reporting of the other IFRS standards must be applied. A subsidiary that applies IFRS 19 must clearly state that IFRS 19 was applied in its explicit and unreserved statement of compliance with IFRS.
As OeKB Group is not fully included in any consolidated financial statements, the Group cannot apply IFRS 19. The provisions have not yet been adopted by the EU.
Material recognition and measurement principles
OeKB Group consistently applied the following accounting methods to all periods shown in these consolidated financial statements unless indicated otherwise.
26
A. Consolidation principles
| Business combinations |
In the case of business combinations as defined in IFRS 3, all identifiable tangible and intangible assets, liabilities, and contingent liabilities of the subsidiary are remeasured at the time of the acquisition for capital consolidation. The acquisition costs are settled with the proportionate share of the net assets at the time of the transfer of control. Non-controlling interests are calculated on the basis of the assets and liabilities measured at fair value.
| Subsidiaries |
Subsidiaries are companies controlled by OeKB. OeKB controls a company when it is subject to fluctuating returns from the company and has a right to returns from the company, and when it has the ability to influence these returns by means of the control that it exercises over the company. The assets, liabilities and equity, and income of subsidiaries are included in the consolidated financial statements from the point in time at which control begins and until the point in time at which control ends.
| Non-controlling interests |
Non-controlling interests are measured at the proportionate value of the identifiable net assets of the acquired company at the time of acquisition. Changes in a share held by the Group in a subsidiary that do not lead to a loss of control are recognised as equity transactions.
| Loss of control |
If OeKB loses control over a subsidiary, it moves the assets and liabilities of the subsidiary and all associated non-controlling interests and other components out of equity. Any profit or loss is recognised in the income statement. Every retained share in the former subsidiary is measured at fair value at the time that control is lost.
| Equity-accounted investments |
Equity-accounted investments consist of shares in joint ventures. A joint venture is a company over which OeKB Group exercises joint control through an agreement. These are recognised according to the equity method, and are initially measured at the acquisition costs including transaction costs. After initial recognition, the consolidated financial statements contain the share in the overall net gain or loss of the equity-accounted investments up to the point in time at which the significant influence or joint control ends. The relevant share of the total comprehensive income is recognised in the income statement in the item share of profit or loss of equity-accounted investments. Dividends received are recognised as a reduction of the net book value measured according to the equity method (asset swap). Based on internal and external findings, the need for any impairment charges will be evaluated annually. If need for impairment charges is determined, the asset will be written down to the impaired value. The value in use is determined on the basis of planning projections according to recognised methods.
| Transactions eliminated during consolidation |
Internal loans and advances and liabilities and all recognised income and expenses from internal transactions within the Group are eliminated during the preparation of the consolidated financial statements. In the periods presented, there were not any intercompany profits in OeKB Group that required elimination. Unrealised gains from transactions with equity-accounted investments are written off against the Groups share in the company in question. Unrealised losses are eliminated in the same manner as unrealised gains, but only if there is no evidence of impairment.
27
B. Foreign currency translations
Foreign currency transactions are first translated into the functional currency by OeKB Group using the valid exchange rate on the date of the transaction.
Monetary assets and debts denominated in a foreign currency on the reporting date are translated into the functional currency at the reference exchange rates published by the European Central Bank for the reporting date.
Indicative exchange rates as at 31 December 2024
Mid rate |
Currency | Mid rate | Currency | Mid rate | Currency | Mid rate | Currency | |||||||||||||||||||||||||
1.6772 | AUD | 0.8292 | GBP | 1.8532 | NZD | 1.0389 | USD | |||||||||||||||||||||||||
1.4948 | CAD | 8.0686 | HKD | 4.2750 | PLN | 19.6188 | ZAR | |||||||||||||||||||||||||
0.9412 | CHF | 411.3500 | HUF | 4.9743 | RON | |||||||||||||||||||||||||||
7.5833 | CNY | 163.0600 | JPY | 11.4590 | SEK | |||||||||||||||||||||||||||
25.1850 | CZK | 11.7950 | NOK | 36.7372 | TRY |
Indicative exchange rates as at 31 December 2023
Mid rate |
Currency | Mid rate | Currency | Mid rate | Currency | Mid rate | Currency | |||||||||||||||||||||||||
1.6263 | AUD | 0.8691 | GBP | 1.7504 | NZD | 1.1050 | USD | |||||||||||||||||||||||||
1.4642 | CAD | 8.6314 | HKD | 4.3395 | PLN | 20.3477 | ZAR | |||||||||||||||||||||||||
0.9260 | CHF | 382.8000 | HUF | 4.9756 | RON | |||||||||||||||||||||||||||
7.8509 | CNY | 156.3300 | JPY | 11.0960 | SEK | |||||||||||||||||||||||||||
24.7240 | CZK | 11.2405 | NOK | 32.6531 | TRY |
Non-monetary assets and debts that are measured at fair value in a foreign currency are translated at the rate valid on the date that the fair value is determined. Non-monetary items measured at the acquisition costs or production in a foreign currency are translated at the exchange rate on the date of the transaction.
Currency translation differences are recognised in the profit or loss for the period.
C. Net interest income
| Effective interest method |
Interest income and interest expenses of financial instruments measured at amortised cost are recognised through profit or loss using the effective interest method. The effective interest rate is calculated on the basis of the estimated future cash flows (incl. transaction costs) over the expected term of a financial asset or financial liability. When calculating the effective interest rate for financial assets that were not impaired at the time of acquisition, OeKB Group estimates the future cash flows taking all contractual provisions of the financial instrument but not expected credit losses (credit risks) into account. For financial assets that were impaired at the time of acquisition, a credit-adjusted effective interest rate is calculated using estimated future cash flows including expected credit losses (credit risks).
28
The calculation of the effective interest rate includes the transaction costs and the paid or received fees, which are an integral part of the effective interest rate. The transaction costs include additional costs that are directly related to the purchase or issue of a financial asset or financial liability.
| Amortised cost |
The amortised cost of a financial asset or financial liability is the amount at which the financial asset or financial liability was measured upon initial recognition less repayments and plus or less the accumulated amortisation using the effective interest method, adjusted for any credit risk provisions. The gross book value of a financial asset is the amortised cost of the financial asset before adjustment for credit risk provisions.
| Calculation of the interest income and expenses calculated using the effective interest method |
In this case, the effective interest rate is applied to the gross book value of the asset (when the asset is not impaired) or to the amortised cost of the debt.
For financial assets whose credit rating was not impaired upon initial recognition but is impaired on the reporting date (level 3), the interest income is calculated using the effective interest rate based on the amortised cost (= net basis). If the credit rating of the asset is no longer impaired, the interest income is again calculated using the gross basis.
For financial assets already impaired at the time of acquisition, the interest income is calculated by applying the credit-adjusted effective interest rate to the amortised cost of the asset. The calculation of the interest income does not revert to the gross basis, even when the credit risk of the asset improves. See Note 37 for information about when the credit rating of assets is impaired.
| Presentation on the income statement |
The interest income and expenses for financial assets and financial liabilities calculated using the effective interest method are shown on the income statement under Interest income and expenses calculated using the effective interest method.
The other interest income and expenses shown on the income statement include interest from financial assets and financial liabilities designated at fair value (FV option) and those that must be measured at fair value through profit or loss (FVTPL). The other interest income also includes reduction in expense from other negative interest, and the other interest expenses reduction in income from other negative interest.
| Charged interest and the EFS interest rate stabilisation provision |
If interest charged under EFS leads to surpluses, these are transferred to the EFS interest rate stabilisation provision according to the resolutions of the governing bodies of OeKB (allocation to the EFS interest rate stabilisation provision). Measures taken to reduce the effective refinancing rate in the scheme are charged against the EFS interest rate stabilisation provision (use of the interest rate stabilisation provision).
Corresponding to the income of the EFS, the interest allocation and use through the EFS interest rate stabilisation provision is recognised in the items Interest income calculated using the effective interest method and Other interest income (see Note 6 and Note 27).
| Guarantee pursuant to § 1(2) AFFG |
The guarantees pursuant to § 1(2) AFFG are directly related to the debt securities issued by OeKB. The expenses are calculated for each guarantee and period and recognised under interest expenses calculated using the effective interest method. If the FV option is applied to guaranteed financial liabilities, the guarantee fees are calculated for the period in question and reported in the item Other interest expenses.
29
D. Net fee and commission income
Fee and commission income and expenses, which are an integral part of the effective interest rate of a financial asset or financial liability, are included in the effective interest rate and are thus presented in the interest income. If a loan commitment is not expected to result in the payout of a loan, the associated loan commitment fee is recognised through profit or loss.
Fee and commission income is recognised in the period in which the associated service is rendered. Fee and commission expenses are recognised as an expense when the service is received.
The guarantee fees paid from the development bank to the Republic of Austria pursuant to § 9 AusfFG are related to the individual financial assets and are reported under the fee and commission expenses (see Note 7).
E. Current income from investments in other unconsolidated companies
Dividend income is recognised at the time of the decision to pay the dividend (see Note 11).
F. Net gain or loss on financial instruments measured at fair value (FV option) in the income statement (FVTPL)
The net gain or loss on financial instruments pertains to
| derivative financial instruments and guarantees pursuant to § 1(2b) AFFG that are held for hedging purposes, |
| financial assets that must be measured at FVTPL, and |
| financial assets and financial liabilities to which the FV option has been applied. |
This item contains the changes in the fair value and all currency translation differences (see Note 9).
G. Income taxes
The tax expenses consist of actual and deferred taxes. Actual taxes and deferred taxes are recognised on the income statement unless they are related to a business combination or to an item recognised directly in equity or in other comprehensive income.
Interest and penalties on income taxes, including on uncertain tax positions, are recognised according to IAS 37.
| Actual taxes pertain to the expected tax obligation or tax receivable on the taxable income for the financial year or to the tax loss, both based on the tax rates that apply on the reporting date or that will soon apply, plus all changes to the tax obligations for prior years. The amount of the expected tax obligation or tax receivable represents the best estimate taking tax uncertainties into account, if any apply. Actual tax obligations also include all tax obligations resulting from resolutions to disburse dividends. Actual tax assets and obligations are only offset according to the provisions of IAS 12.71 ff. |
30
| Deferred taxes recognised for temporary differences between the book values of the assets and debts for group accounting purposes and the amounts used for tax purposes. Deferred taxes are not recognised for |
| temporary differences arising during the initial recognition of assets or liabilities from transactions not involving business combinations and that have no impact on the earnings before taxes or the taxable income; |
| temporary differences related to shares in subsidiaries, associated companies, and joint ventures, provided that OeKB Group is in a position to control the timing of the elimination of the temporary differences and it is probable that these will not be eliminated in the foreseeable future; |
| taxable temporary differences arising during the initial recognition of goodwill. |
There are no deferred tax assets for as of yet unused tax losses.
Unrecognised deferred tax assets are re-evaluated on every reporting date and are recognised to the extent that it is probable that future taxable income will permit the realisation of these deferred tax assets.
Deferred taxes are measured on the basis of the tax rates that are expected to apply to temporary differences once they are reversed, using the tax rates that apply on the reporting date or that will apply in future.
The measurement of deferred taxes reflects the tax consequences expected by OeKB Group based on the manner of the realisation of the net book values of the assets and the repayment of the debts at the reporting date.
Deferred tax assets and deferred tax obligations are offset when the requirements for this according to IAS 12.74 ff are met.
H. Financial assets and financial liabilities
H1 Initial recognition
OeKB Group recognises the cash and cash equivalents, loans and advances to banks and loans and advances to customers, deposits from banks and deposits from customers, and debt securities issued for the first time upon conclusion of the respective contract. All other financial instruments (including the purchase of financial assets) are initially recognised on the trade date, i.e. on the date on which OeKB Group becomes a contractual party to the instrument. Financial assets and financial liabilities are initially recognised at their fair value. If an instrument must be measured at amortised cost, it is initially recognised at the fair value plus transaction costs.
The current income from the financial assets measured at amortised cost is recognised under interest income calculated using the effective interest method. All other current income (except for current income from investments in other unconsolidated companies) is recognised under the item Other interest income. If losses are incurred from negative interest, these are recognised under interest expenses calculated using the effective interest method and other interest expenses. OeKB Group holds no financial assets for trading purposes as in the prior year.
The current expenses from the financial liabilities measured at amortised cost are recognised under the item Interest expenses calculated using the effective interest method. All other current expenses are recognised under the item Other interest expenses. If budget underruns are incurred from negative interest, these are recognised under Interest income calculated using the effective interest method and Other interest income.
31
H2 Classification of financial assets
Upon initial recognition, a financial asset is recognised at amortised cost (AC), at fair value through other comprehensive income (FVOCI), or at fair value through profit or loss (FVTPL). This classification is made on the basis of
| the business model of OeKB Group for managing financial assets and |
| the characteristics of the contractual cash flows of the financial asset. |
A financial asset must be measured at amortised cost when the following conditions are met:
| The financial asset is held under a business model with the objective of holding these assets to receive the contractual cash flows, and |
| The contractual provisions of the asset lead to cash flows at set times and that solely represent the repayment of and interest payments on the outstanding principal. |
A financial asset is measured at FVOCI when the following conditions are met:
| The financial asset is held under a business model with the objective of receiving the contractual cash flows as well as of selling the assets, and |
| The contractual provisions of the asset lead to cash flows at set times and that solely represent the repayment of and interest payments on the outstanding principal. |
AC and FVOCI financial assets are initially recognised at their fair value, taking transaction costs into account.
A financial asset that is neither measured at AC nor at FVOCI must be measured at fair value through profit or loss (FVTPL).
Equity instruments must generally be measured at fair value through profit or loss. Equity instruments not held for trading purposes may also be measured at fair value through other comprehensive income. OeKB Group elected to exercise this option for all of the equity instruments it holds because they are strategic, long-term investments in other unconsolidated companies. All changes in the fair value of these equity instruments are recognised in other comprehensive income, and these cumulatively recognised value changes cannot be recycled to the income statement. Only dividend income from these equity instruments is recognised on the income statement in the item Income from investments in other unconsolidated companies.
A financial asset can be irrevocably designated as measured at fair value through profit or loss (FV option) upon initial recognition when this eliminates or significantly reduces an accounting mismatch. The affected balance sheet items can be found in Note 15.
Business model
OeKB Group assesses the objective of a business model under which an asset is held at the portfolio level on the basis of the manner in which the instrument is managed and how information is reported to management.
32
The information that is taken into account includes:
| The specified strategy and objectives for the portfolio. Especially whether the strategy aims to generate interest income, maintain a certain interest rate profile, adapt the duration of the financial assets to the term of the associated financial liabilities, or to realise the cash flows through the sale of the assets; |
| How the performance of the portfolio is assessed and reported to management; |
| The risks that influence the net gain or loss of the business model and how these risks are managed; |
| Whether the management remuneration is based on the change in the fair value of the managed assets or the received cash flows; and |
| The frequency, volume, and timing of sales in previous periods and the reasons for such sales and the expectations for future selling activity. Information about selling activity is not considered in isolation, however, but as part of an overall assessment of how the express goal of OeKB Group is achieved and how the cash flows are realised. |
Assessment as to whether contractual cash flows consist solely of principal and interest payments
For the purposes of this assessment, the principal is defined as the fair value of the financial asset upon initial recognition. Interest is defined as consideration for the fair value of the money and for the credit risk relating to the outstanding principal sum over a specific period of time and for other fundamental credit risks and costs (such as liquidity risk and administrative costs) plus the profit margin.
In assessing whether the contractual cash flows consist solely of repayment and interest, OeKB Group takes all contractual provisions of the instrument into account. This includes an assessment of whether the financial asset includes contractual provisions that could change the timing or amount of the agreed cash flows in such a manner that they no longer meet this requirement.
Reclassification
Financial assets are not reclassified after their initial recognition except during the period after OeKB Group changed its business model for the management of financial assets. No reclassifications took place during the current or prior year.
Classification of financial liabilities
Upon initial recognition, financial liabilities are generally classified as at amortised cost, except for financial guarantees and loan commitments.
A financial liability can be irrevocably designated as measured at fair value through profit or loss (FV option) upon initial recognition when this eliminates or significantly reduces an accounting mismatch. For the liabilities measured at fair value, IFRS 9 stipulates that the part of the measurement that pertains to the own credit risk must be recognised in Other comprehensive income. Because all results from the fair value measurement of financial instruments that fall under the Export Financing Scheme are reconciled under EFS interest rate stabilisation provision, this approach would lead to an accounting mismatch. For this reason, the exception allowed under IFRS 9.5.7.7 and IFRS 9.5.7.8 is used and the entire result from fair value measurement is still recognised through profit or loss on the income statement.
33
Derecognition of a financial asset
OeKB Group derecognises a financial asset when its contractual entitlement to the cash flows from the financial asset expires, or when it transfers the rights to receive the contractual cash flows into a transaction under which all risks and opportunities associated with the ownership of the financial asset are materially transferred.
When derecognising a financial asset, the difference between the net book value of the asset and the amount of received consideration (including a newly acquired asset less a new liability) plus any accumulated profit or loss, if such is recognised in OCI, is recognised on the income statement.
Any accumulated profit or loss that is recognised in OCI for equity instruments designated at FVOCI (investments in other unconsolidated companies) is not recognised on the income statement when such instruments are derecognised.
All rights and obligations arising from or retained for each share of transferred financial assets that qualifies for derecognition will be recognised as a separate asset or liability upon this transfer.
OeKB Group conducts transactions under which assets are transferred but all material risks and opportunities of the transferred assets remain with OeKB Group (such as repurchase transactions). In these cases, the transferred assets are not derecognised.
Derecognition of a financial liability
OeKB Group derecognises a financial liability when its contractual obligations have been fulfilled, or waived, or have expired.
Modification of financial assets
Modifications are adaptations to originally agreed contract terms. The effects of these adaptations are evaluated at the quantitative and qualitative level by OeKB Group. When the contractual terms of a financial asset are changed, OeKB Group assesses whether the cash flows of the modified asset differ quantitatively. If the difference is material, the original financial asset is derecognised and a new financial asset is recognised at fair value. OeKB Group primarily uses a present value comparison between the original and changed cash flow on the basis of the effective interest rate to assess the quantitative materiality. Similarly to the modification of financial liabilities, a deviation of more than 10% in this comparison qualifies the modification as material. Qualitative criteria are also taken into account in assessing the materiality of a modification, with materiality being assessed based on the object of the change. This includes currency changes, debtor changes, and contractual amendments that lead to a change in the SPPI criterion.
When the cash flows of the modified assets measured at amortised cost do not differ materially, the change does not lead to the derecognition of the financial asset. In this case, OeKB Group recalculates the gross book value of the financial asset and recognises the amount resulting from the change in the gross book value on the income statement as a modification profit or loss. As the modifications of OeKB Group are primarily market- induced modifications, these are recognised in interest income. The difference compared with the repayable amount is distributed over the remaining term of the financial asset through the effective interest rate. If such a change is made due to financial difficulties of the borrower, on the other hand, the profit or loss is reported together with the impairment in the net credit risk provisions.
34
Modification of financial liabilities
Modifications are adaptations to originally agreed contract terms. The effects of these adaptations are evaluated at the quantitative and qualitative level by OeKB Group. As described above for the modification of financial assets, a quantitative and qualitative assessment is also conducted here. If a material modification is identified, OeKB Group posts a financial liability. In this case, a new financial liability is recognised at fair value based on the changed terms. The difference between the net book value of the derecognised financial liability and the new financial liability with modified conditions is recognised on the income statement. Immaterial modifications do not result in the derecognition of the corresponding liability, though any modification gains or losses are recognised in interest income.
Offsetting of financial assets and financial liabilities
Financial assets and financial liabilities are only offset and the resulting net amount reported on the balance sheet when OeKB Group has an enforceable entitlement to offset the amounts and intends to fulfil them on a net basis or to simultaneously realise the asset and pay the debt.
Income and expenses are only reported on a net basis when this is permitted by IFRS or these gains and losses result from a group of similar transactions (such as the net credit risk provisions).
H3 Measuring the fair value
The fair value is the price at which a financial asset can be sold or a financial liability can be transferred between market participants at arms length terms on the reporting date.
A number of accounting methods and disclosures require the determination of the fair values of financial assets and financial liabilities (debts). A valuation team consisting of members of the Finance, Risk Controlling, and Treasury departments defines the methods and parameters for the measurement of the fair values. The monitoring of the measurement of fair values is centralised. Significant valuation results are reported to the Audit Committee.
OeKB Group uses market data that can be observed on active markets when possible to determine the fair values of financial assets or financial liabilities. A market is considered to be active when transactions for the financial asset or financial liability occur with sufficient frequency and volume to continuously provide price information.
When there is no listed price on an active market, OeKB Group uses valuation methods that maximise the use of relevant observable inputs and minimise the use of non-observable inputs. The selected valuation technique takes into account all factors that market participants would consider in determining a price for a transaction.
When a financial asset or financial liability that is measured at fair value has a bid rate and ask rate, the financial asset is measured at the bid rate and the financial liability at the ask rate.
OeKB Group recognises reclassifications between levels in the fair value hierarchy at the end of the reporting period in which the change occurred. No reclassifications took place during the current year (as in the prior year).
35
H4 - Impairment
OeKB Group recognises impairment charges for the expected credit loss (ECL) for the following financial instruments that are not measured at FVTPL:
| financial assets that are debt instruments; |
| outstanding guarantee commitments; |
| loan commitments. |
No impairment charges are recognised for the financial instruments classified as investments in other unconsolidated companies.
OeKB Group measures the impairment in the amount of the ECL calculated over the lifetime of the financial instruments, except for the following financial instruments for which a 12-month ECL is calculated:
| debt instruments that have a low level of credit risk at the reporting date; |
| financial instruments for which the credit risk has not risen substantially since initial recognition. |
OeKB Group considers a bond to have a low credit risk when its credit risk rating is equivalent to the generally recognised definition of investment grade.
The 12-month ECL is the portion of the ECL resulting from a default event of a financial instrument that is possible in the next 12 months after the reporting date (corresponds to stage 1 of the expected credit loss model). The lifetime ECL corresponds to the expectation of default over the entire lifetime of a financial instrument (corresponds to stage 2 and 3 of the expected credit loss model) and is applied in the event of a significant increase in credit risk.
Determining the expected credit loss (ECL)
The ECL is a probability-weighted estimation of the credit losses. It is calculated as follows:
| Financial assets that are not impaired on the reporting date: as the present value of all expected defaults (i.e. the difference between the contractually owed cash flows and the cash flows that OeKB Group expects to receive from the financial instruments); |
| Financial assets that are impaired on the reporting date: as the difference between the net book value and the present value of the estimated future cash flows; |
| Unused loan commitments/credit facilities: as the present value of the difference between the contractual cash flows owed to OeKB Group when the payout of the credit amount is demanded and the cash flows that OeKB Group expects from the financial instruments, taking into account the likelihood of utilisation; |
| Financial guarantees: the expected payments less the amounts that OeKB Group is expected to retain. |
Impaired financial assets
OeKB Group assesses every financial asset recognised at amortised cost on the reporting date to identify any impairment. A financial asset is considered to be impaired when one or more events have occurred that have a negative impact on the estimated future cash flows of the financial asset.
36
OeKB Group employs a rating assessment system and an internal borrower assessment process for the purposes of credit risk management. Counterparties are classified into 22 internal credit rating categories based on an internal rating and mapping system that draws both on external ratings from internationally recognised rating agencies (Standard & Poors, Fitch) and on internal ratings. Ratings are monitored on an ongoing basis.
The majority of loans and advances to banks and loans and advances to customers is assigned to the EFS described in Note 1. No losses have been incurred in this business model since its inception.
The criteria that a financial asset is impaired consists of the following observable data:
| Substantial financial difficulties of the borrower or issuer. |
| A contractual violation such as a default or an event in the past. |
| The restructuring of a loan by OeKB Group. |
| It is likely that the borrower will file for bankruptcy or undergo some other form of financial reorganisation (i.e. restructruring measures). |
| The loss of an active market for an item of collateral because of financial difficulties. |
A loan that is renegotiated because of a worsening in borrower status is usually classified as credit-impaired unless there is evidence that the risk of receiving no contractual cash flows has diminished substantially and there are no further indications of impairment. In addition, a loan that is more than 30 days past due is considered an indication of the impairment of the credit standing of the borrower.
OeKB Group deviates from this practice when assessing whether an investment in government bonds is creditworthy and observes the following external factors:
| The rating assessment of the market is reflected in the bond yields. |
| Rating assessments of the rating agencies. |
| The ability of the country to access the capital markets for the issue of new debt instruments. |
| The probability that debts will be restructured leads to voluntary or mandatory haircuts and thus losses for the creditors. |
| The international support mechanisms that give this country the necessary assistance as the lender of last resort, and the intention of governments and agencies to make use of these mechanisms as stated in public declarations. This includes an assessment of the effect of these mechanisms and of whether the country has the ability and political intention to meet the required criteria. |
Presentation of the impairment charges for expected credit losses on the balance sheet
| Financial assets measured at amortised cost: as a deduction from the gross book value of the assets; |
| Loan commitments and open credit facilities, financial guarantees: generally as a provision; |
| When a financial instrument contains a drawn and also an undrawn component and OeKB Group cannot calculate the ECL of the loan commitment component separately from the drawn component: reporting of a combined impairment charge for both components. The total amount is reported as a deduction from the gross book value of the drawn component. If the total of the impairment losses exceeds the gross book value of a financial instrument, the excess portion of the impairment losses is reported in the provisions. |
37
Assets with ratings below investment grade
For financial assets with ratings below investment grade upon initial recognition, the future payment flows are estimated and the changes recognised in the net credit risk provisions.
Derecognitions
Loans and bonds are (partially or fully) derecognised when there are no realistic prospects of recovery. This is generally the case when OeKB Group determines that the borrower has no assets or income sources that can generate sufficient cash flows to repay the outstanding amounts. Retired financial assets may still be subject to enforcement measures that can generate repayments to OeKB Group. Such repayments are recognised on the date of receipt.
H5 - Designation at fair value on the income statement (FVTPL) Fair value option
Financial assets
OeKB Group designated certain financial assets for recognition at FVTPL upon initial recognition because these financial assets are transactions underlying contracts with derivative financial instruments. For this reason, they are measured at fair value through profit or loss (FVTPL) to avoid an accounting mismatch.
Financial liabilities
In those cases where financial liabilities are hedged against interest or currency risks at the time of acquisition, the financial liability is designated at fair value to avoid an accounting mismatch. The net profits or losses from the fair value measurement are recognised on the income statement in the same manner as the hedging instruments.
I. Cash and cash equivalents
This item consists of cash on hand in euros and claims against central banks (deposits) that are payable on demand. This means unlimited availability without prior notice or availability with a period of notice of no more than one business day or 24 hours. The required minimum reserves are also reported in this item. The item is recognised at amortised cost.
J. Loans and advances to banks and loans and advances to customers
The balance sheet items loans and advances to banks and loans and advances to customers contain:
| Loans at amortised cost; these are reported at fair value plus incremental direct transaction costs upon initial recognition and are then measured at amortised cost applying the effective interest method over the term of the financial instrument; |
| Loans and advances that must be measured at FVTPL or that are designated at FVTPL (to avoid an accounting mismatch), with changes being recognised immediately through profit or loss on the income statement. |
38
The majority of the loans and advances to banks and part of the loans and advances to customers that are assigned to the EFS and the development bank are subject to guarantees from the Republic of Austria pursuant to the AusfFG (see also Note 1), which are integral components of the credit agreements. The integral relationship for contracts of OeEB is set forth in § 9 AusfFG. No credit agreement is concluded without a corresponding guarantee.
The majority of the loans and advances to customers relating to tourism financing and promotion are covered by guarantees from Austrian commercial banks. The remainder of these loans and advances to customers are secured by mortgages or by the Republic of Austria.
K. Other financial assets
The balance sheet item Other financial assets contains:
| Debt instruments measured at amortised cost; these are reported at fair value plus incremental direct transaction costs upon initial recognition and are then measured at amortised cost applying the effective interest method over the term of the financial instrument. |
| Debt and equity instruments that must be measured at FVTPL or that are designated at FVTPL (to avoid an accounting mismatch), with changes being recognised immediately through profit or loss on the income statement. |
| Equity instruments (investments in unconsolidated companies and investments in other unconsolidated companies) that are measured at FVOCI, with changes being recognised in other comprehensive income (no recycling through the income statement), and current income (dividend payments) are recognised in Current income from investments in other unconsolidated companies on the income statement. |
L. Hedging instruments
General
Derivative financial instruments and the guarantees pursuant to § 1(2b) AFFG (see Note 1) are used to hedge market risks. These instruments primarily protect future cash flows and future fair values against changes in interest rates and foreign exchange rates. The derivatives involved are mostly OTC interest rate swaps and OTC cross-currency interest rate swaps, which are employed as hedging instruments for loans and advances to banks, other financial assets, and debt securities issued.
Hedged financial assets and financial liabilities are measured at FVTPL to prevent an accounting mismatch. This means that the fluctuations in the value of the hedging instruments and the hedged financial assets and financial liabilities are recognised directly on the income statement (net gain or loss on financial instruments measured at fair value through profit or loss). No derivative financial instruments are held for trading purposes.
The hedge accounting provisions were not applied at OeKB Group in the financial year or in the prior year.
Derivative financial instruments
The fair value of derivative financial instruments is calculated using recognised methods. Derivatives are recognised at the trade date. Derivative financial instruments are recognised at their present values in a separate asset and liability item.
39
Credit exposures arising from fluctuations in value are secured with collaterals. As required by the EMIR (Regulation [EU] No 648/2012), the clearing of interest rate swaps has been shifted to a central counterparty (LCH London Clearing House) since the fourth quarter of 2016.
Guarantees pursuant to § 1(2b) AFFG
Guarantees of the Republic of Austria pursuant to § 1(2b) AFFG (Federal Law Gazette No 216/1981 as amended) that serve as hedges against exchange rate risks in the EFS (see Note 1) are measured at fair value and are reported in a separate asset item because of their unique nature (based on the legal regulations).
M. Property, equipment, and intangible assets
Property and equipment
Property and equipment comprises land and buildings used by the Group and fixtures, fittings, and equipment. Property and buildings used by the Group are those which are used primarily for the Groups own business operations. Spaces that cannot be used optimally for business operations are leased to third parties. Purchased software that is an integral part of the functionality of the associated system is capitalised as part of this system.
Property and equipment are recognised at cost less scheduled straight-line depreciation and accumulated impairment charges. A gain or loss from the retirement of property or equipment is recognised in the Other operating income on the income statement.
Subsequent expenses are only capitalised when the future increased economic benefit or the additional functionality will flow to OeKB Group. Ongoing repairs and maintenance are recognised as expenses.
The equipment depreciation rates are calculated so that the cost of acquisition or production less the estimated residual value will be written off over the estimated useful life on a straight-line basis. Depreciation is not recognised on land.
Depreciation methods, useful lives, and residual values are reviewed on every reporting date and adapted as necessary.
The estimated useful lives of the key equipment items for the current and comparison period are as follows:
Buildings |
40 years | |
Fixtures, fittings, and equipment |
3 to 10 years | |
IT hardware |
3 to 5 years. |
Intangible assets
Software and other intangible assets with a foreseeable useful life purchased by OeKB Group are recognised at cost less scheduled straight-line depreciation and accumulated impairment charges. Costs for internally produced software are not capitalised as the capitalisation requirements in IAS 38 are not met.
Subsequent expenditures for software are only capitalised when they increase the future economic benefits of the asset in question. All other expenditures are recognised as expenses.
40
Depreciation methods, useful lives, and residual values are reviewed on every reporting date and adapted as necessary.
Software is written off over the estimated useful life on a straight-line basis once its use begins. The estimated useful life of software for the current and comparison period is 3 to 5 years. The loan management system that was developed specifically for the purposes of OeHT in 2019 is being measured on the basis of a useful life of 6 years.
The customer relationships acquired through the purchase of OeHT in 2019 were assigned a useful life of 6 years.
N. Deposits from banks and deposits from customers
The items Deposits from banks and Deposits from customers include:
| Liabilities from cash and deposit accounts, |
| Money market business, |
| Repurchase agreements, |
| Borrowing. |
These financial liabilities are measured at amortised cost; they are reported at fair value plus incremental direct transaction costs upon initial recognition and are then measured at amortised cost applying the effective interest method over the term of the financial instrument.
OeKB Group engages in no traditional deposit-taking business and thus offers no savings accounts. This means that all accounts held by OeKB Group are related to the settlement of or holding of collateral for underlying transactions as described in Note 1.
O. Debt securities issued
Debt securities issued are generally measured at amortised cost; they are reported at fair value plus incremental direct transaction costs upon initial recognition and are then measured at amortised cost applying the effective interest method over the term of the financial instrument.
Debt securities issued are in most cases hedged against interest rate and currency risks upon origination. To avoid an accounting mismatch, these hedged debt securities issued are designated at FVTPL and the net profit or loss from measurement is recognised on the income statement in the same manner as the hedging instruments.
The majority of the debt securities issued at the reporting date feature guarantees pursuant to § 1(2a) and (2b) AFFG of the Republic of Austria (as in the prior year).
P. Provisions
Non-current employee benefit provisions
The provisions for pensions and similar obligations (termination benefits) represent post-employment benefits falling within the scope of IAS 19. The long-term employee benefit provisions contain provisions relating to the death quarter pursuant to the collective bargaining agreement for the banking industry.
41
The obligations under defined-benefit plans are measured using the projected unit credit method. Under this method, dynamic parameters are taken into account in calculating the expected benefit payments after the payable event occurs; these payments are spread over the entire average remaining years of service of the beneficiary employees. The method differentiates between interest costs (which is the amount by which the obligation increases over a given year because benefits have moved closer to payment) and service cost (benefits newly accrued by employees in the year through their employment). The service cost and interest cost are recognised in staff costs and therefore in the operating profit. By contrast, actuarial gains and losses are recognised in other comprehensive income under items that will not be reclassified into the income statement.
The calculation of the defined-benefit obligation involves actuarial assumptions regarding discount rates, salary growth rates, and pension trends as well as employee turnover, which are determined in accordance with the economic conditions. The respective discount rates are selected based on the yields of high-quality corporate bonds of an appropriate maturity and currency. The present value of the defined-benefit obligation (DBO) is recognised at its value at the balance sheet date. There are no plan assets (i.e. assets held by a fund against which to offset the DBO).
The pension obligations relate to both defined-benefit and defined-contribution plans. Defined-benefit plans consist of obligations for current and future pensions.
For a small number of senior managers, the Group still maintains defined-benefit plans that are generally based on length of service and on salary level. These defined-benefit pension plans are funded entirely through provisions.
The provisions for termination benefits relate to statutory and contractual obligations to pay the employee a specified amount on termination if certain conditions are met.
The current version of the computation tables by AVÖ 2018-P for employees are used as the biometric basis for the calculations.
Principal assumptions are the rate of salary increases taking into the changes in the collective bargaining agreement and periodic and extraordinary increases into account as well as the retirement age according to the ASVG transitional provisions pursuant to the Budget Implementation Act 2003.
Principal assumptions
2024 | 2023 | |||||||
Discount rate |
3.39 | % | 3.24 | % | ||||
Future salary growth (for termination benefits and pensions) |
3.20 | % | 3.70 | % | ||||
Future pension growth (for pensions) |
2.90 | % | 3.20 | % | ||||
Retirement age |
||||||||
Women |
65 years | 65 years | ||||||
(gradually until 2033 | ) | (gradually until 2033 | ) | |||||
Men |
65 years | 65 years |
42
OeKB Group offers most of its eligible employees the opportunity to participate in defined-contribution plans. OeKB Group is obligated to transfer a set percentage of the annual salaries to the pension institution (pension fund). Defined contribution plans do not involve any obligations beyond the payment of contributions to dedicated pension institutions. The contributions are recognised in staff costs for the period.
Other provisions
Other provisions are formed if
| OeKB Group has a legal or real obligation to a third party as a result of a past event, |
| the obligation is likely to lead to an outflow of resources, and |
| the amount of the obligation can be reliably estimated. |
Provisions are formed in the amount representing the best estimate of the expenditure required to settle the obligation. If the present value of the obligation determined on the basis of a market interest rate differs materially from its nominal amount, the present value of the obligation is used.
EFS interest rate stabilisation provision
The Austrian system of export promotion and financing is based on two special laws: the Export Guarantees Act (AusfFG) and the Export Financing Guarantees Act (AFFG). Based on these laws, the Republic of Austria commissioned OeKB to handle the technical banking aspects of the federal export promotion and financing activities. OeKB operates the EFS in its own name and for its own account. This also applies to the acceptance of financing pursuant to the AFFG and to the provision of the associated funds to the client banks (the banks of exporters that are participating in the EFS).
The EFS is thus subject to specific legal regulations and has particular characteristics that are not directly covered by any IFRS accounting standards.
The EFS interest rate stabilisation provision is based on the specific purpose of the EFS and the risk associated with this programme. OeKB was commissioned by the Federal Ministry of Finance in 1968 to collect proceeds generated under the EFS in a separate account and to use them solely for the purposes of the EFS as needed. This obligation has always been met via the annual motions of the Supervisory Board of OeKB in December of each year, and the change in the EFS interest rate stabilisation provision is posted accordingly. The proceeds generated under the EFS thus cannot be used by OeKB for other purposes or accessed by the owners now or in future and may only be employed for the purposes of the EFS. The recognition of an interest rate stabilisation provision thus reflects the fact that the surpluses accumulated under the EFS are not at the free disposal of OeKB, but are solely available for the offsetting of risks stemming from the EFS.
Since the inception of the internationally unique Export Financing Scheme, the EFS interest rate stabilisation provision has been built up from the ongoing surpluses. In coordination with the Federal Ministry of Finance, OeKB has decided to report this item separately due to its specific nature.
The decision to report this item in this specific manner was based on the following considerations by OeKB. The fact that the IFRS contain no specific rules about the recognition of the surpluses from the EFS that are allocated to the EFS interest rate stabilisation provision was taken into account in this. Assessment for recognition is also made more difficult by the fact that these funds have the character of being earmarked directly for the EFS and serve as a provision to cover possible future losses in the EFS. At the same time, there are also
43
elements that point to a certain degree of mandatory allocation. OeKB also took the perspective of its contracting authority (Republic of Austria/Federal Ministry of Finance) into account, which clearly sees an obligation on the part of its agent vis-à-vis the EFS. Thus, OeKB acts in its own name and for its own account in accepting funding under the AFFG and disbursing this funding to the banks of its clients. Under IAS 37.10ff, a provision is a liability of uncertain timing or amount. A liability is a present obligation of the company that results from past events and for which settlement is expected to result in an outflow of resources with economic value. An obligating event is an event that creates a legal or factual obligation that leaves the company with no realistic alternative to fulfilment of the obligation.
However, if the definition of IAS 32.11 stating that equity is a contract that evidences a residual interest in the assets of an entity after deducting all of its liabilities is applied to this item, the funds allocated to the EFS interest rate stabilisation provision do not meet these requirements. These funds are earmarked solely for use within the EFS.
Taking the provisions of the IFRS into account and in coordination with its contracting authority (the Federal Ministry of Finance), the management has decided to recognise the EFS interest rate stabilisation provision as a special item directly on the balance sheet between debt instruments and equity instruments, with a description in the notes. The management is thus following IAS 1 and is recognising this item directly on the balance sheet due to its special characteristics. Reporting in this manner allows OeKB to clearly show that the EFS interest rate stabilisation provision is a future obligation for the OeKB and that the shareholders have no access to these funds from the EFS. This depiction also supports the view that the funds in the EFS interest rate stabilisation provision are clearly viewed as an asset of the EFS by the OeKB and may only be used within the EFS.
The federal tax office for corporations in Vienna has acknowledged the EFS interest rate stabilisation provision as a deductible debt item in so far as it is used for decreasing the effective refinancing interest rate for the EFS. The item is thus temporarily tax exempt.
Q. Earnings per share
The calculation of the undiluted earnings per share is based on the profit for the year attributable to the ordinary shareholders and a weighted average of the number of outstanding shares.
The calculation of the diluted earnings per share is based on the profit for the year attributable to the ordinary shareholders and a weighted average of the number of outstanding shares after correction for all potential dilution effects from potential ordinary shares.
44
Note 3 Determining fair value
A number of accounting methods and disclosures of OeKB Group require the determination of the fair values of financial assets and financial liabilities. A valuation team consisting of members of the Finance, Risk Controlling, and Treasury departments measures the fair values. The monitoring of the measurement of fair values is centralised and is reported to the overall Executive Board.
OeKB Group maintains an established control framework for the determination of the fair values. Responsibility for measuring financial instruments at fair value is separate from the trading units. Specific controls cover:
| Verification of the observable prices; |
| Validation and calibration of the valuation models; |
| Review and approval process for new models and changes to existing models. |
The valuation team regularly reviews the significant non-observable input factors and the remeasurement gains and losses. Where information from third parties (such as quotations from brokers or from pricing services) is used to determine fair values, the valuation team reviews the inputs obtained from the third parties. This review includes
| whether the values obtained from a broker or price information service are generally recognised by OeKB Group; |
| the understanding of the determination of the fair value; to what extent this represents actual market transactions and whether the fair value represents a listed price for an identical instrument on an active market; |
| the understanding of how prices for similar instruments were used to measure the fair value and how these prices were adapted to account for the features of the instrument being measured; |
| if a number of price quotes were received for the same financial instrument, that the fair value was determined on the basis of these quotes. |
This supports the conclusion that such measurements meet the IFRS requirements, including the level in the fair value hierarchy to which these measurements are to be assigned.
Significant valuation results are reported to the Audit Committee.
OeKB Group uses available market data when possible to determine the fair values of assets and liabilities. Based on the input factors employed in the valuation techniques, the fair values are assigned to different levels in the fair value hierarchy:
| Level 1: Quoted prices (unadjusted) on active markets for identical assets and liabilities. |
| Level 2: Valuation parameters other than quoted prices considered in Level 1 that can be observed for the asset or the liability directly (i.e. as a price) or indirectly (i.e. as a value derived from prices). |
| Level 3: Valuation parameters for assets and liabilities that are not based on observable market data. |
For items repayable on demand, the fair value equals the net book value; this applies especially cash and cash equivalents.
45
The relevant market prices and interest rates observed at the balance sheet date and obtained from widely accepted external sources are used as far as possible as an initial parameter for determining the fair value of loans and advances to banks and loans and advances to customers, deposits from banks and deposits from customers as well as debt securities issued. The present value of the discounted contractual cash flows is calculated using this data. Financial instruments that are measured in this manner are assigned to Level 2 in the IFRS 13 fair value hierarchy.
| The majority of the loans of the EFS in the items loans and advances to banks and loans and advances to customers are subject to AusfFG guarantees from the Republic of Austria (see also Note 1). Because of the guarantees, the claims are subject to uniform conditions depending on the time at which they were concluded. In the valuation of these assets, the contractually agreed cash flows are therefore discounted using a yield curve that is observable on the market and adjusted by the credit spreads of the Republic of Austria. |
| The majority of the loans and advances to customers that relate to tourism financing are subject to guarantees from Austrian banks or guarantees from the Republic of Austria. Mortgages are in place for a small portion of the loans with an especially low level of default risk. |
The guarantees received has a material effect on the credit rating of the loans, for which reason a yield curve that is based on the credit spreads of the guarantor and that can be observed on the market is used to discount the contractually agreed cash flows when measuring the fair value of these receivables. For measuring the fair value of loans with mortgage collateral, a yield curve that is based on the credit spreads of the Republic of Austria and that can be observed on the market is used to discount the contractually agreed cash flows. This approach is in line with the business practices for loan extension, which apply stringent requirements to the acceptance of mortgage collateral and which are reflected in low customer default risk. Due to this extremely low credit risk, the approximation is based on the credit spreads of the Republic of Austria.
A margin of 81 bp (2023: 78 bp) is added to the applied yield curves for these loans and is derived from the administrative expenses for tourism financing.
| A yield curve observable on the market is used to discount the contractually agreed cash flows when determining the fair values of deposits from banks, deposits from customers, and of debt securities issued that are related to the EFS. For this, the credit spreads observable for OeKB on the market at the valuation date are taken into account. Debt securities issued under the EFS are covered by inseparable default guarantees from the Republic of Austria. These are not taken into account in the calculation of the fair value, but the credit rating of OeKB is linked closely with that of the Republic of Austria. A yield curve observable on the market is used to discount the contractually agreed cash flows when determining the fair values of deposits from banks and deposits from customers that are related to tourism financing. For this, the credit spreads derived from OeHT and observable on the market at the valuation date are taken into account. |
So other financial assets that do not fall under the hold-to-collect business model and do not meet the SPPI criterion are recognised at the fair value determined on the basis of quoted market prices. These financial instruments are assigned to Level 1 in the IFRS 13 fair value hierarchy. Some bonds relating to development financing have no market prices. In these cases, the fair value is determined by discounting the contractually agreed cash flows (Level 2).
46
OeKB Group also holds microfinance funds for the purposes of development aid. There are no listed prices for these funds. In these cases, the fair value is thus determined on a quarterly basis using the information and net asset value (NAV) obtained by the fund managers and assigned to Level 1. This NAV is the value at which the fund units are redeemed.
Investments were also made in private equity funds that focuses on equity investments in developing and emerging countries. The fair value of these funds is determined according to the IPEV valuation standards and stems primarily from valuation methods based on market price, which are assigned to Level 3. The valuation is based largely on EBITDA and P/E multipliers derived from a group of listed and comparable companies. The measurement methods used take into account company-specific information and conditions, as well as any applicable discounts for impaired marketability and control. Thus, the fair value depends largely on input factors, multipliers, and corresponding income statement figures.
Derivative financial instruments held solely for hedging purposes are measured using a standard model. This model is based on the discounted cash flow method. Under this model, the fair value is determined by discounting the contractually agreed cash flows by the current swap curve including adjustment of the credit valuation (CVA and DVA). A credit valuation adjustment (CVA) is a price estimate of the default risk of the counterparty in a financial transaction. A debt valuation adjustment (DVA) estimates the risk of an entitys own default.
In determining the CVA/DVA, OeKB Group uses the Basel method for regulatory capital from credit losses, which is based on the path-dependent multiplication of the following variables and their subsequent aggregation:
| Exposure at default: Fair values at specific future points in time; calculated using a Monte Carlo simulation. |
| Probability of default: Default probabilities at these points in time are calculated from the counterpartys CDS spreads or the companys own CDS spreads. |
| Loss given default: Estimate of the expected recovery in the case of counterparty default or own default. |
The CVA value adjustment at the reporting date was 1.6 million (2023: 0.6 million), the DVA value adjustment was 0.8 million (2023: 1.0 million).
The fair value of the guarantees pursuant to § 1(2b) AFFG (see also Note 1) is based on all future interest and principal cash flows of the debt securities issued with rate guarantees (ultimate obligations = after derivative financial instruments), which are issued in the currency of the financing and translated into euros at the rate guaranteed by the AFFG (taking the AFFG rate guarantee into account) as well as at the forward FX rate (without taking the AFFG rate guarantee into account). The difference between the euro amounts taking the AFFG rate guarantee into account and the euro amounts without taking the AFFG guarantee into account is calculated on a daily basis for each ultimate obligation and represents the potential rate difference that is covered by the guarantee of the Republic of Austria (future decisions for the application of existing exchange rates to new liabilities are handled as new agreements). The fair value of the guarantee is calculated by discounting the previously calculated time series of the potential rate differences taking the refinancing spreads of the Republic of Austria into account for negative rate differences and the refinancing curve of
47
OeKB for positive rate differences and is recognised in the item Guarantees pursuant to § 1(2b) AFFG. The CVA value adjustment for the guarantees pursuant to § 1(2b) AFFG was 59.0 million (2023: 0.8 million) and the DVA value adjustment 106.6 million as of the reporting date (2023: 7.2 million). This change results essentially from the changes in the spread of the government bond curve and the OeKB refinancing curve relative to the risk-free rate.
Financial instruments falling neither under Level 1 nor Level 2 must be assigned to a separate category (Level 3) within which the fair value is determined using special quantitative and qualitative information. Level 3 contains the private equity funds named above and the other investments in subsidiaries. The fair value of Wiener Börse AG was determined based on an appraisal according to the dividend discounted model. The parameters used to determine the fair value and the sensitivity can be found in Note 18.
The following table shows a reconciliation of the financial instruments measured at fair value in Level 3:
Reconciliation of the net book values in Level 3
thousand |
2024 | 2023 | ||||||
As at 1 January |
43,331 | 41,495 | ||||||
Additions |
| | ||||||
Disposals |
(571 | ) | | |||||
Total gains and losses |
||||||||
In other comprehensive income (net gain or loss from the fair value measurement of investments in other unconsolidated companies [FVOCI]) |
(220 | ) | 1,718 | |||||
In the income statement (net gain or loss on financial instruments measured at fair value through profit or loss) |
(881 | ) | 118 | |||||
|
|
|
|
|||||
As at 31 December |
41,659 | 43,331 | ||||||
|
|
|
|
48
The following table shows the financial instruments that are measured at fair value as at the reporting date broken down by fair value hierarchy level and the fair values of the financial instruments that are not measured at fair value. The amounts are based on the figures reported on the balance sheet.
Fair value hierarchy 2024
thousand |
Notes | Carrying amount |
Fair value | Level 1 | Level 2 | Level 3 | ||||||||||||||||||
Financial assets measured at fair value |
||||||||||||||||||||||||
Loans and advances to banks |
17 | 2,692,275 | 2,692,275 | | 2,692,275 | | ||||||||||||||||||
Bonds and other fixed income securities |
1,328,344 | 1,328,344 | 1,328,344 | | | |||||||||||||||||||
Equity shares and other variable-income securities |
419,942 | 419,942 | 414,188 | | 5,755 | |||||||||||||||||||
Investments in other unconsolidated companies |
35,904 | 35,904 | | | 35,904 | |||||||||||||||||||
|
|
|
|
|
|
|
|
|
|
|||||||||||||||
Other financial assets |
18 | 1,784,191 | 1,784,191 | 1,742,532 | | 41,659 | ||||||||||||||||||
Derivative financial instruments |
19 | 890,020 | 890,020 | | 890,020 | | ||||||||||||||||||
Guarantees pursuant to § 1(2b) AFFG |
19 | 6,912,883 | 6,912,883 | | 6,912,883 | | ||||||||||||||||||
|
|
|
|
|
|
|
|
|
|
|||||||||||||||
Financial assets not measured at fair value |
||||||||||||||||||||||||
Cash and cash equivalents |
16 | 939,737 | 939,737 | | 939,737 | | ||||||||||||||||||
Loans and advances to banks |
17 | 18,109,154 | 17,897,357 | | 17,897,357 | | ||||||||||||||||||
Loans and advances to customers |
17 | 2,243,855 | 2,244,152 | | 2,244,152 | | ||||||||||||||||||
Other financial assets |
18 | 895,299 | 899,890 | 793,995 | 105,894 | | ||||||||||||||||||
|
|
|
|
|
|
|
|
|
|
|||||||||||||||
Financial liabilities measured at fair value |
||||||||||||||||||||||||
Debt securities issued |
23 | 22,459,432 | 22,459,432 | | 22,459,432 | | ||||||||||||||||||
Derivative financial instruments |
19 | 972,025 | 972,025 | | 972,025 | | ||||||||||||||||||
|
|
|
|
|
|
|
|
|
|
|||||||||||||||
Financial liabilities not measured at fair value |
||||||||||||||||||||||||
Deposits from banks |
22 | 957,783 | 951,674 | | 951,674 | | ||||||||||||||||||
Deposits from customers |
22 | 1,083,502 | 1,083,506 | | 1,083,506 | | ||||||||||||||||||
Debt securities issued |
23 | 6,385,472 | 6,591,464 | | 6,591,464 | | ||||||||||||||||||
|
|
|
|
|
|
|
|
|
|
49
Fair value hierarchy 2023
thousand |
Notes | Carrying amount |
Fair value | Level 1 * | Level 2 * | Level 3 | ||||||||||||||||||
Financial assets measured at fair value |
||||||||||||||||||||||||
Loans and advances to banks |
17 | 2,138,262 | 2,138,262 | | 2,138,262 | | ||||||||||||||||||
Bonds and other fixed income securities * |
1,320,787 | 1,320,787 | 1,320,787 | | | |||||||||||||||||||
Equity shares and other variable-income securities |
369,565 | 369,565 | 362,930 | | 6,636 | |||||||||||||||||||
Investments in other unconsolidated companies |
36,696 | 36,696 | | | 36,696 | |||||||||||||||||||
|
|
|
|
|
|
|
|
|
|
|||||||||||||||
Other financial assets |
18 | 1,727,049 | 1,727,049 | 1,683,717 | | 43,331 | ||||||||||||||||||
Derivative financial instruments |
19 | 463,801 | 463,801 | | 463,801 | | ||||||||||||||||||
Guarantees pursuant to § 1(2b) AFFG |
19 | 7,117,500 | 7,117,500 | | 7,117,500 | | ||||||||||||||||||
|
|
|
|
|
|
|
|
|
|
|||||||||||||||
Financial assets not measured at fair value |
||||||||||||||||||||||||
Cash and cash equivalents |
16 | 497,877 | 497,877 | | 497,877 | | ||||||||||||||||||
Loans and advances to banks |
17 | 19,780,079 | 19,631,288 | | 19,631,288 | | ||||||||||||||||||
Loans and advances to customers |
17 | 2,282,332 | 2,280,545 | | 2,280,545 | | ||||||||||||||||||
Other financial assets * |
18 | 879,052 | 881,149 | 778,779 | 102,370 | | ||||||||||||||||||
|
|
|
|
|
|
|
|
|
|
|||||||||||||||
Financial liabilities measured at fair value |
||||||||||||||||||||||||
Debt securities issued |
23 | 19,346,129 | 19,346,129 | | 19,346,129 | | ||||||||||||||||||
Derivative financial instruments |
19 | 2,148,639 | 2,148,639 | | 2,148,639 | | ||||||||||||||||||
|
|
|
|
|
|
|
|
|
|
|||||||||||||||
Financial liabilities not measured at fair value |
||||||||||||||||||||||||
Deposits from banks |
22 | 1,139,829 | 1,130,827 | | 1,130,827 | | ||||||||||||||||||
Deposits from customers |
22 | 1,134,417 | 1,134,426 | | 1,134,426 | | ||||||||||||||||||
Debt securities issued |
23 | 8,662,717 | 8,839,969 | | 8,839,969 | | ||||||||||||||||||
|
|
|
|
|
|
|
|
|
|
* | The figures from 2023 were adjusted due to an error in the assignment of the level of the other financial assets. |
OeKB Group recognises reclassifications between levels in the fair value hierarchy at the end of the reporting period in which the change occurred. No reclassifications took place during the business year.
50
Note 4 Segment information
The activities of OeKB Group are presented by business segment in the following. The delineation of these segments Export Services, Capital Market Services, Tourism Services, and Other Services is based on the business model, the internal control structure, and the additional internal financial reporting to the Executive Board as the chief operating decision-making body. The definition of these segments is regularly reviewed to allocate resources to the segments and judge their performance. Key figures are profit before taxes for the year (in all segments), net interest income in Export Services and Tourism Services, and net fee and commission income in Export Services and Capital Market Services.
The Export Services segment covers the Export Financing Scheme of OeKB, the business activities of Oesterreichische Entwicklungsbank AG, and the administration of guarantees of the Republic of Austria by OeKB as authorised agent pursuant to the Export Guarantees Act. Due to the legal basis for the EFS, the regional focus of the business activities is in Austria. If foreign banks fulfil the EFS criteria, they are eligible to participate in the EFS. To be eligible for financing, the goods deliveries or services in question must result in a direct or indirect improvement to Austrias current account.
The Capital Market Services segment covers all securities and infrastructure services of OeKB for the capital market (securities data, point of contact for the fund capital gains tax reporting service, notification office pursuant to the KMG, office for the issue of government bonds) and clearing services for the energy market as well as the operations of the interests in OeKB CSD GmbH and CCPA. The current income from the investments in other unconsolidated companies is assigned to the segment when the activities of the companies in question also fall under this segment.
The Tourism Services segment contains the business activities (promotion and financing for the tourism and leisure economy) of Österreichische Hotel- und Tourismusbank Gesellschaft m.b.H. These business activities are limited to Austrian companies.
The Other Services segment consists of the proprietary trading portfolio, the income from rental, and the income from the investments in other unconsolidated companies that cannot be assigned to a different segment. The segment also contains the private credit insurance activities of OeKB Group and the administration of the COFAG COVID-19 bridging guarantees by OeKB (see also Note 1), as well as the activities related to the OeKB > ESG Data Hub.
51
Segment performance
Amounts charged for intersegmental services represent services rendered, which are provided at cost. No reconciliation of the amounts for the reportable segments to the amounts recorded in the consolidated balance sheet and consolidated statement of comprehensive income is necessary because the consolidation items are assigned directly to the segments.
Results by business segment in 2024
thousand |
Export Services |
Capital Market Services |
Tourism Services |
Other Services |
Total | |||||||||||||||
Interest income |
872,133 | 214 | 48,506 | 44,151 | 965,004 | |||||||||||||||
Interest expenses |
(769,921 | ) | (1 | ) | (37,137 | ) | (23,948 | ) | (831,006 | ) | ||||||||||
|
|
|
|
|
|
|
|
|
|
|||||||||||
Net interest income |
102,213 | 213 | 11,370 | 20,203 | 133,999 | |||||||||||||||
Fee and commission income |
18,749 | 44,598 | 6,977 | 2,090 | 72,415 | |||||||||||||||
Fee and commission expenses |
(19,644 | ) | (1,184 | ) | (2,701 | ) | (694 | ) | (24,223 | ) | ||||||||||
|
|
|
|
|
|
|
|
|
|
|||||||||||
Net fee and commission income |
(895 | ) | 43,415 | 4,276 | 1,396 | 48,193 | ||||||||||||||
Net credit risk provisions |
(355 | ) | | 66 | 9 | (280 | ) | |||||||||||||
Net gain or loss on financial instruments measured at fair value through profit or loss |
200 | (3 | ) | (1 | ) | 148 | 343 | |||||||||||||
Net gain or loss on the derecognition of financial instruments not measured at fair value through profit or loss |
(3 | ) | | | (1 | ) | (4 | ) | ||||||||||||
Current income from investments in other unconsolidated companies |
| 2,699 | | 660 | 3,359 | |||||||||||||||
Share of profit or loss of equity-accounted investments, net of tax |
| 2,011 | | 3,539 | 5,550 | |||||||||||||||
Administrative expenses |
(67,285 | ) | (28,980 | ) | (8,809 | ) | (6,548 | ) | (111,621 | ) | ||||||||||
Other operating income |
(1,649 | ) | 238 | 1,218 | 6,473 | 6,281 | ||||||||||||||
|
|
|
|
|
|
|
|
|
|
|||||||||||
Profit before tax |
32,227 | 19,593 | 8,120 | 25,879 | 85,819 | |||||||||||||||
Segment assets |
32,598,713 | 80,064 | 1,259,180 | 691,144 | 34,629,102 | |||||||||||||||
Segment liabilities |
31,808,130 | 26,150 | 1,176,274 | 677,302 | 33,687,855 | |||||||||||||||
|
|
|
|
|
|
|
|
|
|
The profit before taxes of the reportable segments is identical to the profit before taxes reported on the income statement.
52
Results by business segment in 2023
thousand |
Export Services |
Capital Market Services |
Tourism Services |
Other Services |
Total | |||||||||||||||
Interest income |
786,100 | 110 | 44,343 | 42,289 | 872,842 | |||||||||||||||
Interest expenses |
(688,130 | ) | (0 | ) | (34,677 | ) | (26,287 | ) | (749,094 | ) | ||||||||||
|
|
|
|
|
|
|
|
|
|
|||||||||||
Net interest income |
97,970 | 110 | 9,666 | 16,002 | 123,748 | |||||||||||||||
Fee and commission income |
17,587 | 41,592 | 6,500 | 1,800 | 67,480 | |||||||||||||||
Fee and commission expenses |
(19,817 | ) | (1,176 | ) | (2,717 | ) | (563 | ) | (24,273 | ) | ||||||||||
|
|
|
|
|
|
|
|
|
|
|||||||||||
Net fee and commission income |
(2,230 | ) | 40,416 | 3,783 | 1,237 | 43,206 | ||||||||||||||
Net credit risk provisions |
447 | | 270 | (36 | ) | 682 | ||||||||||||||
Net gain or loss on financial instruments measured at fair value through profit or loss |
(780 | ) | 0 | | (236 | ) | (1,016 | ) | ||||||||||||
Net gain or loss on the derecognition of financial instruments not measured at fair value through profit or loss |
(3 | ) | | | (0 | ) | (3 | ) | ||||||||||||
Current income from investments in other unconsolidated companies |
| 2,323 | | 246 | 2,569 | |||||||||||||||
Share of profit or loss of equity-accounted investments, net of tax |
| 1,490 | | 9,646 | 11,137 | |||||||||||||||
Administrative expenses |
(65,958 | ) | (24,731 | ) | (7,823 | ) | (6,102 | ) | (104,615 | ) | ||||||||||
Other operating income |
(1,570 | ) | 439 | 893 | 5,402 | 5,164 | ||||||||||||||
|
|
|
|
|
|
|
|
|
|
|||||||||||
Profit before tax |
27,876 | 20,048 | 6,789 | 26,160 | 80,872 | |||||||||||||||
Segment assets |
32,529,260 | 98,175 | 1,281,787 | 1,133,709 | 35,042,931 | |||||||||||||||
Segment liabilities |
32,062,168 | 45,967 | 1,198,497 | 814,354 | 34,120,985 | |||||||||||||||
|
|
|
|
|
|
|
|
|
|
The profit before taxes of the reportable segments is identical to the profit before taxes reported on the income statement.
53
Notes on the consolidated statement of comprehensive income of OeKB Group
Note 5 Consolidated statement of comprehensive income
Income and expenses are recognised as they accrue.
Gains and losses are influenced by fair value changes recognised through profit or loss, by impairment losses, reversal of impairment through profit or loss, exchange rate fluctuation, and derecognition.
Note 6 Net interest income
Net interest income 2024
thousand |
Amortised cost |
FVTPL (designated) |
FVTPL (mandatory) |
Total | ||||||||||||
Money market instruments |
72,304 | | | 72,304 | ||||||||||||
Credit operations |
776,630 | 112,468 | | 889,098 | ||||||||||||
Securities |
24,990 | 59,092 | 31,114 | 115,196 | ||||||||||||
Debt securities issued |
| 59 | | 59 | ||||||||||||
Allocation to or use of the EFS interest rate stabilisation provision relating to charged interest |
(413,429 | ) | 304,141 | (2,365 | ) | (111,653 | ) | |||||||||
|
|
|
|
|
|
|
|
|||||||||
Interest income |
460,496 | 475,760 | 28,749 | 965,004 | ||||||||||||
Money market instruments |
(59,207 | ) | | | (59,207 | ) | ||||||||||
Credit operations |
(24,835 | ) | (55 | ) | | (24,889 | ) | |||||||||
Securities |
| | | | ||||||||||||
Debt securities issued |
(247,526 | ) | (398,803 | ) | | (646,330 | ) | |||||||||
Guarantee fees relating to debt securities issued for guarantees purs. to § 1(2) AFFG (see Note 1) |
(23,677 | ) | (76,902 | ) | | (100,579 | ) | |||||||||
|
|
|
|
|
|
|
|
|||||||||
Interest expenses |
(355,246 | ) | (475,760 | ) | | (831,006 | ) | |||||||||
|
|
|
|
|
|
|
|
|||||||||
Net interest income |
105,250 | 0 | 28,749 | 133,999 | ||||||||||||
|
|
|
|
|
|
|
|
54
Net interest income 2023
thousand |
Amortised cost |
FVTPL (designated) |
FVTPL (mandatory) |
Total | ||||||||||||
Money market instruments |
81,860 | | | 81,860 | ||||||||||||
Credit operations |
674,721 | 86,801 | | 761,522 | ||||||||||||
Securities |
16,827 | 49,774 | 22,923 | 89,524 | ||||||||||||
Debt securities issued |
| 284 | | 284 | ||||||||||||
Allocation to or use of the EFS interest rate stabilisation provision relating to charged interest |
(297,993 | ) | 240,094 | (2,448 | ) | (60,348 | ) | |||||||||
|
|
|
|
|
|
|
|
|||||||||
Interest income |
475,414 | 376,953 | 20,475 | 872,842 | ||||||||||||
Money market instruments |
(56,486 | ) | | | (56,486 | ) | ||||||||||
Credit operations |
(24,828 | ) | (108 | ) | | (24,937 | ) | |||||||||
Securities |
| | | | ||||||||||||
Debt securities issued |
(266,409 | ) | (314,534 | ) | | (580,943 | ) | |||||||||
Guarantee fees relating to debt securities issued for guarantees purs. to § 1(2) AFFG (see Note 1) |
(24,418 | ) | (62,310 | ) | | (86,728 | ) | |||||||||
|
|
|
|
|
|
|
|
|||||||||
Interest expenses |
(372,141 | ) | (376,953 | ) | | (749,094 | ) | |||||||||
|
|
|
|
|
|
|
|
|||||||||
Net interest income |
103,273 | | 20,475 | 123,748 | ||||||||||||
|
|
|
|
|
|
|
|
The Interest income included income of 0.1 million (2023: 0.6 million) stemming from the special Kontrollbank refinancing facility launched in response to the COVID-19 crisis.
The Other interest income contains losses from negative interest in the amount of 0.1 million (2023: 0.3 million). The Interest expenses, which are calculated using the effective interest method, contain losses from negative interest in the amount of 0.2 million (2023: 0.4 million) while the Other interest expenses contain losses from negative interest in the amount of 0.1 million (2023: 0.1 million).
55
Note 7 Net fee and commission income
thousand |
2024 | 2023 | ||||||
Income from credit operations |
4,558 | 4,045 | ||||||
Expenses from credit operations |
(20,780 | ) | (20,933 | ) | ||||
|
|
|
|
|||||
Credit operations |
(16,223 | ) | (16,888 | ) | ||||
Income from securities services |
41,066 | 38,393 | ||||||
Expenses from securities services |
(1,645 | ) | (1,599 | ) | ||||
|
|
|
|
|||||
Securities services |
39,421 | 36,794 | ||||||
Income from guarantees |
20,360 | 19,133 | ||||||
Expenses from guarantees |
(1,230 | ) | (1,292 | ) | ||||
|
|
|
|
|||||
Guarantees |
19,130 | 17,841 | ||||||
Income from energy clearing |
3,292 | 3,055 | ||||||
Expenses from energy clearing |
| | ||||||
|
|
|
|
|||||
Energy clearing |
3,292 | 3,055 | ||||||
Income from other services |
3,139 | 2,852 | ||||||
Expenses from other services |
(567 | ) | (449 | ) | ||||
|
|
|
|
|||||
Other Services |
2,572 | 2,403 | ||||||
|
|
|
|
|||||
Net fee and commission income |
48,193 | 43,206 | ||||||
Of which income |
72,415 | 67,480 | ||||||
Of which expenses |
(24,223 | ) | (24,273 | ) | ||||
|
|
|
|
The fee and commission income from credit operations resulted primarily from the activities of the development bank, the servicing of the development aid loans of the Republic of Austria, and the servicing of the ERP loans through OeHT (tourism financing). Fee and commission expenses from credit operations resulted primarily from the guarantee fees paid to the Republic of Austria pursuant to the AusfFG in connection with the operations of the development bank and the tourism financing. The Republic of Austria assumed the default risk for these transactions under these guarantees. The income and expenses stemmed entirely from financial instruments that are measured at amortised cost.
The net fee and commission income from securities services resulted from the services rendered by OeKB Group for the Austrian capital market. These services pertained primarily to securities account management and the acquisition of securities transactions as well as the servicing of government bond auctions, the management of the technical infrastructure for legally required reporting relating to securities, the assignment of ISIN codes for Austrian securities, and the securities data service for master and maturity data.
56
The guarantee activities represent primarily services of the export guarantee activities provided by OeKB on behalf of the Republic of Austria (see also Note 1). The processing fees charged by OeKB are based on the guarantee fees collected for the Republic of Austria. The processing fee is recognised on an accrual basis. The guarantee business of OeKB Group also includes services related to the administration of federal government guarantees in connection with tourism financing.
At the onset of the COVID-19 crisis, the responsible ministries engaged OeKB to conduct measures to combat the crisis (see also Note 1). Fee and commission income of 0.5 million (2023: 0.5 million) was recognised for these services and relates to the processing of the guarantees for the special Kontrollbank refinancing facility. Fee and commission income of 0.8 million (2023: 0.6 million) was generated through the processing of the COFAG bridging guarantees. The fee and commission income for the OeHT services relating to processing COVID-19 assistance for tourism operations, restaurants, and leisure companies came to 1.8 million (2023: 1.4 million).
OeKB offers energy clearing services in connection with credit rating services, financial clearing, and risk management as a central and independent provider.
The net fee and commission income from the other services operations were primarily the result of collected account management and transaction fees and the remuneration for the fiduciary services relating to the development aid measures of the Republic of Austria (see also Note 35).
The following table shows fee and commission income broken down according to the most important services. The table also shows the assignment of the broken down revenue to the reportable segments of OeKB Group.
Fee and commission income pursuant to IFRS 15 2024
thousand |
Export Services | Capital Market Services |
Tourism Services |
Other Services | 2024 | |||||||||||||||
Income from |
||||||||||||||||||||
Credit operations |
1,986 | | 2,572 | | 4,558 | |||||||||||||||
Securities services |
| 41,066 | | | 41,066 | |||||||||||||||
Guarantees |
15,122 | | 4,406 | 832 | 20,360 | |||||||||||||||
Energy clearing |
58 | 3,234 | | | 3,292 | |||||||||||||||
Other services |
1,583 | 298 | | 1,258 | 3,139 | |||||||||||||||
|
|
|
|
|
|
|
|
|
|
|||||||||||
Total |
18,749 | 44,598 | 6,977 | 2,090 | 72,415 | |||||||||||||||
Of which services rendered at a specific point in time |
7,576 | 20,542 | | 738 | 28,856 | |||||||||||||||
Of which services rendered over a period of time |
11,173 | 24,056 | 6,977 | 1,353 | 43,559 | |||||||||||||||
|
|
|
|
|
|
|
|
|
|
57
Fee and commission income pursuant to IFRS 15 2023
thousand |
Export Services | Capital Market Services |
Tourism Services |
Other Services | 2023 | |||||||||||||||
Income from |
||||||||||||||||||||
Credit operations |
1,776 | | 2,269 | | 4,045 | |||||||||||||||
Securities services |
| 38,393 | | | 38,393 | |||||||||||||||
Guarantees |
14,330 | | 4,231 | 573 | 19,133 | |||||||||||||||
Energy clearing |
47 | 3,008 | | | 3,055 | |||||||||||||||
Other services |
1,434 | 191 | | 1,227 | 2,852 | |||||||||||||||
|
|
|
|
|
|
|
|
|
|
|||||||||||
Total |
17,587 | 41,592 | 6,500 | 1,800 | 67,480 | |||||||||||||||
Of which services rendered at a specific point in time |
6,410 | 19,664 | | 698 | 26,773 | |||||||||||||||
Of which services rendered over a period of time |
11,177 | 21,928 | 6,500 | 1,102 | 40,707 | |||||||||||||||
|
|
|
|
|
|
|
|
|
|
The other liabilities contained deferred liabilities relating to revenue from service contracts with customers in the amount of 16.2 million (2023: 17.2 million). These liabilities resulted mostly to fees and commissions already received in relation to export and tourism guarantees. These fees were recorded over a specific period of time in the cases where the terms of the guarantees from the Republic of Austria to be managed by OeKB Group were more than 1 year.
The income recognised in financial year 2024 from fees and commissions received in prior periods came to 5.1 million (2023: 4.6 million).
As permitted by IFRS 15, no disclosures were made about remaining service obligations that had an expected residual term of 1 year or less as at 31 Dec 2024.
58
Note 8 Credit risk provisions
This item includes impairment charges and impairment charge reversals on financial instruments that are subject to the IFRS 9 impairment model for expected credit losses. The changes in POCI assets are also shown in this item.
thousand |
2024 | 2023 | ||||||
Allocation/release of credit risk povisions (net) for |
||||||||
Loans and advances to banks |
37 | (10 | ) | |||||
Loans and advances to customers |
(59 | ) | (67 | ) | ||||
Other financial assets |
3 | (7 | ) | |||||
|
|
|
|
|||||
Allocation/release of credit risk provisions (net) |
(19 | ) | (85 | ) | ||||
Change due to stage transfer |
||||||||
Loans and advances to banks |
| | ||||||
Loans and advances to customers |
(123 | ) | (210 | ) | ||||
|
|
|
|
|||||
Change due to stage transfer |
(123 | ) | (210 | ) | ||||
Change due to present value effects, risk parameters, and model changes for |
||||||||
Loans and advances to banks |
11 | 99 | ||||||
Loans and advances to customers |
228 | 543 | ||||||
Other financial assets |
9 | (28 | ) | |||||
|
|
|
|
|||||
Change due to present value effects, risk parameters, and model changes |
247 | 614 | ||||||
Change in POCI assets for |
||||||||
Loans and advances to customers |
(356 | ) | 449 | |||||
|
|
|
|
|||||
Change in POCI assets |
(356 | ) | 449 | |||||
Transfer of the net gain or loss on financial instruments assigned to the EFS interest rate stabilisation provision |
(29 | ) | (86 | ) | ||||
|
|
|
|
|||||
Net credit risk provisions |
(280 | ) | 682 | |||||
|
|
|
|
Additional information on loan loss provisions can be found in Note 37.
59
Note 9 Net gain or loss on financial instruments measured at fair value through profit or loss
Net gain or loss from the fair value measurement of financial instruments in 2024
Financial instruments assigned to the EFS | Financial instruments not assigned to the EFS |
|||||||||||||||||||||||||||
thousand |
Fair value option |
FVTPL | Hedging transactions |
Total | FVTPL | Total | Total 2024 | |||||||||||||||||||||
Change in the fair value of the |
||||||||||||||||||||||||||||
Loans and advances to banks |
48,467 | | | 48,467 | | | 48,467 | |||||||||||||||||||||
Other financial assets |
43,688 | | | 43,688 | 217 | 217 | 43,905 | |||||||||||||||||||||
Derivative financial instruments |
| | 1,485,945 | 1,485,945 | | | 1,485,945 | |||||||||||||||||||||
Gurantees pursuant to § 1(2b) AFFG |
| | (1,316,979 | ) | (1,316,979 | ) | | | (1,316,979 | ) | ||||||||||||||||||
Debt securities issued |
(224,037 | ) | | | (224,037 | ) | | | (224,037 | ) | ||||||||||||||||||
|
|
|
|
|
|
|
|
|
|
|
|
|
|
|||||||||||||||
Change in the fair value |
(131,882 | ) | | 168,965 | 37,083 | 217 | 217 | 37,301 | ||||||||||||||||||||
Transfer of the net gain or loss on financial instruments assigned to the EFS interest rate stabilisation provision |
131,882 | | (168,965 | ) | (37,083 | ) | | | (37,083 | ) | ||||||||||||||||||
|
|
|
|
|
|
|
|
|
|
|
|
|
|
|||||||||||||||
Net gain or loss from fair value measurement |
| | | 0 | 217 | 217 | 217 | |||||||||||||||||||||
Net gain or loss from foreign exchange differences |
| | | | | 126 | 126 | |||||||||||||||||||||
Net gain or loss from fair value measurement |
| | | 0 | | 217 | 217 | |||||||||||||||||||||
|
|
|
|
|
|
|
|
|
|
|
|
|
|
|||||||||||||||
Net gain or loss on financial instruments |
| | | 0 | | 343 | 343 | |||||||||||||||||||||
|
|
|
|
|
|
|
|
|
|
|
|
|
|
60
The share of the changes in the fair value of loans and advances to banks that stems from changes in the credit spreads came to minus 30.6 million in the period (2023: minus 25.4 million) and to minus 52.8 million in total (2023: minus 22.2 million).
The share of the changes in the fair value of debt securities issued that stems from changes in the credit spreads came to minus 26.7 million in the period (2023: minus 12.4 million) and to minus 141.1 million in total (2023: minus 114.4 million).
Net gain or loss from foreign exchange differences on financial instruments in 2024
thousand |
Financial instruments assigned to the EFS |
Financial instruments not assigned to the EFS |
Total 2024 | |||||||||
Foreign exchange differences income |
135,999 | 113,593 | 249,593 | |||||||||
Foreign exchange differences expenses |
(1,245,997 | ) | (113,467 | ) | (1,359,464 | ) | ||||||
|
|
|
|
|
|
|||||||
Subtotal |
(1,109,998 | ) | 126 | (1,109,872 | ) | |||||||
Foreign exchange differences on guarantees pursuant to § 1(2b) AFFG |
1,112,362 | | 1,112,362 | |||||||||
|
|
|
|
|
|
|||||||
Transfer of the net gain or loss on financial instruments assigned to EFS to the EFS interest rate stabilisation provision |
(2,364 | ) | | (2,364 | ) | |||||||
|
|
|
|
|
|
|||||||
Net gain or loss from foreign exchange differences |
0 | 126 | 126 | |||||||||
|
|
|
|
|
|
The results from foreign exchange differences resulted primarily from the valuation of the USD for financial instruments that were not assigned to the EFS and primarily from the valuation of the CHF for financial instruments that were assigned to the EFS. Because the exchange rates are hedged with guarantees pursuant to § 1(2b) AFFG, they were largely offset through the foreign exchange differences.
61
Net gain or loss from the fair value measurement of financial instruments in 2023
Financial instruments assigned to the EFS | Financial instruments not assigned to the EFS |
|||||||||||||||||||||||||||
thousand |
Fair value option |
FVTPL | Hedging transactions |
Total | FVTPL | Total | Total 2023 | |||||||||||||||||||||
Change in the fair value of the |
||||||||||||||||||||||||||||
Loans and advances to banks |
110,723 | | | 110,723 | | | 110,723 | |||||||||||||||||||||
Other financial assets |
34,839 | | | 34,839 | (644 | ) | (644 | ) | 34,195 | |||||||||||||||||||
Derivative financial instruments |
| | (711,720 | ) | (711,720 | ) | | | (711,720 | ) | ||||||||||||||||||
Guarantees pursuant to § 1(2b) AFFG |
| | 985,115 | 985,115 | | | 985,115 | |||||||||||||||||||||
Debt securities issued |
(465,738 | ) | | | (465,738 | ) | | | (465,738 | ) | ||||||||||||||||||
|
|
|
|
|
|
|
|
|
|
|
|
|
|
|||||||||||||||
Change in the fair value |
(320,176 | ) | | 273,395 | (46,781 | ) | (644 | ) | (644 | ) | (47,425 | ) | ||||||||||||||||
Transfer of the net gain or loss on financial instruments assigned to the EFS interest rate stabilisation provision |
320,176 | | (273,395 | ) | 46,781 | | | 46,781 | ||||||||||||||||||||
|
|
|
|
|
|
|
|
|
|
|
|
|
|
|||||||||||||||
Net gain or loss from fair value measurement |
| | | 0 | (644 | ) | (644 | ) | (644 | ) | ||||||||||||||||||
Net gain or loss from foreign exchange differences |
| | | 0 | | (372 | ) | (372 | ) | |||||||||||||||||||
Net gain or loss from fair value measurement |
| | | 0 | | (644 | ) | (644 | ) | |||||||||||||||||||
|
|
|
|
|
|
|
|
|
|
|
|
|
|
|||||||||||||||
Net gain or loss on financial instruments |
| | | 0 | | (1,016 | ) | (1,016 | ) | |||||||||||||||||||
|
|
|
|
|
|
|
|
|
|
|
|
|
|
62
Net gain or loss from foreign exchange differences on financial instruments in 2023
thousand |
Financial instruments assigned to the EFS |
Financial instruments not assigned to the EFS |
Total 2023 | |||||||||
Foreign exchange differences income |
392,257 | 166,980 | 559,237 | |||||||||
Foreign exchange differences expenses |
(326,655 | ) | (167,352 | ) | (494,006 | ) | ||||||
|
|
|
|
|
|
|||||||
Subtotal |
65,603 | (372 | ) | 65,230 | ||||||||
Foreign exchange differences on guarantees pursuant to § 1(2b) AFFG |
(66,055 | ) | | (66,055 | ) | |||||||
|
|
|
|
|
|
|||||||
Transfer of the net gain or loss on financial instruments assigned to EFS to the EFS interest rate stabilisation provision |
453 | | 453 | |||||||||
|
|
|
|
|
|
|||||||
Net gain or loss from foreign exchange differences |
0 | (372 | ) | (372 | ) | |||||||
|
|
|
|
|
|
Note 10 Net gain or loss on the derecognition of financial instruments not measured at fair value through profit or loss
No assets measured at amortised cost were sold during the reporting period (2023: zero).
Note 11 Current income from investments in other unconsolidated companies
The current income from investments in other unconsolidated companies in the amount of 3.4 million (2023: 2.6 million) includes income from dividends from equity instruments not held for trading purposes, which are measured at fair value through other comprehensive income. These are strategic, long-term investments in other unconsolidated companies. The dividend income in the reporting period did not pertain to any significant equity holdings that were sold or otherwise derecognised.
OeKB did not reclassify accumulated profits and losses from other comprehensive income to equity during the reporting period. No material equity holdings were sold or otherwise derecognised during the reporting period.
Details on the net book value and corresponding fair value can be found in Note 38 Scope of consolidation. Changes in the fair value are shown in Other comprehensive income.
63
Note 12 Administrative expenses
Administrative expenses
thousand |
2024 | 2023 | ||||||
Salaries |
(51,358 | ) | (47,675 | ) | ||||
Social security costs |
(11,534 | ) | (10,997 | ) | ||||
Expenses for retirement benefits and social security costs |
(7,886 | ) | (8,222 | ) | ||||
|
|
|
|
|||||
Staff costs |
(70,778 | ) | (66,895 | ) | ||||
Business space costs |
(8,281 | ) | (8,618 | ) | ||||
Office operations and communication |
(373 | ) | (353 | ) | ||||
IT expenses |
(15,609 | ) | (12,490 | ) | ||||
Vocational training |
(713 | ) | (635 | ) | ||||
Travel and vehicle fleet |
(1,101 | ) | (862 | ) | ||||
Advertising, dues, business contact |
(1,236 | ) | (1,093 | ) | ||||
Data services |
(1,950 | ) | (1,866 | ) | ||||
Legal consulting, auditing (incl. EFS expenses) and insurance |
(4,552 | ) | (3,273 | ) | ||||
Of which for the auditor: Audit of the consolidated and annual financial statements |
(484 | ) | (453 | ) | ||||
Of which for the auditor: Audit-related activities |
(354 | ) | (160 | ) | ||||
Of which for companies affiliated with the auditor: Other consulting |
(25 | ) | | |||||
Other administrative expenses (property and equipment) |
(1,082 | ) | (3,134 | ) | ||||
|
|
|
|
|||||
Administrative expenses (property and equipment) |
(34,898 | ) | (32,324 | ) | ||||
Depreciation and amortisation of property, equipment, and intangible assets |
(5,945 | ) | (5,396 | ) | ||||
|
|
|
|
|||||
Administrative expenses |
(111,621 | ) | (104,615 | ) | ||||
|
|
|
|
Staff costs increased by 5.8% compared to the prior period. This increase resulted primarily from the wage increases in the collective bargaining agreements, which necessitated the adaptation of employee salaries.
The increase in other administrative expenses stemmed from higher spending for digitalisation projects, especially relating to cyber security, and from higher outlay for legal and consulting services.
The increase in depreciation and amortisation for property and equipment and intangible assets resulted from an increase in fixtures, fittings, and equipment relating to new furnishings (Future Office) and an increase in completed digitilisation projects in the current year, resulting in a higher rate of depreciation. Completed digitalisation projects also lead to an increase in the amounts written off.
The expenses for the auditor in the amount of 0.9 million (2023: 0.6 million) consist of the costs for the auditing of the consolidated and separate annual financial statements, the expenses for audit-related activities in the context of the issuance activity of Oesterreichische Kontrollbank Aktiengesellschaft for the EFS, and other services from the network of the auditor.
64
Note 13 Other operating income
Other operating income related largely to service fees received by OeKB for providing outsourced services (such as Finance, IT Services, People & Culture, ESG Data Hub, and other services) and income from input VAT deduction.
The Other operating expenses related mainly to the bank stability tax paid to the fiscal authorities of the Republic of Austria.
The following table shows those parts of other operating income that stem from contracts with customers in accordance with IFRS 15. These were allocated to the reportable segments of OeKB Group and broken down by the time of realisation of proceeds.
Other income pursuant to IFRS 15 2024
thousand |
Export Services | Capital Market Services |
Tourism Services |
Other Services | 2024 | |||||||||||||||
Assigned staff |
| | | 245 | 245 | |||||||||||||||
Billed services |
279 | 606 | 125 | 1,900 | 2,909 | |||||||||||||||
|
|
|
|
|
|
|
|
|
|
|||||||||||
Other revenue |
279 | 606 | 125 | 2,145 | 3,155 | |||||||||||||||
Of which services rendered at a specific point in time |
| 179 | | | 179 | |||||||||||||||
Of which services rendered over a period of time |
279 | 427 | 125 | 2,145 | 2,975 | |||||||||||||||
|
|
|
|
|
|
|
|
|
|
|||||||||||
Other income pursuant to IFRS 15 2023 |
|
|||||||||||||||||||
thousand |
Export Services | Capital Market Services |
Tourism Services |
Other Services | 2023 | |||||||||||||||
Assigned staff |
| | | 217 | 217 | |||||||||||||||
Billed services |
284 | 656 | 568 | 1,579 | 3,087 | |||||||||||||||
|
|
|
|
|
|
|
|
|
|
|||||||||||
Other revenue |
284 | 656 | 568 | 1,796 | 3,304 | |||||||||||||||
Of which services rendered at a specific point in time |
| 135 | | | 135 | |||||||||||||||
Of which services rendered over a period of time |
284 | 521 | 568 | 1,796 | 3,170 | |||||||||||||||
|
|
|
|
|
|
|
|
|
|
As permitted by IFRS 15, no disclosures were made about remaining service obligations that had an expected residual term of 1 year or less as at 31 Dec 2024.
65
Note 14 Income taxes
Income taxes are recognised and calculated in accordance with IAS 12. Income tax entitlements and obligations are gathered using the locally applicable tax rates of 23% for the financial year 2024 and onward (2023: 24%). Deferred taxes are calculated using the liability concept. Under this approach, the book values of the assets and liabilities in the IFRS balance sheet are compared with the respective values that are relevant for the taxation of the respective group company. Differences in these values lead to temporary differences that are recognised as deferred tax assets or liabilities (see also Note 25).
Tax recognised in profit or loss
thousand |
2024 | 2023 | ||||||
Current year |
(25,803 | ) | (20,727 | ) | ||||
Adjustment for previous years |
77 | 176 | ||||||
|
|
|
|
|||||
Total current tax expenses |
(25,726 | ) | (20,550 | ) | ||||
Change in recognised deductible temporary differences |
7,403 | 3,708 | ||||||
|
|
|
|
|||||
Net deferred taxes/tax income |
7,403 | 3,708 | ||||||
|
|
|
|
|||||
Income tax |
(18,323 | ) | (16,842 | ) | ||||
Other taxes |
| | ||||||
|
|
|
|
|||||
Total |
(18,323 | ) | (16,842 | ) | ||||
|
|
|
|
Tax recognised in other comprehensive income
thousand |
2024 | 2023 | ||||||
Actuarial gains/losses on defined benefit plans |
(710 | ) | 3,190 | |||||
Net gain or loss from the fair value measurement of investments in other unconsolidated companies (FVOCI) |
202 | (394 | ) | |||||
|
|
|
|
|||||
Total |
(508 | ) | 2,796 | |||||
|
|
|
|
Change in deferred taxes
thousand |
2024 | 2023 | ||||||
Change in deferred taxes on the income statement |
7,403 | 3,708 | ||||||
Change in deferred taxes in other comprehensive income |
(508 | ) | 2,796 | |||||
|
|
|
|
|||||
Total |
6,895 | 6,504 | ||||||
|
|
|
|
66
The actual taxes are calculated on the tax base for the financial year at the local tax rates applicable to the respective group company.
The taxation at the standard local rates is reconciled with the reported actual income taxes in the table. OeKB Group believes that its provisions for taxes are adequate for all open tax years based on its assessment of many factors including interpretations of tax law and prior experience.
Effective tax rate reconciliation
thousand |
2024 | 2023 | ||||||||||||||
Profit before tax |
85,819 | 100.0 | % | 80,872 | 100.0 | % | ||||||||||
Tax expenses at the domestic tax rate of the company |
(19,738 | ) | (23.0 | )% | (19,409 | ) | (24.0 | )% | ||||||||
Non-deductible expenses |
(266 | ) | (0.3 | )% | (410 | ) | (0.5 | )% | ||||||||
Tax-exempt income |
2,293 | 2.7 | % | 1,841 | 2.3 | % | ||||||||||
Change in recognised deductible temporary differences |
(649 | ) | (0.8 | )% | 1,031 | 1.3 | % | |||||||||
Input taxes |
(39 | ) | 0.0 | % | (71 | ) | (0.1 | )% | ||||||||
Income tax payments for previous years |
77 | 0.1 | % | 176 | 0.2 | % | ||||||||||
|
|
|
|
|
|
|
|
|||||||||
Total |
(18,323 | ) | (21.4 | )% | (16,842 | ) | (20.8 | )% | ||||||||
|
|
|
|
|
|
|
|
The above tax rate change will lead to no material result for OeKB Group.
OeKB Group applied the temporary exception from the accounting rules for deferred taxes in IAS 12 published by the IASB in May 2023. Thus, no deferred taxes relating to the income taxes under the pillar two rules are being reported and no related information is being disclosed.
The Minimum Tax Act was promulgated on 30 December 2023 in Federal Law Gazette I No 187/2023, enacting the Federal Law of the Republic of Austria on Ensuring a Global Minimum Tax for Corporate Groups and amending the Federal Fiscal Code and Austrian Uniform Commercial Code, and thus applies as of 31 December 2023. The goal of the provisions is to ensure that companies that are part of a group that generates worldwide annual revenue of at least 750.0 million pay a minimum global income tax. According to the law, the parent company of the group (Oesterreichische Kontrollbank Aktiengesellschaft, Vienna) must pay an additional tax on the profits of its subsidiaries that are taxed at an effective tax rate of less than 15%. The legal jurisdictions in which this tax can be collected are limited exclusively to Austria. The federal law applies to the Group no earlier than the financial year beginning on 1 January 2025 because the Group surpassed the threshold of 750.0 million in annual revenue in 2023 for the first time and exceeded this threshold in 2024 as well. As all members of OeKB Group are subject to an effective tax rate of over 15%, we expect no additional tax expenses from the global minimum tax for corporate groups at this time. The Group is still assessing the effects of the law on the pillar two rules on the future earnings capacity of the Group.
67
Notes on the consolidated balance sheet of OeKB Group
Note 15 Financial instruments
Classification of financial assets and financial liabilities
The following tables show a breakdown of the financial assets and financial liabilities by category according to IFRS 9. The methods and results of the ECL calculation are explained in Note 37.
Financial instruments by IFRS 9 category as at 31 December 2024
thousand |
Notes | At amortised cost |
FVOCI (designated) |
FVTPL (mandatory) |
FVTPL (designated) |
Total | ||||||||||||||||||
Assets |
||||||||||||||||||||||||
Cash and cash equivalents |
16 | 939,737 | | | | 939,737 | ||||||||||||||||||
Loans and advances to banks |
17 | 18,109,154 | | | 2,692,275 | 20,801,429 | ||||||||||||||||||
Loans and advances to customers |
17 | 2,243,855 | | | | 2,243,855 | ||||||||||||||||||
Other financial assets |
18 | 895,299 | 35,904 | 419,942 | 1,328,344 | 2,679,490 | ||||||||||||||||||
Derivative financial instruments |
19 | | | 890,020 | | 890,020 | ||||||||||||||||||
Guarantees pursuant to § 1(2b) AFFG |
19 | | | 6,912,883 | | 6,912,883 | ||||||||||||||||||
|
|
|
|
|
|
|
|
|
|
|||||||||||||||
Total |
22,188,045 | 35,904 | 8,222,845 | 4,020,620 | 34,467,415 | |||||||||||||||||||
Liabilities and equity |
||||||||||||||||||||||||
Deposits from banks |
22 | 957,783 | | | | 957,783 | ||||||||||||||||||
Deposits from customers |
22 | 1,083,502 | | | | 1,083,502 | ||||||||||||||||||
Debt securities issued |
23 | 6,385,472 | | | 22,459,432 | 28,844,905 | ||||||||||||||||||
Derivative financial instruments |
19 | | | 972,025 | | 972,025 | ||||||||||||||||||
|
|
|
|
|
|
|
|
|
|
|||||||||||||||
Total |
8,426,757 | | 972,025 | 22,459,432 | 31,858,215 | |||||||||||||||||||
|
|
|
|
|
|
|
|
|
|
68
Financial instruments by IFRS 9 category as at 31 December 2023
thousand |
Notes | At amortised cost |
FVOCI (designated) |
FVTPL (mandatory) |
FVTPL (designated) |
Total | ||||||||||||||||||
Assets |
||||||||||||||||||||||||
Cash and cash equivalents |
16 | 497,877 | | | | 497,877 | ||||||||||||||||||
Loans and advances to banks |
17 | 19,780,079 | | | 2,138,262 | 21,918,340 | ||||||||||||||||||
Loans and advances to customers |
17 | 2,282,332 | | | | 2,282,332 | ||||||||||||||||||
Other financial assets |
18 | 879,052 | 36,696 | 369,565 | 1,320,787 | 2,606,100 | ||||||||||||||||||
Derivative financial instruments |
19 | | | 463,801 | | 463,801 | ||||||||||||||||||
Guarantees pursuant to § 1(2b) AFFG |
19 | | | 7,117,500 | | 7,117,500 | ||||||||||||||||||
|
|
|
|
|
|
|
|
|
|
|||||||||||||||
Total |
23,439,339 | 36,696 | 7,950,867 | 3,459,049 | 34,885,951 | |||||||||||||||||||
Liabilities and equity |
||||||||||||||||||||||||
Deposits from banks |
22 | 1,139,829 | | | | 1,139,829 | ||||||||||||||||||
Deposits from customers |
22 | 1,134,417 | | | | 1,134,417 | ||||||||||||||||||
Debt securities issued |
23 | 8,662,717 | | | 19,346,129 | 28,008,847 | ||||||||||||||||||
Derivative financial instruments |
19 | | | 2,148,639 | | 2,148,639 | ||||||||||||||||||
|
|
|
|
|
|
|
|
|
|
|||||||||||||||
Total |
10,936,963 | | 2,148,639 | 19,346,129 | 32,431,732 | |||||||||||||||||||
|
|
|
|
|
|
|
|
|
|
Note 16 Cash and cash equivalents
The recognition and measurement principles are shown in Note 2.
thousand |
31 Dec 2024 |
31 Dec 2023 |
||||||
Balances at central banks |
939,736 | 497,874 | ||||||
Cash |
1 | 3 | ||||||
|
|
|
|
|||||
Cash and cash equivalents |
939,737 | 497,877 | ||||||
|
|
|
|
The minimum reserves amounted to 68.3 million as at 31 Dec 2024 (31 Dec 2023: 77.1 million) and were included in the balances at central banks.
The cash and cash equivalents serve to provide for the minimum reserves and to ensure the liquidity of OeKB Group.
69
Note 17 Loans and advances to banks and loans and advances to customers
The recognition and measurement principles are shown in Note 2. The classification according to IFRS 9 is indicated in Note 15. The breakdown by rating category is presented in Note 37.
Loans and advances to banks
Repayable on demand | Other maturities | Total | ||||||||||||||||||||||
thousand |
31 Dec 2024 | 31 Dec 2023 | 31 Dec 2024 | 31 Dec 2023 | 31 Dec 2024 | 31 Dec 2023 | ||||||||||||||||||
Domestic banks |
15,727 | 34,151 | 18,689,219 | 18,740,352 | 18,704,947 | 18,774,503 | ||||||||||||||||||
Foreign banks |
292,419 | 1,373,380 | 1,804,064 | 1,770,457 | 2,096,483 | 3,143,837 | ||||||||||||||||||
|
|
|
|
|
|
|
|
|
|
|
|
|||||||||||||
Loans and advances to banks |
308,147 | 1,407,531 | 20,493,283 | 20,510,809 | 20,801,429 | 21,918,340 | ||||||||||||||||||
|
|
|
|
|
|
|
|
|
|
|
|
The item Loans and advances to banks pertains to the loans of the Export Financing Scheme with net book values of 20.2 billion (2023: 20.0 billion).
At the reporting date, 15.1 million (2023: 31.0 million) had been tapped under the special Kontrollbank refinancing facility launched as part of the efforts to combat the COVID-19 crisis (see also Note 1). The average utilisation of the volume in the financial year was 20.9 million (2023: 220.1 million).
Loans and advances to customers
Domestic customers | Foreign customers | Total | ||||||||||||||||||||||
thousand |
31 Dec 2024 | 31 Dec 2023 | 31 Dec 2024 | 31 Dec 2023 | 31 Dec 2024 | 31 Dec 2023 | ||||||||||||||||||
States or government-affiliated organisations |
5,881 | 8,056 | 44,278 | 65,539 | 50,159 | 73,595 | ||||||||||||||||||
Others |
1,215,022 | 1,234,490 | 978,675 | 974,248 | 2,193,696 | 2,208,737 | ||||||||||||||||||
|
|
|
|
|
|
|
|
|
|
|
|
|||||||||||||
Loans and advances to customers |
1,220,902 | 1,242,546 | 1,022,953 | 1,039,786 | 2,243,855 | 2,282,332 | ||||||||||||||||||
|
|
|
|
|
|
|
|
|
|
|
|
70
Note 18 Other financial assets
The recognition and measurement principles are shown in Note 2. The classification according to IFRS 9 is indicated in Note 15.
Other financial assets
thousand |
31 Dec 2024 | 31 Dec 2023 | ||||||
Treasury bills |
1,490,232 | 1,365,420 | ||||||
Fixed-income securities from public-sector issuers |
| | ||||||
Bonds |
733,411 | 834,419 | ||||||
|
|
|
|
|||||
Bonds and other fixed income securities |
2,223,643 | 2,199,839 | ||||||
Investment certificates |
419,942 | 369,565 | ||||||
|
|
|
|
|||||
Equity shares and other variable-income securities |
419,942 | 369,565 | ||||||
Investments in unconsolidated subsidiaries |
4,788 | 5,475 | ||||||
Investments in other unconsolidated companies |
31,117 | 31,221 | ||||||
|
|
|
|
|||||
Investments in other unconsolidated companies |
35,904 | 36,696 | ||||||
Other financial assets |
2,679,490 | 2,606,100 | ||||||
|
|
|
|
Of the bonds and other fixed income securities, 2,124 million are listed (2023: 2,104 million) and 502.0 million will come due in the following year (2023 for 2024: 401.2 million).
The Other financial assets (investment certificates) included units in private equity funds in the amount of 5.8 million (2023: 6.6 million). As the fair value is particularly dependent on unobservable parameters, a change in these parameters may lead to different valuation results. Parameters that reflect the actual market conditions at the reporting date were used for the recognition. Changes in the applied EBITDA and P/E multipliers were primarily assessed to determine possible effects. A decrease (an increase) in these market multipliers would cause lower (higher) fair values. These private equity funds are secured by guarantees from the Republic of Austria, which means that potential losses of value are covered. As profits are allocated without undue delay and losses are hedged, no sensitivities are indicated for these assets due to immateriality.
The Investments in other unconsolidated companies included Wiener Börse AG (WBAG) at 27.8 million (2023: 28.1 million). Wiener Börse (the Vienna Stock Exchange) helds 99.54% on Burza cenných papírů Praha, a.s., Prague (the Prague Stock Exchange). The recognised value of Wiener Börse is based on a valuation conducted on 31 December 2024 using the dividend discounted model.
71
The most important assumptions in the valuation were:
2024 | 2023 | |||||||||||||||
Vienna Stock Exchange |
Prague Stock Exchange |
Vienna Stock Exchange |
Prague Stock Exchange |
|||||||||||||
Free cash flows |
4 years | 4 years | 4 years | 4 years | ||||||||||||
WACC |
7.95 | % | 8.35 | % | 7.96 | % | 9.26 | % |
Sensitivity analyses
2024 | 2023 | |||||||||||||||
thousand |
Vienna Stock Exchange |
Prague Stock Exchange |
Vienna Stock Exchange |
Prague Stock Exchange |
||||||||||||
Change in WACC |
||||||||||||||||
WACC increases |
1.00 | % | 1.00 | % | 1.00 | % | 1.00 | % | ||||||||
WACC decreases |
(1.00 | )% | (1.00 | )% | (1.00 | )% | (1.00 | )% | ||||||||
Change in increasing WACC |
||||||||||||||||
Change in the total value (fair value) of WBAG |
(47,239 | ) | (47,111 | ) | ||||||||||||
Effect on the fair value of OeKB Group in WBAG |
(3,120 | ) | (3,111 | ) | ||||||||||||
Change in decreasing WACC |
||||||||||||||||
Change in the total value (fair value) of WBAG |
61,599 | 61,096 | ||||||||||||||
Effect on the fair value of OeKB Group in WBAG |
4,068 | 4,035 |
Details about the individual interests in investments other than subsidiaries can be found in Note 38.
Additional mandatory disclosures pursuant to § 64(1) No 10 and 11 BWG
The item Bonds and other fixed income securities contains the fixed-rate bond portfolio of OeKB Group, which is classified as fixed assets.
The item Equity shares and other variable-income securities contains securities with variable interest rates, of which 370.9 million are classified as fixed assets (2023: 349.9 million).
Of the bonds and other fixed-income securities, 2,123.6 million are admitted for public trading and listed (2023: 2,104.1 million). The equity shares and other variable-income securities and other investments in subsidiaries are not listed on an exchange, as was the case in the previous year.
72
Note 19 Hedging instruments
The recognition and measurement principles are shown in Note 2. The classification according to IFRS 9 is indicated in Note 15.
Derivative financial instruments
2024 | 2023 | |||||||||||||||||||||||
thousand |
Notional amount | Fair values positive |
Fair values negative |
Notional amount |
Fair values positive |
Fair values negative |
||||||||||||||||||
Interest rate derivatives |
||||||||||||||||||||||||
Interest rate swaps |
23,632,135 | 311,316 | 354,739 | 22,151,758 | 404,639 | 566,067 | ||||||||||||||||||
|
|
|
|
|
|
|
|
|
|
|
|
|||||||||||||
Currency derivatives |
||||||||||||||||||||||||
Currency swaps |
25,064,649 | 578,703 | 617,287 | 19,222,517 | 59,162 | 1,582,572 | ||||||||||||||||||
|
|
|
|
|
|
|
|
|
|
|
|
|||||||||||||
Total |
48,696,784 | 890,020 | 972,025 | 41,374,275 | 463,801 | 2,148,639 | ||||||||||||||||||
|
|
|
|
|
|
|
|
|
|
|
|
The development of the fair values was dominated by the strong US dollar on the one hand and by decreasing capital market interest rates on the other.
Information on global netting arrangements
Derivative financial instruments are agreed in accordance with the global netting arrangements (framework contract) of the International Swaps and Derivatives Association (ISDA). The amounts owed under such an agreement are generally settled and paid on an individual transaction basis. In certain cases, for example if a credit event occurs, all outstanding transactions under the agreement are terminated, the termination value is determined, and a single net amount is paid to settle all transactions.
In addition, this net amount is calculated daily as per the ISDA contract and is furnished to or received from the given business partner as collateral. Therefore, the default risk is limited to the performance of one to two days (calculation of the previous days value and transfer of the difference to the previous collateral).
The ISDA agreements do not fulfil the criteria for netting on the balance sheet. This is due to the fact that no legal claim to the netting of the covered amounts because the right to netting is enforceable only in the case of certain future events such as a credit event.
73
The following table shows the net book values of the derivative financial instruments covered by the reported agreements.
Global netting agreements
2024 | 2023 | |||||||||||||||||||||||
thousand |
Derivative financial instruments on the balance sheet |
Gross and net amounts of derivative financial instruments that are not netted |
Net amount | Derivative financial instruments on the balance sheet |
Gross and net amounts of derivative financial instruments that are not netted |
Net amount | ||||||||||||||||||
Derivative financial instruments with positive fair value |
||||||||||||||||||||||||
Interest rate derivatives - Interest rate swaps |
311,316 | (272,403 | ) | 38,913 | 404,639 | (404,639 | ) | | ||||||||||||||||
Currency derivatives - Currency swaps |
578,703 | (321,996 | ) | 256,707 | 59,162 | (59,162 | ) | | ||||||||||||||||
|
|
|
|
|
|
|
|
|
|
|
|
|||||||||||||
Total |
890,020 | (594,399 | ) | 295,620 | 463,801 | (463,801 | ) | | ||||||||||||||||
Derivative financial instruments with negative fair value |
||||||||||||||||||||||||
Interest rate derivatives - Interest rate swaps |
354,739 | (242,028 | ) | 112,710 | 566,067 | (301,753 | ) | 264,314 | ||||||||||||||||
Currency derivatives - Currency swaps |
617,287 | (352,371 | ) | 264,915 | 1,582,572 | (162,048 | ) | 1,420,524 | ||||||||||||||||
|
|
|
|
|
|
|
|
|
|
|
|
|||||||||||||
Total |
972,025 | (594,399 | ) | 377,626 | 2,148,639 | (463,801 | ) | 1,684,838 | ||||||||||||||||
|
|
|
|
|
|
|
|
|
|
|
|
Guarantees pursuant to § 1(2b) AFFG
thousand |
2024 | 2023 | ||||||
Fair value at the beginning of the period |
7,117,500 | 6,198,441 | ||||||
Net profit for the period |
(204,617 | ) | 919,060 | |||||
|
|
|
|
|||||
Fair value at the end of the period |
6,912,883 | 7,117,500 | ||||||
|
|
|
|
The change from foreign exchange differences resulted primarily from the exchange rate of the euro and to the CHF (see the indicative exchange rates on the reporting dates Note 2).
74
Note 20 Composition of the net profit or loss of equity-accounted investments
Equity-accounted investments
thousand |
2024 | 2023 | ||||||
OeKB EH Beteiligungs- und Management AG, Vienna |
64,045 | 66,102 | ||||||
CCP Austria Abwicklungsstelle für Börsengeschäfte GmbH, Vienna |
8,500 | 7,489 | ||||||
|
|
|
|
|||||
Equity-accounted investments |
72,544 | 73,591 | ||||||
|
|
|
|
Net profit or loss of equity-accounted investments
Income statement
thousand |
2024 | 2023 | ||||||
OeKB EH Beteiligungs- und Management AG, Vienna |
3,539 | 5,619 | ||||||
CCP Austria Abwicklungsstelle für Börsengeschäfte GmbH, Vienna |
2,011 | 1,490 | ||||||
|
|
|
|
|||||
Share of profit or loss of equity-accounted investments, net of tax |
5,550 | 7,110 | ||||||
|
|
|
|
Other comprehensive income/(expense)
thousand |
2024 | 2023 | ||||||
OeKB EH Beteiligungs- und Management AG, Vienna |
12 | (415 | ) | |||||
CCP Austria Abwicklungsstelle für Börsengeschäfte GmbH, Vienna |
| | ||||||
|
|
|
|
|||||
Equity-accounted investments - Share of other comprehensive income/(expenses) |
12 | (415 | ) | |||||
|
|
|
|
Total comprehensive income/(expenses)
thousand |
2024 | 2023 | ||||||
OeKB EH Beteiligungs- und Management AG, Vienna |
3,551 | 5,204 | ||||||
CCP Austria Abwicklungsstelle für Börsengeschäfte GmbH, Vienna |
2,011 | 1,490 | ||||||
|
|
|
|
|||||
Net profit for the period |
5,562 | 6,695 | ||||||
|
|
|
|
There were no contingent liabilities for the equity-accounted investments.
75
OeKB EH Beteiligungs- und Management AG, Vienna, Austria
Other Services segment |
2024 | 2023 | ||||||
Shareholding |
51 | % | 51 | % | ||||
Share of voting rights |
51 | % | 51 | % |
OeKB EH Beteiligungs- und Management AG is an unlisted holding company. It is the sole owner of Acredia Versicherung AG. It offers a complete range of credit insurance to Austrian businesses.
OeKB EH Beteiligungs- und Management AG is operated as a joint venture with Euler Hermes Aktiengesell-schaft, Hamburg, and is included in the consolidated financial statements according to the equity method. OeKB does not have the power of decision through voting rights or other rights that would allow it to influence the returns from the affiliated company.
thousand |
2024 | 2023 | ||||||
Earned premiums |
26,315 | 26,924 | ||||||
Actuarial result |
6,912 | 12,829 | ||||||
Profit before tax |
9,088 | 14,534 | ||||||
Of which depreciation and amortisation |
(35 | ) | (101 | ) | ||||
Of which interest income |
1,369 | 885 | ||||||
Of which interest expense |
| (2 | ) | |||||
Profit for the year |
6,939 | 11,018 | ||||||
Other comprehensive income/(expense) |
24 | (814 | ) | |||||
|
|
|
|
|||||
Total comprehensive income/(expenses) |
6,963 | 10,204 | ||||||
Current assets |
34,814 | 45,507 | ||||||
Of which cash and cash equivalents |
27,967 | 37,807 | ||||||
Non-current assets |
127,344 | 127,085 | ||||||
Current liabilities |
16,534 | 22,402 | ||||||
Non-current liabilities |
20,047 | 20,577 | ||||||
|
|
|
|
|||||
Equity |
125,576 | 129,613 | ||||||
Proportionate share of equity at the beginning of the period |
66,102 | 61,470 | ||||||
Initial-application effect |
| 4,027 | ||||||
Proportionate share of total comprehensive income for the period |
3,551 | 5,204 | ||||||
Dividend payments received |
(5,610 | ) | (4,600 | ) | ||||
|
|
|
|
|||||
Proportionate share of equity at the end of the period |
64,045 | 66,102 | ||||||
|
|
|
|
OeKB EH Beteiligungs- und Management AG applied the new standard IFRS 17 for the recognition of insurance contracts in the previous year. The company also exercised the option to apply IFRS 9 together with IFRS 17. The first-time application effect came to 7,896 thousand. The effect was recognised proportionately in the amount of 4,027 thousand.
76
CCP Austria Abwicklungsstelle für Börsengeschäfte GmbH, Vienna, Austria
Capital Market Services segment |
2024 | 2023 | ||||||
Shareholding |
50 | % | 50 | % | ||||
Share of voting rights |
50 | % | 50 | % |
CCPA is operated as a joint venture with Wiener Börse AG, Vienna, and is recognised in the consolidated financial statements according to the equity-method.
CCPA is not a listed company. It acts as the clearing agent for Wiener Börse and EXAA electricity exchange. As the central counterparty, it is involved in all transactions conducted on Wiener Börse and EXAA electricity exchange. CCPA was licensed pursuant to Art 14(1) of Regulation (EU) No 648/2012 (European Market Infrastructure Regulation, EMIR) in 2014.
thousand |
2024 | 2023 | ||||||
Revenue |
5,401 | 5,011 | ||||||
Operating profit |
692 | 893 | ||||||
Profit before tax |
5,231 | 3,928 | ||||||
Of which depreciation and amortisation |
| | ||||||
Of which interest income |
4,539 | 3,035 | ||||||
Of which interest expense |
0 | 0 | ||||||
Profit for the year |
4,022 | 2,981 | ||||||
Other comprehensive income/(expense) |
| | ||||||
|
|
|
|
|||||
Total comprehensive income/(expenses) |
4,022 | 2,981 | ||||||
Current assets |
189,141 | 145,403 | ||||||
Of which cash and cash equivalents |
167,305 | 141,687 | ||||||
Non-current assets |
| | ||||||
Current liabilities |
172,141 | 130,424 | ||||||
Non-current liabilities |
| | ||||||
|
|
|
|
|||||
Equity |
17,000 | 14,979 | ||||||
Proportionate share of equity at the beginning of the period |
7,489 | 6,599 | ||||||
Proportionate share of total comprehensive income for the period |
2,011 | 1,490 | ||||||
Dividend payments received |
(1,000 | ) | (600 | ) | ||||
|
|
|
|
|||||
Proportionate share of equity at the end of the period |
8,500 | 7,489 | ||||||
|
|
|
|
77
Note 21 Property, equipment, and intangible assets
Non-current assets in 2024 Acquisition cost
thousand |
31 Dec 2023 | Additions | Transfers | Disposals | 31 Dec 2024 | |||||||||||||||
Land and buildings |
82,977 | | | | 82,977 | |||||||||||||||
Right of use - buildings |
7,055 | 821 | | 7,876 | ||||||||||||||||
Fixtures, fittings, and equipment |
18,675 | 3,561 | | (1,121 | ) | 21,116 | ||||||||||||||
Right of use - vehicle fleet |
| | | | | |||||||||||||||
|
|
|
|
|
|
|
|
|
|
|||||||||||
Property and equipment |
108,707 | 4,382 | | (1,121 | ) | 111,969 | ||||||||||||||
Software |
16,422 | 1,182 | 392 | (316 | ) | 17,288 | ||||||||||||||
Advanced payments on software |
1,002 | 187 | (392 | ) | | 1,189 | ||||||||||||||
Customer relationships |
517 | | | (517 | ) | | ||||||||||||||
|
|
|
|
|
|
|
|
|
|
|||||||||||
Intangible assets |
17,941 | 1,369 | | (833 | ) | 18,477 | ||||||||||||||
|
|
|
|
|
|
|
|
|
|
|||||||||||
Total |
126,648 | 5,751 | | (1,954 | ) | 130,445 | ||||||||||||||
|
|
|
|
|
|
|
|
|
|
Non-current assets in 2024 - Depreciation, amortisation, and net book values
Accumulated depreciation and amortisation | Net book values | |||||||||||||||||||||||
thousand |
31 Dec 2023 | Additions | Disposals | 31 Dec 2024 | 31 Dec 2023 | 31 Dec 2024 | ||||||||||||||||||
Land and buildings |
71,719 | 166 | | 71,885 | 11,258 | 11,092 | ||||||||||||||||||
Right of use - buildings |
4,330 | 1,011 | | 5,342 | 3,007 | 2,534 | ||||||||||||||||||
Fixtures, fittings, and equipment |
12,605 | 2,510 | (1,091 | ) | 14,024 | 5,787 | 7,092 | |||||||||||||||||
Right of use - vehicle fleet |
| | | | | | ||||||||||||||||||
|
|
|
|
|
|
|
|
|
|
|
|
|||||||||||||
Property and equipment |
88,654 | 3,687 | (1,091 | ) | 91,251 | 20,053 | 20,718 | |||||||||||||||||
Software |
12,774 | 2,172 | (285 | ) | 14,662 | 3,648 | 3,018 | |||||||||||||||||
Advanced payments on software |
| | | | 1,002 | 797 | ||||||||||||||||||
Customer relationships |
431 | 86 | (517 | ) | | 86 | | |||||||||||||||||
|
|
|
|
|
|
|
|
|
|
|
|
|||||||||||||
Intangible assets |
13,205 | 2,258 | (801 | ) | 14,662 | 4,736 | 3,815 | |||||||||||||||||
|
|
|
|
|
|
|
|
|
|
|
|
|||||||||||||
Total |
101,859 | 5,945 | (1,892 | ) | 105,913 | 24,789 | 24,532 | |||||||||||||||||
|
|
|
|
|
|
|
|
|
|
|
|
78
Non-current assets in 2023 Acquisition cost
thousand |
31 Dec 2022 | Additions | Transfers | Disposals | 31 Dec 2023 | |||||||||||||||
Land and buildings |
82,840 | 137 | | | 82,977 | |||||||||||||||
Right of use - buildings |
6,772 | 283 | | | 7,055 | |||||||||||||||
Fixtures, fittings, and equipment |
16,605 | 2,810 | | (739 | ) | 18,675 | ||||||||||||||
Right of use - vehicle fleet |
| | | | | |||||||||||||||
|
|
|
|
|
|
|
|
|
|
|||||||||||
Property and equipment |
106,217 | 3,229 | | (739 | ) | 108,707 | ||||||||||||||
Software |
15,716 | 345 | 971 | (610 | ) | 16,422 | ||||||||||||||
Advanced payments on software |
1,357 | 616 | (971 | ) | | 1,002 | ||||||||||||||
Customer relationships |
517 | | | | 517 | |||||||||||||||
|
|
|
|
|
|
|
|
|
|
|||||||||||
Intangible assets |
17,590 | 961 | | (610 | ) | 17,941 | ||||||||||||||
|
|
|
|
|
|
|
|
|
|
|||||||||||
Total |
123,807 | 4,190 | | (1,349 | ) | 126,648 | ||||||||||||||
|
|
|
|
|
|
|
|
|
|
Non-current assets in 2023 - Depreciation, amortisation, and net book values
Accumulated depreciation and amortisation | Net book values | |||||||||||||||||||||||
thousand |
31 Dec 2022 | Additions | Disposals | 31 Dec 2023 | 31 Dec 2022 | 31 Dec 2023 | ||||||||||||||||||
Land and buildings |
71,562 | 157 | | 71,719 | 11,278 | 11,258 | ||||||||||||||||||
Right of use - buildings |
3,375 | 956 | | 4,330 | 3,398 | 3,007 | ||||||||||||||||||
Fixtures, fittings, and equipment |
11,280 | 2,340 | (1,015 | ) | 12,605 | 5,323 | 5,787 | |||||||||||||||||
Right of use - vehicle fleet |
| | | | | | ||||||||||||||||||
|
|
|
|
|
|
|
|
|
|
|
|
|||||||||||||
Property and equipment |
86,217 | 3,452 | (1,015 | ) | 88,654 | 19,999 | 20,053 | |||||||||||||||||
Software |
11,537 | 1,858 | (620 | ) | 12,774 | 4,180 | 3,648 | |||||||||||||||||
Advanced payments on software |
| | | | 1,357 | 1,002 | ||||||||||||||||||
Customer relationships |
344 | 86 | | 431 | 173 | 86 | ||||||||||||||||||
|
|
|
|
|
|
|
|
|
|
|
|
|||||||||||||
Intangible assets |
11,881 | 1,944 | (620 | ) | 13,205 | 5,710 | 4,736 | |||||||||||||||||
|
|
|
|
|
|
|
|
|
|
|
|
|||||||||||||
Total |
98,098 | 5,396 | (1,635 | ) | 101,859 | 25,709 | 24,789 | |||||||||||||||||
|
|
|
|
|
|
|
|
|
|
|
|
The value of the property itself was 6.4 million (2023: 6.4 million).
There were no additions from capitalised interest in the current financial year or the prior year. There were no write-ups or transfers in the accumulated amortisation and depreciation in the current financial year or prior year.
79
Lease liabilities in the amount of 2.5 million (2023: 2.7 million; recognition in Other liabilities) were connected to the rights of use pursuant to IFRS 16 mentioned above. Of these recognised lease liabilities, 1,019.1 thousand come due in 2025 and the remainder in subsequent years. The interest expense for lease liabilities totaled 2.7 thousand in the financial year (2023: 3.6 thousand). As in the previous year, there were no expenses for short-term lease liabilities during the financial year. The disposals include the reassessment of rights of use in the amount of 824.5 thousand (2023: 282.9 thousand additions).
Note 22 Deposits from banks and deposits from customers
The recognition and measurement principles are shown in Note 2. The classification according to IFRS 9 is indicated in Note 15.
Deposits from banks
Repayable on demand | Other deposits | Total | ||||||||||||||||||||||
thousand |
31 Dec 2024 |
31 Dec 2023 |
31 Dec 2024 |
31 Dec 2023 |
31 Dec 2024 |
31 Dec 2023 |
||||||||||||||||||
Domestic banks |
131,482 | 231,173 | 358,259 | 441,353 | 489,741 | 672,526 | ||||||||||||||||||
Foreign banks |
277,160 | 82,686 | 190,882 | 384,617 | 468,043 | 467,303 | ||||||||||||||||||
|
|
|
|
|
|
|
|
|
|
|
|
|||||||||||||
Total |
408,642 | 313,859 | 549,141 | 825,970 | 957,783 | 1,139,829 | ||||||||||||||||||
|
|
|
|
|
|
|
|
|
|
|
|
The decrease in deposits from banks is primarily the result of short-term money market transactions and a decrease in demand deposits.
Deposits from customers
Domestic customers | Foreign customers | Total | ||||||||||||||||||||||
thousand |
31 Dec 2024 |
31 Dec 2023 |
31 Dec 2024 |
31 Dec 2023 |
31 Dec 2024 |
31 Dec 2023 |
||||||||||||||||||
States or government-affiliated organisations |
539,963 | 636,070 | 13 | 84 | 539,976 | 636,154 | ||||||||||||||||||
Others |
453,986 | 434,797 | 89,540 | 63,466 | 543,526 | 498,264 | ||||||||||||||||||
|
|
|
|
|
|
|
|
|
|
|
|
|||||||||||||
Total |
993,948 | 1,070,867 | 89,553 | 63,550 | 1,083,502 | 1,134,417 | ||||||||||||||||||
|
|
|
|
|
|
|
|
|
|
|
|
80
Note 23 Debt securities issued
The recognition and measurement principles are shown in Note 2. The classification according to IFRS 9 is indicated in Note 15.
Debt securities issued
Net book value | Of which listed | |||||||||||||||
thousand |
31 Dec 2024 | 31 Dec 2023 | 31 Dec 2024 | 31 Dec 2023 | ||||||||||||
Bonds issued |
21,140,073 | 18,543,058 | 21,140,073 | 18,543,058 | ||||||||||||
Other debt securities issued |
7,704,832 | 9,465,789 | | | ||||||||||||
|
|
|
|
|
|
|
|
|||||||||
Total |
28,844,905 | 28,008,847 | 21,140,073 | 18,543,058 | ||||||||||||
|
|
|
|
|
|
|
|
The amount repayable on maturity for debt securities issued that were measured at fair value option was 22,534.6 million (2023: 19,733.6 million). This corresponds to a difference to the fair value of minus 284.7 million (2023: minus 387.5 million).
Of the debt securities issued, 12,678.9 million will come due in the following year (2023 maturing in 2024: 12,778.2 million).
The Other debt securities issued contained subordinated liabilities in the amount of 2.0 million (2023: 2.1 million), for which interest expenses of 0.1 million (2023: 0.2 million) were paid.
Note 24 Provisions
Changes in provisions
thousand |
31 Dec 2023 | Use | Release | Addition | 31 Dec 2024 | |||||||||||||||
Non-current employee benefit provisions |
122,532 | (7,146 | ) | | 1,399 | 116,786 | ||||||||||||||
Other provisions |
7,115 | (5,014 | ) | (312 | ) | 4,325 | 6,113 | |||||||||||||
|
|
|
|
|
|
|
|
|
|
|||||||||||
Total provisions 2024 |
129,647 | (12,160 | ) | (312 | ) | 5,724 | 122,899 | |||||||||||||
|
|
|
|
|
|
|
|
|
|
|||||||||||
Total provisions 2023 |
119,246 | (12,796 | ) | (104 | ) | 23,301 | 129,647 | |||||||||||||
|
|
|
|
|
|
|
|
|
|
81
Changes in non-current employee benefit provisions
thousand |
Pensions | Termination benefits |
Total 2024 |
Total 2023 |
||||||||||||
Present value of defined-benefit obligations (DBO) = employee benefit provisions at 1 January |
99,374 | 23,159 | 122,532 | 112,257 | ||||||||||||
Service cost |
129 | 515 | 644 | 627 | ||||||||||||
Interest cost |
3,122 | 722 | 3,844 | 4,052 | ||||||||||||
Payments |
(5,979 | ) | (1,167 | ) | (7,146 | ) | (7,700 | ) | ||||||||
Actuarial gain/loss |
(2,742 | ) | (347 | ) | (3,089 | ) | 13,296 | |||||||||
Of which actuarial gain/loss arising from changes in parameters |
(4,559 | ) | (1,145 | ) | (5,704 | ) | 6,255 | |||||||||
Of which actuarial gain/loss arising from experience adjustments |
1,817 | 798 | 2,615 | 7,041 | ||||||||||||
|
|
|
|
|
|
|
|
|||||||||
Employee benefit provisions at 31 Dec (DBO) |
93,904 | 22,881 | 116,786 | 122,532 | ||||||||||||
|
|
|
|
|
|
|
|
The actuarial result stemmed from the change in the discount rate from 3.24% to 3.39% (2023: from 3.75% to 3.24%) and the adaption of the long-term salary and pension trends. The long-term trend for future wage growth of 3.20% (2023: 3.70%) and the trend for future pension increases of 2.90% (2023: 3.20%) was adopted. The result in 2023 was attributed largely to the change in the discount rate.
Historical information on defined-benefit obligations
thousand |
2019 | 2020 | 2021 | 2022 | 2023 | |||||||||||||||
Pension provisions |
124,247 | 123,279 | 109,211 | 89,667 | 99,374 | |||||||||||||||
Termination benefit provisions |
30,378 | 29,623 | 26,552 | 22,590 | 23,159 | |||||||||||||||
|
|
|
|
|
|
|
|
|
|
|||||||||||
Non-current employee benefit provisions |
154,625 | 152,902 | 135,763 | 112,257 | 122,532 | |||||||||||||||
|
|
|
|
|
|
|
|
|
|
The pension obligations for most of the staff have been transferred to a pension fund under a defined-contribution plan. In connection with this plan, contributions of 1.3 million were paid to the pension fund in 2024 (2023: 1.2 million).
Staff costs also included the contributions of 0.6 million to the termination benefit fund (2023: 0.5 million).
The following table presents the sensitivity of the obligations to key actuarial assumptions. It showed the respective absolute change in the amount of the provision recognised at 31 December 2024 when varying a single assumption at a time. The other assumptions are unchanged in each case.
82
Sensitivity analyses - Changes in expenses (-)/earnings (+)
thousand |
Pensions | Termination benefits |
Total 2024 |
Total 2023 |
||||||||||||
Increase in the discount rate by 0.50% |
4,663 | 823 | 5,486 | 6,134 | ||||||||||||
Decrease in the discount rate by 0.50% |
(5,096 | ) | (877 | ) | (5,973 | ) | (6,705 | ) | ||||||||
Increase in expected salary growth by 0.50% |
(180 | ) | (872 | ) | (1,052 | ) | (1,143 | ) | ||||||||
Decrease in expected salary growth by 0.50% |
173 | 826 | 1,000 | 1,083 | ||||||||||||
Increase in the pension trend by 0.50% |
(4,760 | ) | | (4,760 | ) | (5,368 | ) | |||||||||
Decrease in the pension trend by 0.50% |
4,416 | | 4,416 | 4,961 | ||||||||||||
Increase in life expectancy by 10% (corresponds to 1 year) |
(5,432 | ) | | (5,432 | ) | (5,768 | ) |
The sensitivity analysis was performed by an independent actuary using the projected unit credit method.
Maturity profile of the non-current employee benefit provisions
Pensions | Termination benefits | |||||||||||||||
thousand |
DBO 31 Dec 2024 |
DBO 31 Dec 2023 |
DBO 31 Dec 2024 |
DBO 31 Dec 2023 |
||||||||||||
1 year |
6,234 | 6,033 | 2,676 | 2,059 | ||||||||||||
2 up to 3 years |
12,135 | 11,867 | 2,858 | 2,875 | ||||||||||||
4 up to 5 years |
11,559 | 11,487 | 2,688 | 3,090 | ||||||||||||
Over 5 years |
63,976 | 69,986 | 14,660 | 15,136 | ||||||||||||
|
|
|
|
|
|
|
|
|||||||||
Total |
93,904 | 99,374 | 22,881 | 23,159 | ||||||||||||
Duration |
10.8 years | 11.5 years | 7.9 years | 8.6 years | ||||||||||||
|
|
|
|
|
|
|
|
Other provisions
thousand |
2024 | 2023 | ||||||
Staff-related provisions |
5,954 | 6,965 | ||||||
Other provisions |
159 | 150 | ||||||
|
|
|
|
|||||
Total |
6,113 | 7,115 | ||||||
|
|
|
|
Note 25 Tax assets and tax liabilities
Tax assets and tax liabilities each include deferred tax assets and deferred tax liabilities arising from temporary differences between the IFRS carrying amounts and the corresponding tax base taking account of the valid tax rates (since 2024: 23.0%, 2023: 24.0%) for Group companies (see also Note 14).
The recognised amount of deferred tax assets is based on the assumption that sufficient taxable revenue will be generated in future. OeKB Group had no (unused) loss carryforwards at the reporting date.
83
Deferred taxes
Deferred tax assets | Deferred tax liabilities | |||||||||||||||
thousand |
31 Dec 2024 | 31 Dec 2023 | 31 Dec 2024 | 31 Dec 2023 | ||||||||||||
Loans and advances to banks |
8,693 | 17,328 | | | ||||||||||||
Loans and advances to customers |
| | 57 | 1,006 | ||||||||||||
Other financial assets |
| | 2,898 | 9,975 | ||||||||||||
Derivative financial instruments |
223,566 | 494,187 | 204,705 | 106,674 | ||||||||||||
Guarantees pursuant to § 1(2b) AFFG |
| | 1,589,963 | 1,637,025 | ||||||||||||
Property and equipment |
| | 1,332 | 1,378 | ||||||||||||
Other assets |
349 | 427 | | | ||||||||||||
Deposits from banks |
330 | 26,759 | | | ||||||||||||
Debt securities issued |
1,426,945 | 1,081,760 | | | ||||||||||||
Provisions |
12,846 | 14,077 | | | ||||||||||||
Other liabilities |
| | 481 | 621 | ||||||||||||
EFS interest rate stabilisation provision |
180,140 | 168,680 | | | ||||||||||||
|
|
|
|
|
|
|
|
|||||||||
Total |
1,852,868 | 1,803,219 | 1,799,435 | 1,756,680 | ||||||||||||
|
|
|
|
|
|
|
|
|||||||||
Tax settlement |
(1,799,435 | ) | (1,756,680 | ) | ||||||||||||
|
|
|
|
|||||||||||||
Tax claims (liabilities), net |
53,434 | 46,539 | ||||||||||||||
|
|
|
|
|||||||||||||
thousand |
2024 | 2023 | ||||||||||||||
Change |
6,895 | 6,364 | ||||||||||||||
Of which in the income statement |
7,403 | 3,708 | ||||||||||||||
Of which transfer to EFS interest stabilisation provision |
| 140 | ||||||||||||||
Of which in the net other comprehensive income |
(508 | ) | 2,796 |
Unrecognised deferred taxes payable
As in the prior year, there were no deferred taxes payable for temporary differences relating to shares in subsidiaries and joint ventures on 31 December 2024.
Note 26 Other liabilities
The item Other liabilities in the amount of 45.8 million (2023: 51.7 million) consisted of 27.0 million (2023: 31.9 million) other liabilities and of 18.8 million (2023: 19.8 million) accruals and deferred income.
The item Other liabilities consisted primarily of open offsetting items in the amount of 11.9 million (2023: 11.6 million), obligations for staff- related expenses in the amount of 3.1 million (2023: 3.1 million), and lease expenses in the amount of 2.5 million (2023: 2.7 million).
84
The accruals and deferred income consisted primarily of not-yet-received commission payments from export and tourism guarantee operations in the amount of 16.3 million (2023: 17.3 million). The accruals and deferred income also included general fees and fees from commitments to lend in the amount of 2.4 million (2023: 2.3 million) relating to loans that have not yet been paid out. These are taken into account in the effective interest rate at the time that the underlying loan is paid out and then received on an ongoing proportionate basis through this rate.
Note 27 EFS interest rate stabilisation provision
The EFS interest rate stabilisation provision is formed for the Export Financing Scheme. The provision is based on the actual obligation regarding the use of surpluses from the EFS. This obligation arises from the rules for the fixing of interest rates in the EFS, which specify fixed margins for OeKB, and from a directive from the Federal Ministry of Finance on the use of surpluses from the scheme (see also Note 1).
The additions to and utilisation of the EFS interest rate stabilisation provision result from the net interest income from the EFS less OeKBs fixed margin for the operation of the scheme and less the costs directly related to the refinancing of the scheme. The net effects from the measurement of the derivative financial instruments, guarantees pursuant to § 1(2b) AFFG, and the loans and advances of and deposits from the EFS are also included in this item. In accordance with the associated decisions, the provision is used to stabilise the terms of export financing loans.
Change in the EFS interest rate stabilisation provision
thousand |
2024 | 2023 | ||||||
At the beginning of the period |
1,499,465 | 1,486,405 | ||||||
Release/allocation from the net interest income |
111,653 | 60,348 | ||||||
Release/allocation from the net credit risk provisions |
29 | 86 | ||||||
Release/allocation from the net gain or loss on financial instruments measured at fair value through profit or loss |
39,447 | (47,373 | ) | |||||
Release/allocation from the net gain or loss on the derecognition of financial instruments not measured at fair value through profit or loss |
| | ||||||
Release/allocation from the net other operating income |
| | ||||||
|
|
|
|
|||||
Change in the EFS interest rate stabilisation provision |
151,129 | 13,061 | ||||||
|
|
|
|
|||||
At the end of the period |
1,650,594 | 1,499,465 | ||||||
|
|
|
|
Note 28 Capital management
Equity disclosure
The subscribed capital of 130.0 million (2023: 130.0 million) is divided into 880,000 no-par value shares. These registered ordinary shares with restricted transferability are represented by global certificates registered in the name of each individual shareholder. Every share represents an equal proportion of the share capital. There are no shares in issue that have not been fully paid up. Each share represents a rounded proportion of 147.73 of the share capital.
85
The capital reserve remained unchanged at 3.3 million and is restricted pursuant to § 229(4) UGB.
The retained earnings attributable to owners of the parent increased by 17.3 million to 793.4 million (2023: 776.1 million). The retained earnings contained an amount of 10.6 million (2023: 10.6 million) as a legal reserve pursuant to § 229(4) UGB.
The IAS 19 reserve is the result of actuarial gains on defined-benefit pension plans and changed by 2.4 million from minus 26.5 million to minus 24.1 million in annual comparison. The FVOCI reserve resulted from the fair value measurement of investments in other unconsolidated companies and came to 20.1 million (2023: 20.7 million).
The equity attributable to owners of the parent thus came to 922.8 million (2023: 903.7 million).
The Executive Board will propose the disbursement of a dividend from the parent company of up to 68.00 per share (880,000 shares) from the profit retained for 2024. This corresponds to a maximum disbursement of 59.8 million. The resolution is scheduled for vote at the Annual General Meeting on 23 May 2025. The vote and specific resolution will depend on the capital needs and ongoing strategic considerations. The remaining profit shall be carried forward.
The ordinary Annual General Meeting resolved on 27 May 2024 to distribute a dividend for the 2023 financial year of 55.00 per share ( 48.4 million) and to carry the remaining profit forward.
The return on assets pursuant to § 64(1)19 BWG attributable to the owners of the parent was 0.2% in 2024 (2023: 0.2 %).
Capital management
According to § 3(1)7 BWG, transactions conducted by OeKB and OeEB under the Export Guarantees Act (Federal Law Gazette No 215/1981) and the Export Financing Guarantees Act (Federal Law Gazette No 196/ 1967) are not subject to Regulation (EU) No 575/2013 or to §§ 22 to 24d, 39(2d) in conjunction with § 69(3), § 39(3) and (4), § 70(4a) 1, 8, 9, and 11, and §§ 70b to 70d BWG and are not subject to the inclusion of these transactions in the limits according to § 5(4) BWG. In terms of the supervisory law monitoring pursuant to § 69(2) BWG, the requirements in Regulation (EU) No 575/2013 do not apply. According to § 3(1)11 BWG, the provisions of the BWG and Regulation (EU) No 575/2013 do not apply to the business activities of OeHT (however, § 5[1]1 to 4a and 6 to 14, §§ 38 to 39b except § 39[2d] in conjunction with § 69[3], §§ 41 to 42, § 65, §§ 69 to 70a, §§ 71 to 73a, and §§ 98 to 99e BWG do apply, though the supervisory monitoring pursuant to § 69[2] BWG shall not take into account the requirements of Regulation [EU] No 575/2013).
The bank group pursuant to § 30 BWG consists of Oesterreichische Kontrollbank Aktiengesellschaft, OeKB CSD GmbH, Oesterreichische Entwicklungsbank AG, and Österreichische Hotel- und Tourismusbank Gesell-schaft m.b.H. The strategy of OeKB Group aims to maintain a stable capital base over the long term. There were no material changes in capital management. The Group satisfied the capital requirements of the national supervisory authority at all times during the reporting period.
The minimum regulatory capital requirement for credit risk was determined in accordance with the provisions of Regulation (EU) No 575/2013. The capital required to be held for operational risk was determined according to the Basic Indicator Approach. The credit risk was significantly lower due to the exemptions from the supervisory regulations described above. The bank group did not hold a trading book at any time. At Group level, the risks were aggregated in accordance with the concept of economic capital. Through the analysis of risk-bearing capacity, the economic capital required was compared with the economic capital available, and both metrics are monitored.
86
OeKB is the parent institution of OeKB bank group for the purposes of § 30 BWG. OeKB Groups regulatory capital determined in accordance with Regulation (EU) No 575/2013 showed the following composition and development:
thousand |
2024 | 2023 | ||||||
Risk-weighted assets (standardised approach to credit risk) |
398,146 | 412,587 | ||||||
|
|
|
|
|||||
Total risk exposure amount (total regulatory capital requirement/8%) |
836,955 | 787,103 | ||||||
Minimum regulatory capital requirement for |
||||||||
Credit risk |
31,852 | 33,007 | ||||||
Operational risk (Basic Indicator Approach) |
35,105 | 29,961 | ||||||
|
|
|
|
|||||
Total regulatory capital requirement |
66,956 | 62,968 | ||||||
Consolidated regulatory capital purs. to Part 2 CRR |
||||||||
Paid-up share capital |
130,000 | 130,000 | ||||||
Reserves* |
742,436 | 726,732 | ||||||
Less deductions |
||||||||
Intangible assets |
(3,815 | ) | (4,736 | ) | ||||
|
|
|
|
|||||
Common equity tier 1 capital |
868,621 | 851,995 | ||||||
|
|
|
|
|||||
Tier 1 capital |
868,621 | 851,995 | ||||||
|
|
|
|
|||||
Available regulatory capital purs. to Part 2 CRR |
868,621 | 851,995 | ||||||
Surplus regulatory capital |
801,665 | 789,027 | ||||||
Consolidated capital adequacy ratio (regulatory capital as a percentage of total risk-weighted assets) |
103.8 | % | 108.2 | % | ||||
Consolidated tier 1 ratio |
103.8 | % | 108.2 | % | ||||
Cover ratio (regulatory capital as a percentage of the capital requirement) |
1,297.3 | % | 1,353.1 | % |
* | Purs. to Art 26(2) CRR, earnings for the year are included in common equity tier 1 only after the official adoption of the final annual financial results. The dedicated reserve for technical assistance is deducted from the reserves. |
This results in the following ratios pursuant to Art 92(1) lit a to c of Regulation (EU) No 575/2013 at the reporting date, which are compared with the minimum ratios for the Group:
Minimum ratios purs. to Art 92 of Regulation (EU) No 575/2013
2024 | 2023 | |||||||||||||||
In% |
Minimum ratio | Actual ratio | Minimum ratio | Actual ratio | ||||||||||||
Core tier 1 ratio |
7.138 | 103.784 | 7.209 | 108.244 | ||||||||||||
Tier 1 ratio |
8.638 | 103.784 | 8.709 | 108.244 | ||||||||||||
Total capital ratio |
10.638 | 103.784 | 10.709 | 108.244 | ||||||||||||
|
|
|
|
|
|
|
|
87
Calculation of the actual ratio
Core tier 1 ratio = | Common equity tier 1 capital purs. to Part 2 CRR * 100 | |
Minimum regulatory capital requirement purs. to Art 92 CRR | ||
Tier 1 ratio = | Tier 1 capital purs. to Part CRR * 100 | |
Minimum regulatory capital requirement purs. to Art 92 CRR | ||
Total capital ratio = | Available regulatory capital purs. to Part 2 CRR * 100 | |
Minimum regulatory capital requirement purs. to Art 92 CRR |
Minimum ratio for OeKB Group
In % |
2024 | 2023 | ||||||
Core tier 1 ratio purs. to Art 92(1) lit a of Regulation (EU) No 575/2013 |
4.500 | 4.500 | ||||||
Capital conservation buffer purs. to § 22 BWG in conjunction with § 103q line 11 BWG |
2.500 | 2.500 | ||||||
Anti-cyclical capital buffer purs. to § 23a BWG in conjunction with § 103q line 11 BWG |
0.138 | 0.209 | ||||||
Core tier 1 ratio purs. to Art 92(1) lit a of Regulation (EU) No 575/2013 incl. buffer requirements |
7.138 | 7.209 | ||||||
Tier 1 ratio purs. to Art 92(1) lit b of Regulation (EU) No 575/2013 incl. buffer requirements |
8.638 | 8.709 | ||||||
Total capital ratio purs. to Art 92(1) lit c of Regulation (EU) No 575/2013 incl. buffer requirements |
10.638 | 10.709 | ||||||
|
|
|
|
The required ratios resulted from Art 92(1) of Regulation (EU) No 575/2013, the additional capital buffer requirements of the BWG, and the capital buffer regulation of the FMA.
Other disclosures and risk report
Note 29 Information regarding the consolidated statement of cash flows
The consolidated statement of cash flows shows the state and development of the cash and cash equivalents of OeKB Group. The reported cash position consisted largely of cash and balances at central banks and corresponds to the item cash and cash equivalents on the balance sheet. Cash and cash equivalents do not include loans and advances to banks that are repayable on demand, which are largely related to cash collaterals, because these cannot be converted into cash amounts at any time. The Group had additional liquidity reserves (see Note 37), but these were not included in the definition of cash and cash equivalents. This additional liquidity buffer was formed in the EFS and was only used in stress scenarios. The reported cash and cash equivalents were denominated exclusively in euros.
The cash flow from operating activities included the changes in loans and advances to banks and loans and advances to customers, the changes in deposits from banks and deposits from customers, and the changes in debt securities issued. The change in the lease liabilities was also reported in cash flows from operating activities as these do not represent a material financing component. In net cash from operating activities, all income and expense components were adjusted for non-cash items, especially depreciation, amortisation,
88
and impairment; changes in provisions and loan loss provisions; deferred taxes; and unrealised currency translation gains and losses; as well as all other items the cash effects of which represent cash flows from investing or financing activities. Foreign currency losses and gains were incurred primarily in connection with the issue of long- and short-term debt securities issued for the EFS. The exchange rate risks were mostly covered by the guarantees pursuant to § 1(2b) AFFG. OeKB Group thus did not bear any exchange rate risk from the EFS. Fluctuations in exchange rates had little or no impact on cash and cash equivalents held or due in foreign currency. The total of the other adjustments primarily contains non-cash foreign currency losses and gains and non-cash effects from the fair value measurement of debt securities issued and derivative financial instruments, which are related to the change to the AFFG guarantee and the deduction for received interest and addition for paid interest, which are reported separately pursuant to IAS 7.
The cash flow from investing activities reflected changes in the other financial assets in the investment portfolio, in the property and equipment, and intangible assets. The cash flow from financing activities reflected changes in equity transactions with the owners.
Reconciliation of the changes in equity to the cash flows from financing activities
thousand |
Notes | Retained earnings 2024 |
Non-controlling interests 2024 |
Net cash from financing activities 2024 |
Retained earnings 2023 |
Non-controlling interests 2023 |
Net cash from financing activities 2023 |
|||||||||||||||||||||
Balance sheet at 1 Jan |
776,134 | | | 746,466 | | | ||||||||||||||||||||||
Dividends paid |
28 | (48,400 | ) | (1,562 | ) | (49,963 | ) | (32,718 | ) | (781 | ) | (33,499 | ) | |||||||||||||||
|
|
|
|
|
|
|
|
|
|
|
|
|||||||||||||||||
Total change in cash flows from financing activities |
(48,400 | ) | (1,562 | ) | (49,963 | ) | (32,718 | ) | (781 | ) | (33,499 | ) | ||||||||||||||||
|
|
|
|
|
|
|
|
|
|
|
|
|||||||||||||||||
Profit for the year |
65,706 | 1,791 | | 62,386 | 1,643 | | ||||||||||||||||||||||
Balance sheet at 31 Dec |
793,439 | | | 776,134 | | | ||||||||||||||||||||||
|
|
|
|
|
|
|
|
|
|
|
|
Most important developments during the financial year
The cash flow from operating activities in the amount of 558.7 million (2023: 263.0 million) changed by 295.7 million compared with the prior year. The change was due to primarily the change of loans and advances to banks and loans and advances to customers, the change in the deposits from banks, and the change in the debt securities issued. The repayments for the redemption of loans and advances to banks and loans and advances to customers exceeded the payments for the purchase of new receivables by 1,179.1 million (2023: minus 426.6 million). The repayments from redemptions of payables to banks and payables to customers and the debt securities issued exceeded the proceeds from new liabilities by 851.3 million (2023: minus 1,611.9 million). As in the previous year, the most significant non-cash transactions were the changes in the EFS interest rate stabilisation provision, the fair value measurement of the derivative financial instruments, and the fair value measurement of the guarantee pursuant to § 1 (2b) AFFG.
The cash flow from investing activities in the amount of minus 66.9 million changed by minus 15.8 million compared with the prior year (2023: minus 51.1 million). The payment outflows exceeded the payment inflows during the financial year, primarily as a result of new investments.
89
Note 30 Analyse of remaining maturities pursuant to § 64(1) BWG
The remaining maturity is the period from the balance sheet date to the contractual maturity date of the asset or liability; in the case of instalments, the remaining maturity is determined separately for each instalment.
Remaining maturities purs. to § 64(1) BWG at 31 Dec 2024
thousand |
Repayable on demand |
Up to 3 months |
3 months up to 1 year |
1 up to 5 years | More than 5 years |
Total | ||||||||||||||||||
Loans and advances to banks |
308,147 | 738,812 | 7,296,775 | 8,996,723 | 3,460,972 | 20,801,429 | ||||||||||||||||||
Loans and advances to customers |
253,007 | 60,529 | 259,186 | 949,934 | 721,200 | 2,243,855 | ||||||||||||||||||
Other financial assets |
5,763 | 42,568 | 520,593 | 1,420,289 | 690,277 | 2,679,490 | ||||||||||||||||||
Deriv. financial instruments |
| 69,080 | 36,164 | 612,871 | 171,905 | 890,020 | ||||||||||||||||||
Guarantees pursuant to § 1(2b) AFFG |
| 761,540 | 1,864,150 | 3,606,318 | 680,875 | 6,912,883 | ||||||||||||||||||
|
|
|
|
|
|
|
|
|
|
|
|
|||||||||||||
Total |
566,916 | 1,672,530 | 9,976,867 | 15,586,135 | 5,725,229 | 33,527,677 | ||||||||||||||||||
Deposits from banks |
408,642 | 49,007 | 91,432 | 238,277 | 170,425 | 957,783 | ||||||||||||||||||
Deposits from customers |
951,701 | 30,884 | 100,917 | | | 1,083,502 | ||||||||||||||||||
Debt securities issued |
| 7,764,288 | 4,914,619 | 14,714,365 | 1,451,633 | 28,844,905 | ||||||||||||||||||
Deriv. financial instruments |
| 70,036 | 418,640 | 431,725 | 51,625 | 972,025 | ||||||||||||||||||
|
|
|
|
|
|
|
|
|
|
|
|
|||||||||||||
Total |
1,360,343 | 7,914,214 | 5,525,608 | 15,384,367 | 1,673,683 | 31,858,215 | ||||||||||||||||||
|
|
|
|
|
|
|
|
|
|
|
|
Remaining maturities purs. to § 64(1) BWG at 31 Dec 2023
thousand |
Repayable on demand |
Up to 3 months |
3 months up to 1 year |
1 up to 5 years | More than 5 years |
Total | ||||||||||||||||||
Loans and advances to banks |
1,407,531 | 883,205 | 7,519,918 | 8,765,434 | 3,342,252 | 21,918,340 | ||||||||||||||||||
Loans and advances to customers |
417,354 | 60,519 | 214,407 | 832,254 | 757,797 | 2,282,332 | ||||||||||||||||||
Other financial assets |
43,216 | 79,491 | 409,028 | 1,462,639 | 611,726 | 2,606,100 | ||||||||||||||||||
Deriv. financial instruments |
| 2,454 | 36,004 | 259,490 | 165,852 | 463,801 | ||||||||||||||||||
Guarantees pursuant to § 1(2b) AFFG |
| 619,668 | 1,170,619 | 4,640,587 | 686,628 | 7,117,500 | ||||||||||||||||||
Current tax assets |
| | 663 | | | 663 | ||||||||||||||||||
|
|
|
|
|
|
|
|
|
|
|
|
|||||||||||||
Total |
1,868,101 | 1,645,337 | 9,350,640 | 15,960,404 | 5,564,256 | 34,388,738 | ||||||||||||||||||
Deposits from banks |
313,859 | 322,213 | 106,776 | 266,444 | 130,537 | 1,139,829 | ||||||||||||||||||
Deposits from customers |
1,034,915 | 2,904 | 90,703 | 5,896 | | 1,134,417 | ||||||||||||||||||
Debt securities issued |
| 6,907,777 | 5,870,451 | 13,804,150 | 1,426,469 | 28,008,847 | ||||||||||||||||||
Deriv. financial instruments |
| 71,822 | 336,066 | 1,703,916 | 36,834 | 2,148,639 | ||||||||||||||||||
|
|
|
|
|
|
|
|
|
|
|
|
|||||||||||||
Total |
1,348,774 | 7,304,716 | 6,403,997 | 15,780,405 | 1,593,840 | 32,431,732 | ||||||||||||||||||
|
|
|
|
|
|
|
|
|
|
|
|
90
Note 31 Subordinated assets
In relation to the development aid activities of OeEB, there are subordinated assets in the balance sheet items Loans and advances to banks in the amount of 57.6 million (2023: 72.4 million), Loans and advances to customers in the amount of 23.0 million (2023: 23.4 million), and Other financial assets in the amount of 63.2 million (2023: 58.9 million) that are covered by guarantees from the Republic of Austria.
Note 32 Assets pledged as collateral
thousand |
2024 | 2023 | ||||||
Collateral for credit risks in derivative financial instruments |
||||||||
Collateral pledged |
514,878 | 1,753,163 | ||||||
Collateral received |
257,679 | |
The change in the assets and liabilities pledged as collateral was due to the changes in the collateral furnished and received pursuant to ISDA contracts with derivatives partners (see Note 19).
Note 33 Contingent liabilities and other off-balance sheet commitments
The contingent liabilities not reported on the balance sheet in the amount of 682.7 million (2023: 799.2 million) pertained to guarantees issued by OeEB in the amount of 26.8 million (2023: 38.5 million) that were in turn backed by guarantees from the Republic of Austria pursuant to the AusfFG and guarantees issued by OeHT in the amount of 656.0 million (2023: 760.7 million) that were backed by an indemnity from the Republic of Austria. The undrawn credit facilities and commitments to lend came in at 3,108.6 million (2023: 4,403.1 million) (see Note 37). There are also security purchase obligations in the amount of 44.7 million (2023: 44.5 million) relating to the activities of OeEB. These purchase obligations are in turn covered by guarantees of the Republic of Austria pursuant to the AusfFG.
Note 34 Other off-balance sheet commitments
Pursuant to § 2(3) ESAEG (Deposit Guarantee Schemes and Investor Compensation Act), the fully consolidated companies of OeKB Group are required to guarantee a proportionate amount of deposits under the deposit insurance system operated by the Vienna-based Einlagensicherung AUSTRIA Ges.m.b.H. OeKB, OeEB, OeKB CSD, and OeHT are members of this institution.
Note 35 Fiduciary assets and liabilities
Off-balance sheet fiduciary transactions from the segment export financing amounted to 161.2 million (2023: 180.3 million). The fiduciary transactions for the Republic of Austria pertain mostly to the operations of the development bank that were entered into under the advisory programme and the Holdings financed by federal funds according to an agreement between OeEB and BMF, as well as to the fiduciary account of the federal government.
91
Off-balance sheet fiduciary transactions from the tourism financing amounted to 453.0 million (2023: 484.3 million). The fiduciary transactions under the ERP fund pertain largely to the business activities of OeHT that were commenced under the aws erp tourism programme (legal basis: ERP Fund Act, general provisions for the aws erp programme, Regulation [EU] No 651/2014 Art 14 and 17, and Regulation [EU] No 1407/2013).
Note 36 Other disclosures on assets and liabilities pursuant to UGB/BWG
Supplementary disclosures purs. to § 43 and § 64 BWG
31 December 2024 | 31 December 2023 | |||||||||||||||
thousand |
Assets | Liabilities and equity |
||||||||||||
Denominated in foreign currency |
2,083,424 | 23,316,829 | 2,528,553 | 20,642,295 | ||||||||||||
Issued or originated outside Austria |
4,336,285 | 29,369,900 | 5,305,746 | 28,919,793 |
Disclosures pursuant to § 225(3) and (6) UGB
Of the Other assets, 8.0 million (2023: 9.1 million) will come due after the reporting date, and of the Other liabilities, 24.5 million (2023: 29.2 million) will come due after the reporting date.
Note 37 Financial risk management and loan loss provisions
Overview and special features of OeKB Group
In significant business segments, OeKB Group acts as a contractor to the Republic of Austria. It engages in no retail or deposit-taking business. As the parent company, OeKB is a special-purpose bank for capital and energy market services, and the Austrian export industry. The bank subsidiary Oesterreichische Entwicklungs-bank AG is the official development bank of the Republic of Austria and supplements the Export Services, and the bank subsidiary OeKB CSD GmbH the Capital Market Services. Österreichische Hotel- und Tourismusbank Gesellschaft m.b.H., which finances investment projects in the Austrian tourism and leisure industry, is managed as the separate Tourism Services segment.
Risk management and risk controlling are key processes that are integral to the business strategy and are designed to ensure the lasting stability and profitability of the company and the entire OeKB Group. Each risk exposure is accepted after careful consideration and must conform with the risk policy and strategy defined by the Executive Board. The policy and strategy are intended to ensure a stable return on equity on the basis of a conservative approach to business and operational risks. The risk policy and strategy set out the risk management principles, the risk appetite, the key features of the risk management organisation, and the principles for the measurement, control, and limitation of the defined risk categories as well as principles for the handling of ESG risks.
The Export Financing Scheme represents the majority of the business model and thus of the assets on the balance sheet see also Note 1.
92
The risks of the EFS that is administered for the Republic of Austria are mitigated by extensive collateral and guarantees, especially from the Republic of Austria. The Export Financing Guarantees Act sets out the requirements for guarantees for export lending and thus the conditions for customer access to credit under the scheme, as well as the rules for the Austrian government guarantees protecting creditors in refinancing operations (creditor guarantees) and the government guarantees for exchange rate risk (exchange rate guarantees).
Exemptions from regulatory requirements are highly important for the business model. OeKB Group is not subject to the liquidity regulations (LCR, NSFR) or European and national provisions for the banking union (such as the BRRD). Further exemptions exist regarding export financing (i.e. the EFS), in particular the exemption from the CRR (Regulation [EU] No 575/2013). These exemptions apply to OeKB as the parent company of OeKB Group as well as to the fully consolidated banking subsidiary Oesterreichische Entwicklungsbank AG (see § 3[1]7 BWG). Similar exceptions apply to the OeKB Group member OeKB CSD GmbH, which is authorised as a central depository under the CSD Regulation (see § 3[1]12 BWG) and for Österreichische Hotel- und Tourismusbank GmbH (see § 3[1]11 BWG).
OeKB as the parent bank runs the Internal Capital Adequacy Assessment Process (ICAAP) pursuant to § 39a(1) and (3) BWG on a consolidated basis as the Group ICAAP. The risks at the individual company level are managed in part by setting risk budgets and monitoring compliance with these budgets on a quarterly basis.
Because of the special importance of the Export Financing Scheme and based on the management principles of OeKB Group, the EFS is treated as a separate investment risk entity (part of credit risk) in the Group ICAAP. For this purpose, a separate risk coverage calculation is performed for the EFS. The EFS poses no risks for the OeKB Group so long as it can bear its own risks. Any risk exceeding the Export Financing Schemes risk coverage capital would become part as a credit risk of the Groups ICAAP. For details, see Chapter ICAAP EFS and its integration in the Group ICAAP.
The following contents of this note specify the risk management objectives, policies, and processes of OeKB Group with regard to market, credit, business, and liquidity risk, operational risk and other non-financial risks, and the impacts of climate-related factors in particular on the risk types.
Aside from the sub-ICAAP for the EFS (see above) and the allocation of risk budgets for the bank subsidiaries, no other risk capital is assigned to the individual segments of OeKB Group. Because of the far-reaching exceptions (see above), risk management is not conducted according to the CRR regulations for the most part, but according to the pillar 2 concepts.
Risk management framework
The Executive Board bears overall responsibility for the establishment of an adequate, functional, and holistic risk management system that covers all material operational and business risks of OeKB Group. It meets this obligation by enacting suitable organisational measures as well as by providing a suitable guideline structure.
Guideline structure
One central guideline of the risk management framework is the risk policy and strategy of OeKB Group, which the Executive Board formulates and adopts in coordination with the Chief Risk Officer (CRO) and in consultation with the Risk Committee of the Supervisory Board on an annual basis in line with the business strategy.
93
The risk policy and strategy set out the risk management principles, the key features of the risk management organisation, the risk appetite, and the principles for the measurement, management, and limitation of the defined risk categories and the integration of sustainability factors. In this manner, the Executive Board ensures the uniform management of risks throughout the OeKB Group.
Each risk exposure that is accepted must conform with the Risk Policy and Strategy of OeKB Group. The principles and standards for ethical business practices are set forth in the Code of Conduct and are binding for all employees. These especially govern the handling of data, complaints, and conflicts of interest as well as compliance, whistleblowing, the prevention of corruption and money laundering, and the fit and proper policy for key personnel. The remuneration policy contains the principles for pay pursuant to the BWG and takes account of the relevant risks. In the standard operating procedure for document management, clear tasks and roles are assigned for the creation, review, release, distribution, revision, and archiving of documents. An effective internal control system is in place to ensure proper processes and correct financial reporting. Internal Audit/Group Audit serve as the third line.
Organisation
Given OeKB Groups key business activities and its specific business and risk structure, the Bank has adopted a clear functional organisation for its risk management process with well defined roles.
The Risk Management Committee (RMC), the Non-Financial Risk Committee (NFRC), and the Cyber Security Executive Committee (CSEC), each of which includes a representative of the overall Executive Board, play a key role in risk management.
The task of the RMC, which is chaired by the Chief Risk Officer (CRO), is strategic financial risk management and controlling including ESG risks. The Committee is the recipient of the risk reports, monitors and manages the risk profiles of the individual financial risks, and adopts or proposes to the Executive Board any necessary measures, including limits and risk budgets derived from the risk coverage calculation. Key findings of the NFRC und CSEC are reported to the RMC to ensure a comprehensive view and assessment of all risks.
The NFRC serves to manage non-financial risks, in particular operational and ICT (information and communications technology) risks and is directed by the central office for the ICS and ORM, which has been located in the Risk Controlling department since October 2024.
The CSEC is chaired by the Chief Information Security Officer (CISO) and serves, among other things, to regularly exchange information with the Executive Board, to ensure governance, to evaluate risks, and to provide advice on and commission measures in the area of information and cyber security. The CISO is responsible for the information and cyber security of OeKB Group and reports regularly and directly to the overall Executive Board.
The implementation of the measures decided by the RMC is especially overseen by the CRO. Falling under the risk oversight officer on the Executive Board in organisational terms, direct reporting to the full Executive Board applies once per year as well as reporting to the Risk Committee of the Supervisory Board. The CRO manages the Risk Controlling department (RCO), which is responsible for the measurement and assessment of financial risks, operating-level financial risk controlling including monitoring the internal limits, and the practical implementation of the Internal Capital Adequacy Assessment Process. The central office for ORM and the ICS has also been integrated into the RCO since October 2024, thus covering the methodological and policy competence for ORM and the ICS. The operational implementation of the requirements for ORM and the ICS is embedded in the OFM (Organisation & Facility Management) department as part of the process management.
94
Other key functions of the governance structure are the officers for preventing money laundering, for compliance (WAG and § 39[6] BWG), data protection, and for outsourcing all of whom report directly to the Executive Board. The activities relating to Operational Risk Management, Information Security, Internal Control System and Compliance are subject to ongoing coordination.
Comprehensive risk analyses are conducted every year to ensure that all material risks have been identified and that they can be measured and managed. New products and services are subject to a product introduction process, which includes a risk assessment.
Risk management is supplemented by the Internal Control System (ICS), which ensures compliance with guidelines and risk-mitigation measures. Ensuring compliance with the legal requirements for the ICS and the implementation of the ICS policy adopted by the Executive Board as well as the ongoing refinement of this policy fall under the methodological responsibility of the central office for the ICS and ORM. Largely automated IT general controls and audits conducted by the Internal Audit/Group Audit department ensure its effectiveness. Internal Audit/Group Audit serve as 3rd line and conduct regular audits on operational manage-ment (1st line), and on the organisational units involved in the risk management processes (2nd line), and on the employed procedures.
OeKB Group has implemented a comprehensive and risk-oriented reporting and limit system to ensure that the senior management responsible for managing and monitoring financial and operational risks are informed adequately and in good time.
The Supervisory Board oversees all risk management arrangements and receives quarterly reports on OeKB Groups risk situation. These risk reports present a detailed view of OeKB Groups risk situation. The Supervisory Board also maintains a Risk Committee pursuant to § 39d BWG, which convened one meeting in 2024. The Audit Committee of the Supervisory Board also monitors the effectiveness of the Internal Control System. The Supervisory Board has also set up a Nomination Committee, a Remuneration Committee, and a Working Committee.
The Business Continuity Management (BCM) of OeKB Group is designed to identify risks to critical business processes and business operations and to establish suitable measures. The goal of BCM is to ensure in critical situations that relevant business processes are not interrupted or are only interrupted temporarily or to the lowest extent possible and that the economic existence of OeKB is ensured even in the event of major damage incidents. The business continuity management policy governs the contingency and crisis management organisations.
Internal Capital Adequacy Assessment Process (ICAAP)
Risk appetite and approaches to risk management
The ICAAP is conducted pursuant to § 39a(3) BWG at the group level and serves to ensure the maintenance of the defined bank-specific level of capital adequacy and forms an integral part of the management process as a controlling and measurement tool. The risk appetite is set annually by the Executive Board in coordination with the Risk Committee of the Supervisory Board.
95
The process accounts for the going concern approach and the gone concern approach. The key difference between the two approaches lies in the definition of the economic capital available to cover risk and the choice of the confidence level for the risk (99.9% for the going concern approach and 99.98% for the gone concern approach).
Risk coverage calculations and limitation
The risk coverage calculation is performed quarterly by the Risk Controlling department which as a risk oversight function is independent from risk origination and is reported both to the Risk Management Committee and the Supervisory Board. In the risk coverage calculation, the economic capital requirement is compared with the risk coverage capital (internal or business capital). This is done in consideration of different coverage objectives and approaches (going concern and gone concern).
The key variable in the measurement and management of risk is economic capital. Risk is defined by OeKB as the danger that the actual outcome will be less favourable than the expected outcome (unexpected loss). The economic capital is calculated on the basis of a one-year horizon at the confidence levels defined in the steering principles.
The risk coverage calculation especially takes all defined material risk categories into account, namely credit risk, market risk, operational risk, and business risk. Credit risks are measured using the credit value at risk (CVaR) approach and market risks using the VaR approach. Business risk is determined on the basis of a statistical analysis of empirical target deviations in the operating profit.
Based on the results of the risk coverage calculation and the recommendations by the Risk Management Committee, the Executive Board defines the limits for market and credit risk for OeKB Group as a whole as well as risk budgets for the individual banks in OeKB Group. Compliance with these limits and risk budgets is monitored by the Risk Controlling department and reported to the Risk Management Committee and the Executive Board on a quarterly basis. There is no steering of individual business divisions or segments in the economic capital within OeKB Group, as this is of limited relevance; a separate ICAAP is conducted for the EFS. As in the prior years, the risk-bearing capacity of the EFS was assured as at 31 December 2024, meaning that there is no risk of spill-over from the EFS to the Group ICAAP. See also the section EFS ICAAP and its integration in the Group ICAAP.
Additional operational limits are also in place in key areas. These also cover the monitoring of risk concentrations.
In the risk coverage calculation, inter-concentrations of risk between risk types are taken into consideration by determining the aggregate risk by adding up the individual type-specific risk capital amounts and thus assuming a perfectly positive correlation.
The measurement of operational risk is based on the Basic Indicator Approach expanded by a distribution for scaling to the respective confidence level of the specific approach.
The following table shows the high risk-bearing capability of OeKB Group in the going concern and gone concern approach.
96
Risk coverage calculation for OeKB Group
31 December 2024 | 31 December 2023 | |||||||||||||||
thousand |
Economic capital | Available risk coverage capital |
||||||||||||
Going concern |
146,805 | 854,043 | 196,109 | 836,755 | ||||||||||||
|
|
|
|
|
|
|
|
|||||||||
Gone concern |
195,828 | 1,037,826 | 254,566 | 1,020,538 | ||||||||||||
|
|
|
|
|
|
|
|
The economic capital calculations are supplemented with stress tests. This involves both univariate tests for key risk drivers and multivariate market-specific tests. To assess the sustainability of the risk-bearing capacity under adverse market conditions, input parameters such as volatilities, correlations, and probabilities of default are subject to stress on the basis of a macroeconomic scenario and then evaluated on the basis of this risk- bearing capacity.
Comparison of risk pursuant to ICAAP with minimum regulatory capital requirements pursuant to Art 92 of Regulation (EU) No 575/2013
Value at Risk pursuant to ICAAP (confidence level 99.98%) |
Minimum regulatory capital requirement purs. to Reg. (EU) No 575/2013 (see Note 28) |
|||||||||||||||
thousand |
31 Dec 2024 | 31 Dec 2023 | 31 Dec 2024 | 31 Dec 2023 | ||||||||||||
Credit risk |
67,920 | 77,079 | 31,852 | 33,007 | ||||||||||||
Commodity and foreign exchange risk |
312 | 449 | | | ||||||||||||
Other market risk in the banking book |
73,603 | 126,792 | | | ||||||||||||
Other risks |
9,325 | 12,122 | | | ||||||||||||
Operational risk |
44,668 | 38,124 | 35,105 | 29,961 | ||||||||||||
|
|
|
|
|
|
|
|
|||||||||
Total |
195,828 | 254,566 | 66,956 | 62,968 | ||||||||||||
|
|
|
|
|
|
|
|
The risk in the ICAAP exceeded the minimum regulatory capital requirement pursuant to CRR. This resulted primarily from the fact that OeHT does not fall under the CRR and that the market risk in the banking book is not covered by the CRR regulatory capital.
Market risk banking book
Market risk is the risk of losses due to changes in market parameters. OeKB Group distinguished between specific and general interest rate risk, foreign exchange risk, and equity price risk. As no trading book is maintained, market risks relate only to banking book positions.
The risk amounts for market risk are assessed in the Group ICAAP (see previous table) using the value at risk (VaR) concept to estimate maximum potential losses within a single year (holding period). According to the steering principles, the calculation is carried out at the two confidence levels of 99.9% and 99.98% by means of Monte Carlo simulations.
97
The market risk limit is set by the Executive Board based on the proposal of the Risk Management Committee. In operational terms, this is managed on the basis of the requirements of the (Group) ALCO and Executive Board by the Treasury department, which administers the proprietary portfolio that makes the most significant VaR contribution. The proprietary investments consist of bonds held directly in securities accounts and managed on the basis of a buy-and-hold strategy. They are recognised according to the amortised cost, which is intended to avoid valuation effects stemming from changes in market interest rates.
The effects of extreme market changes are also determined by means of stress tests, which also serve to assess the plausibility of the VaR values. These tests comprise both the determination of the value at risk under stress conditions (such as credit migration and correlations) and multivariate stress tests based on specific historical scenarios (such as 11 September, 2007/08 financial crisis, COVID-19 2020, Ukraine crisis 2022). The effects of interest rate shifts and twists are also calculated in present-value and the supervisory outlier tests are performed on a quarterly basis.
General and specific interest rate risk in the banking book
In addition to the stochastic interest rate risk calculation in the risk coverage calculation, the general interest rate risk is also regularly calculated using interest rate scenarios. The following table shows the sensitivity of the net present value (PV) and of the net interest income (NII) depending on defined interest rate shocks.
General interest rate risk in the banking book (IRRBB) at 31 Dec 2024
Parallel shift | Short/long twist | Parallel shift of key currencies | ||||||||||||||||||||||||||||||||||
thousand |
PV/NII | +50 BP | (50) BP | -/+25 BP | +/-25 BP | EUR +25 BP |
EUR (25) BP |
CHF +25 BP |
CHF (25) BP |
|||||||||||||||||||||||||||
Interest rate sensitivities on a present value basis (excl. non-interest-bearing assets) |
|
|||||||||||||||||||||||||||||||||||
OeKB Group |
2,114,642 | (79,925 | ) | 82,624 | (19,300 | ) | 19,923 | (53,047 | ) | 53,978 | 14,762 | (15,131 | ) | |||||||||||||||||||||||
Of which EFS |
804,177 | (69,627 | ) | 72,376 | (14,925 | ) | 15,584 | (48,340 | ) | 49,274 | 14,758 | (15,017 | ) | |||||||||||||||||||||||
|
|
|
|
|
|
|
|
|
|
|
|
|
|
|
|
|
|
|||||||||||||||||||
Interest rate sensitivities on an earnings basis (1 year, before guarantee fee) |
|
|||||||||||||||||||||||||||||||||||
OeKB Group |
322,230 | (21,875 | ) | 18,607 | 9,434 | (10,366 | ) | 10,410 | (10,439 | ) | (20,991 | ) | 20,117 | |||||||||||||||||||||||
Of which EFS |
199,510 | (22,746 | ) | 19,479 | 9,853 | (10,785 | ) | 9,872 | (9,901 | ) | (20,991 | ) | 20,117 | |||||||||||||||||||||||
|
|
|
|
|
|
|
|
|
|
|
|
|
|
|
|
|
|
General interest rate risk in the banking book (IRRBB) at 31 Dec 2023
Parallel shift | Short/long twist | Parallel shift of key currencies | ||||||||||||||||||||||||||||||||||
thousand |
PV/NII | +50 BP | (50) BP | -/+25 BP | +/-25 BP |
EUR +25 BP |
EUR (25) BP |
CHF +25 BP |
CHF (25) BP |
|||||||||||||||||||||||||||
Interest rate sensitivities on a present value basis (excl. non-interest-bearing assets) |
|
|||||||||||||||||||||||||||||||||||
OeKB Group |
2,101,292 | (68,077 | ) | 70,596 | (18,385 | ) | 18,948 | (50,976 | ) | 51,912 | 16,300 | (16,594 | ) | |||||||||||||||||||||||
Of which EFS |
781,354 | (57,621 | ) | 60,161 | (14,241 | ) | 14,857 | (45,927 | ) | 46,869 | 16,319 | (16,613 | ) | |||||||||||||||||||||||
|
|
|
|
|
|
|
|
|
|
|
|
|
|
|
|
|
|
|||||||||||||||||||
Interest rate sensitivities on an earnings basis (1 year, before guarantee fee) |
|
|||||||||||||||||||||||||||||||||||
OeKB Group |
323,311 | (15,478 | ) | 15,390 | 6,814 | (6,830 | ) | 12,732 | (12,758 | ) | (20,518 | ) | 20,555 | |||||||||||||||||||||||
Of which EFS |
199,085 | (16,602 | ) | 16,516 | 7,209 | (7,224 | ) | 12,108 | (12,133 | ) | (20,518 | ) | 20,555 | |||||||||||||||||||||||
|
|
|
|
|
|
|
|
|
|
|
|
|
|
|
|
|
|
98
The supervisory outlier tests (SOTs) pertaining to the general interest rate risk pursuant to EBA Guideline 2022/14 were well below the thresholds defined by the supervisory authorities throughout the reporting period from a present-value perspective and from a net-interest-income perspective. The internal model developed for calculating the SOTs is oriented closely to the standardised methodology according to the EBA Guideline. Due to the exceptions (see above), key portions of the balance sheet especially the EFS are not covered by the SOTs.
Over the course of 2024, OeKB also applied this new internal model to the portfolios that are excepted from the SOTs and uses this model, which is closely oriented towards the standardised methodology pursuant to the EBA Guideline, for the management of the general interest rate risk of the Group and the EFS. The following table shows the values of the new model as at 31 Dec 2024 for comparison with the sensitivities above. This new model differs in several details, among which the new specification of the twist has the greatest effect. The key conceptual difference is that the table above contains concrete portfolio plans while the new approach assumes a constant portfolio.
General interest rate risk in the banking book (IRRBB) at 31 Dec 2024/Constant portfolio
Parallel shift | Short/long twist | Parallel shift of key currencies | ||||||||||||||||||||||||||||||||||
thousand |
PV/NII | +50 BP | (50) BP | -/+25 BP | +/-25 BP |
EUR +25 BP |
EUR (25) BP |
CHF +25 BP |
CHF (25) BP |
|||||||||||||||||||||||||||
Interest rate sensitivities on a present value basis (excl. non-interest-bearing assets) |
|
|||||||||||||||||||||||||||||||||||
OeKB Group |
2,105,364 | (79,916 | ) | 82,186 | (21,166 | ) | 20,117 | (52,138 | ) | 52,882 | 14,199 | (14,390 | ) | |||||||||||||||||||||||
Of which EFS |
813,072 | (68,545 | ) | 70,820 | (16,279 | ) | 15,126 | (47,095 | ) | 47,847 | 14,204 | (14,395 | ) | |||||||||||||||||||||||
|
|
|
|
|
|
|
|
|
|
|
|
|
|
|
|
|
|
|||||||||||||||||||
Interest rate sensitivities on an earnings basis (1 year, before guarantee fee) |
|
|||||||||||||||||||||||||||||||||||
OeKB Group |
319,057 | (19,652 | ) | 19,652 | 4,381 | (4,374 | ) | 11,733 | (11,733 | ) | (20,894 | ) | 20,894 | |||||||||||||||||||||||
Of which EFS |
202,968 | (21,383 | ) | 21,383 | 4,729 | (4,729 | ) | 10,715 | (10,715 | ) | (20,894 | ) | 20,894 | |||||||||||||||||||||||
|
|
|
|
|
|
|
|
|
|
|
|
|
|
|
|
|
|
In addition to the general interest rate risk, EBA Guideline 2022/14 also governs how the specific interest rate risk in the banking book is to be taken into account. This risk must also be assessed from a present-value perspective and an income perspective. This has been taken into account in the ICAAP on a present-value basis for many years and amounted to 13.7 million as of 31 Dec 2024 in the gone concern view (31 Dec 2023: 23.3 million). The associated income risk is minor and is included in the regular internal reporting.
Credit risk
OeKB Group differentiates between the following types of credit risk: counterparty risk/default risk, investment risk, and concentration risk.
Beyond the EFS, the only entity in OeKB Group that engages in significant credit operations is the Tourism Services segment (tourism financing). The overall low credit risks compared with the risk coverage capital of OeKB Group therefore stem primarily from the proprietary portfolio (bonds), the non-consolidated holdings, and the tourism financings extended by OeHT. The latter is subject to high collateral standards. The majority of the loans are secured by banks but also by public sector entities and to a limited extent by mortgages.
99
Credit risks are assessed using the credit value at risk (CVaR). This is the difference between the maximum loss at a given confidence level (for example 99.98% in the gone concern approach) and the expected loss associated with the respective default. The CVaR is calculated by means of the Vasicek distribution assuming a one-year holding period. The CVaR amounted to 67.9 million as at 31 Dec 2024 (31 Dec 2023: 77.1 million).
OeKB follows the strategy of broad diversification in the management of its proprietary portfolio. There are individual concentrations of exposure to issuers with the highest credit ratings. The major loan limits must also be followed in this, and reports are submitted regularly to the RMC and the Executive Board. The Tourism Services segment concentration on the tourism and leisure industry in Austria is inherent to the companys business model, so loans are only provided under stringent collateral requirements.
The credit risk limits are set by the Executive Board according to the proposal of the RMC, which is based on the risk coverage calculation; compliance is monitored by the RCO. Credit derivatives are not used.
The creditworthiness of counterparties is assessed using a clear rating and mapping system. This rating is based on a detailed 22-part internal master scale that differentiates between sovereign and other counterparties in the very good rating segment in assessing the probability of default. The PDs are derived taking migration risks into account. This rating and mapping system is adopted by the RMC and is reviewed annually by the RCO.
EFS ICAAP and its integration in the Group ICAAP
The EFS, which OeKB manages as an agent of the Republic of Austria, accounts for the vast majority of the total assets and is managed as a separate accounting entity from the other business activities. In line with the steering principles, OeKB performs a separate risk coverage calculation for the EFS. Risks within the EFS that are not covered by the guarantees from the Republic of Austria (guarantees and avals according to AusfFG and AFFG) are evaluated and compared with the EFS interest rate stabilisation provision pursuant to UGB, which serves as risk coverage capital for the EFS.
This EFS interest rate stabilisation provision results from surpluses generated in the EFS, which are to be retained in the EFS in accordance with the decree of the Ministry of Finance from 1968 (non-interest liability). As the tax office only treats the EFS interest rate stabilisation provision as a deductible debt item if the funds are used to lower the effective refinancing interest rate, a tax provision is added to the credit risks when calculating the risk-bearing capacity.
The EFS is taken into account as investment risk within OeKB Groups Internal Capital Adequacy Assessment Process. Any risk exceeding the risk coverage capital of the EFS thus becomes part of the OeKB Groups credit risk and is included in the calculation of risk coverage for OeKB Group.
The EFS has always had an unimpaired risk-bearing capacity to date, and there has never been a spillover of risks. The total of the risks in the EFS described below is less than the risk coverage capital in the EFS again in 2024, meaning that no risk from the EFS is accounted for in the Group ICAAP.
The most substantial risk types by far are credit and interest rate risk. Other relevant risk positions are, for example, CVA risk in connection with swap transactions and the refinancing risk.
100
Credit risk in the EFS
OeKB Groups credit exposure consists primarily of financial instruments in the Export Financing Scheme (loans and advances to banks and customers). These loans are extended according to strict principles and high collateral requirements (mainly by guarantees of the Republic of Austria). To secure credit risks in connection with derivative financial instruments, collateral agreements are concluded with all counterparties. Credit derivatives are not used.
The extensive collateral and guarantees provided by the Republic of Austria result in a high level of risk concentration vis-à-vis the Republic of Austria, which is not measured due to the high quality of the collateral.
Credit risks above and beyond this are assessed using the credit value at risk (CVaR) method. This is the difference between absolute VaR at a given confidence level (99.9% in the going concern approach and 99.98% in the gone concern approach) and the expected loss associated with the respective default. The CVaR is calculated by means of a Monte Carlo simulation assuming a one-year holding period.
In addition to the risk concentration vis-à-vis the Republic of Austria, there are also significant concentrations vis-à-vis banks and other guarantors. These concentrations are inherent to and scope for the business model; diversification in this regard is limited. Due to the use of the Monte Carlo simulation, the calculated CVaR contains both business partner concentration risks as well as concentrations relating to guarantors and the probability of impairment as based on their credit ratings and correlation with the borrowers.
Credit risk is managed on the basis of the risk coverage calculation and the limits defined on this basis, and in day-to-day operations through a business partner limit system in which business partners and guarantors as well as combinations thereof are assigned limits. The concrete limits are assigned by the Executive Board based on the recommendations of the Credit Committee. Compliance is monitored by the Risk Controlling department.
Market risk in the EFS
In accordance with the primary steering principle, market risk is measured by means of the earnings at risk (EaR) and includes interest rate risks and, to the extent not guaranteed by the Republic of Austria, a limited level of exchange rate risks. As in the case for the measurement of credit risk, market risk is measured by means of a Monte Carlo simulation with the confidence levels specified above and a planning period of one year. The value at risk (VAR) is also determined. These stochastic risk measurement methods are supplemented by the measurement of the impacts of stress assumptions and the calculation of the sensitivity of the net interest income and present value to interest rate shifts and twists, which are also reported to the RMC, ALCO, and Executive Board.
Treasury department is responsible for the operational management of market risk and, in particular, in coordination with the Asset Liability Management Committee (ALCO). ALCO, which includes the Executive Board, is also responsible for defining the EFS asset rates and for designing the EFS products.
Business risk
OeKB Group primarily understands business risks to mean declines in profits caused by unexpected changes in business volume or margins or unexpected operating costs and expenses. Unexpected refers to deviations from the Groups planning. To the extent that they have materialised in the past, these risks also include business model risks and strategic risks arising from business policy decisions and changes in economic or legal conditions as well as reputation risks as negative consequences of stakeholder perceptions.
101
Business risk is initially determined on a quantitative basis and then subject to expert review so that concrete limits can be set annually by the RMC. As this risk category is a profit risk, it is accounted for in the risk coverage calculation by being deducted from the risk coverage capital.
Aside from quantitative inclusion in the ICAAP, the Group is aware of the relevance of these risks in particular in its role as a special-purpose bank group, due to the high importance of the Export Financing Scheme, and in light of the associated legal exceptions. The active monitoring of legislative changes, stakeholder dialogue, adherence to a conservative risk policy, and a proactive reputation policy (including Code of Conduct, sustainability policy) are central factors in mitigating these risks.
Other risks in the ICAAP
Model risks and risks from risk types that are not separately measured are taken into account in the risk coverage calculation by the application of percentage surcharges to the determined economic capital.
OeKB Group faces various risk concentrations. Two of the most significant concentrations are the business field concentration as a special- purpose bank group and the dependence on the guarantees provided by the Republic of Austria in connection with the EFS. These concentrations are inherent to and scope for the business model; diversification in this regard is limited.
Inter-concentration risks that arise from interdependences between different risk types are factored into the Group ICAAP as well as into the EFS ICAAP by aggregating each risk types (credit risk, market risk, etc). Multivariate stress tests are also performed to evaluate these risks.
The risk of excessive leverage, and hence the leverage ratio, are of minor significance for OeKB Group as most of its assets stem from the Export Financing Scheme. The EFS exposure is secured by the guarantees of the Republic of Austria to a large extent, and the debt financing is part of the business model.
Non-financial risks and operational risks
Unlike market and credit risks, for example, non-financial risks can only be measured and managed through key figures to a limited extent. These thus fall more extensively than the other risks under the responsibility of line management and business process owners, and thus under the responsibility of every single employee. The definition of the risk appetite and the management of these risks occur on a qualitative and quantitative basis. OeKB Group includes the following risks in this category: business model risk, strategic risk, reputation and conduct risk, compliance risk, and operational risk, including IT risks.
A five-stage traffic light system is used for the holistic assessment of the non-financial risks on a quarterly basis. A workflow-based decentralised assessment of the various risk categories is conducted by all departments, bank subsidiaries, and risk and compliance officers using a special software system (ARIS). The dashboard system provides an overview and allows an integrated evaluation of the overall situation. The goal is to have all processes, precautions, and measures put into place and executed in such a manner that the expected annual damages are below 500 thousand (half of the tolerable error specified in the ICS).
Operational risk is understood to mean the risk of losses resulting from the inadequacy or failure of internal processes, people, or systems, or from external events, which includes legal risks, model risks, and information and communication technology (ICT risk) risks, but not strategic risks and reputation risks. The economic capital requirement for the Group ICAAP is determined by scaling the minimum regulatory capital requirement according to the Basic Indicator Approach to the respective confidence level.
102
Operational risk is dictated by the corporate culture and the behaviour of each individual more strongly than market risk and credit risk. With this in mind, the Executive Board has established a Code of Conduct with rules, as such as for corruption prevention, the whistle-blower system, and the complaint handling system.
Bank-wide standards and processes are derived from the risk policy and strategy in various policies such as the operational risk manual and the BCM policy. All policies are subject to annual review. The central committee for managing operational risk is the Non-Financial Risk Committee, which is directed by the central office for ORM and ICS. Damage incidents and measures are also discussed in this committee. The effectiveness of plans and concepts is checked using tests and exercises. The ongoing maintenance and evaluation of the central loss incident database, in which near losses are also documented, helps to ensure the continuous optimisation of operational risks.
Legal risks are minimised through continuous monitoring by the respective business segments and the Legal & Compliance department, and by the appointment of Compliance Officers pursuant to the WAG and § 39(6) BWG.
The internal control system was fundamentally revised in technical and organisational terms in 2024 and a central office for ORM and ICS was installed. In addition to methodological and policy responsibility, the office is also responsible for directing the Non-Financial Risk Committee (NFRC). The NFRC, in which the full Executive Board is represented as is the case with the RMC, manages the non-financial risks.
Given the high importance of information and cyber security, the Group has a separate Information Security Officer. The Chief Information Security Officer (CISO) reports directly to the Executive Board and chairs the Information and Cyber Security Executive Committee (CESEC). With the Cyber Security and Defence Programme, a far-reaching project was launched in 2022 and is proceeding according to plan. It served objectives including fulfilment of the regulatory requirements under the Digital Operational Resilience Act (DORA, Regulation [EU] 2022/ 2554), which enters into force on 17 January 2025. Certification according to ISO 27001 was successfully obtained under this project in 2024.
In addition to an effective internal control system, Internal Audit/Group Audit also contributes to reducing operational risks through regular audits as a 3rd line.
Liquidity risk
OeKB Group differentiates between the following types of liquidity risk:
| The risk of not being able to fully meet present or future payment obligations as they fall due; |
| Refinancing risk, the risk that funding can only be obtained at unfavourable market terms; and |
| Market liquidity risk, the risk that assets can only be sold at a discount. |
Liquidity risk management is performed for OeKB Group as a unit, including the EFS.
The Executive Board defines the principles for liquidity risk management and the risk appetite in the Risk Policy and Strategy that is coordinated with the Supervisory Boards Risk Committee on an annual basis. This refers to liquidity risk as insolvency risk. This is the short-term risk of not being able to meet present or future payment obligations fully as they come due. A minimum survival period of at least one month and a target survival period of at least two months have been set for OeKB Group.
103
The goal of the liquidity strategy is to ensure sufficient access to required liquidity on acceptable terms even in difficult market situations. OeKBs excellent standing on the international financial markets for decades as an issuer coupled with the high diversification of its financial instruments, markets, and maturities, and most importantly of all the guarantee of the Republic of Austria protecting the lenders pursuant to § 1(2a) AFFG combine to facilitate market access even when markets are under special stress. The processes used to measure and manage liquidity risk are documented in the liquidity risk management manual that is adopted by the RMC.
As the overwhelming need for liquidity results from the Export Financing Scheme, the refinancing risk is factored into the risk coverage calculation for the EFS.
The central tool for the measurement of liquidity risk in the narrower sense is a monthly liquidity gap analysis. This is done using one-day time buckets for the next twelve-month period and is based on cash flow and funding projections under both idiosyncratic and systemic stress assumptions that are set against the liquidity buffer (consisting primarily of securities eligible for rediscounting by the ECB). Market liquidity risk is taken into account through corresponding haircuts for liquid assets.
The average survival period determined by this methodology was more than 6 months in 2024. OeKB Group defines the survival period as that period for which the current liquidity buffer is sufficient under an assumed combination of simultaneous idiosyncratic and systemic stresses to meet all payment obligations without having to raise additional capital on the financial markets (although the guarantees from the Republic of Austria). In a stress period, the survival period is thus the time available to take any strategic corrective action necessary. A liquidity contingency plan is in place for crisis situations.
OeKB Groups survival period
Days |
2024 | 2023 | ||||||
Annual average |
199 | 148 | ||||||
Yearly maximum |
326 | 251 | ||||||
Yearly minimum |
117 | 74 |
The unencumbered liquidity buffer of OeKB Group has the following composition:
104
Liquidity buffer of OeKB Group
thousand |
Fair values at 31 Dec 2024 |
Fair values at 31 Dec 2023 |
||||||
Cash and cash equivalents |
940 | 497,877 | ||||||
Less minimum reserves |
(68 | ) | (77,073 | ) | ||||
|
|
|
|
|||||
CCPA fiduciary account |
(42 | ) | | |||||
Cash and cash equivalents at central banks |
829 | 420,804 | ||||||
Securities deposited at the central bank |
7,979 | 7,783,660 | ||||||
Treasury bills and similar securities eligible for rediscounting |
1,264 | 1,085,299 | ||||||
Bonds from other issuers eligible for rediscounting |
360 | 242,972 | ||||||
|
|
|
|
|||||
Total |
10,432 | 9,532,735 | ||||||
|
|
|
|
The vast majority of the securities deposited at the central bank are covered bonds issued by OeKB and immediately bought back, for which reason they are not reported on the balance sheet. They are used solely to secure liquidity.
Daily liquidity is ensured on the basis of the needs and coverage calculation, and long-term liquidity is assessed on the basis of the gap analysis. Operational liquidity management is handled by the Treasury department, which reports to the ALCO. Compliance with the survival period requirements is monitored by the Risk Controlling department and reported to the RMC and the ALCO.
OeKB does not manage its liquidity according to the liquidity coverage ratio (LCR) or net stable funding ratio (NSFR). Pursuant to § 3(2)1 BWG, the following legal provisions do not apply: Part 6 of Regulation (EU) No 575/2013, §§ 27a, 39(2b)7 in conjunction with 39(4), 39(3), and 74(6)3a in conjunction with § 74(1) BWG.
The following table shows the future cash flows for the financial liabilities pursuant to IFRS 7.39. The principal flows are assigned to the individual maturity bands based on the contractual maturities. Positions that are repayable on demand are assigned to the first maturity band.
Cash flow analysis as at 31 December 2024
thousand |
Total outflows/inflows |
Up to 2 years | 2 up to 5 years | 5 up to 10 years | More than 10 years |
|||||||||||||||
Financial liabilities |
||||||||||||||||||||
Deposits from banks |
(1,024,148 | ) | (659,169 | ) | (174,931 | ) | (128,161 | ) | (61,886 | ) | ||||||||||
Deposits from customers |
(1,109,068 | ) | (565,257 | ) | (28,985 | ) | (514,826 | ) | | |||||||||||
Debt securities issued |
(30,296,927 | ) | (19,063,741 | ) | (6,629,153 | ) | (4,308,031 | ) | (296,002 | ) | ||||||||||
|
|
|
|
|
|
|
|
|
|
|||||||||||
Total |
(32,430,143 | ) | (20,288,167 | ) | (6,833,069 | ) | (4,951,019 | ) | (357,888 | ) | ||||||||||
Derivative financial instruments |
||||||||||||||||||||
Outflows |
27,000,104 | 16,879,478 | 9,266,061 | 668,719 | 185,846 | |||||||||||||||
Inflows |
(27,986,716 | ) | (17,561,262 | ) | (9,547,822 | ) | (688,035 | ) | (189,598 | ) | ||||||||||
|
|
|
|
|
|
|
|
|
|
|||||||||||
Total |
(986,612 | ) | (681,783 | ) | (281,760 | ) | (19,316 | ) | (3,753 | ) |
105
Cash flow analysis as at 31 December 2023
thousand |
Total outflows/inflows |
Up to 2 years | 2 up to 5 years | 5 up to 10 years | More than 10 years |
|||||||||||||||
Financial liabilities |
||||||||||||||||||||
Deposits from banks |
(1,099,762 | ) | (741,842 | ) | (208,558 | ) | (118,468 | ) | (30,894 | ) | ||||||||||
Deposits from customers |
(1,234,468 | ) | (644,657 | ) | (33,970 | ) | (555,841 | ) | | |||||||||||
Debt securities issued |
(29,511,979 | ) | (19,414,699 | ) | (8,416,922 | ) | (1,413,702 | ) | (266,656 | ) | ||||||||||
|
|
|
|
|
|
|
|
|
|
|||||||||||
Total |
(31,846,209 | ) | (20,801,198 | ) | (8,659,450 | ) | (2,088,012 | ) | (297,550 | ) | ||||||||||
Derivative financial instruments |
||||||||||||||||||||
Outflows |
31,887,377 | 20,481,810 | 10,980,820 | 295,316 | 129,431 | |||||||||||||||
Inflows |
(34,104,304 | ) | (21,790,989 | ) | (11,845,932 | ) | (310,541 | ) | (156,842 | ) | ||||||||||
|
|
|
|
|
|
|
|
|
|
|||||||||||
Total |
(2,216,927 | ) | (1,309,180 | ) | (865,112 | ) | (15,225 | ) | (27,411 | ) |
The following table shows the expected liquidity gaps per maturity band. Here, the contractual capital flows of the liabilities are compared with the corresponding loans and advances. The presentation takes the AFFG exchange rate guarantee into account.
Gap according to the gap analysis as at 31 Dec 2024
Up to 2 years | 2 up to 5 years | 5 up to 10 years | More than 10 years | |||||||||||||
Incl. guarantees |
(2,400,144 | ) | 798,729 | 3,041,075 | 768,042 |
Gap according to the gap analysis as at 31 Dec 2023
Up to 2 years | 2 up to 5 years | 5 up to 10 years | More than 10 years | |||||||||||||
Incl. guarantees |
(2,609,543 | ) | 661,953 | 3,191,779 | 837,222 |
The majority of the portfolio can be attributed to the Export Financing Scheme, and existing liquidity gaps can be closed at any time. Funding operations are conducted on the international financial markets, primarily via commercial paper programmes and bond issues.
106
Details on credit risk and loan loss provisions
The maximum credit risk essentially encompasses all of OeKB Groups assets (with the exception of property and equipment and intangible assets). The maximum credit risk is significantly reduced by the extensive guarantees and sureties, primarily from the Republic of Austria.
Credit rating and country breakdown
The distribution of OeKB Groups financial instruments measured at amortised cost across rating categories (summary of the master rating scale with six rating levels) was as shown in the following table. Guaranteed assets were assigned to the rating category of the guarantor in the amount of the guarantee.
Credit quality of the financial instruments at amortised cost
thousand |
Stage 1 net book value |
Stage 2 net book value |
Stage 3 net book value |
POCI net book value |
Carrying amount 2024 |
Carrying amount 2023 |
||||||||||||||||||
Loans and advances to banks |
||||||||||||||||||||||||
Rating category 1 (AAA/AA) |
17,732,013 | 20,124 | 2,344 | | 17,754,481 | 18,217,772 | ||||||||||||||||||
Rating category 2 (A) |
95,881 | | | | 95,881 | 1,230,509 | ||||||||||||||||||
Rating category 3 (BBB) |
258,792 | | | | 258,792 | 326,030 | ||||||||||||||||||
Rating category 4 (BB) |
| | | | | | ||||||||||||||||||
Rating category 5 (B) |
| | | | | | ||||||||||||||||||
Rating category 6 |
||||||||||||||||||||||||
(CCC or lower) |
| | | | | 5,767 | ||||||||||||||||||
|
|
|
|
|
|
|
|
|
|
|
|
|||||||||||||
Total |
18,086,686 | 20,124 | 2,344 | | 18,109,154 | 19,780,079 | ||||||||||||||||||
Loans and advances to customers |
||||||||||||||||||||||||
Rating category 1 (AAA/AA) |
599,680 | 205,348 | 51,472 | 49,819 | 906,319 | 797,532 | ||||||||||||||||||
Rating category 2 (A) |
1,015,589 | 163,805 | 1,670 | | 1,181,064 | 1,218,761 | ||||||||||||||||||
Rating category 3 (BBB) |
104,308 | 47,761 | 1,009 | | 153,077 | 260,336 | ||||||||||||||||||
Rating category 4 (BB) |
| | | | | 2,544 | ||||||||||||||||||
Rating category 5 (B) |
| | | 698 | 698 | 546 | ||||||||||||||||||
Rating category 6 |
||||||||||||||||||||||||
(CCC or lower) |
501 | | | 2,196 | 2,697 | 2,613 | ||||||||||||||||||
|
|
|
|
|
|
|
|
|
|
|
|
|||||||||||||
Total |
1,720,078 | 416,913 | 54,151 | 52,713 | 2,243,855 | 2,282,332 |
107
Credit quality of the financial instruments at amortised cost
thousand |
Stage 1 net book value |
Stage 2 net book value |
Stage 3 net book value |
POCI net book value |
Carrying amount 2024 |
Carrying amount 2023 |
||||||||||||||||||
Other financial assets (at amortised cost) |
||||||||||||||||||||||||
Rating category 1 (AAA/AA) |
779,914 | | | | 779,914 | 733,732 | ||||||||||||||||||
Rating category 2 (A) |
82,300 | | | | 82,300 | 104,157 | ||||||||||||||||||
Rating category 3 (BBB) |
32,990 | | | | 32,990 | 41,068 | ||||||||||||||||||
Rating category 4 (BB) |
| | | | | | ||||||||||||||||||
Rating category 5 (B) |
| | | | | | ||||||||||||||||||
Rating category 6 |
||||||||||||||||||||||||
(CCC or lower) |
95 | | | | 95 | 95 | ||||||||||||||||||
|
|
|
|
|
|
|
|
|
|
|
|
|||||||||||||
Total |
895,299 | | | | 895,299 | 879,052 | ||||||||||||||||||
Value 2024 | Value 2023 | |||||||||||||||||||||||
Credit facilities and commitments to lend |
|
|||||||||||||||||||||||
Rating category 1 (AAA/AA) |
3,002,799 | | | | 3,002,799 | 4,259,148 | ||||||||||||||||||
Rating category 2 (A) |
68,042 | 2,164 | | | 70,206 | 34,026 | ||||||||||||||||||
Rating category 3 (BBB) |
35,457 | 120 | | | 35,577 | 105,460 | ||||||||||||||||||
Rating category 4 (BB) |
| | | | | 4,420 | ||||||||||||||||||
Rating category 5 (B) |
| | | | | | ||||||||||||||||||
Rating category 6 |
||||||||||||||||||||||||
(CCC or lower) |
| | | | | | ||||||||||||||||||
|
|
|
|
|
|
|
|
|
|
|
|
|||||||||||||
Total |
3,106,298 | 2,284 | | | 3,108,582 | 4,403,054 | ||||||||||||||||||
|
|
|
|
|
|
|
|
|
|
|
|
Credit risk concentrations
The following table shows the geographical breakdown of the loans and advances to banks and loans and advances to customers.
Breakdown of the loan commitments based on the country of the guarantor
Loans and advances to banks | Loans and advances to customers | Total per country | ||||||||||||||||||||||
thousand |
2024 | 2023 | 2024 | 2023 | 2024 | 2023 | ||||||||||||||||||
Austria |
19,974,029 | 19,841,519 | 1,983,060 | 1,885,747 | 21,957,089 | 21,727,265 | ||||||||||||||||||
Italy |
253,014 | 243,645 | 24,764 | | 277,778 | 243,645 | ||||||||||||||||||
France |
27 | 339,875 | 223,537 | 385,063 | 223,564 | 724,938 | ||||||||||||||||||
Germany |
203,249 | 675,446 | 9,591 | 8,873 | 212,840 | 684,320 | ||||||||||||||||||
Great Britain |
161,325 | 188,722 | 102 | | 161,426 | 188,722 | ||||||||||||||||||
Other countries |
209,786 | 629,134 | 2,801 | 2,649 | 212,587 | 631,783 | ||||||||||||||||||
|
|
|
|
|
|
|
|
|
|
|
|
|||||||||||||
Total |
20,801,429 | 21,918,340 | 2,243,855 | 2,282,332 | 23,045,284 | 24,200,672 |
108
Determining the expected credit loss (ECL)
The following shows the material input factors, assumptions, and techniques employed by OeKB Group to calculate impairment charges according to IFRS 9 (expected credit loss model). Because of the business model of OeKB Group and its special credit risk situation, the ECL values calculated according to the IFRS 9 are of limited informational value.
Low credit risk exemption
According to IFRS 9, the credit risk can be considered to be low when the rating of the financial instrument is equivalent to an investment grade rating. OeKB Group applies this low credit risk exemption. A non-significant increase is generally assumed when the financial instrument in question has a low default risk (before accounting for collateral) on the reporting date.
OeKB Group defines categories 1 to 10 of the 22 total categories on the internal master rating scale as low default risk. Level 10 corresponds to an S&P rating of BBB-; this means that the classes 1 to 10 correspond to the markets typical definition of investment grade.
Justification for the use of the low credit risk exemption
OeKB Group is purely a group of special-purpose banks with special, legally mandated tasks for the Capital Market, the Export Services, and in the Tourism Services segment (see Note 1). The majority of the total assets result from the Export Financing Scheme and is governed by special laws (AFFG and AusfFG). Exemptions from the CRR and CRD apply to all activities relating to export (financing) promotion (and to the entire OeKB Group without limitations at the European level), and the subsidiaries are not banks for the purposes of the CRR. The EFS is a self-sustaining promotion system; credit losses do not reduce equity but are posted against the EFS interest rate stabilisation provision or are directly covered by a guarantee from the Republic of Austria (see Note 1). Decades of operational experience have shown no or only minor losses from the portfolios to date.
In line with the EBA Guidelines, OeKB Group regularly monitors the development of credit ratings and reserves the right to take individual financial instruments out of the low credit risk exemption based on an assessment (30-days past due or a different qualitative trigger). This means that the low credit risk exemption is only applied to financial instruments that are of investment grade and that have no qualitative indicators for stage 2 or stage 3.
Definition significant increase in credit risk
The assessment of the significant increase in credit risk is a central aspect of the ECL model. In the event of a significant increase in credit risk, the impairment value must not be the 12-month ECL, but the lifetime ECL (except for instruments to which the low credit risk exemption can be applied).
As OeKB Group uses the low credit risk exemption, the 12-month ECL (stage 1) is generally used. An impairment in the amount of the lifetime expected loss (stage 2) is relevant for financial instruments whose rating is not or is no longer in the investment grade range, if the credit risk increases significantly at the same time (based on quantitative or qualitative characteristics).
109
Significance criteria
An increase in credit risk is significant when the probability of default (PD) increases significantly. The assessment is conducted quantitatively on the basis of the aggregated probabilities of default (PDs) for the (expected) term of the instrument. OeKB Group has selected a change in the forward lifetime PD as the relative transfer criterion for assignment to stage 2, with the change in the default risk being neutralised over the course of time in the comparison. If the increase exceeds the defined threshold, the instrument is assigned to stage 2 (unless the instrument remains in stage 1 on the basis of the low credit risk exemption).
The thresholds for assessing the significance of the change in the default risk are defined relative to the risk of default upon initial recognition, and more than 250% increase in the forward lifetime PD is seen as significant.
In addition to the quantitative definition, OeKB Group also uses qualitative information to assess a significant change in the default risk. This especially includes significant changes in external market indicators and actual or anticipated significant changes in external credit ratings of a financial instrument or borrower. When such marked developments occur, the significance is assessed on a case-by-case basis. A borrower being past due by more than 90 days generally qualifies as a transfer criterion, and being past due by more than 30 days is an indicator that can be refuted in individual cases.
Collateral is not taken into account when assessing the default risk (except collateral included in the security rating).
Collective stage transfers
In some cases in the past, OeKB Group has used the instrument of the collective stage transfer as a management overlay. There was no cause to use this instrument in 2024.
Contracts with modified conditions
There are many different reasons why conditions in customer contracts are changed after the fact, even when the business partners credit rating has not worsened, such as changed market conditions or early repayments.
One reason in OeKB Group is development aid loans used to finance projects in developing and emerging countries. Because projects take different courses, it is normal here to make changes to the times of payout and repayment.
As explained in Note 2, the previous contract is terminated and a new financial asset recognised at fair value when substantial contract amendments are made. In cases of minor changes, the difference in the fair value of the contract before and after the amendment is recognised on the income statement.
When significant changes are made, the date of the initial recognition of the new financial asset is also used as the original credit risk for the future calculation of the change in the credit risk, while the original credit risk upon the conclusion of the original contract is still used in the case of minor changes.
If contracts are modified due to the borrower experiencing financial difficulties and with the intention of maximising the future interest and principal payments of this business partner (forbearance), this is in any case a qualitative indicator for the default of the borrower (see also Definition of default below). The partner may be returned to the 12-month ECL after a longer period of consistent contract fulfilment and when there are additional indications that the financial difficulties have been overcome.
110
Calculation of the expected credit loss
The three key parameters for calculating the ECL are the
| probability of default (PD) |
| loss given default (LGD) |
| exposure at default (EAD). |
The derivation of these three parameters is explained below.
Probability of default
Credit rating classification
OeKB Group classifies every credit exposure and assigns every borrower and every financial instrument to a credit rating category on the internal master rating scale based on external ratings from qualified agencies and internal credit assessments. A probability of default is assigned to every rating level and increases exponentially from level to level. These one-year probabilities of default are used for risk management in the sense of the Basel requirements and must therefore be adapted accordingly for use in the ECL calculation.
PIT and FLI adjustments
In the first step, monthly aggregated probabilities of default are determined out to the maximum maturity in the portfolio using conditional probabilities (Bayes theorem) in line with the one-year through the cycle PDs used in risk management. The use of the Bayesian scalar approach ensures that the PD values are between 0 and 1.
According to IFRS 9, the PD must not only be estimated for a point in time (PIT), but must also take forward looking information (FLI) into account. This means that OeKB Group adapts the PIT probabilities of default to account for expected future developments in the next step.
Portfolio-specific models that allow a multi-year (up to three years) projection of the portfolio PDs by way of relevant macroeconomic indicators (see also below) are created for these FLI adjustments. These adjustments are applied to the PIT PDs and continued on a tapering basis after the end of the forecasting period to calculate the FLI PDs. The FLI models consist of a multilinear regression of quarterly data over a period typically lasting 10 or more years. The dependent variable is the average probability of default for the portfolio, usually calculated as a share-weighted value. A set of independent variables is selected for each portfolio in collaboration with economic experts and added to the regression. Different compositions are then tested from this set in the regression, with the variants taking into account relative and absolute changes as well as time-delayed effects. The model is selected taking the calculated coefficient of determination and the distribution characteristics of the unexplained variation into account. The most important factors include long-term and short-term interest rates, inflation and the wage trend, GDP, and budget balances. The decisive factors in the tourism model are the development of overnight stays, the Austrian unemployment rate, and the long-term interest rate. In the final step, the FLI adjustments are estimated from projections for the macro-economic parameters using the regression coefficients.
111
This econometric model forms the base scenario for the changes in the probabilities of default. This base scenario is current included in the ECL calculation with a weighting of 50%. The two other scenarios are derived from possible further geopolitical developments (such as the conflicts in Ukraine and the Middle East) and their effects on the energy supply, inflation, and interest rates. The comeback scenario (weighting 10%) is based on sufficient energy for households and businesses; the stress scenario (weighting 40%) is based on a spread of the geopolitical crises, a longer-lasting recession, and rising inflation. Depending on the susceptibility of the respective sector, the future probabilities of default for these two scenarios are increased or decreased using multiplicative factors. For the tourism sector, which makes the greatest contribution to the ECL, this means that the probabilities of default are roughly 40% lower in the comeback scenario than in the base scenario in the coming four years, and that they rise by roughly 50% to 100% in the coming four years in the stress scenario.
No PIT or FLI adjustments are applied to the EAD or LGD values.
Definition of default
OeKB Group uses default indicator definitions that are oriented towards Art 178 CRR. These especially include debtors being past due by more than 90 days, the initiation of bankruptcy/restructuring proceedings against the debtor, and other crisis-related restructuring measures that lead to concessions to the debtor. There may also be other indicators that point to a potential default (such as information about the default of the debtor with other creditors) in individual cases. These must be assessed on a case-by-case basis and are also taken into account in the period from the balance sheet to the preparation of the balance sheet.
Loss given default (LGD) and application of collateral
The loss given default is another central parameter in calculating the ECL. It indicates the amount of the loss in the event of borrower or financial instrument default, in which case fungible collateral must be taken into account.
Because of its business model, OeKB Group does not have sufficient data to derive a statistically significant LGD model, either for a 12-month LGD or for a lifetime LGD.
Therefore, the following approach has been selected in general based on the ICAAP and the values specified in the CRR:
| LGD for assets economically guaranteed by the Republic of Austria: unchanged 0%. |
| LGD of unchanged 3.25% for reverse repurchase agreements and unchanged 6% for loans with mortgage collateral (OeHT). |
| LGD for other financial transactions: unchanged 65% (see Art 161 CRR: senior exposures 45% and subordinated 75%). Note: There are no subordinated exposures at this time. |
No collateral is taken into account by way of LGD aside from the cases listed above. Other collateral is not taken into account in the loss given default, but in the PD (multiple default).
112
The calculation of these multiple default PDs takes the number of collateral items into account. This means that this represents the probability that not only the borrower will default, but also the guarantors at the same time, with the correlation between the borrower and the guarantors being taken into account. This means that the joint probability of default is a cumulative bivariate or trivariate distribution function depending on whether there is one item of collateral or two items of collateral.
Collateral is not taken into account in the PD as part of the staging process, but is only used to calculate the ECLs (for the one-year ECL and the lifetime ECL).
Expected exposure at default (EAD)
The EAD represents the expected gross book value at the time of default. The EADs are modelled on the basis of a monthly observation calculated from the contractual cash flows plus accrued interest according to the effective interest method.
Product-specific credit conversion factors are estimated for undrawn facilities and loan commitments based on empirical experience with degrees of utilisation.
Impairment requirement according to the ECL calculation
The impairment charges are determined by the weighting of the ECLs calculated on the basis of the scenarios, using the following weighting factors: 50% for the basic scenario, 10% for the comeback scenario, and 40% for the stress scenario. The following table shows the need for impairment charges based on the ECL calculation and does not include the subsequent measurement of the POCI assets; these can be found in Note 8.
Change in loan loss provisions in 2024
thousand |
Loans and advances to banks |
Loans and advances to customers |
Other financial assets |
Total | ||||||||||||
Loan loss provisions as at 31 Dec 2023 |
77 | 999 | 199 | 1,276 | ||||||||||||
Additions |
13 | 96 | 8 | 116 | ||||||||||||
Disposals |
(50 | ) | (39 | ) | (11 | ) | (100 | ) | ||||||||
Stage transfers |
||||||||||||||||
Transfers from stage 1 in stage 2 |
| 168 | | 168 | ||||||||||||
Transfers from stage 2 in stage 1 |
| (44 | ) | | (44 | ) | ||||||||||
Present value effects and changes in risk parameters |
(11 | ) | (228 | ) | (9 | ) | (247 | ) | ||||||||
|
|
|
|
|
|
|
|
|||||||||
Loan loss provisions as at 31 Dec 2024 |
29 | 951 | 187 | 1,168 | ||||||||||||
|
|
|
|
|
|
|
|
|||||||||
Of which 1-year-ECL |
29 | 320 | 187 | 536 | ||||||||||||
Of which lifetime-ECL |
| 632 | | 632 |
113
Change in loan loss provisions in 2023
thousand |
Loans and advances to banks |
Loans and advances to customers |
Other financial assets |
Total | ||||||||||||
Loan loss provisions as at 31 Dec 2022 |
166 | 1,270 | 164 | 1,600 | ||||||||||||
Additions |
11 | 79 | 19 | 109 | ||||||||||||
Disposals |
(0 | ) | (18 | ) | (11 | ) | (29 | ) | ||||||||
Stage transfers |
||||||||||||||||
Transfers from stage 1 in stage 2 |
337 | | 337 | |||||||||||||
Transfers from stage 2 in stage 1 |
| (127 | ) | | (127 | ) | ||||||||||
Present value effects and changes in risk parameters |
(99 | ) | (543 | ) | 28 | (614 | ) | |||||||||
|
|
|
|
|
|
|
|
|||||||||
Loan loss provisions as at 31 Dec 2023 |
77 | 999 | 199 | 1,276 | ||||||||||||
|
|
|
|
|
|
|
|
|||||||||
Of which 1-year-ECL |
28 | 253 | 199 | 480 | ||||||||||||
Of which lifetime-ECL |
49 | 746 | | 796 |
Because of the extensive guarantees from the Republic of Austria, OeKB Group only has limited need for loan loss provisions. Thus, no further breakdown is provided. The greatest share of these provisions can be attributed to the Tourism Services segment. These OeHT loans to Austrian tourism and leisure companies also feature a high collateral quality (guarantees from the Republic of Austria, from banks, and a limited level of mortgages).
The effects (risks and opportunities) of global warming in particular on the various risk types were evaluated in a causal chain analysis covering the entire OeKB Group also in 2024. Among other things, the findings show that ESG factors currently have no material effect on credit risk, meaning that no additional climate-induced adjustments of the loan loss provisions were made beyond the ESG risks already taken into account in the assessment of creditworthiness.
As can be seen in the table above, the loan loss provisions have decreased slightly. This is especially true of the credit portfolio of OeHT, which makes the greatest contribution to the ECL. Here, the probabilities of default for banks (a large portion of the OeHT credit portfolio is secured by banks) improved in annual comparison.
The corresponding gross book values of the impaired financial assets as at 31 Dec 2024 came to 17,823.8 million (2023: 18,414.5 million) for loans and advances to banks, 2,014.3 million (2023: 1,892.2 million) for loans and advances to customers, and 895.5 million (2023: 879.3 million) for other financial assets. Unimpaired collateral in the amount of 515.9 million (2023: 1,756.7 million) is not included in the gross book values.
Sensitivity of the need for expected credit loss depending on the economic scenarios (see the item PIT and FLI adjustments for a description of the scenarios) as a percentage deviation from posted figures:
31 Dec 2024 |
Comeback scenario | Basic scenario | Stress scenario | |||||||||
Impairment requirement |
(39 | )% | (26 | )% | +42 | % |
114
31 Dec 2023 |
Comeback scenario |
Basic scenario |
Stress scenario |
|||||||||
Impairment requirement |
(21 | )% | (14 | )% | +29 | % |
Sustainability risks
OeKB Group understands sustainability risks to mean environmental, social, or buiness management (ESG risks) that could have a material negative effect on the banks asset, financial, or earnings position or reputation. This especially includes climate-related risks in the form of physical and transition risks. Sustainability risks are not an own risk type, but are aspects that are taken into account in the assessment and management of the various financial and non-financial risks.
The management and employees of OeKB Group are aware of their responsibility to conduct business in a sustainable manner. This applies both to the sustainability policy in terms of the impacts that OeKB Groups business activities have on environmental and social issues as well as to the risks and opportunities that could arise for the business model from changing environmental conditions, such as climate change. For this reason, OeKB is continuing to place a clear focus on the increased consideration of climate risks in its risk management and business strategy.
Since years, we have explicitly integrated climate-based risks and opportunities into the risk policy and strategy of OeKB Group, and to this end, a comprehensive causal chain analysis of the factor of global warming on the different risk types is conducted every year. Sustainability risks are also a core aspect of the quarterly risk situation assessment and of the reporting to the RMC, Executive Board, and Supervisory Board.
All departments of OeKB and the bank subsidiaries are included in the causal chain analysis process. In this, physical and transition risks relating especially to global warming and its impacts on the risk factors are identified and evaluated from a qualitative perspective and with regard to their timing (short, medium and long-term) on a five-level scale.
The salient conclusion of the analysis is that the effect is very low and no adjustment of the risk modelling or in the risk coverage calculation is required over the short to medium-term (up to one or up to five years). ESG factors are already taken into account in the assessment of lending commitments. At the project level, OeKB Group identifies, assesses, and manages climate-related risks starting with the due diligence assessment, which also includes an environmental and social audit in OeKB and OeEB.
Over the medium to long term (more than five years), it is especially transition risks that at least have the potential to impact the business model, reputation, and to a limited degree credit risk. This is above all due to the specific business segments of OeKB Group, which are operated on the basis of legal regulations and at the behest of the Republic of Austria to promote the export and tourism industries and with the goal of development-policy financing. The measures are conducted in close cooperation with the Republic of Austria in conformity with the sustainability strategy (for example the regular issue of sustainability bonds or assisting companies with the transition to renewable energy through the Exportinvest Green Energy product) not only as the sponsor but also through the extensive guarantees pertaining especially to the credit risks of the Republic of Austria. OeKB employs a series of measures to keep reputational risk as low as possible, including a strong ESG orientation in its proprietary investments and the successful establishment of the ESG Data Hub in the market.
115
OeKB is also continuously improving its ESG risk management in accordance with the availability of data. On the one hand, this includes the integration of ESG factors into the rating assessment (ESG risk scoring) and taking these factors into account in the lending process, as well as quantitative ESG stress tests. After a comprehensive evaluation, OeKB is in the process of implementing an ESG software solution for improved quantitative analysis, and plans to gradually bring it online in 2025.
OeKB Group has critically evaluated future trends for years to ensure success in its core business over the long term and to live up to its social responsibility. Climate change, biodiversity, resource scarcity, and sustainable finance are key challenges. See the Sustainability section for more information. This is intended to enhance the resilience of our business strategy. Overall, OeKB sees high potential for the Austrian economy and thus for the business segments of OeKB Group in the transition of the economy.
Thus, ESG factors, especially global warming, have no material impact on the continued operations of OeKB Group at present, and there are no reasons to correct the fair values or valuations of financials, including the determination of risk provisions.
Note 38 Scope of consolidation
The following table shows all companies that are included in the financial statements of OeKB Group. In addition to the parent company Oesterreichische Kontrollbank Aktiengesellschaft, the following companies are fully consolidated: Oesterreichische Entwicklungsbank AG, Vienna, OeKB CSD GmbH, Vienna, and Österreichische Hotel- und Tourismusbank Gesellschaft m.b.H., Vienna.
Three companies were not consolidated (2023: 4) because they do not have a material influence on the asset, financial, or earnings position of the Group. The combined total assets of these three entities represented 0.01% of the Groups consolidated total assets, and their combined profit for the year represented less than 0.14% of the Groups consolidated profit for the year. AGCS Gas Clearing and Settlement AG, in which OeKB holds a 20% stake, was not recognised at the equity book value because its results do not have a material effect on the item share of profit or loss of equity-accounted investments, net of tax and on the item equity-accounted investments. The holding is included in the investments in other unconsolidated companies at fair value (proportionate equity), as is the case with the stakes in other energy clearing companies.
Number of companies consolidated or held at cost
31 Dec 2024 | 31 Dec 2023 | |||||||
Fully consolidated companies |
3 | 3 | ||||||
Equity-accounted investments |
2 | 2 | ||||||
Investments in unconsolidated subsidiaries (fair value measurement) |
3 | 4 | ||||||
Investments in other unconsolidated companies (fair value measurement) |
10 | 10 | ||||||
|
|
|
|
|||||
Total |
18 | 19 | ||||||
|
|
|
|
116
Companies wholly or partly owned by OeKB
Name and registered office |
Type of investment |
Financial information | ||||||||||||||||||||||||||||||||||||||
Amounts in thousand |
BWG category1 |
Segment structure2 |
Directly held |
Indirectly held |
Shareholding in% |
Reporting date of latest annual accounts as at 31 Dec |
Balance sheet total as defined in the UGB |
Equity as defined in §224(3) UGB |
Profit/loss for the year |
Share of OeKB Group at fair value |
||||||||||||||||||||||||||||||
Fully consolidated companies |
||||||||||||||||||||||||||||||||||||||||
Oesterreichische Entwicklungsbank AG, Vienna |
CI | E | x | 100.00 | % | 2024 | 1,448,800 | 69,831 | 7,156 | |||||||||||||||||||||||||||||||
OeKB CSD GmbH, Vienna |
CI | C | x | 100.00 | % | 2024 | 42,155 | 39,304 | 9,712 | |||||||||||||||||||||||||||||||
Österreichische Hotel- und Tourismusbank Gesellschaft m.b.H., Vienna |
CI | T | x | 68.75 | % | 2024 | 1,232,601 | 53,383 | 7,049 | |||||||||||||||||||||||||||||||
Equity-accounted investments |
||||||||||||||||||||||||||||||||||||||||
OeKB EH Beteiligungs- und Management AG, Vienna |
OC | O | x | 51.00 | % | 2024 | 93,647 | 93,585 | 9,951 | 64,044 | ||||||||||||||||||||||||||||||
Acredia Versicherung AG, Vienna |
OC | O | x | 51.00 | % | 2024 | 147,167 | 93,491 | 6,889 | 47,681 | ||||||||||||||||||||||||||||||
Acredia Services GmbH, Vienna |
OC | O | x | 51.00 | % | 2024 | 8,581 | 6,584 | 2,319 | 3,358 | ||||||||||||||||||||||||||||||
CCP Austria Abwicklungs -stelle für Börsengeschäfte GmbH, Vienna |
OC | C | x | 50.00 | % | 2024 | 189,141 | 17,000 | 4,022 | 8,500 | ||||||||||||||||||||||||||||||
Unconsolidated subsidiaries (fair value measurement in other comprehensive income - OCI) |
| |||||||||||||||||||||||||||||||||||||||
OeKB Zentraleuropa Holding GmbH, Vienna |
OC | O | x | 100.00 | % | 2024 | 4,382 | 4,345 | 102 | 4,345 | ||||||||||||||||||||||||||||||
Tourism Investment Services GmbH, Vienna |
OC | T | x | 68.75 | % | 2024 | 136 | 122 | 18 | 84 | ||||||||||||||||||||||||||||||
OeEB Impact GmbH, Vienna |
OC | E | x | 100.00 | % | 2024 | 327 | 320 | (27 | ) | 320 | |||||||||||||||||||||||||||||
Investments in other unconsolidated companies (fair value measurement in other comprehensive income - OCI) |
| |||||||||||||||||||||||||||||||||||||||
AGCS Gas Clearing and Settlement AG, Vienna |
OC | C | x | 20.00 | % | 2023 | 221,561 | 4,140 | 370 | 775 | ||||||||||||||||||||||||||||||
APCS Power Clearing and Settlement AG, Vienna |
OC | C | x | 17.00 | % | 2023 | 137,468 | 4,264 | 1,195 | 815 | ||||||||||||||||||||||||||||||
CISMO Clearing Integrated Services and Market Operations GmbH, Vienna |
OC | C | x | 18.50 | % | 2023 | 4,697 | 3,042 | 2,242 | 568 | ||||||||||||||||||||||||||||||
OeMAG Abwicklungsstelle für Ökostrom AG, Vienna |
OC | C | x | 12.60 | % | 2023 | 1,104,691 | 7,367 | 2,320 | 785 | ||||||||||||||||||||||||||||||
EXAA Abwicklungsstelle für Energieprodukte AG, Vienna |
OC | C | x | 8.06 | % | 2023 | 2,781 | 1,869 | 109 | 153 | ||||||||||||||||||||||||||||||
Wiener Börse AG, Vienna |
OC | C | x | 6.60 | % | 2023 | 209,618 | 192,230 | 39,545 | 27,804 | ||||||||||||||||||||||||||||||
Einlagensicherung AUSTRIA Ges.m.b.H., Vienna |
OC | O | x | 1.00 | % | 2023 | 988 | 100 | | 4 | ||||||||||||||||||||||||||||||
EDFI Management Company S.A., Belgium |
OC | E | x | 10.00 | % | 2023 | 7,813 | 524 | 19 | 52 | ||||||||||||||||||||||||||||||
European Financing Partners S.A., Luxembourg |
OC | E | x | 7.63 | % | 30 Sep 2024 | 179,134 | 250 | 12 | 1 | ||||||||||||||||||||||||||||||
Interact Climate Change Facility S.A., Luxembourg |
OC | E | x | 7.69 | % | 30 Sep 2024 | 139,868 | 257 | 12 | 1 |
1 | CI = Credit institution, OC = Other company |
2 | C = Capital Market Services, E = Export Services, O = Other Services, T = Tourism Services |
117
No interests in investments other than subsidiaries and no interests in subsidiaries are listed on an exchange.
Note 39 Subsidiaries with non-controlling interests
The following table contains material disclosures about Österreichische Hotel- und Tourismusbank Gesellschaft m.b.H. It is the only company in OeKB Group with shares held by non-controlling interests, amounting to 31.25%.
Tourism Services segment
thousand |
2024 | 2023 | ||||||
Net interest income |
11,105 | 9,310 | ||||||
Profit before tax |
7,460 | 6,962 | ||||||
Profit, net of tax |
5,730 | 5,259 | ||||||
Other comprehensive income, net of tax |
20 | (115 | ) | |||||
|
|
|
|
|||||
Total comprehensive income |
5,750 | 5,144 | ||||||
Total comprehensive income attributable to non-controlling interests |
1,797 | 1,607 | ||||||
Current assets |
19,437 | 14,382 | ||||||
Non-current assets |
1,220,182 | 1,236,439 | ||||||
Current liabilities |
4,784 | 9,205 | ||||||
Non-current liabilities |
1,175,713 | 1,183,280 | ||||||
|
|
|
|
|||||
Net assets |
59,122 | 58,337 | ||||||
Net assets attributable to non-controlling interests |
18,476 | 18,230 | ||||||
Net cash from operating activities |
5,356 | 2,946 | ||||||
Net cash from investing activities |
(357 | ) | (445 | ) | ||||
Net cash from financing activities |
(5,000 | ) | (2,500 | ) | ||||
|
|
|
|
|||||
Net cash |
(1 | ) | 1 | |||||
|
|
|
|
|||||
Dividend payment to non-controlling interests |
(1,563 | ) | (781 | ) | ||||
|
|
|
|
Note 40 Staff disclosures
During the financial year, the Group had an average of 471 full-time equivalents (2023: 464).
Note 41 Board members compensation and loans
The following tables give details of the aggregate compensation of the Executive Board and Supervisory Board members. The remuneration of the Executive Board included salaries, a variable component based on the success of the company, benefits in kind, and payments for defined-contribution benefits after the end of the employment relationship.
118
Remuneration of the members of the Executive Board
thousand |
2024 | 2023 | ||||||
Current benefits |
(1,065 | ) | (1,027 | ) | ||||
Expenses for benefits due after the end of the employment relationship (termination benefits and pensions) |
(170 | ) | (371 | ) | ||||
Other non-current benefits |
(958 | ) | (769 | ) | ||||
|
|
|
|
|||||
Total |
(2,193 | ) | (2,167 | ) | ||||
|
|
|
|
Remuneration of former members of the Executive Board and members of the Supervisory Board
thousand |
2024 | 2023 | ||||||
Former members of the Executive Board |
(1,790 | ) | (1,648 | ) | ||||
Members of the Supervisory Board |
(159 | ) | (150 | ) |
No active member of the Executive Board had entitlements under defined-benefit plans.
OeKB Group did not offer share-based payment.
The members of the Executive Board and Supervisory Board did not receive any loans or guarantees from OeKB Group during the financial year, as in the prior year.
Note 42 Other related party transactions
As a specialise-purpose institution for export services and capital market services, OeKB engages in many transactions with its shareholders such as acting as the Hausbank under the EFS and as an issuer of securities. In addition to shareholders, OeKB Group also defines companies that are controlled by the Group but not consolidated and companies that are recognised in the consolidated financial statements according to the equity method as related parties (see following table). Individuals who are considered related parties include the members of the Executive Board and Supervisory Board of Oesterreichische Kontrollbank Aktiengesellschaft (see Note 43). All of the following transactions were conducted at arms length terms.
The majority of loans and advances to banks stem from transactions with shareholders of OeKB relating to the Export Financing Scheme. As explained in Note 1, uniform terms that are published on the OeKB website are offered to all customers in the EFS. The majority of the receivables under the EFS feature a guarantee from the Republic of Austria, and the remainder feature a guarantee from another country or an insurance company. The share of interest income generated by credit transactions with shareholders in 2024 came to 270.6 million or 30.4% (2023: 218.4 million or 28.7%).
The other financial assets are bonds that were publicly issued by the shareholders of OeKB. The fee and commission income from the investments in other unconsolidated companies resulted primarily from services relating to energy clearing.
119
The deposits from banks consist of loans extended by shareholders of OeKB to OeHT to refinance the tourism financing measures.
Transactions between Oesterreichische Kontrollbank Aktiengesellschaft and fully consolidated subsidiaries were not disclosed in the consolidated financial statements because they are eliminated in the consolidation process.
The following balance sheet items include transactions with related parties of OeKB Group:
Related party transactions
thousand |
Owners of OeKB Group 2024 |
Investments in unconsolidated subsidiaries and other interests 2024 |
Equity-accounted investments 2024 |
Owners of OeKB Group 2023 |
Investments in unconsolidated subsidiaries and other interests 2023 |
Equity-accounted investments 2023 |
||||||||||||||||||
Loans and advances to banks |
7,950,259 | | | 8,602,170 | | | ||||||||||||||||||
Other financial assets |
6,926 | | | 4,950 | | | ||||||||||||||||||
|
|
|
|
|
|
|
|
|
|
|
|
|||||||||||||
Assets |
7,957,185 | | | 8,607,120 | | | ||||||||||||||||||
Deposits from banks |
313,619 | | | 362,188 | | | ||||||||||||||||||
Deposits from customers |
| | 144,702 | | | 131,617 | ||||||||||||||||||
Debt securities issued |
1,676 | | | 1,687 | | | ||||||||||||||||||
|
|
|
|
|
|
|
|
|
|
|
|
|||||||||||||
Liabilities and equity |
315,295 | | 144,702 | 363,875 | | 131,617 | ||||||||||||||||||
Nominal amount of loan commitments,financial guarantees and other commitments |
1,435,643 | | | 1,823,991 | | | ||||||||||||||||||
Income statement |
||||||||||||||||||||||||
Interest income |
270,897 | | | 218,868 | | | ||||||||||||||||||
Interest expenses |
8,494 | | 3,236 | 16,243 | | 3,410 | ||||||||||||||||||
Fee and commission income |
5,836 | | 446 | 5,437 | | 407 | ||||||||||||||||||
Fee and commission expenses |
18 | | 0 | 13 | | | ||||||||||||||||||
Current income from investments in other unconsolidated companies |
| | 5,550 | | | 11,137 | ||||||||||||||||||
Administrative expenses |
| | 102 | | | 91 | ||||||||||||||||||
Other operating income |
1,608 | | 1,035 | 1,514 | | 1,131 | ||||||||||||||||||
|
|
|
|
|
|
|
|
|
|
|
|
There were no transactions with the members of the Executive Board or Supervisory Board, as in the prior year.
120
The following table shows the shareholder structure of OeKB.
Ownership structure of Oesterreichische Kontrollbank Aktiengesellschaft at 31 Dec 2024
Shareholders |
Number of shares held |
Shareholding in % |
||||||
CABET-Holding-GmbH, Vienna (UniCredit Bank Austria Group) |
217,800 | 24.750 | % | |||||
UniCredit Bank Austria AG, Vienna |
142,032 | 16.140 | % | |||||
Erste Bank der oesterreichischen Sparkassen AG, Vienna |
113,432 | 12.890 | % | |||||
Schoellerbank Aktiengesellschaft, Vienna |
72,688 | 8.260 | % | |||||
AVZ GmbH, Vienna |
72,600 | 8.250 | % | |||||
Raiffeisen Bank International AG, Vienna |
71,456 | 8.120 | % | |||||
P.S.K. Beteiligungsverwaltung GmbH, Vienna |
44,792 | 5.090 | % | |||||
Raiffeisen OeKB Beteiligungsgesellschaft mbH, Vienna |
44,000 | 5.000 | % | |||||
Oberbank AG, Linz |
34,224 | 3.889 | % | |||||
Beteiligungsholding 5000 GmbH, Innsbruck |
26,888 | 3.055 | % | |||||
BKS Bank AG, Klagenfurt |
26,888 | 3.055 | % | |||||
Volksbank Wien AG, Vienna |
13,200 | 1.500 | % | |||||
|
|
|
|
|||||
Total shares |
880,000 | 100.000 | % | |||||
|
|
|
|
Note 43 Board members and officials
Members of the Executive Board
Term of office | ||||||||
Name |
from | to | ||||||
Helmut Bernkopf |
1 Aug 2016 | 31 Jul 2028 | ||||||
Angelika Sommer-Hemetsberger |
1 Jan 2014 | 31 Dec 2028 |
131
121
Members of the Supervisory Board
Term of office | ||||||||||
Position |
Name |
from | to | |||||||
Chairman |
Robert Zadrazil | 19 May 2009 | AGM 2026 | |||||||
First Vice Chairwoman |
Marie Valerie Brunner | 20 Mar 2024 | AGM 2027 | |||||||
Second Vice Chairwoman |
Ilinka Kajgana | 18 Dec 2024 | AGM 2027 | |||||||
Member |
Sabine Abfalter | 25 May 2022 | AGM 2027 | |||||||
Member |
Rainer Borns | 27 May 2024 | AGM 2027 | |||||||
Member |
Mary-Ann Hayes | 29 May 2019 | AGM 2029 | |||||||
Member |
Dieter Hengl | 25 May 2011 | AGM 2026 | |||||||
Member |
Reinhard Karl | 27 May 2024 | AGM 2025 | |||||||
Member |
Marion Kristen | 24 May 2023 | AGM 2028 | |||||||
Member |
Herbert Pichler | 27 May 2020 | AGM 2025 | |||||||
Member |
Friedrich Spandl | 20 May 2021 | AGM 2026 | |||||||
Member |
Herta Stockbauer | 21 May 2014 | AGM 2029 | |||||||
Member |
Hans Unterdorfer | 28 Sep 2022 | AGM 2025 | |||||||
Member |
Robert Wieselmayer | 19 May 2016 | AGM 2026 | |||||||
Member |
Janine Wukovits | 25 May 2022 | AGM 2027 | |||||||
First Vice Chairman |
Peter Lennkh | 18 May 2017 | 20 Mar 2024 | |||||||
Second Vice Chairwoman |
Alexandra Habeler-Drabek | 28 Sep 2022 | 18 Dec 2024 | |||||||
Member |
Veronika Bernklau | 20 May 2021 | 27 May 2024 | |||||||
Member |
Markus Kriegler | 24 May 2023 | 27 May 2024 |
AGM = Annual General Meeting
Employee representatives
Term of office | ||||||||||
Position |
Name |
from | to | |||||||
Chairman | Martin Krull | 14 Mar 2002 | 27 Nov 2029 | |||||||
Vice Chairwoman (since 1 Jun 2024) | Christina Schadauer | 14 Mar 2023 | 27 Nov 2029 | |||||||
Member | Sophie Clemente-Palma | 28 Nov 2024 | 27 Nov 2029 | |||||||
Member | Elisabeth Halys | 1 Jul 2013 | 27 Nov 2029 | |||||||
Member | Christoph Seper | 14 Mar 2014 | 27 Nov 2029 | |||||||
Member | Markus Tichy | 1 Jul 2011 | 27 Nov 2029 | |||||||
Member | Evelyn Ulrich-Hell | 1 Jun 2024 | 27 Nov 2029 | |||||||
Vice Chairwoman | Erna Scheriau | 1 Apr 2001 | 31 May 2024 | |||||||
Member | Josi Friedel | 8 Jul 2023 | 28 Nov 2024 |
122
Working Committee | ||
Position |
Name | |
Chairman | Robert Zadrazil | |
Member (since 18 Dec 2024) | Sabine Abfalter | |
Member | Martin Krull | |
Member (20 Mar 2024 to 18 Dec 2024) |
Marie Valerie Brunner | |
Member (until 20 Mar 2024) | Peter Lennkh | |
Nomination Committee |
||
Position |
Name | |
Chairman | Robert Zadrazil | |
Member (since 20 Mar 2024) | Marie Valerie Brunner | |
Member (since 1 Jun 2024) | Christina Schadauer | |
Member (until 20 Mar 2024) | Peter Lennkh | |
Member (until 31 May 2024) | Erna Scheriau | |
Audit Committee |
||
Position |
Name | |
Chairwoman | Sabine Abfalter | |
Member | Robert Wieselmayer | |
Member | Martin Krull |
Risk Committee |
||
Position |
Name | |
Chairwoman | Herta Stockbauer | |
Member | Robert Zadrazil | |
Member | Martin Krull | |
Remuneration Committee |
||
Position |
Name | |
Chairman | Robert Wieselmayer | |
Member (since 18 Dec 2024) | Sabine Abfalter | |
Member (since 18 Dec 2024) | Ilinka Kajgana | |
Member | Robert Zadrazil | |
Member | Martin Krull | |
Member (since 1 Jun 2024) | Christina Schadauer | |
Member (20 Mar 2024 to 18 Dec 2024) |
Marie Valerie Brunner | |
Member (until 18 Dec 2024) | Alexandra Habeler-Drabek | |
Member (until 20 Mar 2024) | Peter Lennkh | |
Member (until 31 May 2024) | Erna Scheriau | |
Government commissioners
Name | Term of office since | |||||||
Commissioner | Harald Waiglein | 1 Jul 2012 | ||||||
Deputy Commissioner | Johann Kinast | 1 Mar 2006 |
The government commissioners under § 76 of the Austrian Banking Act are also representatives of the Austrian Minister of Finance under § 6 of the Export Financing Guarantees Act.
123
Note 44 Legal risks
On 7 July 2024, the referral request of the Federal Fiscal Court (BFG) to the European Court of Justice (ECJ) on the question of whether the VAT-relevant intermediary bank exception for banks, insurance companies, and pension funds (§ 6/1/28 UStG valid until 31 Dec 2024) represents state aid under Art 107 (1) TFEU (Treaty on the Functioning of the European Union) was published. The intermediary bank exception had been in force since 1 January 1995.
In the view of the BFG, there is no basis for the intermediary bank exception in Union law. Because EU Directive 2006/112/EC on the common system of value added tax (VAT Directive) cannot be applied against the taxpayers will to their detriment, and a directive-compliant interpretation of national law that contradicts the clear wording of the law is not permissible, aligning national law with EU law is unfeasible. In addition, the BFG sees the question of whether the exemption constitutes prohibited state aid under Art 107 TFEU.
State aid is prohibited when it provides an advantage to certain businesses or sectors, when it distorts or threatens to distort competition, and it may affect cross-border trade.
Upon initiation of a formal investigation procedure (which we expect in 2026), a period of ten years must be considered. In this affected period (20172024, eight years), OeKB Group billed services worth roughly 6.0 million that were rendered exempt of tax pursuant to § 6/1/28 UStG. In addition, OeKB Group received services in the amount of 0.5 million (after deduction of any input taxes) that were rendered exempt of tax pursuant to § 6/1/28. In terms of the services received, roughly 50% of the value added tax can be settled as part of the input tax adjustment.
OeKB primarily applies the intermediary bank exception in the billing of its services to participants in the Austrian capital market (fund data service and financial data service). Billing under application of the intermediary bank exception was applied as soon as the recipient of the service submitted confirmation of eligibility for billing in accordance with the specific legal prerequisites. In principle, some 50% of these rendered services could also have been billed exempt from tax pursuant to § 6(1)8 UStG. For this reason, we anticipate that we will be able to correct the billing of these services in the event of a retroactive change of the legal requirements. Services related to the delegation of personnel or the provision of services were only rendered to a limited degree. OeKB is of the legal opinion that it was not the recipient of prohibited aid under Art 107 TFEU. The outcome of the legal question referred by the BFG to the ECJ currently involves a great deal of uncertainty given that the EU Commission must instruct the Republic of Austria to take action, meaning that the likelihood of an outflow of funds is believed to be remote as at the reporting date.
Aside from this matter, there were no material legal risks that would have negatively influenced the asset, financial, and earnings position of OeKB Group.
124
Note 45 Events after the balance sheet date
There were no events that required reporting after the balance sheet date.
Note 46 Date of approval for publication
These financial statements will be submitted to the Supervisory Board for approval on 21 March 2025. Additional disclosures in accordance with Part 8 of Regulation (EU) No 575/2013 (Disclosure Report, in German only) are provided on the OeKB website (www.oekb.at).
Vienna, 7 March 2025
Oesterreichische Kontrollbank Aktiengesellschaft
Signed by the Executive Board
Helmut Bernkopf Angelika Sommer-Hemetsberger
125
Report on the Audit of the Consolidated Financial Statements
Opinion
We have audited the consolidated financial statements of Oesterreichische Kontrollbank Aktiengesellschaft, Vienna, and its components (the Group), which comprise the statement of profit or loss, the statement of comprehensive income for the financial year 2024, the statement of financial position as of December 31, 2024, the statement of changes in equity and the statement of cash flows for the financial year then ended, and notes to the consolidated financial statements.
In our opinion, the accompanying consolidated financial statements comply with legal requirements and give a true and fair view of the financial position of the Group as of December 31, 2024, and of its consolidated financial performance and consolidated cash flows for the year then ended in accordance with International Financial Reporting Standards (IFRS) as adopted by the EU and the additional requirements under section 245a UGB (Austrian Commercial Code) and the Austrian Banking Act.
Basis for Opinion
We conducted our audit in accordance with the Regulation (EU) No. 537/2014 and the Austrian Standards on Auditing. Those standards require the application of the International Standards on Auditing (ISAs). Our responsibilities under those standards are further described in the Auditors Responsibilities for the Audit of the Consolidated Financial Statements section of our report. We are independent of the Group in accordance with laws and regulations applicable in Austria and we have fulfilled our other professional responsibilities in accordance with these requirements. We believe that the audit evidence we have obtained until the date of our opinion is sufficient and appropriate to provide a basis for our opinion.
Key Audit Matters
Key audit matters are those matters that, in our professional judgement, were of most significance in our audit of the consolidated financial statements of the current period. These matters were addressed in the context of our audit of the consolidated financial statements as a whole, and in forming our opinion thereon, and we do not provide a separate opinion on these matters.
126
Processing of loans and advances to credit institutions in the export financing scheme
Description and Issue
As of December 31, 2024, receivables from credit institutions in connection with the export financing scheme in the amount of EUR 20.209 million were reported. The Republic of Austria is predominantly liable for these claims.
The Companys export financing scheme serves domestic and foreign credit institutions as a source of refinancing, provided that they meet
| OeKBs creditworthiness criteria (house bank status), |
| the statutory conditions for the assumption of guarantees of the Republic of Austria in the form of guarantees regarding the transactions to be financed, and |
| the conditions for a uniform settlement of the financing (collateral). |
Please refer to the information in the chapter Legal basis for the export guarantee and for the Export Financing Scheme of the Notes.
In the context of the valuation of receivables from credit institutions, guarantees (mainly by the Republic of Austria) are considered. If the statutory or contractually defined processing criteria are not met, the guarantees cannot be considered in the valuation. The Company has implemented processes, manual and automated controls in its IT systems that monitor proper processing.
Due to the extensive and partly manual process steps to ensure compliance with the processing criteria, the associated high audit effort, and the importance of the item for the consolidated financial statements, we have determined the processing of receivables from credit institutions in the export financing scheme as a key audit matter.
Our response
In auditing the processing of loans and advances to credit institutions in the export financing scheme, we performed the following key audit procedures:
| We have evaluated the processes to ensure the legally and contractually defined processing criteria and analyzed whether these processes and the key controls established by the company in these areas are suitable for ensuring compliance with the processing criteria. We have tested the effectiveness of these key controls in the case of automated controls involving our IT specialists in random samples. |
| For a random sample of loans to credit institutions (Hausbanken) we have checked whether there is an assumption of guarantee by the Federal Ministry of Finance for them. |
| At the end of the year, we reconciled the amount of receivables from credit institutions under the export financing scheme with the guarantees of the Republic of Austria. |
| For a random sample of loans to credit institutions (Hausbanken) as part of the export financing scheme and still available at the end of the year, we compared the parameters recorded in the system with the application documents. |
127
Other Information
The legal representatives are responsible for the other information. Other information comprises all information in the annual financial report, except for the consolidated financial statements, the group management report, and the auditors report. The annual financial report (except the report of the supervisory board) was made available to us before the date of this auditors report, the report of the supervisory board is expected to be made available to us after the date of the auditors report.
Our audit opinion on the consolidated financial statements does not cover this other information, and we will not express any form of assurance conclusion thereon.
In connection with our audit of consolidated the financial statements, our responsibility is to read the other information and consider whether there is a material inconsistency between the other information and the consolidated financial statements, or our knowledge obtained in the audit, or otherwise appears misleading.
If, based on the work we have performed on the other information obtained prior to the date of our auditors report, we conclude that there is a material misstatement of such other information, we are required to report this fact. We have nothing to report about this.
Responsibilities of Management and the Audit Committee for the Consolidated Financial Statements
Management is responsible for the preparation of the consolidated financial statements that give a true and fair view of the financial position of the Company as December 31, 2024, and of its financial performance for the year then ended in accordance with International Financial Reporting Standards (IFRS) as adopted by the EU, the additional requirements under section 245a UGB and the Austrian Generally Accepted Accounting Principles and the Austrian Banking Act. Furthermore, management is responsible for such internal control as they have determined necessary to enable the preparation of consolidated financial statements that are free from material misstatement, whether due to fraud or error.
In preparing the consolidated financial statements, management is responsible for assessing the Groups ability to continue as a going concern, disclosing, as applicable, matters related to going concern and using the going concern basis of accounting unless management either intends to liquidate the Group or to cease operations, or has no realistic alternative but to do so.
The audit committee is responsible for overseeing the Groups financial reporting process.
Auditors Responsibilities for the Audit of the Consolidated Financial Statements
Our objectives are to obtain reasonable assurance about whether the consolidated financial statements as a whole are free from material misstatement, whether due to fraud or error, and to issue an auditors report that includes our opinion. Reasonable assurance is a high level of assurance but is not a guarantee that an audit conducted in accordance with EU rules and Austrian Generally Accepted Auditing Standards, which require the application of the ISAs, will always detect a material misstatement when it exists. Misstatements can arise from fraud or error and are considered material if, individually or in the aggregate, they could reasonably be expected to influence the economic decisions of users taken on the basis of these consolidated financial statements.
128
As part of an audit in accordance with Regulation (EU) 537/2014 and with Austrian Generally Accepted Auditing Standards, which require the application of the ISAs, we exercise professional judgement and maintain professional skepticism throughout the audit.
We also:
| Identify and assess the risks of material misstatement of the consolidated financial statements, whether due to fraud or error, design and perform audit procedures responsive to those risks, and obtain audit evidence that is sufficient and appropriate to provide a basis for our opinion. The risk of not detecting a material misstatement resulting from fraud is higher than for one resulting from error, as fraud may involve collusion, forgery, intentional omissions, misrepresentations, or the override of internal control. |
| Obtain an understanding of internal control relevant to the audit in order to design audit procedures that are appropriate in the circumstances, but not for the purpose of expressing an opinion on the effectiveness of the Groups internal control. |
| Evaluate the appropriateness of accounting policies used and the reasonableness of accounting estimates and related disclosures made by management. |
| Conclude on the appropriateness of the directors use of the going concern basis of accounting and based on the audit evidence obtained, whether a material uncertainty exists related to events or conditions that may cast significant doubt on the Groups ability to continue as a going concern. If we conclude that a material uncertainty exists, we are required to draw attention in our auditors report to the related disclosures in the consolidated financial statements or, if such disclosures are inadequate, to modify our opinion. Our conclusions are based on the audit evidence obtained up to the date of our auditors report. However, future events or conditions may cause the Group to cease to continue as a going concern. |
| Evaluate the overall presentation, structure, and content of the consolidated financial statements, including the disclosures, and whether the consolidated financial statements represent the underlying transactions and events in a manner that give a true and fair view. |
| Plan and conduct the audit of the consolidated financial statements to obtain sufficient appropriate audit evidence on the financial information of the entities or business activities within the Group as a basis for forming an opinion on the consolidated financial statements. We are responsible for directing, supervising, and reviewing the audit procedures performed for the purposes of auditing the consolidated financial statements. We remain solely responsible for our audit opinion. |
We communicate with the audit committee regarding, among other matters, the planned scope and timing of the audit and significant audit findings, including any significant deficiencies in internal control that we identify during our audit.
We also provide the audit committee with a statement that we have complied with relevant ethical requirements regarding independence, and to communicate with them all relationships and other matters that may reasonably be thought to bear on our independence, and where applicable, any actions taken to eliminate hazards or safeguards applied.
129
From the matters communicated with the audit committee, we determine those matters that were of most significance in the audit of the consolidated financial statements of the current period and are therefore the key audit matters. We describe these matters in our auditors report unless law or regulation precludes public disclosure about the matter or when, in extremely rare circumstances, we determine that a matter should not be communicated in our report because the adverse consequences of doing so would reasonably be expected to outweigh the public interest benefits of such communication.
Other statutory and other legal requirements
Report on the Consolidated Management Report
Pursuant to Austrian Commercial Code, the consolidated management report is to be audited as to whether it is consistent with the consolidated financial statements and whether it has been prepared in accordance with the applicable legal requirements.
Management is responsible for the preparation of the consolidated management report in accordance with the Austrian Commercial Code.
We conducted our audit in accordance with laws and regulations applicable with respect to the consolidated management report.
Opinion
In our opinion, the consolidated management report is prepared in accordance with the applicable legal requirements, the disclosures pursuant to section 243a UGB are appropriate, and it is consistent with the consolidated financial statements.
Statement
Based on the findings during the audit of the consolidated financial statements and due to the thus obtained understanding concerning the Group and its circumstances no material misstatements in the consolidated management report came to our attention.
Additional Information in Accordance with Article 10 of EU Regulation (EU) 537/2014
We were elected as auditor of the Group at the annual general shareholders meeting on May 24, 2023, for the fiscal year ending on December 31, 2024, and mandated by the chairman of the Supervisory Board on May 24, 2023. Furthermore, we were elected as auditor at the annual general shareholders meeting on May 27, 2024, for the subsequent fiscal year and mandated by the chairman of the Supervisory Board on May 27, 2024. We are the auditor of the Company without interruption since the financial year ending December 31, 2022.
130
We confirm that the audit opinion in the section Report on the Consolidated Financial Statements is consistent with the additional report to the audit committee referred to in article 11 of the EU regulation.
We declare that no prohibited non-audit services (article 5 par. 1 of the EU regulation) were provided by us and that we remained independent from the Group in conducting the audit.
Engagement Partner
The engagement partner responsible for the audit is Dr. Gottfried Spitzer.
Vienna
March 7, 2025
Deloitte Audit Wirtschaftsprüfungs GmbH
(signed by:) | ||
Dr. Gottfried Spitzer | Mag. Wolfgang Wurm | |
Certified Public Accountant | Certified Public Accountant |
Publication or sharing with third parties of the consolidated financial statements together with our auditors opinion is only allowed if the financial statements and the management report are identical with the audited version. This audit opinion is only applicable to the German and complete financial statements with the management report. Section 281 para 2 UGB applies to alternated versions.
This translation is for convenience purposes only.
Only the German original is legally valid and binding.
131
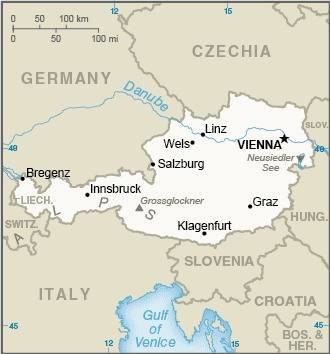
The Republic of Austria is situated in Central Europe. It shares borders with:
| Switzerland and Liechtenstein in the west, |
| Germany, Czech Republic and Slovakia in the north, |
| Hungary in the east, and |
| Slovenia and Italy in the south. |
The population of Austria on January 1, 2025 was 9,198,214, according to Statistik Austria. From 2015 to 2025, Austrias population increased by 6.6%. Vienna, the capital, had a population of 2.03 million in 2025.
Austria has an area of 32,383 square miles. The western and southern regions of Austria, containing the Austrian Alps, are mountainous and heavily forested. There are fertile plains in the eastern parts of the country and in the valley of the Danube River, which flows through Austria for a distance of 217 miles.
The present Austrian frontiers were determined by the Treaty of St. Germain in 1919. The occupation of Austria following World War II was ended by the State Treaty for the Re-establishment of an Independent and Democratic Austria in 1955. The treaty limits the manufacture and possession by Austria of certain types of military weapons, including atomic weapons.
Under the Austrian Federal Constitution Act of 1920, as amended in 1929 (the Constitution), Austria is a democratic and federal republic, with legislative and executive powers divided between the federal government and the nine constituent provinces.
The legislative power of the federal government is vested in a bi-cameral legislature consisting of the Nationalrat and the Bundesrat. The members of the Nationalrat are elected for a period of five years by direct, secret, popular suffrage under a system of proportional representation. The Nationalrat may be dissolved before the termination of the term of five years for which it is elected, by its own action or, in certain circumstances, by the Federal President. The present Nationalrat was elected on September 29, 2024. The members of the Bundesrat are elected periodically by the legislatures of the provinces in proportion to the populations of the nine provinces.
The executive powers of the federal government are vested in the Federal President, the Chancellor and the Cabinet. The Federal President is elected by direct, secret, popular suffrage for a term of six years. Dr. Alexander Van der Bellen was re-elected Federal President on October 9, 2022. The chief constitutional powers of the Federal President are the appointment of the Chancellor and his Cabinet and the dissolution of the Nationalrat. The present administration was formed on March 3, 2025 by a coalition of the Austrian Peoples Party, the Social Democratic Party of Austria, and The New Austria and Liberal Forum and is led by Christian Stocker of the Austrian Peoples Party as Chancellor and Andreas Babler of the Social Democratic Party of Austria as Vice-Chancellor.
The judicial power is exercised by the federal courts. Courts of last resort are provided for questions of civil and criminal law and for questions of administrative law. A separate constitutional court has primary competence to determine the constitutionality of all legislative and administrative acts of the federal government and the provinces.
132
The following table shows the political affiliations of the members of the Nationalrat after the most recent elections and the current composition of the Bundesrat.
Nationalrat | Bundesrat | |||||||||||||||||||
2013 Elections | 2017 Elections | 2019 Elections | 2024 Elections | Composition as of June 25, 2025 |
||||||||||||||||
Freedom Party of Austria (FPÖ) |
40 | 51 | 30 | 57 | 16 | |||||||||||||||
Austrian Peoples Party (ÖVP) |
47 | 62 | 71 | 51 | 22 | |||||||||||||||
Social Democratic Party of Austria (SPÖ) |
52 | 52 | 40 | 41 | 18 | |||||||||||||||
The New Austria and Liberal Forum (NEOS) |
9 | 10 | 15 | 18 | 1 | |||||||||||||||
Austrian Green Party (Grüne) |
24 | | 26 | 16 | 3 | |||||||||||||||
Peter Pilz List (PILZ) |
| 8 | | | | |||||||||||||||
Team Frank Stronach (FRANK) |
11 | | | | | |||||||||||||||
Without party affiliation |
| | 1 | 1 | | |||||||||||||||
|
|
|
|
|
|
|
|
|
|
|||||||||||
Total |
183 | 183 | 183 | 183 | 60 | |||||||||||||||
|
|
|
|
|
|
|
|
|
|
SOURCE: Data published by the Parliament of Austria.
MEMBERSHIP IN INTERNATIONAL ORGANIZATIONS
Austria is a member of many international organizations, including:
| the United Nations and of all of its affiliated organizations. Three of these organizations, the International Atomic Energy Agency, the United Nations Industrial Development Organization and the United Nations Office for Drug Control and Crime Prevention have their headquarters in Vienna. |
| the European Union (EU), |
| the European Stability Mechanism (ESM), |
| the International Monetary Fund (IMF), |
| the International Bank for Reconstruction and Development (IBRD), |
| the Multilateral Investment Guarantee Agency (MIGA), |
| the International Finance Corporation (IFC), |
| the International Development Association (IDA), |
| the Asian Development Bank (ADB), |
| the Asian Development Fund (ADF), |
| the Inter-American Development Bank (IDB), |
| the Fund for Special Operations (FSO), |
| the Inter-American Investment Corporation (IIC), |
| the African Development Fund (AfDF), |
| the African Development Bank (AfDB), |
133
| the European Bank for Reconstruction and Development (ERBD), |
| the European Investment Bank (EIB), |
| the Organization for Economic Cooperation and Development (OECD), |
| the Council of Europe, |
| the International Energy Agency, |
| the International Fund for Agricultural Development (IFAD), |
| the Common Fund for Commodities (CF), and |
| the Global Environment Facility (GEF). |
Austria is a founding member of the World Trade Organization (WTO) and was previously a party to the General Agreement on Tariffs and Trade (GATT). Austria is a founding member of the Asian Infrastructure Investment Bank (AIIB).
Vienna is recognized as a center for international conferences and has served as the site of numerous United Nations meetings as well as Strategic Arms Limitation Talks. The headquarters of the Organization of the Petroleum Exporting Countries (OPEC) are located in Vienna.
General
Austria has a highly developed and diversified economy. Industry, which consists of manufacturing and mining, construction, energy and water supply, accounted for 25.7% of the gross value added at current prices in 2024. The service sector accounted for 73.0% of gross domestic product (GDP) in 2024, while agriculture and forestry produced 1.4% of gross value added.
Gross Domestic Product
The following table shows the major sectors of Austrias GDP for the years 2020 through 2024. The 2024 GDP at current prices totaled EUR 484.2 billion, representing a 2.3% increase over 2023. In 2024, real GDP (reference year 2015) totaled EUR 377.6 billion, representing a 1.0% decrease over 2023. The decline in real economic activity was broad-based, affecting most expenditure categories and sectors.
GROSS DOMESTIC PRODUCT(1)
2020 | 2021 | 2022 | 2023 | 2024 | Percentage of 2024 total gross value added |
|||||||||||||||||||
(Billions of euros at current prices) | ||||||||||||||||||||||||
Agriculture, forestry and fishing |
4.1 | 4.9 | 6.2 | 6.1 | 5.9 | 1.4 | ||||||||||||||||||
Industry: |
||||||||||||||||||||||||
Mining and quarrying; Manufacturing |
63.9 | 70.0 | 73.8 | 76.1 | 75.2 | 17.3 | ||||||||||||||||||
Electricity, gas and water supply, waste management |
9.9 | 10.0 | 12.0 | 15.0 | 7.8 | 1.8 | ||||||||||||||||||
Construction |
23.8 | 24.5 | 27.1 | 28.3 | 28.2 | 6.5 | ||||||||||||||||||
|
|
|
|
|
|
|
|
|
|
|
|
|||||||||||||
Total Industry |
97.6 | 104.5 | 112.9 | 119.5 | 111.3 | 25.7 | ||||||||||||||||||
Service activities: |
||||||||||||||||||||||||
Wholesale and retail trade |
41.2 | 45.8 | 51.3 | 49.2 | 50.7 | 11.7 | ||||||||||||||||||
Transportation and storage |
17.9 | 17.7 | 21.4 | 22.5 | 22.6 | 5.2 | ||||||||||||||||||
Accommodation and food service activities |
9.1 | 8.3 | 14.0 | 16.7 | 18.1 | 4.2 | ||||||||||||||||||
Information and communication |
13.7 | 15.3 | 15.7 | 16.4 | 17.4 | 4.0 | ||||||||||||||||||
Financial and insurance activities |
14.7 | 16.7 | 19.0 | 22.4 | 23.0 | 5.3 | ||||||||||||||||||
Real estate activities |
35.4 | 35.4 | 38.5 | 41.5 | 44.6 | 10.3 | ||||||||||||||||||
Other business activities |
34.2 | 36.8 | 40.4 | 42.4 | 43.9 | 10.1 | ||||||||||||||||||
Public administration(2) |
64.9 | 68.8 | 72.0 | 77.0 | 84.5 | 19.5 | ||||||||||||||||||
Other service activities |
7.8 | 8.2 | 10.0 | 11.1 | 11.8 | 2.7 | ||||||||||||||||||
|
|
|
|
|
|
|
|
|
|
|
|
|||||||||||||
Total service activities |
238.9 | 253.1 | 282.3 | 299.4 | 316.5 | 73.0 | ||||||||||||||||||
Total gross value added |
340.5 | 362.5 | 401.4 | 425.0 | 433.7 | 100.0 | ||||||||||||||||||
|
|
|
|
|
|
|
|
|
|
|
|
|||||||||||||
Taxes less subsidies on products |
39.8 | 43.7 | 46.6 | 48.2 | 50.5 | |||||||||||||||||||
|
|
|
|
|
|
|
|
|
|
|||||||||||||||
Gross domestic product Value |
380.3 | 406.2 | 448.0 | 473.2 | 484.4 | |||||||||||||||||||
|
|
|
|
|
|
|
|
|
|
|||||||||||||||
Volume(3) |
349.0 | 365.8 | 385.1 | 381.4 | 377.6 | |||||||||||||||||||
Percentage change in gross domestic product over preceding year |
||||||||||||||||||||||||
Value |
-3.9 | +6.8 | +10.3 | +5.6 | +2.3 | |||||||||||||||||||
Volume(3) |
-6.3 | +4.8 | +5.3 | -1.0 | -1.0 |
(1) | European System of Accounts (ESA) 2010 basis. Amounts may not add due to rounding. |
(2) | Including defense, compulsory social security, education, human health and social work activities. |
(3) | Chained series, reference year 2015. |
SOURCE: Statistics Austria, WDSWIFO Data System, Macrobond.
These GDP results are based on the European System of Accounts in the version of 2010 (ESA 2010), which became legally binding in September 2014. The ESA 2010 defines for all member states of the European Union (the Member States) which concepts, definitions and accounting rules have to be applied in compiling their national accounts in order to make the data comparable at an international level.
134
Domestic Expenditure
The following table shows the total goods and services available for domestic expenditure and the total domestic expenditure for goods and services at current prices for the years 2020 through 2024.
DOMESTIC EXPENDITURE(1)
2020 | 2021 | 2022 | 2023 | 2024 | Percentage of 2024 gross domestic product |
|||||||||||||||||||
(Billions of euros at current prices) | ||||||||||||||||||||||||
Gross domestic product |
380.3 | 406.2 | 448.0 | 473.2 | 484.2 | 100.0 | ||||||||||||||||||
Add: Imports |
183.6 | 223.7 | 279.6 | 271.4 | 262.9 | 54.3 | ||||||||||||||||||
|
|
|
|
|
|
|
|
|
|
|
|
|||||||||||||
Total demand |
564.0 | 630.0 | 727.7 | 744.6 | 747.1 | 154.3 | ||||||||||||||||||
Less: Exports |
196.5 | 227.3 | 277.6 | 281.4 | 276.6 | 57.1 | ||||||||||||||||||
Total domestic demand |
367.5 | 402.7 | 450.1 | 463.2 | 470.5 | 97.2 | ||||||||||||||||||
Domestic expenditure: |
| |||||||||||||||||||||||
Consumption expenditure: |
| |||||||||||||||||||||||
Households(2) |
188.6 | 201.7 | 228.0 | 245.9 | 254.6 | 52.6 | ||||||||||||||||||
General government |
81.0 | 88.6 | 92.3 | 98.2 | 106.8 | 22.0 | ||||||||||||||||||
|
|
|
|
|
|
|
|
|
|
|
|
|||||||||||||
Final consumption expenditure |
269.6 | 290.3 | 320.3 | 344.0 | 361.4 | 74.6 | ||||||||||||||||||
Investment: |
||||||||||||||||||||||||
Machinery and equipment(3) |
28.9 | 31.9 | 33.9 | 37.5 | 38.1 | 7.9 | ||||||||||||||||||
Construction |
45.2 | 50.2 | 55.2 | 53.6 | 52.2 | 10.8 | ||||||||||||||||||
Other investment(4) |
21.5 | 23.0 | 25.0 | 26.7 | 28.6 | 5.9 | ||||||||||||||||||
|
|
|
|
|
|
|
|
|
|
|
|
|||||||||||||
Gross fixed capital formation |
95.6 | 105.1 | 114.1 | 117.8 | 118.8 | 24.5 | ||||||||||||||||||
Changes in inventories(5) |
2.0 | 7.3 | 16.8 | 2.4 | -8.3 | -1.7 | ||||||||||||||||||
|
|
|
|
|
|
|
|
|
|
|
|
|||||||||||||
Gross capital formation |
97.6 | 112.4 | 130.9 | 120.2 | 110.5 | 22.8 | ||||||||||||||||||
Statistical discrepancy |
0.3 | 0.0 | -1.2 | -1.1 | -1.4 | -0.3 | ||||||||||||||||||
Gross domestic final expenditure |
367.5 | 402.7 | 450.1 | 463.2 | 470.5 | 97.2 | ||||||||||||||||||
|
|
|
|
|
|
|
|
|
|
|
|
(1) | ESA 2010 basis. Amounts may not add due to rounding. |
(2) | Including non-profit institutions serving households. |
(3) | Including weapon systems. |
(4) | Intellectual property products and cultivated biological resources. |
(5) | Including acquisition less disposals of valuables. |
SOURCE: Statistics Austria, WDSWIFO Data System, Macrobond.
Productivity, Wages, Wholesale Prices and Cost of Living
The following table sets forth for Austria the indices of productivity and gross wages and salaries per worker and employee and wholesale and consumer prices (based on the HICP-index), and the respective percentage increases over the previous period for the years 2020 through 2024.
135
PRODUCTIVITY, WAGE AND PRICE INDICES(1)
Productivity Real GDP per person employed |
Wages and salaries per employee |
Wholesale prices | Consumer prices | |||||||||||||||||||||||||||||
Index (2015 = 100) |
Percentage increase over previous year |
Index (2015 = 100) |
Percentage increase over previous year |
Index (2015 = 100) |
Percentage increase over previous year |
Index (2015 = 100) |
Percentage increase over previous year |
|||||||||||||||||||||||||
2020 |
97.7 | -4.5 | 112.0 | +2.2 | 102.0 | -4.1 | 108.5 | +1.4 | ||||||||||||||||||||||||
2021 |
99.9 | +2.3 | 115.1 | +2.7 | 112.6 | +10.4 | 111.5 | +2.8 | ||||||||||||||||||||||||
2022 |
102.4 | +2.5 | 120.7 | +4.9 | 136.2 | +21.0 | 121.1 | +8.6 | ||||||||||||||||||||||||
2023 |
100.4 | -2.0 | 129.0 | +6.9 | 133.9 | -1.7 | 130.4 | +7.7 | ||||||||||||||||||||||||
2024 |
98.8 | -1.6 | 139.8 | +8.3 | 132.6 | -1.0 | 134.2 | +2.9 |
(1) | Indices based on average of monthly data for the periods indicated. |
SOURCE: Statistics Austria, WDSWIFO Data System, Macrobond.
Industry
In 2024, manufacturing accounted for 17.1% of gross value added at current prices, which is 0.6 percentage points below its share in the year before. This decline was mainly due to rising costs of energy and labor that led to a decline of cost-based competitiveness in Austrian manufacturing. The contribution of manufacturing to Austrias gross value added is higher than the average in Member States (15.6%). Austrias share of the European Unions manufacturing output decreased to 2.9% in 2024 after remaining stable between 3.2% and 3.3% from 2012 till 2021. The gross value added per employee was the eighth highest among the 27 Member States in 2022. According to the latest sectoral data from September 2024, in terms of contribution to GDP, machinery and equipment remained the largest sector within the industrial sector, followed by metals and metal products. The primary contributors to the Austrian exports industry are the motor vehicles industry, the machinery industry and the chemical industry. The export intensity in Austrian manufacturing is high. In 2024, approximately 21.8% of exports went to non-European destination countries, primarily in the Americas and Asia, but the EU-27 countries remained the main destination for Austrian exports, capturing approximately 67.0%. According to Statistics Austrias global estimate, Austrias R&D expenditure was well above the European Union average at 3.35% in 2024.
In 2024, an average of 637,006 active employees were part of the manufacturing industry, while 280,382 persons were actively employed in construction, representing 16.3% and 7.2% of Austrias wage and salary earners, respectively. Construction accounted for 6.5% of gross value added in 2024.
Banking, Insurance, Real Estate and Business Services
The Single Market program of the European Union fostered competition within Austrias financial services industry and led to a series of mergers and consolidations. The financial market crisis, automation and widespread use of internet banking services have accelerated the pace of adjustment. Furthermore, the COVID-19 crisis and new payment technologies fostered cashless payments in Austria. Consequently, the number of banks declined from 923 in 2000 to 458 at the end of 2024 and the number of branches was reduced by 1,405 units in the same period. At the end of 2024, the total exposure of Austrian banks towards Central, Eastern and Southeastern Europe (CESEE) according to the Bank for International Settlements fell slightly to EUR 321 billion, which amounted to 62% of Austrian GDP. With an aggregate annual result of around EUR 11.5 billion, Austrian banks can look back on a good business year in 2024. While total operating gains remained almost constant (+0.3%), Austrian banks recorded a drop in profits from investments in subsidiaries (-30%) and a loss of EUR 670 million from discontinued operations. In the third quarter of 2024, the profitability of Austrian banks (on a consolidated basis) in terms of their return on assets (0.9%) was above the corresponding European Union average (0.6%). The consolidated tier 1 capital ratio (T1) of Austrian banks remained stable at 18.6% at year-end 2024 compared to 2023.
The insurance industry is forecasted to grow by 5.5% in 2024 according to preliminary data published by the Financial Market Authority (FMA). The FMA-report indicates solid premium growth in both property-casualty insurance (+5.9%) and health insurance (+10.7%) for 2024. Life insurance recovered from years of shrinking premium intakes and increased by 1.3% in 2024, mainly due to additional single premium contracts. Investment income declined across the industry (-4.3%). Combined with high claims payments resulting from compensation related to the flooding in the summer of 2024, profits before taxes declined to EUR 1.6 billion (-6.7%). Solvency ratios remained comfortably above the Solvency II limits (254%).
According to preliminary data by the statistical office, output in financial and insurance activities grew in 2024 by 4.8% in real terms, while it increased by +2.5% in nominal terms. The contribution of financial services to Austrias gross value added to total value added remained at 5.3% in 2024.
Energy
The following table shows Austrias domestic production and consumption of primary energy and the ratio of domestic production to consumption for the years 2020 through 2023.
DOMESTIC PRODUCTION AND CONSUMPTION OF PRIMARY ENERGY
2020 | 2021 | 2022 | 2023 | |||||||||||||
(Tera Joules) | ||||||||||||||||
Indigenous primary production: |
||||||||||||||||
Electricity |
0 | 0 | 0 | 0 | ||||||||||||
Oil and oil products |
23,894 | 23,879 | 21,921 | 19,805 | ||||||||||||
Natural gas |
26,487 | 23,731 | 22,362 | 19,864 | ||||||||||||
Coal, coke and lignite |
0 | 0 | 0 | 0 | ||||||||||||
Renewable energy(1) |
469,790 | 482,638 | 467,111 | 509,678 | ||||||||||||
|
|
|
|
|
|
|
|
|||||||||
Total(2) |
520,170 | 530,248 | 511,393 | 549,347 | ||||||||||||
|
|
|
|
|
|
|
|
|||||||||
Gross domestic consumption(3): |
||||||||||||||||
Electricity from hydro, wind, PV |
190,902 | 200,942 | 195,708 | 198,117 | ||||||||||||
Oil and oil products |
464,451 | 492,075 | 474,999 | 474,908 | ||||||||||||
Natural gas |
306,427 | 323,717 | 288,460 | 246,722 | ||||||||||||
Coal, coke and lignite |
104,515 | 108,583 | 105,413 | 101,965 | ||||||||||||
Renewable energy(1) and waste |
284,781 | 307,198 | 300,210 | 308,287 | ||||||||||||
|
|
|
|
|
|
|
|
|||||||||
Total(2) |
1,351,075 | 1,432,515 | 1,364,790 | 1,329,998 | ||||||||||||
|
|
|
|
|
|
|
|
|||||||||
Indigenous primary production as a percentage of gross domestic consumption |
38.5 | 37.0 | 37.5 | 41.3 |
(1) | Fuelwood, biofuels, ambient heat, waste. |
(2) | Amounts may not add due to rounding. |
(3) | Taking into account changes in inventories of producers, intermediaries and importers, as well as exchanges with other countries excluding changes in inventories of ultimate consumers. |
SOURCE: WDSWIFO Data System, Macrobond.
136
While the reliance on oil, oil products and hydroelectric power as a percentage of total domestic consumption remained relatively stable and renewable energy including biomass increased slightly, the use of natural gas decreased for the second year. In the foreseeable future, Austria will have to continue importing significant amounts of electric and non-renewable energy products in order to meet its demand.
Domestic oil and gas production in Austria has declined steadily in recent years. In 2024, production of natural gas declined by 3.2% compared to 2023. Following a sharp decline of over 10% in 2023, the production of crude oil (including natural gas liquids) fell only slightly in 2024, reaching 0.476 million tons, which corresponds to 5.9% of the observed refinery intake. Natural gas production from domestic sources covered 7.9% of total domestic natural gas consumption in 2024. According to the Geological Survey, Austria had proven (and potentially available) reserves of 6.1 billion cubic meters of natural gas (excluding inert gas) and 4.03 million tons of crude oil at the end of 2024.
In 2024, Austria generated 10.7% more hydropower and 14.5% more wind-based electricity compared to 2023 (total gross domestic production of electricity +10.5% compared to 2023). Up until 2023, Austria was a net importer of electricity; net imports of total electricity more than tripled between 2010 and 2018, fell sharply in 2019 and 2020, and again rose in 2021 to the level of the years up to 2018, reaching 11.5% of domestic consumption (including consumption used for pumped storage) in 2022. In 2023, for the first time, Austria exported slightly more electricity than it imported. In 2024, Austria was already exporting significantly more electricity than it was importing. Since 1978, following a national referendum, Austrian law prohibits the use of nuclear power as a source of energy.
In 2024, expenditures for imported energy accounted for 2.9% of Austrias GDP. Kazakhstan, Libya, the Kingdom of Saudi Arabia, Azerbaijan, Guyana and Iraq were the principal suppliers of crude oil to Austria in 2024. 81.2% of all natural gas imports came from Russia and 12.9% came from Germany, whereas the share of Norwegian gas imports under the Troll-Gas-Sales Agreement reached 0.0%. The volume of total gas imports fell by 24.8% in 2024, with imports from Russia decreasing by 13.2%. Coal and coke were imported mainly from Poland.
Over the past decades, Austria had relied heavily on pipeline gas from Russia, partly due to its geographical proximity and Austrias lack of access to seaports. The reliance on Russia for more than four-fifths of Austrias natural gas supply exposed Austria to the risk of, among other things, supply disruptions and gas price increases. Since the Russian invasion of Ukraine on February 24, 2022, Austria has experienced the negative effects of this dependence. Russia has supplied significantly less gas to Europe and Austria and, as a result, high energy and commodity prices have pushed up consumer price inflation. The Austrian government has therefore declared a goal of reducing Austrias dependence on gas imports from Russia. In this context, the following steps and initiatives are being undertaken:
| Close cooperation with the EU Energy Platform. The Platform aims at coordinating EU action on global markets to prevent EU countries from outbidding each other, whilst leveraging their political and market weight to effectively diversify supplies, introduce direct competition between the worlds largest suppliers and achieve better conditions for all EU consumers. It covers a range of actions regarding natural gas and LNG (and in the future hydrogen) to support the EUs security of supply and access to affordable energy. The EU has set itself the goal to completely phase out imports of Russian natural gas by 2027. |
| Achieving and maintaining high levels of gas storage and establishing a strategic gas reserve (a state-controlled gas stock held by the federal government) totaling 20 TWh. The quality of data on existing reserves and their legal and technical accessibility has been improved. As of June 30, 2025, the gas storage level after the winter months was at 64.7%. |
| Efforts to diversify sources of gas supply. Additional investments into the cross-border gas pipeline network were made to enhance the capacity to transit gas from Germany and other European countries to Austria. These imports require a corresponding infrastructure of higher-ranking lines, storage facilities and transfer points, which is why Austrias participation in transnational infrastructure initiatives (e.g., European Hydrogen Backbone) is of great importance. Also, specific legislation was put in place to promote diversification, e.g., by targeted support for all companies that purchase gas from alternative sources and therefore reduce dependence on Russian natural gas. In this way, the Austrian government also specifically supports the establishment of new supply relationships by Austrian companies. |
Because of a legal dispute with the Austrian partly state-owned oil company OMV, the Russian natural gas supplier Gazprom Export ceased supplying natural gas to Austria on November 16, 2024, despite an existing long-term supply contract. Consequently, OMV announced the immediate cancellation of this contract on December 11, 2024. Even in case of limited availability of alternative gas imports via Italy and Germany and high gas consumption due to the winter season, no gas shortage is expected.
137
Disruptions in energy supply in combination with high energy costs pose material risks to economic growth. The efforts described above to reduce dependence on Russian gas and to diversify supply are intended to counteract these risks and are not expected to have a negative impact on the general economy.
Agriculture and Forestry
Almost half of Austrias surface area is used for agriculture and animal breeding. Domestic agricultural production covers approximately 90% of the countrys food consumption. In 2024, animal output (e.g., livestock raising and dairy operations) accounted for about 45.4% of total agricultural production.
Austria has one of the largest forest areas in Europe. About 44% of its surface area, or approximately 14,200 square miles, are forested. Exports of lumber and forest products, including paper, paperboard and pulp, represented 5.3% of Austrias exports in 2024.
In 2024, an average of 146,000 individuals were estimated to be employed in agriculture and forestry, representing 3.6% of Austrias labor force (measured as full-time equivalents).
Tourism
Austrias tourism industry benefits from many year-round destinations with visitor peaks in the winter and summer seasons. A large number of international, but also many domestic tourists are attracted by the countrys multifaceted natural and scenic beauties, as well as its rich tradition in cultural attractions.
Tourism demand continued to increase with 46.7 million arrivals and 154.3 million overnight stays in 2024, a rise of 3.3% and 2.1%, respectively, reaching new historic highs that exceeded the previous record levels of 2019 by 1.1% each. Similar to 2022 and 2023, growth in 2024 was primarily driven by international tourists (arrivals +4.2%, overnight stays +2.5%), while domestic demand grew more moderately (+1.6% and +0.9%, respectively). The overnight market share ratio of guest segments was approximately the same as in 2019, with 73.9% from foreign visitors and 26.1% from domestic guests.
Among foreign guests in Austria, the top 10 markets accounted for 82.5% of international overnight demand in 2024, with all but the USA (2.1%) located in Europe (Germany at 51.3%, the Netherlands at 9.7%, Switzerland (including Liechtenstein) at 3.9%, Czechia at 3.3%, the United Kingdom at 3.0%, Belgium at 2.6%, Italy at 2.4%, Poland at 2.3% and Hungary at 1.9%). Overall, these markets grew slightly less than overall international demand (+2.2% versus +2.5%), in particular the Netherlands (-0.2%), Switzerland (+0.3%), Germany (+1.8%) and Belgium (+2.0%). The other six top markets showed above-average growth, while the USA recorded the strongest percentage increase in overnight stays (+14.2%), followed by Poland and the United Kingdom (+5.5% and +5.4%, respectively).
Although demand from long-haul travelers, especially from Asia, rose sharply year-on-year in 2024 (China +85.6%, Japan +32.2%, Brazil +27.0%, India +21.1%, South Korea +13.6%), demand remained well below pre-pandemic levels in some cases (compared to 2019: Russia -86.2%, China -55.7%, Japan -53.9%, South Korea -22.5%).
The following table shows the total number of overnight stays by foreign tourists in Austria and international tourism receipts according to the balance of payments (the latter also includes spending by foreign guests during day trips).
138
OVERNIGHT STAYS BY FOREIGNERS
AND FOREIGN EXCHANGE RECEIPTS
2020 | 2021 | 2022 | 2023 | 2024 | ||||||||||||||||
Overnight stays by foreign visitors (thousands) |
66,280 | 49,964 | 98,031 | 111,261 | 114,058 | |||||||||||||||
International tourism receipts(1) (millions of Euros) |
13,436 | 10,167 | 21,019 | 25,419 | 26,975 |
(1) | Including international transport. |
SOURCE: Statistics Austria, OeNB; WDSWIFO Data System, Macrobond.
The Role of Government in the Economy
The industries and companies under state ownership formerly included the entire coal, iron ore, and iron and steel industries and a large part of the non-ferrous metals and oil and natural gas industries, as well as a number of companies producing machinery and vehicles, electrical machinery and equipment, and chemicals and chemical products. Austria vested the administration of ownership interests in these nationalized industries in the Österreichische Industrieholding Aktiengesellschaft (ÖIAG). In 1993 ÖIAG began with the privatization of companies or groups of companies owned by it. Since then, ÖIAG has carried out numerous privatization transactions including successfully floating holdings on the stock exchange. In March 2015, ÖIAG was converted into a limited liability company and renamed Österreichische Bundes- und Industriebeteiligungen GmbH (ÖBIB). With effect from February 20, 2019, ÖBIB was converted into a joint stock company and renamed Österreichische Beteiligungs AG (ÖBAG). ÖBAG is wholly-owned by the Republic of Austria.
ÖBAG holds interests in the three listed companies OMV AG (31.50%), Telekom Austria AG (28.42%), and Österreichische Post AG (52.85%). Regarding these holdings:
| OMV AG is engaged in the exploration, development and refining of oil and gas, as well as the production of chemicals for use in the fertilizer industry. |
| Telekom Austria AG is Austrias largest telecommunications group, providing fixed network, mobile communications, data communications and internet services. |
| Österreichische Post AG is Austrias leading service provider in mail carriage. |
Furthermore, ÖBAG owns stakes in Casinos Austria AG (33.24%), in APK Pensionskasse (32.97%) and in EuroTeleSites AG (28.42%) and is the sole owner of Bundesimmobiliengesellschaft m.b.H. (BIG), GKB-Bergbau GmbH and IMIB Immobilien- und Industriebeteiligungen GmbH. ÖBAG also manages the 51.00% stake in VERBUND AG, Austrias largest electricity provider, that is owned by the Republic of Austria. ÖBB-Holding AG, the holding company of the Austrian national railway system, is wholly owned by the Republic of Austria.
Labor and Social Legislation
At the beginning of 2024, about 6.0 million people of working age (15-64) lived in Austria, of which about 4.8 million (79.2%) were in the labor force (employees, self-employed and unemployed).
The number of persons in active employment was 3,897,774. For the first time, more than 1 million (1,005,840) were foreign workers, representing 25.8% of the workforce. About 60% of them are EU citizens.
Austrias real GDP declined by 1.2% in 2024. The ongoing economic weakness weighed on the labor market: employment increased only slightly in 2024 (+0.1% in 2024 compared to +1.1% in 2023). The unemployment rate (according to the European Labour Force Survey) increased to 5.2% in 2024, 0.1 percentage points higher than in 2023. The following table sets forth information relating to unemployment and wage increases for the years 2020 through 2024:
2020 | 2021 | 2022 | 2023 | 2024 | ||||||||||||||||
(%) | ||||||||||||||||||||
Unemployment rate (according to Labour Force Survey) |
6.0 | 6.2 | 4.8 | 5.1 | 5.2 | |||||||||||||||
Index increase of agreed scale wages |
+2.3 | +1.7 | +3.0 | +7.6 | +8.5 |
SOURCE: Eurostat, Statistics Austria.
Active dependent employment in construction (-2.9%) and manufacturing sectors (-1.4%) fell due to the downturn in the labor market. In the temporary employment sector, which is particularly sensitive to business cycle fluctuations, the slowdown in economic momentum has already been reflected in a year-on-year decline in employment from November 2022 onwards. Employment in retail and wholesale trade also declined in 2024 (-0.8%). In some service sectors, however, employment was higher than in the previous year (e.g., accommodation and food service industry (+0.9%), transport (+1.5%), information and communication sector (+1.9%), public services (+2.1%), provision of professional, scientific, technical services (+2.4%) and health services (+3.4%).
In 2024, the majority of the total employed population (74.7%) had a job in the tertiary sector. Another 21.6% worked in the secondary sector and 3.7% in the primary sector. The following table sets forth information relating to employment for the years 2020 through 2024:
2020 | 2021 | 2022 | 2023 | 2024 | ||||||||||||||||
(As % of total employment) | ||||||||||||||||||||
Primary sector |
4.3 | 4.2 | 4.0 | 3.7 | 3.7 | |||||||||||||||
Secondary sector |
22.3 | 22.2 | 22.1 | 22.0 | 21.6 | |||||||||||||||
Tertiary sector |
73.4 | 73.6 | 73.9 | 74.3 | 74.7 |
SOURCE: WDSWIFO Data System, Macrobond.Employment according to National Accounts definition (jobs).
139
The employment rate, which indicates how many people in a given age group are employed, was 74.1% in 2024 for people aged 15-64; the gender gap (not adjusted for working hours) was 6.8 percentage points, once again slightly lower than in previous years (7.6 percentage points in 2023; employment rate for men in 2024: 77.5%, employment rate for women in 2024: 70.7%). The employment rate of young people (2024: 51.3%) was particularly high by international comparison, especially for men, due to the high importance of apprenticeship training in Austria. In the age group 15-24, 54.3% of men and 48.3% of women were employed in 2024, with a gender gap of 6 percentage points. At prime working age (25 to 54 years), the gender gap decreased to 4 percentage points (2023: 4.8 percentage points; employment rate for men 2024: 87.4%, women 83.4%). The gender gap was most pronounced at the transition from working life to retirement at almost 15 percentage points (55-64 years old: men 66.2%, women 51.6%). However, it is expected that this pronounced gender-specific difference will decrease in the coming years with the alignment of the retirement age for women.
There are gender differences in the transition phases into and out of working life. On the one hand, there are differences in the educational choices made by young women and men, with men being more likely to opt for apprenticeship training, which is characterized by the fact that it takes place both at a company and at school, while women more often opt for full-time school-based intermediate and tertiary education. These differences in enrolment patterns continue into tertiary education.
The following table sets forth the employment rate in percent by age and gender for the years 2020 through 2024:
Sex |
Age |
2020 | 2021 | 2022 | 2023 | 2024 | ||||||||||||||||
Total |
15 to 24 years | 49.8 | 50.2 | 51.9 | 53.1 | 51.3 | ||||||||||||||||
Total |
15 to 64 years | 71.7 | 72.4 | 74.0 | 74.1 | 74.1 | ||||||||||||||||
Total |
25 to 54 years | 83.1 | 83.8 | 85.7 | 85.4 | 85.4 | ||||||||||||||||
Total |
55 to 64 years | 54.2 | 55.4 | 56.4 | 57.3 | 58.8 | ||||||||||||||||
Men |
15 to 24 years | 52.4 | 54.6 | 55.6 | 56.3 | 54.3 | ||||||||||||||||
Men |
15 to 64 years | 76.0 | 76.7 | 78.0 | 77.9 | 77.5 | ||||||||||||||||
Men |
25 to 54 years | 86.5 | 86.9 | 88.5 | 87.8 | 87.4 | ||||||||||||||||
Men |
55 to 64 years | 62.3 | 62.7 | 63.9 | 65.4 | 66.2 | ||||||||||||||||
Women |
15 to 24 years | 47.1 | 45.7 | 48.2 | 49.8 | 48.3 | ||||||||||||||||
Women |
15 to 64 years | 67.4 | 68.1 | 70.0 | 70.3 | 70.7 | ||||||||||||||||
Women |
25 to 54 years | 79.7 | 80.7 | 83.0 | 83.0 | 83.4 | ||||||||||||||||
Women |
55 to 64 years | 46.4 | 48.3 | 49.0 | 49.4 | 51.6 |
SOURCE: Eurostat, WIFO.Data according to Labour Force Survey (percentages of total population, based on persons). A time series break in 2021 due to survey changeover has no effect on the data in the table as comparability over time is ensured.
Austrias social security system includes health, maternity, disability and old age benefits, workers compensation, family allowances, supplementary retirement and welfare plans, unemployment benefits and a number of other social services and benefits. In 2023, about 99.9% of Austrias population was covered by health insurance (Main Association of Social Security Institutions, 2024), which is a major part of social security. Social security benefits are paid out of current contributions from employees and employers and by current allocations from the federal budget.
According to ESSPROS (European System of Integrated Social Protection Statistics), the gross social expenditure to GDP ratio was 30.9% in 2023. Compared to the previous year, this corresponds to an increase of 0.4 percentage points. At +7.2%, social spending grew faster than nominal GDP at +5.6%. In 2023, social expenditure was divided into the following components: 45.4% on old age, 28.1% on health care and sickness, 8.8% on family allowances, 5.3% on disability, 4.9% on survivors pensions, 4.6% on unemployment policy and 2.8% on housing and social inclusion.
The Austrian statutory pension system for employees, self-employed persons and farmers in gainful employment includes old-age, surviving and disability pensions. The first pillar is an earnings-related pay-as-you-go scheme. Occupational and private schemes as second and third pillar have a limited role in overall provisions. About 90.5% of old age income is out of the first, 3.8% out of the second and 5.7% out of the third pillar in 2023. The current statutory retirement age is 65 years for men. For women, it was 60 years until 2023 and between 2024 to 2033, it is expected to gradually increase by 0.5 years each year until it reaches 65. The early retirement age for the long-term insured (40 years of gainful employment) is 62. For women, this type of pension will therefore be relevant from 2028.
Over the past decade, major pension reforms have been adopted by the Austrian parliament with the aim of strengthening actuarial calculations, reducing early retirement by abolishing certain types of early retirement schemes and increasing the deductions for each year of early retirement. Deductions for early retirement range from 1.8% per year for heavy workers to 5.1% for the long-time insured. Each year of gainful employment counts for 1.78% for the pension payment which means that after 45 insurance years the gross replacement rate is 80.1% of average lifetime gross income. As a result of past reforms, the replacement rate of 80.1% now requires 45 years of insurance instead of 40 years. All pensions are fully subject to income tax and health insurance contributions.
The disability scheme has also been reformed: as of January 1, 2014, people born in 1964 or later no longer have access to temporary disability pensions. The reform is accompanied by a number of measures, such as rehabilitation programs, skills upgrading, etc., to reintegrate this group of workers into the workforce.
Overall, the pension reforms had positive effects: The average retirement age in 2024 was 61.2 years for women and 63.4 years for men (old age pensions) and the average age entering a disability pension was 53.4 years for women and 56.4 years for men (Main Association of Social Security Institutions, 2025). At the same time, access to disability pensions has halved over the last decade. According to the latest pension projections (November
140
2024) by the Austrian Pension Commission for 2024 to 2029, pension expenditure is expected to increase from 12.94% of GDP in 2024 to 13.6% of GDP in 2029. In 2024, 3.48% of pension expenditure (including poverty-preventing payments to pension beneficiaries) as a share of GDP was financed from the federal budget, rising to 3.83% of GDP in 2029. Recent pension reforms have reduced the growth of pension expenditure. However, the high price increases used as the basis for the annual pension adjustment increase the future expenditure dynamics much more than was calculated in the previous projections.
Foreign Direct Investments
The amount of inward foreign direct investment increased by 7.1% in 2024, after increasing by 5.3% in 2023. Inward foreign direct investment mainly originated from the 27 EU member states (50%), but this share has been decreasing over the last decade (2010: 62.7%). The largest EU investors in 2024 were Germany (27.8%) and Italy (5.7%). All European countries together accounted for 73.6% of inward foreign direct investment. The most important European investors in Austria from outside the EU were Russia (11.7%), as well as Switzerland (8.7%). Overseas, the USA (7.9%) and Canada (4.1%) were the most important investors in Austria, while the United Arab Emirates, Japan, and Hong Kong held shares of 3.5%, 1.6% and 1.2%, respectively.
Looking at the sector level, investment in the services sector, which accounted for 89.1% of inward foreign direct investment in 2024, was significantly larger than inward foreign direct investment in the manufacturing sector. Foreign investors have invested mainly in professional, scientific and technical service activities (58.8%), financial intermediation (11.4%), real estate activities (6.6%) and trade (6.1%). Important manufacturing industries in which foreign entities acquired major interests were the chemical industry (accounting for 2.9% of total foreign direct investment in 2024), the manufacturing of computers, electronic and optical products (2.1%) and the manufacturing of machinery and equipment (1.6% of total foreign direct investment in 2024). Growth in inward foreign direct investment was most dynamic in the fields of administrative and support service activities (67.9%), manufacture of computers, electronic and optical products (+36.7%) and transport equipment (+33.5%). The largest contributors to the 7.1% overall increase in foreign direct investment in 2024 were professional, scientific and technical services (+2.9 percentage points), financial intermediation (+1.8 percentage points), administrative and support service activities (+1.2 percentage points) and manufacture of computers, electronic and optical products (+0.6 percentage points). Negative contributions were concentrated in real estate activities (-0.2 percentage points) followed by food products, beverages and tobacco products (-0.1 percentage points). The contributions of the remaining sectors were spread around zero.
FOREIGN TRADE AND BALANCE OF PAYMENTS
Foreign Trade
On January 1, 1995, Austria joined the European Union and since then has taken part in all steps of deeper EU integration. Over the past 30 years, foreign trade has become increasingly important for the Austrian economy. In 2024, exports of goods at current prices (EUR 191.2 billion) represented 39.5% of GDP, compared to 24.0% in 1995. Due to the unfavorable international environment, Austrian exports of goods fell by 4.8% in 2024. As a result, export growth in Austria remained more subdued than in the euro area, leading to a loss of market share. Imports of goods decreased by 6.8% in 2024 compared with 2023, amounting to EUR 189.0 billion at current prices. This was mainly due to weak domestic industrial production and sluggish investment. The share of imports in GDP increased from 27.6% in 1995 to 39.0% in 2024. The goods balance improved in 2024 by EUR 4.2 billion compared to 2023 due to the weak demand for imports and, for the first time since 2007, achieved a surplus of EUR 2.2 billion or 0.5% of GDP.
The following table, which should be considered in conjunction with the price indices shown below, shows the exports and imports of goods of Austria in the years 2020 through 2024.
FOREIGN TRADE IN GOODS
Year |
Exports (f.o.b.) |
Imports (c.i.f.) |
Balance of trade |
Exports as a percentage of imports |
||||||||||||
(Millions of euros) | (%) | |||||||||||||||
2020 |
142,566 | 144,421 | -1,855 | 98.7 | ||||||||||||
2021 |
165,586 | 178,446 | -12,860 | 92.8 | ||||||||||||
2022 |
194,679 | 215,273 | -20,593 | 90.4 | ||||||||||||
2023 |
200,755 | 202,777 | -2,022 | 99.0 | ||||||||||||
2024 |
191,184 | 188,990 | +2,194 | 101.2 |
SOURCE: Statistics Austria, WDSWIFO Data System, Macrobond.
In 2024, 67% of Austrias external trade was with EU Member States. Austrias exports to the 27 EU Member States fell by 6.7% in 2024, after a moderate increase in 2023 (+2.8%). Germany is Austrias most important trading partner, accounting for 29.7% of exports and 32.2% of imports. The weak economic environment and sluggish industrial production, especially in Germany, dampened the development of goods exports in almost all export markets. In 2024, exports to Germany decreased by 2.9% and imports from Germany also fell by 6.0% compared to 2023. In general, Austrias international trade relations are still highly concentrated on the EU Single Market. Austrias trade relations with the EU-13, the new Member States since 2004, accounted for 19.1% of total exports and 15.8% of total imports. Although these countries experienced stronger GDP growth, exports to the EU-13 fell by 4.0%. While exports to countries outside of the European Union also fell slightly by 0.6% in 2024, exports to the USA and China increased significantly. In particular, exports of goods to the USA, Austrias second most important trading partner, increased by 10.1% and accounted for 8.5% of total exports. This positive trend in exports to the USA is due to the continued strong demand for Austrian chemical products, especially medical and pharmaceutical products.
In terms of product groups, exports of machinery and transport equipment are by far the most important group of Austrian exports, but they declined by 5.8% in 2024. Amid weakness in the European industry, almost all product groups in particular industrial primary products, machinery and vehicles recorded significant declines in both export and import dynamics.
Changes in the volume of exports and imports, in export and import prices and in Austrias terms of trade, i.e., the relationship of the prices of exported goods to the prices of imported goods, are shown in the following table.
141
INDICES OF FOREIGN TRADE IN GOODS
(2015 = 100)
Exports (f.o.b.) | Imports (c.i.f.) | Terms of trade(1) |
||||||||||||||||||
Year |
Price index |
Volume index |
Price index |
Volume index |
||||||||||||||||
2020 |
99.8 | 108.6 | 100.5 | 107.6 | 99.3 | |||||||||||||||
2021 |
106.4 | 118.3 | 108.5 | 123.2 | 98.1 | |||||||||||||||
2022 |
119.3 | 124.0 | 130.7 | 123.3 | 91.3 | |||||||||||||||
2023 |
119.2 | 128.0 | 131.9 | 115.2 | 90.4 | |||||||||||||||
2024 |
120.9 | 120.1 | 130.8 | 108.4 | 92.5 |
(1) | Export price index divided by import price index, expressed in percentages. |
SOURCE: Statistics Austria, WDSWIFO Data System, Macrobond.
The following table summarizes the composition of Austrias exports and imports by product groups for the years 2020 through 2024.
EXPORTS AND IMPORTS BY PRODUCT GROUPS(1)
2020 | 2021 | 2022 | 2023 | 2024 | Percentage of 2024 |
|||||||||||||||||||
(Millions of euros) | (%) | |||||||||||||||||||||||
Exports (f.o.b.): |
||||||||||||||||||||||||
Food and live animals |
8,836 | 9,565 | 11,119 | 11,997 | 12,719 | 6.7 | ||||||||||||||||||
Beverages and tobacco |
2,897 | 3,119 | 3,595 | 3,343 | 3,047 | 1.6 | ||||||||||||||||||
Crude materials, inedible except fuels |
4,276 | 5,850 | 6,537 | 5,485 | 5,791 | 3.0 | ||||||||||||||||||
Mineral fuels, lubricants and related materials |
2,810 | 4,154 | 7,599 | 7,486 | 5,674 | 3.0 | ||||||||||||||||||
Animal and vegetable oils, fats and waxes |
272 | 353 | 390 | 332 | 272 | 0.1 | ||||||||||||||||||
Chemicals and related products, n.e.s. |
22,182 | 25,288 | 29,080 | 34,610 | 33,241 | 17.4 | ||||||||||||||||||
Manufactured goods classified chiefly by material(2) |
28,731 | 35,343 | 42,774 | 39,262 | 37,910 | 19.8 | ||||||||||||||||||
Machinery and transport equipment |
54,398 | 61,308 | 69,497 | 75,306 | 70,930 | 37.1 | ||||||||||||||||||
Miscellaneous manufactured articles |
18,164 | 20,607 | 24,089 | 22,934 | 21,600 | 11.3 | ||||||||||||||||||
|
|
|
|
|
|
|
|
|
|
|
|
|||||||||||||
Total exports(3) |
142,566 | 165,586 | 194,679 | 200,755 | 191,184 | 100.0 | ||||||||||||||||||
|
|
|
|
|
|
|
|
|
|
|
|
|||||||||||||
Imports (c.i.f.): |
||||||||||||||||||||||||
Food and live animals |
10,161 | 10,716 | 12,626 | 13,821 | 15,240 | 8.1 | ||||||||||||||||||
Beverages and tobacco |
1,010 | 1,182 | 1,268 | 1,418 | 1,543 | 0.8 | ||||||||||||||||||
Crude materials, inedible except fuels |
5,818 | 8,235 | 9,029 | 7,480 | 7,171 | 3.8 | ||||||||||||||||||
Mineral fuels, lubricants and related materials |
8,258 | 13,912 | 27,119 | 18,186 | 14,073 | 7.4 | ||||||||||||||||||
Animal and vegetable oils, fats and waxes |
472 | 683 | 872 | 733 | 674 | 0.4 | ||||||||||||||||||
Chemicals and related products, n.e.s. |
20,951 | 26,235 | 29,674 | 28,967 | 26,725 | 14.1 | ||||||||||||||||||
Manufactured goods classified chiefly by material(2) |
22,943 | 29,114 | 34,924 | 29,977 | 27,919 | 14.8 | ||||||||||||||||||
Machinery and transport equipment |
50,450 | 59,089 | 65,852 | 69,963 | 65,659 | 34.7 | ||||||||||||||||||
Miscellaneous manufactured articles |
24,359 | 29,280 | 33,910 | 32,233 | 29,987 | 15.9 | ||||||||||||||||||
|
|
|
|
|
|
|
|
|
|
|
|
|||||||||||||
Total imports(3) |
144,421 | 178,446 | 215,273 | 202,777 | 188,990 | 100.0 | ||||||||||||||||||
|
|
|
|
|
|
|
|
|
|
|
|
(1) | Based on movement of goods. |
(2) | Semi-finished and finished products. |
(3) | Amounts may not add due to rounding. |
SOURCE: Statistics Austria, WDSWIFO Data System, Macrobond.
142
The following table shows the geographic distribution of Austrias foreign trade for the years 2020 through 2024.
EXPORTS AND IMPORTS BY GEOGRAPHIC AREA(1)
2020 | 2021 | 2022 | 2023 | 2024 | Percentage of 2024 |
|||||||||||||||||||
(Millions of Euros) | (%) | |||||||||||||||||||||||
Exports (f.o.b.): |
||||||||||||||||||||||||
EU countries(2) |
||||||||||||||||||||||||
Germany |
43,431 | 49,925 | 58,012 | 58,444 | 56,743 | 29.7 | ||||||||||||||||||
Italy |
8,823 | 11,211 | 13,244 | 12,309 | 11,745 | 6.1 | ||||||||||||||||||
Czech Republic |
5,083 | 6,030 | 7,083 | 7,236 | 6,763 | 3.5 | ||||||||||||||||||
Hungary |
4,948 | 6,134 | 7,734 | 7,258 | 6,843 | 3.6 | ||||||||||||||||||
Other EU countries |
34,104 | 39,466 | 47,604 | 52,124 | 46,079 | 24.1 | ||||||||||||||||||
|
|
|
|
|
|
|
|
|
|
|
|
|||||||||||||
Total EU 27 countries |
96,389 | 112,766 | 133,678 | 137,370 | 128,172 | 67.0 | ||||||||||||||||||
Other countries |
||||||||||||||||||||||||
United Kingdom |
4,080 | 4,440 | 5,106 | 5,453 | 4,933 | 2.6 | ||||||||||||||||||
Switzerland |
7,479 | 8,172 | 9,991 | 9,957 | 9,473 | 5.0 | ||||||||||||||||||
Russian Federation |
2,118 | 1,998 | 1,838 | 1,297 | 992 | 0.5 | ||||||||||||||||||
Other Eastern European countries(3) |
2,050 | 2,479 | 2,671 | 2,918 | 3,068 | 1.6 | ||||||||||||||||||
United States |
9,297 | 11,100 | 12,913 | 14,739 | 16,228 | 8.5 | ||||||||||||||||||
Japan |
1,522 | 1,704 | 1,787 | 1,783 | 1,582 | 0.8 | ||||||||||||||||||
China |
3,915 | 4,821 | 5,262 | 5,073 | 5,310 | 2.8 | ||||||||||||||||||
All other countries |
15,715 | 18,106 | 21,435 | 22,166 | 21,425 | 11.2 | ||||||||||||||||||
|
|
|
|
|
|
|
|
|
|
|
|
|||||||||||||
Total exports(4) |
142,566 | 165,586 | 194,679 | 200,755 | 191,184 | 100.0 | ||||||||||||||||||
|
|
|
|
|
|
|
|
|
|
|
|
|||||||||||||
Imports (c.i.f.): |
||||||||||||||||||||||||
EU countries(2) |
||||||||||||||||||||||||
Germany |
50,515 | 59,150 | 69,022 | 64,705 | 60,835 | 32.2 | ||||||||||||||||||
Italy |
9,119 | 11,571 | 13,437 | 13,010 | 12,335 | 6.5 | ||||||||||||||||||
Czech Republic |
6,014 | 7,762 | 9,819 | 8,404 | 8,124 | 4.3 | ||||||||||||||||||
Hungary |
3,872 | 4,684 | 5,348 | 5,037 | 4,782 | 2.5 | ||||||||||||||||||
Other EU countries |
29,246 | 35,770 | 42,614 | 40,197 | 39,414 | 20.9 | ||||||||||||||||||
|
|
|
|
|
|
|
|
|
|
|
|
|||||||||||||
Total EU 27 countries |
98,766 | 118,937 | 140,240 | 131,353 | 125,489 | 66.4 | ||||||||||||||||||
Other countries |
||||||||||||||||||||||||
United Kingdom |
2,144 | 2,779 | 3,495 | 3,070 | 2,330 | 1.2 | ||||||||||||||||||
Switzerland |
7,617 | 9,726 | 10,026 | 10,259 | 7,120 | 3.8 | ||||||||||||||||||
Russian Federation |
2,171 | 4,670 | 8,250 | 4,092 | 2,428 | 1.3 | ||||||||||||||||||
Other Eastern European countries(3) |
2,211 | 2,745 | 3,290 | 2,992 | 2,830 | 1.5 | ||||||||||||||||||
United States |
5,259 | 5,700 | 7,257 | 7,931 | 7,722 | 4.1 | ||||||||||||||||||
Japan |
2,050 | 2,243 | 2,521 | 2,813 | 2,508 | 1.3 | ||||||||||||||||||
China |
10,187 | 13,106 | 17,453 | 15,116 | 15,473 | 8.2 | ||||||||||||||||||
All other countries |
14,016 | 18,541 | 22,742 | 25,152 | 23,091 | 12.2 | ||||||||||||||||||
|
|
|
|
|
|
|
|
|
|
|
|
|||||||||||||
Total imports(4) |
144,421 | 178,446 | 215,273 | 202,777 | 188,990 | 100.0 |
(1) | Based on movements of goods. |
(2) | The EU consists of Austria, Belgium, Bulgaria, Croatia, Cyprus, Czech Republic, Denmark, Estonia, Finland, France, Germany, Greece, Hungary, Ireland, Italy, Latvia, Lithuania, Luxembourg, Malta, the Netherlands, Poland, Portugal, Romania, Slovakia, Slovenia, Spain and Sweden. |
(3) | Albania, Belarus, Bosnia and Herzegovina, Kosovo, Macedonia, Moldova, Montenegro, Serbia and Ukraine. |
(4) | Amounts may not add due to rounding. |
SOURCE: Statistics Austria, WDSWIFO Data System, Macrobond.
143
Balance of Payments
The following table shows the balance of payments of Austria with all countries and the net change in official international reserves of the Oesterreichische Nationalbank (OeNB), the central bank of the Republic of Austria, for the years 2020 through 2024.
BALANCE OF PAYMENTS(1)
2020 | 2021 | 2022 | 2023 | 2024 | ||||||||||||||||
(Millions of Euros) | ||||||||||||||||||||
Current account |
12,805 | 7,048 | -3,862 | 6,345 | 11,665 | |||||||||||||||
Goods |
4,461 | 49 | -8,770 | 4,005 | 7,901 | |||||||||||||||
Exports |
139,300 | 167,841 | 198,489 | 197,588 | 189,483 | |||||||||||||||
Imports |
134,839 | 167,792 | 207,259 | 193,583 | 181,582 | |||||||||||||||
Services |
7,926 | 3,155 | 6,246 | 5,504 | 5,853 | |||||||||||||||
Exports |
56,948 | 60,166 | 78,850 | 83,536 | 87,133 | |||||||||||||||
Imports |
49,020 | 57,010 | 72,605 | 78,032 | 81,279 | |||||||||||||||
Primary income |
4,185 | 6,700 | 2,015 | 193 | 1,610 | |||||||||||||||
Secondary income |
-3,767 | -2,857 | -3,353 | -3,356 | -3,699 | |||||||||||||||
Capital account |
-296 | 162 | -227 | 2,047 | -964 | |||||||||||||||
Financial account |
7,960 | 4,600 | -8,831 | 5,061 | 7,688 | |||||||||||||||
Direct investment |
12,180 | 8,574 | 88 | 5,043 | 1,355 | |||||||||||||||
Portfolio investment |
-12,819 | 12,293 | 1,064 | -14,323 | -24,868 | |||||||||||||||
Other investment(2) |
6,012 | -20,990 | -11,497 | 17,517 | 32,555 | |||||||||||||||
Financial derivatives |
1,105 | 569 | 943 | 818 | -1,023 | |||||||||||||||
Reserve assets |
1,484 | 4,152 | 572 | -3,993 | -332 | |||||||||||||||
Errors and omissions |
-4,548 | -2,612 | -4,743 | -3,333 | -3,012 |
(1) | New presentation scheme BPM6. Amounts may not add due to rounding. |
(2) | Includes currency and deposits, loans, trade credit and advances, SDR allocations, etc. |
SOURCE: OeNB.
The current account balance showed a high surplus of EUR 11.7 billion or 2.4% of GDP in 2024, after recording a deficit for the first time in two decades in 2022 (EUR -3.9 billion or -0.9% of GDP) and building on the recovery in 2023 (EUR +6.3 billion). The high surplus in the current account balance is attributable to trade in goods, which contributed a positive balance of EUR 7.9 billion. Expenditures on importing goods fell by 6.2% due to weak domestic demand. Travel net income stagnated and contributed a net EUR 8.6 billion to the result. Austrias income from foreign visitors reached EUR 24.3 billion, around 6.3% higher than 2023. The financial account in 2024 was primarily driven by a net outflow of funds from Austria. Portfolio investment continued to register net inflows. Direct investments made a positive contribution of EUR 1.4 billion to the financial account. While Austrian investors bought foreign long-term securities amounting to only EUR 4.6 billion, foreign investors acquired EUR 35.8 billion of Austrian securities. The outflow of other investments amounting to EUR 32.6 billion in 2024 was again driven by a considerable build-up of cash holdings and deposits abroad (EUR +29.8 billion).
Foreign Exchange Rates
On January 1, 1999, the euro was introduced as the legal currency of participating member states of the European Union, including Austria. The following table shows the average exchange rates of the euro to the dollar during the periods indicated.
144
EXCHANGE RATES OF THE EURO
Annual average |
||||
2020 |
1.1422 | |||
2021 |
1.1827 | |||
2022 |
1.0530 | |||
2023 |
1.0813 | |||
2024 |
1.0824 | |||
Monthly average |
||||
January 2025 |
1.0354 | |||
February 2025 |
1.0412 | |||
March 2025 |
1.0806 | |||
April 2025 |
1.1214 | |||
May 2025 |
1.1278 | |||
June 2025 |
1.1516 | |||
July 2025 |
1.1677 | |||
August 2025 (through August 11, 2025) |
1.1568 |
SOURCE: OeNB.
The exchange rate of the euro started into the year 2024 at 1.0956 USD per EUR and closed the year 2024 at 1.0389 USD per EUR. During 2024, the euro reached its low at 1.0389 USD per EUR on December 31, 2024, and its high at 1.1196 USD per EUR on September 30, 2024.
Austrian Economy and Budgetary Situation
The decline in industrial production in the eurozone that has been observed since the beginning of 2023 continues to have an impact on the Austrian economy. Surveys among industrial companies do not yet indicate a turnaround. In addition, the announced increase of US tariffs on EU export goods is weighing on sentiment. GDP is expected to shrink by 0.3% in 2025, following a decline of 1.2% in 2024 and of 1.0% in 2023, respectively. Construction and consumer demand, on the other hand, are trending upwards in 2025. The inflation rate rose significantly at the start of 2025, but is expected to fall again as the year progresses. The labor market is proving to be relatively robust given the duration and severity of the recession, although unemployment is also expected to rise in 2025. For 2026, the Austrian economy is expected to gain momentum again and to increase by 1.2%.
The ongoing economic crisis is having an impact on public finances and has caused the budget deficit to rise to 4.7% of GDP in 2024. In addition to the decline in economic output, the 8.8% rise in government spending driven by the wage settlements for the public sector, the adjustments to pensions and the valorization of social benefits contributed to the increase in the budget deficit. Tax revenues, on the other hand, increased less strongly by 4.9%. Due to the economic situation revenues from production and import duties in particular rose by only 3.2% in 2024, which is significantly lower than in previous years. The high budget deficit caused the debt ratio to increase to 81.8% of GDP in 2024.
Under the Treaty on the Functioning of the European Union and the Stability and Growth Pact, a member state whose general government deficit exceeds the reference value of 3% of GDP or whose general government debt is greater than 60% of GDP and is not sufficiently diminishing and approaching 60% of GDP at a satisfactory pace may become subject to an Excessive Deficit Procedure. On July 8, 2025, the European Union officially initiated an excessive deficit procedure against Austria. By mid-October, Austria must submit to the European Commission effective measures to comply with the correction path. The European Commission will then submit an assessment of the measures by mid-November.
See Revenues and ExpendituresFederal BudgetDeficit Restrictions and Excessive Deficit Procedure under the Treaty of Maastricht and the EU Stability and Growth Pact.
On July 27, 2025, the EU concluded a political framework agreement on tariffs and trade with the USA. The agreement provides a single 15% tariff rate for the majority of EU exports, including motor vehicles, semiconductors and pharmaceuticals. The impact of this agreement on the Austrian economy cannot yet be assessed in detail at this stage. However, in the run-up to the talks, the WIFO formulated an optimistic and a pessimistic tariff scenario and simulated the effects of the respective tariff rates on the economic output of the Austrian economy. The base scenario of this simulation assumed a tariff rate of only 10% which resulted in an expected negative effect on Austrian GDP of around 0.3 percent.
Russian Invasion of Ukraine
Since February 23, 2022, the EU agreed on a range of restrictive measures to respond to the Russian invasion of Ukraine. These measures include, among others, sanctions against members of the Russian State Duma as well as sanctions and asset freezes against other individuals and entities, restrictions on economic relations with the non-government controlled areas of the Donetsk and Luhansk oblasts, restrictions on the ability of the Russian state and government to access the EUs capital and financial markets and services, a SWIFT ban for seven Russian banks, sanctions against Belarus in response to its involvement in Russias military invasion, a ban on all transactions with certain state-owned enterprises, and a broad range of trade restrictions as well as export and import bans (e.g. concerning iron, steel¸ crude oil and refined petroleum products as well as luxury goods).
145
Under the Temporary Protection Directive, the EU decided to grant temporary protection in any EU member country to former residents of Ukraine, who left the country to escape war after February 24, 2022. Temporary protection will last for at least one year and may be extended depending on the situation in Ukraine. Rights under the Temporary Protection Directive include a residence permit, access to the labor market and housing, medical assistance, and access to education for children. In Austria, as of June 30, 2025, approximately 82,000 displaced persons from Ukraine had been registered.
BANKING SYSTEM AND MONETARY POLICY
Oesterreichische Nationalbank (OeNB)Central Bank of Austria
The following is a general description of the Austrian banking system as part of the European central bank system, which is defined by the Treaty establishing the European Community, as amended by the Treaty establishing the European Union (the Maastricht Treaty) (hereinafter the EC Treaty) and the Statutes of the European System of Central Banks and of the European Central Bank. The role of Austrias central bank in this system is also defined by the Austrian National Bank Act.
The OeNB, established by Austrian Federal Law in 1922, is the central bank of Austria. It is a joint stock company, 100% of whose shares are owned by the Republic of Austria by law.
The OeNB is supervised by a General Council (Generalrat) consisting of ten members: the President and Vice-President of the OeNB, and eight members appointed by the Federal Government for a term of five years. Pursuant to the National Bank Act, the members of the General Council shall comprise senior members from the practical sphere of the economic life besides lawyers and economists. The daily business of OeNB is run by the Directorate (Direktorium) consisting of the Gouverneur, the Vice-Gouverneur and two other members.
Like any other company in which the Republic of Austria holds a stake of at least 50% of the capital, the OeNB is subject to control by the Court of Accounts (Rechnungshof).
European System of Central Banks: Upon Austrias entry into the final stage of the European Monetary Union on January 1, 1999, the OeNB became an integral part of the European System of Central Banks (ESCB). The ESCB, which consists of the European Central Bank (ECB) and the national central banks (NCBs) of those EU member states participating in monetary union, was established for the conduct of the single European monetary policy. The ESCBs primary objective is to maintain price stability. In addition, and without prejudice to this objective, the ESCB supports the general economic policies in participating countries. Its basic functions are to define and implement the monetary policy of the euro area; to conduct foreign exchange operations; to hold and manage the official foreign reserves of the member states; and to promote the smooth operation of payment systems. The process of decision-making in the ESCB is centralized through the decision-making bodies of the ECB, namely the ECBs Executive Board and its Governing Councils.
The sole shareholders of the ECB are the NCBs of the member states. Each NCBs capital share is based on the respective member states share in the population and the GDP of the EU. Since January 1, 2024, the OeNB has a share of 2.4175% in the subscribed capital of the ECB.
By establishing the ECB, the participating member states abandoned some of their sovereignty over monetary policy, but the NCBs retain all of the functions that are not transferred to the ECB.
The ECB requires credit institutions established in the participating member states, including OeKB, to hold minimum reserves on accounts with the national central banks, which, in OeKBs case, are held by OeNB. OeKB calculates the minimum reserve requirements according to the relevant ECB regulations. The ECB may at any time change the reserve ratios. Liabilities to other institutions subject to the ECBs minimum reserve system and liabilities to the ECB and the national central banks are not included in the reserve base.
146
Single Supervisory Mechanism (SSM): The ECB took on new banking supervision tasks as part of a single supervisory mechanism. The SSM created a new system of financial supervision comprising the ECB and the national competent authorities of participating EU countries. Among these EU countries are those whose currency is the euro and those whose currency is not the euro but who have entered into close cooperation with the SSM. Specific tasks relating to the prudential supervision of credit institutions were conferred on the ECB according to Article 127(6) of the Treaty on the Functioning of the European Union. The main aims of the SSM are to ensure the safety and soundness of the European banking system and to increase financial integration and stability in Europe. The ECB is responsible for the effective and consistent functioning of the single supervisory mechanism, cooperating with the national competent authorities of participating EU countries. The ECB assumed its new banking supervision responsibilities in November 2014, 12 months after the regulation creating the supervisor entered into force.
Banking System
As of December 31, 2024, Austria had a total of 458 independent banks (Kreditinstitute, or credit institutions), which are classified into seven sectors on the basis of their legal status:
| 36 joint stock banks and private bankers |
| 49 savings banks |
| 6 regional mortgage banks |
| 284 rural credit cooperatives |
| 9 small commercial cooperative banks |
| 4 building and loan societies |
| 53 special purpose banks |
| 17 branches of foreign banks |
In 2024, the number of credit institutions in Austria decreased by 14 from 472 to 458. The development was driven by mergers of small banks, mainly cooperative banks (Raiffeisenbanken), in order to create bigger and more competitive units. This process of consolidation is ongoing and is expected to lead to a further reduction of banks in 2025.
Unless otherwise specified, data in this section refer to all Austrian-based credit institutions, including those under foreign ownership.
Business Activity and Earnings Situation
The leverage ratio of Austrian-based credit institutions increased in 2024 from 9.7% to a level of 9.9%. Overall lending by Austrian banks to non-banks also decreased by 0.1% over the same time frame, with loans to domestic non-financial corporations increasing by 0.8% and loans to households decreasing by 1.0%. Loans to the general government decreased by 8.8% in 2024 compared to 2023.
In 2024, the total operating profit of all Austrian-based credit institutions slightly increased by 0.3% compared to 2023. There was an increase in income from financial transactions (+55.1%), together with a small increase in interest income (+1.8%) whereas commission income increased slightly (+0.6%). Furthermore, 2024 saw an increase in securities and participating interests (+12.6%) as well as operating income slightly increasing by 1.0%. On the other hand, operating expenses increased only by 0.4%. As a result, the cost/income ratio decreased to 46.0%. Six Austrian banks (Addiko Bank, Erste Group, BAWAG P.S.K, Volksbank Wien AG, Raiffeisen Bank International as well as one Raiffeisen Landesbank) are supervised under the Single Supervisory Mechanism (SSM).
Exposure to Eastern European Regions and Countries
As of December 31, 2024, majority-Austrian-owned banks had significant exposure to the Central, Eastern, and Southeastern Europe (CESEE) region, with total assets amounting to EUR 315 billion, rising from EUR 288 billion as of December 31, 2023. The most significant subsidiaries are located in Czechia, Slovakia, Romania, Croatia and Hungary which together account for nearly 86% of Austrian banks aggregate EU assets in the CESEE region. The CESEE subsidiaries generated EUR 5.4 billion in net profits in 2024, declining slightly from EUR 5.5 billion in 2023 and representing nearly 50% of total Austrian banking profit.
147
Monetary Policy
In order to fulfill the mandate of maintaining price stability, the EC Treaty accords the Eurosystem (term used to refer to the ECB and the NCBs of the member states that have adopted the euro) a considerable degree of institutional independence, albeit supplemented by extensive obligations concerning transparency and accountability.
The Eurosystems stability-oriented monetary policy, which was announced in October 1998 and thoroughly evaluated four and a half years after the introduction of the euro in May 2003, consists of three main elements: a quantitative definition of price stability, a broadly based assessment of the outlook for price developments, and a prominent role for money in the assessment of risks to price stability. The last two elements are also referred to as the two pillars which structure the comprehensive analysis on which monetary policy decisions are based. While the economic analysis identifies short to medium-term risks to price stability, the monetary analysis should help assessing medium to long-term trends in inflation.
The Eurosystem has a variety of monetary policy instruments at its disposal to manage liquidity. As an integral part of the Eurosystem, one of the main tasks of the OeNB is to carry out monetary policy operations in Austria.
The euro money market, in which the TARGET (Trans-European Automated Real-time Gross settlement Express Transfer) System payment system plays an important role, has continued to operate with increasing efficiency. The number of cross-border transactions was considerably higher than before the start of the Eurozone, and some banks managed at times to get liquidity in the unsecured segment at conditions at least as favorable as the minimum bid rate in the tender operations.
As of the last maintenance period in 2024 lasting from October 23, 2024 to December 17, 2024 the Austrian share amounted to approximately 2.9% of the total Eurozone reserve requirement. The minimum reserve ratio applicable to the liability base of banks was left unchanged at 1% in 2024. In the course of 2024, required reserves increased slightly from approximately EUR 4.7 billion to EUR 4.8 billion in the last maintenance period in 2024. Until December 20, 2022, minimum reserves accrued interest on the basis of the marginal rate that the Eurosystem charges for its main refinancing operations. From December 21, 2022 until September 19, 2023, minimum reserves have been remunerated at the interest rate of the Eurosystems deposit facility. As of September 20, 2023, the remuneration of minimum reserves has been set at 0%.
The following table sets out Austrias official reserve assets as of December 31, 2022, 2023 and 2024.
December 31, 2022 |
December 31, 2023 |
December 31, 2024 |
||||||||||||
Official Reserve Assets |
31,102 | 28,270 | 34,070 | |||||||||||
1. |
Foreign currency assets (in convertible foreign currencies) | 7,422 | 3,149 | 3,089 | ||||||||||
(1a) Securities | 7,354 | 3,078 | 3,040 | |||||||||||
(1b) total currency and deposits with: | ||||||||||||||
(i) other national central banks BIS and IMF |
68 | 71 | 49 | |||||||||||
(ii) banks headquartered in the euro area and located abroad |
0 | 0 | 0 | |||||||||||
(iii) banks headquartered and located outside the euro area |
0 | 0 | 1 | |||||||||||
2. | IMF reserve position | 1,370 | 1,332 | 1,228 | ||||||||||
3. |
SDRs |
6,952 | 6,972 | 7,150 | ||||||||||
4. |
Gold (including gold deposits and gold swapped) |
15,359 | 16,815 | 22,605 | ||||||||||
- volume in millions of fine troy ounces | 9 | 9 | 9 | |||||||||||
5. |
Other reserve assets |
-1 | 2 | -2 | ||||||||||
- financial derivatives | -1 | 2 | -2 | |||||||||||
Other Foreign Currency Assets | 793 | 1,006 | 397 | |||||||||||
- securities not included in official reserve assets | 793 | 1,003 | 355 | |||||||||||
- deposits not included in official reserve assets | 0 | 3 | 42 | |||||||||||
- loans not included in official reserve assets | 0 | 0 | 0 | |||||||||||
- financial derivatives not included in official reserve assets | 0 | 0 | 0 |
SOURCE: OeNB, Austrian Federal Financing Agency.
148
The ECB has exclusive authority for the issuance of banknotes within the euro area. Since Austria joined the European Economic and Monetary Union, the OeNB publishes data on the number of banknotes in circulation, calculated by the ECB in accordance with decision ECB/2010/29. According to these calculations, there were EUR 43,203 million banknotes in circulation in Austria as of December 31, 2024.
Monetary Policy Response to the COVID-19 Pandemic. In March 2020, the ECB launched a pandemic emergency purchase program (PEPP) to counter the risks of the COVID-19 pandemic to the monetary policy transmission mechanism and the economic outlook of the euro area. This temporary asset purchase program has an overall envelope of EUR 750 billion, with assets class eligibility coinciding with existing asset purchasing programs, including a waiver of eligibility for Greek government bonds. The ECB pledged to keep this program intact for as long as the COVID-19 pandemic persists, but in any case, until the end of 2020.
On December 10, 2020, the ECB announced a significant recalibration of its monetary policy instruments in view of the economic fallout due to the resurgence of the COVID-19 pandemic. These include, among others, the decision of the governing council of the ECB (the Governing Council) to increase the PEPP by EUR 500 billion to a total of EUR 1,850 billion and to extend the horizon for net purchases under the PEPP to at least the end of March 2022. In addition, the reinvestment of principal payments from maturing securities purchased under the PEPP was extended until at least the end of 2024. Furthermore, the Governing Council recalibrated the conditions of the third series of targeted longer-term refinancing operations (TLTRO III) by extending the period over which considerably more favorable terms will apply by 12 months to June 2022. Three additional operations will also be conducted between June and December 2021. The Governing Council also decided to raise the total amount that counterparties will be entitled to borrow in TLTRO III operations from 50% to 55% of their stock of eligible loans. In order to provide an incentive for banks to sustain the current level of bank lending, the recalibrated TLTRO III borrowing conditions will be made available only to banks that achieve a new lending performance target. Moreover, the Governing Council extended the duration of the set of collateral easing measures it adopted in April 2020 to June 2022, and decided to offer four additional pandemic emergency longer-term refinancing operations (PELTROs) in 2021, which are expected to continue to provide an effective liquidity backstop.
On July 21, 2022, the ECB Governing Council approved the Transmission Protection Instrument (TPI). The Governing Council assessed that the establishment of the TPI is necessary to support the effective transmission of monetary policy. In particular, as the Governing Council continues normalizing monetary policy, the TPI is supposed to ensure that the monetary policy stance is transmitted smoothly across all euro area countries. TPI purchases are focused on public sector securities with a remaining maturity between one and ten years. Jurisdictions in which the Eurosystem might conduct purchases under the TPI must fulfill a cumulative list of criteria to ensure sound and sustainable fiscal and macroeconomic policies.
On October 25, 2022, the Governing Council of the European Central Bank (ECB) decided to recalibrate the conditions of the third series of targeted longer-term refinancing operations (TLTRO III) as part of the monetary policy measures adopted to restore price stability over the medium term. From November 23, 2022 until the maturity date or early repayment date of each respective outstanding TLTRO III operation, the interest rate on TLTRO III operations will be indexed to the average applicable key ECB interest rates over this period. Due to the less attractive TLTRO design, three additional voluntary early repayment dates were introduced to provide participants with additional opportunities to repay their respective TLTRO III borrowings before their maturity. The final tranches of TLTRO III will mature in the course of 2024.
The asset purchase programme (APP) portfolio is declining at a measured and predictable pace as the Eurosystem no longer reinvests the principal payments from maturing securities. The Pandemic Emergency Purchase Programme (PEPP) is currently being reduced by EUR 7.5 billion per month on average. The Governing Council intends to discontinue reinvestments under this programme completely at the end of 2024.
149
Federal Budget
Since 2009, the annual budget process on the federal level has been split into two parts: the preparation of the Medium-Term Expenditure Framework (MTEF) in the spring and the annual budget, which is based on the MTEF.
The MTEF, concerning only the federal government and accompanied by the presentation of a Budget Strategy Report, was introduced in January 2009 in order to enhance budgetary stability. Under the new rules, the Parliament is obliged to adopt a four-year plan, setting binding expenditure limits in nominal terms for the five main budgetary headings. Annually in the spring, the Parliament rolls the four-year plan forward by one year. The expenditure ceilings are either fixed or flexible. Flexible expenditure ceilings are used for areas exposed to cyclical fluctuations, such as social security allocations. Ceilings are also set at the sub-heading level, or chapters, but these are binding only for the following year and are only indicative for the remaining three years. The MTEF is intended to serve as a basis for the planning, implementation and control of the priorities and budgetary objectives set out by the government. For the annual budget, the broad expenditure categories by chapter have to be broken down to each appropriation account. Fixed expenditure items are required to be consistent with the MTEF, and budgeted amounts for variable expenditure items are set based on the current economic forecast. Deviations from the ceilings are only permitted to the extent of the amount of existing reserves and additional revenues. For each ministry, any unspent appropriations at the end of the year may be accrued as reserves, thereby encouraging a more efficient use of resources. Both the MTEF and the annual budget must be approved by Parliament. If the estimated funds of the budget or fixed expenditure ceilings of the MTEF are not sufficient, an amendment to the budget law or the MTEF, respectively, would be required to be passed by Parliament. Budget deficits are financed by government borrowing either domestically or externally.
Pursuant to the Federal Constitution, the Rechnungshof (Austrian Court of Audit) is mandated with the audit of the administration of the finances of the federal government and its constituent provinces and of their annual financial statements. The Rechnungshof is independent from the executive branch and reports directly to the Nationalrat. It is responsible for the compilation of the budget outcome report to be submitted annually to the Nationalrat, for assistance in the contracting of indebtedness for moneys borrowed (federal debt documents have to be countersigned by the president of the Rechnungshof), for the control of administration expenditures, and for assistance in issuing certain government decrees.
The figures of the federal budget are presented on a cash basis and cover only parts of the Austrian government sector. For international comparison and assessment of the Austrian fiscal position, budget figures for the general government sector have to be prepared in accordance with the accrual-based system of national accounts. In addition to the federal budget, the general government sector as defined in the Maastricht treaty and in the 2010 European System of Accounts (ESA 2010) also includes the provincial governments (Länder), the local authorities (Gemeinden) and the social security sector.
Deficit Restrictions and Excessive Deficit Procedure under the Treaty of Maastricht and the EU Stability and Growth Pact
To ensure continuous budgetary discipline in the European Monetary Union, the member states agreed on the Treaty of Maastricht (the Treaty) in 1992 as well as on the main elements of a Stability and Growth Pact (the Pact) established in 1997.
According to the Treaty, the ratio of gross government debt to GDP of a member state must not exceed 60% at the end of the preceding fiscal year. If the debt ratio is in excess of 60% of GDP and the gap between the debt ratio and the 60% reference value is, on average, reduced by 1/20th annually, the fiscal requirements are considered to be met; the 1/20 debt reduction rule is designed such that one-off measures like the debt effects due to the financial crisis or debt accrued due to crisis support to other member states will be subtracted before the 1/20 reduction assessment is applied.
150
According to the Pact, which was last amended in 2013, member states must converge and adhere to their medium-term budgetary objectives in order to ensure the long-term sustainability of public finances and to minimize the risk of government deficits exceeding the reference value of 3% of GDP under the Treaty on the Functioning of the European Union (TFEU). Under the TFEU and the Pact, a member state whose general government deficit exceeds the reference value of 3% of GDP or is non-compliant with the debt requirement if its general government debt is greater than 60% of GDP and is not sufficiently diminishing and approaching 60% of GDP at a satisfactory pace becomes subject to the Excessive Deficit Procedure (EDP).
Under the EDP, the Economic and Financial Affairs Council (the Ecofin Council) determines whether an excessive deficit exists. The Ecofin Council is composed of Economics and Finance Ministers of the member states. If it determines that an excessive deficit exists, the Ecofin Council, based on a recommendation by the European Commission, will recommend measures aimed at correcting the excessive deficit and will review the corrective measures taken by the member state. For those member states whose currency is the euro, the Pact contemplates a set of financial sanctions. Those member states can be required to provide a non-interest bearing deposit of up to 0.2% of the previous years national GDP upon the determination that an excessive deficit exists. If the Ecofin Council, after reviewing a member states corrective measures, decides that no effective action has been taken to correct the excessive deficit, the deposit can turn into a fine of up to 0.2% of the previous years national GDP and a variable component (whereas no fine should exceed 0.5% of GDP, annually). The Ecofin Council takes these decisions by using the reversed qualified majority voting rule, i.e. the European Commissions recommendation on financial sanctions will be adopted, unless the Ecofin Council decides with a qualified majority to reject the European Commissions recommendation. Other relevant factors are also taken into account in the steps leading to the decision on the existence of an excessive deficit (breach of the deficit and/or debt criterion). For instance, in the case of a severe economic downturn or when the deviation is the result of an unusual event outside of the control of the member state concerned, provided that the deviation does not endanger the sustainability of the fiscal position over the medium term, triggering an EDP may be avoided. Those member states not being subject to an EDP must adhere to the so-called preventive arm of the Pact. The preventive arm of the Pact aims to ensure sound budgetary policies over the medium term by setting parameters for member states fiscal planning and policies during normal economic times (medium-term budgetary objective and expenditure benchmark), while taking into account the ups and downs of the economic cycle.
Treaty on Stability, Coordination and Governance in the European Economic and Monetary Union
On January 1, 2013, the Treaty on Stability, Coordination and Governance in the European Economic and Monetary Union (the TSCG) entered into force. Since then it has been ratified by 26 signatories (all EU member states except for Czech Republic). Its provisions are binding for euro area member states, while the other member states will only be bound if they adopt the euro, unless they declare their intention to be bound by certain provisions of the treaty at an earlier date. The core set of rules aims at further strengthening fiscal discipline within the euro area and is also known as the fiscal compact (Title III of the TSCG). The fiscal compact binds 23 EU member states. These are the 20 euro area countries plus Bulgaria, Denmark and Romania who have chosen to opt-in. It is accompanied by a set of common principles, including the role and independence of monitoring institutions. The TSCG is not EU law but an entirely new intergovernmental agreement. Therefore, the fiscal compact does not replace the Pact, but is applicable in parallel to the Pact and reinforces its rules. The fiscal compact requires contracting parties to ensure convergence towards the country- specific medium-term budgetary objectives, as defined in the Pact, with an upper limit of a structural deficit of 0.5% of GDP for countries with a debt-to-GDP-ratio in excess of 60% or of 1.0% of GDP for states with a debt-to-GDP-ratio below 60%. In the event of a deviation from this rule, an automatic correction mechanism will be triggered, with escape clauses for exceptional circumstances. These budget rules were required to be transposed into national law through provisions of binding force and permanent character, preferably constitutional no later than one year after the entry into force of the treaty, i.e., by January 1, 2014 at the latest. If a contracting party does not comply, the matter can be brought to the Court of Justice of the European Union by one or more of the other Contracting Parties. The courts judgment would be binding, and, in the case of non-compliance with the judgment, could be followed up with a penalty of up to 0.1% of GDP, payable to the European Stability Mechanism (ESM) in the case of euro area member states. In other cases, payments shall be made to the general budget of the European Union. A full assessment of the transposition of the fiscal compact into national law was provided by the European Commission in February 2017. Five countries (Spain, Slovenia, Belgium, Greece and Luxembourg) were requested to complete the transposition of the provisions of the fiscal compact into national law. Moreover, the contracting parties agreed that financial assistance will only be granted under the ESM if the relevant member state has ratified the TSCG by March 1, 2013 and transposed the provisions relating to the balanced budget rule into national law within the time frame set in the fiscal compact. Finally, the fiscal compact includes a commitment by euro area member states to adopt the European
151
Commissions recommendations in the framework of an EDP unless opposed by a qualified majority. The fiscal compact entered into force in Austria as of January 1, 2013. In Article 16 of the TSCG, a political agreement is enshrined, according to which within five years of its entry into force steps should be taken in order to incorporate the substance of that Treaty into the legal framework of the European Union. Accordingly, on December 6, 2017, the European Commission presented a corresponding proposal for a Council Directive. This is currently being discussed.
Response to the European Sovereign Debt Crisis
To safeguard the stability of euro area sovereign debt markets, euro area member states in 2010 established the temporary European Financial Stability Facility (EFSF) followed in 2012 by the permanent European Stability Mechanism (ESM). As of December 31, 2024, Greece had EUR 31.61 billion outstanding in bilateral loans vis-à-vis other Euro area Member States, EUR 127.4 billion in loans to the European Financial Stability Facility (EFSF) and EUR 59.9 billion to the European Stability Mechanism (ESM). Ireland had loans outstanding to the EFSF of EUR 18.41 billion. Portugal had loans outstanding to the EFSF of EUR 25.33 billion. Cyprus had loans outstanding to the ESM of EUR 6.3 billion. Spain had loans outstanding to the ESM of EUR 11.9 billion.
On November 30, 2020, the Eurogroup in inclusive format (i.e., the economic and finance ministers of all EU Member States) agreed on the reform of the ESM with a view to strengthening the Economic and Monetary Union and the European Banking Union. The reform aims to further develop the ESM toolkit and strengthen the role of the ESM in the design, negotiation and monitoring of financial assistance programs. It will also provide for the establishment of a common backstop to the Single Resolution Fund (SRF) in the form of a credit line from the ESM, providing a financial safety net for bank resolutions in the Banking Union, which will help to protect financial stability. The common backstop will replace the Direct Recapitalization Instrument, which currently allows the ESM to recapitalize systemic and viable euro area financial institutions under specific circumstances as a last resort measure. These changes aim to strengthen the resilience and crisis resolution capacities of the euro area. As of end-2023, the Amending Agreement to the ESM-Treaty has not yet entered into force.
Croatia adopted the Euro on January 1, 2023 and subsequently became a member of the ESM.
Federal Accounts and Budget
The federal accounts as set forth below for the years 2020 to 2023 were audited by the Rechnungshof and approved by the Nationalrat. The accounts for the year 2024 are the Draft Federal Budget audited by the Rechnungshof but not yet approved by the Nationalrat. For further information concerning the budget for the fiscal years 2020 to 2024, see Tables and Supplementary InformationPart 2: Republic of AustriaI. Federal Revenues and Expenditures.
152
SUMMARY OF REVENUES AND EXPENDITURES
2020 | 2021 | 2022 | 2023 | 2024(1) | ||||||||||||||||
(Millions of euros) | ||||||||||||||||||||
I. General Account |
||||||||||||||||||||
Federal Government Revenues: |
||||||||||||||||||||
Total taxes and leviesgross |
81,808 | 95,684 | 105,167 110,152 | 114,269 | ||||||||||||||||
Less: transfers to provinces, municipalities and funds |
(30,045 | ) | (33,269 | ) | (39,533 | ) | (39,587 | ) | (41,315 | ) | ||||||||||
Transfer to EUbudget |
(3,478 | ) | (3,561 | ) | (3,406 | ) | (3,098 | ) | (2,937 | ) | ||||||||||
|
|
|
|
|
|
|
|
|
|
|||||||||||
Total taxes and leviesnet |
48,285 | 58,854 | 62,228 | 67,467 | 70,017 | |||||||||||||||
Other sources |
29,750 | 30,336 | 28,399 | 33,753 | 31,551 | |||||||||||||||
Total revenues |
77,855 | 89,190 | 90,627 | 101,220 | 101,568 | |||||||||||||||
|
|
|
|
|
|
|
|
|
|
|||||||||||
Total Expenditures |
100,334 | 107,139 | 111,389 | 109,235 | 120,687 |
153
2020 | 2021 | 2022 | 2023 | 2024(1) | ||||||||||||||||
(Millions of euros) | ||||||||||||||||||||
(Budget deficit) / Budget surplusnet of public debt redemptions |
(22,480 | ) | (17,949 | ) | (20,762 | ) | (8,014 | ) | (19,119 | ) | ||||||||||
(Budget deficit) / Budget surplusnet, as a percentage of gross domestic product |
(6.0 | %) | (4.4 | %) | (4.1 | %) | (2.9 | %) | (3.2 | %) | ||||||||||
General Government (deficit)/surplus in national accounts delineation (Maastricht (deficit)/surplus)as a percentage of gross domestic product |
(8.9 | %) | (5.8 | %) | (3.5 | %) | (2.6 | %) | (4.7 | %) | ||||||||||
Central Government (deficit)/surplus in national accounts delineation (Maastricht (deficit)/surplus)as a percentage of gross domestic product |
(7.8 | %) | (5.2 | %) | (3.8 | %) | (2.5 | %) | (3.5 | %) | ||||||||||
II. Financing Account |
||||||||||||||||||||
Expenditure |
131,860 | 128,194 | 120,354 | 188,218 | 191,452 | |||||||||||||||
Revenue |
154,339 | 146,143 | 141,116 | 196,232 | 210,572 | |||||||||||||||
|
|
|
|
|
|
|
|
|
|
|||||||||||
(Deficit) / Surplus |
22,480 | 17,949 | 20,762 | 8,014 | 19,119 | |||||||||||||||
|
|
|
|
|
|
|
|
|
|
Differences may arise due to rounding
(1) | Draft Federal Budget |
SOURCE: Federal Ministry of Finance.
On January 1, 2013, the Federal Budget Reform 2013 came into effect. The key elements of the reform are the following: performance oriented (instead of input oriented) budgeting; enhanced accountability of ministries and budget managing bodies; improved structuring by implementing Global Budgets and Detail Budgets; and a new accounting system including capital finance accounting, operating statements and capital accounting, which replaces the former system of governmental accounting.
Taxation
The principal taxes levied by Austria are personal income tax (including salary and wage tax), corporate income tax and value added tax (VAT).
Personal income taxation is progressive, with a top marginal rate of 55% on taxable income in excess of EUR 1,000,000. For employees, this top marginal rate is reduced by statutory tax allowances for 1/6 of the yearly income. For the corporate income tax there is a flat rate of 23%. The general VAT rate is 20%, and the reduced rates, mainly on food products, rents, passenger transport, books and newspapers and certain services, are 13% and 10%.
Under Austrian law, a fraction of the taxes collected by the federal government must be remitted to the provinces and municipalities under a revenue-sharing plan. The fractions and the taxes involved, and the basis of distribution among the provincial and local entities, are negotiated periodically among federal and other government authorities. The latest agreement concluded in 2023 covers the period 2024 to 2028.
Austria is a party to tax treaties with numerous countries worldwide, including the USA.
154
Summary of Domestic and External Debt
The following table sets forth the total direct domestic and external debt of Austria outstanding at December 31 of the years indicated:
December 31, | ||||||||||||||||||||||||
2020 | 2021 | 2022 | 2023 | 2024 | 2024 | |||||||||||||||||||
(after swaps) | (before swaps) | |||||||||||||||||||||||
(Millions of euros) | ||||||||||||||||||||||||
Domestic |
250,289 | 266,292 | 283,129 | 294,129 | 312,227 | 307,161 | ||||||||||||||||||
External(1) |
0 | 0 | 0 | 0 | 0 | 5,251 | ||||||||||||||||||
|
|
|
|
|
|
|
|
|
|
|
|
|||||||||||||
Total |
250,289 | 266,292 | 283,129 | 294,813 | 312,227 | 312,412 | ||||||||||||||||||
|
|
|
|
|
|
|
|
|
|
|
|
|||||||||||||
Less: Holdings of own Bonds |
(12,317 | ) | (12,726 | ) | (12,239 | ) | (11,560 | ) | (12,975 | ) | (12,975 | ) | ||||||||||||
|
|
|
|
|
|
|
|
|
|
|
|
|||||||||||||
Total |
237,972 | 253,566 | 270,890 | 283,252 | 299,252 | 299,436 | ||||||||||||||||||
|
|
|
|
|
|
|
|
|
|
|
|
(1) | Translated into EUR at the exchange rates prevailing at December 31 of each year indicated. |
SOURCE: Austrian Federal Financing Agency.
As of December 31, 2024, after giving effect to currency swaps, there was no external funded debt outstanding.
In addition to its direct debt, Austria has guaranteed the payment of the principal of, and interest on, certain obligations of public agencies, enterprises in which Austria has an ownership interest, and of others pursuant to the Export Guarantees Act and Export Financing Guarantees Act. The major portion of the debt guaranteed by Austria has been guaranteed pursuant to the Export Guarantees Act and the Export Financing Guarantees Act.
The following table sets forth the principal amount of debt guaranteed by Austria outstanding at December 31 of the years indicated:
GUARANTEED DEBT
December 31, | ||||||||||||||||||||
2020 | 2021 | 2022 | 2023 | 2024 | ||||||||||||||||
(Millions of euros) | ||||||||||||||||||||
Domestic |
76,449 | 73,361 | 71,248 | 68,619 | 65,432 | |||||||||||||||
External(1) |
24,433 | 26,663 | 24,548 | 24,026 | 27,140 | |||||||||||||||
|
|
|
|
|
|
|
|
|
|
|||||||||||
Total Guaranteed Debt(2) |
100,882 | 100,024 | 95,796 | 92,645 | 92,572 | |||||||||||||||
|
|
|
|
|
|
|
|
|
|
(1) | Translated into EUR at the exchange rates prevailing at December 31 of each year indicated. |
(2) | In addition, the Republic is liable by law for all liabilities of the Austrian Postal Savings Bank assumed until December 31, 2000, which amounted to EUR 0.42 billion as of December 31, 2024. |
SOURCE: Ministry of Finance.
155
Debt Service
The following table sets forth the debt service requirements for the indicated periods in respect of the internal funded debt of Austria outstanding at December 31, 2024.
DEBT SERVICE REQUIREMENTS OF DOMESTIC DEBT
2025 | 2026 | 2027 | 2028 | 2029 | ||||||||||||||||
(Billions of euros) | ||||||||||||||||||||
Interest |
5.2 | 5.0 | 4.3 | 3.6 | 3.5 | |||||||||||||||
Principal |
43.5 | 28.6 | 22.5 | 21.6 | 21.6 | |||||||||||||||
|
|
|
|
|
|
|
|
|
|
|||||||||||
Total |
48.6 | 33.6 | 26.8 | 25.3 | 25.1 | |||||||||||||||
|
|
|
|
|
|
|
|
|
|
SOURCE: Austrian Federal Financing Agency.
As of December 31, 2024, after giving effect to currency swaps, there was no external funded debt outstanding.
General Government Gross Debt
General government gross debt is defined in the Maastricht Treaty as consolidated general government gross debt at nominal value outstanding at the end of the year in the following categories of government liabilities: currency and deposits, securities other than shares, excluding financial derivatives, and loans. For this purpose, the general government sector comprises the federal government, the provincial governments (Länder), the local authorities (Gemeinden) and the social security sector.
Member states are required by EU treaties to keep their general government gross debt equal to or below (or on a sufficiently downward trend towards) 60% of GDP. An excessive deficit procedure may be launched on the basis of a debt ratio in excess of 60% of GDP, if the gap between the debt ratio and the 60% reference is not reduced, on average, by 1/20th annually (see Revenues and ExpendituresFederal BudgetDeficit Restrictions and Excessive Deficit Procedure under the Treaty of Maastricht and the EU Stability and Growth Pact). Relevant factors such as funding extended to stabilize the financial markets may be taken into account when assessing compliance with the debt rule.
GENERAL GOVERNMENT GROSS DEBT(1)
December 31, | ||||||||||||||||||||
2020 | 2021 | 2022 | 2023 | 2024 | ||||||||||||||||
(Millions of euros) | ||||||||||||||||||||
General government gross debt(2) |
316,360 | 334,713 | 351,131 | 371,520 | 394,131 | |||||||||||||||
|
|
|
|
|
|
|
|
|
|
|||||||||||
General government gross debt as a percentage of gross domestic product |
82.2 | % | 82.4 | % | 78.4 | % | 78.5 | % | 81.8 | % | ||||||||||
|
|
|
|
|
|
|
|
|
|
(1) | All values reflect the statistical methodologies required by the European System of Accounts 2010 (ESA 2010). |
(2) | As defined in the Maastricht Treaty and ESA 2010. |
SOURCE: Statistik Austria.
General government gross debt as a percentage of GDP as of December 31, 2024 was 81.8%, which represents a 3.3 percentage point increase in comparison to December 31, 2023. This increase was mainly due to the higher government gross debt, which more than compensated for the increase in GDP.
156
TABLES AND SUPPLEMENTARY INFORMATION
PART 1: OESTERREICHISCHE KONTROLLBANK AKTIENGESELLSCHAFT
I. OUTSTANDING DEBT AS OF DECEMBER 31, 2024
Issue |
Issue Date | Termination Date |
Interest Rate |
Nominal | Amount in EUR based on exchange rate as of 12/31/2024 |
|||||||||||||||||||||||
USD 1,500,000,000 1.50% Guaranteed Global Notes |
2/12/2020 | 2/12/2025 | 1.50000 | % | USD | 1,500,000,000.00 | EUR | 1,443,834,825.30 | ||||||||||||||||||||
USD 60,000,000 5.132% Guaranteed Notes |
2/21/2024 | 2/21/2025 | 5.13200 | % | USD | 60,000,000.00 | EUR | 57,753,393.01 | ||||||||||||||||||||
CNH 400,000,000 2.44% Guaranteed Notes |
3/5/2024 | 3/5/2025 | 2.44000 | % | CNH | 400,000,000.00 | EUR | 52,747,484.60 | ||||||||||||||||||||
USD 1,000,000,000 2.875% Guaranteed Global Notes |
5/24/2022 | 5/23/2025 | 2.87500 | % | USD | 1,000,000,000.00 | EUR | 962,556,550.20 | ||||||||||||||||||||
USD 100,000,000 4.94% Guaranteed Notes |
8/1/2023 | 8/1/2025 | 4.94000 | % | USD | 100,000,000.00 | EUR | 96,255,655.02 | ||||||||||||||||||||
AUD 450,000,000 3.2% Guaranteed Notes |
2/25/2015 | 8/25/2025 | 3.20000 | % | AUD | 450,000,000.00 | EUR | 268,304,316.72 | ||||||||||||||||||||
USD 1,500,000,000 0.375% Guaranteed Global Notes |
9/17/2020 | 9/17/2025 | 0.37500 | % | USD | 1,500,000,000.00 | EUR | 1,443,834,825.30 | ||||||||||||||||||||
USD 1,000,000,000 4.625% Guaranteed Global Notes |
11/3/2022 | 11/3/2025 | 4.62500 | % | USD | 1,000,000,000.00 | EUR | 962,556,550.20 | ||||||||||||||||||||
GBP 1,000,000,000 0.50% Guaranteed Notes |
6/15/2021 | 12/15/2025 | 0.50000 | % | GBP | 1,000,000,000.00 | EUR | 1,206,010,757.62 | ||||||||||||||||||||
USD 1,000,000,000 4.125% Guaranteed Global Notes |
1/20/2023 | 1/20/2026 | 4.12500 | % | USD | 1,000,000,000.00 | EUR | 962,556,550.20 | ||||||||||||||||||||
USD 1,500,000,000 0.50% Guaranteed Global Notes |
2/2/2021 | 2/2/2026 | 0.50000 | % | USD | 1,500,000,000.00 | EUR | 1,443,834,825.30 | ||||||||||||||||||||
HKD 400,000,000 3.82% Guaranteed Notes |
2/9/2024 | 2/9/2026 | 3.82000 | % | HKD | 400,000,000.00 | EUR | 49,574,895.27 | ||||||||||||||||||||
HKD 400,000,000 3.95% Guaranteed Notes |
2/9/2024 | 2/9/2026 | 3.95000 | % | HKD | 400,000,000.00 | EUR | 49,574,895.27 | ||||||||||||||||||||
GBP 625,000,000 4.25% Guaranteed Notes |
1/17/2023 | 3/17/2026 | 4.25000 | % | GBP | 625,000,000.00 | EUR | 753,756,723.51 | ||||||||||||||||||||
NOK 1,000,000,000 1.337% Guaranteed Notes |
3/30/2021 | 3/30/2026 | 1.33700 | % | NOK | 1,000,000,000.00 | EUR | 84,781,687.16 | ||||||||||||||||||||
CNH 500,000,000 2.755% Guaranteed Notes |
4/13/2023 | 4/13/2026 | 2.75500 | % | CNH | 500,000,000.00 | EUR | 65,934,355.76 | ||||||||||||||||||||
USD 150,000,000 3.975% Guaranteed Notes |
4/13/2023 | 4/13/2026 | 3.97500 | % | USD | 150,000,000.00 | EUR | 144,383,482.53 | ||||||||||||||||||||
CNH 1,000,000,000 2.62% Guaranteed Notes |
4/20/2023 | 4/20/2026 | 2.62000 | % | CNH | 1,000,000,000.00 | EUR | 131,868,711.51 | ||||||||||||||||||||
CNH 350,000,000 2.98% Guaranteed Notes |
4/26/2024 | 4/26/2026 | 2.98000 | % | CNH | 350,000,000.00 | EUR | 46,154,049.03 | ||||||||||||||||||||
CNH 2,000,000,000 2.56% Guaranteed Notes |
5/23/2024 | 5/23/2026 | 2.56000 | % | CNH | 2,000,000,000.00 | EUR | 263,737,423.02 | ||||||||||||||||||||
USD 50,000,000 4.74% Guaranteed Notes |
7/2/2024 | 7/2/2026 | 4.74000 | % | USD | 50,000,000.00 | EUR | 48,127,827.51 | ||||||||||||||||||||
EUR 500,000,000 0.00% Guaranteed Notes SUBO |
10/8/2019 | 10/8/2026 | 0.00000 | % | EUR | 500,000,000.00 | EUR | 500,000,000.00 | ||||||||||||||||||||
USD 1,000,000,000 5.00% Guaranteed Global Notes |
10/24/2023 | 10/23/2026 | 5.00000 | % | USD | 1,000,000,000.00 | EUR | 962,556,550.20 | ||||||||||||||||||||
CNH 350,000,000 2.41% Guaranteed Notes |
11/22/2024 | 11/20/2026 | 2.41000 | % | CNH | 350,000,000.00 | EUR | 46,154,049.03 | ||||||||||||||||||||
HKD 400,000,000 1.58% Guaranteed Notes |
2/8/2022 | 2/2/2027 | 1.58000 | % | HKD | 400,000,000.00 | EUR | 49,574,895.27 | ||||||||||||||||||||
USD 1,500,000,000 4.75% Guaranteed Global Notes |
5/21/2024 | 5/21/2027 | 4.75000 | % | USD | 1,500,000,000.00 | EUR | 1,443,834,825.30 | ||||||||||||||||||||
EUR 500,000,000 1.50% Guaranteed Notes SUBO |
7/13/2022 | 7/13/2027 | 1.50000 | % | EUR | 500,000,000.00 | EUR | 500,000,000.00 | ||||||||||||||||||||
GBP 530,000,000 4.125% Guaranteed Notes |
1/16/2024 | 7/22/2027 | 4.12500 | % | GBP | 530,000,000.00 | EUR | 639,185,701.54 | ||||||||||||||||||||
AUD 215,000,000 3.50% Guaranteed Notes |
2/3/2017 | 8/3/2027 | 3.50000 | % | AUD | 215,000,000.00 | EUR | 128,189,840.21 | ||||||||||||||||||||
USD 1,000,000,000 3.625% Guaranteed Global Notes |
9/9/2022 | 9/9/2027 | 3.62500 | % | USD | 1,000,000,000.00 | EUR | 962,556,550.20 | ||||||||||||||||||||
HKD 400,000,000 2.90% Guaranteed Notes |
9/23/2024 | 9/23/2027 | 2.90000 | % | HKD | 400,000,000.00 | EUR | 49,574,895.27 | ||||||||||||||||||||
HKD 500,000,000 3.2125% Guaranteed Notes |
10/15/2024 | 10/15/2027 | 3.21250 | % | HKD | 500,000,000.00 | EUR | 61,968,619.09 | ||||||||||||||||||||
HKD 400,000,000 3.51% Guaranteed Notes |
10/18/2024 | 10/18/2027 | 3.51000 | % | HKD | 400,000,000.00 | EUR | 49,574,895.27 | ||||||||||||||||||||
EUR 80,000,000 2.45% Guaranteed Notes |
10/21/2024 | 10/21/2027 | 2.45000 | % | EUR | 80,000,000.00 | EUR | 80,000,000.00 | ||||||||||||||||||||
CNH 300,000,000 2.48% Guaranteed Notes |
11/27/2024 | 11/26/2027 | 2.48000 | % | CNH | 300,000,000.00 | EUR | 39,560,613.45 | ||||||||||||||||||||
USD 1,000,000,000 4.25% Guaranteed Global Notes |
3/1/2023 | 3/1/2028 | 4.25000 | % | USD | 1,000,000,000.00 | EUR | 962,556,550.20 | ||||||||||||||||||||
GBP 465,000,000 4.125% Guaranteed Notes |
4/16/2024 | 10/16/2028 | 4.12500 | % | GBP | 465,000,000.00 | EUR | 560,795,002.29 | ||||||||||||||||||||
SEK 200,000,000 1.37% Guaranteed Notes |
7/11/2019 | 11/13/2028 | 1.37000 | % | SEK | 200,000,000.00 | EUR | 17,453,529.98 | ||||||||||||||||||||
AUD 175,000,000 3.3% Guaranteed Notes |
5/15/2018 | 11/15/2028 | 3.30000 | % | AUD | 175,000,000.00 | EUR | 104,340,567.61 | ||||||||||||||||||||
EUR 500,000,000 3.125% Guaranteed Notes SUBO |
11/15/2023 | 11/15/2028 | 3.12500 | % | EUR | 500,000,000.00 | EUR | 500,000,000.00 | ||||||||||||||||||||
GBP 150,000,000 5.75% Guaranteed Notes |
10/21/1999 | 12/7/2028 | 5.75000 | % | GBP | 150,000,000.00 | EUR | 180,901,613.64 | ||||||||||||||||||||
USD 1,500,000,000 4.125% Guaranteed Global Notes |
1/18/2024 | 1/18/2029 | 4.12500 | % | USD | 1,500,000,000.00 | EUR | 1,443,834,825.30 | ||||||||||||||||||||
AUD 400,000,000 4.3% Guaranteed Notes |
3/20/2024 | 3/20/2029 | 4.30000 | % | AUD | 400,000,000.00 | EUR | 238,492,725.97 | ||||||||||||||||||||
GBP 300,000,000 4.00% Guaranteed Notes |
8/27/2024 | 6/27/2029 | 4.00000 | % | GBP | 300,000,000.00 | EUR | 361,803,227.28 | ||||||||||||||||||||
USD 1,000,000,000 3.75% Guaranteed Global Notes |
9/5/2024 | 9/5/2029 | 3.75000 | % | USD | 1,000,000,000.00 | EUR | 962,556,550.20 | ||||||||||||||||||||
CHF 1,090,000,000 2.875% Guaranteed Notes |
2/25/2005 | 2/25/2030 | 2.87500 | % | CHF | 1,090,000,000.00 | EUR | 1,158,096,047.60 | ||||||||||||||||||||
USD 50,000,000 4.805% Guaranteed Notes |
5/8/2024 | 5/8/2031 | 4.80500 | % | USD | 50,000,000.00 | EUR | 48,127,827.51 | ||||||||||||||||||||
AUD 60,000,000 3.3% Guaranteed Notes |
3/29/2022 | 9/29/2032 | 3.30000 | % | AUD | 60,000,000.00 | EUR | 35,773,908.90 | ||||||||||||||||||||
CHF 200,000,000 3.25% Guaranteed Notes |
7/25/2006 | 7/25/2036 | 3.25000 | % | CHF | 200,000,000.00 | EUR | 212,494,687.63 |
157
Exchange Rate as of 12/31/2024 |
||||||||||||||||||||
AUD |
1.67720 | AUD | 1,300,000,000.00 | EUR | 775,101,359.41 | |||||||||||||||
CAD |
1.49480 | CAD | 0.00 | EUR | 0.00 | |||||||||||||||
CHF |
0.94120 | CHF | 1,290,000,000.00 | EUR | 1,370,590,735.23 | |||||||||||||||
EUR |
1.00000 | EUR | 1,580,000,000.00 | EUR | 1,580,000,000.00 | |||||||||||||||
GBP |
0.82918 | GBP | 3,070,000,000.00 | EUR | 3,702,453,025.88 | |||||||||||||||
JPY |
163.06000 | JPY | 0.00 | EUR | 0.00 | |||||||||||||||
TRY |
36.73720 | TRY | 0.00 | EUR | 0.00 | |||||||||||||||
USD |
1.03890 | USD | 14,910,000,000.00 | EUR | 14,351,718,163.48 | |||||||||||||||
NOK |
11.795 | NOK | 1,000,000,000.00 | EUR | 84,781,687.16 | |||||||||||||||
HUF |
411.35 | HUF | 0.00 | EUR | 0.00 | |||||||||||||||
SEK |
11.459 | SEK | 200,000,000.00 | EUR | 17,453,529.98 | |||||||||||||||
CNH |
7.5833 | CNH | 4,900,000,000.00 | EUR | 646,156,686.40 | |||||||||||||||
HKD |
8.0686 | HKD | 2,500,000,000.00 | EUR | 309,843,095.44 | |||||||||||||||
|
|
|||||||||||||||||||
EUR | 22,838,098,282.98 |
158
PART 2: REPUBLIC OF AUSTRIA
I. FEDERAL REVENUES AND EXPENDITURES
ORDINARY BUDGET REVENUES
2020 | 2021 | 2022 | 2023 | 2024(1) | ||||||||||||||||
(Millions of euros) | ||||||||||||||||||||
Total taxes and levies, gross |
81,808 | 95,684 | 105,167 | 110,152 | 114,269 | |||||||||||||||
Of which: |
||||||||||||||||||||
Personal Income Tax |
2,982 | 4,473 | 5,867 | 4,852 | 5,006 | |||||||||||||||
Wage Tax |
27,255 | 30,096 | 31,421 | 33,281 | 36,214 | |||||||||||||||
Tax on Interest |
2,580 | 4,217 | 4,336 | 4,804 | 5,635 | |||||||||||||||
Corporate Income Tax |
6,334 | 9,821 | 13,625 | 13,266 | 12,658 | |||||||||||||||
Turnover Tax |
27,563 | 30,648 | 35,397 | 38,167 | 38,628 | |||||||||||||||
Mineral Oils Tax |
3,778 | 3,968 | 4,133 | 4,009 | 3,804 | |||||||||||||||
Other Taxes and Levies |
11,316 | 12,461 | 10,388 | 11,773 | 12,324 | |||||||||||||||
|
|
|
|
|
|
|
|
|
|
|||||||||||
Less: transfers to provinces and municipalities, funds, etc. |
(30,045 | ) | (33,269 | ) | (39,533 | ) | (39,587 | ) | (41,315 | ) | ||||||||||
Transfers to the European Union |
(3,478 | ) | (3,561 | ) | (3,406 | ) | (3,098 | ) | (2,937 | ) | ||||||||||
|
|
|
|
|
|
|
|
|
|
|||||||||||
Public taxes, net |
48,285 | 58,854 | 62,228 | 67,467 | 70,017 | |||||||||||||||
Other sources |
29,570 | 30,336 | 28,399 | 33,753 | 31,551 | |||||||||||||||
|
|
|
|
|
|
|
|
|
|
|||||||||||
Total |
77,855 | 89,190 | 90,627 | 101,220 | 101,568 | |||||||||||||||
|
|
|
|
|
|
|
|
|
|
Differences may arise due to rounding
(1) | Draft Federal Budget |
SOURCE: Federal Ministry of Finance.
On January 1, 2013, the Federal Budget Reform 2013 came into effect. The key elements of the reform are the following: performance oriented (instead of input oriented) budgeting; enhanced accountability of ministries and budget managing bodies; improved structuring by implementing Global Budgets and Detail Budgets; and a new accounting system including capital finance accounting, operating statements and capital accounting, which replaces the former system of governmental accounting.
159
ORDINARY BUDGET EXPENDITURES
2020 | 2021 | 2022 | 2023 | 2024(1) | ||||||||||||||||
(Millions of euros) | ||||||||||||||||||||
I. General Account |
||||||||||||||||||||
Federal Government: |
||||||||||||||||||||
Office of the President |
9 | 10 | 10 | 12 | 12 | |||||||||||||||
Federal Legislature |
252 | 320 | 325 | 320 | 313 | |||||||||||||||
Constitutional Court |
17 | 18 | 17 | 19 | 20 | |||||||||||||||
Administrative Court |
22 | 22 | 22 | 24 | 26 | |||||||||||||||
Public Attorneys Office |
12 | 13 | 14 | 15 | 16 | |||||||||||||||
Court of Accounts |
35 | 37 | 37 | 41 | 46 | |||||||||||||||
Federal Chancellery |
434 | 481 | 535 | 597 | 961 | |||||||||||||||
Interior Affairs |
2,956 | 3,182 | 3,295 | 3,601 | 4,010 |
160
2020 | 2021 | 2022 | 2023 | 2024(1) | ||||||||||||||||
(Millions of euros) | ||||||||||||||||||||
Foreign Affairs |
521 | 541 | 626 | 618 | 643 | |||||||||||||||
Justice |
1,773 | 1,775 | 1,852 | 2,063 | 2,321 | |||||||||||||||
Military Affairs and Sport |
3,208 | 3,420 | 3,029 | 3,596 | 4,326 | |||||||||||||||
Financial Administration |
1,177 | 1,097 | 1,374 | 1,657 | 1,554 | |||||||||||||||
Asylum/Migration |
381 | 358 | 582 | 779 | 629 | |||||||||||||||
Pensions |
10,656 | 12,185 | 12,664 | 11,490 | 12,658 | |||||||||||||||
Grants to Provinces and Municipalities |
1,396 | 1,803 | 2,753 | 2,527 | 3,406 | |||||||||||||||
Federal Property |
9,305 | 11,686 | 6,915 | 2,188 | 2,398 | |||||||||||||||
Financial Market Stability |
26 | 27 | 1,026 | 1 | 135 | |||||||||||||||
Treasury Operations |
56 | 69 | 61 | 0 | 0 | |||||||||||||||
Public Debt Services incl. Swaps |
3,675 | 3,221 | 6,021 | 7,689 | 7,365 | |||||||||||||||
Employment |
15,831 | 13,762 | 9,719 | 9,134 | 10,181 | |||||||||||||||
Social Affairs and Consumer Protection |
3,940 | 3,986 | 4,065 | 5,113 | 5,790 | |||||||||||||||
Social Security |
10,100 | 10,346 | 10,733 | 13,950 | 17,357 | |||||||||||||||
Health |
1,791 | 5,045 | 5,655 | 3,985 | 2,951 | |||||||||||||||
Youth and Family |
8,068 | 7,654 | 8,123 | 8,262 | 8,747 | |||||||||||||||
Commerce (Research) |
110 | 93 | 119 | 166 | 222 | |||||||||||||||
Economy |
1,770 | 2,179 | 1,358 | 2,103 | 2,002 | |||||||||||||||
Education, Arts and Culture |
9,891 | 10,313 | 10,564 | 11,320 | 12,247 | |||||||||||||||
Science |
4,875 | 5,044 | 5,370 | 6,057 | 6,557 | |||||||||||||||
Transportation, Innovation and Technology (Research) |
517 | 441 | 561 | 580 | 540 | |||||||||||||||
Transportation, Innovation and Technology |
4,292 | 4,343 | 4,708 | 5,069 | 5,357 | |||||||||||||||
Agriculture, Forestry and Water economy |
2,902 | 3,214 | 3,052 | 3,026 | 3,012 | |||||||||||||||
Environment |
336 | 454 | 8,527 | 3,233 | 4,884 | |||||||||||||||
Total Federal Expenditure |
100,334 | 107,139 | 111,389 | 109,235 | 120,687 | |||||||||||||||
(Net Deficit) / Net Surplus |
(22,480 | ) | (17,949 | ) | (20,762 | ) | (8,014 | ) | (19,119 | ) | ||||||||||
II. Financing Account |
||||||||||||||||||||
Expenditure |
131,860 | 128,194 | 120,354 | 188,218 | 191,452 | |||||||||||||||
Revenue |
154,339 | 146,143 | 141,116 | 196,232 | 210,572 | |||||||||||||||
Surplus |
22,480 | 17,949 | 20,762 | 8,014 | 19,119 |
(1) | Draft Federal Budget |
SOURCE: Federal Ministry of Finance.
The difference between the amount of expenditures and that of revenues (deficit) is financed by borrowings under authority of the federal budget law of the respective fiscal years and by application of the balance of available funds at the end of the preceding fiscal year.
161
PUBLIC DEBT (Internal and External Debt) as of December 31, 2024
Financial debt before swap | thereof Credit affiliates | Credit swaps | Debt swaps | Debt holding of own bonds | ||||||||||||||||||||||||||||||||||||||||||||||||||||||||||||||||||||
Date of Issue | Maturity | Interest Rate (%) |
Curr. | Principal Amount Outstanding |
Equivalent of Principal Amount Outstanding (EUR) |
Curr. | Principal Amount Outstanding |
Equivalent of Principal Amount Outstanding (EUR) |
Curr. | Principal Amount Outstanding |
Equivalent of Principal Amount Outstanding (EUR) |
Curr. | Principal Amount Outstanding |
Equivalent of Principal Amount Outstanding (EUR) |
Curr. | Principal Amount Outstanding |
Equivalent of Principal Amount Outstanding (EUR) |
|||||||||||||||||||||||||||||||||||||||||||||||||||||||
Government Bond 2017-2032 |
2017 | 2032 | 0.000 | EUR | 1,108,322,805.00 | 1,108,322,805.00 | ||||||||||||||||||||||||||||||||||||||||||||||||||||||||||||||||||
Government Bond 2023-2027 |
2023 | 2027 | 0.000 | EUR | 373,177,000.00 | 373,177,000.00 | EUR | 56,943,224.33 | 56,943,224.33 | |||||||||||||||||||||||||||||||||||||||||||||||||||||||||||||||
Government Bond 2024-2025 |
2024 | 2025 | 0.000 | EUR | 362,940,000.00 | 362,940,000.00 | EUR | 24,054,629.75 | 24,054,629.75 | |||||||||||||||||||||||||||||||||||||||||||||||||||||||||||||||
Government Bond 2020-2030 |
2020 | 2030 | 0.000 | EUR | 14,283,848,000.00 | 14,283,848,000.00 | EUR | 2,363,435,000.00 | 2,363,435,000.00 | |||||||||||||||||||||||||||||||||||||||||||||||||||||||||||||||
Government Bond 2020-2040 |
2020 | 2040 | 0.000 | EUR | 6,893,705,000.00 | 6,893,705,000.00 | EUR | 2,858,950,000.00 | 2,858,950,000.00 | EUR | 237,405,000.00 | 237,405,000.00 | ||||||||||||||||||||||||||||||||||||||||||||||||||||||||||||
Government Bond 2021-2025 |
2021 | 2025 | 0.000 | EUR | 9,055,000,000.00 | 9,055,000,000.00 | EUR | 633,810,000.00 | 633,810,000.00 | EUR | 194,470,000.00 | 194,470,000.00 | ||||||||||||||||||||||||||||||||||||||||||||||||||||||||||||
Government Bond 2021-2031 |
2021 | 2031 | 0.000 | EUR | 16,021,736,000.00 | 16,021,736,000.00 | EUR | 3,239,188,000.00 | 3,239,188,000.00 | EUR | 114,000,000.00 | 114,000,000.00 | ||||||||||||||||||||||||||||||||||||||||||||||||||||||||||||
Government Bond 2022-2028 |
2022 | 2028 | 0.000 | EUR | 11,546,213,000.00 | 11,546,213,000.00 | EUR | 1,777,240,000.00 | 1,777,240,000.00 | EUR | 249,400,000.00 | 249,400,000.00 | ||||||||||||||||||||||||||||||||||||||||||||||||||||||||||||
Government Bond 2020-2040 |
2020 | 2040 | 0.100 | EUR | 150,000,000.00 | 150,000,000.00 | EUR | 234,200,000.00 | 234,200,000.00 | |||||||||||||||||||||||||||||||||||||||||||||||||||||||||||||||
Government Bond 2021-2036 |
2021 | 2036 | 0.250 | EUR | 8,182,060,000.00 | 8,182,060,000.00 | EUR | 2,820,200,000.00 | 2,820,200,000.00 | |||||||||||||||||||||||||||||||||||||||||||||||||||||||||||||||
Government Bond 2017-2027 |
2017 | 2027 | 0.500 | EUR | 15,149,028,000.00 | 15,149,028,000.00 | EUR | 2,759,805,000.00 | 2,759,805,000.00 | EUR | 569,680,000.00 | 569,680,000.00 | ||||||||||||||||||||||||||||||||||||||||||||||||||||||||||||
Government Bond 2019-2029 |
2019 | 2029 | 0.500 | EUR | 15,091,577,000.00 | 15,091,577,000.00 | EUR | 3,043,600,000.00 | 3,043,600,000.00 | EUR | 101,245,000.00 | 101,245,000.00 | ||||||||||||||||||||||||||||||||||||||||||||||||||||||||||||
Government Bond 2021-2071 |
2021 | 2071 | 0.700 | EUR | 5,477,500,000.00 | 5,477,500,000.00 | EUR | 775,000,000.00 | 775,000,000.00 | EUR | 184,700,000.00 | 184,700,000.00 | ||||||||||||||||||||||||||||||||||||||||||||||||||||||||||||
Government Bond 2018-2028 |
2018 | 2028 | 0.750 | EUR | 13,749,317,000.00 | 13,749,317,000.00 | EUR | 1,933,330,000.00 | 1,933,330,000.00 | EUR | 162,500,000.00 | 162,500,000.00 | ||||||||||||||||||||||||||||||||||||||||||||||||||||||||||||
Government Bond 2020-2051 |
2020 | 2051 | 0.750 | EUR | 9,813,135,000.00 | 9,813,135,000.00 | EUR | 1,702,292,000.00 | 1,702,292,000.00 | EUR | 236,800,000.00 | 236,800,000.00 | ||||||||||||||||||||||||||||||||||||||||||||||||||||||||||||
Government Bond 2016-2026 |
2016 | 2026 | 0.750 | EUR | 16,155,895,000.00 | 16,155,895,000.00 | EUR | 1,619,539,000.00 | 1,619,539,000.00 | EUR | 130,000,000.00 | 130,000,000.00 | ||||||||||||||||||||||||||||||||||||||||||||||||||||||||||||
Government Bond 2020-2120 |
2020 | 2120 | 0.850 | EUR | 5,550,000,000.00 | 5,550,000,000.00 | EUR | 541,400,000.00 | 541,400,000.00 | EUR | 137,945,000.00 | 137,945,000.00 | ||||||||||||||||||||||||||||||||||||||||||||||||||||||||||||
Government Bond 2022-2032 |
2022 | 2032 | 0.900 | EUR | 13,124,429,000.00 | 13,124,429,000.00 | EUR | 2,268,280,000.00 | 2,268,280,000.00 | EUR | 184,000,000.00 | 184,000,000.00 | ||||||||||||||||||||||||||||||||||||||||||||||||||||||||||||
Government Bond 2015-2025 |
2015 | 2025 | 1.200 | EUR | 13,326,943,000.00 | 13,326,943,000.00 | EUR | 771,855,000.00 | 771,855,000.00 | EUR | 120,250,000.00 | 120,250,000.00 | ||||||||||||||||||||||||||||||||||||||||||||||||||||||||||||
Government Bond 2016-2086 |
2016 | 2086 | 1.500 | EUR | 3,390,897,000.00 | 3,390,897,000.00 | EUR | 1,532,947,000.00 | 1,532,947,000.00 | EUR | 125,000,000.00 | 125,000,000.00 | ||||||||||||||||||||||||||||||||||||||||||||||||||||||||||||
Government Bond 2016-2047 |
2016 | 2047 | 1.500 | EUR | 10,390,784,000.00 | 10,390,784,000.00 | EUR | 2,075,017,345.96 | 2,075,017,345.96 | EUR | 82,950,000.00 | 82,950,000.00 | ||||||||||||||||||||||||||||||||||||||||||||||||||||||||||||
Government Bond 2022-2049 |
2022 | 2049 | 1.850 | EUR | 6,650,000,000.00 | 6,650,000,000.00 | EUR | 480,450,000.00 | 480,450,000.00 | |||||||||||||||||||||||||||||||||||||||||||||||||||||||||||||||
Government Bond 2022-2026 |
2022 | 2026 | 2.000 | EUR | 4,885,124,000.00 | 4,885,124,000.00 | EUR | 699,150,000.00 | 699,150,000.00 | EUR | 300,000,000.00 | 300,000,000.00 | ||||||||||||||||||||||||||||||||||||||||||||||||||||||||||||
Government Bond 2017-2117 |
2017 | 2117 | 2.100 | EUR | 6,000,000,000.00 | 6,000,000,000.00 | EUR | 1,579,500,000.00 | 1,579,500,000.00 | EUR | 134,850,000.00 | 134,850,000.00 | ||||||||||||||||||||||||||||||||||||||||||||||||||||||||||||
Government Bond 2013-2034 |
2013 | 2034 | 2.400 | EUR | 9,779,919,000.00 | 9,779,919,000.00 | EUR | 1,447,986,143.60 | 1,447,986,143.60 | EUR | 931,090,000.00 | 931,090,000.00 | ||||||||||||||||||||||||||||||||||||||||||||||||||||||||||||
Government Bond 2024-2029 |
2024 | 2029 | 2.500 | EUR | 4,500,000,000.00 | 4,500,000,000.00 | EUR | 257,950,000.00 | 257,950,000.00 | EUR | 113,630,000.00 | 113,630,000.00 | ||||||||||||||||||||||||||||||||||||||||||||||||||||||||||||
Government Bond 2023-2033 |
2023 | 2033 | 2.900 | EUR | 17,624,783,000.00 | 17,624,783,000.00 | EUR | 2,860,430,000.00 | 2,860,430,000.00 | EUR | 217,050,000.00 | 217,050,000.00 | ||||||||||||||||||||||||||||||||||||||||||||||||||||||||||||
Government Bond 2024-2034 |
2024 | 2034 | 2.900 | EUR | 13,796,803,700.00 | 13,796,803,700.00 | EUR | 3,251,630,000.00 | 3,251,630,000.00 | EUR | 277,970,000.00 | 277,970,000.00 | ||||||||||||||||||||||||||||||||||||||||||||||||||||||||||||
Government Bond 2023-2029 |
2023 | 2029 | 2.900 | EUR | 5,302,824,000.00 | 5,302,824,000.00 | EUR | 1,058,750,000.00 | 1,058,750,000.00 | |||||||||||||||||||||||||||||||||||||||||||||||||||||||||||||||
Government Bond 2023-2053 |
2023 | 2053 | 3.150 | EUR | 6,208,835,000.00 | 6,208,835,000.00 | EUR | 2,065,800,000.00 | 2,065,800,000.00 | EUR | 65,000,000.00 | 65,000,000.00 | ||||||||||||||||||||||||||||||||||||||||||||||||||||||||||||
Government Bond 2012-2044 |
2012 | 2044 | 3.150 | EUR | 9,777,152,000.00 | 9,777,152,000.00 | EUR | 1,711,348,000.00 | 1,711,348,000.00 | EUR | 767,500,000.00 | 767,500,000.00 | ||||||||||||||||||||||||||||||||||||||||||||||||||||||||||||
Government Bond 2024-2039 |
2024 | 2039 | 3.200 | EUR | 4,150,000,000.00 | 4,150,000,000.00 | EUR | 361,170,000.00 | 361,170,000.00 | EUR | 568,772,000.00 | 568,772,000.00 | ||||||||||||||||||||||||||||||||||||||||||||||||||||||||||||
Government Bond 2023-2030 |
2023 | 2030 | 3.450 | EUR | 6,966,223,000.00 | 6,966,223,000.00 | EUR | 1,420,400,000.00 | 1,420,400,000.00 | EUR | 151,450,000.00 | 151,450,000.00 | ||||||||||||||||||||||||||||||||||||||||||||||||||||||||||||
Government Bond 2012-2029 |
2012 | 2029 | 3.560 | EUR | 109,000,000.00 | 109,000,000.00 | EUR | 205,650,000.00 | 205,650,000.00 | |||||||||||||||||||||||||||||||||||||||||||||||||||||||||||||||
Government Bond 2012-2062 |
2012 | 2062 | 3.800 | EUR | 4,473,666,000.00 | 4,473,666,000.00 | EUR | 510,120,000.00 | 510,120,000.00 | |||||||||||||||||||||||||||||||||||||||||||||||||||||||||||||||
Government Bond 2007-2037 |
2007 | 2037 | 4.150 | EUR | 15,416,012,000.00 | 15,416,012,000.00 | EUR | 1,386,030,162.42 | 1,386,030,162.42 | EUR | 255,850,000.00 | 255,850,000.00 | ||||||||||||||||||||||||||||||||||||||||||||||||||||||||||||
Government Bond 2009-2026 |
2009 | 2026 | 4.850 | EUR | 10,351,371,000.00 | 10,351,371,000.00 | EUR | 410,904,000.00 | 410,904,000.00 | EUR | 308,355,000.00 | 308,355,000.00 | ||||||||||||||||||||||||||||||||||||||||||||||||||||||||||||
Government Bond 2004-2034 |
2004 | 2034 | 5.130 | EUR | 16,596,960.00 | 16,596,960.00 | EUR | 16,596,959.44 | 16,596,959.44 | EUR | 141,196,000.00 | 141,196,000.00 | ||||||||||||||||||||||||||||||||||||||||||||||||||||||||||||
Government Bond 1997-2027 |
1997 | 2027 | 6.250 | EUR | 9,449,531,002.31 | 9,449,531,002.31 | EUR | 517,660,000.00 | 517,660,000.00 | |||||||||||||||||||||||||||||||||||||||||||||||||||||||||||||||
Government Bond 2019-2119 |
2019 | 2119 | 0.000 | EUR | 50,000,000.00 | 50,000,000.00 | EUR | 147,776,000.00 | 147,776,000.00 | |||||||||||||||||||||||||||||||||||||||||||||||||||||||||||||||
Government Bond 2020-2077 |
2020 | 2077 | 0.000 | EUR | 150,000,000.00 | 150,000,000.00 | ||||||||||||||||||||||||||||||||||||||||||||||||||||||||||||||||||
Government Bond 2020-2080 |
2020 | 2080 | 0.000 | EUR | 250,000,000.00 | 250,000,000.00 | ||||||||||||||||||||||||||||||||||||||||||||||||||||||||||||||||||
Government Bond 2020-2120 |
2020 | 2120 | 0.000 | EUR | 100,000,000.00 | 100,000,000.00 | ||||||||||||||||||||||||||||||||||||||||||||||||||||||||||||||||||
Government Bond 2004-2034 |
2004 | 2034 | 5.380 | CAD | 300,000,000.00 | 200,695,745.25 | CAD | 300,000,000.00 | 200,695,745.25 | EUR | 205,037,156.90 | 205,037,156.90 | ||||||||||||||||||||||||||||||||||||||||||||||||||||||||||||
Government Bond 2023-2027 |
2023 | 2027 | 0.000 | CHF | 54,255,055.00 | 57,644,554.82 | CHF | 54,255,055.00 | 57,644,554.82 | |||||||||||||||||||||||||||||||||||||||||||||||||||||||||||||||
Government Bond 2024-2025 |
2024 | 2025 | 0.000 | CHF | 22,968,062.00 | 24,402,955.80 | CHF | 22,968,062.00 | 24,402,955.80 | |||||||||||||||||||||||||||||||||||||||||||||||||||||||||||||||
Government Bond 2012-2029 |
2012 | 2029 | 2.450 | EUR | 21,000,000.00 | 21,000,000.00 | EUR | 21,000,000.00 | 21,000,000.00 | |||||||||||||||||||||||||||||||||||||||||||||||||||||||||||||||
Government Bond 1999-2029 |
1999 | 2029 | 7.250 | GBP | 80,000,000.00 | 96,480,860.61 | GBP | 80,000,000.00 | 96,480,860.61 | |||||||||||||||||||||||||||||||||||||||||||||||||||||||||||||||
Government Bond 2020-2025 |
2020 | 2025 | 0.670 | USD | 600,000,000.00 | 577,533,930.12 | USD | 600,000,000.00 | 577,533,930.12 | EUR | 550,458,715.60 | 550,458,715.60 | ||||||||||||||||||||||||||||||||||||||||||||||||||||||||||||
Federal Obligation 2005-2035 |
2005 | 2035 | var. | EUR | 75,000,000.00 | 75,000,000.00 | ||||||||||||||||||||||||||||||||||||||||||||||||||||||||||||||||||
Federal Obligation 2004-2034 |
2004 | 2034 | var. | EUR | 30,000,000.00 | 30,000,000.00 | ||||||||||||||||||||||||||||||||||||||||||||||||||||||||||||||||||
Federal Obligation 2005-2025 |
2005 | 2025 | var. | EUR | 267,984,000.00 | 267,984,000.00 | ||||||||||||||||||||||||||||||||||||||||||||||||||||||||||||||||||
Federal Obligation 2005-2034 |
2005 | 2034 | var. | EUR | 10,000,000.00 | 10,000,000.00 | ||||||||||||||||||||||||||||||||||||||||||||||||||||||||||||||||||
Federal Obligation 2001-2031 |
2001 | 2031 | 4 | JPY | 3,000,000,000.00 | 18,398,135.66 | JPY | 3,000,000,000.00 | 18,398,135.66 | EUR | 27,473,000.00 | 27,473,000.00 | ||||||||||||||||||||||||||||||||||||||||||||||||||||||||||||
Federal Obligation 2002-2027 |
2002 | 2027 | 4 | JPY | 1,000,000,000.00 | 6,132,711.89 | JPY | 1,000,000,000.00 | 6,132,711.89 | EUR | 8,805,000.00 | 8,805,000.00 | ||||||||||||||||||||||||||||||||||||||||||||||||||||||||||||
Federal Obligation 2002-2032 |
2002 | 2032 | 4 | JPY | 1,000,000,000.00 | 6,132,711.89 | JPY | 1,000,000,000.00 | 6,132,711.89 | EUR | 8,520,000.00 | 8,520,000.00 | ||||||||||||||||||||||||||||||||||||||||||||||||||||||||||||
Federal Obligation 2003-2033 |
2003 | 2033 | 5.5 | JPY | 1,000,000,000.00 | 6,132,711.89 | JPY | 1,000,000,000.00 | 6,132,711.89 | EUR | 7,662,835.25 | 7,662,835.25 | ||||||||||||||||||||||||||||||||||||||||||||||||||||||||||||
Treasury Bills |
2023 | 2024 | EUR | 20,227,521,700.00 | 20,227,521,700.00 | EUR | 4,261,238,489.71 | 4,261,238,489.71 | EUR | 3,785,521,201.94 | 3,785,521,201.94 | |||||||||||||||||||||||||||||||||||||||||||||||||||||||||||||
USD | 2,381,000,000.00 | 2,291,847,146.00 | USD | 2,381,000,000.00 | 2,291,847,146.00 | |||||||||||||||||||||||||||||||||||||||||||||||||||||||||||||||||||
GBP | 1,710,000,000.00 | 2,062,278,395.52 | GBP | 1,710,000,000.00 | 2,062,278,395.52 | |||||||||||||||||||||||||||||||||||||||||||||||||||||||||||||||||||
Loans from Insurances |
2004 | 2072 | EUR | 3,451,059,517.00 | 3,451,059,517.00 | |||||||||||||||||||||||||||||||||||||||||||||||||||||||||||||||||||
Loans from Banks |
1995 | 2046 | EUR | 5,649,360,000.00 | 5,649,360,000.00 | EUR | 149,697,410.29 | 149,697,410.29 | EUR | 82,770,000.00 | 82,770,000.00 | |||||||||||||||||||||||||||||||||||||||||||||||||||||||||||||
Other Loans |
2009 | 2036 | EUR | 3,441,252,744.58 | 3,441,252,744.58 |
162
Financial debt before swap | thereof Credit affiliates | Credit swaps | Debt swaps | Debt holding of own bonds | ||||||||||||||||||||||||||||||||||||||||||||||||||||||||||||||||||||
Date of Issue | Maturity | Interest Rate (%) |
Curr. | Principal Amount Outstanding |
Equivalent of Principal Amount Outstanding (EUR) |
Curr. | Principal Amount Outstanding |
Equivalent of Principal Amount Outstanding (EUR) |
Curr. | Principal Amount Outstanding |
Equivalent of Principal Amount Outstanding (EUR) |
Curr. | Principal Amount Outstanding |
Equivalent of Principal Amount Outstanding (EUR) |
Curr. | Principal Amount Outstanding |
Equivalent of Principal Amount Outstanding (EUR) |
|||||||||||||||||||||||||||||||||||||||||||||||||||||||
Government Bonds |
EUR | 325,225,347,467.31 | 325,225,347,467.31 | EUR | 51,216,966,651.98 | 51,216,966,651.98 | EUR | 16,596,959.44 | 16,596,959.44 | EUR | 836,493,726.58 | 836,493,726.58 | EUR | 9,189,884,000.00 | 9,189,884,000.00 | |||||||||||||||||||||||||||||||||||||||||||||||||||||||||
JPY | 0.00 | 0.00 | ||||||||||||||||||||||||||||||||||||||||||||||||||||||||||||||||||||||
CHF | 77,223,117.00 | 82,047,510.62 | CHF | 77,223,117.00 | 82,047,510.62 | |||||||||||||||||||||||||||||||||||||||||||||||||||||||||||||||||||
USD | 600,000,000.00 | 577,533,930.12 | USD | 600,000,000.00 | 577,533,930.12 | |||||||||||||||||||||||||||||||||||||||||||||||||||||||||||||||||||
GBP | 80,000,000.00 | 96,480,860.61 | GBP | 80,000,000.00 | 96,480,860.61 | |||||||||||||||||||||||||||||||||||||||||||||||||||||||||||||||||||
CAD | 300,000,000.00 | 200,695,745.25 | CAD | 300,000,000.00 | 200,695,745.25 | |||||||||||||||||||||||||||||||||||||||||||||||||||||||||||||||||||
Federal Obligation |
EUR | 382,984,000.00 | 382,984,000.00 | EUR | 52,460,835.25 | 52,460,835.25 | ||||||||||||||||||||||||||||||||||||||||||||||||||||||||||||||||||
JPY | 6,000,000,000.00 | 36,796,271.33 | JPY | 6,000,000,000.00 | 36,796,271.33 | |||||||||||||||||||||||||||||||||||||||||||||||||||||||||||||||||||
Treasury Bills |
EUR | 20,227,521,700.00 | 20,227,521,700.00 | EUR | 4,261,238,489.71 | 4,261,238,489.71 | EUR | 3,785,521,201.94 | 3,785,521,201.94 | |||||||||||||||||||||||||||||||||||||||||||||||||||||||||||||||
USD | 2,381,000,000.00 | 2,291,847,146.00 | USD | 2,381,000,000.00 | 2,291,847,146.00 | |||||||||||||||||||||||||||||||||||||||||||||||||||||||||||||||||||
GBP | 1,710,000,000.00 | 2,062,278,395.52 | GBP | 1,710,000,000.00 | 2,062,278,395.52 | |||||||||||||||||||||||||||||||||||||||||||||||||||||||||||||||||||
Loan from Insurance Companies |
EUR | 3,451,059,517.00 | 3,451,059,517.00 | |||||||||||||||||||||||||||||||||||||||||||||||||||||||||||||||||||||
Loan from Banks |
EUR | 5,649,360,000.00 | 5,649,360,000.00 | EUR | 149,697,410.29 | 149,697,410.29 | EUR | 82,770,000.00 | 82,770,000.00 | |||||||||||||||||||||||||||||||||||||||||||||||||||||||||||||||
Other Loans |
EUR | 3,441,252,744.58 | 3,441,252,744.58 | |||||||||||||||||||||||||||||||||||||||||||||||||||||||||||||||||||||
Total |
EUR | 358,377,525,428.89 | 358,377,525,428.89 | EUR | 51,216,966,651.98 | 51,216,966,651.98 | EUR | 166,294,369.72 | 166,294,369.73 | EUR | 5,232,963,051.54 | 5,232,963,051.54 | EUR | 12,975,405,201.94 | 12,975,405,201.94 | |||||||||||||||||||||||||||||||||||||||||||||||||||||||||
JPY | 6,000,000,000.00 | 36,796,271.33 | JPY | 6,000,000,000.00 | 36,796,271.33 | |||||||||||||||||||||||||||||||||||||||||||||||||||||||||||||||||||
CHF | 77,223,117.00 | 82,047,510.62 | CHF | 77,223,117.00 | 82,047,510.62 | |||||||||||||||||||||||||||||||||||||||||||||||||||||||||||||||||||
USD | 2,981,000,000.00 | 2,869,381,076.12 | USD | 2,981,000,000.00 | 2,869,381,076.12 | |||||||||||||||||||||||||||||||||||||||||||||||||||||||||||||||||||
GBP | 1,790,000,000.00 | 2,158,759,256.13 | GBP | 80,000,000.00 | 96,480,860.61 | GBP | 1,710,000,000.00 | 2,062,278,395.52 | ||||||||||||||||||||||||||||||||||||||||||||||||||||||||||||||||
CAD | 300,000,000.00 | 200,695,745.25 | CAD | 300,000,000.00 | 200,695,745.25 | |||||||||||||||||||||||||||||||||||||||||||||||||||||||||||||||||||
Financial debt before swap |
Credit affiliates | Credit swaps | Debt swaps | Debt holding of own bonds |
Financial debt after swap |
|||||||||||||||||||||||||||||||||||||||||||||||||||||||||||||||||||
Grand Total Internal Debt |
|
EUR | 358,377,525,428.89 | 51,216,966,651.98 | 166,294,369.72 | 5,232,963,051.54 | 12,975,405,201.94 | 299,251,822,256.79 | ||||||||||||||||||||||||||||||||||||||||||||||||||||||||||||||||
Grand Total External Debt |
|
EUR | 5,347,679,859.45 | 96,480,860.61 | 5,251,198,998.84 | 0.00 | 0.00 | 0.00 | ||||||||||||||||||||||||||||||||||||||||||||||||||||||||||||||||
Grand Total Debt |
|
EUR | 363,725,205,288.34 | 51,313,447,512.59 | 5,417,493,368.56 | 5,232,963,051.54 | 12,975,405,201.94 | 299,251,822,256.79 | ||||||||||||||||||||||||||||||||||||||||||||||||||||||||||||||||
Financial debt before swap |
Credit affiliates | Credit swaps | Debt swaps | Debt holding of own bonds |
Financial debt after swap |
|||||||||||||||||||||||||||||||||||||||||||||||||||||||||||||||||||
Internal Funded Debt | 338,150,003,728.89 | 51,216,966,651.98 | 166,294,369.72 | 971,724,561.83 | 9,189,884,000.00 | 278,548,583,269.02 | ||||||||||||||||||||||||||||||||||||||||||||||||||||||||||||||||||
External Funded Debt | 993,554,317.93 | 96,480,860.61 | 897,073,457.32 | 0.00 | 0.00 | 0.00 | ||||||||||||||||||||||||||||||||||||||||||||||||||||||||||||||||||
Internal Floating Indebtedness | 20,227,521,700.00 | 0.00 | 0.00 | 4,261,238,489.71 | 3,785,521,201.94 | 20,703,238,987.77 | ||||||||||||||||||||||||||||||||||||||||||||||||||||||||||||||||||
External Floating Indebtedness | 4,354,125,541.52 | 0.00 | 4,354,125,541.52 | 0.00 | 0.00 | 0.00 | ||||||||||||||||||||||||||||||||||||||||||||||||||||||||||||||||||
|
|
|
|
|
|
|
|
|
|
|
|
|||||||||||||||||||||||||||||||||||||||||||||||||||||||||||||
Grand Total | 363,725,205,288.34 | 51,313,447,512.59 | 5,417,493,368.56 | 5,232,963,051.54 | 12,975,405,201.94 | 299,251,822,256.79 | ||||||||||||||||||||||||||||||||||||||||||||||||||||||||||||||||||
|
|
|
|
|
|
|
|
|
|
|
|
163
GUARANTEED DEBT
EXTERNAL GUARANTEED DEBT AS OF DECEMBER 31, 2024
Borrower |
Amount (Millions of euros) |
|||
Export Guarantees(1) |
||||
Export Guarantees Act(2) |
2,975.01 | |||
Export Financing Guarantees Act |
23,293.99 | |||
Transport and Infrastructure |
||||
Austrian Railways (ÖBB) |
107.39 | |||
Other Liabilities |
||||
Loans to Federal Museums |
764.07 | |||
|
|
|||
Total |
27,140.46 | |||
|
|
(1) | Guarantees issued by the Republic of Austria under the Export Guarantees Act and the Export Financing Guarantees Act cover the assets side and the liabilities side of Oesterreichische Kontrollbank AGs (Austrias export credit agency) balance sheet. The probability of payments for guarantees referring to both sides of the balance sheet is very low. Therefore, following an economic approach, the amounts utilized under both sides of the balance sheet are counted only once. Following this economic approach the guaranteed debt for export guarantees amounted to EUR 6,488.70 million (external guaranteed debt) and EUR 26,090.99 million (domestic guaranteed debt) as of December 31, 2024. |
(2) | Includes recognized but unpaid claims against the Republic under Export Guarantees. |
DOMESTIC GUARANTEED DEBT AS OF DECEMBER 31, 2024
Borrower |
Amount (Millions of euros) |
|||
Export Guarantees(1) |
||||
Export Guarantees Act(2) |
26,090.99 | |||
Export Financing Guarantees Act |
1,580.00 | |||
Transport and Infrastructure |
||||
ASFINAG |
7,600.00 | |||
Austrian Railways (ÖBB) |
7,212.83 | |||
Railway Infrastructure Services Company (SCHIG) |
0.94 | |||
Austrian Financial Market |
||||
Guarantee Act for Carinthia |
1,520.85 | |||
Balance of Payments Stabilisation Act (ZaBiStaG) |
||||
European Financial Stability Facility (EFSF) |
8,897.58 | |||
Macro Financial Assistance (Ukraine) |
101.89 | |||
Coinage Act 1988 |
5,673.92 | |||
Promotion of Economic Development |
||||
Austria Wirtschaftsservice GesmbH (AWS) |
1,874.79 | |||
Austrian Bank for Tourism Development (ÖHT) |
306.43 | |||
Austrian Research Promotion Agency (FFG) |
85.00 | |||
COVID-19 Liabilities |
||||
Austria Wirtschaftsservice GesmbH (AWS) |
1,761.69 | |||
Austrian Bank for Tourism Development (ÖHT) |
289.57 | |||
Mitigation of Unemployment Risk (SURE) |
717.22 | |||
Pan-European Guarantee Fund |
632.35 | |||
Other Liabilities |
||||
Loans to Federal Museums |
873.19 | |||
Nuclear Liability Act 1999 |
121.80 | |||
European Investmentbank (EIB) |
90.76 | |||
|
|
|||
Total(3) |
65,431.53 | |||
|
|
(1) | Guarantees issued by the Republic of Austria under the Export Guarantees Act and the Export Financing Guarantees Act cover the assets side and the liabilities side of Oesterreichische Kontrollbank AGs (Austrias export credit agency) balance sheet. The probability of payments for guarantees referring to both sides of the balance sheet is very low. Therefore, following an economic approach, the amounts utilized under both sides of the balance sheet are counted only once. Following this economic approach the guaranteed debt for export guarantees amounted to EUR 6,488.70 million (external guaranteed debt) and EUR 26,090.99 million (domestic guaranteed debt) as of December 31, 2024. |
(2) | Includes recognized but unpaid claims against the Republic under Export Guarantees. |
(3) | In addition, the Republic is liable by law for all liabilities of the Austrian Postal Savings Bank assumed until December 31, 2000, which amounted to EUR 0.42 billion as of December 31, 2024. |
164
Except as stated below, the information set forth herein with respect to Austria has been supplied by Mag. Christoph Kreutler, Director, Head of the Division for Export Financing, International Export Promotion Policy and State Guarantees, Ministry of Finance of the Republic of Austria, in his official capacity and is included herein on his authority.
The information contained under the headings Balance of Payments, Foreign Exchange, Banking System and Monetary Policy Oesterreichische Nationalbank and Banking System and Monetary PolicyMonetary Policy and the information in the tables set forth under Balance of Payments, Foreign Exchange, Banking System and Monetary Policy and The EconomyTourism has been extracted from publications of the Oesterreichische Nationalbank and the Austrian Central Statistical Office, all of which are official documents published by Austrian authorities or the Oesterreichische Nationalbank.
The information in the tables set forth under The Economy and Public Debt has been extracted from publications of STATISTICS AUSTRIA (STATISTIK AUSTRIA), from publications of the Austrian Institute for Economic Research (Österreichisches Institut für Wirtschaftsforschung or WIFO), and from publications of the Oesterreichische Nationalbank (OeNB). STATISTIK AUSTRIA is an agency of Austria. OeNB is the Austrian central bank, which is owned by the Republic of Austria. WIFO is an independent, non-partisan and not-for-profit organization supported by numerous professional associations and institutions for economic policy.
Certain information contained under the heading The EconomyLabor and Social Legislation has been extracted from publications of Eurostat, the statistical office of the European Union.
The information in the tables under Tables and Supplementary Information has been extracted from the Federal Budget Laws of the Republic of Austria, which are official documents published by the Republic of Austria.
The name and address of the authorized agent of the Bank and Austria in the United States is DDr. Petra Schneebauer, Ambassador extraordinary and plenipotentiary of the Republic of Austria to the United States, Austrian Embassy, 3524 International Court, N.W., Washington, D.C. 20008.
165