

August 2025 Industry Leading Provider of Outsourced Semiconductor Assembly, Test & Bumping Services 2Q25 Results Conference Exhibit 99.2
Safe Harbor Notice This presentation contains certain forward-looking statements. These forward-looking statements may be identified by words such as ‘believes,’ ‘expects,’ ‘anticipates,’ ‘projects,’ ‘intends,’ ‘should,’ ‘seeks,’ ‘estimates,’ ‘future’ or similar expressions or by discussion of, among other things, strategies, goals, plans or intentions. These statements may include financial projections and estimates and their underlying assumptions, statements regarding current macroeconomic conditions, including the impacts of high inflation, foreign exchange rates and risk of recession, on demand for our products, consumer confidence and financial markets generally; changes in trade regulations, policies, and agreements and the imposition of tariffs that affect our products or operations, including potential new tariffs that may be imposed and our ability to mitigate with respect to future operations, products and services, and statements regarding future performance. Actual results may differ materially in the future from those reflected in forward-looking statements contained in this document, due to various factors. Further information regarding these risks, uncertainties and other factors are included in the Company’s most recent Annual Report on Form 20-F filed with the U.S. Securities and Exchange Commission (the “SEC”) and in the Company’s other filings with the SEC.
Agenda Welcome 2Q25 Operating Results S.J. Cheng 2Q25 Financial Results Silvia Su Business Outlook S.J. Cheng Q&A
4 2Q25 Operating Results
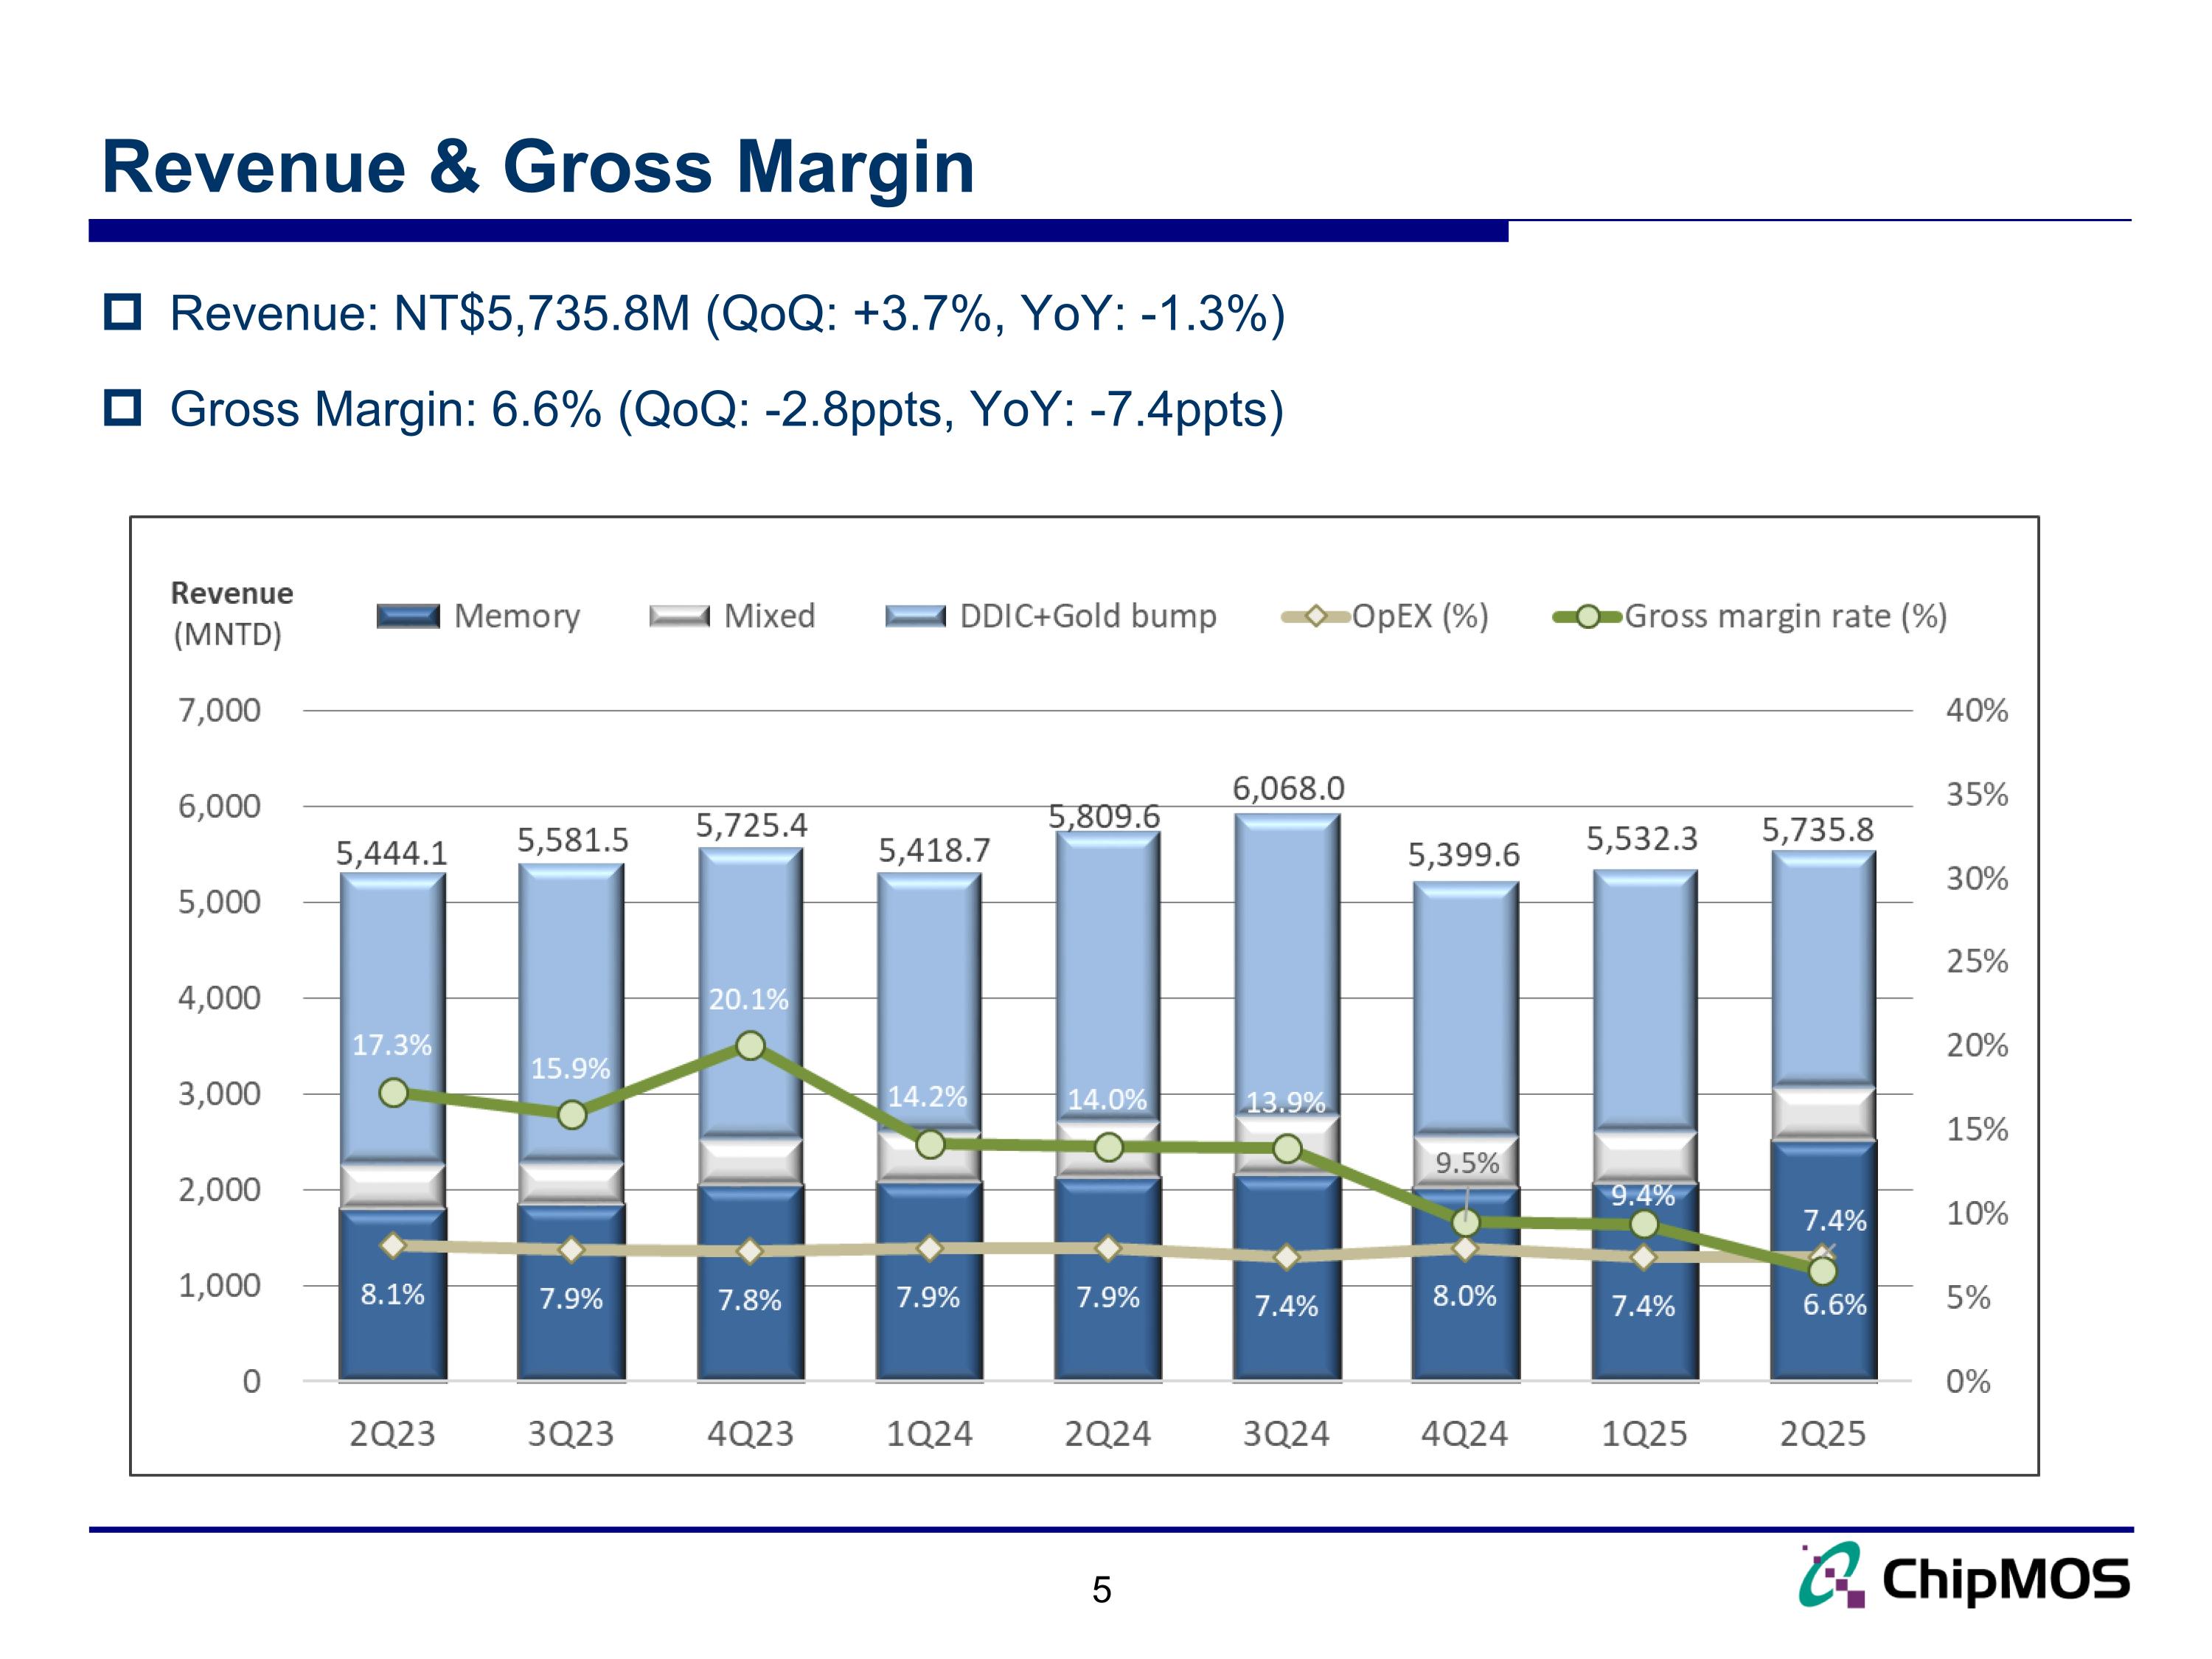
Revenue: NT$5,735.8M (QoQ: +3.7%, YoY: -1.3%) Gross Margin: 6.6% (QoQ: -2.8ppts, YoY: -7.4ppts) Revenue & Gross Margin 5
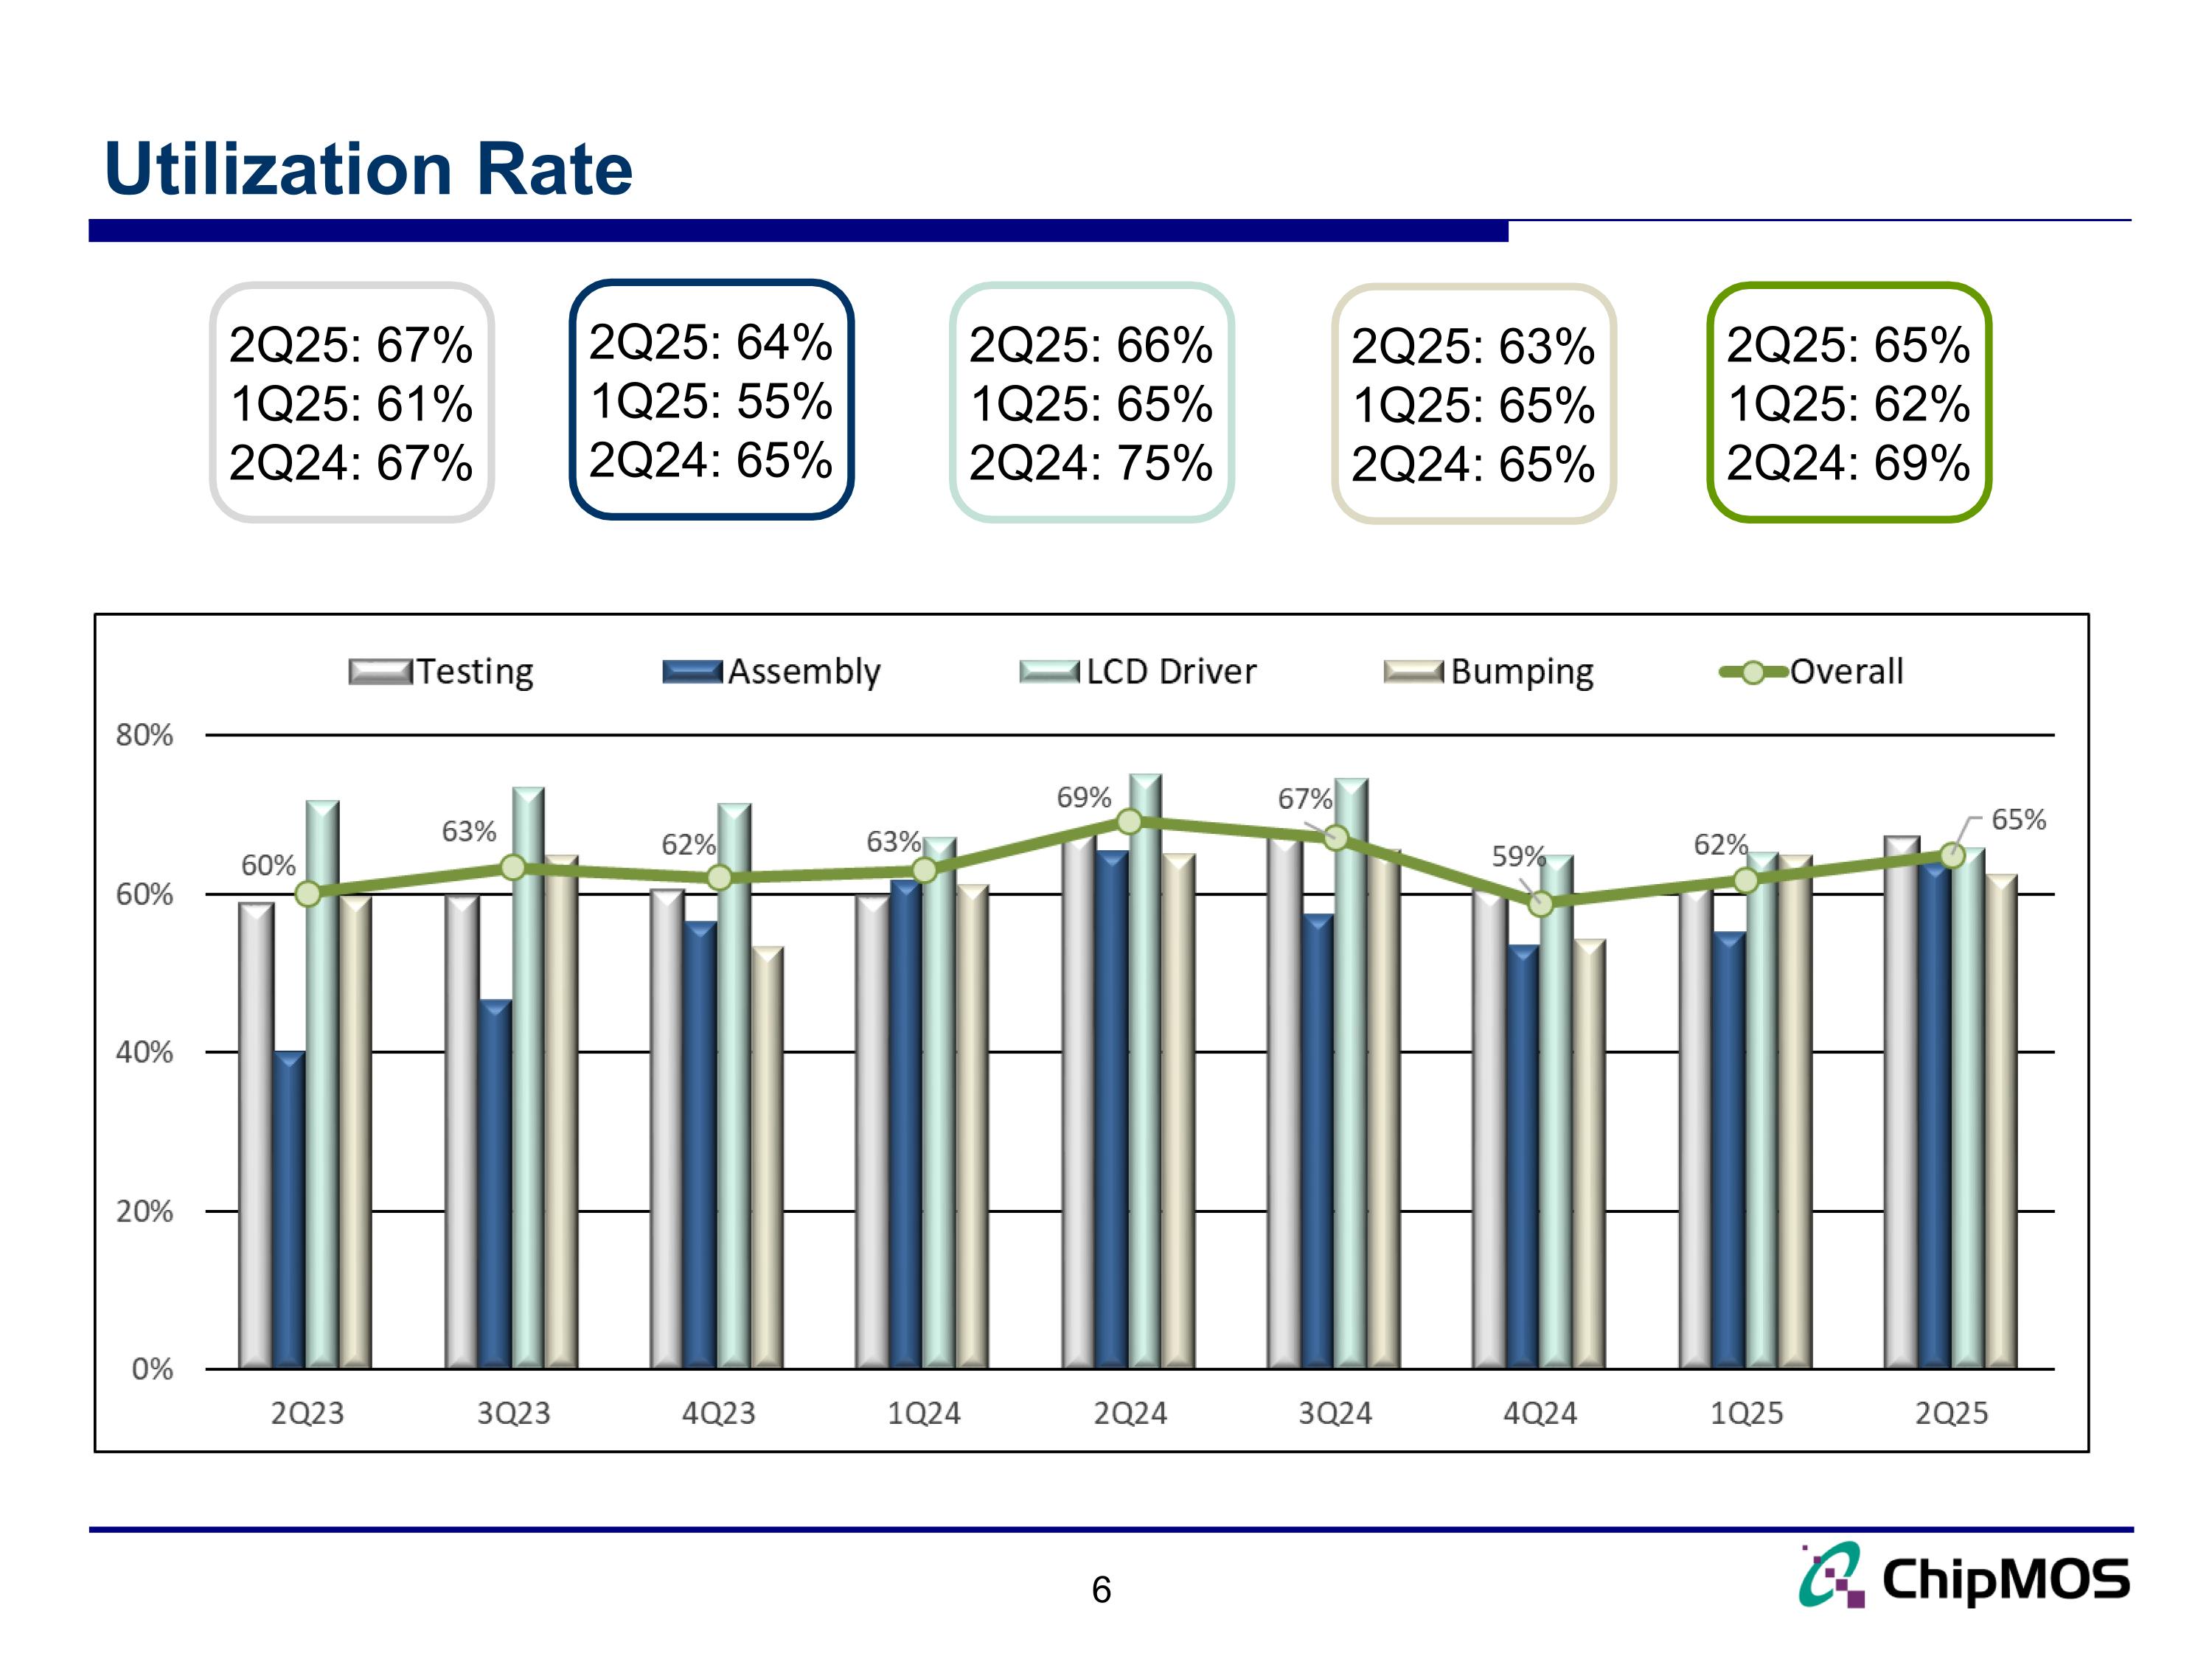
Utilization Rate 6 2Q25: 64% 1Q25: 55% 2Q24: 65% 2Q25: 63% 1Q25: 65% 2Q24: 65% 2Q25: 66% 1Q25: 65% 2Q24: 75% 2Q25: 65% 1Q25: 62% 2Q24: 69% 2Q25: 67% 1Q25: 61% 2Q24: 67%
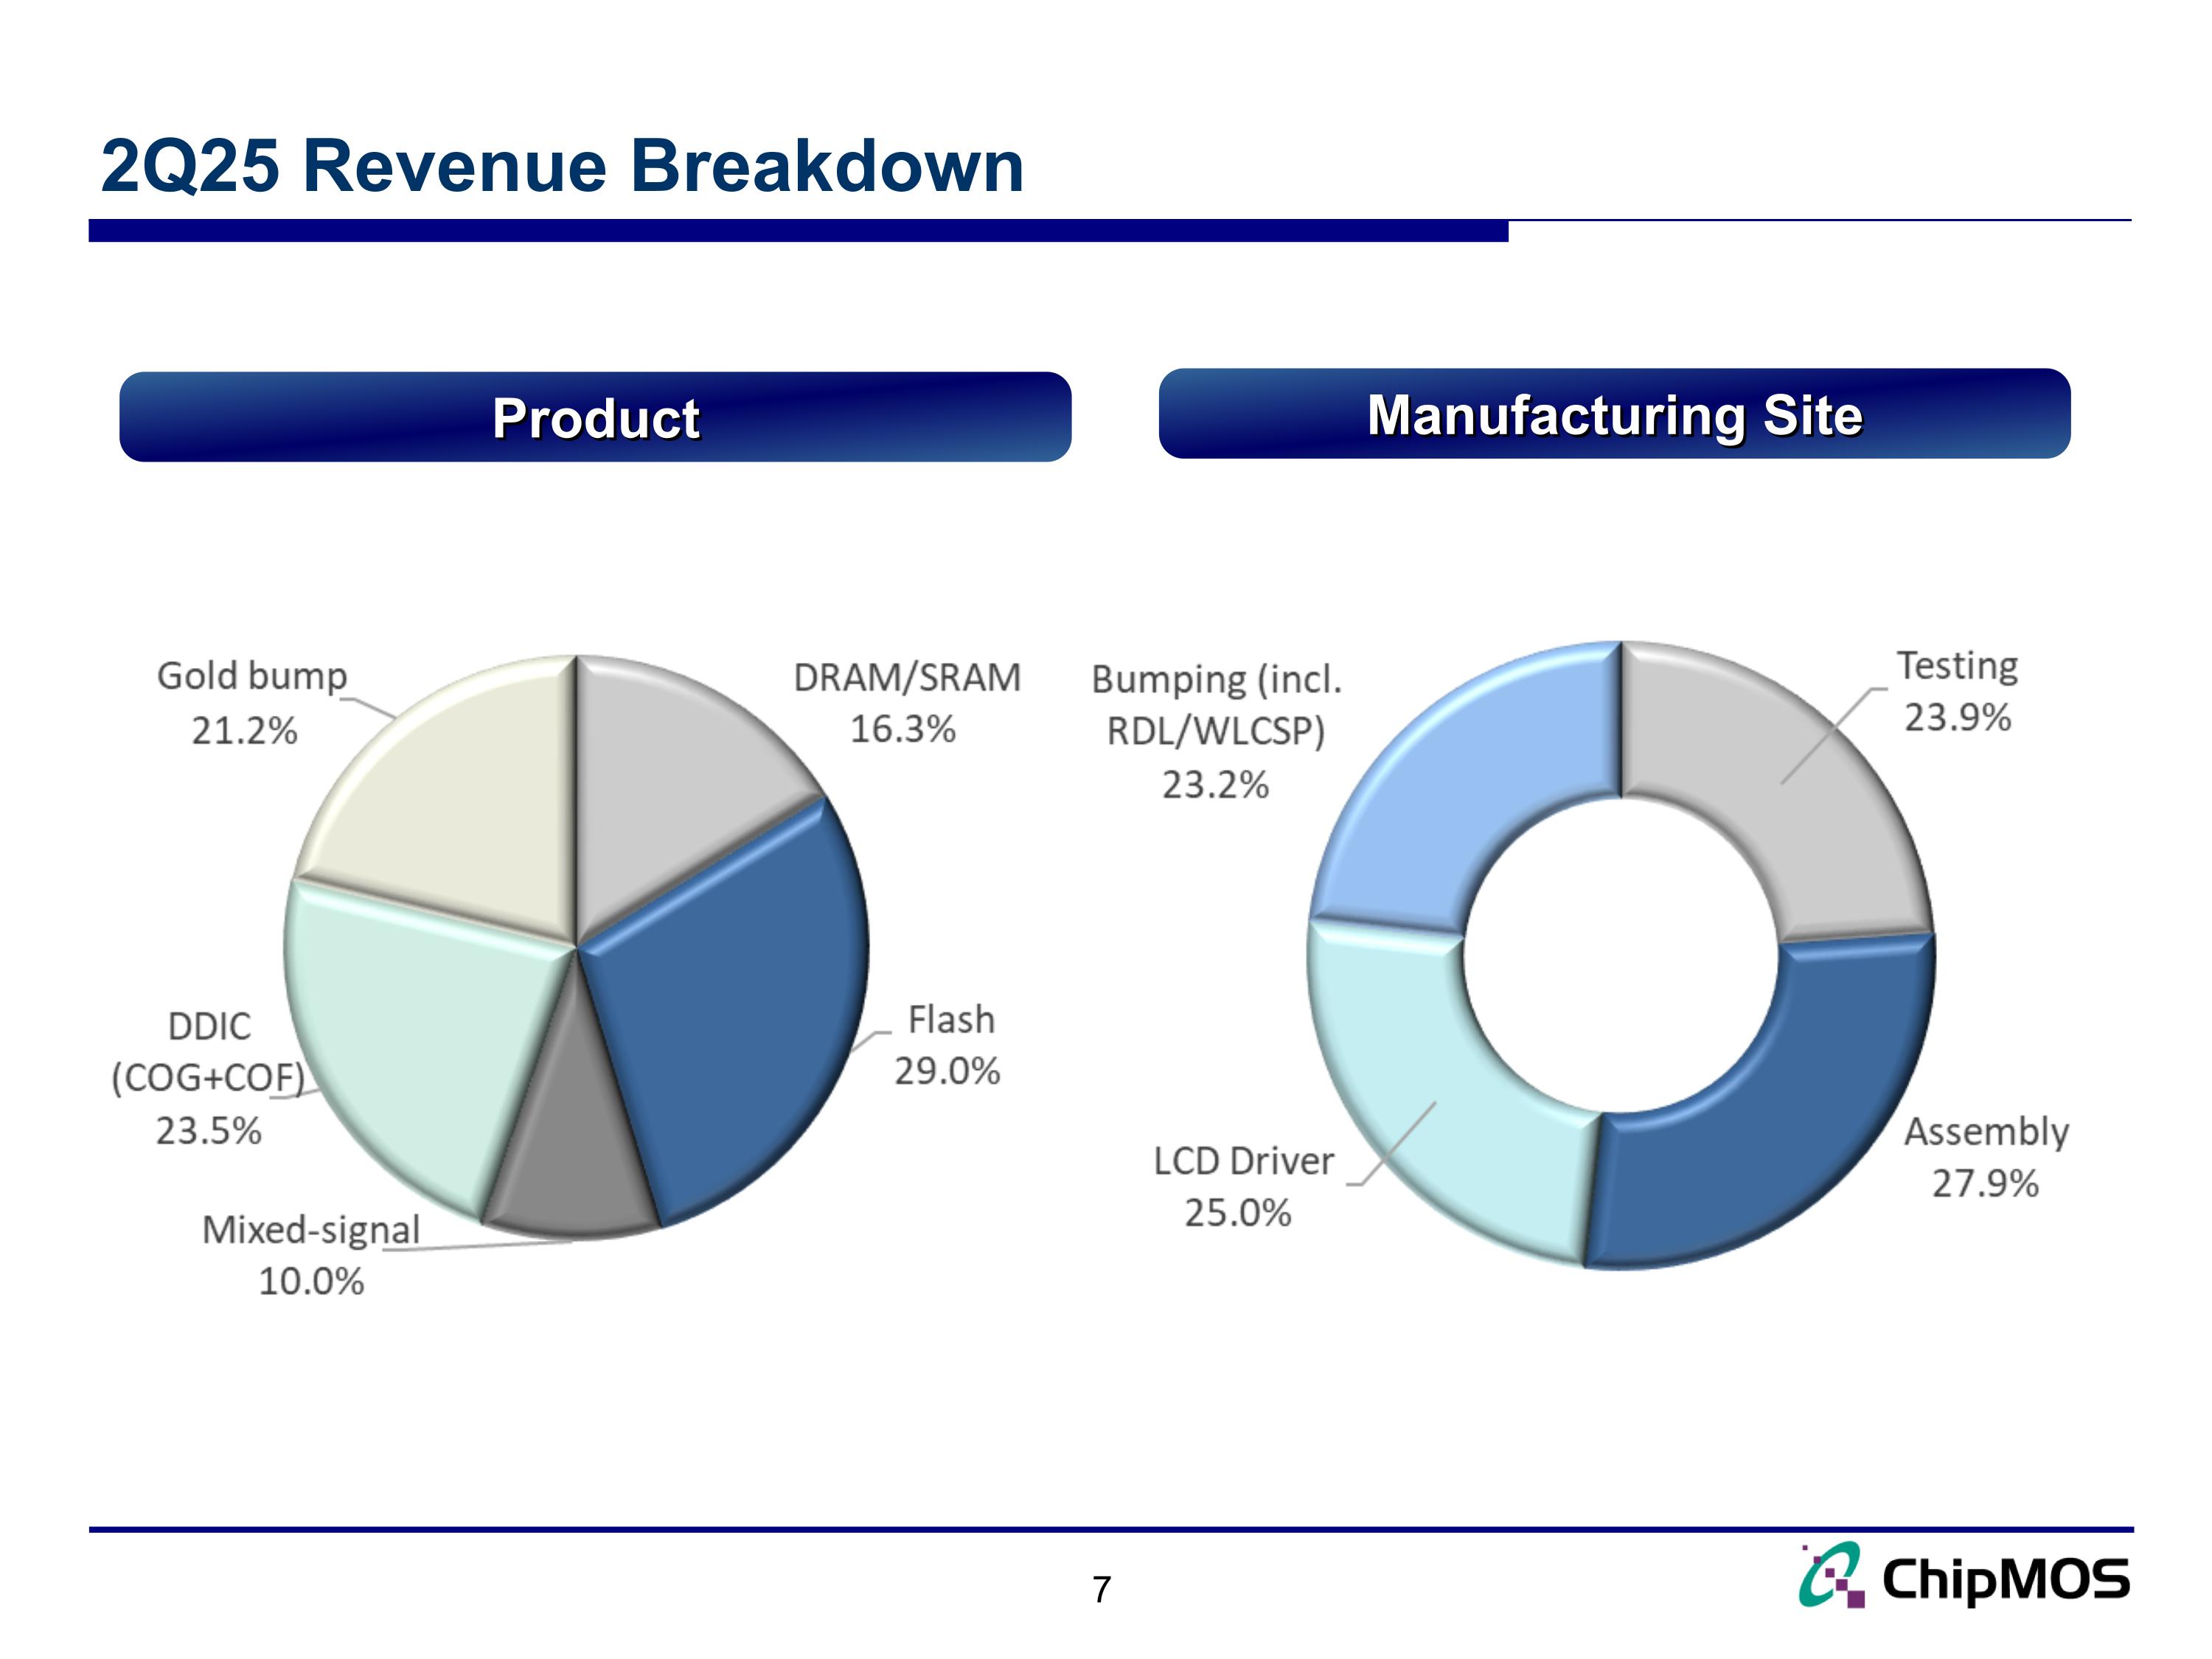
2Q25 Revenue Breakdown Product Manufacturing Site
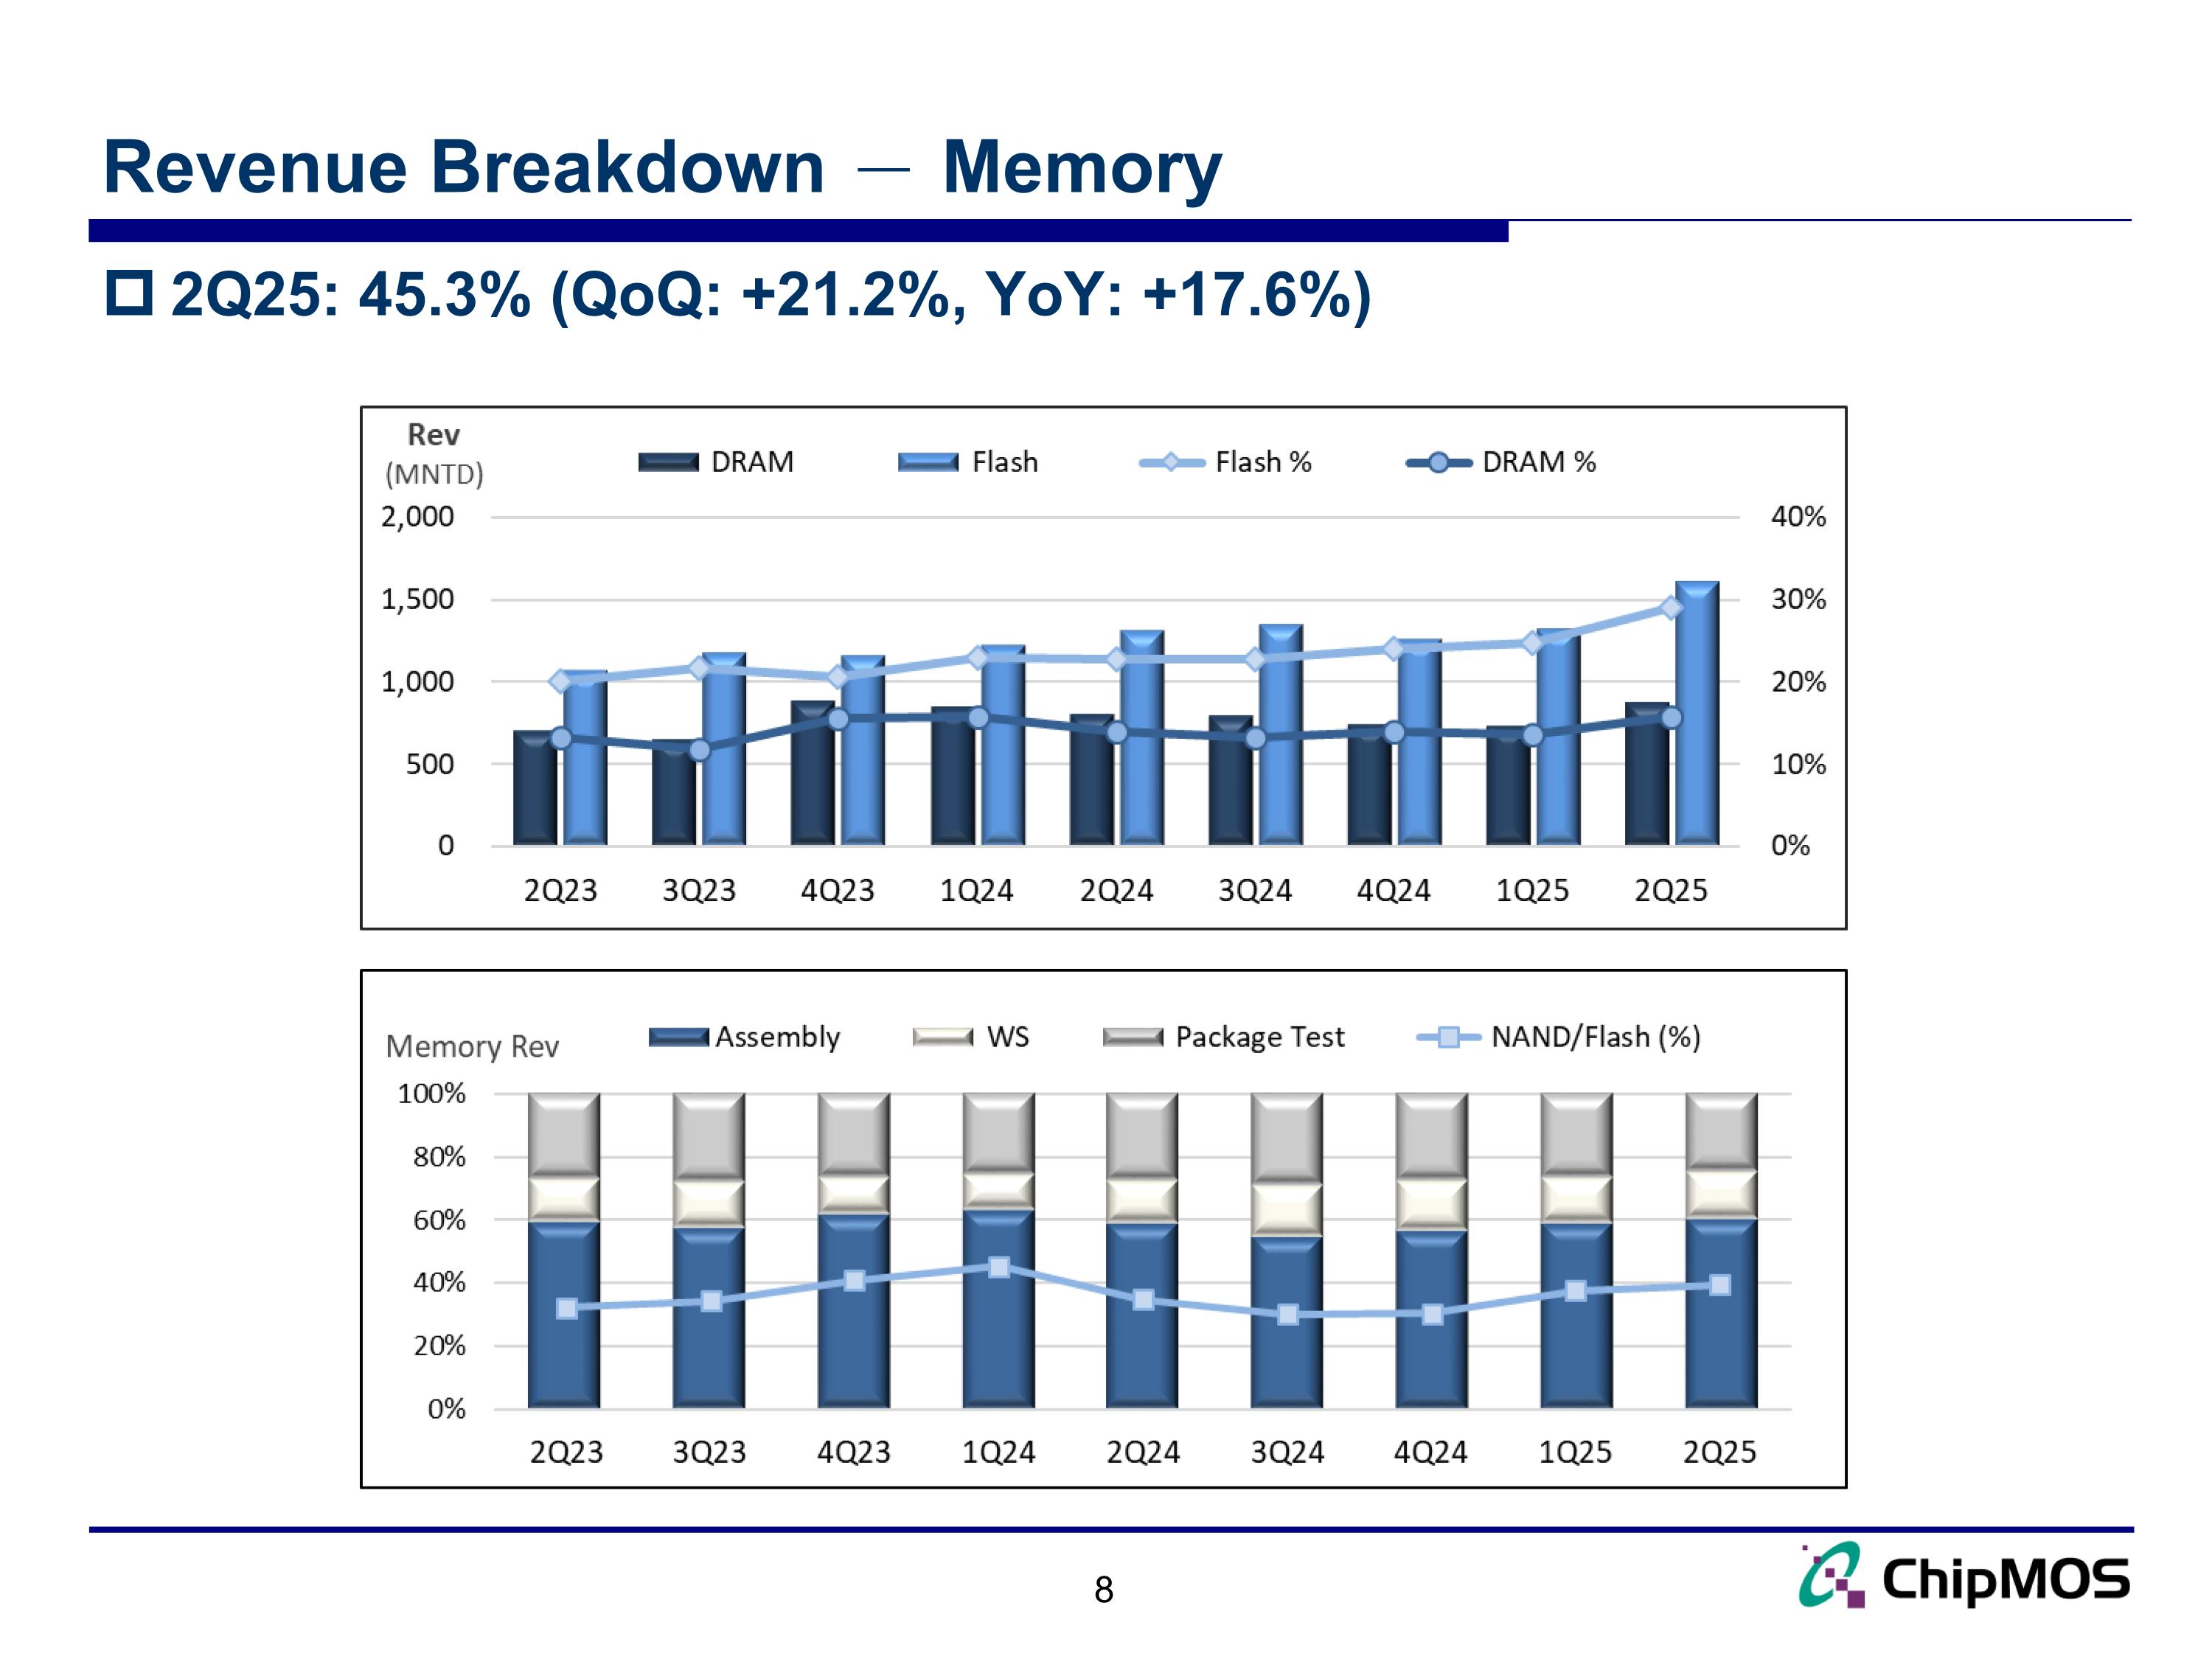
Revenue Breakdown - Memory 8 2Q25: 45.3% (QoQ: +21.2%, YoY: +17.6%)
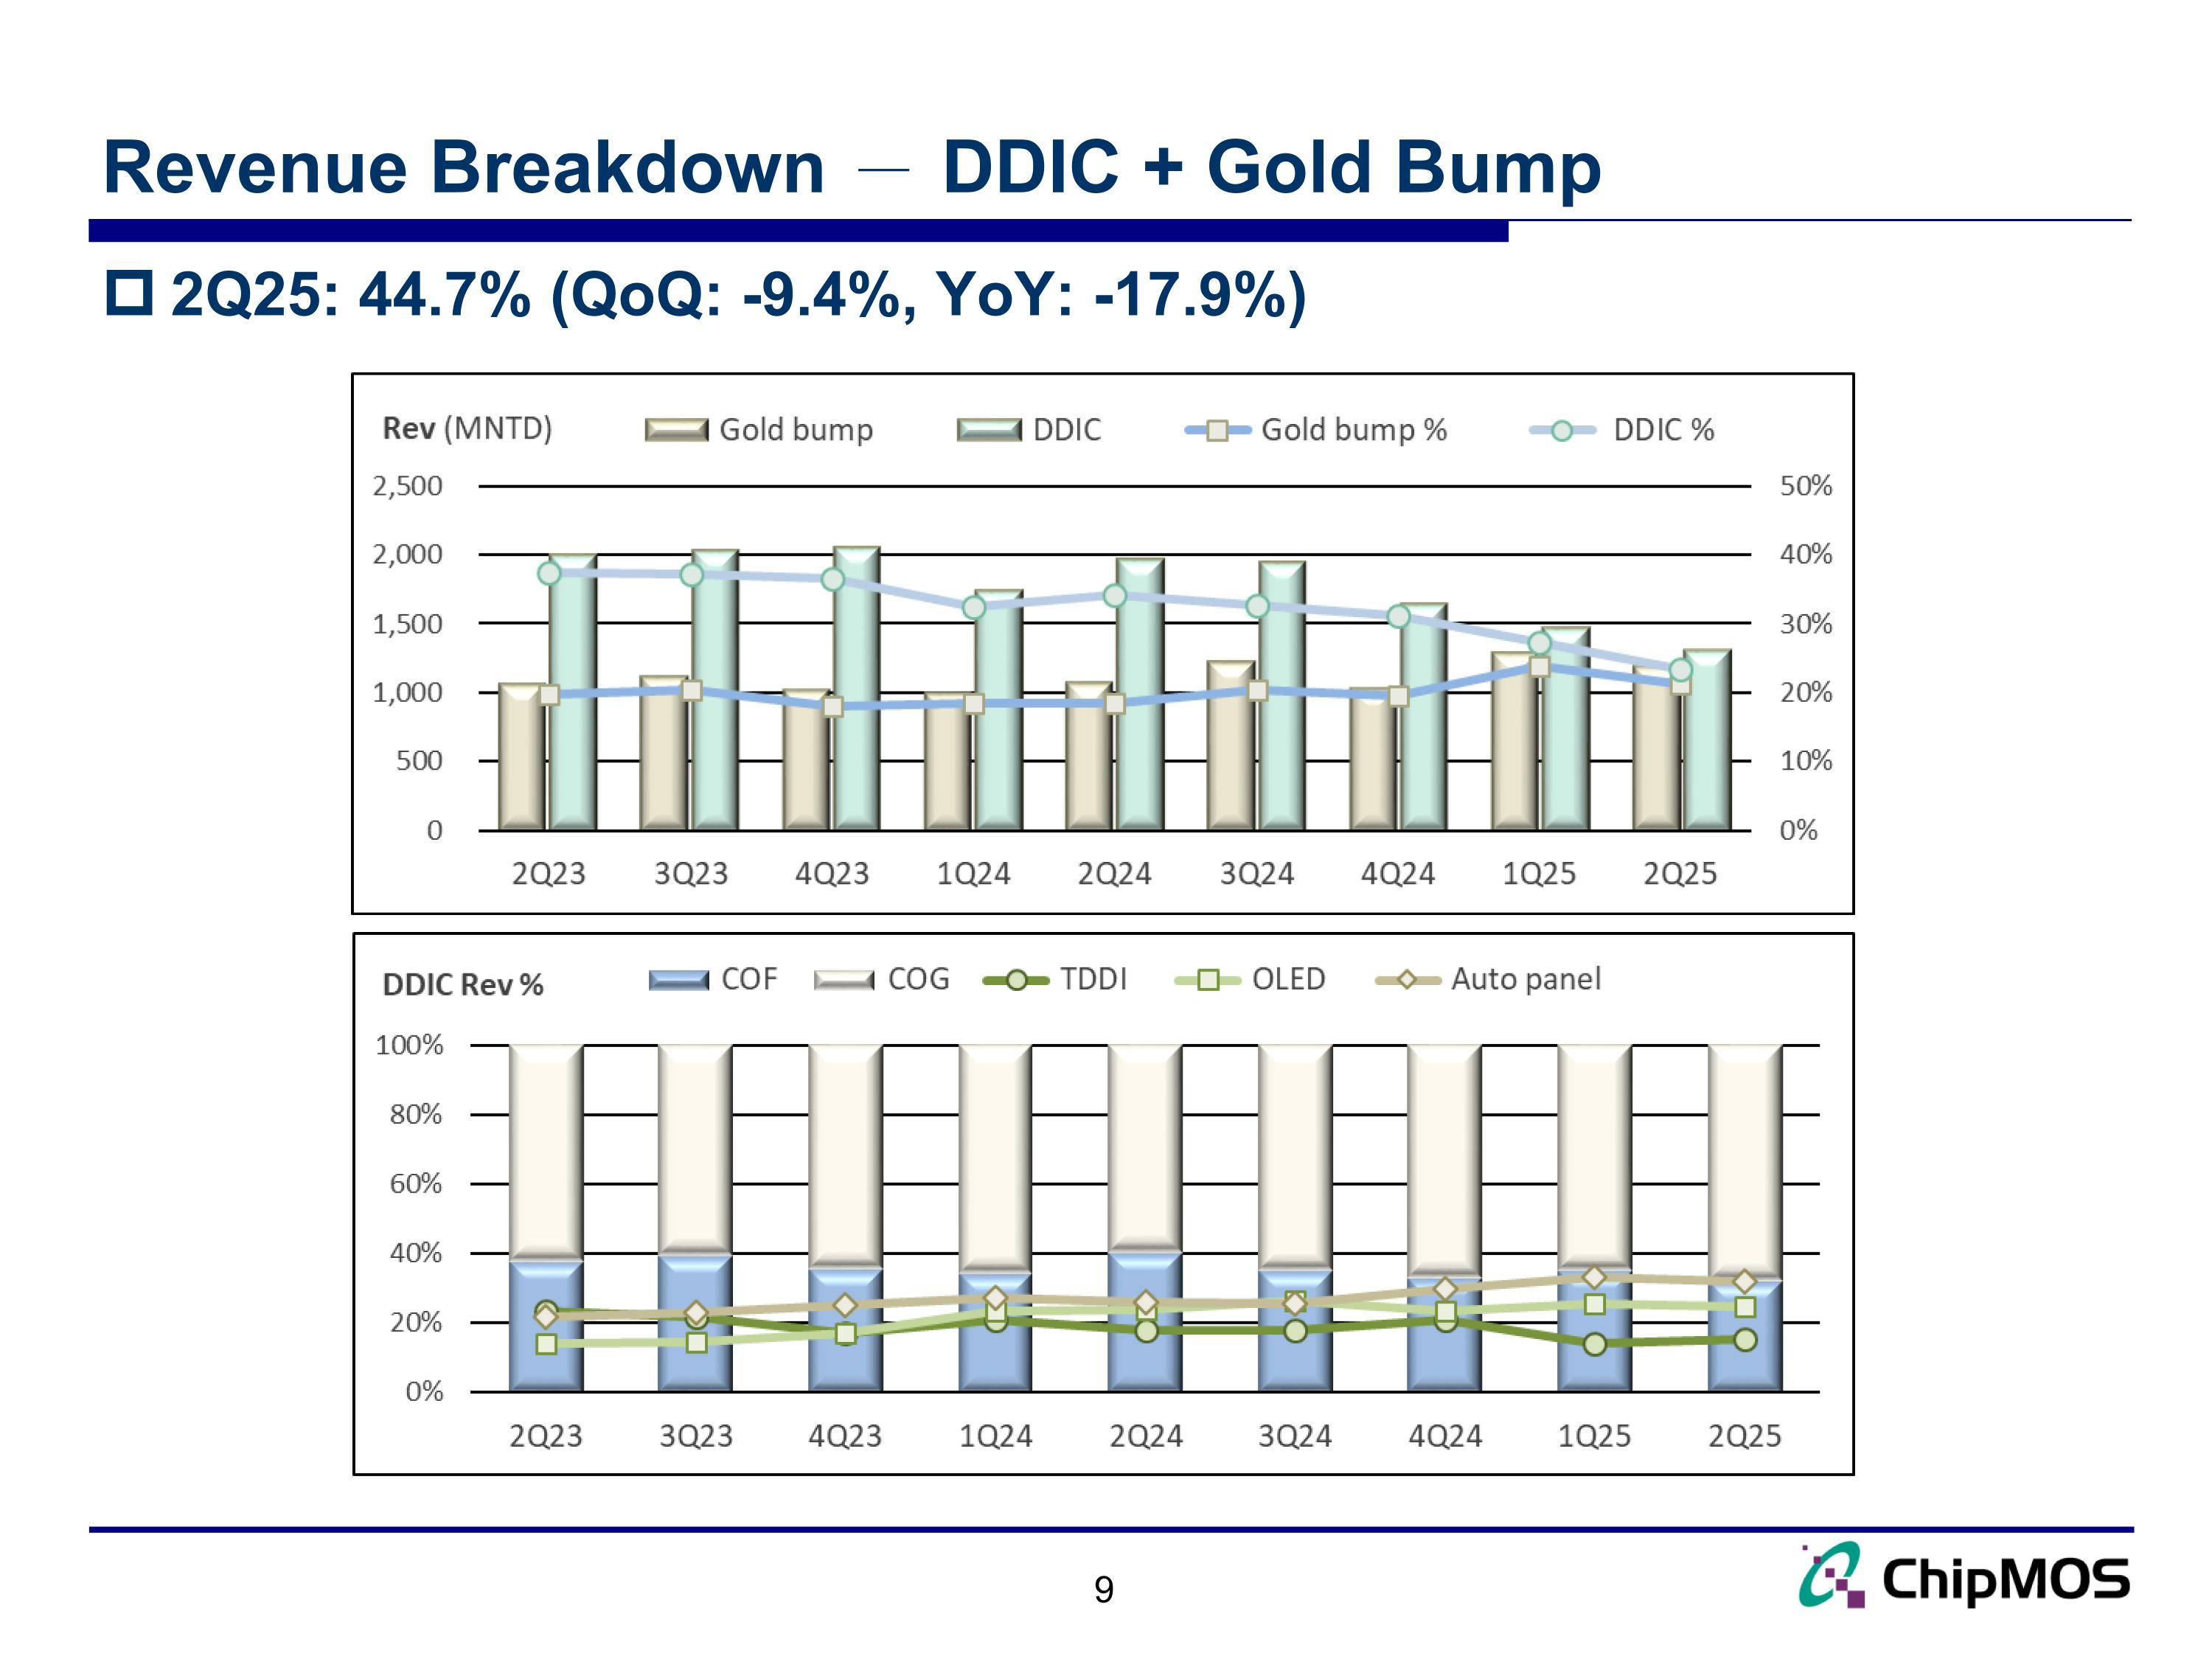
Revenue Breakdown - DDIC + Gold Bump 9 2Q25: 44.7% (QoQ: -9.4%, YoY: -17.9%)
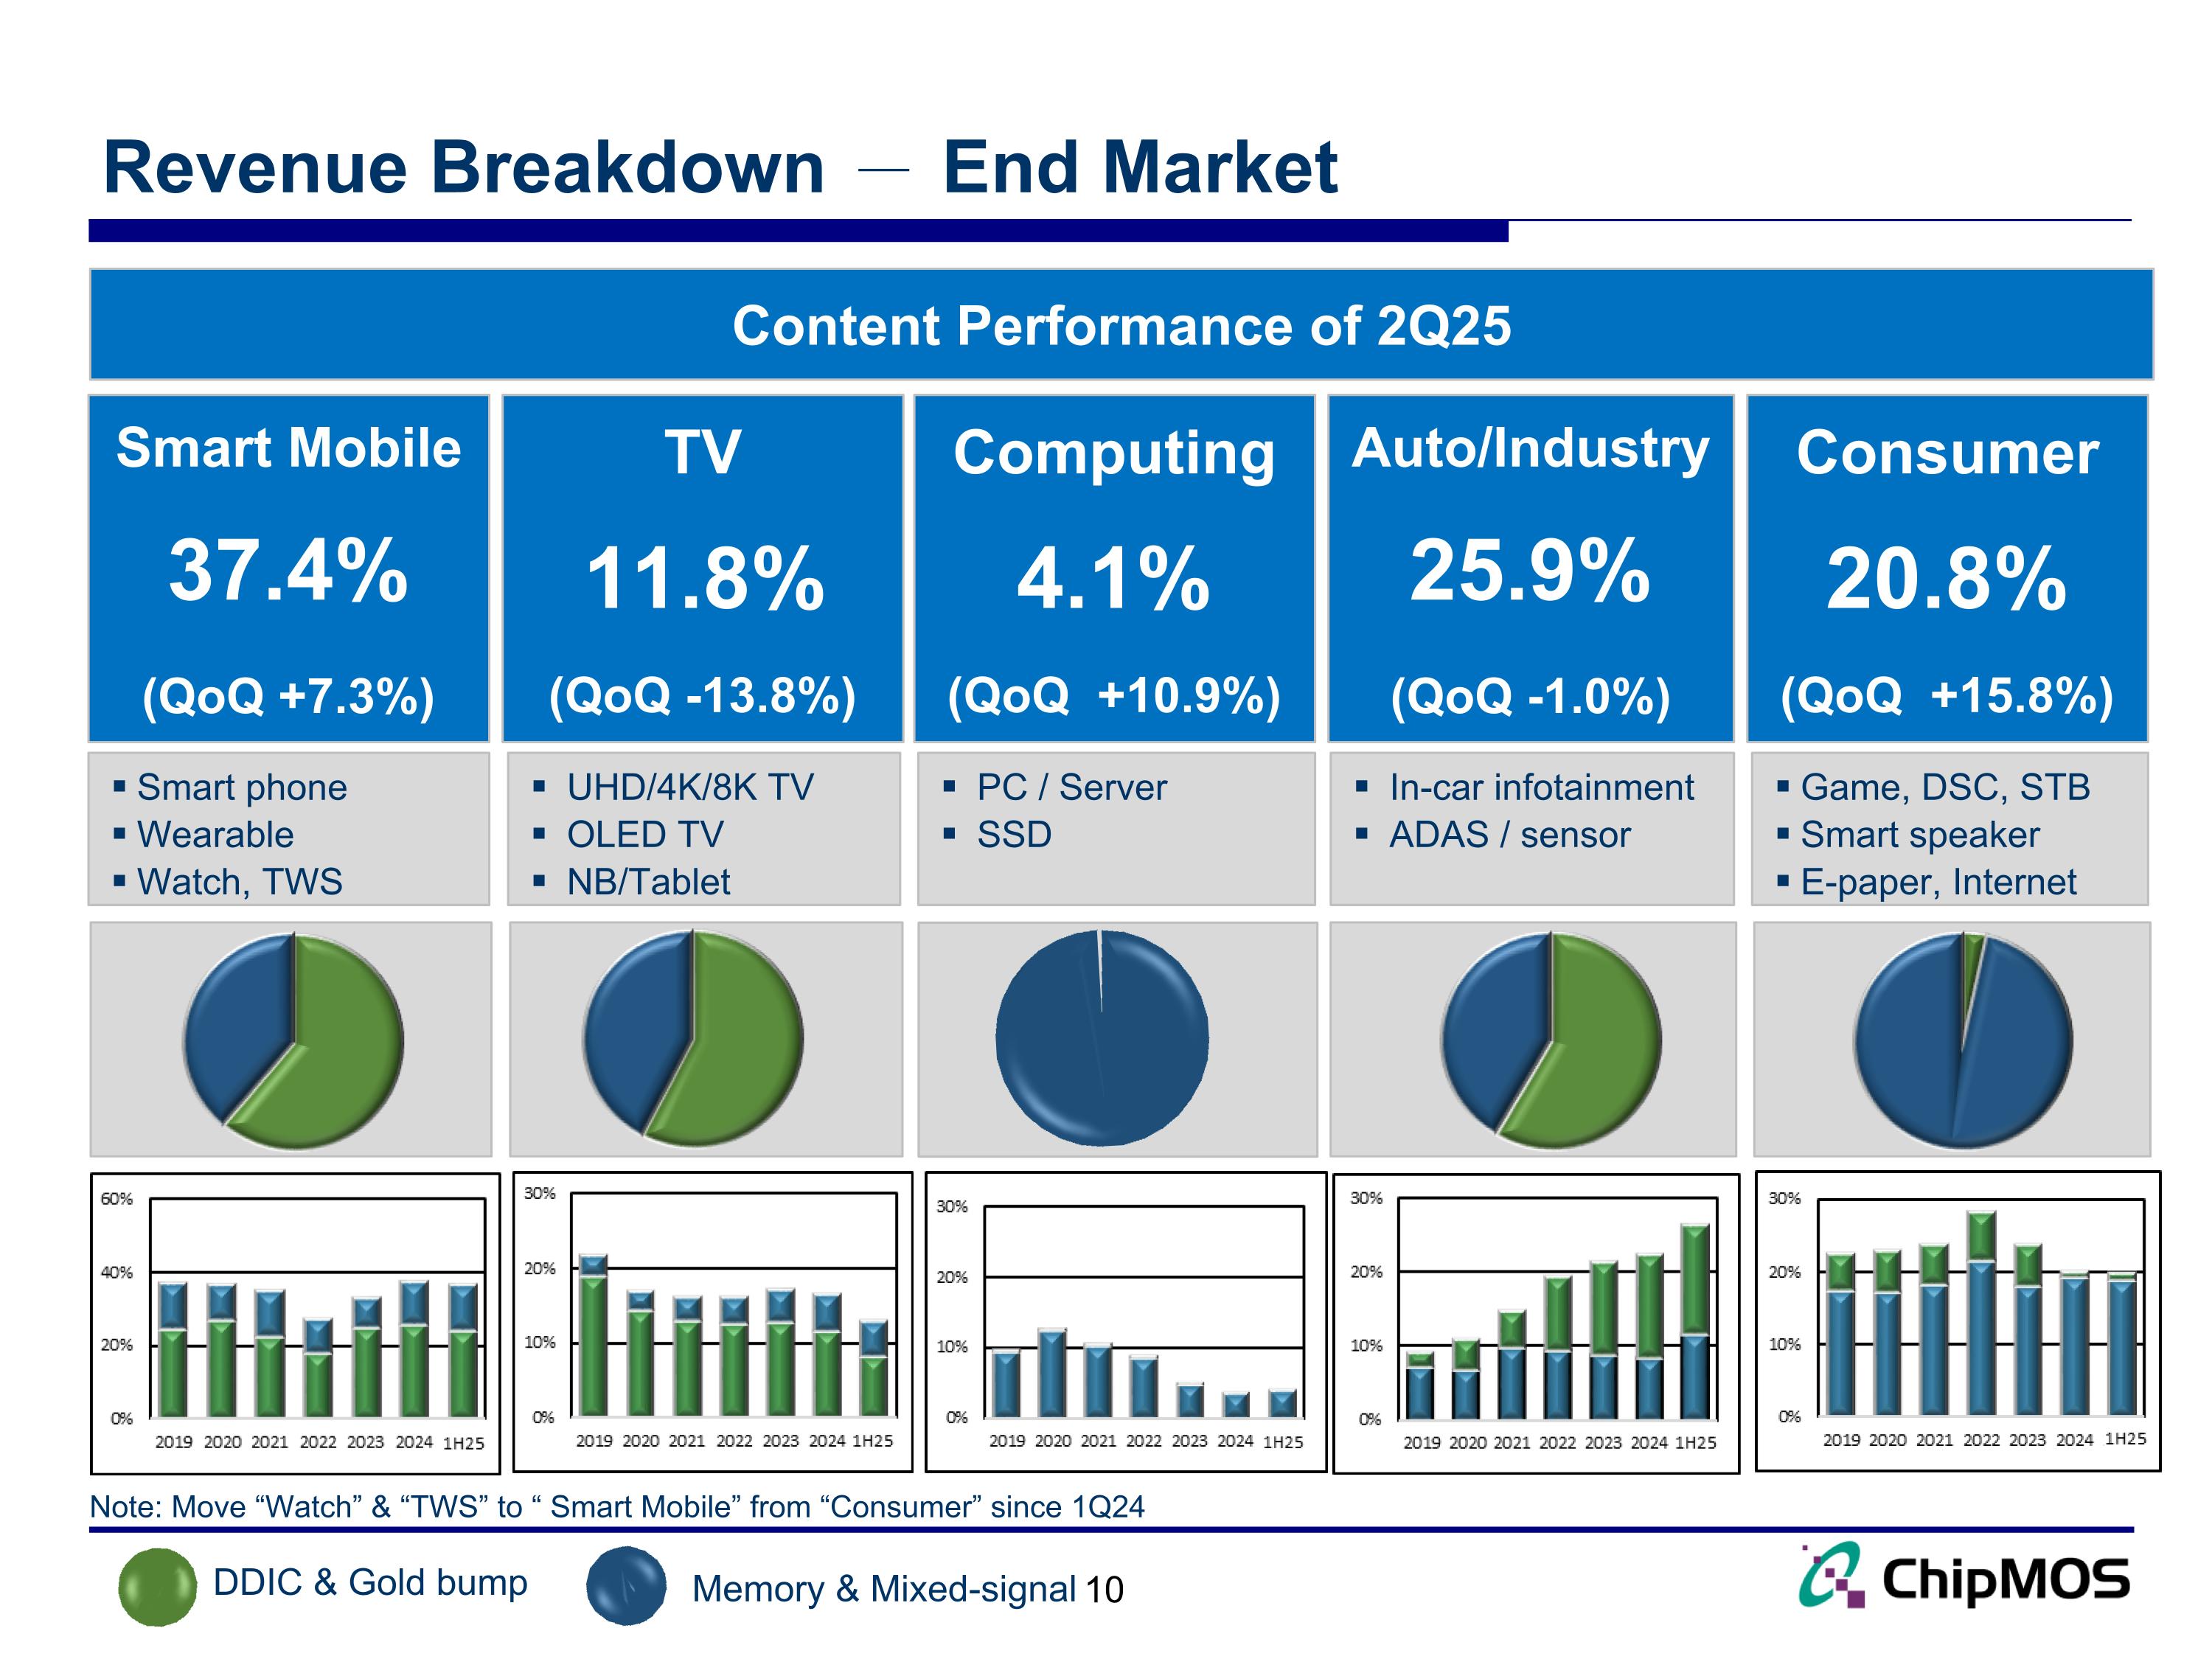
Revenue Breakdown - End Market 10 DDIC & Gold bump Memory & Mixed-signal Content Performance of 2Q25 Smart Mobile 37.4% (QoQ +7.3%) TV 11.8% (QoQ -13.8%) Computing 4.1% (QoQ +10.9%) Auto/Industry 25.9% (QoQ -1.0%) Consumer 20.8% (QoQ +15.8%) Smart phone Wearable Watch, TWS UHD/4K/8K TV OLED TV NB/Tablet PC / Server SSD In-car infotainment ADAS / sensor Game, DSC, STB Smart speaker E-paper, Internet Note: Move “Watch” & “TWS” to “ Smart Mobile” from “Consumer” since 1Q24
11 2Q25 Financial Results
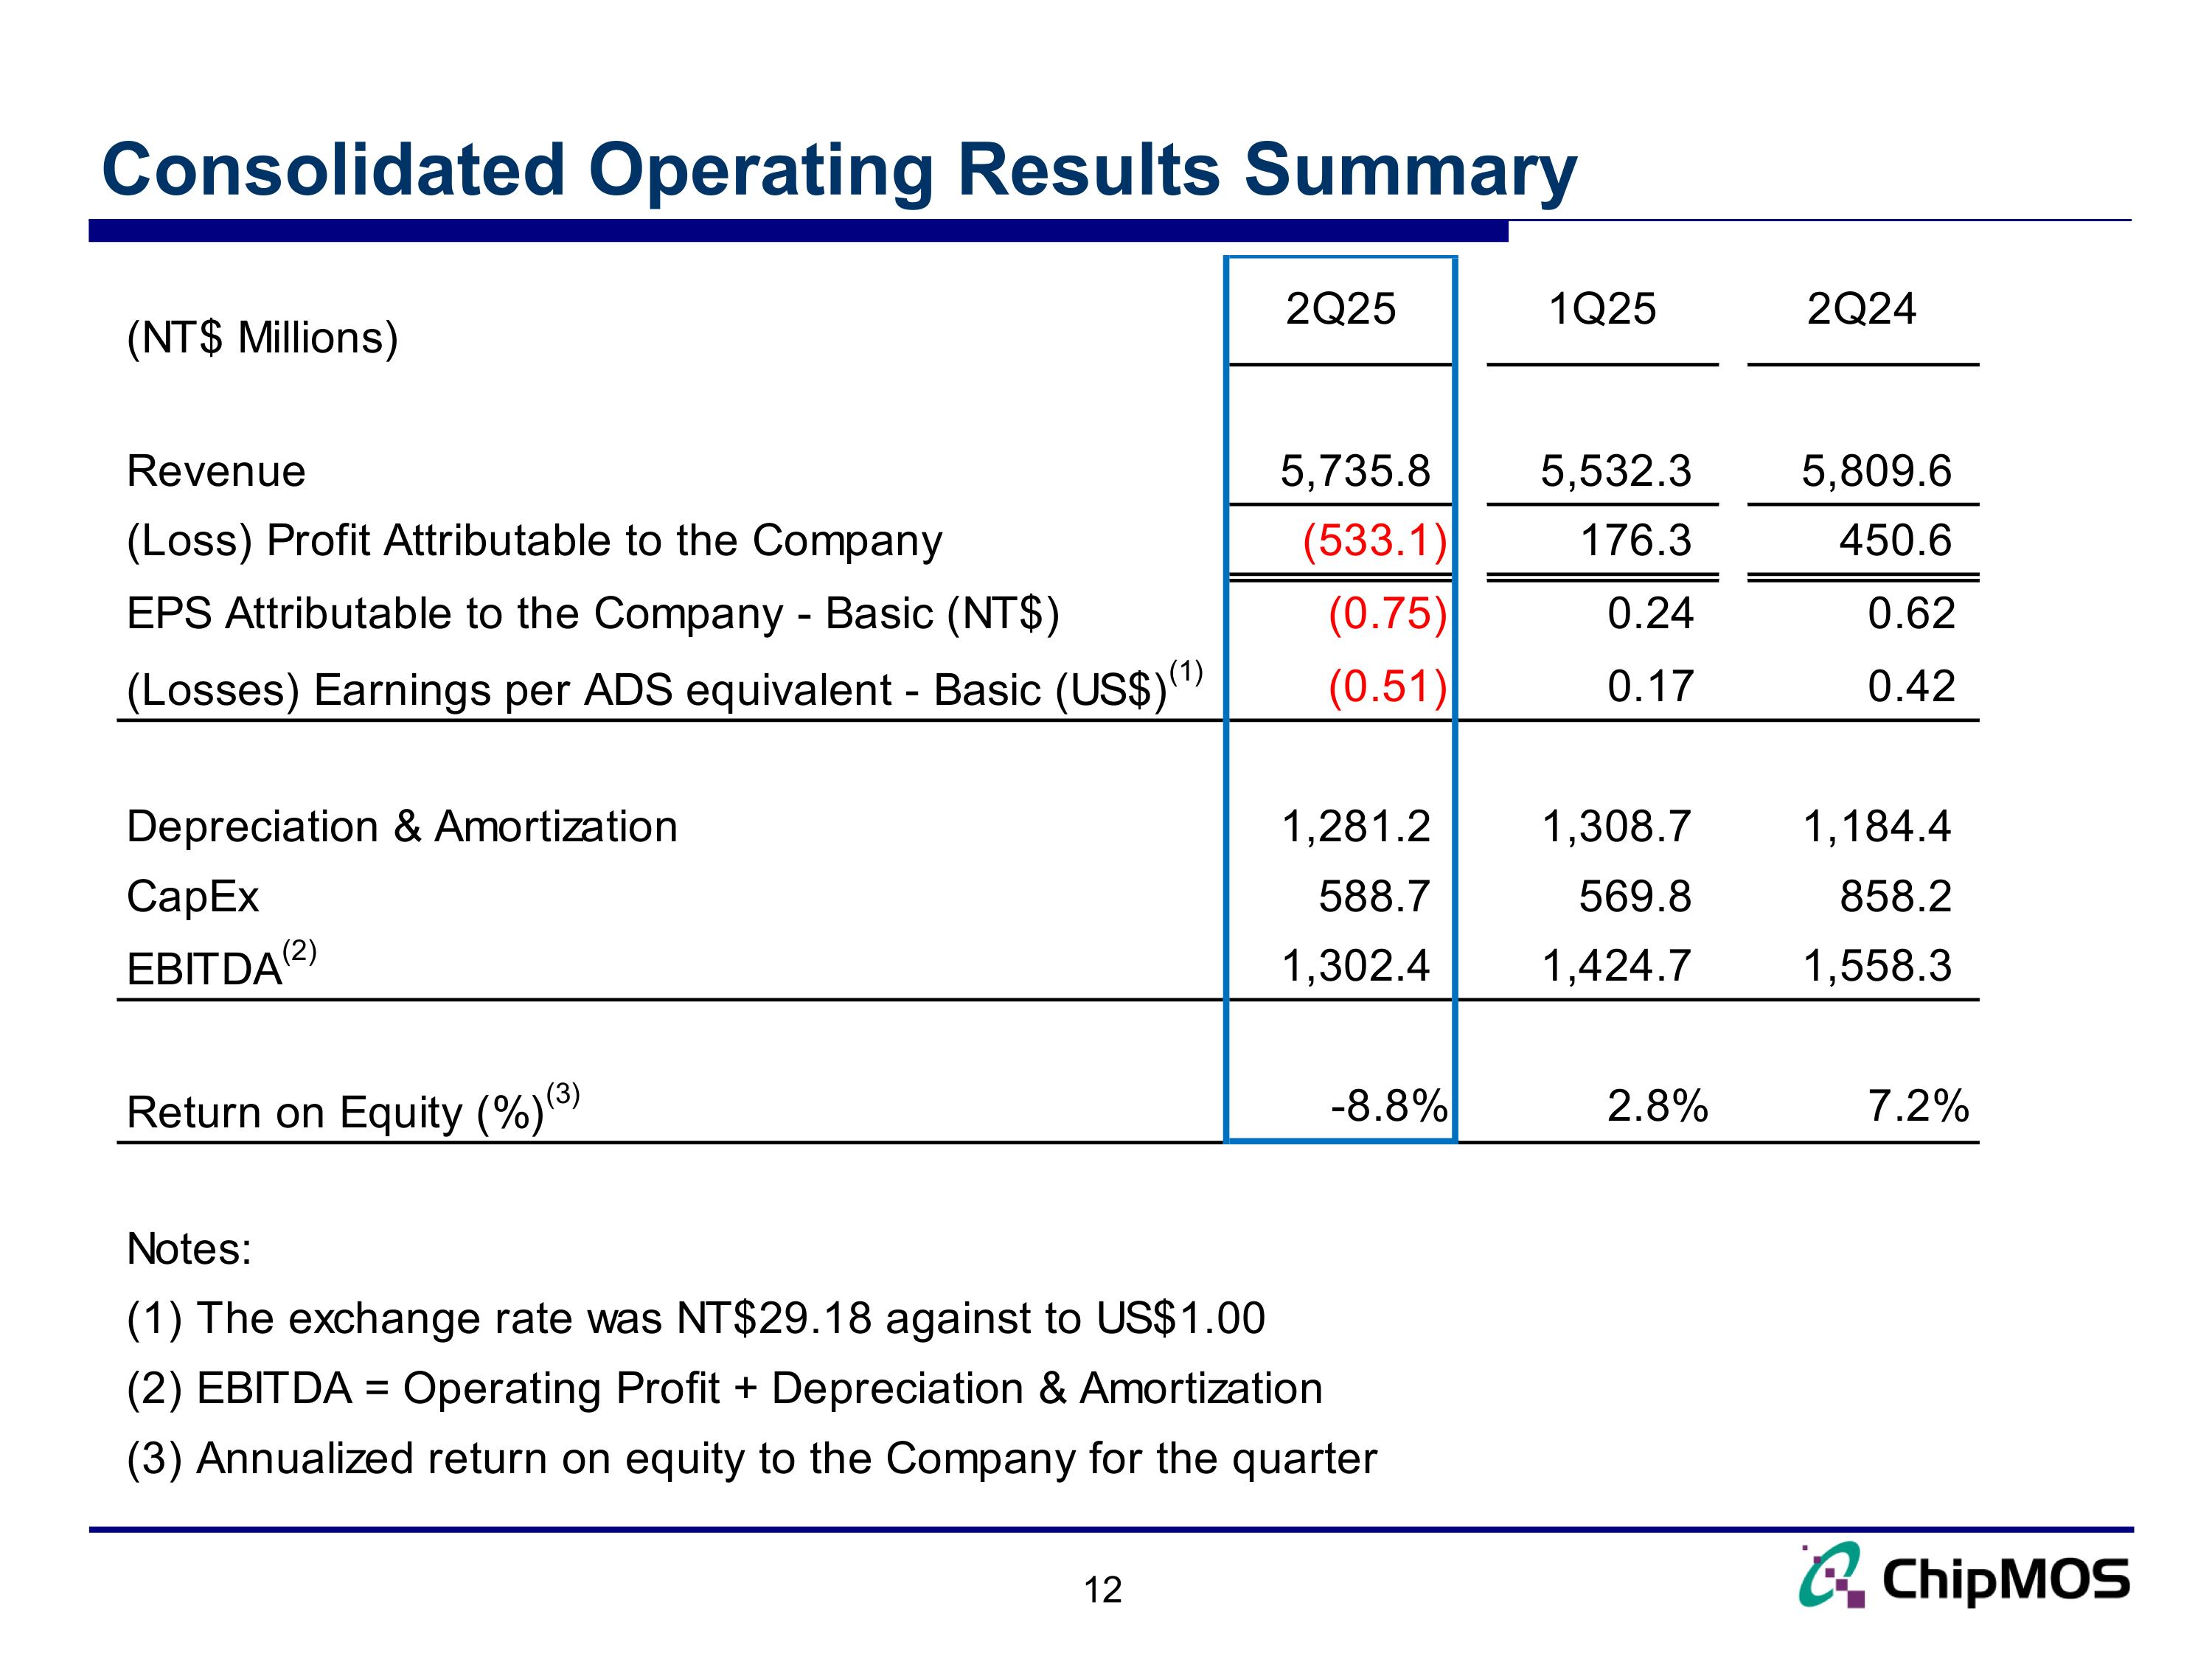
Consolidated Operating Results Summary
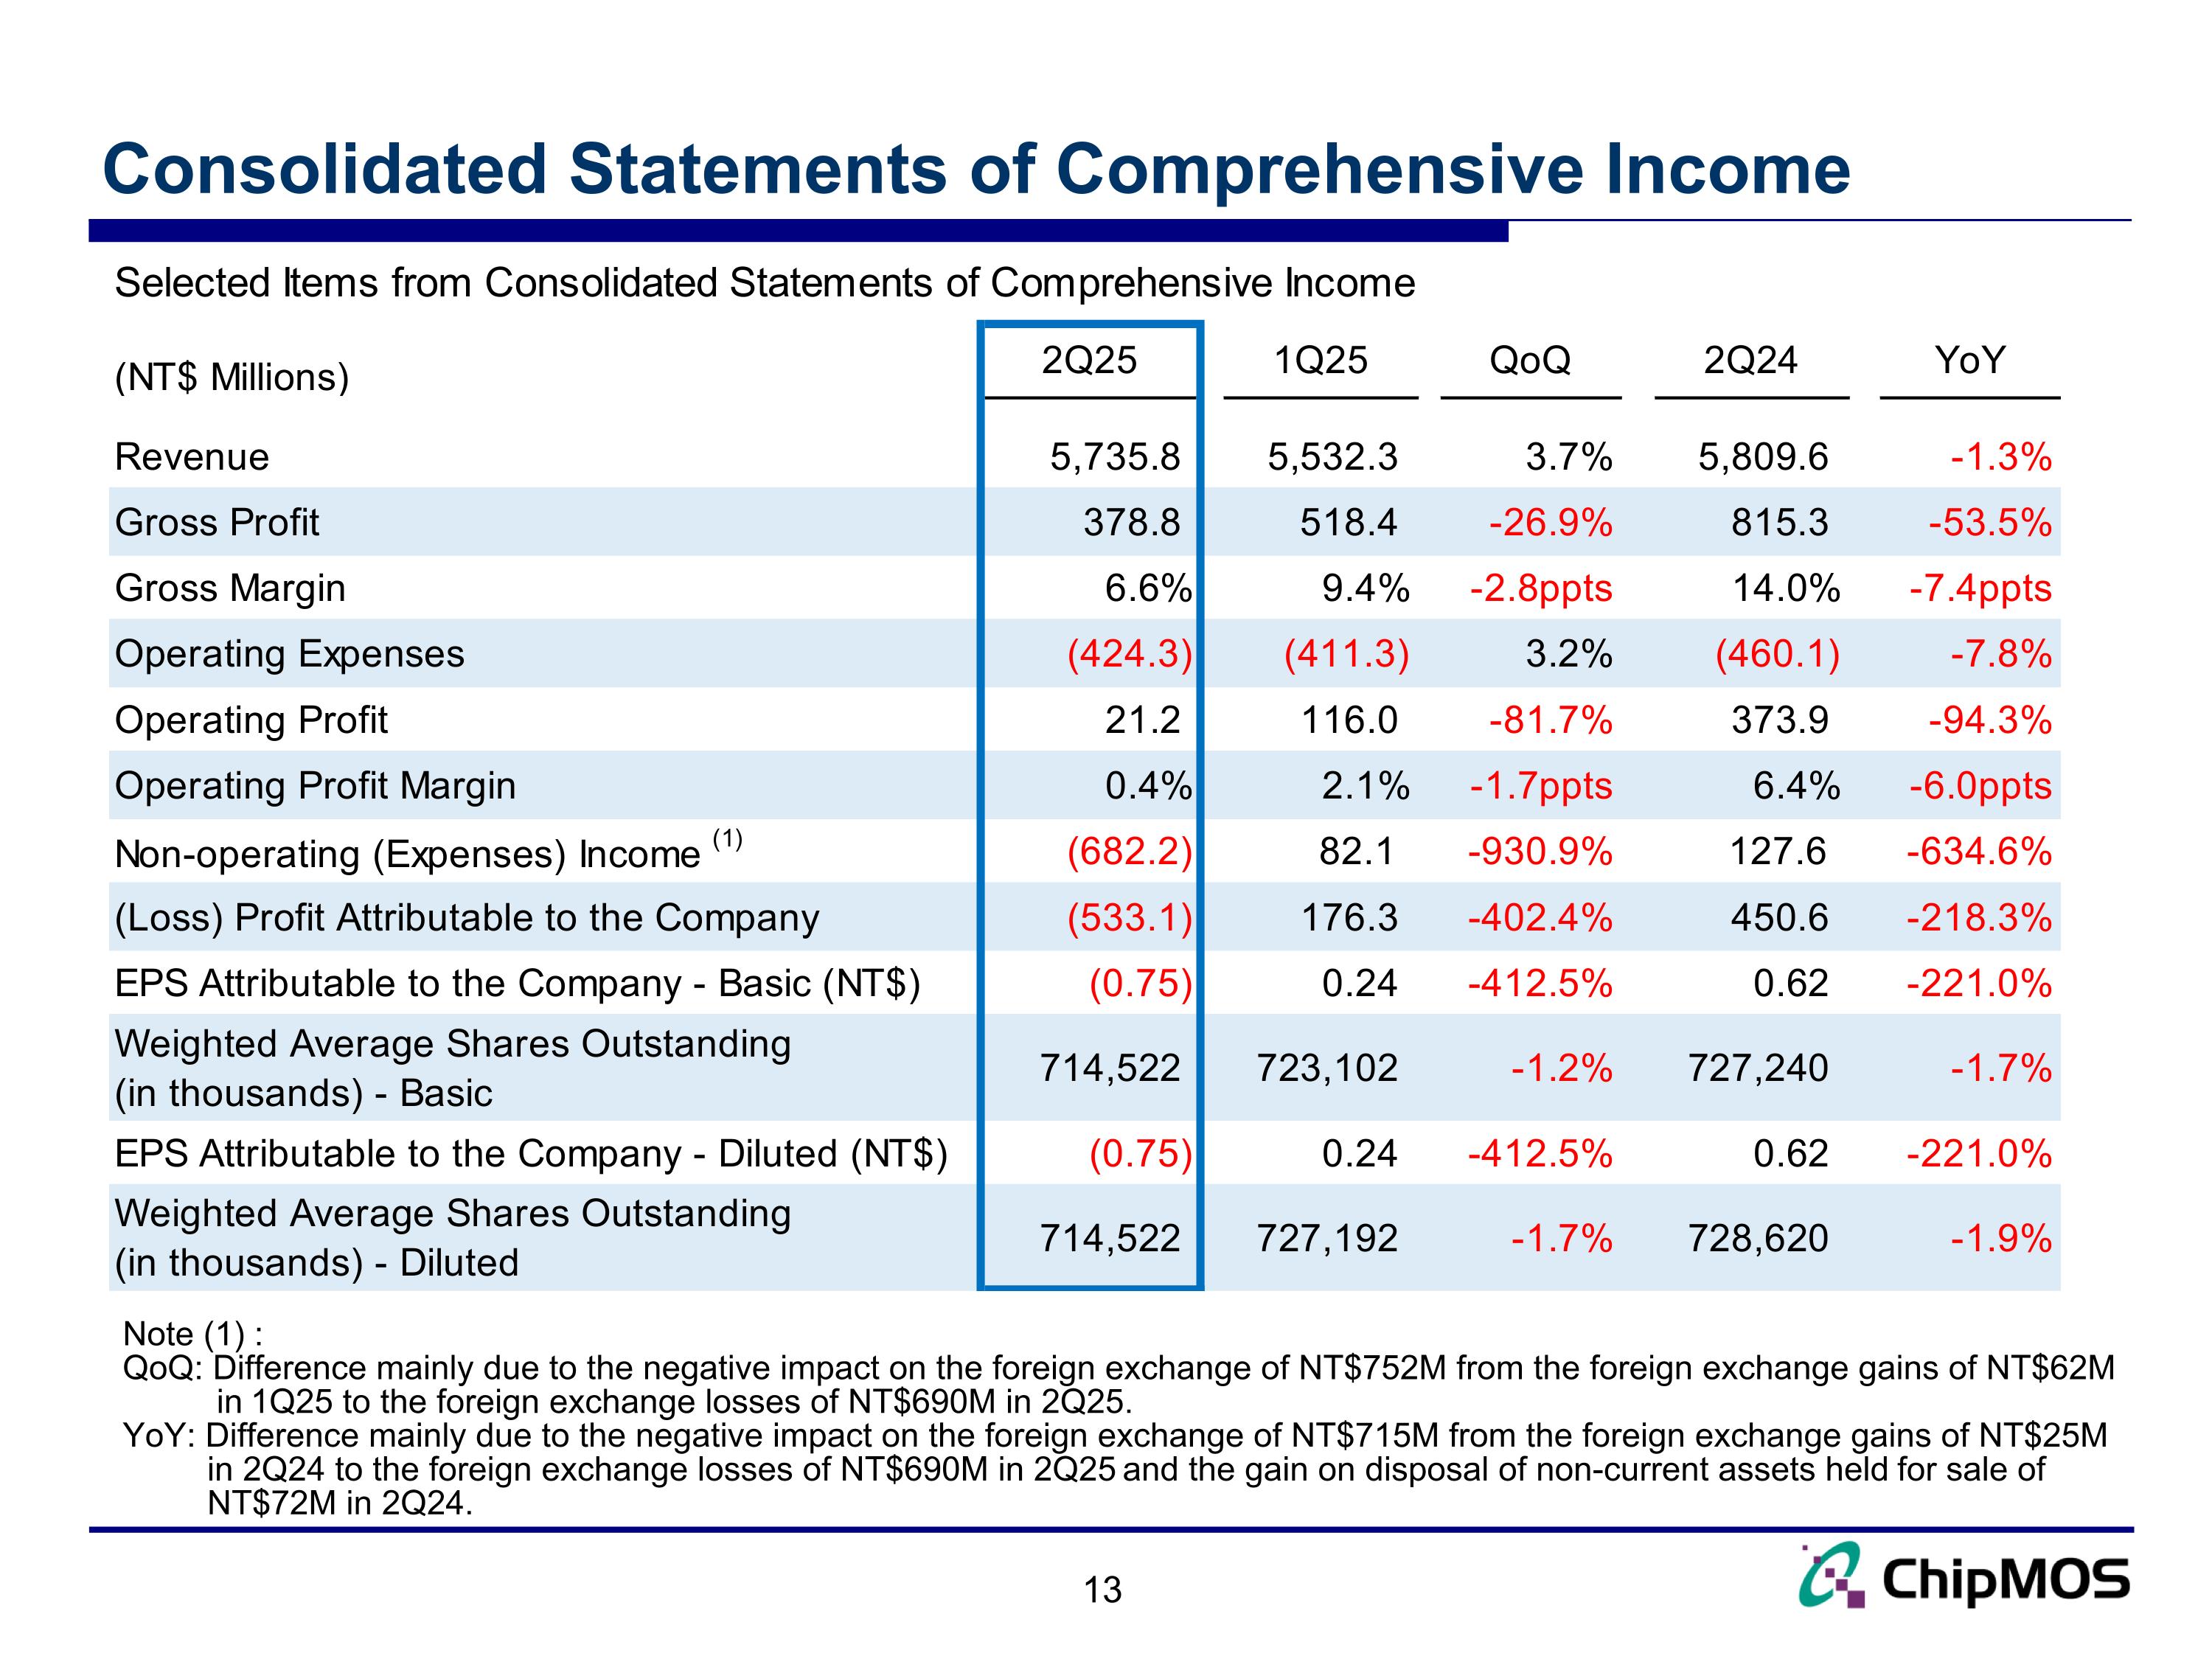
Consolidated Statements of Comprehensive Income Note (1) : QoQ: Difference mainly due to the negative impact on the foreign exchange of NT$752M from the foreign exchange gains of NT$62M in 1Q25 to the foreign exchange losses of NT$690M in 2Q25. YoY: Difference mainly due to the negative impact on the foreign exchange of NT$715M from the foreign exchange gains of NT$25M in 2Q24 to the foreign exchange losses of NT$690M in 2Q25 and the gain on disposal of non-current assets held for sale of NT$72M in 2Q24.
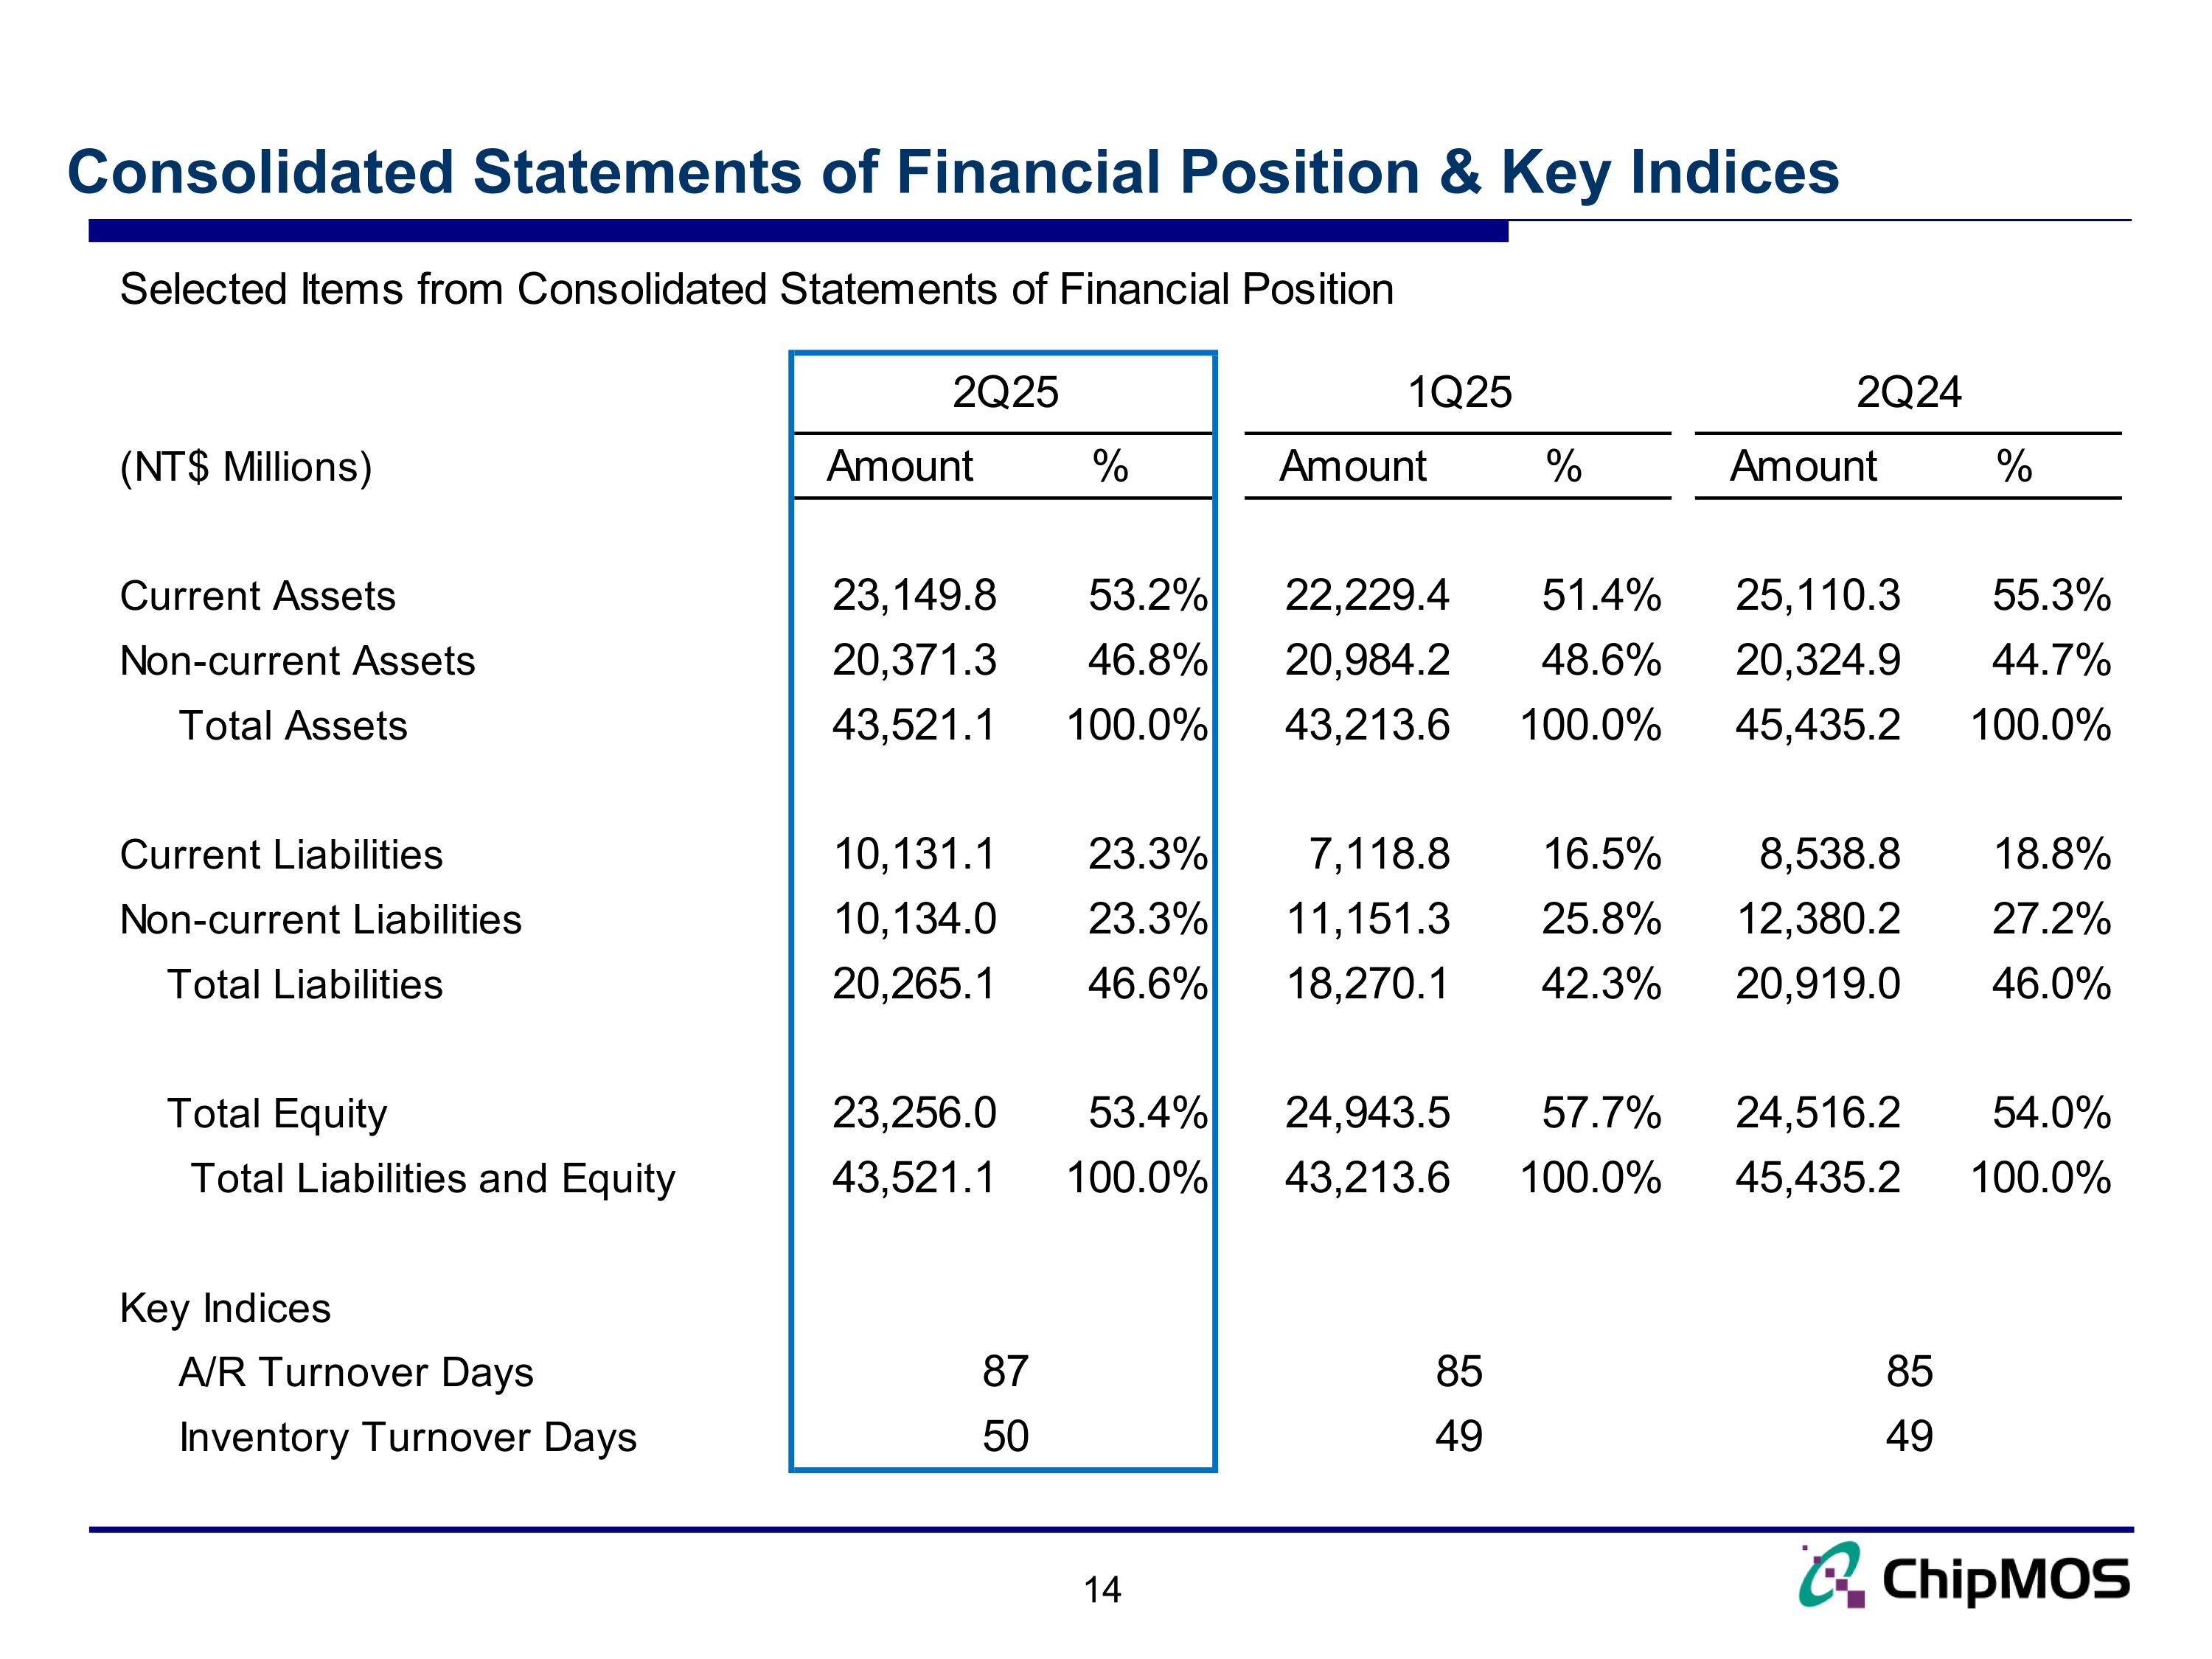
Consolidated Statements of Financial Position & Key Indices
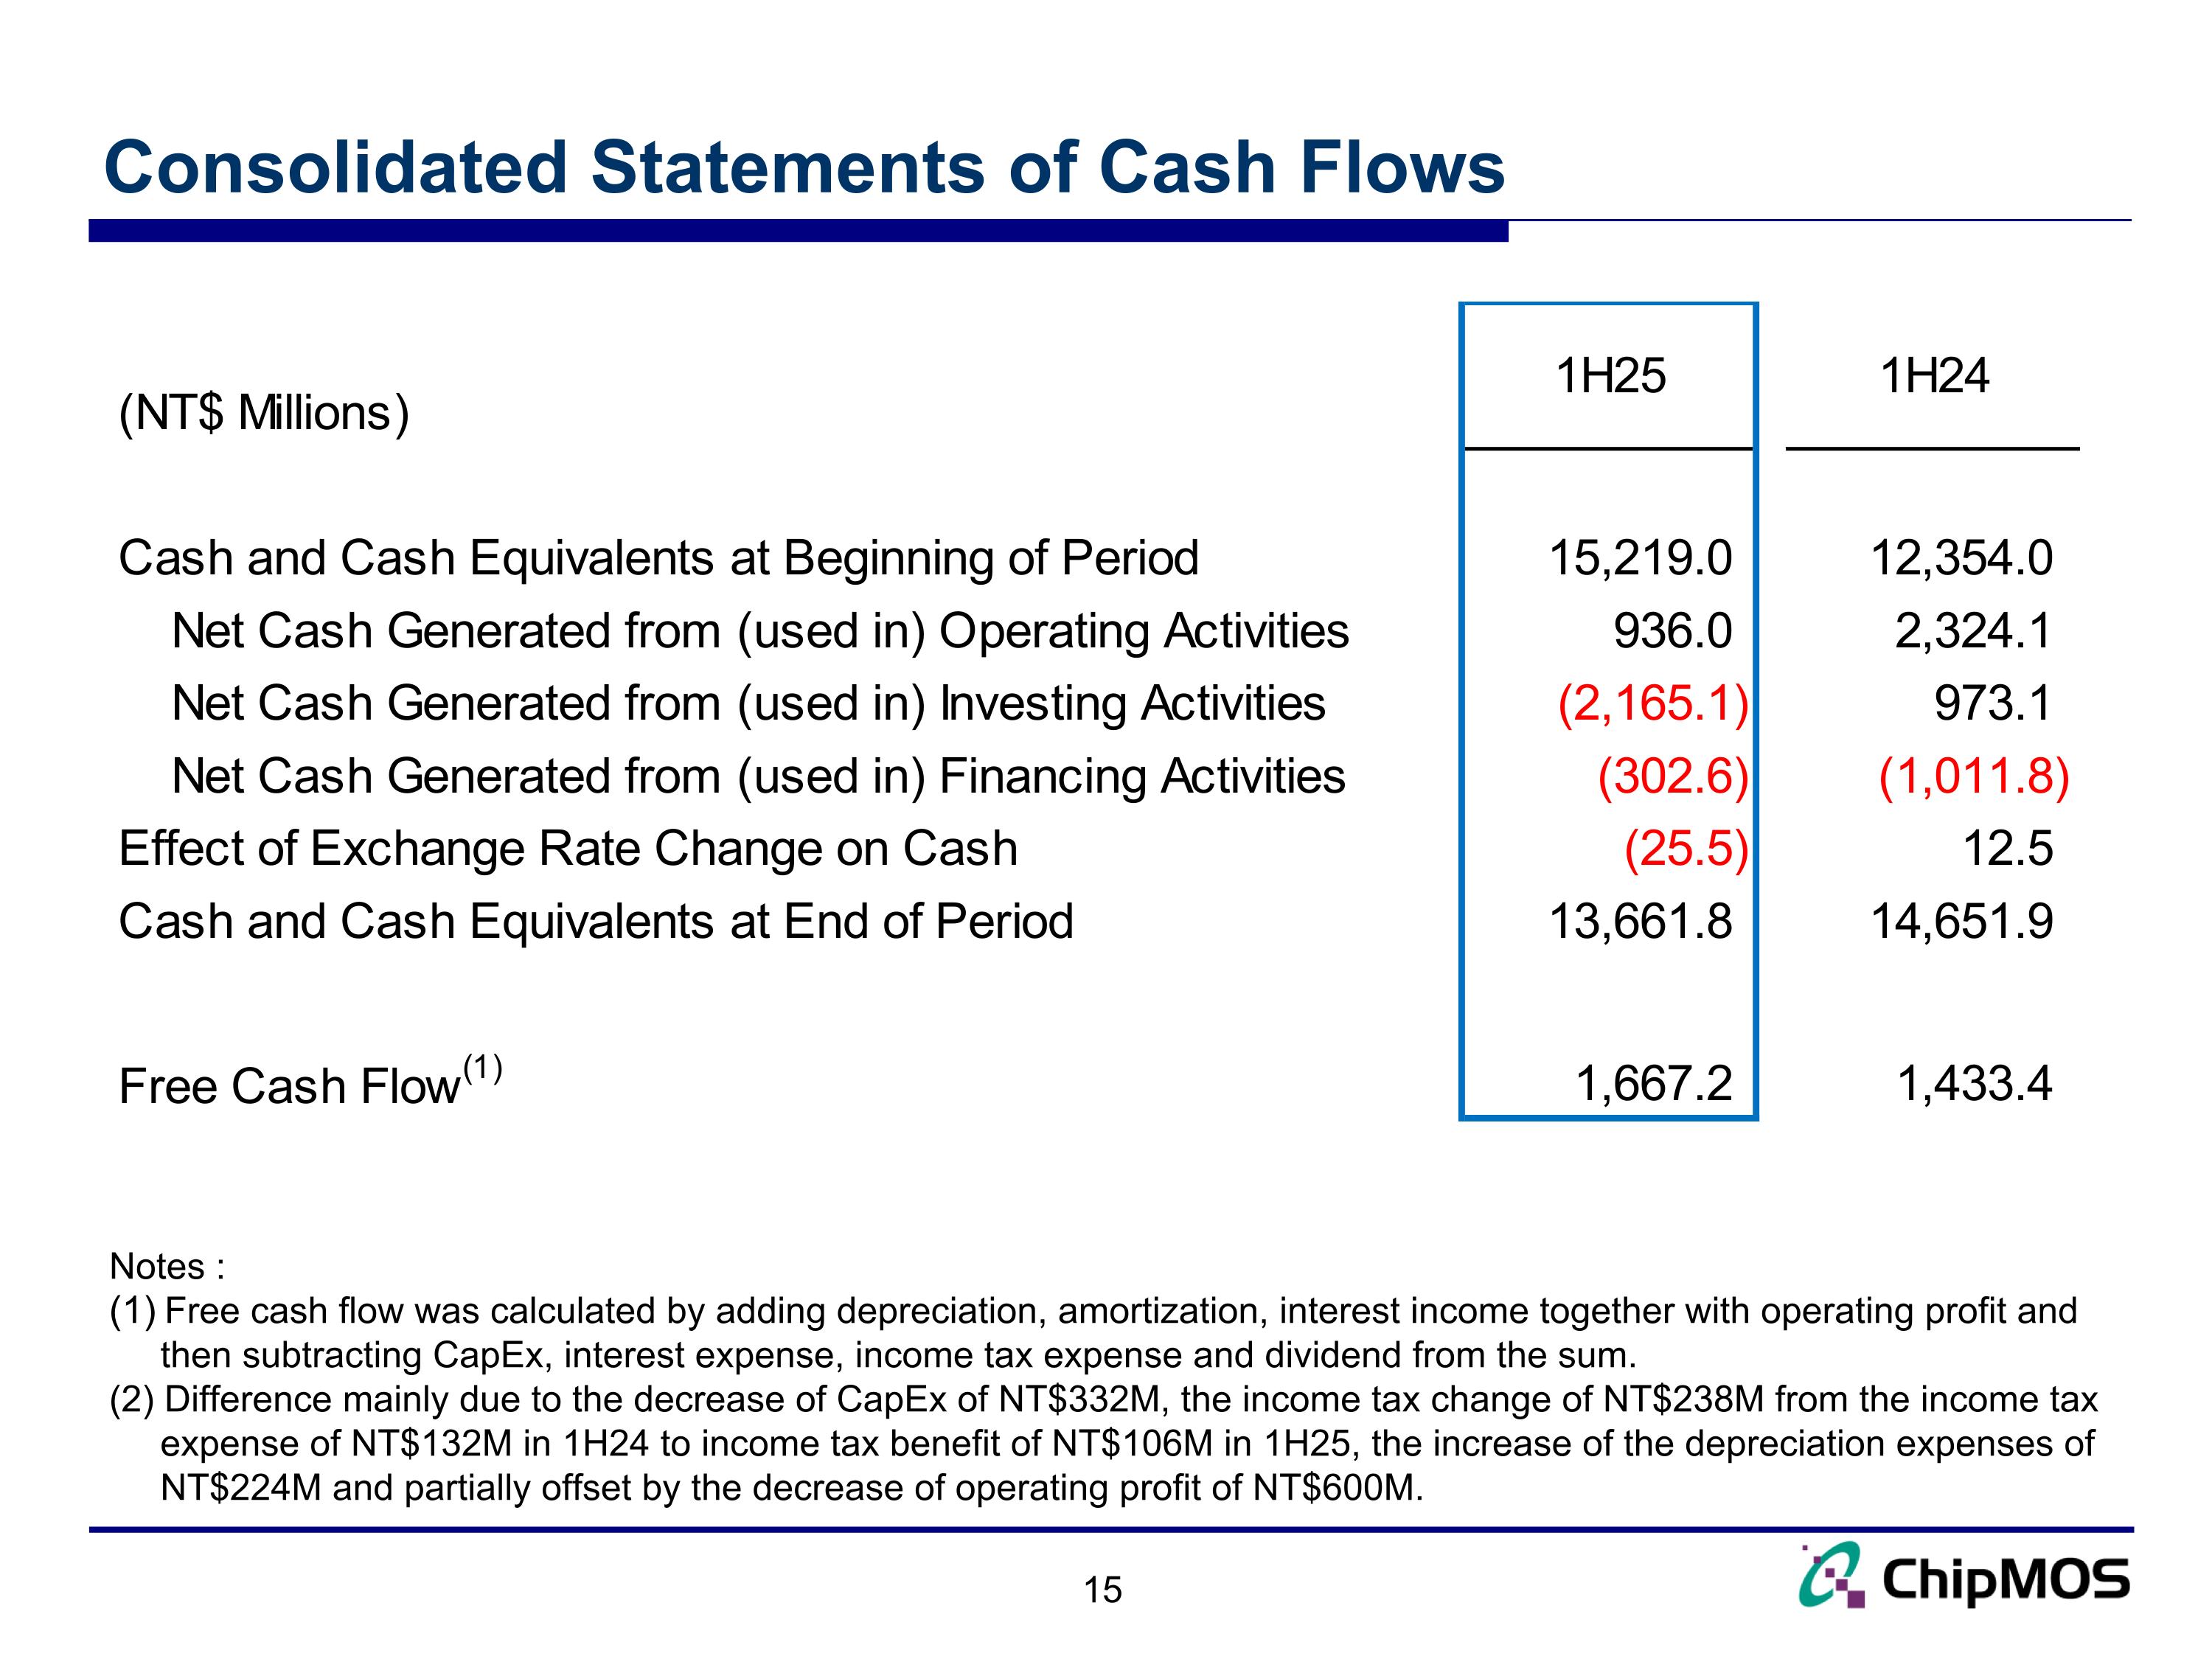
Consolidated Statements of Cash Flows Notes : Free cash flow was calculated by adding depreciation, amortization, interest income together with operating profit and then subtracting CapEx, interest expense, income tax expense and dividend from the sum. (2) Difference mainly due to the decrease of CapEx of NT$332M, the income tax change of NT$238M from the income tax expense of NT$132M in 1H24 to income tax benefit of NT$106M in 1H25, the increase of the depreciation expenses of NT$224M and partially offset by the decrease of operating profit of NT$600M.
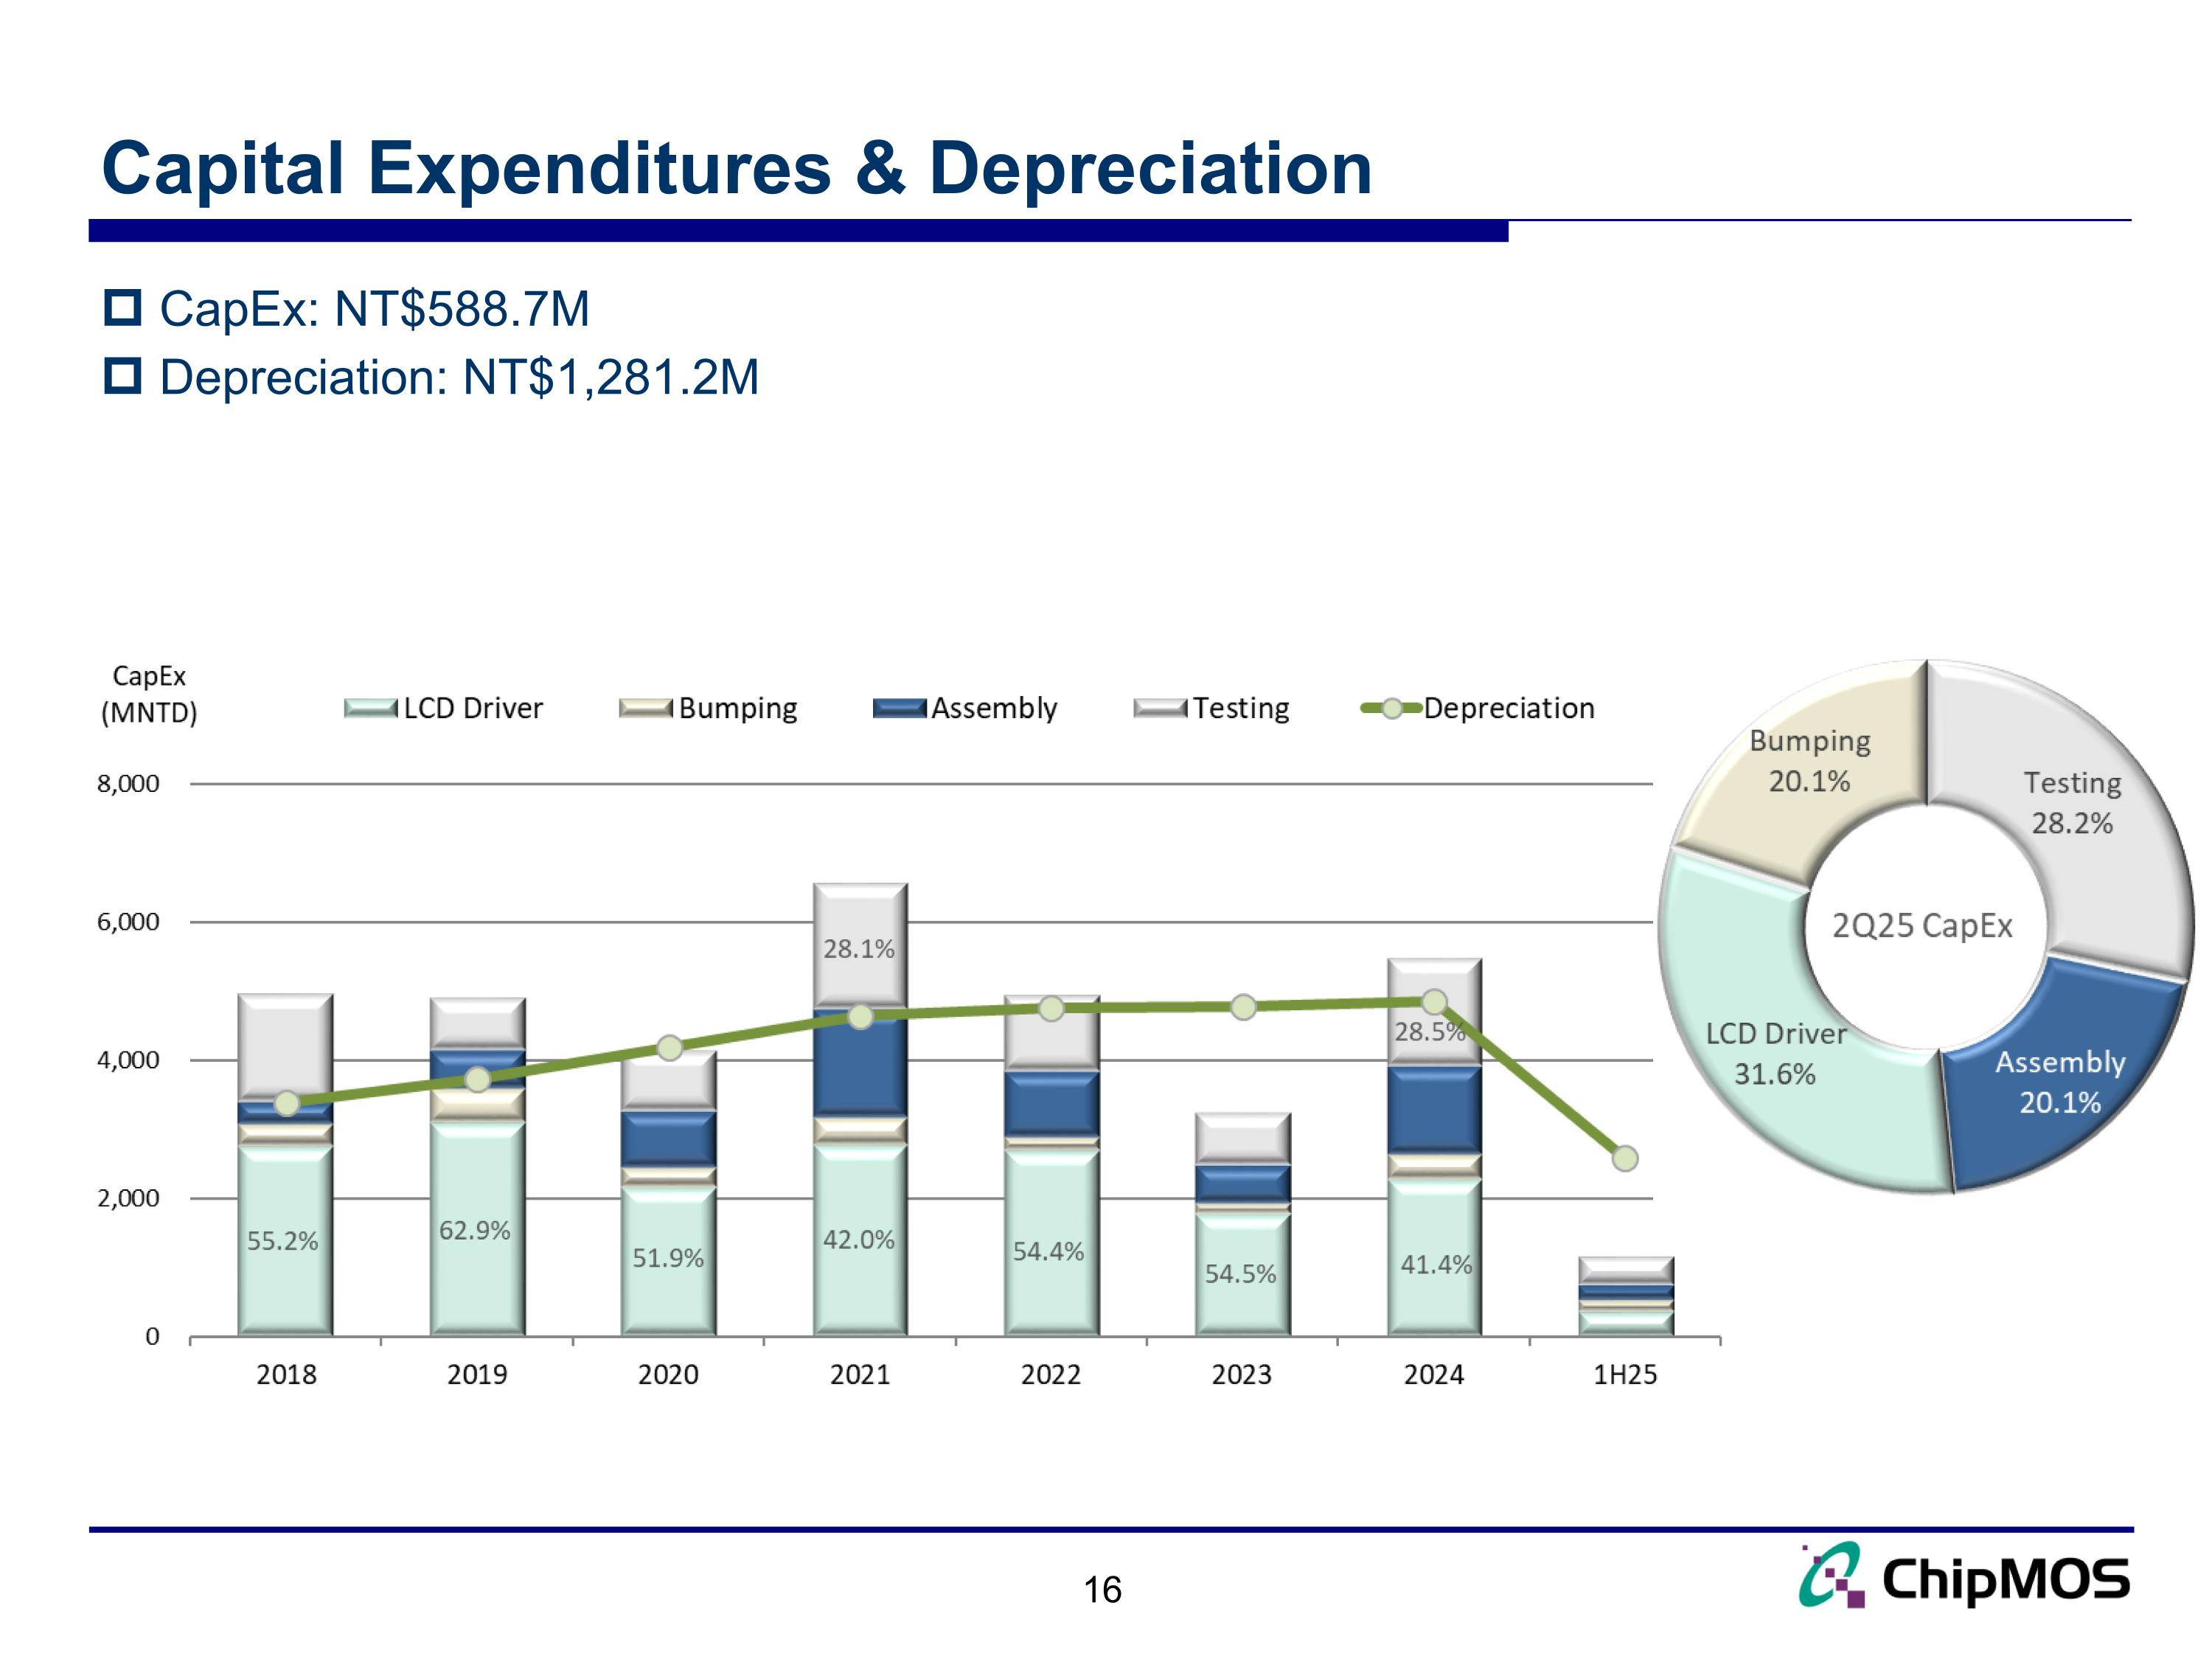
Capital Expenditures & Depreciation 16 CapEx: NT$588.7M Depreciation: NT$1,281.2M
17 Business Outlook
Market & Business Outlook Conservative end consumer demand Solid memory momentum Continue to focus on higher margin mix improvement, cost controls and remain cautious in CapEx spending Memory: Momentum expected to be better than DDIC for customers’ re-stocking and solid demand DRAM and NAND demand is rebounding Upside to memory OSAT prices DDIC: Customers’ re-stocking for smartphone product OLED momentum is improving for seasonal re-stocking Auto panel momentum is stable compare with other DDIC products
Q&A www.chipmos.com