Shareholder Report
May 31, 2025
USD ($)
Holding
WHAT WERE THE FUND COSTS FOR THE LAST SIX MONTHS?
(Based on a hypothetical $10,000 investment)
| Fund | Costs of a $10,000 investment | Costs paid as a percentage of a $10,000 investment |
| First Trust Active Global Quality Income ETF | $23 | 0.44%(1) (2) |
|
(1) |
Annualized. |
|
(2) |
This ratio reflects tax expense paid by the Fund and a payment received from insurance related to extraordinary legal fees paid by the Fund during the fiscal year ended November 30, 2024 and the fiscal period ended November 30, 2023. If the tax payment had not been made and the insurance payment had not been received, the ratio would have been 0.85%. |
KEY FUND STATISTICS (As of May 31, 2025)
| Fund net assets | $55,241,347 |
| Total number of portfolio holdings | 33 |
| Portfolio turnover rate | 37% |
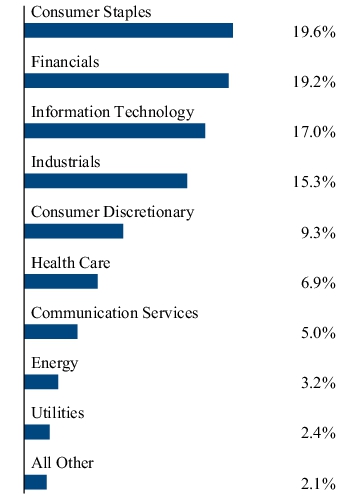
WHAT DID THE FUND INVEST IN? (As of May 31, 2025)
The tables below show the investment makeup of the Fund, representing the percentage of total investments of the Fund.
Top Ten Holdings
| Taiwan Semiconductor Manufacturing Co., Ltd. | 5.0% |
| Microsoft Corp. | 4.7% |
| BAE Systems PLC | 4.5% |
| RELX PLC | 4.4% |
| Nordea Bank Abp | 4.0% |
| Coca-Cola (The) Co. | 4.0% |
| Carlsberg A/S, Class B | 3.8% |
| nVent Electric PLC | 3.7% |
| Procter & Gamble (The) Co. | 3.6% |
| Unilever PLC | 3.6% |
Sector Allocation
Top Ten Holdings
| Taiwan Semiconductor Manufacturing Co., Ltd. | 5.0% |
| Microsoft Corp. | 4.7% |
| BAE Systems PLC | 4.5% |
| RELX PLC | 4.4% |
| Nordea Bank Abp | 4.0% |
| Coca-Cola (The) Co. | 4.0% |
| Carlsberg A/S, Class B | 3.8% |
| nVent Electric PLC | 3.7% |
| Procter & Gamble (The) Co. | 3.6% |
| Unilever PLC | 3.6% |
WHAT WERE THE FUND COSTS FOR THE LAST SIX MONTHS?
(Based on a hypothetical $10,000 investment)
| Fund | Costs of a $10,000 investment | Costs paid as a percentage of a $10,000 investment |
| FT Energy Income Partners Enhanced Income ETF | $56 | 1.14%(1) (2) |
|
(1) |
Annualized. |
|
(2) |
Includes tax expense. If the tax expense was not included, the expense ratio would have been 1.10%. |
KEY FUND STATISTICS (As of May 31, 2025)
| Fund net assets | $902,506,252 |
| Total number of portfolio holdings | 111 |
| Portfolio turnover rate | 64% |
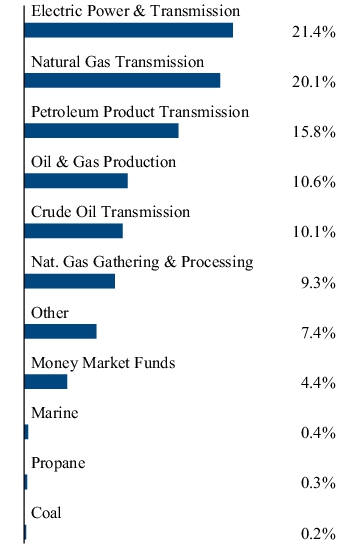
WHAT DID THE FUND INVEST IN? (As of May 31, 2025)
The tables below show the investment makeup of the Fund, representing the percentage of total investments of the Fund.
Top Ten Holdings
| Enterprise Products Partners, L.P. | 7.7% |
| Energy Transfer, L.P. | 6.7% |
| MPLX, L.P. | 4.6% |
| ONEOK, Inc. | 4.5% |
| Morgan Stanley Institutional Liquidity Funds - Treasury Portfolio - Institutional Class | 4.4% |
| Kinder Morgan, Inc. | 3.9% |
| Williams (The) Cos., Inc. | 3.8% |
| TotalEnergies SE, ADR | 3.4% |
| Shell PLC, ADR | 3.0% |
| Exxon Mobil Corp. | 2.7% |
Industry Allocation
Top Ten Holdings
| Enterprise Products Partners, L.P. | 7.7% |
| Energy Transfer, L.P. | 6.7% |
| MPLX, L.P. | 4.6% |
| ONEOK, Inc. | 4.5% |
| Morgan Stanley Institutional Liquidity Funds - Treasury Portfolio - Institutional Class | 4.4% |
| Kinder Morgan, Inc. | 3.9% |
| Williams (The) Cos., Inc. | 3.8% |
| TotalEnergies SE, ADR | 3.4% |
| Shell PLC, ADR | 3.0% |
| Exxon Mobil Corp. | 2.7% |
| [1] | Annualized. |
| [2] | This ratio reflects tax expense paid by the Fund and a payment received from insurance related to extraordinary legal fees paid by the Fund during the fiscal year ended November 30, 2024 and the fiscal period ended November 30, 2023. If the tax payment had not been made and the insurance payment had not been received, the ratio would have been 0.85%. |
| [3] | Annualized. |
| [4] | Includes tax expense. If the tax expense was not included, the expense ratio would have been 1.10%. |