Management's Discussion and Analysis (“MD&A”)
Quarterly Report on the Second Quarter of 2025
This portion of the Quarterly Report provides management’s discussion and analysis (“MD&A”) of the financial condition and results of operations, to enable a reader to assess material changes in financial condition and results of operations as at, and for the three and six month periods ended June 30, 2025, in comparison to the corresponding prior-year periods. The MD&A is intended to help the reader understand Barrick Mining Corporation (formerly Barrick Gold Corporation) (“Barrick”, “we”, “our”, the “Company” or the “Group”), our operations, financial performance as well as our present and future business environment. This MD&A, which has been prepared as of August 8, 2025, is intended to supplement and complement the condensed unaudited interim consolidated financial statements and notes thereto, prepared in accordance with IFRS Accounting Standards as issued by the International Accounting Standards Board applicable to the preparation of interim financial statements, under International Accounting Standard 34, Interim Financial Reporting, for the three and six month periods ended June 30, 2025 (collectively, the “Financial Statements”), which are included in this Quarterly Report on pages 64 to 68. You are encouraged to review the Financial Statements in conjunction with your review of this MD&A. This MD&A should be read in conjunction with both the annual audited
consolidated financial statements for the two years ended December 31, 2024, the related annual MD&A included in the 2024 Annual Report, and the most recent Form 40–F/Annual Information Form on file with the U.S. Securities and Exchange Commission (“SEC”) and Canadian provincial securities regulatory authorities. These documents and additional information relating to the Company are available on SEDAR+ at www.sedarplus.ca and EDGAR at www.sec.gov. Certain notes to the Financial Statements are specifically referred to in this MD&A and such notes are incorporated by reference herein. All dollar amounts in this MD&A are in millions of United States dollars (“$” or “US$”), unless otherwise specified.
For the purposes of preparing our MD&A, we consider the materiality of information. Information is considered material if: (i) such information results in, or would reasonably be expected to result in, a significant change in the market price or value of our shares; (ii) there is a substantial likelihood that a reasonable investor would consider it important in making an investment decision; or (iii) it would significantly alter the total mix of information available to investors. We evaluate materiality with reference to all relevant circumstances, including potential market sensitivity.
Abbreviations
|
|
|
|
|
|
|
|
| AISC |
All-in Sustaining Costs |
| ARK |
Agbarabo-Rhino-Kombokolo |
|
|
|
|
|
|
|
|
| BNL |
Barrick Niugini Limited |
|
|
|
|
|
|
| CCV |
Critical Control Verifications |
|
|
|
|
|
|
|
|
|
|
|
|
|
|
| COS |
Cost of Sales |
|
|
| DRC |
Democratic Republic of Congo |
|
|
|
|
|
|
|
|
|
|
|
|
|
|
|
|
|
|
|
|
|
|
|
|
|
|
| G&A |
General and administrative |
|
|
| GHG |
Greenhouse Gas |
|
|
| GoT |
Government of Tanzania |
|
|
|
|
| IASB |
International Accounting Standards Board |
| ICMM |
International Council on Mining and Metals |
| ICSID |
International Centre for the Settlement of Investment Disputes |
| IFRS |
IFRS Accounting Standards as issued by the International Accounting Standards Board |
|
|
|
|
|
|
|
|
|
|
|
|
| KCD |
Karagba, Chauffeur and Durba |
|
|
|
|
|
|
|
|
|
|
| Ktpa |
Thousand tonnes per annum |
| Lb |
Pound |
| LME |
London Metal Exchange |
| LTI |
Lost Time Injury |
|
|
|
|
|
|
| LTIFR |
Lost Time Injury Frequency Rate |
|
|
|
|
|
|
|
|
|
|
| Mtpa |
Million tonnes per annum |
|
|
| MW |
Megawatt |
|
|
| NGM |
Nevada Gold Mines |
|
|
| OECD |
Organisation for Economic Co-operation and Development |
| Oz |
Ounce |
|
|
|
|
|
|
| PJL |
Porgera Jersey Limited |
| PNG |
Papua New Guinea |
|
|
| Randgold |
Randgold Resources Limited |
|
|
|
|
|
|
|
|
|
|
|
|
|
|
|
|
| SOKIMO |
Société Minière de Kilo-Moto SARL |
| TCC |
Total Cash Costs |
| TRIFR |
Total Recordable Injury Frequency Rate |
|
|
| TSF |
Tailings Storage Facilities |
|
|
|
|
|
|
|
|
|
|
|
|
|
|
| UN SDG |
United Nations Sustainable Development Goals |
| VAT |
Value-Added Tax |
|
|
| WGC |
World Gold Council |
| WTI |
West Texas Intermediate |
| YTD |
Year to date June 30 |
|
|
|
|
|
|
|
|
|
BARRICK SECOND QUARTER 2025 |
1 |
MANAGEMENT'S DISCUSSION AND ANALYSIS |
Cautionary Statement on Forward-Looking Information
Certain information contained or incorporated by reference in this MD&A, including any information as to our strategy, projects, plans or future financial or operating performance, constitutes “forward-looking statements”. All statements, other than statements of historical fact, are forward-looking statements. The words “believe”, “expect”, “anticipated”, “aim”, “strategy”, “ramp up”, “target”, “plan”, “opportunities”, “guidance”, “forecast”, “outlook”, “project”, “develop”, “progress”, “continue”, “temporary”, “committed”, “estimate”, “potential”, “prospective”, “future”, “focus”, “ongoing”, “following”, “subject to”, “scheduled”, “may”, “will”, “can”, “could”, “would”, “should” and similar expressions identify forward-looking statements. In particular, this MD&A contains forward-looking statements including, without limitation, with respect to: Barrick’s forward-looking production and cost guidance, including our ability to meet our 2025 guidance; anticipated production growth from Barrick’s organic project pipeline and reserve replacement; estimates of future cost of sales per ounce for gold and per pound for copper, total cash costs per ounce and C1 cash costs per pound, and all-in sustaining costs per ounce/pound; cash flow forecasts; projected capital, operating and exploration expenditures; the share buyback program and performance dividend policy; mine life and production rates; anticipated benefits from the sale of the Donlin Gold project; anticipated timing for development of the Goldrush Project; our plans, timelines, and expected completion and benefits of our growth projects, including the Goldrush Project, Fourmile, Ren, Pueblo Viejo Expansion project, Veladero Phase 8 Leach Pad, Reko Diq, solar power project at Kibali, and the Lumwana Super Pit Expansion; anticipated production at Goldrush, Ren, Reko Diq and Lumwana; timing for first production from the Lumwana Super Pit Expansion; capital expenditures related to upgrades and ongoing management initiatives; Barrick’s global exploration strategy and planned exploration activities; Barrick’s copper strategy; the status of negotiations with the Government of Mali in respect of ongoing disputes regarding the Loulo-Gounkoto Complex, including the outcome of dispute resolution through arbitration; the resumption of operations and the temporary nature of the provisional administration and transfer of operational control to an external administrator at Loulo-Gounkoto; our pipeline of high confidence projects at or near existing operations; our ability to identify new Tier One assets and the potential for existing assets to attain Tier One status, including Fourmile; the incorporation of Fourmile into the NGM joint venture at fair market value; potential mineralization and metal or mineral recoveries; our ability to convert resources into reserves and future reserve replacement; asset sales, joint ventures and partnerships; Barrick’s strategy, plans, targets and goals in respect of sustainability issues, including climate change, greenhouse gas (“GHG”) emissions reduction targets, safety performance, community development, and responsible water use; and expectations regarding future price assumptions, financial performance and other outlook or guidance.
Forward-looking statements are necessarily based upon a number of estimates and assumptions including material estimates and assumptions related to the factors set forth below that, while considered reasonable by the Company as at the date of this MD&A in light of
management’s experience and perception of current conditions and expected developments, are inherently subject to significant business, economic and competitive uncertainties and contingencies. Known and unknown factors could cause actual results to differ materially from those projected in the forward-looking statements and undue reliance should not be placed on such statements and information. Such factors include, but are not limited to: fluctuations in the spot and forward price of gold, copper or certain other commodities (such as silver, diesel fuel, natural gas and electricity); risks associated with projects in the early stages of evaluation and for which additional engineering and other analysis is required; risks related to the possibility that future exploration results will not be consistent with the Company’s expectations, that quantities or grades of reserves will be diminished, and that resources may not be converted to reserves; risks associated with the fact that certain of the initiatives described in this MD&A are still in the early stages and may not materialize; changes in mineral production performance, exploitation and exploration successes; risks that exploration data may be incomplete and considerable additional work may be required to complete further evaluation, including but not limited to drilling, engineering and socioeconomic studies and investment; the speculative nature of mineral exploration and development; lack of certainty with respect to foreign legal systems, corruption and other factors that are inconsistent with the rule of law; changes in national and local government legislation, taxation, controls or regulations and/or changes in the administration of laws, policies and practices, including the expropriation or nationalization of property and political or economic developments in Canada, the United States, Mali or other countries in which Barrick does or may carry on business in the future; risks relating to political instability in certain of the jurisdictions in which Barrick operates; timing of receipt of, or failure to comply with, necessary permits and approvals; non-renewal of key licenses by governmental authorities; failure to comply with environmental and health and safety laws and regulations; increased costs and physical and transition risks related to climate change, including extreme weather events, resource shortages, emerging policies and increased regulations relating to related to GHG emission levels, energy efficiency and reporting of risks; the Company's ability to achieve its sustainability goals, including its climate-related goals and GHG emissions reduction targets, in particular its ability to achieve its Scope 3 emissions targets which require reliance on entities within Barrick's value chain, but outside of the Company's direct control, to achieve such targets within the specified time frames; contests over title to properties, particularly title to undeveloped properties, or over access to water, power and other required infrastructure; the liability associated with risks and hazards in the mining industry, and the ability to maintain insurance to cover such losses; damage to the Company’s reputation due to the actual or perceived occurrence of any number of events, including negative publicity with respect to the Company’s handling of environmental matters or dealings with community groups, whether true or not; risks related to operations near communities that may regard Barrick’s operations as being detrimental to them; litigation and legal and administrative proceedings; operating or technical
|
|
|
|
|
|
|
|
|
BARRICK SECOND QUARTER 2025 |
2 |
MANAGEMENT'S DISCUSSION AND ANALYSIS |
difficulties in connection with mining or development activities, including geotechnical challenges, tailings dam and storage facilities failures, and disruptions in the maintenance or provision of required infrastructure and information technology systems; increased costs, delays, suspensions and technical challenges associated with the construction of capital projects; risks associated with working with partners in jointly controlled assets; risks related to disruption of supply routes which may cause delays in construction and mining activities, including disruptions in the supply of key mining inputs due to the invasion of Ukraine by Russia and conflicts in the Middle East; risk of loss due to acts of war, terrorism, sabotage and civil disturbances; risks associated with artisanal and illegal mining; risks associated with Barrick’s infrastructure, information technology systems and the implementation of Barrick’s technological initiatives, including risks related to cybersecurity incidents, including those caused by computer viruses, malware, ransomware and other cyberattacks, or similar information technology system failures, delays and/or disruptions; the impact of global liquidity and credit availability on the timing of cash flows and the values of assets and liabilities based on projected future cash flows; the impact of inflation, including global inflationary pressures driven by ongoing global supply chain disruptions, global energy cost increases following the invasion of Ukraine by Russia and country-specific political and economic factors in Argentina; adverse changes in our credit ratings; fluctuations in the currency markets; changes in U.S. dollar interest rates; changes in U.S. trade, tariff and other controls on imports and exports, tax, immigration or other policies that may impact relations with foreign countries, result in retaliatory policies, lead to increased costs for raw materials and components, or impact Barrick’s existing operations and material growth projects; risks arising from holding derivative instruments (such as credit risk, market liquidity risk and mark-to-market risk); risks related to the demands placed on the Company’s management, the ability of management to implement its business strategy and enhanced political risk in certain
jurisdictions; uncertainty whether some or all of Barrick’s targeted investments and projects will meet the Company’s capital allocation objectives and internal hurdle rate; whether benefits expected from recent transactions are realized; business opportunities that may be presented to, or pursued by, the Company; our ability to successfully integrate acquisitions or complete divestitures; risks related to competition in the mining industry; employee relations including loss of key employees; availability and increased costs associated with mining inputs and labor; risks associated with diseases, epidemics and pandemics; risks related to the failure of internal controls; and risks related to the impairment of the Company’s goodwill and assets.
In addition, there are risks and hazards associated with the business of mineral exploration, development and mining, including environmental hazards, industrial accidents, unusual or unexpected formations, pressures, cave-ins, flooding and gold bullion, copper cathode or gold or copper concentrate losses (and the risk of inadequate insurance, or inability to obtain insurance, to cover these risks).
Many of these uncertainties and contingencies can affect our actual results and could cause actual results to differ materially from those expressed or implied in any forward-looking statements made by, or on behalf of, us. Readers are cautioned that forward-looking statements are not guarantees of future performance. All of the forward-looking statements made in this MD&A are qualified by these cautionary statements. Specific reference is made to the most recent Form 40-F/Annual Information Form on file with the SEC and Canadian provincial securities regulatory authorities for a more detailed discussion of some of the factors underlying forward-looking statements and the risks that may affect Barrick’s ability to achieve the expectations set forth in the forward-looking statements contained in this MD&A. We disclaim any intention or obligation to update or revise any forward-looking statements whether as a result of new information, future events or otherwise, except as required by applicable law.
|
|
|
|
|
|
|
|
|
BARRICK SECOND QUARTER 2025 |
3 |
MANAGEMENT'S DISCUSSION AND ANALYSIS |
Use of Non-GAAP Financial Measures
We use the following non-GAAP financial measures and ratios in our MD&A:
■"adjusted net earnings"
■"free cash flow"
■"EBITDA"
■"adjusted EBITDA"
■"attributable EBITDA"
■“attributable EBITDA margin”
■“net leverage”
■"minesite sustaining capital expenditures"
■"project capital expenditures"
■"TCC/oz"
■"C1 cash costs/lb"
■"AISC per oz/lb" and
■"realized price per oz/lb"
For a detailed description of each of the non-GAAP financial measures used in this MD&A and a detailed reconciliation to the most directly comparable measure under IFRS, please refer to the Non-GAAP Financial Measures section of this MD&A on pages 44 to 59. Each non-GAAP financial measure has been annotated with a reference to an endnote on page 60. The non-GAAP financial measures set out in this MD&A are intended to provide additional information to investors and do not have any standardized meaning under IFRS, and therefore may not be comparable to other issuers, and should not be considered in isolation or as a substitute for measures of performance prepared in accordance with IFRS.
Index
|
|
|
|
|
|
|
|
|
|
Overview |
|
|
|
|
|
Financial and Operating Highlights |
|
|
Key Business Developments |
|
|
Sustainability |
|
|
Outlook |
|
|
|
|
|
|
|
Operating Performance |
|
|
|
|
|
Nevada Gold Mines |
|
|
Carlin |
|
|
Cortez |
|
|
Turquoise Ridge |
|
|
|
|
|
Pueblo Viejo |
|
|
|
|
|
Kibali |
|
|
|
|
|
|
|
|
North Mara |
|
|
Bulyanhulu |
|
|
Other Mines - Gold |
|
|
Lumwana |
|
|
Other Mines - Copper |
|
|
|
|
Growth Projects |
|
|
|
|
Exploration and Mineral Resource Management |
|
|
|
|
Review of Financial Results |
|
|
|
|
|
Revenue |
|
|
Production Costs |
|
|
|
|
|
General and Administrative Expenses |
|
|
Exploration, Evaluation and Project Expenses |
|
|
Finance Costs, Net |
|
|
Additional Statement of Income Items |
|
|
Income Tax Expense |
|
|
|
|
Financial Condition Review |
|
|
|
|
|
Balance Sheet Review |
|
|
|
|
|
Financial Position and Liquidity |
|
|
Summary of Cash Inflow (Outflow) |
|
|
|
|
|
|
|
|
|
|
|
|
|
|
|
|
|
|
|
|
|
|
|
|
|
|
|
|
|
|
|
|
|
|
|
|
|
|
|
|
Commitments and Contingencies |
|
|
|
|
Review of Quarterly Results |
|
|
|
|
Internal Control over Financial Reporting and
Disclosure Controls and Procedures |
|
|
|
|
IFRS Critical Accounting Policies and Accounting Estimates |
|
|
|
|
Non-GAAP Financial Measures |
|
|
|
|
Technical Information |
|
|
|
|
Endnotes |
|
|
|
|
Financial Statements |
|
|
|
|
Notes to Consolidated Financial Statements |
|
|
|
|
|
|
|
|
|
BARRICK SECOND QUARTER 2025 |
4 |
MANAGEMENT'S DISCUSSION AND ANALYSIS |
Overview
Financial and Operating Highlights
|
|
|
|
|
|
|
|
|
|
|
|
|
|
|
|
|
|
|
|
|
|
|
|
|
|
|
|
|
|
|
|
|
|
For the three months ended |
|
For the six months ended |
| |
6/30/25 |
3/31/25 |
% Change |
|
6/30/24 |
% Change |
|
6/30/25 |
6/30/24 |
% Change |
Financial Results ($ millions) |
|
|
|
|
|
|
|
|
|
|
| Revenues |
3,681 |
3,130 |
18 |
% |
|
3,162 |
16 |
% |
|
6,811 |
5,909 |
15 |
% |
| Cost of sales |
1,878 |
1,785 |
5 |
% |
|
1,979 |
(5) |
% |
|
3,663 |
3,915 |
(6) |
% |
Net earningsa |
811 |
474 |
71 |
% |
|
370 |
119 |
% |
|
1,285 |
665 |
93 |
% |
Adjusted net earningsb |
800 |
603 |
33 |
% |
|
557 |
44 |
% |
|
1,403 |
890 |
58 |
% |
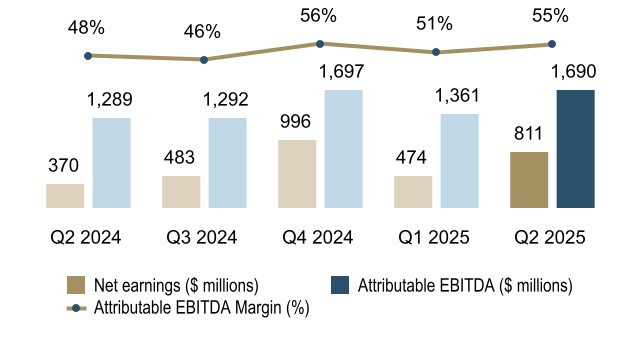
Attributable EBITDAb |
1,690 |
1,361 |
24 |
% |
|
1,289 |
31 |
% |
|
3,051 |
2,196 |
39 |
% |
Attributable EBITDA marginb |
55 |
% |
51 |
% |
8 |
% |
|
48 |
% |
15 |
% |
|
53 |
% |
45 |
% |
18 |
% |
Minesite sustaining capital expendituresb,c |
479 |
564 |
(15) |
% |
|
631 |
(24) |
% |
|
1,043 |
1,181 |
(12) |
% |
Project capital expendituresb,c |
439 |
269 |
63 |
% |
|
176 |
149 |
% |
|
708 |
341 |
108 |
% |
Total consolidated capital expendituresc,d |
934 |
837 |
12 |
% |
|
819 |
14 |
% |
|
1,771 |
1,547 |
14 |
% |
Total attributable capital expenditurese |
717 |
631 |
14 |
% |
|
694 |
3 |
% |
|
1,348 |
1,266 |
6 |
% |
| Net cash provided by operating activities |
1,329 |
1,212 |
10 |
% |
|
1,159 |
15 |
% |
|
2,541 |
1,919 |
32 |
% |
Net cash provided by operating activities marginf |
36 |
% |
39 |
% |
(8) |
% |
|
37 |
% |
(3) |
% |
|
37 |
% |
32 |
% |
16 |
% |
Free cash flowb |
395 |
375 |
5 |
% |
|
340 |
16 |
% |
|
770 |
372 |
107 |
% |
| Net earnings per share (basic and diluted) |
0.47 |
0.27 |
74 |
% |
|
0.21 |
124 |
% |
|
0.75 |
0.38 |
97 |
% |
Adjusted net earnings (basic)b per share |
0.47 |
0.35 |
34 |
% |
|
0.32 |
47 |
% |
|
0.82 |
0.51 |
61 |
% |
| Weighted average diluted common shares (millions of shares) |
1,716 |
1,725 |
(1) |
% |
|
1,755 |
(2) |
% |
|
1,721 |
1,755 |
(2) |
% |
| Operating Results |
|
|
|
|
|
|
|
|
|
|
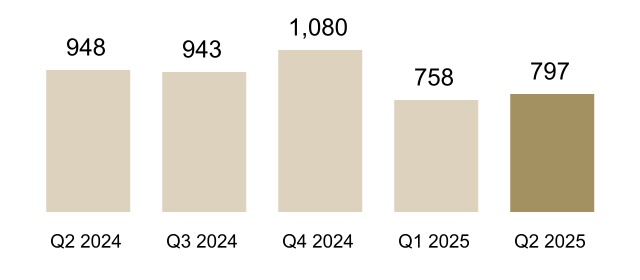
Gold production (thousands of ounces)g |
797 |
758 |
5 |
% |
|
948 |
(16) |
% |
|
1,555 |
1,888 |
(18) |
% |
Gold sold (thousands of ounces)g |
770 |
751 |
3 |
% |
|
956 |
(19) |
% |
|
1,521 |
1,866 |
(18) |
% |
| Market gold price ($/oz) |
3,280 |
2,860 |
15 |
% |
|
2,338 |
40 |
% |
|
3,067 |
2,203 |
39 |
% |
Realized gold priceb,g ($/oz) |
3,295 |
2,898 |
14 |
% |
|
2,344 |
41 |
% |
|
3,099 |
2,213 |
40 |
% |
Gold COS (Barrick’s share)g,h ($/oz) |
1,654 |
1,629 |
2 |
% |
|
1,441 |
15 |
% |
|
1,641 |
1,433 |
15 |
% |
Gold TCCb,g ($/oz) |
1,239 |
1,220 |
2 |
% |
|
1,059 |
17 |
% |
|
1,229 |
1,055 |
16 |
% |
Gold AISCb,g ($/oz) |
1,684 |
1,775 |
(5) |
% |
|
1,498 |
12 |
% |
|
1,728 |
1,489 |
16 |
% |
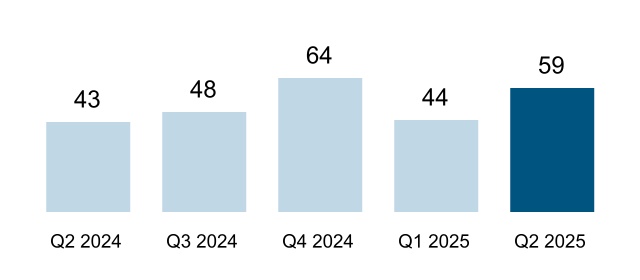
Copper production (thousands of tonnes)g |
59 |
44 |
34 |
% |
|
43 |
37 |
% |
|
103 |
83 |
24 |
% |
Copper sold (thousands of tonnes)g |
54 |
51 |
6 |
% |
|
42 |
29 |
% |
|
105 |
81 |
30 |
% |
| Market copper price ($/lb) |
4.32 |
4.24 |
2 |
% |
|
4.42 |
(2) |
% |
|
4.28 |
4.12 |
4 |
% |
Realized copper priceb,g ($/lb) |
4.36 |
4.51 |
(3) |
% |
|
4.53 |
(4) |
% |
|
4.43 |
4.21 |
5 |
% |
Copper COS (Barrick’s share)g,i ($/lb) |
2.56 |
2.92 |
(12) |
% |
|
3.05 |
(16) |
% |
|
2.74 |
3.12 |
(12) |
% |
Copper C1 cash costsb,g ($/lb) |
1.80 |
2.25 |
(20) |
% |
|
2.18 |
(17) |
% |
|
2.02 |
2.28 |
(11) |
% |
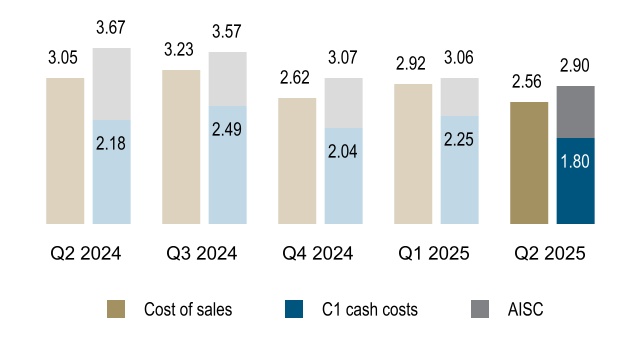
Copper AISCb,g ($/lb) |
2.90 |
3.06 |
(5) |
% |
|
3.67 |
(21) |
% |
|
2.98 |
3.64 |
(18) |
% |
|
|
|
|
|
|
|
|
|
|
|
| |
As at 6/30/25 |
As at 3/31/25 |
% Change |
|
As at 6/30/24 |
% Change |
|
|
|
|
Financial Position ($ millions) |
|
|
|
|
|
|
|
|
|
|
| Debt (current and long-term) |
4,729 |
4,727 |
0 |
% |
|
4,724 |
0 |
% |
|
|
|
|
| Cash and equivalents |
4,802 |
4,104 |
17 |
% |
|
4,036 |
19 |
% |
|
|
|
|
|
|
|
|
|
|
|
|
|
|
|
|
|
|
|
|
|
|
|
|
|
|
| Debt, net of cash |
(73) |
623 |
(112) |
% |
|
688 |
(111) |
% |
|
|
|
|
a.Net earnings represents net earnings attributable to the equity holders of the Company.
b.Further information on these non-GAAP financial measures, including detailed reconciliations, is included on pages 44 to 59 of this MD&A.
c.Amounts presented on a consolidated cash basis. Project capital expenditures are not included in our calculation of AISC.
d.Total consolidated capital expenditures also includes capitalized interest of $16 million and $20 million for Q2 2025 and YTD 2025, respectively (Q1 2025: $4 million; Q2 2024: $12 million; YTD 2024: $25 million).
e.These amounts are presented on the same basis as our guidance.
f.Represents net cash provided by operating activities divided by revenue.
g.On an attributable basis.
h.Gold COS/oz is calculated as cost of sales across our gold operations (excluding sites in closure or care and maintenance) divided by ounces sold (both on an attributable basis using Barrick's ownership share).
i.Copper COS/lb is calculated as cost of sales across our copper operations divided by pounds sold (both on an attributable basis using Barrick's ownership share).
|
|
|
|
|
|
|
|
|
BARRICK SECOND QUARTER 2025 |
5 |
MANAGEMENT'S DISCUSSION AND ANALYSIS |
|
|
|
|
|
|
GOLD PRODUCTIONa (thousands of ounces) |
COPPER PRODUCTIONa (thousands of tonnes) |
|
|
|
|
|
|
GOLD COST OF SALESb, TOTAL CASH COSTSc, |
COPPER COST OF SALESb, C1 CASH COSTSc, |
AND ALL-IN SUSTAINING COSTSc ($ per ounce) |
AND ALL-IN SUSTAINING COSTSc ($ per pound) |
|
|
|
|
|
|
NET EARNINGS, ATTRIBUTABLE EBITDAc |
CAPITAL EXPENDITURESc,d
|
AND ATTRIBUTABLE EBITDA MARGINc |
($ millions) |
|
|
|
|
|
|
|
|
OPERATING CASH FLOW AND FREE CASH FLOWc |
RETURNS TO SHAREHOLDERSe ($ millions) |
a.On an attributable basis.
b.Gold COS/oz is calculated as cost of sales across our gold operations (excluding sites in closure or care and maintenance) divided by ounces sold (both on an attributable basis using Barrick's ownership share). Copper COS/lb is calculated as cost of sales across our copper operations divided by pounds sold (both on an attributable basis using Barrick's ownership share). Refer to endnote 2 for further details.
c.Further information on these non-GAAP financial measures, including detailed reconciliations, is included on pages 44 to 59 of this MD&A.
d.Capital expenditures also includes capitalized interest.
e.Dividends declared are inclusive of performance dividends.
|
|
|
|
|
|
|
|
|
BARRICK SECOND QUARTER 2025 |
6 |
MANAGEMENT'S DISCUSSION AND ANALYSIS |
Factors affecting net earnings and adjusted net earnings1 - Q2 2025 versus Q1 2025
The higher realized gold price1 was the primary driver of our Q2 2025 results performance relative to Q1 2025. Although unit costs were marginally higher due to the positive correlation between royalties and higher prices, almost all of the benefit of the higher price was delivered to the bottom line.
Net earnings and adjusted net earnings1 attributable to equity holders of Barrick ("net earnings") for Q2 2025 were $811 million and $800 million, respectively, compared to $474 million and $603 million, respectively in Q1 2025. The primary drivers of the increase were higher realized gold prices1, increased gold sales volumes, and lower copper COS/lb2. This was partially offset by higher gold COS/oz2.
After adjusting for items that are not indicative of future operating earnings, adjusted net earnings1 of $800 million for Q2 2025 was $197 million higher than Q1 2025. Q2 2025 realized gold prices1 were 14% higher when compared to Q1 2025. The increase in gold sales volumes was mainly as a result of planned shutdowns at Carlin, Pueblo Viejo and Kibali that occurred in the prior quarter. Copper COS/lb2 was lower compared to Q1 2025, primarily driven by lower unit costs at Lumwana due to the impact of higher grades processed and higher capitalised waste stripping. Higher gold COS/oz2 was mainly driven by higher costs at Cortez due to higher tonnes shipped and processed at Carlin and increased processing costs at the Gold Quarry roaster due to the planned shutdown, combined with changes in the sales mix across the portfolio.
Factors affecting net earnings and adjusted net earnings1 - Q2 2025 versus Q2 2024
Net earnings and adjusted net earnings1 for Q2 2025 were $811 million and $800 million, respectively, compared to $370 million and $557 million, respectively in Q2 2024. The primary drivers of the increase were higher realized gold prices1 and lower copper COS/lb2, partially offset by lower gold sales volumes and higher gold COS/oz2. Q2 2025 realized gold prices1 were 41% higher when compared to Q2 2024. Lower copper COS/lb2 resulted from higher grades processed driving greater fixed cost dilution at Lumwana. The decrease in gold sales volume was primarily as a result of the temporary suspension of operations at Loulo-Gounkoto, which was subsequently placed under a temporary provisional administration on June 16, 2025. This was combined with lower production at Carlin resulting from the planned shutdown at the Gold Quarry roaster. The increase in gold COS/oz2 was mainly due to the impact of less fixed cost dilution driven by lower throughput and to a lesser extent lower grades processed at a number of operations, combined with higher royalties (impact approximately $25/oz) associated with the higher realized gold price1.
Factors affecting net earnings and adjusted net earnings1 - YTD 2025 versus YTD 2024
Net earnings and adjusted net earnings1 for YTD 2025 were $1,285 million and $1,403 million, respectively, up from $665 million and $890 million in YTD 2024. The primary drivers of the increase were higher realized gold prices1 and lower copper COS/lb2, partially offset by lower gold sales volumes, and higher gold COS/oz2. YTD 2025 realized gold prices1 were 40% higher when compared to YTD 2024 while the decrease in copper COS/lb2 was mainly due to higher grades processed at Lumwana. The lower gold sales volume was primarily driven by the temporary suspension of operations at Loulo-Gounkoto, which was subsequently placed under a temporary provisional administration on June 16, 2025. This was combined with lower production at Carlin as a result of a decrease in underground tonnes mined, lower grades mined and lower recoveries at the autoclave. The increase in gold COS/oz2 compared to YTD 2024 was primarily due to the impact of less fixed cost dilution driven by lower throughput and to a lesser extent lower grades processed at a number of operations, combined with higher royalties (impact approximately $30/oz) associated with the higher realized gold price1.
Significant adjusting items for both Q2 2025 and YTD 2025 include:
■acquisition/disposition losses of $289 million for both Q2 2025 and YTD 2025, mainly relating to the $1,035 million net loss on the deconsolidation of Loulo-Gounkoto following the change of control after it was placed under a temporary provisional administration on June 16, 2025 (refer to page 8 for further details), partially offset by the recognition of our investment in Loulo-Gounkoto. This was offset by a gain of $745 million on the sale of our 50% interest in the Donlin Gold project; and ■other expense adjustments of $44 million and $217 million, respectively, which mainly related to reduced operations costs at Loulo-Gounkoto prior to June 16, 2025. YTD 2025 was further impacted by the signing of agreements to settle legacy legal matters in the Philippines related to Placer Dome Inc. (refer to note 17 of the Financial Statements for further details).
Refer to page 45 for a full list of reconciling items between net earnings and adjusted net earnings1 for the current and previous periods.
1Numerical annotations throughout the text of this document refer to the endnotes found starting on page 60.
|
|
|
|
|
|
|
|
|
BARRICK SECOND QUARTER 2025 |
7 |
MANAGEMENT'S DISCUSSION AND ANALYSIS |
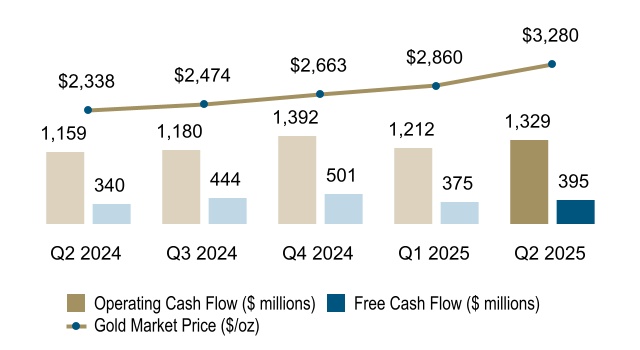
Factors affecting Operating Cash Flow and Free Cash Flow1 - Q2 2025 versus Q1 2025
The cash flow outcomes for Q2 2025 reflect the strong earnings delivery and would have been even higher if not for a temporary working capital increase as discussed below. The second quarter is typically our lowest from a cash generation perspective given the timing of our largest tax payments coincides with the semi-annual coupon payments on our public market debt in the second quarter. Our two key growth projects remain on track and at current copper prices, the Lumwana expansion is self funding. We also accelerated our share buy back program with $268 million for the quarter bringing the total over the last 12 months to $860 million. Finally, we ended the quarter in a net cash position resulting in the payment of a performance dividend in relation to the second quarter, further enhancing our returns to shareholders.
In Q2 2025, we generated $1,329 million in operating cash flow, compared to $1,212 million in Q1 2025. The increase of $117 million was primarily due to higher realized gold prices, increased gold sales volumes, and lower copper C1 cash costs/lb1. This was partially offset by higher gold TCC/oz1. Operating cash flow was further impacted by a favorable movement in working capital, mainly in accounts payable and inventory, partially offset by an unfavorable movement in accounts receivable. The increase in accounts receivable mainly relates to our mines in Tanzania and Zambia where sales occurred at the end of the quarter with the receipt of the cash early in Q3. These results were also impacted by an increase in cash taxes paid and higher interest paid as a result of the timing of semi-annual interest payments on our bonds, which primarily occur in the second and fourth quarters.
In Q2 2025, we recorded free cash flow1 of $395 million, compared to $375 million in Q1 2025, mainly reflecting operating cash flows as explained above partially offset by higher capital expenditures. In Q2 2025, capital expenditures on a cash basis were $934 million compared to $837 million in Q1 2025, as discussed on page 40.
Factors affecting Operating Cash Flow and Free Cash Flow1 - Q2 2025 versus Q2 2024
In Q2 2025, we generated $1,329 million in operating cash flow, compared to $1,159 million in Q2 2024. The increase of $170 million was primarily due to higher realized gold prices1 and lower copper C1 cash costs/lb1. This was partially offset by lower gold sales volumes and higher gold TCC/oz1. These results were partially offset by higher cash taxes paid and an unfavorable movement in working capital, mainly in accounts receivable, partially offset by a favorable movement in other current liabilities. The increase in accounts receivable mainly relates to our mines in Tanzania and Zambia where sales were delayed to the end of the quarter with the receipt of the cash occurring early in Q3.
In Q2 2025, we generated free cash flow1 of $395 million compared to $340 million in Q2 2024. The increase primarily reflects higher operating cash flows as explained above, partially offset by higher capital expenditures. In Q2 2025, capital expenditures on a cash basis were $934 million compared to $819 million in the second quarter of 2024, as discussed on page 41.
Factors affecting Operating Cash Flow and Free Cash Flow1 - YTD 2025 versus YTD 2024
For YTD 2025, we generated $2,541 million in operating cash flow, compared to $1,919 million in YTD 2024. The increase of $622 million was primarily due to higher realized gold prices1, and lower C1 cash costs/lb1, partially offset by lower gold sales volumes and higher TCC/oz1. This was combined with an unfavorable change in working capital mainly in accounts receivable, partially offset by a favorable movement in other current liabilities and accounts payable. The increase in accounts receivable mainly relates to our mines in Tanzania and Zambia where sales were delayed to the end of the quarter with the receipt of the cash occurring early in Q3. These impacts were partially offset by higher cash taxes paid.
For YTD 2025, we generated free cash flow1 of $770 million compared to $372 million in YTD 2024. The increase of $398 million primarily reflects higher operating cash flows as explained above, partially offset by higher capital expenditures. In YTD 2025, capital expenditures on a cash basis were $1,771 million compared to $1,547 million in YTD 2024, as discussed on page 41.
Key Business Developments
Loulo-Gounkoto Mining Conventions Dispute
The Company and the Government of Mali have been engaged in an ongoing dispute in connection with the existing mining conventions of Société des Mines de Loulo SA (“Somilo”) and Société des Mines de Gounkoto (“Gounkoto”) (together, the “Conventions”).
On December 18, 2024, after multiple good faith attempts to resolve the dispute, Somilo and Gounkoto submitted a request for arbitration to ICSID in accordance with the provisions of their respective Conventions. On January 14, 2025, due to the restrictions imposed by the Government of Mali on gold shipments, the Company announced that the Loulo-Gounkoto complex would temporarily suspend operations.
On June 16, 2025, the Bamako Commercial Tribunal placed Loulo-Gounkoto under a temporary provisional administration. While Barrick retains its 80% legal ownership of the mine, operational control has been transferred to an external administrator. As a result of this loss of control event, the assets, liabilities and non-controlling interest of Loulo-Gounkoto were deconsolidated and derecognized and a retained investment was recognized at fair value.
For more information, refer to notes 16 and 17 of the Financial Statements.
Donlin Sale
On April 22, 2025, Barrick announced it had entered into an agreement to sell its 50% interest in the Donlin Gold project located in Alaska, USA to affiliates of Paulson Advisers LLC and NOVAGOLD Resources Inc. (“NOVAGOLD”) for total cash consideration of $1 billion. In addition, Barrick has granted NOVAGOLD an option to purchase the outstanding debt owed to Barrick (value of $160 million as at June 30, 2025 and presented in Other Assets) in connection with the Donlin Gold project for $90 million if purchased prior to closing (which was not exercised), or for $100 million if purchased within 18 months from closing, when the option expires. If that option is not exercised, the debt will remain outstanding, substantially in accordance with its existing terms which would largely defer repayment to the
|
|
|
|
|
|
|
|
|
BARRICK SECOND QUARTER 2025 |
8 |
MANAGEMENT'S DISCUSSION AND ANALYSIS |
commencement of production.
The transaction closed on June 3, 2025 and we recognized a gain on sale of $745 million in Q2 2025. In addition, NOVAGOLD retains the option to purchase the outstanding debt for $100 million within 18 months from closing.
Alturas Sale
On August 8, 2025, Barrick announced that it has reached an agreement to sell the Alturas Project in Chile to a subsidiary of Boroo Pte Ltd (Singapore) (“Boroo”) for an up-front cash payment of $50 million. In addition, Barrick will be granted a 0.5% net smelter return royalty on gold and silver produced from the Project, which will terminate once 2 million ounces of gold and gold-equivalent have been produced. Boroo may repurchase the royalty within four years from closing for $10 million. The transaction is expected to be completed within Q3 2025 subject to customary closing conditions being satisfied.
Name and Ticker Change
At the Company’s Annual and Special Meeting of Shareholders on May 6, 2025, Barrick's shareholders approved the change of the Company's corporate name from Barrick Gold Corporation to Barrick Mining Corporation, which was made effective on that date. In addition, as of May 9, 2025, Barrick’s ticker on the New York Stock Exchange changed to “B” from “GOLD”, better reflecting Barrick’s current business and our mission to achieve sustainable and profitable gold and copper growth. Barrick’s ticker on the TSX will remain unchanged.
Board of Directors Changes
Also at the Company’s Annual and Special Meeting of Shareholders on May 6, 2025, two new independent directors were elected to the Board of Directors: Ben van Beurden and Pekka Vauramo. They replace Christopher Coleman and Andrew Quinn who have retired from the Board.
At the August 8, 2025 meeting, the Board of Directors appointed Ben van Beurden as Lead Director, succeeding Brett Harvey who continues to serve on the Board as an independent director. Mr. van Beurden, former CEO of Shell, brings nearly four decades of global leadership in the energy and natural resource sectors.
Share Buyback Program
At the February 11, 2025 meeting, the Board of Directors authorized a new share buyback program for the purchase of up to $1 billion of Barrick’s outstanding common shares over the next 12 months. Barrick repurchased $268 million of shares in Q2 2025 and $143 million of shares in Q1 2025, bringing the YTD 2025 to $411 million purchased under this share buyback program.
The actual number of common shares that may be purchased, and the timing of any such purchases, will be determined by Barrick based on a number of factors, including the Company’s financial performance, the availability of cash flows, and the consideration of other uses of cash, including capital investment opportunities, returns to shareholders, and debt reduction.
The repurchase program does not obligate the Company to acquire any particular number of common shares, and the repurchase program may be suspended or discontinued at any time at the Company’s discretion.
Sustainability
Sustainability, including our license to operate, is entrenched in our DNA: our sustainability strategy is our business plan. Please refer to page 13 of our fourth quarter and full year 2024 MD&A for a full description of governance, strategy, risk management and targets. Key updates for 2025 are summarized below:
We reiterate our steadfast dedication to the health and safety of our employees and contractors, their families, and the communities in which we operate, encapsulating our safety vision of "Every person going home safe and healthy every day." The ongoing efforts of our "Journey to Zero" initiative continues to make significant strides.
The tracking and reporting on leading indicators continues at all sites, with a key focus on completing our CCVs before tasks and implementing corrective actions where identified. These serve as proactive measures, quantifying prevention efforts and anticipating incidents before they occur.
During the quarter, we undertook over 36,000 CCVs across the group. The group recorded a TRIFR3 of 0.57 during the quarter, a 18% improvement from the previous quarter, and an LTIFR3 of 0.08.
Barrick continues to roll out its climate risk assessments, the Barrick Biodiversity Residual Impact Assessment tool, and development of community based socio-economic metrics aligned to the UN SDGs across all sites, as published in our annual Sustainability Report for 2024. The report included the forecasting of Barrick’s GHG emissions in line with its expansion projects and increased production outlook towards the end of the decade, along with associated revised GHG targets.
During Q2 2025, the Group's total Scope 1 and 2 (location-based) GHG emissions were 1,815 kt CO2-e. Absolute emissions are trending in line with 2024, however emissions have increased on a relative basis compared to 2024 as 2024 emissions included the continued operation of Loulo-Gounkoto.
Following its disclosure of all extreme and very high consequence classified TSFs in August 2023, Barrick disclosed its remaining TSFs as per the Global Industry Standard on Tailings Management. Notably, Barrick has brought a total of 13 TSFs into Safe Closure designation. The TSF disclosures are available on Barrick’s website and are not incorporated by reference into, and are not a part of, this MD&A.
|
|
|
|
|
|
|
|
|
|
|
|
|
|
|
For the three months ended |
|
|
6/30/2025a |
3/31/2025a |
6/30/24 |
|
|
LTIFR3 |
0.08 |
0.10 |
0.16 |
|
|
TRIFR3 |
0.57 |
0.71 |
0.84 |
|
|
| Community Development Spend ($ millions) |
15 |
15 |
10 |
|
|
Class 14 Environmental Incidents |
0 |
0 |
0 |
|
|
GHG Scope 1 and 2 emissions (kt CO2-e) (location based) |
1,815 |
1,890 |
1,730 |
|
|
| Water Recycling and Reuse Rate |
83 |
% |
82 |
% |
85 |
% |
|
|
|
|
|
|
|
|
|
|
|
|
|
|
a.Data presented is provisional data and is subject to change as a result of external assurance during annual reporting.
|
|
|
|
|
|
|
|
|
BARRICK SECOND QUARTER 2025 |
9 |
MANAGEMENT'S DISCUSSION AND ANALYSIS |
Full Year 2025 Outlook
As a result of the temporary suspension of operations at Loulo-Gounkoto in January, Loulo-Gounkoto was excluded from our 2025 production guidance at the time it was issued in February (refer to page 8 for more information). The following commentary is therefore exclusive of Loulo-Gounkoto. We continue to expect our 2025 gold production to be in the range of 3.15 to 3.50 million ounces. We expect Pueblo Viejo, Turquoise Ridge, Porgera and Kibali to deliver higher year-over-year performances, together with stable delivery across Carlin and Cortez. At Veladero and Phoenix, we expect 2025 production to be lower than 2024.
Across the four quarters of 2025, as previously indicated the Company’s gold production is expected to be the lowest in Q1 and highest in Q4 due to the timing of shutdowns, the Goldrush ramp-up and mine sequencing across the NGM sites, the 35 day shutdown for de-bottlenecking work needed at Pueblo Viejo in Q1 as previously disclosed, and grade variability at Kibali driven by the mine plan. This trend is partially offset by Veladero and North Mara where production is slightly weighted to the first half of the year. This is expected to result in an approximately 46% / 54% split of the Company’s total gold production between the first half and second half of the year, respectively.
Our 2025 gold cost guidance remains unchanged, including COS/oz2 of $1,460 to $1,560, TCC/oz1 of $1,050 to $1,130 and AISC/oz1 of $1,460 to $1,560 (all based on a gold price assumption of $2,400/oz). We have previously disclosed a sensitivity of $5/oz on our 2025 gold cost guidance metrics for every $100/oz change in the gold price which is driven by higher royalties. On the basis of this sensitivity, and given that the gold price has averaged closer to $3,000/oz for the first six months of the 2025 year, the above mentioned cost guidance ranges would increase by $30/oz if this average holds for the remainder of the year. Aside from this impact, we are on track to achieve our 2025 gold cost guidance metrics.
We expect 2025 copper production to be in the range of 200 to 230 thousand tonnes. As previously indicated, production is expected to be more evenly spread over the last three quarters with Q1 being the lowest quarter of the year mainly driven by grade at Lumwana as per the mine plan. We are on track to achieve our copper cost guidance metrics for 2025, which are based on a LME copper price assumption of $4.00/lb. We have previously disclosed a sensitivity of $0.01/lb on our 2025 copper cost guidance metrics for every $0.25/lb change in the copper price which is driven by higher royalties. On the basis of this sensitivity, if for example the copper price were to average $4.75/lb for the year, the copper all-in sustaining cost1 guidance range would increase by $0.03/lb (note royalties are excluded from C1 cash costs1).
Further detail on our 2025 company guidance is provided below and on the next page, inclusive of the key assumptions that were used as the basis for this guidance as released on February 11, 2025 and as qualified by the comments above.
|
|
|
|
|
|
Company Guidance ($ millions, except per oz/lb data) |
2025
Estimate |
| Gold production (millions of ounces) |
3.15 - 3.50 |
| Gold cost metrics |
|
| COS - gold ($/oz) |
1,460 - 1,560 |
TCC ($/oz)a |
1,050 - 1,130 |
| Depreciation ($/oz) |
370 - 400 |
AISC ($/oz)a |
1,460 - 1,560 |
| Copper production (thousands of tonnes) |
200 - 230 |
| Copper cost metrics |
|
| COS - copper ($/lb) |
2.50 - 2.80 |
C1 cash costs ($/lb)a |
1.80 - 2.10 |
| Depreciation ($/lb) |
0.75 - 0.85 |
AISC ($/lb)a |
2.80 - 3.10 |
| Exploration and project expenses |
330 - 370 |
| Exploration and evaluation |
220 - 240 |
| Project expenses |
110 - 130 |
| General and administrative expenses |
~160 |
| Corporate administration |
~120 |
Share-based compensationb |
~40 |
|
|
| Other expense |
70 - 90 |
| Finance costs, net |
270 - 310 |
| Attributable capital expenditures: |
|
Attributable minesite sustaininga |
1,400 - 1,650 |
Attributable projecta |
1,700 - 1,950 |
| Total attributable capital expenditures |
3,100 - 3,600 |
Effective income tax ratec |
26% - 30% |
| Key assumptions (used for guidance) |
| Gold Price ($/oz) |
2,400 |
|
| Copper Price ($/lb) |
4.00 |
|
| Oil Price (WTI) ($/barrel) |
80 |
|
| AUD Exchange Rate (AUD:USD) |
0.75 |
|
| ARS Exchange Rate (USD:ARS) |
1,000 |
|
| CAD Exchange Rate (USD:CAD) |
1.30 |
|
| CLP Exchange Rate (USD:CLP) |
900 |
|
| EUR Exchange Rate (EUR:USD) |
1.10 |
|
|
|
a.Further information on these non-GAAP financial measures, including detailed reconciliations, is included on pages 44 to 59 of this MD&A.
b.Based on a one-month trailing average ending December 31, 2024 of US$16.39 per share.
c.Based on key assumptions included in this table.
|
|
|
|
|
|
|
|
|
BARRICK SECOND QUARTER 2025 |
10 |
MANAGEMENT'S DISCUSSION AND ANALYSIS |
Operating Division Guidance
Our 2025 forecast gold and copper production, COSa, TCCb, AISCb, and C1 cash costsb ranges by operating division were originally released on February 12, 2025 as follows:
|
|
|
|
|
|
|
|
|
|
|
|
|
|
|
| Operating Division |
2025 forecast attributable production (koz) |
2025 forecast COSa ($/oz) |
2025 forecast TCCb ($/oz) |
2025 forecast AISCb ($/oz) |
| Gold |
|
|
|
|
| Carlin (61.5%) |
705 - 785 |
1,470 - 1,570 |
1,140 - 1,220 |
1,630 - 1,730 |
Cortez (61.5%)c |
420 - 470 |
1,420 - 1,520 |
1,050 - 1,130 |
1,370 - 1,470 |
Turquoise Ridge (61.5%) |
310 - 345 |
1,370 - 1,470 |
1,000 - 1,080 |
1,260 - 1,360 |
| Phoenix (61.5%) |
85 - 105 |
2,070 - 2,170 |
890 - 970 |
1,240 - 1,340 |
|
|
|
|
|
Nevada Gold Mines (61.5%) |
1,540 - 1,700 |
1,470 - 1,570 |
1,070 - 1,150 |
1,460 - 1,560 |
Hemlo |
140 - 160 |
1,500 - 1,600 |
1,200 - 1,280 |
1,600 - 1,700 |
| North America |
1,680 - 1,860 |
1,470 - 1,570 |
1,080 - 1,160 |
1,480 - 1,580 |
|
|
|
|
|
Pueblo Viejo (60%) |
370 - 410 |
1,540 - 1,640 |
910 - 990 |
1,280 - 1,380 |
Veladero (50%) |
190 - 220 |
1,390 - 1,490 |
890 - 970 |
1,570 - 1,670 |
| Porgera (24.5%) |
70 - 95 |
1,510 - 1,610 |
1,210 - 1,290 |
1,770 - 1,870 |
|
|
|
|
|
| Latin America & Asia Pacific |
630 - 730 |
1,490 - 1,590 |
940 - 1,020 |
1,430 - 1,530 |
|
|
|
|
|
Loulo-Gounkoto (80%)d |
— |
— |
— |
— |
Kibali (45%) |
310 - 340 |
1,280 - 1,380 |
940 - 1,020 |
1,130 - 1,230 |
| North Mara (84%) |
230 - 260 |
1,370 - 1,470 |
1,020 - 1,100 |
1,400 - 1,500 |
| Bulyanhulu (84%) |
150 - 180 |
1,470 - 1,570 |
1,010 - 1,090 |
1,540 - 1,640 |
| Tongon (89.7%) |
110 - 140 |
1,790 - 1,890 |
1,570 - 1,650 |
1,660 - 1,760 |
|
|
|
|
|
| Africa & Middle East |
820 - 910 |
1,420 - 1,520 |
1,060 - 1,140 |
1,360 - 1,460 |
|
|
|
|
|
Total Attributable to Barricke,f,g |
3,150 - 3,500 |
1,460 - 1,560 |
1,050 - 1,130 |
1,460 - 1,560 |
|
|
|
|
|
| |
2025 forecast attributable production (kt) |
2025 forecast COSa ($/lb) |
2025 forecast C1 cash costsb ($/lb) |
2025 forecast AISCb ($/lb) |
| Copper |
|
|
|
|
| Lumwana |
125 - 155 |
2.30 - 2.60 |
1.60 - 1.90 |
2.80 - 3.10 |
| Zaldívar (50%) |
40 - 45 |
3.60 - 3.90 |
2.70 - 3.00 |
3.50 - 3.80 |
| Jabal Sayid (50%) |
25 - 35 |
2.00 - 2.30 |
1.60 - 1.90 |
1.80 - 2.10 |
Total Copperg |
200 - 230 |
2.50 - 2.80 |
1.80 - 2.10 |
2.80 - 3.10 |
a.Gold COS/oz is calculated as cost of sales across our gold operations (excluding sites in closure or care and maintenance) divided by ounces sold (both on an attributable basis using Barrick's ownership share). Copper COS/lb is calculated as cost of sales across our copper operations divided by pounds sold (both on an attributable basis using Barrick's ownership share).
b.Further information on these non-GAAP financial measures, including detailed reconciliations, is included on pages 44 to 59 of this MD&A.
c.Includes Goldrush.
d.As a result of the temporary suspension of operations at Loulo-Gounkoto in January, Loulo-Gounkoto was excluded from our 2025 production guidance at the time it was issued in February (refer to page 8 for more information). e.TCC/oz and AISC/oz include costs allocated to non-operating sites.
f.Operating division guidance ranges reflect expectations at each individual operating division and may not add up to the company-wide guidance range total.
g.Includes corporate administration costs.
|
|
|
|
|
|
|
|
|
BARRICK SECOND QUARTER 2025 |
11 |
MANAGEMENT'S DISCUSSION AND ANALYSIS |
Operating Performance
Our presentation of reportable operating segments consists of eight gold mines (Carlin, Cortez, Turquoise Ridge, Pueblo Viejo, Loulo-Gounkoto, Kibali, North Mara and Bulyanhulu) and one copper mine (Lumwana). Starting with this MD&A, the discussion on Loulo-Gounkoto is being presented in the “Other Mines - Gold” section as no operating or per ounce data is provided as a result of the temporary suspension of operations starting January 14, 2025, and subsequent loss of control on June 16, 2025.
The remaining operating segments, including our remaining gold and copper mines, have been grouped into an “Other Mines” category and will not be reported on individually. Segment performance is evaluated based on a number of measures including operating income before tax, production levels and unit production costs. Certain costs are managed on a consolidated basis and are therefore not reflected in segment income.
Nevada Gold Mines (61.5%)a, Nevada, USA
Summary of Operating and Financial Data
|
|
|
|
|
|
|
|
|
|
|
|
|
|
|
|
|
|
|
|
|
|
|
|
|
|
|
|
|
|
|
|
|
|
|
For the three months ended |
|
For the six months ended |
| |
6/30/25 |
3/31/25 |
% Change |
|
6/30/24 |
% Change |
|
6/30/25 |
6/30/24 |
% Change |
| Total tonnes mined (000s) |
37,304 |
36,961 |
1 |
% |
|
41,810 |
(11) |
% |
|
74,265 |
81,492 |
(9) |
% |
| Open pit ore |
3,988 |
3,974 |
0 |
% |
|
4,915 |
(19) |
% |
|
7,962 |
10,111 |
(21) |
% |
| Open pit waste |
31,724 |
31,534 |
1 |
% |
|
35,431 |
(10) |
% |
|
63,258 |
68,439 |
(8) |
% |
| Underground |
1,592 |
1,453 |
10 |
% |
|
1,464 |
9 |
% |
|
3,045 |
2,942 |
4 |
% |
| Average grade (grams/tonne) |
|
|
|
|
|
|
|
|
|
|
| Open pit mined |
0.96 |
0.98 |
(2) |
% |
|
0.90 |
7 |
% |
|
0.97 |
0.91 |
7 |
% |
| Underground mined |
8.16 |
7.62 |
7 |
% |
|
8.61 |
(5) |
% |
|
7.91 |
8.45 |
(6) |
% |
| Processed |
2.97 |
2.51 |
18 |
% |
|
2.63 |
13 |
% |
|
2.73 |
2.57 |
6 |
% |
| Ore tonnes processed (000s) |
5,941 |
6,143 |
(3) |
% |
|
6,446 |
(8) |
% |
|
12,084 |
13,225 |
(9) |
% |
| Oxide mill |
1,847 |
1,880 |
(2) |
% |
|
2,177 |
(15) |
% |
|
3,727 |
4,290 |
(13) |
% |
| Roaster |
1,362 |
1,126 |
21 |
% |
|
1,301 |
5 |
% |
|
2,488 |
2,695 |
(8) |
% |
| Autoclave |
929 |
1,098 |
(15) |
% |
|
1,167 |
(20) |
% |
|
2,027 |
2,234 |
(9) |
% |
| Heap leach |
1,803 |
2,039 |
(12) |
% |
|
1,801 |
0 |
% |
|
3,842 |
4,006 |
(4) |
% |
| Recovery rate |
82 |
% |
82 |
% |
0 |
% |
|
83 |
% |
(1) |
% |
|
82 |
% |
83 |
% |
(1) |
% |
| Oxide Mill |
79 |
% |
77 |
% |
3 |
% |
|
78 |
% |
1 |
% |
|
78 |
% |
79 |
% |
(1) |
% |
| Roaster |
86 |
% |
85 |
% |
1 |
% |
|
86 |
% |
0 |
% |
|
85 |
% |
85 |
% |
0 |
% |
| Autoclave |
77 |
% |
81 |
% |
(5) |
% |
|
80 |
% |
(4) |
% |
|
79 |
% |
80 |
% |
(1) |
% |
| Gold produced (000s oz) |
381 |
342 |
11 |
% |
|
401 |
(5) |
% |
|
723 |
821 |
(12) |
% |
| Oxide mill |
77 |
72 |
7 |
% |
|
72 |
7 |
% |
|
149 |
157 |
(5) |
% |
| Roaster |
212 |
172 |
23 |
% |
|
216 |
(2) |
% |
|
384 |
424 |
(9) |
% |
| Autoclave |
82 |
86 |
(5) |
% |
|
91 |
(10) |
% |
|
168 |
179 |
(6) |
% |
| Heap leach |
10 |
12 |
(17) |
% |
|
22 |
(55) |
% |
|
22 |
61 |
(64) |
% |
| Gold sold (000s oz) |
376 |
345 |
9 |
% |
|
400 |
(6) |
% |
|
721 |
824 |
(13) |
% |
| Revenue ($ millions) |
1,272 |
1,030 |
23 |
% |
|
967 |
32 |
% |
|
2,302 |
1,884 |
22 |
% |
| Cost of sales ($ millions) |
637 |
570 |
12 |
% |
|
592 |
8 |
% |
|
1,207 |
1,204 |
0 |
% |
|
|
|
|
|
|
|
|
|
|
|
|
|
|
|
|
|
|
|
|
|
|
| Income ($ millions) |
624 |
453 |
38 |
% |
|
363 |
72 |
% |
|
1,077 |
659 |
63 |
% |
EBITDA ($ millions)b,c |
742 |
566 |
31 |
% |
|
484 |
53 |
% |
|
1,308 |
912 |
43 |
% |
EBITDA margind |
58 |
% |
55 |
% |
5 |
% |
|
50 |
% |
16 |
% |
|
57 |
% |
48 |
% |
19 |
% |
Capital expenditures ($ millions)e |
201 |
257 |
(22) |
% |
|
234 |
(14) |
% |
|
458 |
454 |
1 |
% |
Minesite sustainingb |
151 |
209 |
(28) |
% |
|
199 |
(24) |
% |
|
360 |
383 |
(6) |
% |
Projectb |
48 |
48 |
0 |
% |
|
34 |
41 |
% |
|
96 |
68 |
41 |
% |
| COS ($/oz) |
1,685 |
1,643 |
3 |
% |
|
1,464 |
15 |
% |
|
1,665 |
1,447 |
15 |
% |
TCC ($/oz)b |
1,319 |
1,269 |
4 |
% |
|
1,104 |
19 |
% |
|
1,295 |
1,092 |
19 |
% |
AISC ($/oz)b |
1,749 |
1,899 |
(8) |
% |
|
1,636 |
7 |
% |
|
1,821 |
1,585 |
15 |
% |
|
|
|
|
|
|
|
|
|
|
|
|
|
|
|
|
|
|
|
|
|
|
|
|
|
|
|
|
|
|
|
|
|
a.Barrick is the operator of NGM and owns 61.5%, with Newmont Corporation owning the remaining 38.5%. NGM is accounted for as a subsidiary with a 38.5% non-controlling interest. These results represent our 61.5% interest in Carlin, Cortez, Turquoise Ridge and Phoenix.
b.Further information on these non-GAAP financial measures, including detailed reconciliations, is included on pages 44 to 59 of this MD&A.
c.EBITDA represents income less depreciation. Depreciation expense is $118 million and $231 million for Q2 2025 and YTD 2025, respectively (Q1 2025: $113 million, Q2 2024: $121 million, YTD 2024: $253 million).
d.Represents EBITDA divided by revenue.
e.Includes capitalized interest.
NGM includes Carlin, Cortez, Turquoise Ridge, Phoenix and non-mine site related activity such as the TS Solar Project. Barrick is the operator of the joint venture and owns 61.5%, with Newmont owning the remaining 38.5%. Refer to pages 13 to 18 and 27 for a detailed discussion of each minesite's results.
|
|
|
|
|
|
|
|
|
BARRICK SECOND QUARTER 2025 |
12 |
MANAGEMENT'S DISCUSSION AND ANALYSIS |
Carlin (61.5%), Nevada, USA
Summary of Operating and Financial Data
|
|
|
|
|
|
|
|
|
|
|
|
|
|
|
|
|
|
|
|
|
|
|
|
|
|
|
|
|
|
|
|
|
|
For the three months ended |
|
For the six months ended |
| |
6/30/25 |
3/31/25 |
% Change |
|
6/30/24 |
% Change |
|
6/30/25 |
6/30/24 |
% Change |
| Total tonnes mined (000s) |
16,042 |
16,710 |
(4) |
% |
|
17,282 |
(7) |
% |
|
32,752 |
31,310 |
5 |
% |
| Open pit ore |
378 |
128 |
195 |
% |
|
627 |
(40) |
% |
|
506 |
1,217 |
(58) |
% |
| Open pit waste |
14,814 |
15,786 |
(6) |
% |
|
15,801 |
(6) |
% |
|
30,600 |
28,393 |
8 |
% |
| Underground |
850 |
796 |
7 |
% |
|
854 |
0 |
% |
|
1,646 |
1,700 |
(3) |
% |
| Average grade (grams/tonne) |
|
|
|
|
|
|
|
|
|
|
| Open pit mined |
1.38 |
1.30 |
6 |
% |
|
1.67 |
(17) |
% |
|
1.36 |
1.80 |
(24) |
% |
| Underground mined |
7.28 |
7.27 |
0 |
% |
|
7.92 |
(8) |
% |
|
7.27 |
7.72 |
(6) |
% |
| Processed |
4.50 |
3.97 |
13 |
% |
|
4.19 |
7 |
% |
|
4.24 |
4.11 |
3 |
% |
| Ore tonnes processed (000s) |
1,432 |
1,377 |
4 |
% |
|
1,739 |
(18) |
% |
|
2,809 |
3,608 |
(22) |
% |
|
|
|
|
|
|
|
|
|
|
|
| Roasters |
1,049 |
860 |
22 |
% |
|
1,131 |
(7) |
% |
|
1,909 |
2,351 |
(19) |
% |
| Autoclave |
305 |
499 |
(39) |
% |
|
608 |
(50) |
% |
|
804 |
1,257 |
(36) |
% |
| Heap leach |
78 |
18 |
333 |
% |
|
0 |
100 |
% |
|
96 |
0 |
100 |
% |
| Recovery rate |
81 |
% |
81 |
% |
0 |
% |
|
82 |
% |
(1) |
% |
|
81 |
% |
82 |
% |
(1) |
% |
| Roasters |
85 |
% |
84 |
% |
1 |
% |
|
85 |
% |
0 |
% |
|
84 |
% |
84 |
% |
0 |
% |
| Autoclave |
43 |
% |
67 |
% |
(36) |
% |
|
68 |
% |
(37) |
% |
|
56 |
% |
70 |
% |
(20) |
% |
| Gold produced (000s oz) |
170 |
145 |
17 |
% |
|
202 |
(16) |
% |
|
315 |
407 |
(23) |
% |
|
|
|
|
|
|
|
|
|
|
|
| Roasters |
157 |
125 |
26 |
% |
|
173 |
(9) |
% |
|
282 |
342 |
(18) |
% |
| Autoclave |
10 |
16 |
(38) |
% |
|
23 |
(57) |
% |
|
26 |
53 |
(51) |
% |
| Heap leach |
3 |
4 |
(25) |
% |
|
6 |
(50) |
% |
|
7 |
12 |
(42) |
% |
| Gold sold (000s oz) |
166 |
142 |
17 |
% |
|
202 |
(18) |
% |
|
308 |
409 |
(25) |
% |
| Revenue ($ millions) |
552 |
417 |
32 |
% |
|
474 |
16 |
% |
|
969 |
912 |
6 |
% |
| Cost of sales ($ millions) |
264 |
246 |
7 |
% |
|
283 |
(7) |
% |
|
510 |
571 |
(11) |
% |
| Income ($ millions) |
285 |
168 |
70 |
% |
|
187 |
52 |
% |
|
453 |
334 |
36 |
% |
EBITDA ($ millions)a,b |
327 |
206 |
59 |
% |
|
236 |
39 |
% |
|
533 |
434 |
23 |
% |
EBITDA marginc |
59 |
% |
49 |
% |
20 |
% |
|
50 |
% |
18 |
% |
|
55 |
% |
48 |
% |
15 |
% |
Capital expenditures ($ millions)d |
98 |
174 |
(44) |
% |
|
135 |
(27) |
% |
|
272 |
255 |
7 |
% |
Minesite sustaininga |
78 |
156 |
(50) |
% |
|
130 |
(40) |
% |
|
234 |
243 |
(4) |
% |
Projecta |
18 |
18 |
0 |
% |
|
5 |
260 |
% |
|
36 |
12 |
200 |
% |
| COS ($/oz) |
1,589 |
1,720 |
(8) |
% |
|
1,390 |
14 |
% |
|
1,649 |
1,380 |
19 |
% |
TCC ($/oz)a |
1,330 |
1,459 |
(9) |
% |
|
1,145 |
16 |
% |
|
1,390 |
1,136 |
22 |
% |
AISC ($/oz)a |
1,826 |
2,570 |
(29) |
% |
|
1,805 |
1 |
% |
|
2,169 |
1,745 |
24 |
% |
|
|
|
|
|
|
|
|
|
|
|
a.Further information on these non-GAAP financial measures, including detailed reconciliations, is included on pages 44 to 59 of this MD&A.
b.EBITDA represents income less depreciation. Depreciation expense is $42 million and $80 million for Q2 2025 and YTD 2025, respectively (Q1 2025: $38 million, Q2 2024: $49 million, YTD 2024: $100 million).
c.Represents EBITDA divided by revenue.
d.Includes capitalized interest.
Safety and Environment
|
|
|
|
|
|
|
|
|
|
|
| For the three months ended |
|
|
6/30/25 |
3/31/25 |
|
|
| LTI |
0 |
0 |
|
|
LTIFR3 |
0.00 |
0.00 |
|
|
TRIFR3 |
0.80 |
1.66 |
|
|
Class 14 environmental incidents |
0 |
0 |
|
|
Financial Results
Q2 2025 compared to Q1 2025
Underground mining across the Carlin operations continued its progressive improvement journey delivering higher grades versus Q1 and open pit mining continued to track well on both costs and tonnes. The focus for H2 remains on the continued improvement in underground efficiencies and stability in the Gold Quarry roaster and Goldstrike autoclave. In line with our expectations and as previously
guided, we continue to expect Carlin’s production to be higher in the second half and production to be within the guidance range for 2025.
Gold production in Q2 2025 was 17% higher compared to Q1 2025 primarily due to higher plant availability following the planned shutdown that occurred at the Goldstrike roaster in Q1 2025, combined with a 13% increase in the average grade processed driven by higher ore tonnes mined from the underground operations. This was partially offset by less Carlin material processed at the autoclave as Cortez refractory ore was processed instead to the overall benefit of NGM in addition to the planned shutdown at the Gold Quarry roaster early in Q2 2025.
COS/oz2 and TCC/oz1 in Q2 2025 were 8% and 9% lower, respectively, than Q1 2025, which mainly reflected higher fixed cost dilution driven by the higher sales volumes. In Q2 2025, AISC/oz1 was 29% lower than Q1
|
|
|
|
|
|
|
|
|
BARRICK SECOND QUARTER 2025 |
13 |
MANAGEMENT'S DISCUSSION AND ANALYSIS |
2025, driven by lower TCC/oz1, combined with lower minesite sustaining capital expenditures1.
Capital expenditures decreased by 44% compared to Q1 2025 mainly due to lower minesite sustaining capital expenditures1 as the Komatsu-930 truck fleet deliveries were finalized in Q1 2025 and lower open pit waste stripping.
Q2 2025 compared to Q2 2024
Gold production for Q2 2025 was 16% lower than Q2 2024, primarily due to the planned shutdown at the Gold Quarry roaster, combined with less Carlin material processed at the autoclave as Cortez refractory ore was processed instead to the overall benefit of NGM, as described above.
COS/oz2 and TCC/oz1 for Q2 2025 were 14% and 16% higher, respectively, than Q2 2024, primarily due to higher maintenance costs associated with the Gold Quarry roaster planned shutdown and lower fixed cost dilution driven by the lower sales volumes. This was partially offset by lower open pit mining costs resulting from the operation of the new Komatsu-930 truck fleet which has delivered higher availability and lower fleet maintenance costs. For Q2 2025, AISC/oz1 was in line with Q2 2024 as higher TCC/oz1 was offset by lower minesite sustaining capital expenditures1.
Capital expenditures were 27% lower than Q2 2024, mainly due to lower minesite sustaining capital expenditures1 driven by purchases of the Komatsu-930 truck fleet occurring in Q2 2024 and lower open pit waste stripping. Project capital expenditures1 increased due to the advancement and continuation of the Ren project.
YTD 2025 compared to YTD 2024
Gold production for YTD 2025 was 23% lower than YTD 2024, mainly due to a decrease in underground tonnes mined, lower grades mined and lower recoveries at the autoclave. This was further impacted by a higher proportion of higher-grade Cortez refractory ore processed at the Carlin roasters compared to YTD 2024 which displaced lower-grade Carlin feed (noting that overall production for NGM was maximized as a result of these ore movements between the two sites).
COS/oz2 and TCC/oz1 for YTD 2025 were 19% and 22% higher, respectively, than YTD 2024, primarily due to lower tonnes processed and lower recoveries at the autoclave, and lower fixed cost dilution driven by the lower sales volumes, partially offset by lower open pit mining costs resulting from the operation of the new Komatsu-930 truck fleet which has delivered higher availability and lower fleet maintenance costs. For YTD 2025, AISC/oz1 were 24% higher than YTD 2024, mainly due to higher TCC/oz1 and higher minesite sustaining capital expenditures1 on a per ounce basis.
Capital expenditures were 7% higher than YTD 2024 driven by higher project capital expenditures1 relating to the continuation of the vent shaft and declines associated with the Ren project, partially offset by lower minesite sustaining capital expenditures1 primarily due to the purchase of the Komatsu-930 truck fleet occurring in YTD 2024 and lower open pit waste stripping.
|
|
|
|
|
|
|
|
|
BARRICK SECOND QUARTER 2025 |
14 |
MANAGEMENT'S DISCUSSION AND ANALYSIS |
Cortez (61.5%), Nevada, USA
Summary of Operating and Financial Data
|
|
|
|
|
|
|
|
|
|
|
|
|
|
|
|
|
|
|
|
|
|
|
|
|
|
|
|
|
|
|
|
|
|
For the three months ended |
|
For the six months ended |
| |
6/30/25 |
3/31/25 |
% Change |
|
6/30/24 |
% Change |
|
6/30/25 |
6/30/24 |
% Change |
| Total tonnes mined (000s) |
14,639 |
14,397 |
2 |
% |
|
17,471 |
(16) |
% |
|
29,036 |
36,229 |
(20) |
% |
| Open pit ore |
1,092 |
1,391 |
(21) |
% |
|
1,253 |
(13) |
% |
|
2,483 |
3,076 |
(19) |
% |
| Open pit waste |
13,019 |
12,550 |
4 |
% |
|
15,794 |
(18) |
% |
|
25,569 |
32,310 |
(21) |
% |
| Underground |
528 |
456 |
16 |
% |
|
424 |
25 |
% |
|
984 |
843 |
17 |
% |
| Average grade (grams/tonne) |
|
|
|
|
|
|
|
|
|
|
| Open pit mined |
0.99 |
1.14 |
(13) |
% |
|
0.89 |
11 |
% |
|
1.08 |
0.82 |
32 |
% |
| Underground mined |
7.88 |
6.37 |
24 |
% |
|
8.51 |
(7) |
% |
|
7.20 |
8.63 |
(17) |
% |
| Processed |
2.69 |
1.87 |
44 |
% |
|
2.05 |
31 |
% |
|
2.25 |
1.94 |
16 |
% |
| Ore tonnes processed (000s) |
1,553 |
1,782 |
(13) |
% |
|
1,756 |
(12) |
% |
|
3,335 |
3,778 |
(12) |
% |
| Oxide mill |
455 |
526 |
(13) |
% |
|
669 |
(32) |
% |
|
981 |
1,270 |
(23) |
% |
| Roasters |
313 |
266 |
18 |
% |
|
170 |
84 |
% |
|
579 |
344 |
68 |
% |
| Autoclave |
128 |
13 |
885 |
% |
|
n/a |
100 |
% |
|
141 |
n/a |
100 |
% |
| Heap leach |
657 |
977 |
(33) |
% |
|
917 |
(28) |
% |
|
1,634 |
2,164 |
(24) |
% |
| Recovery rate |
82 |
% |
85 |
% |
(4) |
% |
|
83 |
% |
(1) |
% |
|
83 |
% |
83 |
% |
0 |
% |
| Oxide Mill |
82 |
% |
82 |
% |
0 |
% |
|
79 |
% |
4 |
% |
|
82 |
% |
79 |
% |
4 |
% |
| Roasters |
89 |
% |
87 |
% |
2 |
% |
|
88 |
% |
1 |
% |
|
88 |
% |
89 |
% |
(1) |
% |
|
|
|
|
|
|
|
|
|
|
|
| Autoclave |
46 |
% |
52 |
% |
(12) |
% |
|
n/a |
n/a |
|
46 |
% |
n/a |
n/a |
| Gold produced (000s oz) |
108 |
92 |
17 |
% |
|
102 |
6 |
% |
|
200 |
221 |
(10) |
% |
| Oxide Mill |
45 |
37 |
22 |
% |
|
45 |
0 |
% |
|
82 |
94 |
(13) |
% |
| Roasters |
55 |
46 |
20 |
% |
|
42 |
31 |
% |
|
101 |
80 |
26 |
% |
| Autoclave |
1 |
1 |
0 |
% |
|
n/a |
100 |
% |
|
2 |
n/a |
100 |
% |
| Heap leach |
7 |
8 |
(13) |
% |
|
15 |
(53) |
% |
|
15 |
47 |
(68) |
% |
| Gold sold (000s oz) |
107 |
96 |
11 |
% |
|
101 |
6 |
% |
|
203 |
222 |
(9) |
% |
| Revenue ($ millions) |
356 |
281 |
27 |
% |
|
237 |
50 |
% |
|
637 |
491 |
30 |
% |
| Cost of sales ($ millions) |
181 |
148 |
22 |
% |
|
138 |
31 |
% |
|
329 |
298 |
10 |
% |
| Income ($ millions) |
173 |
131 |
32 |
% |
|
96 |
80 |
% |
|
304 |
188 |
62 |
% |
EBITDA ($ millions)a,b |
211 |
166 |
27 |
% |
|
131 |
61 |
% |
|
377 |
269 |
40 |
% |
EBITDA marginc |
59 |
% |
59 |
% |
0 |
% |
|
55 |
% |
7 |
% |
|
59 |
% |
55 |
% |
7 |
% |
| Capital expenditures ($ millions) |
75 |
60 |
25 |
% |
|
62 |
21 |
% |
|
135 |
126 |
7 |
% |
Minesite sustaininga |
45 |
32 |
41 |
% |
|
39 |
15 |
% |
|
77 |
84 |
(8) |
% |
Projecta |
30 |
28 |
7 |
% |
|
23 |
30 |
% |
|
58 |
42 |
38 |
% |
| COS ($/oz) |
1,687 |
1,541 |
9 |
% |
|
1,366 |
23 |
% |
|
1,618 |
1,346 |
20 |
% |
TCC ($/oz)a |
1,326 |
1,172 |
13 |
% |
|
1,013 |
31 |
% |
|
1,253 |
976 |
28 |
% |
AISC ($/oz)a |
1,774 |
1,536 |
15 |
% |
|
1,447 |
23 |
% |
|
1,662 |
1,389 |
20 |
% |
|
|
|
|
|
|
|
|
|
|
|
a.Further information on these non-GAAP financial measures, including detailed reconciliations, is included on pages 44 to 59 of this MD&A.
b.EBITDA represents income less depreciation. Depreciation expense is $38 million and $73 million for Q2 2025 and YTD 2025, respectively (Q1 2025: $35 million, Q2 2024: $35 million, YTD 2024: $81 million).
c.Represents EBITDA divided by revenue.
Safety and Environment
|
|
|
|
|
|
|
|
|
|
|
| For the three months ended |
|
|
6/30/25 |
3/31/25 |
|
|
| LTI |
0 |
0 |
|
|
LTIFR3 |
0.00 |
0.00 |
|
|
TRIFR3 |
0.88 |
0.00 |
|
|
Class 14 environmental incidents |
0 |
0 |
|
|
Financial Results
Q2 2025 compared to Q1 2025
Underground delivery at Cortez made a step change in Q2 to offset the lower planned open pit material. The Goldrush ramp-up continued to progress, while Cortez Hills underground successfully transitioned to self-perform on
development. With the continued ramp-up of the Goldrush underground and high grade ore from Cortez Pits Phase 1 as mining ends in Q4, we continue to expect a strong second half from Cortez and to be comfortably within the production guidance for 2025.
Gold production in Q2 2025 was 17% higher than Q1 2025, primarily driven by an increase in underground ore processed at the Carlin roasters, the Carlin autoclave and at the oxide mill combined with higher underground grades mined. This was partially offset by a 21% decrease in open pit ore and a 13% decrease in open pit grade mined, consistent with the planned mining sequence. The combined impact of the above resulted in a significant increase in the average grade processed.
|
|
|
|
|
|
|
|
|
BARRICK SECOND QUARTER 2025 |
15 |
MANAGEMENT'S DISCUSSION AND ANALYSIS |
COS/oz2 and TCC/oz1 in Q2 2025 were 9% and 13% higher, respectively, than Q1 2025, primarily reflecting the higher tonnes shipped and processed at Carlin and increased processing costs at the Gold Quarry roaster due to the planned shutdown that occurred in April 2025. In Q2 2025, AISC/oz1 was 15% higher than Q1 2025, driven by higher TCC/oz1, combined with higher minesite sustaining capital expenditures1.
Capital expenditures in Q2 2025 were 25% higher than Q1 2025, resulting from increased minesite sustaining capital expenditures1 primarily due to higher waste stripping at Crossroads Phase 6, while project capital expenditures1 increased by 7% in Q2 2025 as the ramp-up at Goldrush continues.
Q2 2025 compared to Q2 2024
Gold production for Q2 2025 was 6% higher than Q2 2024, primarily driven by increased underground ore processed at the Carlin roasters, the Carlin autoclave and at the oxide mill, combined with higher underground grades mined driving an increase in the average grade processed. This was partially offset by a 13% decrease in open pit ore mined, consistent with the planned mining sequence.
COS/oz2 and TCC/oz1 for Q2 2025 were 23% and 31% higher, respectively, than Q2 2024, reflecting a higher proportion of higher cost refractory ounces processed at the Carlin roasters and autoclave, and increased roaster costs resulting from the Gold Quarry planned shutdown that occurred in April 2025. For Q2 2025, AISC/oz1 was 23% higher than Q2 2024, driven by higher TCC/oz1, combined with higher minesite sustaining capital expenditures1.
Capital expenditures in Q2 2025 were 21% higher than Q2 2024, largely due to higher project capital expenditures1 as the ramp-up at Goldrush continues and higher sustaining capital expenditures1 for additional support equipment.
YTD 2025 compared to YTD 2024
Gold production for YTD 2025 was 10% lower than YTD 2024 resulting from lower underground grades mined in line with the mine sequence. This resulted in lower grade oxide ore processed at the oxide mill and a decrease in tonnes placed on the leach pad. This was partially offset by an increase in refractory ore shipped and processed at the Carlin roasters and autoclave.
COS/oz2 and TCC/oz1 for YTD 2025 were 20% and 28% higher, respectively, than YTD 2024, reflecting lower fixed cost dilution driven by the lower sales volumes, combined with a higher proportion of higher-cost refractory ounces processed at Carlin in the sales mix. For YTD 2025, AISC/oz1 increased by 20% compared to YTD 2024, due to higher TCC/oz1, partially offset by lower minesite sustaining capital expenditures1 on a per ounce basis.
Capital expenditures for YTD 2025 were 7% higher than YTD 2024, due to an increase in project capital expenditures1 as the ramp-up continues at Goldrush and higher minesite sustaining capital expenditures1 for shovel components and support equipment, partially offset by lower waste stripping in Crossroads Phase 6.
|
|
|
|
|
|
|
|
|
BARRICK SECOND QUARTER 2025 |
16 |
MANAGEMENT'S DISCUSSION AND ANALYSIS |
Turquoise Ridge (61.5%), Nevada, USA
Summary of Operating and Financial Data
|
|
|
|
|
|
|
|
|
|
|
|
|
|
|
|
|
|
|
|
|
|
|
|
|
|
|
|
|
|
|
|
|
|
For the three months ended |
|
For the six months ended |
| |
6/30/25 |
3/31/25 |
% Change |
|
6/30/24 |
% Change |
|
6/30/25 |
6/30/24 |
% Change |
| Total tonnes mined (000s) |
221 |
201 |
10 |
% |
|
731 |
(70) |
% |
|
422 |
1,299 |
(68) |
% |
|
|
|
|
|
|
|
|
|
|
|
| Open pit waste |
7 |
0 |
100 |
% |
|
545 |
(99) |
% |
|
7 |
900 |
(99) |
% |
| Underground |
214 |
201 |
6 |
% |
|
186 |
15 |
% |
|
415 |
399 |
4 |
% |
| Average grade (grams/tonne) |
|
|
|
|
|
|
|
|
|
|
|
|
|
|
|
|
|
|
|
|
|
| Underground mined |
11.93 |
10.63 |
12 |
% |
|
11.62 |
3 |
% |
|
11.28 |
10.92 |
3 |
% |
| Processed |
4.74 |
4.08 |
16 |
% |
|
4.22 |
12 |
% |
|
4.39 |
4.27 |
3 |
% |
| Ore tonnes processed (000s) |
570 |
655 |
(13) |
% |
|
634 |
(10) |
% |
|
1,225 |
1,114 |
10 |
% |
| Oxide Mill |
74 |
69 |
7 |
% |
|
75 |
(1) |
% |
|
143 |
137 |
4 |
% |
| Autoclave |
496 |
586 |
(15) |
% |
|
559 |
(11) |
% |
|
1,082 |
977 |
11 |
% |
|
|
|
|
|
|
|
|
|
|
|
| Recovery rate |
89 |
% |
85 |
% |
5 |
% |
|
85 |
% |
5 |
% |
|
87 |
% |
85 |
% |
2 |
% |
| Oxide Mill |
85 |
% |
85 |
% |
0 |
% |
|
85 |
% |
0 |
% |
|
85 |
% |
85 |
% |
0 |
% |
| Autoclave |
89 |
% |
86 |
% |
3 |
% |
|
85 |
% |
5 |
% |
|
88 |
% |
85 |
% |
4 |
% |
| Gold produced (000s oz) |
76 |
74 |
3 |
% |
|
72 |
6 |
% |
|
150 |
134 |
12 |
% |
| Oxide Mill |
5 |
5 |
0 |
% |
|
3 |
67 |
% |
|
10 |
6 |
67 |
% |
| Autoclave |
71 |
69 |
3 |
% |
|
68 |
4 |
% |
|
140 |
126 |
11 |
% |
| Heap leach |
0 |
0 |
100 |
% |
|
1 |
(100) |
% |
|
0 |
2 |
(100) |
% |
| Gold sold (000s oz) |
75 |
78 |
(4) |
% |
|
70 |
7 |
% |
|
153 |
132 |
16 |
% |
| Revenue ($ millions) |
252 |
224 |
13 |
% |
|
165 |
53 |
% |
|
476 |
295 |
61 |
% |
| Cost of sales ($ millions) |
133 |
125 |
6 |
% |
|
113 |
18 |
% |
|
258 |
220 |
17 |
% |
| Income ($ millions) |
122 |
99 |
23 |
% |
|
51 |
139 |
% |
|
221 |
73 |
203 |
% |
EBITDA ($ millions)a,b |
149 |
128 |
16 |
% |
|
76 |
96 |
% |
|
277 |
121 |
129 |
% |
EBITDA marginc |
59 |
% |
57 |
% |
4 |
% |
|
46 |
% |
28 |
% |
|
58 |
% |
41 |
% |
41 |
% |
| Capital expenditures ($ millions) |
16 |
14 |
14 |
% |
|
17 |
(6) |
% |
|
30 |
35 |
(14) |
% |
Minesite sustaininga |
16 |
13 |
23 |
% |
|
16 |
0 |
% |
|
29 |
34 |
(15) |
% |
Projecta |
0 |
1 |
(100) |
% |
|
1 |
(100) |
% |
|
1 |
1 |
0 |
% |
| COS ($/oz) |
1,761 |
1,605 |
10 |
% |
|
1,603 |
10 |
% |
|
1,682 |
1,664 |
1 |
% |
TCC ($/oz)a |
1,394 |
1,227 |
14 |
% |
|
1,235 |
13 |
% |
|
1,310 |
1,293 |
1 |
% |
AISC ($/oz)a |
1,621 |
1,408 |
15 |
% |
|
1,505 |
8 |
% |
|
1,513 |
1,575 |
(4) |
% |
|
|
|
|
|
|
|
|
|
|
|
a.Further information on these non-GAAP financial measures, including detailed reconciliations, is included on pages 44 to 59 of this MD&A.
b.EBITDA represents income less depreciation. Depreciation expense is $27 million and $56 million for Q2 2025 and YTD 2025, respectively (Q1 2025: $29 million, Q2 2024: $25 million, YTD 2024: $48 million).
c.Represents EBITDA divided by revenue.
Safety and Environment
|
|
|
|
|
|
|
|
|
|
|
| For the three months ended |
|
|
6/30/25 |
3/31/25 |
|
|
| LTI |
0 |
1 |
|
|
LTIFR3 |
0.00 |
1.48 |
|
|
TRIFR3 |
0.00 |
2.95 |
|
|
Class 14 environmental incidents |
0 |
0 |
|
|
Financial Results
Q2 2025 compared to Q1 2025
Turquoise Ridge underground continued to deliver on the ore tonnes mined with grade expected to increase as the mining moves into the high-grade zone over the remainder of the the year. The focus for H2 remains on the ramp up of the underground along with continuing to build on the reliability improvements to the Sage autoclave. Our expectation is that the combination of the higher ore tonnes and grades mined from the underground will mean Turquoise Ridge ends the year comfortably within the 2025 production guidance.
Gold production in Q2 2025 was 3% higher than Q1 2025, mainly due to a 16% increase in grade processed
driven by mine sequencing at the Turquoise Ridge underground. This was partially offset by lower throughput at the Sage autoclave as a result of the planned shutdown that occurred early in Q2 2025.
COS/oz2 and TCC/oz1 in Q2 2025 were 10% and 14% higher, respectively, than Q1 2025, primarily due higher maintenance costs driven by the planned autoclave shutdown. AISC/oz1 was 15% higher than Q1 2025, primarily reflecting higher TCC/oz1, combined with higher minesite sustaining capital expenditures1.
Q2 2025 compared to Q2 2024
Gold production for Q2 2025 was 6% higher than Q2 2024, primarily due to higher ore tonnes mined from Turquoise Ridge underground as the first half of 2024 was primarily focused on backfill and development. This also resulted in a 12% increase in the average grade processed as a higher proportion of the feed was higher grade Turquoise Ridge underground ore.
COS/oz2 and TCC/oz1 for Q2 2025 were 10% and 13% higher, respectively, than Q2 2024, primarily owing to higher maintenance costs as a result of the planned Sage autoclave shutdown that occurred early in Q2 2025. AISC/
|
|
|
|
|
|
|
|
|
BARRICK SECOND QUARTER 2025 |
17 |
MANAGEMENT'S DISCUSSION AND ANALYSIS |
oz1 was 8% higher than Q2 2024, reflecting higher TCC/oz1, partially offset by lower minesite sustaining capital expenditures1 on a per ounce basis.
YTD 2025 compared to YTD 2024
Gold production for YTD 2025 was 12% higher compared to YTD 2024, primarily due to higher ore tonnes mined at a higher-grade from Turquoise Ridge underground as the first half of 2024 was primarily focused on backfill and development. Tonnes processed were 10% higher in YTD 2025 compared to YTD 2024 as we are starting to realize the benefits of the investments made in the Sage autoclave during 2024.
COS/oz2 and TCC/oz1 for YTD 2025 were both in line with YTD 2024. AISC/oz1 decreased by 4% compared to YTD 2024, with lower minesite sustaining capital expenditures1, driven largely by lower underground development as noted above.
|
|
|
|
|
|
|
|
|
BARRICK SECOND QUARTER 2025 |
18 |
MANAGEMENT'S DISCUSSION AND ANALYSIS |
Pueblo Viejo (60%)a, Dominican Republic
Summary of Operating and Financial Data
|
|
|
|
|
|
|
|
|
|
|
|
|
|
|
|
|
|
|
|
|
|
|
|
|
|
|
|
|
|
|
|
|
|
For the three months ended |
|
For the six months ended |
| |
6/30/25 |
3/31/25 |
% Change |
|
6/30/24 |
% Change |
|
6/30/25 |
6/30/24 |
% Change |
| Open pit tonnes mined (000s) |
3,876 |
1,382 |
180 |
% |
|
3,501 |
11 |
% |
|
5,258 |
6,445 |
(18) |
% |
| Open pit ore |
673 |
89 |
656 |
% |
|
1,487 |
(55) |
% |
|
762 |
2,722 |
(72) |
% |
| Open pit waste |
3,203 |
1,293 |
148 |
% |
|
2,014 |
59 |
% |
|
4,496 |
3,723 |
21 |
% |
| Average grade (grams/tonne) |
|
|
|
|
|
|
|
|
|
|
| Open pit mined |
2.22 |
2.19 |
1 |
% |
|
2.17 |
2 |
% |
|
2.22 |
2.13 |
4 |
% |
| Processed |
2.34 |
2.17 |
8 |
% |
|
2.38 |
(2) |
% |
|
2.26 |
2.36 |
(4) |
% |
| Autoclave ore tonnes processed (000s) |
1,611 |
1,294 |
24 |
% |
|
1,496 |
8 |
% |
|
2,905 |
2,878 |
1 |
% |
| Recovery rate |
77 |
% |
82 |
% |
(6) |
% |
|
76 |
% |
1 |
% |
|
79 |
% |
79 |
% |
0 |
% |
| Gold produced (000s oz) |
95 |
74 |
28 |
% |
|
80 |
19 |
% |
|
169 |
161 |
5 |
% |
| Gold sold (000s oz) |
93 |
76 |
22 |
% |
|
79 |
18 |
% |
|
169 |
161 |
5 |
% |
| Revenue ($ millions) |
306 |
228 |
34 |
% |
|
187 |
64 |
% |
|
534 |
359 |
49 |
% |
| Cost of sales ($ millions) |
160 |
141 |
13 |
% |
|
130 |
23 |
% |
|
301 |
255 |
18 |
% |
| Income ($ millions) |
142 |
84 |
69 |
% |
|
54 |
163 |
% |
|
226 |
98 |
131 |
% |
EBITDA ($ millions)b,c |
188 |
128 |
47 |
% |
|
93 |
102 |
% |
|
316 |
174 |
82 |
% |
EBITDA margind |
61 |
% |
56 |
% |
9 |
% |
|
50 |
% |
22 |
% |
|
59 |
% |
48 |
% |
23 |
% |
Capital expenditures ($ millions)e |
56 |
46 |
22 |
% |
|
62 |
(10) |
% |
|
102 |
117 |
(13) |
% |
Minesite sustainingb |
37 |
36 |
3 |
% |
|
32 |
16 |
% |
|
73 |
57 |
28 |
% |
Projectb |
16 |
8 |
100 |
% |
|
20 |
(20) |
% |
|
24 |
40 |
(40) |
% |
| COS ($/oz) |
1,715 |
1,863 |
(8) |
% |
|
1,630 |
5 |
% |
|
1,781 |
1,578 |
13 |
% |
TCC ($/oz)b |
1,147 |
1,189 |
(4) |
% |
|
1,024 |
12 |
% |
|
1,166 |
1,018 |
15 |
% |
AISC ($/oz)b |
1,552 |
1,668 |
(7) |
% |
|
1,433 |
8 |
% |
|
1,605 |
1,382 |
16 |
% |
|
|
|
|
|
|
|
|
|
|
|
a.Barrick is the operator of Pueblo Viejo and owns 60%, with Newmont Corporation owning the remaining 40%. Pueblo Viejo is accounted for as a subsidiary with a 40% non-controlling interest. The results in the table and the discussion that follows are based on our 60% share only.
b.Further information on these non-GAAP financial measures, including detailed reconciliations, is included on pages 44 to 59 of this MD&A.
c.EBITDA represents income less depreciation. Depreciation expense is $46 million and $90 million for Q2 2025 and YTD 2025, respectively (Q1 2025: $44 million, Q2 2024: $39 million, YTD 2024: $76 million).
d.Represents EBITDA divided by revenue.
e.Includes capitalized interest.
Safety and Environment
|
|
|
|
|
|
|
|
|
|
|
| For the three months ended |
|
|
6/30/25 |
3/31/25 |
|
|
| LTI |
0 |
1 |
|
|
LTIFR3 |
0.00 |
0.23 |
|
|
TRIFR3 |
0.22 |
0.23 |
|
|
Class 14 environmental incidents |
0 |
0 |
|
|
Financial Results
Q2 2025 compared to Q1 2025
Following the successful completion of our Q1 plant throughput improvement projects, Pueblo Viejo delivered a 24% increase in throughput in Q2. The focus for H2 will be to continue ramping up process plant tonnes, whilst delivering on recovery optimization projects. The operation remains on track to deliver full year production guidance.
Gold production in Q2 2025 was 28% higher than Q1 2025, primarily due to higher throughput following the throughput optimization projects and higher grades processed driven by mine and stockpile feed sequencing.
COS/oz2 and TCC/oz1 for Q2 2025 were 8% and 4% lower respectively, compared to Q1 2025, mainly driven by the impact of higher production. For Q2 2025, AISC/oz1 was 7% lower than Q1 2025, mainly driven by lower TCC/oz1 and lower minesite sustaining capital expenditures1 on a per ounce basis.
Capital expenditures for Q2 2025 increased by 22% compared to Q1 2025, mainly due to higher project capital expenditures1 related to the Naranjo TSF and increased construction relating to the Llagal TSF.
Q2 2025 compared to Q2 2024
Gold production for Q2 2025 was 19% higher than Q2 2024, driven by higher throughput following the throughput optimization projects.
COS/oz2 and TCC/oz1 for Q2 2025 were 5% and 12% higher, respectively, compared to Q2 2024, driven by the higher royalties resulting from the higher realized gold price1. For Q2 2025, AISC/oz1 was 8% higher than Q2 2024, driven by higher TCC/oz1, partially offset by lower minesite sustaining capital expenditures1 on a per ounce basis.
Capital expenditures for Q2 2025 decreased by 10% compared to Q2 2024, primarily due to lower project capital expenditures1 related to the Naranjo TSF, partially offset by higher minesite sustaining capital expenditures1 due to increased activities at the Llagal TSF and the execution of process optimization projects.
YTD 2025 compared to YTD 2024
Gold production for YTD 2025 was 5% higher than YTD 2024, driven by higher throughput resulting from the plant expansion, partially offset by a lower average grade processed driven by the mine and stockpile feed sequence.
|
|
|
|
|
|
|
|
|
BARRICK SECOND QUARTER 2025 |
19 |
MANAGEMENT'S DISCUSSION AND ANALYSIS |
COS/oz2 and TCC/oz1 for YTD 2025 were 13% and 15% higher, respectively, than YTD 2024, primarily due to higher royalties resulting from the higher realized gold price1. For YTD 2025, AISC/oz1 increased by 16% compared to YTD 2024, primarily reflecting higher TCC/oz1, and higher minesite sustaining capital expenditures1.
Capital expenditures for YTD 2025 decreased by 13% compared to YTD 2024, primarily lower project expenditures, partially offset by higher sustaining capital expenditures1 from the execution of process plant optimization projects.
|
|
|
|
|
|
|
|
|
BARRICK SECOND QUARTER 2025 |
20 |
MANAGEMENT'S DISCUSSION AND ANALYSIS |
Kibali (45%)a, Democratic Republic of Congo
Summary of Operating and Financial Data
|
|
|
|
|
|
|
|
|
|
|
|
|
|
|
|
|
|
|
|
|
|
|
|
|
|
|
|
|
|
|
|
|
|
For the three months ended |
|
For the six months ended |
| |
6/30/25 |
3/31/25 |
% Change |
|
6/30/24 |
% Change |
|
6/30/25 |
6/30/24 |
% Change |
| Total tonnes mined (000s) |
5,421 |
5,246 |
3 |
% |
|
4,794 |
13 |
% |
|
10,667 |
9,962 |
7 |
% |
| Open pit ore |
624 |
392 |
59 |
% |
|
397 |
57 |
% |
|
1,016 |
1,002 |
1 |
% |
| Open pit waste |
4,393 |
4,472 |
(2) |
% |
|
3,952 |
11 |
% |
|
8,865 |
8,035 |
10 |
% |
| Underground |
404 |
382 |
6 |
% |
|
445 |
(9) |
% |
|
786 |
925 |
(15) |
% |
| Average grade (grams/tonne) |
|
|
|
|
|
|
|
|
|
|
| Open pit mined |
1.45 |
1.48 |
(2) |
% |
|
1.25 |
16 |
% |
|
1.46 |
1.35 |
8 |
% |
| Underground mined |
5.36 |
5.02 |
7 |
% |
|
5.61 |
(4) |
% |
|
5.19 |
5.33 |
(3) |
% |
| Processed |
2.73 |
2.36 |
16 |
% |
|
2.95 |
(7) |
% |
|
2.55 |
2.90 |
(12) |
% |
| Ore tonnes processed (000s) |
946 |
931 |
2 |
% |
|
966 |
(2) |
% |
|
1,877 |
1,891 |
(1) |
% |
| Recovery rate |
90 |
% |
90 |
% |
0 |
% |
|
89 |
% |
1 |
% |
|
90 |
% |
89 |
% |
1 |
% |
| Gold produced (000s oz) |
75 |
63 |
19 |
% |
|
82 |
(9) |
% |
|
138 |
158 |
(13) |
% |
| Gold sold (000s oz) |
69 |
67 |
3 |
% |
|
81 |
(15) |
% |
|
136 |
153 |
(11) |
% |
| Revenue ($ millions) |
226 |
192 |
18 |
% |
|
189 |
20 |
% |
|
418 |
341 |
23 |
% |
| Cost of sales ($ millions) |
108 |
113 |
(4) |
% |
|
107 |
1 |
% |
|
221 |
193 |
15 |
% |
| Income ($ millions) |
89 |
72 |
24 |
% |
|
84 |
6 |
% |
|
161 |
148 |
9 |
% |
EBITDA ($ millions)b,c |
121 |
104 |
16 |
% |
|
120 |
1 |
% |
|
225 |
212 |
6 |
% |
EBITDA margind |
54 |
% |
54 |
% |
0 |
% |
|
63 |
% |
(14) |
% |
|
54 |
% |
62 |
% |
(13) |
% |
| Capital expenditures ($ millions) |
30 |
32 |
(6) |
% |
|
34 |
(12) |
% |
|
62 |
58 |
7 |
% |
Minesite sustainingb |
10 |
12 |
(17) |
% |
|
16 |
(38) |
% |
|
22 |
31 |
(29) |
% |
Projectb |
20 |
20 |
0 |
% |
|
18 |
11 |
% |
|
40 |
27 |
48 |
% |
| COS ($/oz) |
1,565 |
1,691 |
(7) |
% |
|
1,313 |
19 |
% |
|
1,627 |
1,260 |
29 |
% |
TCC ($/oz)b |
1,094 |
1,212 |
(10) |
% |
|
868 |
26 |
% |
|
1,152 |
837 |
38 |
% |
AISC ($/oz)b |
1,273 |
1,426 |
(11) |
% |
|
1,086 |
17 |
% |
|
1,348 |
1,068 |
26 |
% |
|
|
|
|
|
|
|
|
|
|
|
a.Barrick owns 45% of Kibali Goldmines SA with the Government of DRC and our joint venture partner, AngloGold Ashanti, owning 10% and 45%, respectively. The figures presented in this table and the discussion that follows are based on our 45% effective interest in Kibali Goldmines SA held through our 50% interest in Kibali (Jersey) Limited and its other subsidiaries (collectively "Kibali"), inclusive of the impact of the purchase price allocation resulting from the merger with Randgold. Kibali is accounted for as an equity method investment on the basis that the joint venture partners that have joint control have rights to the net assets of the joint venture.
b.Further information on these non-GAAP financial measures, including detailed reconciliations, is included on pages 44 to 59 of this MD&A.
c.EBITDA represents income less depreciation. Depreciation expense is $32 million and $64 million for Q2 2025 and YTD 2025, respectively (Q1 2025: $32 million, Q2 2024: $36 million, YTD 2024: $64 million).
d.Represents EBITDA divided by revenue.
Safety and Environment
|
|
|
|
|
|
|
|
|
|
|
| For the three months ended |
|
|
6/30/25 |
3/31/25 |
|
|
| LTI |
2 |
1 |
|
|
LTIFR3 |
0.39 |
0.20 |
|
|
TRIFR3 |
1.77 |
0.39 |
|
|
Class 14 environmental incidents |
0 |
0 |
|
|
Financial Results
Q2 2025 compared to Q1 2025
Kibali had a better quarter compared to Q1 albeit it was slightly hampered by an unplanned shaft rope change-out. For H2, the focus will be on increasing underground ore tonnes mined by improving on equipment utilization and commissioning additional underground trucking capacity. This will be supplemented by increased open-pit mining during the ramp up of Kalimva and Ikamva. As a result and as previously guided, we continue to expect production to be higher during the latter part of the year from both the underground and open pit. Our expectation continues to be that Kibali will end the year comfortably within the 2025 production guidance.
Gold production in Q2 2025 was 19% higher than Q1 2025, mainly due to higher grades processed resulting from more ore tonnes mined from the underground in line with the mine plan. In addition, Q1 was impacted by the shaft shutdown.
COS/oz2 and TCC/oz1 for Q2 2025 were 7% and 10% lower, respectively, mainly due to a higher average grade processed and lower royalties driven by the repeal in April 2025 of the 3% export duty that was previously included in the new finance act, partially offset by the impact of a higher realized gold price1. For Q2 2025, AISC/oz1 was 11% lower compared to Q1 2025, mainly due to lower TCC/oz1, combined with lower minesite sustaining capital expenditures1 on a per ounce basis.
Q2 2025 compared to Q2 2024
Gold production for Q2 2025 was 9% lower than Q2 2024, mainly due to lower grades processed, driven by fewer ore tonnes from the underground related to an unplanned shaft rope change-out during Q2 2025.
COS/oz2 and TCC/oz1 for Q2 2025 were 19% and 26% higher, respectively, compared to Q2 2024 mainly resulting from lower ore delivery from both the open pits and the underground, reduced fixed cost dilution and higher
|
|
|
|
|
|
|
|
|
BARRICK SECOND QUARTER 2025 |
21 |
MANAGEMENT'S DISCUSSION AND ANALYSIS |
royalties related to a higher realized gold price1. For Q2 2025, AISC/oz1 was 17% higher than Q2 2024, driven by higher TCC/oz1, partially offset by lower minesite sustaining capital expenditures1.
Capital expenditures for Q2 2025 were 12% lower than Q2 2024, predominantly driven by lower minesite sustaining capital expenditures linked to lower capitalized stripping, partially offset by higher project capital expenditures1 driven by the Pamao TSF project.
YTD 2025 compared to YTD 2024
Gold production for YTD 2025 was 13% lower compared to YTD 2024, mainly due to lower grades processed driven by fewer ore tonnes from the underground relating to a planned shaft shutdown during Q1 2025, coupled with an unplanned rope changeout in Q2 2025 that resulted in a delay in processing higher grade tonnes.
COS/oz2 and TCC/oz1 for YTD 2025 were 29% and 38% higher, respectively, than YTD 2024, mainly due to
lower grades processed, higher maintenance costs due to the events mentioned above and higher royalties resulting from the 3% export duty that was in place during Q1 2025 and the impact of a higher realized gold price1.
For YTD 2025, AISC/oz1 were 26% higher compared to YTD 2024, mainly due to the higher TCC/oz1, partially offset by lower minesite sustaining capital expenditures1.
Capital expenditures in YTD 2025 were 7% higher than YTD 2024, mainly due to an increase in project capital expenditures1 related to the solar project and progress made towards the construction of the Cyanide Tailings Storage Facility 3, partially offset by lower minesite sustaining capital expenditures1 due to decreased capitalized waste stripping.
|
|
|
|
|
|
|
|
|
BARRICK SECOND QUARTER 2025 |
22 |
MANAGEMENT'S DISCUSSION AND ANALYSIS |
North Mara (84%)a, Tanzania
Summary of Operating and Financial Data
|
|
|
|
|
|
|
|
|
|
|
|
|
|
|
|
|
|
|
|
|
|
|
|
|
|
|
|
|
|
|
|
|
|
For the three months ended |
|
For the six months ended |
| |
6/30/25 |
3/31/25 |
% Change |
|
6/30/24 |
% Change |
|
6/30/25 |
6/30/24 |
% Change |
| Total tonnes mined (000s) |
3,271 |
3,843 |
(15) |
% |
|
3,734 |
(12) |
% |
|
7,114 |
7,315 |
(3) |
% |
| Open pit ore |
488 |
1,057 |
(54) |
% |
|
500 |
(2) |
% |
|
1,545 |
874 |
77 |
% |
| Open pit waste |
2,398 |
2,398 |
0 |
% |
|
2,854 |
(16) |
% |
|
4,796 |
5,665 |
(15) |
% |
| Underground |
385 |
388 |
(1) |
% |
|
380 |
1 |
% |
|
773 |
776 |
0 |
% |
| Average grade (grams/tonne) |
|
|
|
|
|
|
|
|
|
|
| Open pit mined |
1.90 |
2.04 |
(7) |
% |
|
1.66 |
14 |
% |
|
2.00 |
1.67 |
20 |
% |
| Underground mined |
3.73 |
3.72 |
0 |
% |
|
3.23 |
15 |
% |
|
3.72 |
3.01 |
24 |
% |
| Processed |
3.16 |
3.56 |
(11) |
% |
|
2.61 |
21 |
% |
|
3.36 |
2.52 |
33 |
% |
| Ore tonnes processed (000s) |
698 |
672 |
4 |
% |
|
715 |
(2) |
% |
|
1,370 |
1,366 |
0 |
% |
| Recovery rate |
88 |
% |
88 |
% |
0 |
% |
|
89 |
% |
(1) |
% |
|
88 |
% |
89 |
% |
(1) |
% |
| Gold produced (000s oz) |
62 |
67 |
(7) |
% |
|
54 |
15 |
% |
|
129 |
100 |
29 |
% |
| Gold sold (000s oz) |
50 |
68 |
(26) |
% |
|
50 |
0 |
% |
|
118 |
96 |
23 |
% |
| Revenue ($ millions) |
168 |
198 |
(15) |
% |
|
117 |
44 |
% |
|
366 |
213 |
72 |
% |
| Cost of sales ($ millions) |
71 |
86 |
(17) |
% |
|
79 |
(10) |
% |
|
157 |
156 |
1 |
% |
| Income ($ millions) |
88 |
109 |
(19) |
% |
|
35 |
151 |
% |
|
197 |
50 |
294 |
% |
EBITDA ($ millions)b,c |
104 |
127 |
(18) |
% |
|
50 |
108 |
% |
|
231 |
80 |
189 |
% |
EBITDA margind |
62 |
% |
64 |
% |
(3) |
% |
|
43 |
% |
44 |
% |
|
63 |
% |
38 |
% |
66 |
% |
| Capital expenditures ($ millions) |
43 |
34 |
26 |
% |
|
24 |
79 |
% |
|
77 |
54 |
43 |
% |
Minesite sustainingb |
10 |
17 |
(41) |
% |
|
10 |
0 |
% |
|
27 |
28 |
(4) |
% |
Projectb |
33 |
17 |
94 |
% |
|
14 |
136 |
% |
|
50 |
26 |
92 |
% |
| COS ($/oz) |
1,430 |
1,257 |
14 |
% |
|
1,570 |
(9) |
% |
|
1,330 |
1,622 |
(18) |
% |
TCC ($/oz)b |
1,073 |
986 |
9 |
% |
|
1,266 |
(15) |
% |
|
1,022 |
1,301 |
(21) |
% |
AISC ($/oz)b |
1,292 |
1,258 |
3 |
% |
|
1,491 |
(13) |
% |
|
1,272 |
1,617 |
(21) |
% |
|
|
|
|
|
|
|
|
|
|
|
a.Barrick owns 84% of North Mara, with the GoT owning 16%. North Mara is accounted for as a subsidiary with a 16% non-controlling interest on the basis that Barrick controls the asset. The results in the table and the discussion that follows are based on our 84% share.
b.Further information on these non-GAAP financial measures, including detailed reconciliations, is included on pages 44 to 59 of this MD&A.
c.EBITDA represents income less depreciation. Depreciation expense is $16 million and $34 million for Q2 2025 and YTD 2025, respectively (Q1 2025: $18 million, Q2 2024: $15 million, YTD 2024: $30 million).
d.Represents EBITDA divided by revenue.
Safety and Environment
|
|
|
|
|
|
|
|
|
|
|
| For the three months ended |
|
|
6/30/25 |
3/31/25 |
|
|
| LTI |
0 |
0 |
|
|
LTIFR3 |
0.00 |
0.00 |
|
|
TRIFR3 |
0.00 |
1.05 |
|
|
Class 14 environmental incidents |
0 |
0 |
|
|
Financial Results
Q2 2025 compared to Q1 2025
North Mara was in a transition phase in Q2 with the conclusion of open pit ore mining in the Gena Cut 2. Looking forward we expect to transition into a more underground focused feed plan resulting in higher grades in Q3, with the open pit mining activity moving to waste material in the Gokona pit. Our expectation continues to be that North Mara will end the year comfortably within the 2025 production guidance.
In Q2 2025, gold production was 7% lower than Q1 2025 mainly driven by a lower average grade processed due to feeding more of the lower grade Gena open pit material into the plant. Gold sales were lower than gold production during Q2 2025 as we set aside 20% of the quarter’s production from our Tanzanian mines to be sold to the Bank of Tanzania pursuant to the changes made to the
Mining Act. We are working with the Bank of Tanzania on the terms for the proposed purchase agreement and expect the gold to be sold in Q3 2025. The majority of the 80% of gold that was sold in Q2 occurred at the end of the quarter and therefore the cash from these sales was received early in Q3. The unwind of the remaining gold inventory and receivables is expected to result in higher operating cash flow in Q3.
COS/oz2 and TCC/oz1 were 14% and 9% higher, respectively, than Q1 2025 mainly due to the impact of the lower grade processed. AISC/oz1 in Q2 2025 was 3% higher than Q1 2025, mainly due to higher TCC/oz1, partially offset by lower minesite sustaining capital expenditures1.
Capital expenditures for Q2 2025 were 26% higher compared to Q1 2025 due to increased project capital expenditures1 driven by the increased ramp-up of the Gokona open pit pre-stripping project, which is on track to deliver first ore by Q3 2026, combined with the second crushing line, which was partially offset by lower sustaining capital expenditures1.
Q2 2025 compared to Q2 2024
Gold production for Q2 2025 was 15% higher mainly due to higher grades mined and processed, slightly offset by lower throughput.
|
|
|
|
|
|
|
|
|
BARRICK SECOND QUARTER 2025 |
23 |
MANAGEMENT'S DISCUSSION AND ANALYSIS |
COS/oz2 and TCC/oz1 were 9% and 15% lower, respectively, compared to Q2 2024, due to the higher grade processed, partially offset by higher royalties associated with the higher realized gold price1. AISC/oz1 in Q2 2025 was 13% lower than Q2 2024, mainly due to lower TCC/oz1, while minesite sustaining capital expenditures1 on a per ounce basis remained in line with Q2 2024.
For Q2 2025, capital expenditures increased by 79% compared to Q2 2024, mainly due to higher project capital expenditures1 relating to the continued investment in the second crushing line which is scheduled for a Q2 2026 commissioning.
YTD 2025 compared to YTD 2024
For YTD 2025, gold production was 29% higher than YTD 2024, mainly due to a higher average grade processed driven by the higher grades mined from the underground and open pit compared to the feed blend of YTD 2024.
COS/oz2 and TCC/oz1 in YTD 2025 were 18% and 21% lower, respectively, due to the impact of higher grades processed as described above, partially offset by higher royalties associated with the higher realized gold price1. AISC/oz1 for YTD 2025 was 21% lower than YTD 2024 reflecting the decrease in TCC/oz1, combined with lower minesite sustaining capital expenditures1 on a per ounce basis.
For YTD 2025, capital expenditures increased by 43% compared to YTD 2024, mainly driven by higher project capital expenditures1 reflecting the start up of the Gokona open pit and second crushing line.
|
|
|
|
|
|
|
|
|
BARRICK SECOND QUARTER 2025 |
24 |
MANAGEMENT'S DISCUSSION AND ANALYSIS |
Bulyanhulu (84%)a, Tanzania
Summary of Operating and Financial Data
|
|
|
|
|
|
|
|
|
|
|
|
|
|
|
|
|
|
|
|
|
|
|
|
|
|
|
|
|
|
|
|
|
|
For the three months ended |
|
For the six months ended |
| |
6/30/25 |
3/31/25 |
% Change |
|
6/30/24 |
% Change |
|
6/30/25 |
6/30/24 |
% Change |
| Underground tonnes mined (000s) |
377 |
304 |
24 |
% |
|
314 |
20 |
% |
|
681 |
618 |
10 |
% |
| Average grade (grams/tonne) |
|
|
|
|
|
|
|
|
|
|
| Underground mined |
5.29 |
5.27 |
0 |
% |
|
5.89 |
(10) |
% |
|
5.28 |
5.87 |
(10) |
% |
| Processed |
5.37 |
5.27 |
2 |
% |
|
5.89 |
(9) |
% |
|
5.32 |
5.83 |
(9) |
% |
| Ore tonnes processed (000s) |
231 |
237 |
(3) |
% |
|
250 |
(8) |
% |
|
468 |
488 |
(4) |
% |
| Recovery rate |
95 |
% |
93 |
% |
2 |
% |
|
94 |
% |
1 |
% |
|
94 |
% |
95 |
% |
(1) |
% |
| Gold produced (000s oz) |
38 |
37 |
3 |
% |
|
45 |
(16) |
% |
|
75 |
87 |
(14) |
% |
| Gold sold (000s oz) |
31 |
38 |
(18) |
% |
|
44 |
(30) |
% |
|
69 |
84 |
(18) |
% |
| Revenue ($ millions) |
112 |
123 |
(9) |
% |
|
108 |
4 |
% |
|
235 |
197 |
19 |
% |
| Cost of sales ($ millions) |
53 |
65 |
(18) |
% |
|
62 |
(15) |
% |
|
118 |
122 |
(3) |
% |
| Income ($ millions) |
58 |
56 |
4 |
% |
|
45 |
29 |
% |
|
114 |
73 |
56 |
% |
EBITDA ($ millions)b,c |
69 |
70 |
(1) |
% |
|
58 |
19 |
% |
|
139 |
99 |
40 |
% |
EBITDA margind |
62 |
% |
57 |
% |
9 |
% |
|
54 |
% |
15 |
% |
|
59 |
% |
50 |
% |
18 |
% |
| Capital expenditures ($ millions) |
36 |
35 |
3 |
% |
|
23 |
57 |
% |
|
71 |
49 |
45 |
% |
Minesite sustainingb |
22 |
23 |
(4) |
% |
|
11 |
100 |
% |
|
45 |
29 |
55 |
% |
Projectb |
14 |
12 |
17 |
% |
|
12 |
17 |
% |
|
26 |
20 |
30 |
% |
| COS ($/oz) |
1,722 |
1,714 |
0 |
% |
|
1,438 |
20 |
% |
|
1,718 |
1,458 |
18 |
% |
TCC ($/oz)b |
1,189 |
1,212 |
(2) |
% |
|
985 |
21 |
% |
|
1,201 |
1,013 |
19 |
% |
AISC ($/oz)b |
1,885 |
1,831 |
3 |
% |
|
1,243 |
52 |
% |
|
1,856 |
1,360 |
36 |
% |
|
|
|
|
|
|
|
|
|
|
|
a.Barrick owns 84% of Bulyanhulu, with the GoT owning 16%. Bulyanhulu is accounted for as a subsidiary with a 16% non-controlling interest on the basis that Barrick controls the asset. The results in the table and the discussion that follows are based on our 84% share.
b.Further information on these non-GAAP financial measures, including detailed reconciliations, is included on pages 44 to 59 of this MD&A.
c.EBITDA represents income less depreciation. Depreciation expense is $11 million and $25 million for Q2 2025 and YTD 2025, respectively (Q1 2025: $14 million, Q2 2024: $13 million, YTD 2024: $26 million).
d.Represents EBITDA divided by revenue.
Safety and Environment
|
|
|
|
|
|
|
|
|
|
|
| For the three months ended |
|
|
6/30/25 |
3/31/25 |
|
|
| LTI |
0 |
0 |
|
|
LTIFR3 |
0.00 |
0.00 |
|
|
TRIFR3 |
1.51 |
2.00 |
|
|
Class 14 environmental incidents |
0 |
0 |
|
|
Financial Results
Q2 2025 compared to Q1 2025
At Bulyanhulu, Q2 production was higher than Q1 albeit dewatering issues did impact our progress. The dewatering of all key production areas has now been completed, and the focus has shifted to delivering on targeted underground advance rates while minimizing dilution. The Upper West project is advancing well and on schedule for first production by the end of the year. Our expectation continues to be that Bulyanhulu will end the year comfortably within the 2025 production guidance.
In Q2 2025, gold production was 3% higher than Q1 2025 mainly due to a higher average grade processed and higher recovery, slightly offset by lower throughput. Gold sales were lower than gold production during Q2 2025 as we set aside 20% of the quarter’s production from our Tanzanian mines to be sold to the Bank of Tanzania pursuant to the changes made to the Mining Act. We are working with the Bank of Tanzania on the terms for the proposed purchase agreement and expect the gold to be sold in Q3 2025. The majority of the 80% of gold that was sold in Q2 occurred at the end of the quarter and therefore
the cash from these sales was received early in Q3. The unwind of the remaining gold inventory and receivables is expected to result in higher operating cash flow in Q3.
COS/oz2 was in line with Q1 2025 as higher depreciation on a per ounce basis was largely offset by lower TCC/oz1. TCC/oz1 in Q2 2025 was 2% lower reflecting the higher average grade processed. AISC/oz1 in Q2 2025 was 3% higher than Q1 2025, due to higher minesite sustaining capital expenditures1 on a per ounce basis.
Capital expenditures in Q2 2025 were slightly higher compared to Q1 2025, reflecting higher project capital expenditures1 which relates to the continued development and infrastructure investments associated with the Upper West project including a new workshop and project related equipment, with first ore expected by the end of the year. This was partially offset by slightly lower minesite sustaining capital expenditures1.
Q2 2025 compared to Q2 2024
For Q2 2025, gold production was 16% lower than Q2 2024 mainly driven by a lower average grade processed and lower throughput, in line with the mine plan and with the focus on development.
COS/oz2 and TCC/oz1 for Q2 2025 were 20% and 21% higher, respectively, compared to Q2 2024, due to the lower grade processed and higher royalties associated with the higher realized gold price1, slightly offset by improved underground unit rates associated with the increased tonnes mined. AISC/oz1 in Q2 2025 was 52% higher than
|
|
|
|
|
|
|
|
|
BARRICK SECOND QUARTER 2025 |
25 |
MANAGEMENT'S DISCUSSION AND ANALYSIS |
Q2 2024, mainly due to higher TCC/oz1 and higher minesite sustaining capital expenditures1.
For Q2 2025, capital expenditures were 57% higher than Q2 2024, mainly due to higher minesite sustaining capital expenditures1 related to the purchase of underground support equipment and dewatering pumps, combined with higher project capital expenditures1 related to the Upper West project.
YTD 2025 compared to YTD 2024
For YTD 2025, gold production was 14% lower than YTD 2024, due to a lower average grade processed and lower throughput, in line with our mine plan.
COS/oz2 and TCC/oz1 in YTD 2025 were 18% and 19% higher, respectively, than YTD 2024, largely reflecting the lower grades processed and higher royalties associated with the higher realized gold price1. AISC/oz1 for YTD 2025 was 36% higher than YTD 2024, mainly due to higher TCC/oz1, lower gold sales and higher minesite sustaining capital expenditures1.
For YTD 2025, capital expenditures increased by 45% compared to YTD 2024, mainly due to higher minesite sustaining capital expenditures1 related to underground equipment and higher project capital expenditures1 related to the Upper West project.
|
|
|
|
|
|
|
|
|
BARRICK SECOND QUARTER 2025 |
26 |
MANAGEMENT'S DISCUSSION AND ANALYSIS |
Other Mines - Gold
Summary of Operating and Financial Data
|
|
|
|
|
|
|
|
|
|
|
|
|
|
|
|
|
|
|
|
|
|
|
|
|
|
|
|
|
|
|
|
|
|
|
|
|
For the three months ended |
|
6/30/25 |
|
3/31/25 |
|
Gold produced (000s oz) |
COS
($/oz) |
TCC
($/oz)a |
AISC ($/oz)a |
Capital Expend-ituresb |
|
Gold produced (000s oz) |
COS
($/oz) |
TCC ($/oz)a |
AISC ($/oz)a |
Capital Expend-ituresb |
| Phoenix (61.5%) |
27 |
2,033 |
|
1,010 |
|
1,376 |
|
8 |
|
|
31 |
1,686 |
|
747 |
|
1,012 |
|
6 |
|
| Veladero (50%) |
62 |
1,234 |
|
751 |
|
1,295 |
|
41 |
|
|
71 |
1,141 |
|
753 |
|
1,271 |
|
48 |
|
| Tongon (89.7%) |
29 |
2,397 |
|
2,204 |
|
2,390 |
|
4 |
|
|
27 |
2,154 |
|
1,971 |
|
2,144 |
|
3 |
|
| Hemlo |
32 |
1,837 |
|
1,512 |
|
1,766 |
|
8 |
|
|
38 |
1,730 |
|
1,458 |
|
1,692 |
|
9 |
|
|
|
|
|
|
|
|
|
|
|
|
|
| Porgera (24.5%) |
23 |
1,354 |
|
1,041 |
|
1,406 |
|
10 |
|
|
21 |
1,675 |
|
1,336 |
|
1,684 |
|
8 |
|
Loulo-Gounkoto (80%)c |
— |
— |
— |
— |
4 |
|
|
18 |
— |
— |
— |
14 |
|
|
|
|
|
|
|
|
|
|
|
|
|
a.Further information on these non-GAAP financial measures, including detailed reconciliations, is included on pages 44 to 59 of this MD&A.
b.Includes both minesite sustaining and project capital expenditures1.
c.As a result of temporary suspension of operations at Loulo-Gounkoto starting January 14, 2025, and subsequent loss of control on June 16, 2025, no operating or per ounce data is provided.
Phoenix (61.5%), Nevada, USA
Gold production for Phoenix in Q2 2025 was 13% lower compared to Q1 2025, mainly driven by lower grades mined and processed, partially offset by higher recoveries. COS/oz2 and TCC/oz1 in Q2 2025 were 21% and 35% higher, respectively, compared to Q1 2025 due to the lower grades processed. TCC/oz1 was further impacted by lower by-product credits on a per ounce basis. In Q2 2025, AISC/oz1 increased by 36% compared to Q1 2025 due to higher TCC/oz1 combined with higher minesite sustaining capital expenditures1.
Veladero (50%), Argentina
Gold production for Veladero in Q2 2025 was 13% lower compared to Q1 2025 mainly driven by lower recoverable ounces placed on the leach pad in line with plan. COS/oz2 in Q2 2025 was 8% higher due to an increase in depreciation while TCC/oz1 and AISC/oz1 remained in line with Q1 2025.
Tongon (89.7%), Côte d'Ivoire
Gold production for Tongon in Q2 2025 was 7% higher than Q1 2025, primarily due to increased throughput in the processing plant. COS/oz2 and TCC/oz1 in Q2 2025 were 11% and 12% higher, respectively, compared to Q1 2025, primarily driven by increased royalty costs as a result of the higher realized gold price1 and higher energy costs due to power grid constraints necessitating higher reliance on diesel generators. The power blend is expected to normalize in Q3. AISC/oz1 in Q2 2025 increased by 11% compared to Q1 2025, primarily reflecting higher TCC/oz1 and higher minesite sustaining capital expenditures1. Although Tongon continues to be managed for the benefit of all stakeholders, our investment in this asset is not considered to be a core part of our portfolio.
Hemlo (100%), Ontario, Canada
Gold production in Q2 2025 was 16% lower than Q1 2025 resulting from lower ore tonnes mined and processed as per the planned mine sequence and resulting from planned improvement projects in the underground. This was partially offset by a higher average grade processed and slightly higher recoveries. COS/oz2 was 6% higher, while TCC/oz1 and AISC/oz1 were both 4% higher than Q1 2025, resulting from lower fixed cost dilution related to lower sales volumes. Although Hemlo continues to be managed for the benefit of all stakeholders, our investment in this asset is not considered to be a core part of our portfolio.
Porgera (24.5%), Papua New Guinea
Gold production in Q2 2025 was 10% higher than Q1 2025 driven by the ongoing ramp-up of operations. COS/oz2, TCC/oz1 and AISC/oz1 were all lower than Q1 2025 driven by higher production, with AISC/oz1 partially offset by higher minesite sustaining capital expenditures.
Loulo-Gounkoto (80%), Mali
On January 14, 2025, Loulo-Gounkoto temporarily suspended operations following an ongoing dispute over the existing mining Conventions. On June 16, 2025 the Bamako Commercial Tribunal placed Loulo-Gounkoto under a temporary provisional administration. While Barrick retains its 80% legal ownership of the mine, operational control has been transferred to an external administrator. As a result of this loss of control event, the assets, liabilities and non-controlling interest of Loulo-Gounkoto were deconsolidated and derecognized and an investment recognized at fair value to reflect the value of our shareholder rights in Q2 2025 resulting in a net loss of $1,035 million (pre-tax). Refer to page 8 for more information. In addition, the temporary suspension had a significant negative impact on Loulo-Gounkoto’s financial results for 2025 prior to the loss of control event and the loss of $58 million in Q2 2025 mainly relates to reduced operations costs (included in Other Expense (Income) as detailed in note 9 of the Financial Statements) as well as continued depreciation of certain assets.
|
|
|
|
|
|
|
|
|
BARRICK SECOND QUARTER 2025 |
27 |
MANAGEMENT'S DISCUSSION AND ANALYSIS |
Lumwana (100%), Zambia
Summary of Operating and Financial Data
|
|
|
|
|
|
|
|
|
|
|
|
|
|
|
|
|
|
|
|
|
|
|
|
|
|
|
|
|
|
|
|
|
|
For the three months ended |
|
For the six months ended |
| |
6/30/25 |
3/31/25 |
% Change |
|
6/30/24 |
% Change |
|
6/30/25 |
6/30/24 |
% Change |
| Open pit tonnes mined (000s) |
37,481 |
30,310 |
24 |
% |
|
39,132 |
(4) |
% |
|
67,791 |
68,703 |
(1) |
% |
| Open pit ore |
7,667 |
6,004 |
28 |
% |
|
5,563 |
38 |
% |
|
13,671 |
9,290 |
47 |
% |
| Open pit waste |
29,814 |
24,306 |
23 |
% |
|
33,569 |
(11) |
% |
|
54,120 |
59,413 |
(9) |
% |
|
|
|
|
|
|
|
|
|
|
|
|
|
|
|
|
|
|
|
|
|
|
| Average grade |
|
|
|
|
|
|
|
|
|
|
| Open pit mined |
0.63 |
% |
0.59 |
% |
7 |
% |
|
0.49 |
% |
29 |
% |
|
0.61 |
% |
0.49 |
% |
24 |
% |
| Processed |
0.67 |
% |
0.57 |
% |
18 |
% |
|
0.45 |
% |
49 |
% |
|
0.63 |
% |
0.43 |
% |
47 |
% |
| Tonnes processed (000s) |
7,082 |
5,237 |
35 |
% |
|
6,523 |
9 |
% |
|
12,319 |
12,545 |
(2) |
% |
| Recovery rate |
92 |
% |
91 |
% |
1 |
% |
|
85 |
% |
8 |
% |
|
92 |
% |
86 |
% |
6 |
% |
| Copper produced (kt) |
44 |
27 |
63 |
% |
|
25 |
76 |
% |
|
71 |
47 |
51 |
% |
| Copper sold (kt) |
39 |
34 |
15 |
% |
|
25 |
56 |
% |
|
73 |
47 |
55 |
% |
| Revenue ($ millions) |
340 |
305 |
11 |
% |
|
219 |
55 |
% |
|
645 |
382 |
69 |
% |
| Cost of sales ($ millions) |
194 |
208 |
(7) |
% |
|
172 |
13 |
% |
|
402 |
340 |
18 |
% |
| Income ($ millions) |
144 |
95 |
52 |
% |
|
37 |
(289) |
% |
|
239 |
30 |
697 |
% |
EBITDA ($ millions)a,b |
213 |
155 |
37 |
% |
|
107 |
99 |
% |
|
368 |
160 |
130 |
% |
EBITDA marginc |
63 |
% |
51 |
% |
24 |
% |
|
49 |
% |
29 |
% |
|
57 |
% |
42 |
% |
36 |
% |
Capital expenditures ($ millions)d |
151 |
70 |
116 |
% |
|
117 |
29 |
% |
|
221 |
204 |
8 |
% |
Minesite sustaininga |
78 |
50 |
56 |
% |
|
102 |
(24) |
% |
|
128 |
177 |
(28) |
% |
Projecta |
72 |
20 |
260 |
% |
|
15 |
380 |
% |
|
92 |
27 |
241 |
% |
| COS ($/lb) |
2.25 |
2.80 |
(20) |
% |
|
3.15 |
(29) |
% |
|
2.51 |
3.27 |
(23) |
% |
C1 cash costs ($/lb)a |
1.58 |
2.22 |
(29) |
% |
|
2.14 |
(26) |
% |
|
1.88 |
2.32 |
(19) |
% |
AISC ($/lb)a |
2.79 |
3.20 |
(13) |
% |
|
4.36 |
(36) |
% |
|
2.98 |
4.34 |
(31) |
% |
|
|
|
|
|
|
|
|
|
|
|
a.Further information on these non-GAAP financial measures, including detailed reconciliations, is included on pages 44 to 59 of this MD&A.
b.EBITDA represents income less depreciation. Depreciation expense is $69 million and $129 million for Q2 2025 and YTD 2025, respectively (Q1 2025: $60 million, Q2 2024: $70 million, YTD 2024: $130 million).
c.Represents EBITDA divided by revenue.
d.Includes capitalized interest.
Safety and Environment
|
|
|
|
|
|
|
|
|
|
|
| For the three months ended |
|
|
6/30/25 |
3/31/25 |
|
|
| LTI |
0 |
1 |
|
|
LTIFR3 |
0.00 |
0.22 |
|
|
TRIFR3 |
0.00 |
0.22 |
|
|
Class 14 environmental incidents |
0 |
0 |
|
|
Financial Results
Q2 2025 compared to Q1 2025
As previously guided, Q1 was expected to be the lowest quarter of the year mainly driven by lower grades as per the mine plan. For Q2, open pit mining continued to track well on both costs and tonnes. As such, our expectation continues to be that Lumwana will end the year comfortably within the 2025 production guidance.
Copper production in Q2 2025 was 63% higher than in Q1 2025 due to improved mining rates driving higher throughput as well as higher grades and better recovery.
COS/lb2 and C1 cash costs/lb1 were 20% and 29% lower, respectively, than Q1 2025, mainly reflecting the higher grade processed, as well as higher waste stripping from the change in the mine plan to mine more material in the Malundwe pit causing higher capital stripping. In Q2 2025, AISC/lb1 decreased by 13% compared to Q1 2025, primarily driven by the decrease in C1 cash costs/lb1, partially offset by higher royalties due to the higher realized
copper price1 and higher minesite sustaining capital expenditure1.
Capital expenditures for Q2 2025 were 116% higher than Q1 2025, due to higher project capital expenditures1 on long lead items and the mobile equipment related to the Lumwana Super Pit Expansion project, as well as higher minesite sustaining capital expenditures1 resulting from higher waste stripping. Refer to the Projects section on page 31 for more details.
The free cash flow1 for the quarter was impacted by delays experienced with the smelters leading to a build up in our receivables which are expected to normalize again in Q3.
Q2 2025 compared to Q2 2024
Copper production for Q2 2025 was 76% higher than Q2 2024, mainly due to higher grades processed, as well as higher recoveries and higher throughput.
COS/lb2 and C1 cash costs/lb1 for Q2 2025 decreased by 29% and 26%, respectively, compared to Q2 2024, mainly due to the higher grades processed and higher fixed cost dilution. For Q2 2025, AISC/lb1 was 36% lower than Q2 2024 mainly due to lower C1 cash cost/lb1 and lower minesite sustaining capital expenditures1. This was partially offset by higher royalties due to the higher realized copper price1.
Capital expenditures for Q2 2025 were 29% higher than Q2 2024, mainly due to the increased project capital expenditures1 on the Super Pit Expansion project, including
|
|
|
|
|
|
|
|
|
BARRICK SECOND QUARTER 2025 |
28 |
MANAGEMENT'S DISCUSSION AND ANALYSIS |
long lead items, mobile equipment, housing, engineering procurement and construction management and owners team costs.
YTD 2025 compared to YTD 2024
Copper production for YTD 2025 was 51% higher than YTD 2024, primarily due to higher grades processed and higher recovery rates.
COS/lb2 and C1 cash costs/lb1 for YTD 2025 decreased by 23% and 19%, respectively, compared to YTD 2024, mainly as a result of higher grades processed, partially offset by higher mining and energy costs. For YTD 2025, AISC/lb1 decreased by 31% compared to YTD 2024, mainly due to lower minesite sustaining capital
expenditures1 and lower C1 cash costs/lb1, partially offset by higher royalty costs driven by the higher realized copper price1.
Capital expenditures for YTD 2025 were 8% higher than YTD 2024 due to higher project capital expenditures1 on the Super Pit Expansion project, as described above, partially offset by lower minesite sustaining capital expenditures1 including a decrease in waste stripping.
Other Mines - Copper
Summary of Operating and Financial Data
|
|
|
|
|
|
|
|
|
|
|
|
|
|
|
|
|
|
|
|
|
|
|
|
|
|
|
|
|
|
|
|
|
|
|
|
|
For the three months ended |
|
6/30/25 |
|
3/31/25 |
|
Copper production (kt) |
COS
($/lb) |
C1 cash costs ($/lb)a |
AISC ($/lb)a |
Capital Expend-ituresb |
|
Copper production (kt) |
COS
($/lb) |
C1 cash costs ($/lb)a |
AISC ($/lb)a |
Capital Expend-ituresb |
|
|
|
|
|
|
|
|
|
|
|
|
Zaldívar (50%) |
7 |
4.59 |
|
3.46 |
|
4.34 |
|
13 |
|
|
9 |
4.11 |
|
2.99 |
|
3.38 |
|
7 |
|
| Jabal Sayid (50%) |
8 |
2.11 |
|
1.29 |
|
1.46 |
|
4 |
|
|
8 |
1.96 |
|
1.44 |
|
1.55 |
|
4 |
|
|
|
|
|
|
|
|
|
|
|
|
|
a.Further information on these non-GAAP financial measures, including detailed reconciliations, is included on pages 44 to 59 of this MD&A.
b.Includes both minesite sustaining and project capital expenditures1.
Zaldívar (50%), Chile
Copper production for Zaldívar in Q2 2025 was 22% lower than Q1 2025 driven by lower throughput and recovery. COS/lb2 and C1 cash costs/lb1 were 12% and 16% higher, respectively, than Q1 2025, driven by lower production. AISC/lb1 in Q2 2025 was 28% higher compared to Q1 2025, driven by higher C1 cash costs/lb1 and higher minesite sustaining capital expenditures1.
In May 2025, Zaldívar’s Environmental Impact Assessment was approved. This approval enables the extension of Zaldívar’s mine life to 2051. Our investment in this asset, of which we are not the operator, continues to be a non-core part of our portfolio.
Jabal Sayid (50%), Saudi Arabia
Jabal Sayid's copper production in Q2 2025 was in line with Q1 2025 as lower grades processed were offset by higher recoveries. COS/lb2 for Q2 2025 was 8% higher than Q1 2025 due to higher processing unit rates, while C1 cash costs/lb1 decreased by 10% as higher gold by-product credits and lower treatment and refining costs more than offset these higher unit rates. AISC/lb1 in Q2 2025 decreased by 6% compared to Q1 2025, mainly due to lower C1 cash costs/lb1, partially offset by higher sustaining capital expenditures1 on a per pound basis.
|
|
|
|
|
|
|
|
|
BARRICK SECOND QUARTER 2025 |
29 |
MANAGEMENT'S DISCUSSION AND ANALYSIS |
Growth Projects
Goldrush Project, Nevada, USA6
Goldrush, which is included within Cortez, is expected to be a long-life underground mine with anticipated annual production in excess of 400,000 ounces of gold per year (100% basis) once in full production by 2028.
In Q2 2025, execution planning for the second surface ventilation raise was completed with construction preparation activities planned to begin in Q4. The additional fresh air intake to support equipment ramp up is expected in Q4 2026. Life of Mine ventilation modeling is planned to be updated next quarter to optimize future surface raises.
Surface dewatering began in Horse Canyon through the first of three wells planned in 2025. The second and third wells are planned to be commissioned in Q3 and Q4, respectively. Mine dewatering is on track with the next wells planned for 2027.
The material handling trade-off study was completed for ore and backfill aggregate transport. The portal pad and access road are currently being redesigned to accommodate Komatsu 930E haul trucks. The portal pad design will reflect the future paste backfill plant infrastructure and associated stockpiles for dry tailings.
Material testing continues with focus on optimizing the paste backfill makeup; specifically the paste pumping capability and cement content necessary to satisfy the backfill strength requirements. A summary test report is expected in Q3 which will help steer the project infrastructure required to deliver paste backfill to the mining operation. A conceptual design of the plant components has been developed and a technical review will be completed in Q3.
As of June 30, 2025, project spend was $457 million on a 100% basis (including $10 million in Q2 2025) inclusive of the exploration declines. This capital spent to date, together with the remaining expected pre-production capital, is still anticipated to be near the approximate $1 billion initial capital estimate for the Goldrush project (100% basis).
Fourmile, Nevada, USA7
Fourmile, located adjacent to Goldrush, is a 100% owned Barrick asset in Nevada and has the potential to be a standalone Tier One Gold Asset5. The current focus is on exploration drilling with promising results to date that support the potential to significantly increase the modeled extents of the declared mineral resource within the 2.5 kilometers of prospective Wenban stratigraphy, as well as to uplift the grade. A dedicated Barrick project development team and budget are targeting the extension of the existing mineral resources, while also evaluating an independent surface portal access from Bullion Hill, which would decouple the evaluation of the project from the existing Goldrush development and ultimately complement the current Goldrush multi-purpose development. Footwall development along the strike of the Fourmile orebodies would initially be used for underground exploration drilling and then later be re-purposed for ore haulage.
During Q2 2025, engineering work for the portal and execution plan of the Bullion Hill Decline continued to progress while the team also advanced the metallurgical studies and ongoing mining trade off studies in support of the PFS. The disturbance plan that was submitted to the
relevant authorities in Q1 2025, continues to progress on plan.
Drilling continued to ramp up to the largest drill campaign at Fourmile with 16 rigs active in Q2 for a total of 23,667m drilled. This drilling is focused on defining the orebody and delineating the overall Fourmile footprint, with drilling planned across the full strike length. Drilling is expected to continue at a similar pace in Q3, while results come in from earlier this year and are updated in the geologic model.
Barrick anticipates Fourmile will be incorporated into the NGM joint venture, at fair market value, if certain criteria are met. In Q2 2025, we spent $26 million, with a YTD spend of $31 million, out of an estimated $75 to $85 million for 2025 as we continue to expand the upside and continue conversion drilling in the known deposits. This will also cover additional study costs as we commence the PFS in 2025.
Ren, Nevada, USA8
Ren is a new ore deposit at Goldstrike Underground and a key expansion project at Carlin. Located north of Goldstrike Underground’s Meikle and Banshee deposits, Ren is anticipated to produce an average of 140,000 ounces per year (contained ounces, 100% basis) once in full production in 2027.
To develop the deposit, the existing exploration drift will be duplicated, allowing for increased ventilation and secondary egress into the working area. Once completed, additional exploration drilling platforms will be constructed to support further drilling on the project allowing for both the conversion of the existing resource and further growth of the deposit.
To support production mining of the deposit, an additional set of twin declines will be driven from the Betze-Post open pit to the north with the intent to provide life of mine ventilation to the deposit as well as a direct path for material to be hauled and hoisted out via the existing Meikle Headframe. To complete the project, a seven meter ventilation shaft will be sunk 550 meters to serve as an exhaust raise and utility conduit for mining the orebody.
During Q2 2025, work on the secondary drift development was impacted by the replacement of the development contractor with internal resources at a lower cost. Remaining drill bays were completed to facilitate the 2025 drilling program and remaining development around the JB zone is anticipated to be completed in Q3. Rehabilitation of the initial exploration drift is largely complete, which has improved area egress and ventilation. Infill conversion drilling continued with a total of 4,150 meters through the end of Q2, with the assay results starting to come back to support the conversion updates. Final contract negotiations advanced for the Ren ventilation shaft construction and a contract is expected to be awarded in Q3.
As of June 30, 2025, project spend was $115 million (including $20 million in Q2 2025) out of an estimated capital cost of $410 to $470 million (100% basis).
Pueblo Viejo Expansion, Dominican Republic9
The Pueblo Viejo Life of Mine Expansion continues to focus on housing, resettlement, and the Naranjo Tailings Storage Facility. Engineering work is ongoing to optimize design,
|
|
|
|
|
|
|
|
|
BARRICK SECOND QUARTER 2025 |
30 |
MANAGEMENT'S DISCUSSION AND ANALYSIS |
complete permitting and advance the project on schedule. Current field work includes the dam access road, the diorite filter access road, development of the diorite filter quarry, and ongoing drilling for site investigation.
The housing project continues with 402 homes constructed and 82 families now resettled. The east side of the project is on track, which includes the sewage treatment plant, two community centers and the elementary school.
The overall resettlement process continues to advance, with key issues resolved and the agreement between the mine, communities and government successfully executed. The Resettlement Action Plan is progressing with asset inventories nearing completion and package presentations progressing well.
As at June 30, 2025, total project spend was $1,165 million (including $22 million in Q2 2025) on a 100% basis. The estimated capital cost of the plant expansion and mine life extension project remains approximately $2.6 billion (100% basis).
Veladero Phase 8 Leach Pad, Argentina
The construction of the Phase 8 leach pad will be divided into three phases being 8A, 8B and 8C. In December 2024, the Phase 8A leach pad construction project was approved. Construction started in Q1 2025 and is expected to be completed by Q1 2026. Construction of the phase includes cutting, filling, sub-drainage and monitoring, leak collection and recirculation, impermeabilization, as well as pregnant leaching solution collection.
Overall, for the Phase 8 leach pad, as at June 30, 2025, project spend was $53 million ($14 million in Q2) out of an estimated capital cost of $250-270 million (100% basis).
Reko Diq Project, Pakistan10
At the end of 2024, Barrick completed a full update of the project’s 2010 feasibility study and 2011 expansion prefeasibility study and added 7.3 million tonnes of copper and 13 million ounces of attributable gold in probable reserves as at December 31, 202411. Once fully commissioned, the Reko Diq project is projected to deliver 240,000 tonnes of copper production and 297,000 ounces of gold per year during Phase 1 increasing to 460,000 tonnes of copper and 520,000 ounces of gold during the first ten years (2034-2043) of Phase 2 (100% basis). This is based on an increased 45Mtpa process plant throughput in Phase 1 (from the original 40Mtpa) and 90Mtpa (from the original 80Mtpa) in Phase 2, following the grind size optimization work undertaken as part of the feasibility study. The total estimated capital cost of Phase 1 is $5.6-6.0 billion (100% basis, exclusive of capitalization of financing costs) to be spent between 2025-2029. On February 11, 2025, the Board of Directors conditionally approved the development of Phase 1 subject to the closing of approximately $3 billion of limited recourse project financing. Assuming $3 billion of project financing, Barrick’s share of the total partner equity contribution required to fund the construction of Phase 1 is expected to be $1.4-1.7 billion (exclusive of capitalization of financing costs). The total estimated capital cost of Phase 2 is $3.3-3.6 billion (100% basis, exclusive of capitalization of financing costs) to be spent between 2029-2033.
Q2 was focused on finalizing the Fluor contract, with the Full Notice to Proceed now executed, and integrating engineering optimizations into the execution schedule. Key construction package definitions advanced
ahead of tendering, while major equipment contracts were signed to initiate long-lead procurement. Early works progressed on site infrastructure, and regulatory approvals remained on track.
Capital expenditures commenced in Q2 2024, with total capitalized spend to date of $421 million (including $193 million in Q2 2025) (100% basis).
For 2025, the spend profile has been optimized with suppliers and continues to be less than $1 billion (100% basis) with the project schedule remaining on track.
Kibali Solar Project, DRC
This project entails the design, supply and installation of a 16 MW photovoltaic solar farm with a 15 MW battery energy storage system to complement the existing hydroelectric power stations raising the renewable component of the mine’s energy mix from 81% to 85%. The completion of this project is projected to deliver a 53% reduction in fuel consumption in the power plant. During Q2 2025, the commissioning of the solar PV field with its associated tracking system and battery energy storage system (BESS) has been completed. This enabled the injection of power from the PV field into the Kibali power grid to commence. The final phase and area of focus for Q3 2025 includes the integration of the solar PV field and BESS in the power management system to ensure the full utilization of the benefits provided by the solar project. As at June 30, 2025, project spend was $40 million (including $1 million in Q2 2025) out of an estimated capital cost of $55 million (100% basis).
Lumwana Super Pit Expansion, Zambia12
The Lumwana Super Pit Expansion is projected to deliver 240,000 tonnes of copper production per year, from a 52Mtpa process plant expansion, with a mine life of more than 30 years. Following the successful transition in 2023 to the owner stripping model we have already seen the 20% planned cost and efficiency benefit which aligns well with the interim mine volumes and longer-term expansion strategy.
The project execution schedule was risk assessed during Q2 2025 which maintains our target of first copper production in Q1 2028 and provides a clear outline of the critical path influenced by engineering, procurement and construction. The main critical path for the process plant expansion is the mill building, driven by concrete volumes. Long lead equipment manufacturing is continuing to make progress with certified vendor data provided to continue detailed engineering of the process plant. Procurement of future packages is tracking on schedule with the award of key packages during the quarter, including the civil package for the wet plant, construction package of the pebble crusher and conveyor mechanical equipment.
The geotechnical site investigation report has been handed over to the engineering consultant where remediation work for the pebble crusher and milling foundations has commenced.
The current construction activities which involves enabling earthworks construction at the wet plant, including critical road infrastructure, has made steady progress during Q2 2025.
The building of the first accommodation units for the construction camp has been completed and handed over to operations during Q2. Procurement and construction for the next phase of accommodation units has
|
|
|
|
|
|
|
|
|
BARRICK SECOND QUARTER 2025 |
31 |
MANAGEMENT'S DISCUSSION AND ANALYSIS |
commenced. The TSF design and reviews have been completed and the construction of the first diversion channel for the expanded facility is currently in progress.
Positive progress of the detailed engineering, procurement and construction ensured that the total project remains ahead of schedule. We have now successfully integrated with the new engineering, procurement, and construction management and have delivered an updated execution schedule which delivers on all key milestones set out in the feasibility study. Following this updated execution
schedule, an updated forecast of the project cash flow for 2025 has been completed to ensure it is fully aligned. The spend profile has been optimized with suppliers and is now expected to be approximately $350 million in 2025 with no impact on the project schedule. As at Q2 2025, we have spent $60 million, (including $44 million in Q2 2025). As at June 30, 2025, the total spend on the expansion project is $222 million. The total project capital cost (exclusive of capitalized stripping) is expected to be $2 billion based on the approved feasibility study.
Exploration and Mineral Resource Management
The foundation of our exploration strategy is a deep organizational understanding that discovery through exploration is a long-term investment and the main value driver for the business. Our exploration strategy has multiple elements that all need to be in balance to deliver on Barrick's business plan for growth and long-term sustainability.
First, we seek to deliver projects of a short- to medium-term nature that will drive improvements in mine plans. Second, we seek to make new discoveries that add to Barrick's Tier One Gold Asset5 portfolio. Third, we work to optimize the value of our major undeveloped projects and finally, we seek to identify emerging opportunities early in their value chain and secure them, where appropriate.
The following section summarizes the exploration results from Q2 2025.
North America
Carlin, Nevada, USA
Drilling during the quarter on the Carlin Trend focused on near-mine conversion drilling, primarily at Leeville, Ren and Arturo. Results to date have been in line with expectations, validating high-grade mineral controls and confirming the deposit geology.
Several drill programs on earlier stage projects began during the quarter and are currently in progress. To date, holes have been completed at Greater Leeville, Carlin Basin, and several near-mine targets proximal to Goldstrike.
At Greater Leeville, a completed hole testing the mineralization controlling stratigraphy along the Lynn/Big 6 corridor has intersected moderate decalcification and anomalism at the target horizon, expanding the target footprint. Assays are pending, and three additional holes are in progress.
Following the success of the Carlin Basin top-of-bedrock and framework drilling completed in 2024, two of the most prospective targets are currently being drill tested. Strong geochemical anomalism in combination with the projections of the Good Hope and Chucker/Alunite fault zones from the Gold Quarry deposit framing the target opportunities.
At Goldstrike underground, near-mine drilling has identified a new zone of strong brecciation, sulfidation and dyking along the Post Fault in a previously undrilled area of the main structural trend. Situated at a slightly deeper elevation to previous drilling and mining levels, this new zone, called the GAP, between Meikle and Rodeo, shows strong indications for well developed breccia hosted mineralization in the primary host lithologies present elsewhere on the trend. Assays are currently pending for the first hole, and follow-up drilling is in progress, testing the
remainder of the 700 meter strike length potential of the target area.
Cortez, Nevada, USA13
Within the Hanson system, below the Cortez Hills Underground operation, the first surface core hole at the Birch target returned 8.5 meters at 7.41 g/t Au. These results confirm 100 meters strike of continuous high-grade hosted in silica-sulfide breccia. Drilling will continue to test additional strike length in support of a near-term incremental resource addition.
At Swift, delivery of a new model resolves thrust-fold complexities and has generated targets of potential feeding structures. Targeted drilling will begin in Q3.
At Goldrush, growth and exploration drilling was deferred during mine development. Mineralization remains open in multiple directions along the five-kilometer strike of the deposit providing a significant upside opportunity. Drilling will begin in the second half of 2025 targeting a significant ounce addition in the southern KB area.
Turquoise Ridge, Nevada, USA
New geologic information from multiple drilling programs around Turquoise Ridge has better defined the framework around the mine, generating a stronger interpretation on the primary FED and MBD zones, whilst confirming the presence of significant ore-controlling features around both zones with step-out drilling also intersecting alteration along the Turquoise Ridge and Getchell-parallel faults. Assays are pending.
Infill drilling has begun in the Mega Pit further defining Cut 55 mineralization and structural controls. An expansion of the existing reserve pit shell is anticipated as a result of this program, which will not only contribute additional reserve ounces to our open pit operations but also enhance the value of the present designs.
Regional, Nevada Gold Mines
NGM’s regional exploration team is investigating greenfield opportunities within the joint venture. Multiple deposit types are being considered to deliver value to the company with an open-minded approach. The underexplored Jurassic Park project at Buffalo Mountain on newly acquired ground shows copper-gold porphyry potential in a large intrusive complex where exploration is currently in progress.
Regional, USA
Barrick’s regional exploration team continues to identify and acquire opportunities for discovery of both gold and copper deposits across the western USA. Geologic fieldwork is in progress across the portfolio, supplemented by geophysical surveys. Several properties are currently in the drill
|
|
|
|
|
|
|
|
|
BARRICK SECOND QUARTER 2025 |
32 |
MANAGEMENT'S DISCUSSION AND ANALYSIS |
permitting stage with various federal and state agencies. Drilling will start on one epithermal project in western Nevada in Q3, while three other projects in Nevada, Arizona and Montana are expected to be approved for drilling in Q4.
Patris, Quebec, Canada
The Patris earn-in agreement with Midland Exploration was terminated in May 2025.
Norris, Ontario, Canada
Wide-space framework drilling along a covered stretch of the Cadillac-Larder Lake deformation zone and associated second order structures intercepted broad zones of alteration and pathfinder geochemistry. Interpretation and data analysis is ongoing and expected to lead to targeted drilling in Q3 2025.
Regional, Canada
Two new consolidated greenfield opportunities were acquired through map staking in Quebec during Q2 in the Cornier and Laflamme areas, comprising approximately 70,000 hectares over major structures and associated basins. The area has seen little previous exploration. Field reconnaissance, including mapping and prospecting will start in Q3 2025.
Latin America & Asia-Pacific
Pueblo Viejo, Dominican Republic
At Pueblo Viejo, the team has refined six priority areas of interest for epithermal gold mineralization. Follow-up fieldwork has identified Mejita Tails—located approximately one kilometer southeast of the Moore pit—as the current top-ranked target. A 2,000-meter diamond drill program is scheduled to begin in August 2025 to test this area. Work continues across the remaining targets, with additional drill-ready prospects expected to be defined by year-end.
Regional Exploration, Dominican Republic
At the Restauracion District, located in the western Dominican Republic, geological work continues to advance across four large areas of interest with potential for epithermal and porphyry-style gold mineralization. Two target areas: Simon (three by two kilometers) and Mariano (five by three kilometers) have emerged as the most prospective. An Induced Polarization geophysical survey is planned for Q3. Drill-ready targets are expected to be defined in both areas by year-end.
Jamaica
Early-stage exploration activities continued under the earn-in agreement with Geophysx Jamaica Ltd., focused on two prioritized camp-scale areas with potential for epithermal and porphyry-style gold mineralization along Jamaica’s Cretaceous and Paleocene belts. Induced Polarization and Audio Magnetotelluric ground geophysical surveys will be completed in the Central district in Q3 with the objective to define drill-ready targets by year-end. Along the Paleocene Belt, the goal is to define the top-priority target and progress it toward drill-ready status in the first half of 2026.
Veladero District, Argentina14, 15
The discovery of new ounces that support the extension of Veladero’s Life of Mine remains a key priority. The current exploration program is combining near-mine drilling with a district-scale review focused on identifying additional oxidized high-sulfidation gold systems. Multiple epithermal
gold targets have been prioritized, including Porfiada, Argenta Block, Filo Norte and The Wall with drill programs expected to resume in the second half of the year.
At the Porfiada target, located five kilometers north of the Veladero pit, drilling has confirmed an oxidized high-sulfidation system with similar characteristics to Veladero with a broad surface footprint of approximately 1.4 kilometers by 500 meters, marked by extensive steam-heated alteration, indicating good preservation. Hole DDH-POR-05 returned two encouraging intercepts: 53.8 meters at 0.36 g/t Au from 61 meters and 34.5 meters at 1.93 g/t Au from 301.5 meters. Large portions of the alteration footprint remain untested, and follow-up drilling is planned after the winter season.
At the Argenta Block, located five kilometers south of the Veladero pit, recent drilling is testing the southwestern extension of the historically mined deposit. Notably, hole DDH-ARG-014 returned 21.4 meters at 0.56 g/t Au from 170 meters including 5.15 meters at 1.05 g/t Au from 170.85 meters, opening up a potential 500-meter extension of the Argenta ore shoot. Follow-up drilling is ongoing.
Peru
Exploration activities in Peru are focused on consolidating large, prospective land positions across proven mineral belts. The portfolio spans from reconnaissance work to first-pass drilling, targeting high-sulfidation gold and porphyry copper and gold systems.
At the Ccoropuro copper–gold porphyry district in southern Peru, a drilling program, which began in early Q3, will test multiple targets defined by geological mapping, geochemical anomalies, and remote sensing. The district remains largely underexplored, with significant potential to define new porphyry centers.
In the Alqo Sub-belt, exploration work is advancing over a large, recently consolidated land position in a prospective segment of the Eocene–Oligocene belt, located between the Constancia and Tintaya porphyry districts. Early field results are encouraging and target delineation is ongoing, with further technical and land access work expected to continue through the second half of the year.
Reko Diq, Pakistan16
Exploration activities at Reko Diq continue to progress positively, with a strong focus on enhancing geological understanding across the district.
At Bukit Pasir, located four kilometers northeast of the Western Porphyries, drilling has confirmed a significant new copper–gold porphyry discovery. To date, drilling has defined a mineralized footprint of more than 700 meters north–south by 600 meters east–west, with continuous copper–gold mineralization intercepted from shallow depths (approximately 30 meters). Hole RD-001184, located 200 meters north of previously reported hole RD-001183, intercepted 974 meters at 0.51% Cu and 0.25 g/t Au from 24 meters, including 630 meters at 0.60% Cu and 0.26 g/t Au from 356 meters. Hole RD-001188, located 200 meters east of RD-001184 intercepted 1,030 meters at 0.54% Cu and 0.25 g/t Au from 22 meters, including 482 meters at 0.80% Cu and 0.32 g/t Au from 570 meters. The Bukit Pasir system remains open in several directions, and structural interpretation suggests that higher-grade mineralization may become shallower toward the north, enhancing its potential for near-surface resource definition. Follow-up drilling is planned for the second half of the year, with the
|
|
|
|
|
|
|
|
|
BARRICK SECOND QUARTER 2025 |
33 |
MANAGEMENT'S DISCUSSION AND ANALYSIS |
objective of advancing the project to a more advanced exploration stage by year-end.
A 60-square-kilometer 3D Induced Polarization geophysical survey covering the mining lease — including Bukit Pasir and the Western Porphyries — is scheduled to commence in Q3. The data will support petrophysical characterization and prioritization of additional targets, particularly those under cover.
At the same time, the team continues to advance the Exploration License area through regional mapping, transects, and a systematic target ranking process.
Porgera, Papua New Guinea
At the Wangima target, diamond drilling continued during the quarter, with total drilling reaching 11,626 meters by the end of Q2. A resource model update and pit optimization study incorporating Wangima was completed during the period, and the results are now being used to guide and optimize follow-up drilling.
In parallel, a comprehensive geological, structural, and mineralization review was completed across the Porgera Special Mining Lease and adjacent Exploration Leases. This work has confirmed the presence of multiple new exploration targets. Field programs, including mapping and geochemical sampling, were designed during Q2 and are scheduled for execution across 2025 and 2026 to advance target delineation and drill planning.
Japan Gold Strategic Alliance, Japan
At Ebino, located near the Hishikari deposit, drilling commenced during Q2 to test low-sulfidation epithermal gold targets. Two diamond drillholes were completed, and a third is in progress. Drilling intersected silica–clay alteration zones, consistent with epithermal environments. Assay results are pending and expected in Q3, with interpretation of geological features ongoing.
Africa and Middle East
Kibali, DRC17
At ARK, drilling is currently underway, targeting the delivery of a high-grade, multi-million-ounce orebody located approximately four kilometers from the processing plant. During Q2 drilling identified multiple new zones of mineralization within the system. With follow-up work, these discoveries have the potential to support further expansions of both open-pit and underground resources. Notable intercepts include AGDD0032, which returned 19.72 meters at 5.44 g/t Au from 88.28 meters, including a high-grade interval of 3.45 meters at 23.76 g/t Au from 95.55 meters, and RKDD0061, with 19.1 meters at 3.08 g/t Au from 266.00 meters, including 4.9 meters at 7.99 g/t Au from 268.31 meters.
Meanwhile, framework drilling is testing the outer limits of the ARK system to expand the highly prospective search space, particularly down-plunge. These efforts have intersected mineralized lodes that represent a 350-meter extension down-plunge, beyond any previous drilling, with the system remaining open at depth. Significant results from this phase include 8.9 meters at 4.24 g/t Au from 561.10 meters in ADD045 and 10.4 meters at 3.06 g/t Au from 371.60 meters in ADD049, which includes 7 meters at 4.00 g/t Au.
At KCD, deep directional drilling successfully intersected the extension of the KCD host geology and mineralization system 500 meters down-plunge from the previous deepest drill holes (one kilometer vertical depth).
An underground exploration drive is being planned to more efficiently drill test and unlock the extensions of the multiple main lodes in the KCD system which remain open in multiple directions.
North Mara and Bulyanhulu, Tanzania18
At North Mara, a 45-hole reverse circulation drilling program is underway at the Tagota complex, targeting a one by two and a half kilometer gold-bearing hydrothermal system identified through earlier exploration phases. The program aims to assess the potential of this target to host a significant satellite deposit, located approximately 17 kilometers from the processing plant. While most assay results are still pending, those received to date are encouraging and confirm the presence of a broad, mineralized envelope such as TGRC054: 22 meters at 1.48 g/t Au from 87 meters, including 5 meters at 4.65 g/t Au.
On the Nzega Belt, target delineation drilling programs have commenced on prioritized segments of the 150 kilometer long fertile structural corridor. These programs are focused on identifying large-scale mineralized systems beneath extensive post-mineral cover, which may have preserved the potential for undiscovered gold.
High-resolution geophysical surveys began in early Q3 at both Nzega and Siga. These surveys will support detailed geological interpretations, guiding follow-up geochemical drilling programs and enabling the generation of high-priority exploration targets.
Jabal Sayid, Kingdom of Saudi Arabia
Deep penetrating ground electromagnetics and high-resolution gravity surveys have been completed over the prospective corridors on the Jabal Sayid mining license and geophysical crews have now moved to survey the prospective corridors in the Umm ad Damar and Jabal Sayid South Exploration licenses which are located close to the Jabal Sayid Mine. Priority targets identified from this work will be tested in Q3. Beneath Lode 4 at Jabal Sayid, a deep diamond drilling program has commenced to test for repeating zones of mineralization along the main controlling structures.
Lumwana, Zambia and Central African Copperbelt
In the Central African Copperbelt at Lumwana, drilling has commenced at the Odile target located less than 10 kilometers west of the Malundwe Pit, testing for a repetition of the Malundwe Ore Schist. The two drillholes completed to date have intersected ore schist, with assay results pending. The program will test the potential for Odile to deliver a high grade satellite to provide flexibility to Lumwana.
Further afield the regional greenfield portfolio across the Copperbelt has expanded significantly with four new exploration licenses being granted in Q2 covering 3,818km2. Target delineation programs have commenced across the portfolio aiming to deliver the Copperbelt’s next major discovery.
|
|
|
|
|
|
|
|
|
BARRICK SECOND QUARTER 2025 |
34 |
MANAGEMENT'S DISCUSSION AND ANALYSIS |
Review of Financial Results
Revenue
|
|
|
|
|
|
|
|
|
|
|
|
|
|
|
|
|
|
| ($ millions, except per oz/lb data in dollars) |
|
For the three months ended |
For the six months ended |
| |
6/30/25 |
3/31/25 |
6/30/24 |
6/30/25 |
6/30/24 |
| Gold |
|
|
|
|
|
000s oz solda |
770 |
|
751 |
|
956 |
|
1,521 |
|
1,866 |
|
000s oz produceda |
797 |
|
758 |
|
948 |
|
1,555 |
|
1,888 |
|
| Market price ($/oz) |
3,280 |
|
2,860 |
|
2,338 |
|
3,067 |
|
2,203 |
|
Realized price ($/oz)b |
3,295 |
|
2,898 |
|
2,344 |
|
3,099 |
|
2,213 |
|
| Revenue |
3,280 |
|
2,766 |
|
2,868 |
|
6,046 |
|
5,396 |
|
| Copper |
|
|
|
|
|
000s tonnes solda |
54 |
|
51 |
|
42 |
|
105 |
|
81 |
|
000s tonnes produceda |
59 |
|
44 |
|
43 |
|
103 |
|
83 |
|
| Market price ($/lb) |
4.32 |
|
4.24 |
|
4.42 |
|
4.28 |
|
4.12 |
|
Realized price ($/lb)b |
4.36 |
|
4.51 |
|
4.53 |
|
4.43 |
|
4.21 |
|
| Revenue |
337 |
|
304 |
|
219 |
|
641 |
|
382 |
|
| Other sales |
64 |
|
60 |
|
75 |
|
124 |
|
131 |
|
| Total revenue |
3,681 |
|
3,130 |
|
3,162 |
|
6,811 |
|
5,909 |
|
a.On an attributable basis.
b.Further information on these non-GAAP financial measures, including detailed reconciliations, is included on pages 44 to 59 of this MD&A.
Q2 2025 compared to Q1 2025
In Q2 2025, gold revenues on a consolidated basis increased by 19% compared to Q1 2025, as a higher realized gold price1 was combined with higher sales volumes. The average market price for Q2 2025 was $3,280/oz, representing an all-time high quarterly average and a 15% increase versus the $2,860/oz average in Q1 2025. During Q2 2025, the gold price ranged from $2,957/oz to an all-time nominal high of $3,500/oz, and closed the quarter at $3,287/oz. Gold prices in Q2 2025 continued to be volatile, impacted by economic and geopolitical concerns, especially related to the potential impact of increased tariffs on global trade, and a decline in the value of the trade-weighted US dollar.
In Q2 2025, gold production on an attributable basis increased by 5% compared to Q1 2025 mainly as a result of planned shutdowns at Carlin, Pueblo Viejo and Kibali that occurred in the prior quarter. This was partially offset by lower production as a result of the temporary suspension of operations at Loulo-Gounkoto, which was subsequently placed under a temporary provisional administration on June 16, 2025 (refer to page 8 for further details).
ATTRIBUTABLE GOLD PRODUCTION VARIANCE (000s oz)
Q2 2025 compared to Q1 2025
In Q2 2025, copper revenues on a consolidated basis increased by 11% compared to Q1 2025, primarily due to higher sales volumes compared to Q1 2025, partially offset by a lower realized copper price1. The average market price in Q2 2025 was $4.32/lb, representing an increase of 2% from the $4.24/lb average in Q1 2025. The realized copper price1 in Q2 2025 was slightly higher than the market copper price due to the timing of sales, whereas the realized copper price1 was higher than the market copper price in Q1 due to the impact of positive provisional pricing adjustments. During the first half of 2025, the copper price traded in a range of $3.68/lb to $4.61/lb, and closed the quarter at $4.55/lb. Copper prices in Q2 2025 were impacted by a decline in the trade-weighted US dollar, concerns about the global economy resulting from global trade disputes, the flow of physical copper due to potential tariffs, and demand forecasts in China, which is the world’s largest consumer of copper.
Attributable copper production in Q2 2025 was 15 thousand tonnes higher compared to Q1 2025 mainly driven by higher throughput, grades and recovery at Lumwana.
Q2 2025 compared to Q2 2024
For Q2 2025, gold revenues on a consolidated basis increased by 14% compared to Q2 2024, primarily due to a higher realized gold price1, partially offset by lower sales volumes. The average market price for Q2 2025 was $3,280/oz versus $2,338/oz for Q2 2024.
ATTRIBUTABLE GOLD PRODUCTION VARIANCE (000s oz)
Q2 2025 compared to Q2 2024
|
|
|
|
|
|
|
|
|
BARRICK SECOND QUARTER 2025 |
35 |
MANAGEMENT'S DISCUSSION AND ANALYSIS |
For Q2 2025, attributable gold production was 151 thousand ounces lower than Q2 2024, primarily as a result of the temporary suspension of operations at Loulo-Gounkoto, which was subsequently placed under a temporary provisional administration on June 16, 2025. This was combined with lower production at Carlin resulting from the planned shutdown at the Gold Quarry roaster.
For Q2 2025, copper revenues on a consolidated basis increased by 54% compared to Q2 2024, due to increased sales volumes, partially offset by a lower realized copper price1. In Q2 2025, the realized copper price1 was higher than the market copper price, as discussed above, consistent with Q2 2024.
Attributable copper production for Q2 2025 was 16 thousand tonnes higher than Q2 2024, mainly due to higher grades processed and higher recoveries at Lumwana.
YTD 2025 compared to YTD 2024
For YTD 2025, gold revenues increased by 12% compared to YTD 2024, primarily due to an increase in the realized gold price1, partially offset by a decrease in sales volumes. The average market price for YTD 2025 was $3,067/oz versus $2,203/oz for YTD 2024.
For YTD 2025, attributable gold production was 333 thousand ounces lower than YTD 2024, primarily driven by the temporary suspension of operations at Loulo-Gounkoto, which was subsequently placed under a temporary provisional administration on June 16, 2025. This was combined with lower production at Carlin as a result of a decrease in underground tonnes mined, lower grades mined and lower recoveries at the autoclave.
Copper revenues for YTD 2025 increased by 68% compared to YTD 2024, as a result of higher sales volume, combined with a higher realized copper price1. For YTD 2025, the realized copper price1 was higher than the market copper price due to the impact of positive provisional pricing adjustments, consistent with YTD 2024.
Attributable copper production for YTD 2025, increased by 20 thousand tonnes compared to YTD 2024, mainly due to higher grades processed and higher recovery rates at Lumwana.
Production Costs
|
|
|
|
|
|
|
|
|
|
|
|
|
|
|
|
|
|
| ($ millions, except per oz/lb data in dollars) |
|
For the three months ended |
For the six months ended |
| |
6/30/25 |
3/31/25 |
6/30/24 |
6/30/25 |
6/30/24 |
| Gold |
|
|
|
|
|
| Site operating costs |
1,179 |
|
1,097 |
|
1,268 |
|
2,276 |
|
2,509 |
|
| Depreciation |
359 |
|
342 |
|
401 |
|
701 |
|
808 |
|
| Royalty expense |
103 |
|
95 |
|
99 |
|
198 |
|
187 |
|
| Mining and production taxes |
25 |
|
23 |
|
21 |
|
48 |
|
37 |
|
| Community relations |
10 |
|
11 |
|
10 |
|
21 |
|
19 |
|
| Cost of sales |
1,676 |
|
1,568 |
|
1,799 |
|
3,244 |
|
3,560 |
|
COS ($/oz)a |
1,654 |
|
1,629 |
|
1,441 |
|
1,641 |
|
1,433 |
|
TCC ($/oz)b |
1,239 |
|
1,220 |
|
1,059 |
|
1,229 |
|
1,055 |
|
AISC ($/oz)b |
1,684 |
|
1,775 |
|
1,498 |
|
1,728 |
|
1,489 |
|
| Copper |
|
|
|
|
|
| Site operating costs |
99 |
|
126 |
|
84 |
|
225 |
|
179 |
|
| Depreciation |
68 |
|
60 |
|
71 |
|
128 |
|
131 |
|
| Royalty expense |
25 |
|
21 |
|
16 |
|
46 |
|
28 |
|
| Community relations |
1 |
|
1 |
|
1 |
|
2 |
|
2 |
|
| Cost of sales |
193 |
|
208 |
|
172 |
|
401 |
|
340 |
|
COS ($/lb)a |
2.56 |
|
2.92 |
|
3.05 |
|
2.74 |
|
3.12 |
|
C1 cash costs ($/lb)b |
1.80 |
|
2.25 |
|
2.18 |
|
2.02 |
|
2.28 |
|
AISC ($/lb)b |
2.90 |
|
3.06 |
|
3.67 |
|
2.98 |
|
3.64 |
|
a.Gold COS/oz is calculated as cost of sales across our gold operations (excluding sites in closure or care and maintenance) divided by ounces sold (both on an attributable basis using Barrick's ownership share). Copper COS/lb is calculated as cost of sales across our copper operations divided by pounds sold (both on an attributable basis using Barrick's ownership share).
b.Further information on these non-GAAP financial measures, including detailed reconciliations, is included on pages 44 to 59 of this MD&A.
Q2 2025 compared to Q1 2025
In Q2 2025, gold cost of sales on a consolidated basis was 7% higher than Q1 2025, mainly due to higher sales volumes. Our 45% interest in Kibali and 24.5% interest in Porgera are equity accounted, and therefore each mine's cost of sales is excluded from our consolidated gold cost of sales. Our per ounce metrics, gold COS/oz2 and TCC/oz1, includes our proportionate share of cost of sales at our equity method investees, and were both 2% higher than Q1 2025, mainly driven by higher costs at Cortez due to higher tonnes shipped and processed at Carlin and increased processing costs at the Gold Quarry roaster due to the planned shutdown, combined with changes in the sales mix across the portfolio.
In Q2 2025, gold AISC/oz1, which also includes our proportionate share of equity method investees, decreased by 5% compared to Q1 2025. This was primarily due to lower minesite sustaining capital expenditures1, partially offset by higher TCC/oz1 as explained above.
In Q2 2025, copper cost of sales on a consolidated basis was 7% lower than Q1 2025, mainly due to lower site operating costs, partially offset by increased sales volumes. Our 50% interests in Zaldívar and Jabal Sayid are equity accounted and therefore, we do not include their cost of sales in our consolidated copper cost of sales. Our per pound metrics, copper COS/lb2 and C1 cash costs/lb1, include our proportionate share of cost of sales at our
|
|
|
|
|
|
|
|
|
BARRICK SECOND QUARTER 2025 |
36 |
MANAGEMENT'S DISCUSSION AND ANALYSIS |
equity method investees. Copper COS/lb2 and C1 cash costs/lb1 were 12% and 20% lower, respectively, compared to Q1 2025, primarily driven by lower unit costs at Lumwana due to the impact of higher grades processed and higher capitalised waste stripping.
In Q2 2025, copper AISC/lb1, which also includes our proportionate share of equity method investees, was 5% lower compared to Q1 2025, as a decrease in C1 cash costs/lb1 was partially offset by an increase in minesite sustaining capital expenditures1 .
Q2 2025 compared to Q2 2024
For Q2 2025, gold cost of sales on a consolidated basis was 7% lower than Q2 2024, mainly due to lower sales volumes. As described above, our per ounce metrics, gold COS/oz2 and TCC/oz1, include our proportionate share of cost of sales at our equity method investees, and were 15% and 17% higher, respectively, compared to Q2 2024. This was mainly due to the impact of less fixed cost dilution driven by lower throughput and to a lesser extent lower grades processed at a number of operations, combined with higher royalties (impact approximately $25/oz) associated with the higher realized gold price1.
For Q2 2025, gold AISC/oz1 was 12% higher than Q2 2024, primarily due to higher TCC/oz1, as described above, partially offset by lower minesite sustaining capital expenditures1 on a per ounce basis.
For Q2 2025, copper cost of sales on a consolidated basis was 12% higher than Q2 2024, primarily due to the impact of higher sales volumes. As described above, our per pound metrics, copper COS/lb2 and C1 cash costs/lb1, include our proportionate share of cost of sales at our equity method investees. Copper COS/lb2 and C1 cash costs/lb1 were 16% and 17% lower, respectively, compared to Q2 2024, due to higher grades processed driving greater fixed cost dilution at Lumwana.
For Q2 2025, copper AISC/lb1 was 21% lower than Q2 2024, primarily reflecting lower C1 cash costs/lb1, as per above, combined with lower minesite sustaining capital expenditures1.
YTD 2025 compared to YTD 2024
For YTD 2025, COS applicable to gold was 9% lower than YTD 2024, mainly due to lower sales volumes. On a per ounce basis, gold COS2 and TCC1, after including our proportionate share of COS at our equity method investees (refer to explanation above), were 15% and 16% higher, respectively, than YTD 2024. This was primarily due to the impact of less fixed cost dilution driven by lower throughput and to a lesser extent lower grades processed at a number of operations, combined with higher royalties (impact approximately $30/oz) associated with the higher realized gold price1.
For YTD 2025, gold AISC/oz1 increased by 16% compared to YTD 2024, primarily due to an increase in TCC/oz1, combined with higher minesite sustaining capital expenditures1 on a per ounce basis.
For YTD 2025, copper COS on a consolidated basis was 18% higher than YTD 2024, primarily due to the impact of higher sales volumes. Our per pound metrics, copper COS2 and C1 cash costs1, include our proportionate share of COS at our equity method investees (refer to explanation above). Copper COS/lb2 and C1 cash costs/lb1 were 12% and 11% lower, respectively, compared to YTD 2024, due to higher grades processed at Lumwana.
For YTD 2025, copper AISC/lb1 were 18% lower than YTD 2024, primarily due to a lower C1 cash costs/lb1, as discussed above, combined with lower minesite sustaining capital expenditures1 which was mainly driven by the decrease in waste stripping at Lumwana.
General and Administrative Expenses
|
|
|
|
|
|
|
|
|
|
|
|
|
|
|
|
|
|
| ($ millions) |
|
For the three months ended |
For the six months ended |
| |
6/30/25 |
3/31/25 |
6/30/24 |
6/30/25 |
6/30/24 |
| Corporate administration |
30 |
|
27 |
|
24 |
|
57 |
|
51 |
|
Share-based compensationa |
9 |
|
15 |
|
8 |
|
24 |
|
9 |
|
|
|
|
|
|
|
| General & administrative expenses |
39 |
|
42 |
|
32 |
|
81 |
|
60 |
|
a.Based on a US$20.91 share price as at June 30, 2025 (March 31, 2025: US$19.04 and June 30, 2024: US$16.67).
For YTD 2025, general and administrative expenses increased by $21 million compared to YTD 2024 mainly due to higher share-based compensation expenses attributed to an increase in our share price during the current period compared to a decrease in YTD 2024.
Exploration, Evaluation and Project Expenses
|
|
|
|
|
|
|
|
|
|
|
|
|
|
|
|
|
|
| ($ millions) |
|
For the three months ended |
For the six months ended |
| |
6/30/25 |
3/31/25 |
6/30/24 |
6/30/25 |
6/30/24 |
| Global exploration and evaluation |
53 |
|
27 |
|
47 |
|
80 |
|
71 |
|
| Project costs: |
|
|
|
|
|
| Reko Diq |
0 |
3 |
25 |
3 |
|
64 |
|
|
|
|
|
|
|
|
|
|
|
|
|
|
|
|
|
|
|
| Other |
22 |
|
19 |
|
19 |
|
41 |
|
38 |
|
|
|
|
|
|
|
|
|
|
|
|
|
| Global exploration and evaluation and project expense |
75 |
|
49 |
|
91 |
|
124 |
|
173 |
|
| Minesite exploration and evaluation |
7 |
|
5 |
|
6 |
|
12 |
|
19 |
|
| Total exploration, evaluation and project expenses |
82 |
|
54 |
|
97 |
|
136 |
|
192 |
|
Exploration, evaluation and project expenses for Q2 2025 increased by $28 million compared to Q1 2025 driven by higher global exploration and evaluation costs mainly due to increased activity at Fourmile (refer to Growth Projects section).
Exploration, evaluation and project expenses for Q2 2025 and YTD 2025 decreased compared to Q2 2024 and YTD 2024, respectively, driven by lower project costs at Reko Diq as the feasibility study was completed at the end of 2024 which resulted in the conversion of resources to mineral reserves and consequently costs are now capitalized consistent with our accounting policy.
|
|
|
|
|
|
|
|
|
BARRICK SECOND QUARTER 2025 |
37 |
MANAGEMENT'S DISCUSSION AND ANALYSIS |
Finance Costs, Net
|
|
|
|
|
|
|
|
|
|
|
|
|
|
|
|
|
|
| ($ millions) |
|
For the three months ended |
For the six months ended |
| |
6/30/25 |
3/31/25 |
6/30/24 |
6/30/25 |
6/30/24 |
Interest expensea |
99 |
|
98 |
|
109 |
|
197 |
|
202 |
|
| Accretion |
22 |
|
23 |
|
23 |
|
45 |
|
44 |
|
|
|
|
|
|
|
| Interest capitalized |
(16) |
|
(4) |
|
(12) |
|
(20) |
|
(25) |
|
| Other finance costs |
0 |
|
1 |
|
1 |
|
1 |
|
2 |
|
| Finance income |
(47) |
|
(56) |
|
(70) |
|
(103) |
|
(141) |
|
| Finance costs, net |
58 |
|
62 |
|
51 |
|
120 |
|
82 |
|
a.For Q2 2025 and YTD 2025, interest expense includes $8 million and $16 million, respectively, of non-cash interest expense relating to the Pueblo Viejo streaming agreement with Royal Gold Inc. (Q1 2025: $8 million; Q2 2024: $8 million; YTD 2024: $16 million). Interest expense also includes $4 million and $8 million, respectively, relating to finance costs in Argentina (Q1 2025: $4 million; Q2 2024: $16 million; YTD 2024: $16 million).
In Q2 2025, finance costs, net decreased compared to Q1 2025 mainly due to higher interest capitalized, partially offset by lower finance income.
For Q2 2025, finance costs, net increased by $7 million compared to Q2 2024, primarily due to lower finance income, partially offset by lower interest expense.
For YTD 2025, finance costs, net were $38 million higher than YTD 2024 as a result of lower finance income.
Additional Statement of Income Items
|
|
|
|
|
|
|
|
|
|
|
|
|
|
|
|
|
|
|
|
|
| ($ millions) |
|
For the three months ended |
For the six months ended |
|
|
|
| |
6/30/25 |
3/31/25 |
6/30/24 |
6/30/25 |
6/30/24 |
|
|
|
| Impairment charges |
0 |
|
4 |
|
1 |
|
4 |
|
18 |
|
|
|
|
| (Gain) loss on currency translation |
(2) |
|
2 |
|
5 |
|
0 |
|
17 |
|
|
|
|
| Closed mine rehabilitation |
(8) |
|
19 |
|
(9) |
|
11 |
|
(11) |
|
|
|
|
| Other expense |
353 |
|
170 |
|
80 |
|
523 |
|
97 |
|
|
|
|
Other Expense
Other expense in Q2 2025 was $353 million which mainly reflects the net loss of $1,035 million (pre-tax) on the deconsolidation of Loulo-Gounkoto following the change of control after it was placed under a temporary provisional administration on June 16, 2025 (refer to page 8 for further details), partially offset by the recognition of our investment in Loulo-Gounkoto. The details are summarized in the following table:
|
|
|
|
|
|
| Carrying value of net assets derecognized |
$(3,421) |
| Carrying value of non-controlling interest derecognized |
686 |
| Investment in Loulo-Gounkoto recognized |
1,700 |
| Loss of control (pre-tax) |
$(1,035) |
| Tax effects |
437 |
| Loss of control (post-tax) |
$(598) |
Other expense was offset by a gain of $745 million on the sale of our 50% interest in the Donlin Gold project. Other expense of $170 million in Q1 2025 mainly related to the signing of agreements to settle legacy legal matters in the Philippines related to Placer Dome Inc. (refer to note 17
of the Financial Statements for further details), combined with reduced operations costs at Loulo-Gounkoto. For Q2 2024 and YTD 2024, other expense mainly related to interest and penalties recognized following the settlement of the Zaldívar Tax Assessments in Chile.
For a further breakdown of other expense, refer to note 9 to the Financial Statements.
Income Tax Expense
Income tax expense was $102 million in Q2 2025. The unadjusted effective income tax rate in Q2 2025 was 8% of income before income taxes.
The underlying effective income tax rate on ordinary income in Q2 2025 was 26% after adjusting for the impact of foreign currency translation losses on deferred tax balances; the impact of the sale of the Donlin Gold project; the impact of Loulo-Gounkoto’s loss of control (derecognition of $437 million in current and deferred tax balances); the impact of Loulo-Gounkoto's reduced operations costs; and the impact of other expense adjustments.
We record deferred tax charges or credits if changes in facts or circumstances affect the estimated tax basis of assets and therefore, the expectations of our ability to realize deferred tax assets. The interpretation of tax regulations and legislation as well as their application to our business is complex and subject to change. We have significant amounts of deferred tax assets, including tax loss carry forwards, and also deferred tax liabilities. We also have significant amounts of unrecognized deferred tax assets (e.g. for tax losses in Canada). Potential changes in any of these amounts, as well as our ability to realize deferred tax assets, could significantly affect net income or cash flow in future periods. For further details on income tax expense, refer to note 10 of the Financial Statements.
Withholding Taxes
In Q2 2025, we recorded $30 million of dividend withholding taxes related to the undistributed and distributed earnings of our subsidiaries in Argentina and Saudi Arabia, and the undistributed earnings of our subsidiaries in the United States.
OECD Pillar Two model rules
We have applied the exception available under the amendments to IAS 12 published by the IASB in May 2023 and are not recognizing or disclosing information about deferred tax assets and liabilities related to Pillar Two income taxes. Our review of Pillar Two for the current year, based on the OECD’s Transitional Safe Harbour rules as implemented in the Global Minimum Tax Act in Canada, has not identified any material amounts to be accrued for Q2 2025. As the law is evolving, both in Canada and elsewhere, we will continue to monitor the impact of this legislation.
|
|
|
|
|
|
|
|
|
BARRICK SECOND QUARTER 2025 |
38 |
MANAGEMENT'S DISCUSSION AND ANALYSIS |
Financial Condition Review
Summary Balance Sheet and Key Financial Ratios
|
|
|
|
|
|
|
|
|
| ($ millions, except ratios and share amounts) |
As at 6/30/25 |
As at 12/31/24 |
| Total cash and equivalents |
4,802 |
4,074 |
| Current assets |
3,347 |
3,558 |
| Non-current assets |
39,138 |
39,994 |
| Total Assets |
47,287 |
47,626 |
| Current liabilities excluding short-term debt |
2,462 |
2,618 |
Non-current liabilities excluding long-term debta |
6,672 |
7,023 |
| Debt (current and long-term) |
4,729 |
4,729 |
| Total Liabilities |
13,863 |
14,370 |
| Total shareholders’ equity |
24,829 |
24,290 |
| Non-controlling interests |
8,595 |
8,966 |
| Total Equity |
33,424 |
33,256 |
Total common shares outstanding (millions of shares)b |
1,706 |
1,727 |
| Debt, net of cash |
(73) |
655 |
| Key Financial Ratios: |
|
|
Current ratioc |
3.21:1 |
2.89:1 |
Debt-to-equityd |
0.14:1 |
0.14:1 |
Net leveragee |
0.0:1 |
0.1:1 |
|
|
|
|
|
|
|
|
|
a.Non-current financial liabilities as at June 30, 2025 were $5,196 million (December 31, 2024: $5,215 million).
b.As of July 29, 2025, the number of common shares outstanding is 1,705,993,790.
c.Represents current assets divided by current liabilities (including short-term debt) as at June 30, 2025 and December 31, 2024.
d.Represents debt divided by total shareholders’ equity (including minority interest) as at June 30, 2025 and December 31, 2024.
e.Further information on these non-GAAP financial measures, including detailed reconciliations, is included on pages 44 to 59 of this MD&A.
Balance Sheet Review
Total assets were $47.3 billion as at June 30, 2025, slightly lower than total assets as at December 31, 2024, driven by the deconsolidation and derecognition of the assets, liabilities and non-controlling interests of Loulo-Gounkoto following the loss of control event as it was placed on temporary provisional administration on June 16, 2025. This was partially offset by the recognition of our investment in Loulo-Gounkoto and the cash proceeds received from the sale of our 50% interest in the Donlin project.
Our asset base is primarily comprised of non-current assets such as property, plant and equipment and equity method investments, reflecting the capital-intensive nature of the mining business and our history of growing through acquisitions and creation of joint ventures with other mining companies. Other significant assets include our investment in Loulo-Gounkoto, production inventories, indirect taxes recoverable and receivable, concentrate sales receivable, other government and joint venture related receivables, as well as cash and equivalents.
Total liabilities at June 30, 2025 were $13.9 billion, $0.5 billion lower than total liabilities at December 31, 2024, as a result of the deconsolidation and derecognition of the assets, liabilities and non-controlling interests of Loulo-Gounkoto, as described above. Our liabilities are primarily comprised of debt, other non-current liabilities (such as provisions and deferred income tax liabilities), and accounts payable.
Financial Position and Liquidity
We believe we have sufficient financial resources to meet our business requirements for the foreseeable future, including capital expenditures, working capital requirements, interest payments, environmental rehabilitation, securities buybacks and dividends.
Total cash and cash equivalents as at June 30, 2025 were $4.8 billion. Our capital structure comprises a mix of debt, non-controlling interest (primarily at NGM) and shareholders’ equity. As at June 30, 2025, our total debt was $4.7 billion (debt, net of cash and equivalents was $(73) million) and our debt-to-equity ratio was 0.14:1. This compares to total debt as at December 31, 2024 of $4.7 billion (debt, net of cash and equivalents was $655 million), and a debt-to-equity ratio of 0.14:1.
Uses of cash for the remainder of 2025 include capital commitments of $937 million, and we expect to incur attributable minesite sustaining1 and project capital expenditures1 of approximately $1,800 to $2,300 million during the remainder of the year, based on our annual guidance range on page 10. For the remainder of 2025, we have contractual obligations and commitments of $827 million for supplies and consumables. In addition, we have $143 million in interest payments and other amounts as detailed in the table on page 42. We expect to fund these commitments through operating cash flow, which is our primary source of liquidity, as well as our existing cash balances as necessary. As previously disclosed, we have authorized a share buyback program, where we may purchase up to $1 billion of Barrick shares. As at June 30, 2025, we have purchased $411 million of shares under this program.
We also have a performance dividend policy that enhances shareholder returns when the Company’s liquidity is strong. In addition to our base dividend, the amount of the performance dividend on a quarterly basis will be based on the amount of cash, net of debt, on our balance sheet at the end of each quarter as per the schedule below.
|
|
|
|
|
|
|
|
|
BARRICK SECOND QUARTER 2025 |
39 |
MANAGEMENT'S DISCUSSION AND ANALYSIS |
|
|
|
|
|
|
|
|
|
|
|
|
|
|
|
| Performance Dividend Level |
Threshold Level |
Quarterly Base Dividend |
Quarterly Performance Dividend |
Quarterly Total Dividend |
| Level I |
Net cash <$0 |
$0.10
per share |
$0.00
per share |
$0.10
per share |
| Level II |
Net cash
>$0 and <$0.5B |
$0.10
per share |
$0.05
per share |
$0.15
per share |
| Level III |
Net cash
>$0.5B and <$1B |
$0.10
per share |
$0.10
per share |
$0.20
per share |
| Level IV |
Net cash >$1B |
$0.10
per share |
$0.15
per share |
$0.25
per share |
The declaration and payment of dividends is at the discretion of the Board of Directors, and will depend on the company’s financial results, cash requirements, future prospects, the number of outstanding common shares, and other factors deemed relevant by the Board.
Our operating cash flow is dependent on the ability of our operations to deliver projected future cash flows. The market price of gold and to a lesser extent, copper, are the primary drivers of our operating cash flow. Other options to enhance liquidity include portfolio optimization; issuance of equity or long-term debt securities in the public markets or to private investors (Moody’s and S&P currently rate Barrick’s outstanding long-term debt as investment grade, with ratings of A3 and BBB+, respectively); and drawing on the $3.0 billion available under our undrawn Credit Facility (subject to compliance with covenants and the making of certain representations and warranties, this facility is available for drawdown as a source of financing). In May 2025, we completed an update to our undrawn $3.0 billion revolving credit facility, including an extension of the termination date by one year to May 2030. The revolving Credit Facility incorporates sustainability-linked metrics and are made up of annual environmental and social performance targets directly influenced by Barrick's actions, rather than based on external ratings. The performance targets include Scope 1 and Scope 2 GHG emissions intensity, water use efficiency (reuse and recycling rates), and TRIFR3. Barrick may incur positive or negative pricing adjustments on drawn credit spreads and standby fees based on its sustainability performance versus the targets that have been set. The key financial covenant in our undrawn Credit Facility requires Barrick to maintain a net debt to total capitalization ratio of less than 0.60:1. Barrick’s net debt to total capitalization ratio was 0.00:1 as at June 30, 2025 (0.02:1 as at December 31, 2024).
Summary of Cash Inflow (Outflow)
|
|
|
|
|
|
|
|
|
|
|
|
|
|
|
|
|
|
| ($ millions) |
For the three
months ended |
For the six months ended |
| |
6/30/25 |
3/31/25 |
6/30/24 |
6/30/25 |
6/30/24 |
| Net cash provided by operating activities |
1,329 |
|
1,212 |
|
1,159 |
|
2,541 |
|
1,919 |
|
| Investing activities |
|
|
|
|
|
| Capital expenditures |
(934) |
|
(837) |
|
(819) |
|
(1,771) |
|
(1,547) |
|
| Divestitures |
999 |
|
0 |
|
0 |
|
999 |
|
0 |
|
| Income taxes paid on divestitures |
(87) |
|
0 |
|
0 |
|
(87) |
|
0 |
|
| Funding of equity method investments |
0 |
|
0 |
|
(11) |
|
0 |
|
(55) |
|
| Dividends received from equity method investments |
53 |
|
38 |
|
42 |
|
91 |
|
89 |
|
| Shareholder loan repayments from equity method investments |
53 |
|
60 |
|
45 |
|
113 |
|
90 |
|
| Investment sales |
0 |
|
0 |
|
33 |
|
0 |
|
33 |
|
| Other |
2 |
|
0 |
|
7 |
|
2 |
|
7 |
|
| Total investing inflows/(outflows) |
86 |
|
(739) |
|
(703) |
|
(653) |
|
(1,383) |
|
Net change in debta |
(16) |
|
(3) |
|
(4) |
|
(19) |
|
(7) |
|
|
|
|
|
|
|
Dividendsb |
(170) |
|
(172) |
|
(175) |
|
(342) |
|
(350) |
|
|
|
|
|
|
|
| Net disbursements to non-controlling interests |
(280) |
|
(125) |
|
(139) |
|
(405) |
|
(238) |
|
| Share buyback program |
(268) |
|
(143) |
|
(49) |
|
(411) |
|
(49) |
|
| Other |
13 |
|
4 |
|
5 |
|
17 |
|
(2) |
|
| Total financing outflows |
(721) |
|
(439) |
|
(362) |
|
(1,160) |
|
(646) |
|
| Effect of exchange rate |
0 |
|
0 |
|
0 |
|
0 |
|
(2) |
|
| Increase (decrease) in cash and equivalents |
694 |
|
34 |
|
94 |
|
728 |
|
(112) |
|
a.The difference between the net change in debt on a cash basis and the net change on the balance sheet is due to changes in non-cash charges, specifically the unwinding of discounts and amortization of debt issue costs.
b.For Q2 2025 and YTD 2025, we declared and paid dividends per share in US dollars totaling $0.10 and $0.20, respectively (Q1 2025: declared and paid $0.10; Q2 2024: declared and paid $0.10; YTD 2024: declared and paid $0.20).
Q2 2025 compared to Q1 2025
In Q2 2025, we generated $1,329 million in operating cash flow, compared to $1,212 million in Q1 2025. The increase of $117 million was primarily due to higher realized gold prices, increased gold sales volumes, and lower copper C1 cash costs/lb1. This was partially offset by higher gold TCC/oz1. Operating cash flow was further impacted by a favorable movement in working capital, mainly in accounts payable and inventory, partially offset by an unfavorable movement in accounts receivable. The increase in accounts receivable mainly relates to our mines in Tanzania and Zambia where sales occurred at the end of the quarter with the receipt of the cash early in Q3. These results were also impacted by an increase in cash taxes paid and higher interest paid as a result of the timing of semi-annual interest payments on our bonds, which primarily occur in the second and fourth quarters.
Cash inflows from investing activities in Q2 2025 were $86 million, compared to cash outflows $739 million in
|
|
|
|
|
|
|
|
|
BARRICK SECOND QUARTER 2025 |
40 |
MANAGEMENT'S DISCUSSION AND ANALYSIS |
Q1 2025. The increased inflow of $825 million was primarily due to proceeds from the sale of our 50% interest in the Donlin project, partially offset by higher capital expenditures. Project capital expenditures1 were higher at both Reko Diq (related to payments made for onsite infrastructure) and at Lumwana (related to long lead items and mobile equipment). This was partially offset by decreased minesite sustaining capital expenditures1, mainly at Carlin driven by the Komatsu-930 truck fleet deliveries were finalized in Q1 2025 and lower open pit waste stripping.
Net financing cash outflows for Q2 2025 amounted to $721 million, compared to $439 million in Q1 2025. The increase of $282 million is primarily due to higher net disbursements paid to non-controlling interests, primarily to Newmont in relation to their interest in NGM. This was combined with increased repurchases of shares under our share buyback program compared to Q1 2025.
Q2 2025 compared to Q2 2024
In Q2 2025, we generated $1,329 million in operating cash flow, compared to $1,159 million in Q2 2024. The increase of $170 million was primarily due to higher realized gold prices1 and lower copper C1 cash costs/lb1. This was partially offset by lower gold sales volumes and higher gold TCC/oz1. These results were partially offset by higher cash taxes paid and an unfavorable movement in working capital, mainly in accounts receivable, partially offset by a favorable movement in other current liabilities. The increase in accounts receivable mainly relates to our mines in Tanzania and Zambia where sales were delayed to the end of the quarter with the receipt of the cash occurring early in Q3.
Cash inflows from investing activities in Q2 2025 were $86 million compared to cash outflows $703 million in Q2 2024. The increase of $789 million was primarily due to proceeds from the sale of our 50% interest in the Donlin project. This was partially offset by higher capital expenditures driven by increased project capital expenditures1, mainly related to costs being capitalized at Reko Diq as the feasibility study was completed in Q4 2024 and at Lumwana on the Super Pit Expansion project, partially offset by decreased minesite sustaining capital expenditures1 mainly at Carlin driven by purchases of the Komatsu-930 truck fleet occurring in Q2 2024 and lower open pit waste stripping, and at Loulo-Gounkoto as operations were temporarily suspended and the mine was subsequently placed under a temporary provisional administration on June 16, 2025.
Net financing cash outflows for Q2 2025 amounted to $721 million compared to $362 million in Q2 2024. The increase of $359 million is primarily due to increased repurchases of shares under our share buyback program in Q2 2025. This was combined with higher net disbursements paid to non-controlling interests, primarily to Newmont in relation to their interest in NGM.
YTD 2025 compared to YTD 2024
For YTD 2025, we generated $2,541 million in operating cash flow, compared to $1,919 million in YTD 2024. The increase of $622 million was primarily due to higher realized gold prices1, and lower C1 cash costs/lb1, partially offset by lower gold sales volumes and higher TCC/oz1. This was combined with an unfavorable change in working capital mainly in accounts receivable, partially offset by a favorable movement in other current liabilities and accounts payable. The increase in accounts receivable mainly relates to our mines in Tanzania and Zambia where sales were delayed to the end of the quarter with the receipt of the cash occurring early in Q3. These impacts were partially offset by higher cash taxes paid.
Cash outflows from investing activities for YTD 2025 were $653 million compared to $1,383 million in YTD 2024. The decrease of $730 million was primarily due to proceeds from the sale of our 50% interest in the Donlin project. This was partially offset by higher capital expenditures as a result of higher project capital expenditures1 mainly related to costs being capitalized at Reko Diq as the feasibility study was completed in Q4 2024 and at Lumwana on the Super Pit Expansion project, partially offset by lower minesite sustaining capital expenditures1 mainly at Carlin driven by purchases of the Komatsu-930 truck fleet occurring in YTD 2024 and lower open pit waste stripping, and at Loulo-Gounkoto as operations were temporarily suspended and the mine was subsequently placed under a temporary provisional administration on June 16, 2025.
Net financing cash outflows for YTD 2025 amounted to $1,160 million, compared to $646 million in YTD 2024. The increased outflow of $514 million is primarily due to the repurchase of shares under our share buyback program in the current year. This was combined with higher net disbursements paid to non-controlling interests, primarily to Newmont in relation to their interest in NGM.
|
|
|
|
|
|
|
|
|
BARRICK SECOND QUARTER 2025 |
41 |
MANAGEMENT'S DISCUSSION AND ANALYSIS |
Commitments and Contingencies
Litigation and Claims
We are currently subject to various litigation proceedings as disclosed in note 17 to the Financial Statements, and we may be involved in disputes with other parties in the future that may result in litigation. If we are unable to resolve these disputes favorably, it may have a material adverse impact on our financial condition, cash flow and results of operations.
Contractual Obligations and Commitments
In the normal course of business, we enter into contracts that give rise to commitments for future minimum payments. The following table summarizes the remaining contractual maturities of our financial liabilities and operating and capital commitments shown on an undiscounted basis:
|
|
|
|
|
|
|
|
|
|
|
|
|
|
|
|
|
|
|
|
|
|
|
|
| ($ millions) |
Payments due as at 6/30/25 |
| |
2025 |
2026 |
2027 |
2028 |
2029 |
2030 and thereafter |
Total |
Debta |
|
|
|
|
|
|
|
| Repayment of principal |
12 |
47 |
0 |
0 |
0 |
4,631 |
4,690 |
| Capital leases |
6 |
17 |
18 |
13 |
3 |
3 |
60 |
| Interest |
143 |
284 |
280 |
279 |
277 |
2,659 |
3,922 |
Provisions for environmental rehabilitationb |
104 |
139 |
105 |
153 |
129 |
1,919 |
2,549 |
|
|
|
|
|
|
|
|
| Restricted share units |
12 |
26 |
5 |
0 |
0 |
0 |
43 |
| Pension benefits and other post-retirement benefits |
3 |
5 |
4 |
4 |
4 |
62 |
82 |
|
|
|
|
|
|
|
|
|
|
|
|
|
|
|
|
Purchase obligations for supplies and consumablesc |
827 |
289 |
247 |
151 |
129 |
93 |
1,736 |
Capital commitmentsd |
937 |
436 |
104 |
67 |
0 |
0 |
1,544 |
Social development costse |
40 |
30 |
8 |
4 |
4 |
59 |
145 |
Other obligationsf |
38 |
62 |
65 |
63 |
58 |
545 |
831 |
| Total |
2,122 |
1,335 |
836 |
734 |
604 |
9,971 |
15,602 |
a.Debt and Interest: Our debt obligations do not include any subjective acceleration clauses or other clauses that enable the holder of the debt to call for early repayment, except in the event that we breach any of the terms and conditions of the debt or for other customary events of default. We are not required to post any collateral under any debt obligations. Projected interest payments on variable rate debt were based on interest rates in effect at June 30, 2025. Interest is calculated on our long-term debt obligations using both fixed and variable rates.
b.Provisions for environmental rehabilitation: Amounts presented in the table represent the undiscounted uninflated future payments for the expected cost of environmental rehabilitation.
c.Purchase obligations for supplies and consumables: Includes commitments related to new purchase obligations to secure a supply of acid, tires and cyanide for our production process.
d.Capital commitments: Purchase obligations for capital expenditures include only those items where binding commitments have been entered into.
e.Social development costs: Includes a commitment of $14 million in 2030 and thereafter, related to the funding of a power transmission line in Argentina.
f.Other obligations includes the Pueblo Viejo joint venture partner shareholder loan, the deposit on the Pascua-Lama silver sale agreement with Wheaton Precious Metals Corp. due in 2039, and minimum royalty payments.
|
|
|
|
|
|
|
|
|
BARRICK SECOND QUARTER 2025 |
42 |
MANAGEMENT'S DISCUSSION AND ANALYSIS |
Review of Quarterly Results
Quarterly Informationa
|
|
|
|
|
|
|
|
|
|
|
|
|
|
|
|
|
|
|
|
|
|
|
|
|
|
|
| ($ millions, except where indicated) |
2025 |
2025 |
2024 |
2024 |
2024 |
2024 |
2023 |
2023 |
|
Q2 |
Q1 |
Q4 |
Q3 |
Q2 |
Q1 |
Q4 |
Q3 |
| Revenues |
3,681 |
3,130 |
3,645 |
3,368 |
3,162 |
2,747 |
3,059 |
2,862 |
Realized price/oz – goldb |
3,295 |
2,898 |
2,657 |
2,494 |
2,344 |
2,075 |
1,986 |
1,928 |
Realized price/lb – copperb |
4.36 |
4.51 |
3.96 |
4.27 |
4.53 |
3.86 |
3.78 |
3.78 |
| Cost of sales |
1,878 |
1,785 |
1,995 |
2,051 |
1,979 |
1,936 |
2,139 |
1,915 |
| Net earnings |
811 |
474 |
996 |
483 |
370 |
295 |
479 |
368 |
Per share (dollars)c |
0.47 |
0.27 |
0.57 |
0.28 |
0.21 |
0.17 |
0.27 |
0.21 |
Adjusted net earningsb |
800 |
603 |
794 |
529 |
557 |
333 |
466 |
418 |
Per share (dollars)b,c |
0.47 |
0.35 |
0.46 |
0.30 |
0.32 |
0.19 |
0.27 |
0.24 |
| Operating cash flow |
1,329 |
1,212 |
1,392 |
1,180 |
1,159 |
760 |
997 |
1,127 |
Consolidated capital expendituresd |
934 |
837 |
891 |
736 |
819 |
728 |
861 |
768 |
Free cash flowb |
395 |
375 |
501 |
444 |
340 |
32 |
136 |
359 |
a.Sum of all the quarters may not add up to the annual total due to rounding.
b.Further information on these non-GAAP financial measures, including detailed reconciliations, is included on pages 44 to 59 of this MD&A.
c.Calculated using weighted average number of shares outstanding under the basic method of earnings per share.
d.Amounts presented on a consolidated cash basis.
Our recent financial results reflect our emphasis on cost discipline, an agile management structure that empowers our site based leadership teams and a portfolio of Tier One Gold Assets5. This, combined with ongoing strength in gold and copper prices, has resulted in strong operating cash flows over the past several quarters. The positive operating cash flow generated has allowed us to continue to reinvest in our business including our key growth projects, maintain a strong balance sheet and increase returns to shareholders.
In addition to the strength in metal prices, net earnings has also been impacted by the following items in each quarter, which have been excluded from adjusted net earnings1. In Q2 2025, we recorded a net loss of $1,035 million on the deconsolidation of Loulo-Gounkoto following the change of control after it was placed under a temporary
provisional administration on June 16, 2025 (refer to page 8 for further details), which was partially offset by the recognition of our investment in Loulo-Gounkoto. In addition, we recorded a gain of $745 million on the sale of our 50% interest in the Donlin Gold project. In Q4 2024, we recorded non-current asset impairment reversals of $655 million at Lumwana and $437 million at Veladero. In addition, we recorded a goodwill impairment of $484 million related to Loulo-Gounkoto. In Q2 2024, we recorded a provision following the settlement of the Zaldívar Tax Assessments in Chile (refer to note 17 of the Financial Statements). In Q4 2023, we recorded a gain of $352 million as the conditions for the reopening of the Porgera mine were completed on December 22, 2023. In addition, we recorded a long-lived asset impairment of $280 million at Long Canyon.
Internal Control Over Financial Reporting and Disclosure Controls and Procedures
Management is responsible for establishing and maintaining adequate internal control over financial reporting and disclosure controls and procedures as defined in our 2024 annual MD&A.
Together, the internal control frameworks provide internal control over financial reporting and disclosure. Due to its inherent limitations, internal control over financial reporting and disclosure may not prevent or detect all misstatements. Further, the effectiveness of internal control is subject to the risk that controls may become inadequate because of changes in conditions, or that the degree of compliance with policies or procedures may change.
There were no changes in our internal controls over financial reporting during the three months ended June 30, 2025 that have materially affected, or are reasonably likely to materially affect, our internal controls over financial reporting.
Under the supervision and with the participation of management, including the President and Chief Executive Officer and Senior Executive Vice-President and Chief Financial Officer, management will continue to monitor and evaluate the design and effectiveness of its internal control over financial reporting and disclosure controls and procedures, and may make modifications from time to time as considered necessary.
|
|
|
|
|
|
|
|
|
BARRICK SECOND QUARTER 2025 |
43 |
MANAGEMENT'S DISCUSSION AND ANALYSIS |
IFRS Critical Accounting Policies and Accounting Estimates
Management has discussed the development and selection of our critical accounting estimates with the Audit & Risk Committee of the Board of Directors, and the Audit & Risk Committee has reviewed the disclosure relating to such estimates in conjunction with its review of this MD&A. The accounting policies and methods we utilize determine how we report our financial condition and results of operations, and they may require management to make estimates or rely on assumptions about matters that are inherently uncertain. The consolidated financial statements have been prepared in accordance with IFRS. Our material accounting policies are disclosed in note 2 of the Financial Statements, including a summary of current and future changes in accounting policies.
Critical Accounting Estimates and Judgments
Certain accounting estimates have been identified as being “critical” to the presentation of our financial condition and results of operations because they require us to make subjective and/or complex judgments about matters that are inherently uncertain; or there is a reasonable likelihood that materially different amounts could be reported under different conditions or using different assumptions and estimates. Our significant accounting judgments, estimates and assumptions, including our assessment of the impacts following the loss of control of our Loulo-Gounkoto mine, are disclosed in note 3 of the accompanying Financial Statements.
Non-GAAP Financial Measures
Adjusted Net Earnings and Adjusted Net Earnings per
Share
Adjusted net earnings is a non-GAAP financial measure which excludes the following from net earnings:
■Impairment charges (reversals) related to intangibles, goodwill, property, plant and equipment, and investments;
■Acquisition/disposition gains/losses;
■Foreign currency translation gains/losses;
■Significant tax adjustments;
■Other items that are not indicative of the underlying operating performance of our core mining business; and
■Tax effect and non-controlling interest of the above items.
Management uses this measure internally to evaluate our underlying operating performance for the reporting periods presented and to assist with the planning and forecasting of future operating results. Management believes that adjusted net earnings is a useful measure of our performance because impairment charges, acquisition/disposition gains/losses and significant tax adjustments do not reflect the underlying operating performance of our core mining business and are not necessarily indicative of future operating results. Furthermore, foreign currency translation gains/losses are not necessarily reflective of the underlying operating results for the reporting periods presented. The tax effect and non-controlling interest of the adjusting items are also excluded to reconcile the amounts to Barrick’s share on a post-tax basis, consistent with net earnings.
As noted, we use this measure for internal purposes. Management’s internal budgets and forecasts and public guidance do not reflect the types of items we adjust for. Consequently, the presentation of adjusted net earnings enables investors and analysts to better understand the underlying operating performance of our core mining business through the eyes of management. Management periodically evaluates the components of adjusted net earnings based on an internal assessment of performance measures that are useful for evaluating the operating performance of our business segments and a review of the non-GAAP financial measures used by mining industry analysts and other mining companies.
Adjusted net earnings is intended to provide additional information only and does not have any standardized definition under IFRS and should not be considered in isolation or as a substitute for measures of performance prepared in accordance with IFRS. The measures are not necessarily indicative of operating profit or cash flow from operations as determined under IFRS. Other companies may calculate these measures differently. The following table reconciles these non-GAAP financial measures to the most directly comparable IFRS measure.
|
|
|
|
|
|
|
|
|
BARRICK SECOND QUARTER 2025 |
44 |
MANAGEMENT'S DISCUSSION AND ANALYSIS |
Reconciliation of Net Earnings to Net Earnings per Share, Adjusted Net Earnings and Adjusted Net Earnings per Share
|
|
|
|
|
|
|
|
|
|
|
|
|
|
|
|
|
|
| ($ millions, except per share amounts in dollars) |
For the three months ended |
For the six months ended |
|
6/30/25 |
3/31/25 |
6/30/24 |
6/30/25 |
6/30/24 |
| Net earnings attributable to equity holders of the Company |
811 |
|
474 |
|
370 |
|
1,285 |
|
665 |
|
Impairment charges related to intangibles, goodwill, property, plant and equipment, and investmentsa |
0 |
|
4 |
|
1 |
|
4 |
|
18 |
|
Acquisition/disposition losses (gains)b |
289 |
|
0 |
|
(5) |
|
289 |
|
(6) |
|
| Loss on currency translation |
(2) |
|
2 |
|
5 |
|
0 |
|
17 |
|
Significant tax adjustmentsc |
(35) |
|
(15) |
|
137 |
|
(50) |
|
166 |
|
Other expense adjustmentsd |
44 |
|
173 |
|
48 |
|
217 |
|
39 |
|
| Non-controlling interest |
(4) |
|
(11) |
|
0 |
|
(15) |
|
(4) |
|
Tax effecte |
(303) |
|
(24) |
|
1 |
|
(327) |
|
(5) |
|
| Adjusted net earnings |
800 |
|
603 |
|
557 |
|
1,403 |
|
890 |
|
Net earnings per sharef |
0.47 |
|
0.27 |
|
0.21 |
|
0.75 |
|
0.38 |
|
Adjusted net earnings per sharef |
0.47 |
|
0.35 |
|
0.32 |
|
0.82 |
|
0.51 |
|
a.There were no significant impairment charges or reversals in the current period or prior periods.
b.Acquisition/disposition (losses) gains for Q2 2025 and YTD 2025 mainly relate to the net loss of $1,035 million on the deconsolidation of Loulo-Gounkoto following the change of control after it was placed under a temporary provisional administration on June 16, 2025 (refer to page 8 for further details), partially offset by the recognition of our investment in Loulo-Gounkoto. This was offset by a gain of $745 million on the sale of our 50% interest in the Donlin Gold project. c.For Q2 2025 and YTD 2025, significant tax adjustments include the re-measurement of deferred tax balances and adjustments in respect of prior years. For Q2 2024 and YTD 2024, significant tax adjustments include the proposed settlement of the Zaldívar Tax Assessments in Chile. Significant tax adjustments for YTD 2024 also include the de-recognition of deferred tax assets, and adjustments in respect of prior years and the re-measurement of deferred tax balances.
d.Other expense adjustments for the 2025 periods mainly relate to reduced operation costs at Loulo-Gounkoto. Q1 2025 and YTD 2025 also include the signing of agreements to settle legacy legal matters in the Philippines related to Placer Dome Inc. Other adjustments in Q2 2024 and YTD 2024 mainly relate to the interest and penalties recognized following the settlement of the Zaldívar Tax Assessments in Chile.
e.Tax effect for Q2 2025 and YTD 2025 primarily relates to acquisition/disposition losses (gains).
f.Calculated using weighted average number of shares outstanding under the basic method of earnings per share.
Free Cash Flow
Free cash flow is a non-GAAP financial measure that deducts capital expenditures from net cash provided by operating activities. Management believes this to be a useful indicator of our ability to operate without reliance on additional borrowing or usage of existing cash.
Free cash flow is intended to provide additional information only and does not have any standardized definition under IFRS and should not be considered in
isolation or as a substitute for measures of performance prepared in accordance with IFRS. The measure is not necessarily indicative of operating profit or cash flow from operations as determined under IFRS. Other companies may calculate this measure differently. The following table reconciles this non-GAAP financial measure to the most directly comparable IFRS measure.
Reconciliation of Net Cash Provided by Operating Activities to Free Cash Flow
|
|
|
|
|
|
|
|
|
|
|
|
|
|
|
|
|
|
|
|
|
| ($ millions) |
For the three months ended |
For the six months ended |
|
|
|
|
6/30/25 |
3/31/25 |
6/30/24 |
6/30/25 |
6/30/24 |
|
|
|
| Net cash provided by operating activities |
1,329 |
|
1,212 |
|
1,159 |
|
2,541 |
|
1,919 |
|
|
|
|
| Capital expenditures |
(934) |
|
(837) |
|
(819) |
|
(1,771) |
|
(1,547) |
|
|
|
|
| Consolidated free cash flow |
395 |
|
375 |
|
340 |
|
770 |
|
372 |
|
|
|
|
| Free cash flow applicable to equity investees |
66 |
|
156 |
|
110 |
|
222 |
|
173 |
|
|
|
|
| Non-controlling interests |
(437) |
|
(120) |
|
(166) |
|
(557) |
|
(265) |
|
|
|
|
| Attributable free cash flow |
24 |
|
411 |
|
284 |
|
435 |
|
280 |
|
|
|
|
Capital Expenditures
Capital expenditures are classified into minesite sustaining capital expenditures or project capital expenditures depending on the nature of the expenditure. Minesite sustaining capital expenditures is the capital spending required to support current production levels. Project capital expenditures represent the capital spending at new projects and major, discrete projects at existing operations intended to increase net present value through higher production or longer mine life. Management believes this to be a useful indicator of the purpose of capital expenditures
and this distinction is an input into the calculation of AISC/oz.
Classifying capital expenditures is intended to provide additional information only and does not have any standardized definition under IFRS, and should not be considered in isolation or as a substitute for measures of performance prepared in accordance with IFRS. Other companies may calculate these measures differently. The following table reconciles these non-GAAP financial measures to the most directly comparable IFRS measure.
|
|
|
|
|
|
|
|
|
BARRICK SECOND QUARTER 2025 |
45 |
MANAGEMENT'S DISCUSSION AND ANALYSIS |
Reconciliation of the Classification of Capital Expenditures
|
|
|
|
|
|
|
|
|
|
|
|
|
|
|
|
|
|
|
|
| ($ millions) |
For the three months ended |
|
For the six months ended |
|
6/30/25 |
3/31/25 |
6/30/24 |
|
6/30/25 |
6/30/24 |
|
| Minesite sustaining capital expenditures |
479 |
|
564 |
|
631 |
|
|
1,043 |
|
1,181 |
|
|
| Project capital expenditures |
439 |
|
269 |
|
176 |
|
|
708 |
|
341 |
|
|
| Capitalized interest |
16 |
|
4 |
|
12 |
|
|
20 |
|
25 |
|
|
| Total consolidated capital expenditures |
934 |
|
837 |
|
819 |
|
|
1,771 |
|
1,547 |
|
|
Total cash costs per ounce, All-in sustaining costs per ounce, C1 cash costs per pound and All-in sustaining costs per pound
TCC/oz and AISC/oz are non-GAAP financial measures which are calculated based on the definition published by the WGC (a market development organization for the gold industry comprised of and funded by gold mining companies from around the world, including Barrick. The WGC is not a regulatory organization. Management uses these measures to monitor the performance of our gold mining operations and their ability to generate positive cash flow, both on an individual site basis and an overall company basis.
TCC start with our cost of sales related to gold production and removes depreciation, the non-controlling interest of cost of sales and includes by-product credits. AISC start with TCC and includes sustaining capital expenditures, sustaining leases, general and administrative costs, minesite exploration and evaluation costs and reclamation cost accretion and amortization. These additional costs reflect the expenditures made to maintain current production levels.
We believe that our use of TCC and AISC will assist analysts, investors and other stakeholders of Barrick in understanding the costs associated with producing gold, understanding the economics of gold mining, assessing our operating performance and also our ability to generate free cash flow from current operations and to generate free cash flow on an overall company basis. Due to the capital-intensive nature of the industry and the long useful lives over which these items are depreciated, there can be a significant timing difference between net earnings calculated in accordance with IFRS and the amount of free cash flow that is being generated by a mine and therefore we believe these measures are useful non-GAAP operating metrics and supplement our IFRS disclosures. These measures are not representative of all of our cash expenditures as they do not include income tax payments, interest costs or dividend payments. These measures do not include depreciation or amortization.
TCC/oz and AISC/oz are intended to provide additional information only and do not have standardized definitions under IFRS and should not be considered in isolation or as a substitute for measures of performance prepared in accordance with IFRS. These measures are not equivalent to net income or cash flow from operations as determined under IFRS. Although the WGC has published a standardized definition, other companies may calculate these measures differently.
In addition to presenting these metrics on a by-product basis, we have calculated these metrics on a co-product basis. Our co-product metrics remove the impact of other metal sales that are produced as a by-product of our gold production from cost per ounce calculations but does not reflect a reduction in costs for costs associated with other metal sales.
C1 cash costs/lb and AISC/lb are non-GAAP financial measures related to our copper mine operations. We believe that C1 cash costs/lb enables investors to better understand the performance of our copper operations in comparison to other copper producers who present results on a similar basis. C1 cash costs/lb excludes royalties and non-routine charges as they are not direct production costs. AISC/lb is similar to the gold AISC metric and management uses this to better evaluate the costs of copper production. We believe this measure enables investors to better understand the operating performance of our copper mines as this measure reflects all of the sustaining expenditures incurred in order to produce copper. AISC/lb includes C1 cash costs, sustaining capital expenditures, sustaining leases, general and administrative costs, minesite exploration and evaluation costs, royalties, reclamation cost accretion and amortization and write-downs taken on inventory to net realizable value.
|
|
|
|
|
|
|
|
|
BARRICK SECOND QUARTER 2025 |
46 |
MANAGEMENT'S DISCUSSION AND ANALYSIS |
Reconciliation of Gold Cost of Sales to Total cash costs and All-in sustaining costs, including on a per ounce basis
|
|
|
|
|
|
|
|
|
|
|
|
|
|
|
|
|
|
|
|
|
| ($ millions, except per oz information in dollars) |
|
For the three months ended |
For the six months ended |
|
Footnote |
6/30/25 |
3/31/25 |
6/30/24 |
6/30/25 |
6/30/24 |
| COS applicable to gold production |
|
1,676 |
|
1,568 |
|
1,799 |
|
3,244 |
|
3,560 |
|
| Depreciation |
|
(359) |
|
(342) |
|
(401) |
|
(701) |
|
(808) |
|
| Total cash costs applicable to equity method investments |
|
101 |
|
109 |
|
77 |
|
210 |
|
133 |
|
| By-product credits |
|
(64) |
|
(60) |
|
(75) |
|
(124) |
|
(131) |
|
|
|
|
|
|
|
|
| Non-recurring items |
a |
0 |
|
0 |
|
0 |
|
0 |
|
0 |
|
| Other |
b |
11 |
|
5 |
|
5 |
|
16 |
|
7 |
|
| Non-controlling interests |
c |
(411) |
|
(364) |
|
(393) |
|
(775) |
|
(793) |
|
| Total cash costs |
|
954 |
|
916 |
|
1,012 |
|
1,870 |
|
1,968 |
|
| General & administrative costs |
|
39 |
|
42 |
|
32 |
|
81 |
|
60 |
|
| Minesite exploration and evaluation costs |
d |
7 |
|
5 |
|
6 |
|
12 |
|
19 |
|
| Minesite sustaining capital expenditures |
e |
479 |
|
564 |
|
631 |
|
1,043 |
|
1,181 |
|
| Sustaining leases |
|
7 |
|
8 |
|
9 |
|
15 |
|
15 |
|
| Rehabilitation - accretion and amortization (operating sites) |
f |
16 |
|
17 |
|
20 |
|
33 |
|
37 |
|
| Non-controlling interest, copper operations and other |
g |
(208) |
|
(217) |
|
(278) |
|
(425) |
|
(502) |
|
| All-in sustaining costs |
|
1,294 |
|
1,335 |
|
1,432 |
|
2,629 |
|
2,778 |
|
|
|
|
|
|
|
|
|
|
|
|
|
|
|
|
|
|
|
|
|
|
|
|
|
|
|
|
|
|
|
|
|
|
|
|
|
|
|
|
|
|
|
|
|
|
|
|
|
|
| Ounces sold - attributable basis (koz) |
h |
770 |
|
751 |
|
956 |
|
1,521 |
|
1,866 |
|
| COS/oz |
i,j |
1,654 |
|
1,629 |
|
1,441 |
|
1,641 |
|
1,433 |
|
| TCC/oz |
j |
1,239 |
|
1,220 |
|
1,059 |
|
1,229 |
|
1,055 |
|
| TCC/oz (on a co-product basis) |
j,k |
1,292 |
|
1,273 |
|
1,112 |
|
1,282 |
|
1,103 |
|
| AISC/oz |
j |
1,684 |
|
1,775 |
|
1,498 |
|
1,728 |
|
1,489 |
|
| AISC/oz (on a co-product basis) |
j,k |
1,737 |
|
1,828 |
|
1,551 |
|
1,781 |
|
1,537 |
|
|
|
|
|
|
|
|
|
|
|
|
|
|
|
a.Non-recurring items - These costs are not indicative of our cost of production and have been excluded from the calculation of TCC.
b.Other - Other adjustments mainly relate to treatment and refinement charges.
c.Non-controlling interests - Non-controlling interests include non-controlling interests related to gold production of $540 million and $1,027 million for Q2 2025 and YTD 2025, respectively, (Q1 2025: $487 million; Q2 2024: $532 million; YTD 2024: $1,074 million). Non-controlling interests include NGM, Pueblo Viejo, Loulo-Gounkoto, Tongon, North Mara and Bulyanhulu. Refer to Note 5 to the Financial Statements for further information.
d.Exploration and evaluation costs - Exploration, evaluation and project expenses are presented as minesite sustaining if they support current mine operations and project if they relate to future projects. Refer to page 37 of this MD&A.
e.Capital expenditures - Capital expenditures are related to our gold sites only and are split between minesite sustaining and project capital expenditures.
f.Rehabilitation—accretion and amortization - Includes depreciation on the assets related to rehabilitation provisions of our gold operations and accretion on the rehabilitation provision of our gold operations, split between operating and non-operating sites.
g.Non-controlling interest and copper operations - Removes general and administrative costs related to non-controlling interests and copper based on a percentage allocation of revenue. Also removes exploration, evaluation and project expenses, rehabilitation costs and capital expenditures incurred by our copper sites and the non-controlling interest of NGM, Pueblo Viejo, Loulo-Gounkoto, Tongon, North Mara and Bulyanhulu operating segments. It also includes capital expenditures applicable to our equity method investment in Kibali. The impact is summarized as the following:
|
|
|
|
|
|
|
|
|
|
|
|
|
|
|
|
|
|
| ($ millions) |
For the three months ended |
For the six months ended |
| Non-controlling interest, copper operations and other |
6/30/25 |
3/31/25 |
6/30/24 |
6/30/25 |
6/30/24 |
| General & administrative costs |
(6) |
|
(6) |
|
(6) |
|
(12) |
|
(10) |
|
| Minesite exploration and evaluation expenses |
(3) |
|
0 |
|
(4) |
|
(3) |
|
(6) |
|
| Rehabilitation - accretion and amortization (operating sites) |
(6) |
|
(5) |
|
(6) |
|
(11) |
|
(11) |
|
| Minesite sustaining capital expenditures |
(193) |
|
(206) |
|
(262) |
|
(399) |
|
(475) |
|
| All-in sustaining costs total |
(208) |
|
(217) |
|
(278) |
|
(425) |
|
(502) |
|
|
|
|
|
|
|
|
|
|
|
|
|
|
|
|
|
|
|
h.Ounces sold - attributable basis - Excludes Long Canyon which is producing residual ounces from the leach pad while in care and maintenance.
i.COS/oz - Gold COS/oz is calculated as cost of sales across our gold operations (excluding sites in closure or care and maintenance) divided by ounces sold (both on an attributable basis using Barrick's ownership share).
j.Per ounce figures - COS/oz, TCC/oz and AISC/oz may not calculate based on amounts presented in this table due to rounding.
k.Co-product costs/oz
TCC/oz and AISC/oz presented on a co-product basis removes the impact of by-product credits of our gold production (net of non-controlling interest) calculated as:
|
|
|
|
|
|
|
|
|
|
|
|
|
|
|
|
|
|
| ($ millions) |
For the three months ended |
For the six months ended |
| |
6/30/25 |
3/31/25 |
6/30/24 |
6/30/25 |
6/30/24 |
| By-product credits |
64 |
|
60 |
|
75 |
|
124 |
|
131 |
|
| Non-controlling interest |
(23) |
|
(20) |
|
(24) |
|
(43) |
|
(42) |
|
| By-product credits (net of non-controlling interest) |
41 |
|
40 |
|
51 |
|
81 |
|
89 |
|
|
|
|
|
|
|
|
|
|
BARRICK SECOND QUARTER 2025 |
47 |
MANAGEMENT'S DISCUSSION AND ANALYSIS |
Reconciliation of Gold Cost of Sales to Total cash costs and All-in sustaining costs, including on a per ounce basis, by operating segment
|
|
|
|
|
|
|
|
|
|
|
|
|
|
|
|
|
|
|
|
|
|
|
|
|
|
|
|
| ($ millions, except per oz information in dollars) |
|
For the three months ended 6/30/25 |
| |
Footnote |
Carlin |
Cortez |
Turquoise Ridge |
|
Phoenix |
Nevada Gold Minesa |
Hemlo |
North America |
| COS applicable to gold production |
|
429 |
|
294 |
|
216 |
|
|
92 |
|
1,031 |
|
58 |
|
1,089 |
|
| Depreciation |
|
(68) |
|
(62) |
|
(44) |
|
|
(18) |
|
(192) |
|
(10) |
|
(202) |
|
| By-product credits |
|
(1) |
|
(1) |
|
(1) |
|
|
(34) |
|
(37) |
|
0 |
|
(37) |
|
|
|
|
|
|
|
|
|
|
|
| Non-recurring items |
b |
0 |
|
0 |
|
0 |
|
|
0 |
|
0 |
|
0 |
|
0 |
|
| Other |
c |
0 |
|
0 |
|
0 |
|
|
6 |
|
6 |
|
0 |
|
6 |
|
| Non-controlling interests |
|
(138) |
|
(89) |
|
(66) |
|
|
(18) |
|
(312) |
|
0 |
|
(312) |
|
| Total cash costs |
|
222 |
|
142 |
|
105 |
|
|
28 |
|
496 |
|
48 |
|
544 |
|
| General & administrative costs |
|
0 |
|
0 |
|
0 |
|
|
0 |
|
0 |
|
0 |
|
0 |
|
| Minesite exploration and evaluation costs |
d |
4 |
|
2 |
|
0 |
|
|
1 |
|
7 |
|
0 |
|
7 |
|
| Minesite sustaining capital expenditures |
e |
128 |
|
72 |
|
26 |
|
|
13 |
|
246 |
|
7 |
|
253 |
|
| Sustaining capital leases |
|
0 |
|
0 |
|
0 |
|
|
0 |
|
1 |
|
1 |
|
2 |
|
| Rehabilitation - accretion and amortization (operating sites) |
f |
2 |
|
4 |
|
1 |
|
|
2 |
|
9 |
|
1 |
|
10 |
|
| Non-controlling interests |
|
(52) |
|
(30) |
|
(9) |
|
|
(6) |
|
(100) |
|
0 |
|
(100) |
|
| All-in sustaining costs |
|
304 |
|
190 |
|
123 |
|
|
38 |
|
659 |
|
57 |
|
716 |
|
|
|
|
|
|
|
|
|
|
|
|
|
|
|
|
|
|
|
|
|
|
|
|
|
|
|
|
|
|
|
|
|
|
|
|
|
|
|
|
|
|
|
|
|
|
|
|
|
|
|
|
|
|
|
|
|
|
|
|
|
|
|
|
|
|
|
|
|
|
|
| Ounces sold - attributable basis (koz) |
|
166 |
|
107 |
|
75 |
|
|
28 |
|
376 |
|
32 |
|
408 |
|
| COS/oz |
g,h |
1,589 |
|
1,687 |
|
1,761 |
|
|
2,033 |
|
1,685 |
|
1,837 |
|
1,697 |
|
| TCC/oz |
h |
1,330 |
|
1,326 |
|
1,394 |
|
|
1,010 |
|
1,319 |
|
1,512 |
|
1,334 |
|
| TCC/oz (on a co-product basis) |
h,i |
1,335 |
|
1,331 |
|
1,403 |
|
|
1,634 |
|
1,370 |
|
1,524 |
|
1,382 |
|
| AISC/oz |
h |
1,826 |
|
1,774 |
|
1,621 |
|
|
1,376 |
|
1,749 |
|
1,766 |
|
1,751 |
|
| AISC/oz (on a co-product basis) |
h,i |
1,831 |
|
1,779 |
|
1,630 |
|
|
2,000 |
|
1,800 |
|
1,778 |
|
1,799 |
|
|
|
|
|
|
|
|
|
|
|
|
|
|
|
|
|
|
|
|
|
|
|
|
|
|
|
|
|
|
|
|
|
|
|
|
|
|
|
| ($ millions, except per oz information in dollars) |
For the three months ended 6/30/25 |
| |
Footnote |
Pueblo Viejo |
Veladero |
Porgera |
Latin America & Asia Pacific |
| COS applicable to gold production |
|
267 |
|
82 |
|
32 |
|
381 |
|
| Depreciation |
|
(77) |
|
(31) |
|
(7) |
|
(115) |
|
| By-product credits |
|
(11) |
|
(2) |
|
0 |
|
(13) |
|
|
|
|
|
|
|
| Non-recurring items |
b |
0 |
|
0 |
|
0 |
|
0 |
|
| Other |
c |
0 |
|
0 |
|
0 |
|
0 |
|
| Non-controlling interests |
|
(72) |
|
0 |
|
0 |
|
(72) |
|
| Total cash costs |
|
107 |
|
49 |
|
25 |
|
181 |
|
| General & administrative costs |
|
0 |
|
0 |
|
0 |
|
0 |
|
| Minesite exploration and evaluation costs |
d |
0 |
|
2 |
|
1 |
|
3 |
|
| Minesite sustaining capital expenditures |
e |
61 |
|
34 |
|
8 |
|
103 |
|
| Sustaining capital leases |
|
0 |
|
1 |
|
1 |
|
2 |
|
| Rehabilitation - accretion and amortization (operating sites) |
f |
2 |
|
0 |
|
0 |
|
2 |
|
| Non-controlling interests |
|
(25) |
|
0 |
|
0 |
|
(25) |
|
| All-in sustaining costs |
|
145 |
|
86 |
|
35 |
|
266 |
|
|
|
|
|
|
|
|
|
|
|
|
|
|
|
|
|
|
|
|
|
|
|
|
|
|
|
|
|
|
|
|
|
|
|
|
|
|
|
|
|
|
|
| Ounces sold - attributable basis (koz) |
|
93 |
|
67 |
|
24 |
|
184 |
|
| COS/oz |
g,h |
1,715 |
|
1,234 |
|
1,354 |
|
1,494 |
|
| TCC/oz |
h |
1,147 |
|
751 |
|
1,041 |
|
990 |
|
| TCC/oz (on a co-product basis) |
h,i |
1,219 |
|
775 |
|
1,051 |
|
1,037 |
|
| AISC/oz |
h |
1,552 |
|
1,295 |
|
1,406 |
|
1,440 |
|
| AISC/oz (on a co-product basis) |
h,i |
1,624 |
|
1,319 |
|
1,416 |
|
1,487 |
|
|
|
|
|
|
|
|
|
|
|
|
|
|
|
|
|
|
|
|
|
|
BARRICK SECOND QUARTER 2025 |
48 |
MANAGEMENT'S DISCUSSION AND ANALYSIS |
|
|
|
|
|
|
|
|
|
|
|
|
|
|
|
|
|
|
|
|
|
|
|
|
|
| ($ millions, except per oz information in dollars) |
For the three months ended 6/30/25 |
| |
Footnote |
Loulo-Gounkotoj |
Kibali |
North Mara |
Tongon |
Bulyanhulu |
|
Africa & Middle East |
| COS applicable to gold production |
|
— |
|
108 |
|
84 |
|
74 |
|
64 |
|
|
330 |
|
| Depreciation |
|
— |
|
(32) |
|
(19) |
|
(6) |
|
(14) |
|
|
(71) |
|
| By-product credits |
|
— |
|
(1) |
|
(2) |
|
0 |
|
(7) |
|
|
(10) |
|
|
|
|
|
|
|
|
|
|
| Non-recurring items |
b |
— |
|
0 |
|
0 |
|
0 |
|
0 |
|
|
0 |
|
| Other |
c |
— |
|
0 |
|
0 |
|
0 |
|
1 |
|
|
1 |
|
| Non-controlling interests |
|
— |
|
0 |
|
(9) |
|
(7) |
|
(7) |
|
|
(23) |
|
| Total cash costs |
|
— |
|
75 |
|
54 |
|
61 |
|
37 |
|
|
227 |
|
| General & administrative costs |
|
— |
|
0 |
|
0 |
|
0 |
|
0 |
|
|
0 |
|
| Minesite exploration and evaluation costs |
d |
— |
|
0 |
|
0 |
|
0 |
|
0 |
|
|
0 |
|
| Minesite sustaining capital expenditures |
e |
— |
|
10 |
|
11 |
|
4 |
|
25 |
|
|
50 |
|
| Sustaining capital leases |
|
— |
|
3 |
|
0 |
|
0 |
|
0 |
|
|
3 |
|
| Rehabilitation - accretion and amortization (operating sites) |
f |
— |
|
0 |
|
1 |
|
2 |
|
1 |
|
|
4 |
|
| Non-controlling interests |
|
— |
|
0 |
|
(2) |
|
(1) |
|
(4) |
|
|
(7) |
|
| All-in sustaining costs |
|
— |
|
88 |
|
64 |
|
66 |
|
59 |
|
|
277 |
|
|
|
|
|
|
|
|
|
|
|
|
|
|
|
|
|
|
|
|
|
|
|
|
|
|
|
|
|
|
|
|
|
|
|
|
|
|
|
|
|
|
|
|
|
|
|
|
|
|
|
|
|
|
|
|
|
|
|
|
|
|
|
|
| Ounces sold - attributable basis (koz) |
|
— |
|
69 |
|
50 |
|
28 |
|
31 |
|
|
178 |
|
| COS/oz |
g,h |
— |
|
1,565 |
|
1,430 |
|
2,397 |
|
1,722 |
|
|
1,718 |
|
| TCC/oz |
h |
— |
|
1,094 |
|
1,073 |
|
2,204 |
|
1,189 |
|
|
1,277 |
|
| TCC/oz (on a co-product basis) |
h,i |
— |
|
1,099 |
|
1,100 |
|
2,207 |
|
1,353 |
|
|
1,316 |
|
| AISC/oz |
h |
— |
|
1,273 |
|
1,292 |
|
2,390 |
|
1,885 |
|
|
1,577 |
|
| AISC/oz (on a co-product basis) |
h,i |
— |
|
1,278 |
|
1,319 |
|
2,393 |
|
2,049 |
|
|
1,616 |
|
|
|
|
|
|
|
|
|
|
|
|
|
|
|
|
|
|
|
|
|
|
|
|
|
|
|
|
|
|
|
|
|
|
|
|
|
|
|
|
|
|
|
|
|
|
|
| ($ millions, except per oz information in dollars) |
|
For the three months ended 3/31/25 |
| |
Footnote |
Carlin |
Cortez |
Turquoise Ridge |
|
Phoenix |
Nevada Gold Minesa |
Hemlo |
North America |
| COS applicable to gold production |
|
401 |
241 |
203 |
|
79 |
925 |
67 |
992 |
| Depreciation |
|
(62) |
(57) |
(47) |
|
(17) |
(183) |
(10) |
(193) |
| By-product credits |
|
(2) |
(1) |
(1) |
|
(33) |
(37) |
0 |
(37) |
|
|
|
|
|
|
|
|
|
|
| Non-recurring items |
b |
0 |
0 |
0 |
|
0 |
0 |
0 |
0 |
| Other |
c |
0 |
0 |
0 |
|
6 |
6 |
0 |
6 |
| Non-controlling interests |
|
(130) |
(70) |
(60) |
|
(13) |
(273) |
0 |
(273) |
| Total cash costs |
|
207 |
113 |
95 |
|
22 |
438 |
57 |
495 |
| General & administrative costs |
|
0 |
0 |
0 |
|
0 |
0 |
0 |
0 |
| Minesite exploration and evaluation costs |
d |
1 |
1 |
0 |
|
0 |
3 |
0 |
3 |
| Minesite sustaining capital expenditures |
e |
253 |
52 |
22 |
|
10 |
340 |
8 |
348 |
| Sustaining capital leases |
|
0 |
0 |
0 |
|
0 |
0 |
1 |
1 |
| Rehabilitation - accretion and amortization (operating sites) |
f |
3 |
4 |
1 |
|
2 |
10 |
0 |
10 |
| Non-controlling interests |
|
(99) |
(22) |
(9) |
|
(5) |
(136) |
0 |
(136) |
| All-in sustaining costs |
|
365 |
148 |
109 |
|
29 |
655 |
66 |
721 |
|
|
|
|
|
|
|
|
|
|
|
|
|
|
|
|
|
|
|
|
|
|
|
|
|
|
|
|
|
|
|
|
|
|
|
|
|
|
|
|
|
|
|
|
|
|
|
|
|
|
|
|
|
|
|
|
|
|
|
|
|
|
|
|
|
|
|
|
|
|
| Ounces sold - attributable basis (koz) |
|
142 |
96 |
78 |
|
29 |
345 |
39 |
384 |
| COS/oz |
g,h |
1,720 |
1,541 |
1,605 |
|
1,686 |
1,643 |
1,730 |
1,652 |
| TCC/oz |
h |
1,459 |
1,172 |
1,227 |
|
747 |
1,269 |
1,458 |
1,288 |
| TCC/oz (on a co-product basis) |
h,i |
1,466 |
1,176 |
1,234 |
|
1,329 |
1,323 |
1,468 |
1,338 |
| AISC/oz |
h |
2,570 |
1,536 |
1,408 |
|
1,012 |
1,899 |
1,692 |
1,878 |
| AISC/oz (on a co-product basis) |
h,i |
2,577 |
1,540 |
1,415 |
|
1,594 |
1,953 |
1,702 |
1,928 |
|
|
|
|
|
|
|
|
|
|
|
|
|
|
|
|
|
|
|
|
|
|
|
|
|
|
|
|
|
BARRICK SECOND QUARTER 2025 |
49 |
MANAGEMENT'S DISCUSSION AND ANALYSIS |
|
|
|
|
|
|
|
|
|
|
|
|
|
|
|
|
|
|
| ($ millions, except per oz information in dollars) |
For the three months ended 3/31/25 |
| |
Footnote |
Pueblo Viejo |
Veladero |
Porgera |
Latin America & Asia Pacific |
| COS applicable to gold production |
|
237 |
|
79 |
|
36 |
|
352 |
|
| Depreciation |
|
(75) |
|
(25) |
|
(7) |
|
(107) |
|
| By-product credits |
|
(12) |
|
(1) |
|
0 |
|
(13) |
|
|
|
|
|
|
|
| Non-recurring items |
b |
0 |
|
0 |
|
0 |
|
0 |
|
| Other |
c |
0 |
|
0 |
|
0 |
|
0 |
|
| Non-controlling interests |
|
(60) |
|
0 |
|
0 |
|
(60) |
|
| Total cash costs |
|
90 |
|
53 |
|
29 |
|
172 |
|
| General & administrative costs |
|
0 |
|
0 |
|
0 |
|
0 |
|
| Minesite exploration and evaluation costs |
d |
0 |
|
1 |
|
0 |
|
1 |
|
| Minesite sustaining capital expenditures |
e |
59 |
|
33 |
|
6 |
|
98 |
|
| Sustaining capital leases |
|
0 |
|
0 |
|
0 |
|
0 |
|
| Rehabilitation - accretion and amortization (operating sites) |
f |
1 |
|
1 |
|
0 |
|
2 |
|
| Non-controlling interests |
|
(23) |
|
0 |
|
0 |
|
(23) |
|
| All-in sustaining costs |
|
127 |
|
88 |
|
35 |
|
250 |
|
|
|
|
|
|
|
|
|
|
|
|
|
|
|
|
|
|
|
|
|
|
|
|
|
|
|
|
|
|
|
|
|
|
|
|
|
|
|
|
|
|
|
| Ounces sold - attributable basis (koz) |
|
76 |
|
68 |
|
21 |
|
165 |
|
| COS/oz |
g,h |
1,863 |
|
1,141 |
|
1,675 |
|
1,539 |
|
| TCC/oz |
h |
1,189 |
|
753 |
|
1,336 |
|
1,027 |
|
| TCC/oz (on a co-product basis) |
h,i |
1,280 |
|
773 |
|
1,346 |
|
1,078 |
|
| AISC/oz |
h |
1,668 |
|
1,271 |
|
1,684 |
|
1,505 |
|
| AISC/oz (on a co-product basis) |
h,i |
1,759 |
|
1,291 |
|
1,694 |
|
1,556 |
|
|
|
|
|
|
|
|
|
|
|
|
|
|
|
|
|
|
|
|
|
|
|
|
|
|
|
|
|
|
|
|
|
|
|
|
|
|
| ($ millions, except per oz information in dollars) |
For the three months ended 3/31/25 |
| |
Footnote |
Loulo-Gounkotoj |
Kibali |
North Mara |
Tongon |
Bulyanhulu |
|
Africa & Middle East |
| COS applicable to gold production |
|
— |
113 |
102 |
70 |
77 |
|
362 |
| Depreciation |
|
— |
(32) |
(21) |
(6) |
(16) |
|
(75) |
| By-product credits |
|
— |
0 |
(1) |
0 |
(7) |
|
(8) |
|
|
|
|
|
|
|
|
|
| Non-recurring items |
b |
— |
0 |
0 |
0 |
0 |
|
0 |
| Other |
c |
— |
0 |
0 |
0 |
1 |
|
1 |
| Non-controlling interests |
|
— |
0 |
(13) |
(7) |
(9) |
|
(29) |
| Total cash costs |
|
— |
81 |
67 |
57 |
46 |
|
251 |
| General & administrative costs |
|
— |
0 |
0 |
0 |
0 |
|
0 |
| Minesite exploration and evaluation costs |
d |
— |
0 |
0 |
0 |
0 |
|
0 |
| Minesite sustaining capital expenditures |
e |
— |
12 |
21 |
3 |
28 |
|
64 |
| Sustaining capital leases |
|
— |
2 |
0 |
0 |
0 |
|
2 |
| Rehabilitation - accretion and amortization (operating sites) |
f |
— |
0 |
1 |
2 |
0 |
|
3 |
| Non-controlling interests |
|
— |
0 |
(3) |
0 |
(5) |
|
(8) |
| All-in sustaining costs |
|
— |
95 |
86 |
62 |
69 |
|
312 |
|
|
|
|
|
|
|
|
|
|
|
|
|
|
|
|
|
|
|
|
|
|
|
|
|
|
|
|
|
|
|
|
|
|
|
|
|
|
|
|
|
|
|
|
|
|
|
|
|
|
|
|
|
|
|
|
|
|
|
|
|
|
|
| Ounces sold - attributable basis (koz) |
|
— |
67 |
68 |
29 |
38 |
|
202 |
| COS/oz |
g,h |
— |
1,691 |
1,257 |
2,154 |
1,714 |
|
1,639 |
| TCC/oz |
h |
— |
1,212 |
986 |
1,971 |
1,212 |
|
1,244 |
| TCC/oz (on a co-product basis) |
h,i |
— |
1,219 |
999 |
1,975 |
1,350 |
|
1,277 |
| AISC/oz |
h |
— |
1,426 |
1,258 |
2,144 |
1,831 |
|
1,602 |
| AISC/oz (on a co-product basis) |
h,i |
— |
1,433 |
1,271 |
2,148 |
1,969 |
|
1,635 |
|
|
|
|
|
|
|
|
|
|
|
|
|
|
|
|
|
|
|
|
|
|
|
|
|
|
|
BARRICK SECOND QUARTER 2025 |
50 |
MANAGEMENT'S DISCUSSION AND ANALYSIS |
|
|
|
|
|
|
|
|
|
|
|
|
|
|
|
|
|
|
|
|
|
|
|
|
|
|
|
|
| ($ millions, except per oz information in dollars) |
|
For the three months ended 6/30/24 |
| |
Footnote |
Carlin |
Cortez |
Turquoise Ridge |
|
Phoenix |
Nevada Gold Minesa |
Hemlo |
North America |
| COS applicable to gold production |
|
461 |
|
224 |
|
185 |
|
|
88 |
|
960 |
|
64 |
|
1,024 |
|
| Depreciation |
|
(80) |
|
(57) |
|
(42) |
|
|
(17) |
|
(197) |
|
(10) |
|
(207) |
|
| By-product credits |
|
0 |
|
(1) |
|
(1) |
|
|
(44) |
|
(46) |
|
0 |
|
(46) |
|
|
|
|
|
|
|
|
|
|
|
| Non-recurring items |
b |
0 |
|
0 |
|
0 |
|
|
0 |
|
0 |
|
0 |
|
0 |
|
| Other |
c |
(4) |
|
0 |
|
0 |
|
|
7 |
|
3 |
|
0 |
|
3 |
|
| Non-controlling interests |
|
(145) |
|
(64) |
|
(55) |
|
|
(14) |
|
(278) |
|
0 |
|
(278) |
|
| Total cash costs |
|
232 |
|
102 |
|
87 |
|
|
20 |
|
442 |
|
54 |
|
496 |
|
| General & administrative costs |
|
0 |
|
0 |
|
0 |
|
|
0 |
|
0 |
|
0 |
|
0 |
|
| Minesite exploration and evaluation costs |
d |
3 |
|
2 |
|
2 |
|
|
2 |
|
10 |
|
0 |
|
10 |
|
| Minesite sustaining capital expenditures |
e |
211 |
|
65 |
|
29 |
|
|
13 |
|
328 |
|
9 |
|
337 |
|
| Sustaining capital leases |
|
0 |
|
0 |
|
0 |
|
|
0 |
|
1 |
|
2 |
|
3 |
|
| Rehabilitation - accretion and amortization (operating sites) |
f |
4 |
|
4 |
|
1 |
|
|
2 |
|
11 |
|
0 |
|
11 |
|
| Non-controlling interests |
|
(85) |
|
(26) |
|
(12) |
|
|
(6) |
|
(134) |
|
0 |
|
(134) |
|
| All-in sustaining costs |
|
365 |
|
147 |
|
107 |
|
|
31 |
|
658 |
|
65 |
|
723 |
|
|
|
|
|
|
|
|
|
|
|
|
|
|
|
|
|
|
|
|
|
|
|
|
|
|
|
|
|
|
|
|
|
|
|
|
|
|
|
|
|
|
|
|
|
|
|
|
|
|
|
|
|
|
|
|
|
|
|
|
|
|
|
|
|
|
|
|
|
|
|
| Ounces sold - attributable basis (koz) |
|
202 |
|
101 |
|
70 |
|
|
27 |
|
400 |
|
39 |
|
439 |
|
| COS/oz |
g,h |
1,390 |
|
1,366 |
|
1,603 |
|
|
2,018 |
|
1,464 |
|
1,663 |
|
1,482 |
|
| TCC/oz |
h |
1,145 |
|
1,013 |
|
1,235 |
|
|
781 |
|
1,104 |
|
1,395 |
|
1,129 |
|
| TCC/oz (on a co-product basis) |
h,i |
1,147 |
|
1,017 |
|
1,242 |
|
|
1,638 |
|
1,164 |
|
1,404 |
|
1,185 |
|
| AISC/oz |
h |
1,805 |
|
1,447 |
|
1,505 |
|
|
1,167 |
|
1,636 |
|
1,660 |
|
1,638 |
|
| AISC/oz (on a co-product basis) |
h,i |
1,807 |
|
1,451 |
|
1,512 |
|
|
2,024 |
|
1,696 |
|
1,669 |
|
1,694 |
|
|
|
|
|
|
|
|
|
|
|
|
|
|
|
|
|
|
|
|
|
|
|
|
|
|
|
|
|
|
|
|
|
|
|
|
|
|
|
| ($ millions, except per oz information in dollars) |
For the three months ended 6/30/24 |
| |
Footnote |
Pueblo Viejo |
Veladero |
Porgera |
Latin America & Asia Pacific |
| COS applicable to gold production |
|
213 |
|
88 |
|
14 |
|
315 |
|
| Depreciation |
|
(63) |
|
(22) |
|
(2) |
|
(87) |
|
| By-product credits |
|
(14) |
|
(3) |
|
(1) |
|
(18) |
|
|
|
|
|
|
|
| Non-recurring items |
b |
0 |
|
0 |
|
0 |
|
0 |
|
| Other |
c |
0 |
|
0 |
|
0 |
|
0 |
|
| Non-controlling interests |
|
(55) |
|
0 |
|
0 |
|
(55) |
|
| Total cash costs |
|
81 |
|
63 |
|
11 |
|
155 |
|
| General & administrative costs |
|
0 |
|
0 |
|
0 |
|
0 |
|
| Minesite exploration and evaluation costs |
d |
0 |
|
0 |
|
0 |
|
0 |
|
| Minesite sustaining capital expenditures |
e |
52 |
|
25 |
|
0 |
|
77 |
|
| Sustaining capital leases |
|
0 |
|
0 |
|
1 |
|
1 |
|
| Rehabilitation - accretion and amortization (operating sites) |
f |
2 |
|
0 |
|
1 |
|
3 |
|
| Non-controlling interests |
|
(21) |
|
0 |
|
0 |
|
(21) |
|
| All-in sustaining costs |
|
114 |
|
88 |
|
13 |
|
215 |
|
|
|
|
|
|
|
|
|
|
|
|
|
|
|
|
|
|
|
|
|
|
|
|
|
|
|
|
|
|
|
|
|
|
|
|
|
|
|
|
|
|
|
| Ounces sold - attributable basis (koz) |
|
79 |
|
68 |
|
12 |
|
159 |
|
| COS/oz |
g,h |
1,630 |
|
1,298 |
|
1,132 |
|
1,441 |
|
| TCC/oz |
h |
1,024 |
|
931 |
|
941 |
|
977 |
|
| TCC/oz (on a co-product basis) |
h,i |
1,147 |
|
978 |
|
980 |
|
1,061 |
|
| AISC/oz |
h |
1,433 |
|
1,308 |
|
1,079 |
|
1,348 |
|
| AISC/oz (on a co-product basis) |
h,i |
1,556 |
|
1,355 |
|
1,118 |
|
1,432 |
|
|
|
|
|
|
|
|
|
|
|
|
|
|
|
|
|
|
|
|
|
|
BARRICK SECOND QUARTER 2025 |
51 |
MANAGEMENT'S DISCUSSION AND ANALYSIS |
|
|
|
|
|
|
|
|
|
|
|
|
|
|
|
|
|
|
|
|
|
|
|
|
|
|
| ($ millions, except per oz information in dollars) |
For the three months ended 6/30/24 |
|
| |
Footnote |
Loulo-Gounkotoj |
Kibali |
North Mara |
Tongon |
Bulyanhulu |
|
Africa & Middle East |
|
| COS applicable to gold production |
|
198 |
|
107 |
|
94 |
|
101 |
|
74 |
|
|
574 |
|
|
| Depreciation |
|
(62) |
|
(36) |
|
(18) |
|
(12) |
|
(16) |
|
|
(144) |
|
|
| By-product credits |
|
0 |
|
(1) |
|
(1) |
|
0 |
|
(7) |
|
|
(9) |
|
|
|
|
|
|
|
|
|
|
|
|
| Non-recurring items |
b |
0 |
|
0 |
|
0 |
|
0 |
|
0 |
|
|
0 |
|
|
| Other |
c |
0 |
|
0 |
|
0 |
|
0 |
|
0 |
|
|
0 |
|
|
| Non-controlling interests |
|
(27) |
|
0 |
|
(12) |
|
(10) |
|
(8) |
|
|
(57) |
|
|
| Total cash costs |
|
109 |
|
70 |
|
63 |
|
79 |
|
43 |
|
|
364 |
|
|
| General & administrative costs |
|
0 |
|
0 |
|
0 |
|
0 |
|
0 |
|
|
0 |
|
|
| Minesite exploration and evaluation costs |
d |
0 |
|
0 |
|
0 |
|
0 |
|
0 |
|
|
0 |
|
|
| Minesite sustaining capital expenditures |
e |
76 |
|
16 |
|
12 |
|
5 |
|
13 |
|
|
122 |
|
|
| Sustaining capital leases |
|
1 |
|
2 |
|
0 |
|
1 |
|
0 |
|
|
4 |
|
|
| Rehabilitation - accretion and amortization (operating sites) |
f |
2 |
|
1 |
|
1 |
|
3 |
|
1 |
|
|
8 |
|
|
| Non-controlling interests |
|
(16) |
|
0 |
|
(2) |
|
(1) |
|
(3) |
|
|
(22) |
|
|
| All-in sustaining costs |
|
172 |
|
89 |
|
74 |
|
87 |
|
54 |
|
|
476 |
|
|
|
|
|
|
|
|
|
|
|
|
|
|
|
|
|
|
|
|
|
|
|
|
|
|
|
|
|
|
|
|
|
|
|
|
|
|
|
|
|
|
|
|
|
|
|
|
|
|
|
|
|
|
|
|
|
|
|
|
|
|
|
|
|
|
|
|
|
|
|
|
| Ounces sold - attributable basis (koz) |
|
137 |
|
81 |
|
50 |
|
46 |
|
44 |
|
|
358 |
|
|
| COS/oz |
g,h |
1,160 |
|
1,313 |
|
1,570 |
|
1,960 |
|
1,438 |
|
|
1,389 |
|
|
| TCC/oz |
h |
795 |
|
868 |
|
1,266 |
|
1,716 |
|
985 |
|
|
1,019 |
|
|
| TCC/oz (on a co-product basis) |
h,i |
796 |
|
873 |
|
1,273 |
|
1,723 |
|
1,130 |
|
|
1,040 |
|
|
| AISC/oz |
h |
1,251 |
|
1,086 |
|
1,491 |
|
1,899 |
|
1,243 |
|
|
1,330 |
|
|
| AISC/oz (on a co-product basis) |
h,i |
1,252 |
|
1,091 |
|
1,498 |
|
1,906 |
|
1,388 |
|
|
1,351 |
|
|
|
|
|
|
|
|
|
|
|
|
|
|
|
|
|
|
|
|
|
|
|
|
|
|
|
|
|
|
|
|
|
|
|
|
|
|
|
|
|
|
|
|
|
|
|
|
|
|
| ($ millions, except per oz information in dollars) |
|
For the six months ended 6/30/25 |
| |
Footnote |
Carlin |
Cortez |
Turquoise Ridge |
|
Phoenix |
Nevada Gold Minesa |
Hemlo |
North America |
| COS applicable to gold production |
|
830 |
|
535 |
|
419 |
|
|
171 |
|
1,956 |
|
125 |
|
2,081 |
|
| Depreciation |
|
(130) |
|
(119) |
|
(91) |
|
|
(35) |
|
(375) |
|
(20) |
|
(395) |
|
| By-product credits |
|
(3) |
|
(2) |
|
(2) |
|
|
(67) |
|
(74) |
|
0 |
|
(74) |
|
|
|
|
|
|
|
|
|
|
|
| Non-recurring items |
b |
0 |
|
0 |
|
0 |
|
|
0 |
|
0 |
|
0 |
|
0 |
|
| Other |
c |
0 |
|
0 |
|
0 |
|
|
12 |
|
12 |
|
0 |
|
12 |
|
| Non-controlling interests |
|
(268) |
|
(159) |
|
(126) |
|
|
(31) |
|
(585) |
|
0 |
|
(585) |
|
| Total cash costs |
|
429 |
|
255 |
|
200 |
|
|
50 |
|
934 |
|
105 |
|
1,039 |
|
| General & administrative costs |
|
0 |
|
0 |
|
0 |
|
|
0 |
|
0 |
|
0 |
|
0 |
|
| Minesite exploration and evaluation costs |
d |
5 |
|
3 |
|
0 |
|
|
1 |
|
10 |
|
0 |
|
10 |
|
| Minesite sustaining capital expenditures |
e |
381 |
|
124 |
|
48 |
|
|
23 |
|
586 |
|
15 |
|
601 |
|
| Sustaining capital leases |
|
0 |
|
0 |
|
0 |
|
|
0 |
|
1 |
|
2 |
|
3 |
|
| Rehabilitation - accretion and amortization (operating sites) |
f |
5 |
|
8 |
|
2 |
|
|
4 |
|
19 |
|
1 |
|
20 |
|
| Non-controlling interests |
|
(151) |
|
(52) |
|
(18) |
|
|
(11) |
|
(236) |
|
0 |
|
(236) |
|
| All-in sustaining costs |
|
669 |
|
338 |
|
232 |
|
|
67 |
|
1,314 |
|
123 |
|
1,437 |
|
|
|
|
|
|
|
|
|
|
|
|
|
|
|
|
|
|
|
|
|
|
|
|
|
|
|
|
|
|
|
|
|
|
|
|
|
|
|
|
|
|
|
|
|
|
|
|
|
|
|
|
|
|
|
|
|
|
|
|
|
|
|
|
|
|
|
|
|
|
|
| Ounces sold - attributable basis (koz) |
|
308 |
|
203 |
|
153 |
|
|
57 |
|
721 |
|
71 |
|
792 |
|
| COS/oz |
g,h |
1,649 |
|
1,618 |
|
1,682 |
|
|
1,856 |
|
1,665 |
|
1,779 |
|
1,675 |
|
| TCC/oz |
h |
1,390 |
|
1,253 |
|
1,310 |
|
|
876 |
|
1,295 |
|
1,482 |
|
1,312 |
|
| TCC/oz (on a co-product basis) |
h,i |
1,396 |
|
1,258 |
|
1,318 |
|
|
1,479 |
|
1,348 |
|
1,493 |
|
1,361 |
|
| AISC/oz |
h |
2,169 |
|
1,662 |
|
1,513 |
|
|
1,190 |
|
1,821 |
|
1,725 |
|
1,812 |
|
| AISC/oz (on a co-product basis) |
h,i |
2,175 |
|
1,667 |
|
1,521 |
|
|
1,793 |
|
1,874 |
|
1,736 |
|
1,861 |
|
|
|
|
|
|
|
|
|
|
|
|
|
|
|
|
|
|
|
|
|
|
|
|
|
|
|
|
|
|
BARRICK SECOND QUARTER 2025 |
52 |
MANAGEMENT'S DISCUSSION AND ANALYSIS |
|
|
|
|
|
|
|
|
|
|
|
|
|
|
|
|
|
|
| ($ millions, except per oz information in dollars) |
For the six months ended 6/30/25 |
| |
Footnote |
Pueblo Viejo |
Veladero |
Porgera |
Latin America & Asia Pacific |
| COS applicable to gold production |
|
504 |
|
161 |
|
68 |
|
733 |
|
| Depreciation |
|
(152) |
|
(56) |
|
(14) |
|
(222) |
|
| By-product credits |
|
(23) |
|
(3) |
|
0 |
|
(26) |
|
|
|
|
|
|
|
| Non-recurring items |
b |
0 |
|
0 |
|
0 |
|
0 |
|
| Other |
c |
0 |
|
0 |
|
0 |
|
0 |
|
| Non-controlling interests |
|
(132) |
|
0 |
|
0 |
|
(132) |
|
| Total cash costs |
|
197 |
|
102 |
|
54 |
|
353 |
|
| General & administrative costs |
|
0 |
|
0 |
|
0 |
|
0 |
|
| Minesite exploration and evaluation costs |
d |
0 |
|
3 |
|
1 |
|
4 |
|
| Minesite sustaining capital expenditures |
e |
120 |
|
67 |
|
14 |
|
201 |
|
| Sustaining capital leases |
|
0 |
|
1 |
|
1 |
|
2 |
|
| Rehabilitation - accretion and amortization (operating sites) |
f |
3 |
|
1 |
|
0 |
|
4 |
|
| Non-controlling interests |
|
(48) |
|
0 |
|
0 |
|
(48) |
|
| All-in sustaining costs |
|
272 |
|
174 |
|
70 |
|
516 |
|
|
|
|
|
|
|
|
|
|
|
|
|
|
|
|
|
|
|
|
|
|
|
|
|
|
|
|
|
|
|
|
|
|
|
|
|
|
|
|
|
|
|
| Ounces sold - attributable basis (koz) |
|
169 |
|
135 |
|
45 |
|
349 |
|
| COS/oz |
g,h |
1,781 |
|
1,187 |
|
1,503 |
|
1,515 |
|
| TCC/oz |
h |
1,166 |
|
752 |
|
1,179 |
|
1,008 |
|
| TCC/oz (on a co-product basis) |
h,i |
1,247 |
|
774 |
|
1,188 |
|
1,057 |
|
| AISC/oz |
h |
1,605 |
|
1,283 |
|
1,535 |
|
1,471 |
|
| AISC/oz (on a co-product basis) |
h,i |
1,686 |
|
1,305 |
|
1,544 |
|
1,520 |
|
|
|
|
|
|
|
|
|
|
|
|
|
|
|
|
|
|
|
|
|
|
|
|
|
|
|
|
|
|
|
|
|
|
|
|
|
|
| ($ millions, except per oz information in dollars) |
For the six months ended 6/30/25 |
| |
Footnote |
Loulo-Gounkotoj |
Kibali |
North Mara |
Tongon |
Bulyanhulu |
|
Africa & Middle East |
| COS applicable to gold production |
|
— |
|
221 |
|
186 |
|
144 |
|
141 |
|
|
692 |
|
| Depreciation |
|
— |
|
(64) |
|
(40) |
|
(12) |
|
(30) |
|
|
(146) |
|
| By-product credits |
|
— |
|
(1) |
|
(3) |
|
0 |
|
(14) |
|
|
(18) |
|
|
|
|
|
|
|
|
|
|
| Non-recurring items |
b |
— |
|
0 |
|
0 |
|
0 |
|
0 |
|
|
0 |
|
| Other |
c |
— |
|
0 |
|
0 |
|
0 |
|
2 |
|
|
2 |
|
| Non-controlling interests |
|
— |
|
0 |
|
(22) |
|
(14) |
|
(16) |
|
|
(52) |
|
| Total cash costs |
|
— |
|
156 |
|
121 |
|
118 |
|
83 |
|
|
478 |
|
| General & administrative costs |
|
— |
|
0 |
|
0 |
|
0 |
|
0 |
|
|
0 |
|
| Minesite exploration and evaluation costs |
d |
— |
|
0 |
|
0 |
|
0 |
|
0 |
|
|
0 |
|
| Minesite sustaining capital expenditures |
e |
— |
|
22 |
|
32 |
|
7 |
|
53 |
|
|
114 |
|
| Sustaining capital leases |
|
— |
|
5 |
|
0 |
|
0 |
|
0 |
|
|
5 |
|
| Rehabilitation - accretion and amortization (operating sites) |
f |
— |
|
0 |
|
2 |
|
4 |
|
1 |
|
|
7 |
|
| Non-controlling interests |
|
— |
|
0 |
|
(5) |
|
(1) |
|
(9) |
|
|
(15) |
|
| All-in sustaining costs |
|
— |
|
183 |
|
150 |
|
128 |
|
128 |
|
|
589 |
|
|
|
|
|
|
|
|
|
|
|
|
|
|
|
|
|
|
|
|
|
|
|
|
|
|
|
|
|
|
|
|
|
|
|
|
|
|
|
|
|
|
|
|
|
|
|
|
|
|
|
|
|
|
|
|
|
|
|
|
|
|
|
|
| Ounces sold - attributable basis (koz) |
|
— |
|
136 |
|
118 |
|
57 |
|
69 |
|
|
380 |
|
| COS/oz |
g,h |
— |
|
1,627 |
|
1,330 |
|
2,272 |
|
1,718 |
|
|
1,676 |
|
| TCC/oz |
h |
— |
|
1,152 |
|
1,022 |
|
2,084 |
|
1,201 |
|
|
1,260 |
|
| TCC/oz (on a co-product basis) |
h,i |
— |
|
1,158 |
|
1,041 |
|
2,088 |
|
1,351 |
|
|
1,296 |
|
| AISC/oz |
h |
— |
|
1,348 |
|
1,272 |
|
2,264 |
|
1,856 |
|
|
1,591 |
|
| AISC/oz (on a co-product basis) |
h,i |
— |
|
1,354 |
|
1,291 |
|
2,268 |
|
2,006 |
|
|
1,627 |
|
|
|
|
|
|
|
|
|
|
|
|
|
|
|
|
|
|
|
|
|
|
|
|
|
|
|
|
BARRICK SECOND QUARTER 2025 |
53 |
MANAGEMENT'S DISCUSSION AND ANALYSIS |
|
|
|
|
|
|
|
|
|
|
|
|
|
|
|
|
|
|
|
|
|
|
|
|
|
|
|
|
| ($ millions, except per oz information in dollars) |
|
For the six months ended 6/30/24 |
| |
Footnote |
Carlin |
Cortez |
Turquoise Ridge |
|
Phoenix |
Nevada Gold Minesa |
Hemlo |
North America |
| COS applicable to gold production |
|
929 |
485 |
359 |
|
176 |
1,951 |
129 |
2,080 |
| Depreciation |
|
(163) |
(132) |
(79) |
|
(35) |
(410) |
(19) |
(429) |
| By-product credits |
|
(1) |
(2) |
(1) |
|
(78) |
(82) |
0 |
(82) |
|
|
|
|
|
|
|
|
|
|
| Non-recurring items |
b |
0 |
0 |
0 |
|
0 |
0 |
0 |
0 |
| Other |
c |
(9) |
0 |
0 |
|
13 |
4 |
0 |
4 |
| Non-controlling interests |
|
(291) |
(135) |
(108) |
|
(29) |
(563) |
0 |
(563) |
| Total cash costs |
|
465 |
216 |
171 |
|
47 |
900 |
110 |
1,010 |
| General & administrative costs |
|
0 |
0 |
0 |
|
0 |
0 |
0 |
0 |
| Minesite exploration and evaluation costs |
d |
6 |
3 |
3 |
|
3 |
16 |
0 |
16 |
| Minesite sustaining capital expenditures |
e |
394 |
137 |
56 |
|
19 |
623 |
19 |
642 |
| Sustaining capital leases |
|
0 |
0 |
0 |
|
1 |
2 |
2 |
4 |
| Rehabilitation - accretion and amortization (operating sites) |
f |
7 |
8 |
2 |
|
3 |
20 |
0 |
20 |
| Non-controlling interests |
|
(158) |
(56) |
(23) |
|
(10) |
(254) |
0 |
(254) |
| All-in sustaining costs |
|
714 |
308 |
209 |
|
63 |
1,307 |
131 |
1,438 |
|
|
|
|
|
|
|
|
|
|
|
|
|
|
|
|
|
|
|
|
|
|
|
|
|
|
|
|
|
|
|
|
|
|
|
|
|
|
|
|
|
|
|
|
|
|
|
|
|
|
|
|
|
|
|
|
|
|
|
|
|
|
|
|
|
|
|
|
|
|
| Ounces sold - attributable basis (koz) |
|
409 |
222 |
132 |
|
61 |
824 |
77 |
901 |
| COS/oz |
g,h |
1,380 |
1,346 |
1,664 |
|
1,782 |
1,447 |
1,689 |
1,468 |
| TCC/oz |
h |
1,136 |
976 |
1,293 |
|
773 |
1,092 |
1,435 |
1,121 |
| TCC/oz (on a co-product basis) |
h,i |
1,138 |
979 |
1,299 |
|
1,434 |
1,143 |
1,443 |
1,169 |
| AISC/oz |
h |
1,745 |
1,389 |
1,575 |
|
1,043 |
1,585 |
1,706 |
1,595 |
| AISC/oz (on a co-product basis) |
h,i |
1,747 |
1,392 |
1,581 |
|
1,704 |
1,636 |
1,714 |
1,643 |
|
|
|
|
|
|
|
|
|
|
|
|
|
|
|
|
|
|
|
|
|
|
|
|
|
|
|
|
|
|
|
|
|
|
|
|
|
|
| ($ millions, except per oz information in dollars) |
For the six months ended 6/30/24 |
| |
Footnote |
Pueblo Viejo |
Veladero |
Porgera |
Latin America & Asia Pacific |
| COS applicable to gold production |
|
423 |
|
133 |
|
14 |
|
570 |
|
| Depreciation |
|
(125) |
|
(33) |
|
(2) |
|
(160) |
|
| By-product credits |
|
(24) |
|
(4) |
|
(1) |
|
(29) |
|
|
|
|
|
|
|
| Non-recurring items |
b |
0 |
|
0 |
|
0 |
|
0 |
|
| Other |
c |
0 |
|
0 |
|
0 |
|
0 |
|
| Non-controlling interests |
|
(110) |
|
0 |
|
0 |
|
(110) |
|
| Total cash costs |
|
164 |
|
96 |
|
11 |
|
271 |
|
| General & administrative costs |
|
0 |
|
0 |
|
0 |
|
0 |
|
| Minesite exploration and evaluation costs |
d |
0 |
|
3 |
|
0 |
|
3 |
|
| Minesite sustaining capital expenditures |
e |
94 |
|
46 |
|
0 |
|
140 |
|
| Sustaining capital leases |
|
0 |
|
0 |
|
1 |
|
1 |
|
| Rehabilitation - accretion and amortization (operating sites) |
f |
3 |
|
0 |
|
0 |
|
4 |
|
| Non-controlling interests |
|
(38) |
|
0 |
|
0 |
|
(38) |
|
| All-in sustaining costs |
|
223 |
|
145 |
|
13 |
|
381 |
|
|
|
|
|
|
|
|
|
|
|
|
|
|
|
|
|
|
|
|
|
|
|
|
|
|
|
|
|
|
|
|
|
|
|
|
|
|
|
|
|
|
|
| Ounces sold - attributable basis (koz) |
|
161 |
|
101 |
|
12 |
|
274 |
|
| COS/oz |
g,h |
1,578 |
|
1,306 |
|
1,132 |
|
1,458 |
|
| TCC/oz |
h |
1,018 |
|
941 |
|
941 |
|
986 |
|
| TCC/oz (on a co-product basis) |
h,i |
1,110 |
|
985 |
|
980 |
|
1,058 |
|
| AISC/oz |
h |
1,382 |
|
1,427 |
|
1,079 |
|
1,386 |
|
| AISC/oz (on a co-product basis) |
h,i |
1,474 |
|
1,471 |
|
1,118 |
|
1,458 |
|
|
|
|
|
|
|
|
|
|
|
|
|
|
|
|
|
|
|
|
|
|
BARRICK SECOND QUARTER 2025 |
54 |
MANAGEMENT'S DISCUSSION AND ANALYSIS |
|
|
|
|
|
|
|
|
|
|
|
|
|
|
|
|
|
|
|
|
|
|
|
|
|
| ($ millions, except per oz information in dollars) |
For the six months ended 6/30/24 |
| |
Footnote |
Loulo-Gounkotoj |
Kibali |
North Mara |
Tongon |
Bulyanhulu |
|
Africa & Middle East |
| COS applicable to gold production |
|
404 |
193 |
186 |
174 |
145 |
|
1,102 |
| Depreciation |
|
(129) |
(64) |
(36) |
(22) |
(31) |
|
(282) |
| By-product credits |
|
0 |
(1) |
(1) |
0 |
(13) |
|
(15) |
|
|
|
|
|
|
|
|
|
| Non-recurring items |
b |
0 |
0 |
0 |
0 |
0 |
|
0 |
| Other |
c |
0 |
0 |
0 |
0 |
0 |
|
0 |
| Non-controlling interests |
|
(55) |
0 |
(24) |
(16) |
(16) |
|
(111) |
| Total cash costs |
|
220 |
128 |
125 |
136 |
85 |
|
694 |
| General & administrative costs |
|
0 |
0 |
0 |
0 |
0 |
|
0 |
| Minesite exploration and evaluation costs |
d |
0 |
0 |
0 |
0 |
0 |
|
0 |
| Minesite sustaining capital expenditures |
e |
126 |
31 |
34 |
7 |
34 |
|
232 |
| Sustaining capital leases |
|
1 |
4 |
0 |
1 |
0 |
|
6 |
| Rehabilitation - accretion and amortization (operating sites) |
f |
3 |
1 |
2 |
7 |
1 |
|
14 |
| Non-controlling interests |
|
(26) |
0 |
(6) |
(2) |
(6) |
|
(40) |
| All-in sustaining costs |
|
324 |
164 |
155 |
149 |
114 |
|
906 |
|
|
|
|
|
|
|
|
|
|
|
|
|
|
|
|
|
|
|
|
|
|
|
|
|
|
|
|
|
|
|
|
|
|
|
|
|
|
|
|
|
|
|
|
|
|
|
|
|
|
|
|
|
|
|
|
|
|
|
|
|
|
|
| Ounces sold - attributable basis (koz) |
|
277 |
153 |
96 |
81 |
84 |
|
691 |
| COS/oz |
g,h |
1,168 |
1,260 |
1,622 |
1,928 |
1,458 |
|
1,376 |
| TCC/oz |
h |
794 |
837 |
1,301 |
1,679 |
1,013 |
|
1,004 |
| TCC/oz (on a co-product basis) |
h,i |
795 |
842 |
1,308 |
1,686 |
1,144 |
|
1,023 |
| AISC/oz |
h |
1,171 |
1,068 |
1,617 |
1,845 |
1,360 |
|
1,312 |
| AISC/oz (on a co-product basis) |
h,i |
1,172 |
1,073 |
1,624 |
1,852 |
1,491 |
|
1,331 |
|
|
|
|
|
|
|
|
|
|
|
|
|
|
|
|
|
|
a.These results represent our 61.5% interest in Carlin, Cortez, Turquoise Ridge and Phoenix.
b.Non-recurring items - These costs are not indicative of our cost of production and have been excluded from the calculation of TCC.
c.Other - Other adjustments at Carlin include the removal of TCC and by-product credits associated with Emigrant, which is producing incidental ounces.
d.Exploration and evaluation costs - Exploration, evaluation and project expenses are presented as minesite sustaining if it supports current mine operations and project if it relates to future projects. Refer to page 37 of this MD&A.
e.Capital expenditures - Capital expenditures are related to our gold sites only and are split between minesite sustaining and project capital expenditures.
f.Rehabilitation - accretion and amortization - Includes depreciation on the assets related to rehabilitation provisions of our gold operations and accretion on the rehabilitation provision of our gold operations, split between operating and non-operating sites.
g.COS/oz - Gold COS/oz is calculated as cost of sales across our gold operations (excluding sites in closure or care and maintenance) divided by ounces sold (both on an attributable basis using Barrick's ownership share).
h.Per ounce figures - COS/oz, TCC/oz and AISC/oz may not calculate based on amounts presented in this table due to rounding.
i.Co-product costs/oz - TCC/oz and AISC/oz presented on a co-product basis removes the impact of by-product credits of our gold production (net of non-controlling interest) calculated as:
|
|
|
|
|
|
|
|
|
|
|
|
|
|
|
|
|
|
|
|
|
|
|
|
|
| ($ millions) |
|
For the three months ended 6/30/25 |
| |
|
Carlin |
Cortez |
Turquoise Ridge |
Phoenix |
Nevada Gold Minesa |
Hemlo |
Pueblo Viejo |
| By-product credits |
|
1 |
|
1 |
|
1 |
|
34 |
|
37 |
|
0 |
|
11 |
|
| Non-controlling interest |
|
0 |
|
0 |
|
(1) |
|
(13) |
|
(14) |
|
0 |
|
(4) |
|
| By-product credits (net of non-controlling interest) |
|
1 |
|
1 |
|
0 |
|
21 |
|
23 |
|
0 |
|
7 |
|
|
|
|
|
|
|
|
|
|
| ($ millions) |
|
For the three months ended 6/30/25 |
| |
|
Veladero |
Porgera |
Loulo-Gounkotoj |
Kibali |
North Mara |
Tongon |
Bulyanhulu |
| By-product credits |
|
2 |
|
0 |
|
— |
|
1 |
|
2 |
|
0 |
|
7 |
|
| Non-controlling interest |
|
0 |
|
0 |
|
— |
|
0 |
|
0 |
|
0 |
|
(1) |
|
| By-product credits (net of non-controlling interest) |
|
2 |
|
0 |
|
— |
|
1 |
|
2 |
|
0 |
|
6 |
|
|
|
|
|
|
|
|
|
|
| ($ millions) |
|
For the three months ended 3/31/25 |
| |
|
Carlin |
Cortez |
Turquoise Ridge |
Phoenix |
Nevada Gold Minesa |
Hemlo |
Pueblo Viejo |
| By-product credits |
|
2 |
|
1 |
|
1 |
|
33 |
|
37 |
|
0 |
|
12 |
|
| Non-controlling interest |
|
(1) |
|
(1) |
|
0 |
|
(13) |
|
(15) |
|
0 |
|
(5) |
|
| By-product credits (net of non-controlling interest) |
|
1 |
|
0 |
|
1 |
|
20 |
|
22 |
|
0 |
|
7 |
|
|
|
|
|
|
|
|
|
|
|
|
|
|
|
|
|
|
|
|
|
|
|
|
|
|
|
|
|
|
|
|
|
|
|
|
|
BARRICK SECOND QUARTER 2025 |
55 |
MANAGEMENT'S DISCUSSION AND ANALYSIS |
|
|
|
|
|
|
|
|
|
|
|
|
|
|
|
|
|
|
|
|
|
|
|
|
|
| ($ millions) |
|
For the three months ended 3/31/25 |
| |
|
Veladero |
Porgera |
Loulo-Gounkotoj |
Kibali |
North Mara |
Tongon |
Bulyanhulu |
| By-product credits |
|
1 |
|
0 |
|
— |
|
0 |
|
1 |
|
0 |
|
7 |
|
| Non-controlling interest |
|
0 |
|
0 |
|
— |
|
0 |
|
0 |
|
0 |
|
(1) |
|
| By-product credits (net of non-controlling interest) |
|
1 |
|
0 |
|
— |
|
0 |
|
1 |
|
0 |
|
6 |
|
|
|
|
|
|
|
|
|
|
| ($ millions) |
|
|
For the three months ended 6/30/24 |
| |
|
Carlin |
Cortez |
Turquoise Ridge |
Phoenix |
Nevada Gold Minesa |
Hemlo |
Pueblo Viejo |
| By-product credits |
|
0 |
|
1 |
|
1 |
|
44 |
|
46 |
|
0 |
|
14 |
|
| Non-controlling interest |
|
0 |
|
(1) |
|
0 |
|
(17) |
|
(18) |
|
0 |
|
(6) |
|
| By-product credits (net of non-controlling interest) |
|
0 |
|
0 |
|
1 |
|
27 |
|
28 |
|
0 |
|
8 |
|
|
|
|
|
|
|
|
|
|
|
|
|
|
|
|
|
|
|
|
|
|
|
|
|
|
|
|
|
|
|
|
|
|
|
|
|
|
|
|
|
|
|
|
|
|
|
|
|
|
|
|
|
|
|
|
|
|
|
|
|
|
|
|
|
|
|
|
|
|
|
|
|
|
|
|
|
|
|
|
|
|
|
|
|
|
|
|
|
|
|
|
|
|
|
|
|
|
|
|
|
|
|
|
|
|
|
|
|
|
|
|
|
|
|
|
|
|
|
|
|
|
|
|
|
|
|
|
|
|
|
|
|
|
|
|
|
|
|
|
|
|
|
|
|
|
|
|
|
|
|
|
|
|
|
|
|
|
|
|
|
|
|
|
|
|
|
|
|
|
|
|
|
|
|
|
|
|
|
|
|
|
|
|
|
|
|
|
|
|
|
|
|
|
|
|
|
|
|
|
|
|
|
|
|
|
|
|
|
|
|
|
|
|
|
|
|
|
|
|
|
|
|
|
|
|
|
|
|
|
|
|
|
|
|
|
|
|
|
|
|
|
|
|
|
|
|
|
|
|
|
|
|
|
|
|
| ($ millions) |
|
|
For the three months ended 6/30/24 |
|
| |
Veladero |
Porgera |
Loulo-Gounkotoj |
Kibali |
North Mara |
Tongon |
Bulyanhulu |
|
| By-product credits |
3 |
|
1 |
|
0 |
|
1 |
|
1 |
|
0 |
|
7 |
|
|
| Non-controlling interest |
0 |
|
0 |
|
0 |
|
0 |
|
0 |
|
0 |
|
(1) |
|
|
| By-product credits (net of non-controlling interest) |
3 |
|
1 |
|
0 |
|
1 |
|
1 |
|
0 |
|
6 |
|
|
|
|
|
|
|
|
|
|
|
| ($ millions) |
For the six months ended 6/30/25 |
|
|
Carlin |
Cortez |
Turquoise Ridge |
Phoenix |
Nevada Gold Minesa |
Hemlo |
Pueblo Viejo |
|
| By-product credits |
3 |
|
2 |
|
2 |
|
67 |
|
74 |
|
0 |
|
23 |
|
|
| Non-controlling interest |
(1) |
|
(1) |
|
(1) |
|
(26) |
|
(29) |
|
0 |
|
(9) |
|
|
| By-product credits (net of non-controlling interest) |
2 |
|
1 |
|
1 |
|
41 |
|
45 |
|
0 |
|
14 |
|
|
|
|
|
|
|
|
|
|
|
| ($ millions) |
For the six months ended 6/30/25 |
|
|
Veladero |
Porgera |
Loulo-Gounkotoj |
Kibali |
North Mara |
Tongon |
Bulyanhulu |
|
| By-product credits |
3 |
|
0 |
|
— |
|
1 |
|
3 |
|
0 |
|
14 |
|
|
| Non-controlling interest |
0 |
|
0 |
|
— |
|
0 |
|
0 |
|
0 |
|
(2) |
|
|
| By-product credits (net of non-controlling interest) |
3 |
|
0 |
|
— |
|
1 |
|
3 |
|
0 |
|
12 |
|
|
|
|
|
|
|
|
|
|
|
| ($ millions) |
|
For the six months ended 6/30/24 |
|
|
Carlin |
Cortez |
Turquoise Ridge |
Phoenix |
Nevada Gold Minesa |
Hemlo |
Pueblo Viejo |
|
| By-product credits |
1 |
|
2 |
|
1 |
|
78 |
|
82 |
|
0 |
|
24 |
|
|
| Non-controlling interest |
0 |
|
(1) |
|
0 |
|
(30) |
|
(31) |
|
0 |
|
(10) |
|
|
| By-product credits (net of non-controlling interest) |
1 |
|
1 |
|
1 |
|
48 |
|
51 |
|
0 |
|
14 |
|
|
|
|
|
|
|
|
|
|
|
| ($ millions) |
|
For the six months ended 6/30/24 |
|
|
Veladero |
Porgera |
Loulo-Gounkotoj |
Kibali |
North Mara |
Tongon |
Bulyanhulu |
|
| By-product credits |
4 |
|
1 |
|
0 |
|
1 |
|
1 |
|
0 |
|
13 |
|
|
| Non-controlling interest |
0 |
|
0 |
|
0 |
|
0 |
|
0 |
|
0 |
|
(2) |
|
|
| By-product credits (net of non-controlling interest) |
4 |
|
1 |
|
0 |
|
1 |
|
1 |
|
0 |
|
11 |
|
|
j.As a result of temporary suspension of operations at Loulo-Gounkoto starting January 14, 2025, and subsequent loss of control on June 16, 2025, no operating or per ounce data is provided.
|
|
|
|
|
|
|
|
|
BARRICK SECOND QUARTER 2025 |
56 |
MANAGEMENT'S DISCUSSION AND ANALYSIS |
Reconciliation of Copper Cost of Sales to C1 cash costs and All-in sustaining costs, including on a per pound basis
|
|
|
|
|
|
|
|
|
|
|
|
|
|
|
|
|
|
| ($ millions, except per lb information in dollars) |
For the three months ended |
For the six months ended |
| |
6/30/25 |
3/31/25 |
6/30/24 |
6/30/25 |
6/30/24 |
| Cost of sales |
193 |
|
208 |
|
172 |
|
401 |
|
340 |
|
| Depreciation/amortization |
(68) |
|
(60) |
|
(71) |
|
(128) |
|
(131) |
|
| Treatment and refinement charges |
40 |
|
42 |
|
38 |
|
82 |
|
72 |
|
| C1 cash costs applicable to equity method investments |
84 |
|
90 |
|
84 |
|
174 |
|
166 |
|
| Less: royalties |
(25) |
|
(21) |
|
(16) |
|
(46) |
|
(28) |
|
| By-product credits |
(12) |
|
(5) |
|
(6) |
|
(17) |
|
(11) |
|
|
|
|
|
|
|
| C1 cash costs |
212 |
|
254 |
|
201 |
|
466 |
|
408 |
|
| General & administrative costs |
8 |
|
8 |
|
5 |
|
16 |
|
9 |
|
| Rehabilitation - accretion and amortization |
3 |
|
1 |
|
2 |
|
4 |
|
4 |
|
| Royalties |
25 |
|
21 |
|
16 |
|
46 |
|
28 |
|
| Minesite exploration and evaluation costs |
1 |
|
2 |
|
1 |
|
3 |
|
1 |
|
| Minesite sustaining capital expenditures |
90 |
|
57 |
|
111 |
|
147 |
|
194 |
|
| Sustaining leases |
2 |
|
3 |
|
4 |
|
5 |
|
5 |
|
|
|
|
|
|
|
| All-in sustaining costs |
341 |
|
346 |
|
340 |
|
687 |
|
649 |
|
| Tonnes sold - attributable basis (Kt) |
54 |
|
51 |
|
42 |
|
105 |
|
81 |
|
| Pounds sold - attributable basis (Mlb) |
118 |
|
113 |
|
93 |
|
231 |
|
179 |
|
COS/lba,b |
2.56 |
|
2.92 |
|
3.05 |
|
2.74 |
|
3.12 |
|
C1 cash costs/lba |
1.80 |
|
2.25 |
|
2.18 |
|
2.02 |
|
2.28 |
|
AISC/lba |
2.90 |
|
3.06 |
|
3.67 |
|
2.98 |
|
3.64 |
|
a.COS/lb, C1 cash costs/lb and AISC/lb may not calculate based on amounts presented in this table due to rounding.
b.Copper COS/lb is calculated as cost of sales across our copper operations divided by pounds sold (both on an attributable basis using Barrick's ownership share).
Reconciliation of Copper Cost of Sales to C1 cash costs and All-in sustaining costs, including on a per pound basis, by operating segment
|
|
|
|
|
|
|
|
|
|
|
|
|
|
|
|
|
|
|
|
|
|
|
|
|
|
|
|
|
|
| ($ millions, except per lb information in dollars) |
For the three months ended |
|
6/30/25 |
3/31/25 |
6/30/24 |
| |
Zaldívar |
Lumwana |
Jabal Sayid |
Zaldívar |
Lumwana |
Jabal Sayid |
Zaldívar |
Lumwana |
Jabal Sayid |
| Cost of sales |
75 |
|
194 |
|
33 |
|
88 |
|
208 |
|
33 |
|
78 |
|
172 |
|
32 |
|
| Depreciation/amortization |
(18) |
|
(69) |
|
(6) |
|
(24) |
|
(60) |
|
(7) |
|
(19) |
|
(70) |
|
(7) |
|
| Treatment and refinement charges |
0 |
|
39 |
|
1 |
|
0 |
|
39 |
|
3 |
|
0 |
|
32 |
|
6 |
|
| Less: royalties |
0 |
|
0 |
|
0 |
|
0 |
|
(21) |
|
0 |
|
0 |
|
(16) |
|
0 |
|
| By-product credits |
0 |
|
(4) |
|
(8) |
|
0 |
|
0 |
|
(5) |
|
0 |
|
0 |
|
(6) |
|
|
|
|
|
|
|
|
|
|
|
| C1 cash costs |
57 |
|
135 |
|
20 |
|
64 |
|
166 |
|
24 |
|
59 |
|
118 |
|
25 |
|
| Rehabilitation - accretion and amortization |
1 |
|
1 |
|
0 |
|
0 |
|
1 |
|
0 |
|
0 |
|
2 |
|
0 |
|
| Royalties |
0 |
|
0 |
|
0 |
|
0 |
|
21 |
|
0 |
|
0 |
|
16 |
|
0 |
|
| Minesite exploration and evaluation costs |
1 |
|
0 |
|
0 |
|
2 |
|
0 |
|
0 |
|
1 |
|
0 |
|
0 |
|
| Minesite sustaining capital expenditures |
10 |
|
78 |
|
2 |
|
5 |
|
50 |
|
2 |
|
6 |
|
102 |
|
3 |
|
| Sustaining leases |
1 |
|
0 |
|
1 |
|
2 |
|
1 |
|
0 |
|
2 |
|
1 |
|
1 |
|
|
|
|
|
|
|
|
|
|
|
| All-in sustaining costs |
70 |
|
239 |
|
23 |
|
73 |
|
239 |
|
26 |
|
68 |
|
239 |
|
29 |
|
| Tonnes sold - attributable basis (Kt) |
7 |
|
39 |
|
8 |
|
10 |
|
34 |
|
7 |
|
9 |
|
25 |
|
8 |
|
| Pounds sold - attributable basis (Mlb) |
17 |
|
85 |
|
16 |
|
21 |
|
75 |
|
17 |
|
19 |
|
55 |
|
19 |
|
COS/lba,b |
4.59 |
|
2.25 |
|
2.11 |
|
4.11 |
|
2.80 |
|
1.96 |
|
4.13 |
|
3.15 |
|
1.67 |
|
C1 cash costs/lba |
3.46 |
|
1.58 |
|
1.29 |
|
2.99 |
|
2.22 |
|
1.44 |
|
3.12 |
|
2.14 |
|
1.34 |
|
AISC/lba |
4.34 |
|
2.79 |
|
1.46 |
|
3.38 |
|
3.20 |
|
1.55 |
|
3.55 |
|
4.36 |
|
1.53 |
|
|
|
|
|
|
|
|
|
|
BARRICK SECOND QUARTER 2025 |
57 |
MANAGEMENT'S DISCUSSION AND ANALYSIS |
|
|
|
|
|
|
|
|
|
|
|
|
|
|
|
|
|
|
|
|
|
| ($ millions, except per lb information in dollars) |
For the six months ended |
|
6/30/25 |
6/30/24 |
| |
Zaldívar |
Lumwana |
Jabal Sayid |
Zaldívar |
Lumwana |
Jabal Sayid |
| Cost of sales |
163 |
|
402 |
|
66 |
|
160 |
|
340 |
|
58 |
|
| Depreciation/amortization |
(42) |
|
(129) |
|
(13) |
|
(40) |
|
(130) |
|
(12) |
|
| Treatment and refinement charges |
0 |
|
78 |
|
4 |
|
0 |
|
60 |
|
12 |
|
| Less: royalties |
0 |
|
0 |
|
0 |
|
0 |
|
(28) |
|
0 |
|
| By-product credits |
0 |
|
(4) |
|
(13) |
|
0 |
|
0 |
|
(11) |
|
| Other |
0 |
|
0 |
|
0 |
|
0 |
|
0 |
|
0 |
|
| C1 cash costs |
121 |
|
301 |
|
44 |
|
120 |
|
242 |
|
47 |
|
| Rehabilitation - accretion and amortization |
1 |
|
2 |
|
0 |
|
0 |
|
4 |
|
0 |
|
| Royalties |
0 |
|
0 |
|
0 |
|
0 |
|
28 |
|
0 |
|
| Minesite exploration and evaluation costs |
3 |
|
0 |
|
0 |
|
1 |
|
0 |
|
0 |
|
| Minesite sustaining capital expenditures |
15 |
|
128 |
|
4 |
|
11 |
|
177 |
|
6 |
|
| Sustaining leases |
3 |
|
1 |
|
1 |
|
3 |
|
1 |
|
1 |
|
|
|
|
|
|
|
|
| All-in sustaining costs |
143 |
|
478 |
|
49 |
|
135 |
|
452 |
|
54 |
|
| Tonnes sold - attributable basis (thousands of tonnes) |
17 |
|
73 |
|
15 |
|
18 |
|
47 |
|
16 |
|
| Pounds sold - attributable basis (millions pounds) |
38 |
|
160 |
|
33 |
|
40 |
|
104 |
|
35 |
|
COS/lba,b |
4.32 |
|
2.51 |
|
2.03 |
|
4.05 |
|
3.27 |
|
1.64 |
|
C1 cash cost/lba |
3.20 |
|
1.88 |
|
1.36 |
|
3.03 |
|
2.32 |
|
1.35 |
|
AISC/lba |
3.79 |
|
2.98 |
|
1.51 |
|
3.40 |
|
4.34 |
|
1.54 |
|
a.COS/lb, C1 cash costs/lb and AISC/lb may not calculate based on amounts presented in this table due to rounding.
b.Copper COS/lb is calculated as cost of sales across our copper operations divided by pounds sold (both on an attributable basis using Barrick's ownership share).
EBITDA, Adjusted EBITDA, Attributable EBITDA, Attributable EBITDA Margin and Net Leverage
EBITDA is a non-GAAP financial measure, which excludes the following from net earnings:
■Income tax expense;
■Finance costs;
■Finance income; and
■Depreciation.
Management believes that EBITDA is a valuable indicator of our ability to generate liquidity by producing operating cash flow to fund working capital needs, service debt obligations, and fund capital expenditures. Management uses EBITDA for this purpose. EBITDA is also frequently used by investors and analysts for valuation purposes whereby EBITDA is multiplied by a factor or “EBITDA multiple” that is based on an observed or inferred relationship between EBITDA and market values to determine the approximate total enterprise value of a company.
Adjusted EBITDA removes the effect of impairment charges; acquisition/disposition gains/losses; foreign currency translation gains/losses; and other expense adjustments. We also remove the impact of income tax expense, finance costs, finance income and depreciation incurred in our equity method accounted investments. Attributable EBITDA further removes the non-controlling interest portion. We believe these items provide a greater level of consistency with the adjusting items included in our adjusted net earnings reconciliation, with the exception that these amounts are adjusted to remove any impact on finance costs/income, income tax expense and/or depreciation as they do not affect EBITDA. We believe this additional information will assist analysts, investors and other stakeholders of Barrick in better understanding our
ability to generate liquidity from our attributable business, including equity method investments, by excluding these amounts from the calculation as they are not indicative of the performance of our core mining business and do not necessarily reflect the underlying operating results for the periods presented. Additionally, it is aligned with how we present our forward-looking guidance on gold ounces and copper pounds produced.
Attributable EBITDA margin is calculated as attributable EBITDA divided by revenues - as adjusted. We believe this ratio will assist analysts, investors and other stakeholders of Barrick to better understand the relationship between revenues and EBITDA or operating profit.
Net leverage is calculated as debt, net of cash divided by the sum of adjusted EBITDA of the last four consecutive quarters. We believe this ratio will assist analysts, investors and other stakeholders of Barrick in monitoring our leverage and evaluating our balance sheet.
EBITDA, adjusted EBITDA, attributable EBITDA, EBITDA margin and net leverage are intended to provide additional information to investors and analysts and do not have any standardized definition under IFRS, and should not be considered in isolation or as a substitute for measures of performance prepared in accordance with IFRS. EBITDA, adjusted EBITDA and attributable EBITDA exclude the impact of cash costs of financing activities and taxes, and the effects of changes in operating working capital balances, and therefore are not necessarily indicative of operating profit or cash flow from operations as determined under IFRS. Other companies may calculate EBITDA, adjusted EBITDA, attributable EBITDA, EBITDA margin and net leverage differently.
|
|
|
|
|
|
|
|
|
BARRICK SECOND QUARTER 2025 |
58 |
MANAGEMENT'S DISCUSSION AND ANALYSIS |
Reconciliation of Net Earnings to EBITDA, Adjusted EBITDA and Attributable EBITDA
|
|
|
|
|
|
|
|
|
|
|
|
|
|
|
|
|
|
|
| ($ millions) |
For the three months ended |
For the six months ended |
| |
6/30/25 |
3/31/25 |
6/30/24 |
|
6/30/25 |
6/30/24 |
| Net earnings |
1,256 |
|
781 |
|
634 |
|
|
2,037 |
|
1,121 |
|
| Income tax expense |
102 |
|
278 |
|
407 |
|
|
380 |
|
581 |
|
Finance costs, neta |
36 |
|
39 |
|
28 |
|
|
75 |
|
38 |
|
| Depreciation |
436 |
|
411 |
|
480 |
|
|
847 |
|
954 |
|
| EBITDA |
1,830 |
|
1,509 |
|
1,549 |
|
|
3,339 |
|
2,694 |
|
Impairment charges of non-current assetsb |
0 |
|
4 |
|
1 |
|
|
4 |
|
18 |
|
Acquisition/disposition losses (gains)c |
289 |
|
0 |
|
(5) |
|
|
289 |
|
(6) |
|
| Loss on currency translation |
(2) |
|
2 |
|
5 |
|
|
0 |
|
17 |
|
Other expense adjustmentsd |
44 |
|
173 |
|
48 |
|
|
217 |
|
39 |
|
|
|
|
|
|
|
|
Income tax expense, net finance costsa and depreciation from equity investees |
156 |
|
141 |
|
119 |
|
|
297 |
|
221 |
|
| Adjusted EBITDA |
2,317 |
|
1,829 |
|
1,717 |
|
|
4,146 |
|
2,983 |
|
| Non-controlling Interests |
(627) |
|
(468) |
|
(428) |
|
|
(1,095) |
|
(787) |
|
| Attributable EBITDA |
1,690 |
|
1,361 |
|
1,289 |
|
|
3,051 |
|
2,196 |
|
Revenues - as adjustede |
3,050 |
|
2,685 |
|
2,658 |
|
|
5,735 |
|
4,880 |
|
Attributable EBITDA marginf |
55 |
% |
51 |
% |
48 |
% |
|
53 |
% |
45 |
% |
|
As at 6/30/25 |
As at 12/31/24 |
As at 6/30/24 |
|
As at 6/30/25 |
As at 12/31/24 |
Net leverageg |
0.0:1 |
0.1:1 |
0.1:1 |
|
0.0:1 |
0.0:1 |
a.Finance costs exclude accretion.
b.There were no significant impairment charges or reversals in the current period or prior periods.
c.Acquisition/disposition (losses) gains for Q2 2025 and YTD 2025 mainly relate to a net loss of $1,035 million on the deconsolidation of Loulo-Gounkoto following the change of control after it was placed under a temporary provisional administration on June 16, 2025 (refer to page 8 for further details) was partially offset by the recognition of our investment in Loulo-Gounkoto. This was offset by a gain of $745 million on the sale of our 50% interest in the Donlin Gold project. d.Other expense adjustments for the 2025 periods mainly relate to reduced operation costs at Loulo-Gounkoto. Q1 2025 and YTD 2025 also include the signing of agreements to settle legacy legal matters in the Philippines related to Placer Dome Inc. Other adjustments in Q2 2024 and YTD 2024 mainly relate to the interest and penalties recognized following the settlement of the Zaldívar Tax Assessments in Chile.
e.Refer to Reconciliation of Sales to Realized Price per oz/pound on page 59 of this MD&A.
f.Represents attributable EBITDA divided by revenues - as adjusted.
g.Represents debt, net of cash divided by adjusted EBITDA of the last four consecutive quarters.
Realized Price
Realized price is a non-GAAP financial measure which excludes from sales:
■Treatment and refining charges; and
■Cumulative catch-up adjustment to revenue relating to our streaming arrangements.
We believe this provides investors and analysts with a more accurate measure with which to compare to market gold and copper prices and to assess our gold and copper sales performance. For those reasons, management believes that this measure provides a more accurate reflection of our
Company’s past performance and is a better indicator of its expected performance in future periods.
The realized price measure is intended to provide additional information, and does not have any standardized definition under IFRS and should not be considered in isolation or as a substitute for measures of performance prepared in accordance with IFRS. The measure is not necessarily indicative of sales as determined under IFRS. Other companies may calculate this measure differently. The following table reconciles realized prices to the most directly comparable IFRS measure.
Reconciliation of Sales to Realized Price per ounce/pound
|
|
|
|
|
|
|
|
|
|
|
|
|
|
|
|
|
|
|
|
|
|
|
|
|
|
|
|
|
|
|
|
|
|
|
|
| ($ millions, except per oz/lb information in dollars) |
Gold |
Copper |
Gold |
Copper |
| For the three months ended |
For the six months ended |
| |
6/30/25 |
3/31/25 |
6/30/24 |
6/30/25 |
3/31/25 |
6/30/24 |
6/30/25 |
6/30/24 |
6/30/25 |
6/30/24 |
| Sales |
3,280 |
|
2,766 |
|
2,868 |
|
337 |
|
304 |
|
219 |
|
6,046 |
|
5,396 |
|
641 |
|
382 |
|
| Sales applicable to non-controlling interests |
(1,054) |
|
(848) |
|
(850) |
|
0 |
|
0 |
|
0 |
|
(1,902) |
|
(1,645) |
|
0 |
|
0 |
|
Sales applicable to equity method investmentsa,b |
306 |
|
252 |
|
217 |
|
135 |
|
164 |
|
161 |
|
558 |
|
368 |
|
299 |
|
297 |
|
|
|
|
|
|
|
|
|
|
|
|
Sales applicable to sites in closure or care and maintenancec |
(1) |
|
(1) |
|
(3) |
|
0 |
|
0 |
|
0 |
|
(2) |
|
(5) |
|
0 |
|
0 |
|
| Treatment and refinement charges |
7 |
|
6 |
|
8 |
|
40 |
|
42 |
|
38 |
|
13 |
|
15 |
|
82 |
|
72 |
|
|
|
|
|
|
|
|
|
|
|
|
| Other |
0 |
|
0 |
|
0 |
|
0 |
|
0 |
|
0 |
|
0 |
|
0 |
|
0 |
|
0 |
|
| Revenues – as adjusted |
2,538 |
|
2,175 |
|
2,240 |
|
512 |
|
510 |
|
418 |
|
4,713 |
|
4,129 |
|
1,022 |
|
751 |
|
Ounces/pounds sold (koz/Mlb)c |
770 |
|
751 |
|
956 |
|
118 |
|
113 |
|
93 |
|
1,521 |
|
1,866 |
|
231 |
|
179 |
|
Realized gold/copper price per oz/lbd |
3,295 |
|
2,898 |
|
2,344 |
|
4.36 |
|
4.51 |
|
4.53 |
|
3,099 |
|
2,213 |
|
4.43 |
|
4.21 |
|
a.Represents sales of $226 million and $417 million, respectively, for Q2 2025 and YTD 2025 (Q1 2025: $191 million; Q2 2024: $189 million; YTD 2024: $340 million) applicable to our 45% equity method investment in Kibali and $80 million and $141 million, respectively (Q1 2025: $61 million; Q2 2024: $28 million; YTD 2024: $28 million) applicable to our 24.5% equity method investment in Porgera for gold. Represents sales of $71 million and $166 million, respectively, for Q2 2025 and YTD 2025 (Q1 2025: $95 million; Q2 2024: $89 million; YTD 2024: $169 million) applicable to our 50% equity method investment in Zaldívar and $65 million and $137 million, respectively (Q1 2025: $72 million; Q2 2024: $79 million; YTD 2024: $141 million), applicable to our 50% equity method investment in Jabal Sayid for copper.
b.Sales applicable to equity method investments are net of treatment and refinement charges.
c.On an attributable basis. Excludes Long Canyon which is producing residual ounces from the leach pad while in care and maintenance.
d.Realized price per oz/lb may not calculate based on amounts presented in this table due to rounding.
|
|
|
|
|
|
|
|
|
BARRICK SECOND QUARTER 2025 |
59 |
MANAGEMENT'S DISCUSSION AND ANALYSIS |
Technical Information
The scientific and technical information contained in this MD&A has been reviewed and approved by Tricia Evans, BSc, SMERM, Mineral Resource Manager: North America; Mark Roux, BSc (Hons), P. Grad. Cert. (Geostatistics), Pr. Sci. Nat, Resource Geology Lead – North America; Richard Peattie, MPhil, FAusIMM, Mineral Resources Manager: Africa and Middle East; Peter Jones, MAIG, Manager Resource Geology – Latin America & Asia Pacific; Simon Bottoms, CGeol, MGeol, FGS, FAusIMM, Mineral Resource Management and Evaluation Executive; and Joel Holliday, FAusIMM, Executive Vice-President, Exploration – each a “Qualified Person” as defined in National Instrument 43-101 – Standards of Disclosure for Mineral Projects.
All mineral reserve and mineral resource estimates are estimated in accordance with National Instrument 43-101 – Standards of Disclosure for Mineral Projects. Unless otherwise noted, such mineral reserve and mineral resource estimates are as of December 31, 2024.
Endnotes
1Further information on these non-GAAP financial measures, including detailed reconciliations, is included on pages 44 to 59 of this MD&A.
2Gold COS/oz is calculated as cost of sales across our gold operations (excluding sites in closure or care and maintenance) divided by ounces sold (both on an attributable basis using Barrick's ownership share). Copper COS/lb is calculated as cost of sales across our copper operations divided by pounds sold (both on an attributable basis using Barrick's ownership share). References to attributable basis means our 100% share of Hemlo and Lumwana, our 61.5% share of NGM, our 60% share of Pueblo Viejo, our 80% share of Loulo-Gounkoto, our 89.7% share of Tongon, our 84% share of North Mara, and Bulyanhulu, our 50% share of Veladero, Zaldívar and Jabal Sayid, our 24.5% share of Porgera and our 45% share of Kibali.
3Total reportable incident frequency rate ("TRIFR") is a ratio calculated as follows: number of reportable injuries x 1,000,000 hours divided by the total number of hours worked. Reportable injuries include fatalities, lost time injuries, restricted duty injuries, and medically treated injuries. Lost time injury frequency rate ("LTIFR") is a ratio calculated as follows: number of lost time injuries x 1,000,000 hours divided by the total number of hours worked.
4Class 1 - High Significance is defined as an incident that causes significant negative impacts on human health or the environment or an incident that extends onto publicly accessible land and has the potential to cause significant adverse impact to surrounding communities, livestock or wildlife.
5A Tier One Gold Asset is an asset with a $1,400/oz reserve with potential to deliver a minimum 10-year life, annual production of at least 500,000 ounces of gold and with costs per ounce in the lower half of the industry cost curve. A Tier One Copper Asset/Project is an asset with a $3.00/lb reserve with potential for +5Mt contained copper in support at least 20 years life, annual production of at least 200ktpa, with costs per pound in the lower half of the industry cost curve. Tier One Assets must be located in a world-class geological district with potential for organic reserve growth and long-term geologically driven addition.
6Refer to the Technical Report on the Cortez Complex, Lander and Eureka Counties, State of Nevada, USA, dated December 31, 2021, and filed on SEDAR+ at www.sedarplus.ca and EDGAR at www.sec.gov on March 18, 2022.
7Fourmile is currently 100% owned by Barrick. As previously disclosed, Barrick anticipates Fourmile being contributed to the NGM joint venture if certain criteria are met following the completion of drilling and the requisite feasibility work.
8Refer to the Technical Report on the Carlin Complex, Eureka and Elko County, Nevada, USA, dated March 14, 2025, and filed on SEDAR+ at www.sedarplus.ca and EDGAR at www.sec.gov on March 14, 2025.
9Refer to the Technical Report on the Pueblo Viejo mine, Dominican Republic, dated March 17, 2023, and filed on SEDAR+ at www.sedarplus.ca and EDGAR at www.sec.gov on March 17, 2023.
10Refer to the Technical Report on the Reko Diq Project, Balochistan, Pakistan, dated February 19, 2025, and filed on SEDAR+ at www.sedarplus.ca and EDGAR at www.sec.gov on February 19, 2025.
11Reko Diq probable reserves of 1,400 million tonnes grading 0.28 g/t representing 13 million ounces of gold, probable reserves of 1,500 million tonnes grading 0.48% representing 7.3 million tonnes of copper, indicated resources of 1,800 million tonnes grading 0.25 g/t representing 15 million ounces of gold, inferred resources of 640 million tonnes grading 0.2 g/t representing 3.9 million ounces of gold, indicated resources of 2,000 million tonnes grading 0.43% representing 8.4 million tonnes of copper, and inferred resources of 690 million tonnes grading 0.3% representing 2.2 million tonnes of copper. Complete mineral reserve and mineral resource data for all mines and projects referenced in this MD&A, including tonnes, grades, and ounces, can be found on pages 83-92 of Barrick’s Fourth Quarter and Year-End 2024 Report.
12Refer to the Technical Report on the Lumwana Expansion Project, Republic of Zambia, dated February 19, 2025, and filed on SEDAR+ at www.sedarplus.ca and EDGAR at www.sec.gov on February 19, 2025.
|
|
|
|
|
|
|
|
|
BARRICK SECOND QUARTER 2025 |
60 |
MANAGEMENT'S DISCUSSION AND ANALYSIS |
13Hanson Significant Interceptsa
|
|
|
|
|
|
|
|
|
|
|
|
|
|
|
|
|
|
|
|
|
|
|
|
|
|
|
|
|
| Drill Results from Q2 2025 |
|
|
|
|
|
|
|
Including |
Drill Holeb |
Azimuth |
Dip |
Interval (m) |
Width (m)c |
Au (g/t) |
|
Interval (m) |
Width (m)c |
Au (g/t) |
|
| CMX-25005A |
048 |
(81) |
856.2-864.7 |
8.5 |
7.41 |
|
862.2-863.2 |
1 |
17.55 |
|
|
|
|
|
|
|
|
|
|
|
|
|
|
|
|
|
|
|
|
|
|
|
|
|
|
|
|
|
|
|
|
|
|
|
|
|
|
|
|
|
|
|
|
|
|
|
|
|
|
|
|
|
|
|
|
|
|
|
|
|
|
|
|
|
|
|
|
|
|
|
|
|
|
|
|
|
|
|
|
|
|
|
|
|
|
|
|
|
|
|
|
|
|
|
|
|
|
|
|
|
|
|
|
|
|
|
|
|
|
|
|
|
|
|
|
|
|
|
|
|
|
|
|
|
|
|
|
|
|
|
|
|
|
|
|
|
|
|
|
|
|
|
|
|
|
|
|
|
|
|
|
|
|
|
|
|
|
|
|
|
|
|
|
|
|
|
|
|
|
|
|
|
|
|
|
|
|
|
|
|
|
|
|
|
|
|
|
|
|
|
|
|
|
|
|
|
|
|
|
|
|
|
|
|
|
|
|
|
|
|
|
|
|
|
|
|
|
|
|
|
|
|
|
|
|
|
|
|
|
|
|
|
|
|
|
|
|
|
|
|
|
|
|
|
|
|
|
|
|
|
|
|
|
|
|
|
|
|
|
|
|
|
|
|
|
|
|
|
|
|
|
|
|
|
|
|
|
|
|
|
|
|
|
|
|
|
|
|
|
|
|
|
|
|
|
|
|
|
|
|
|
|
|
|
|
|
|
|
|
|
|
|
|
|
|
|
|
|
|
|
|
|
|
|
|
|
|
|
|
|
|
|
|
|
|
|
|
|
|
|
|
|
|
|
|
|
|
|
|
|
|
|
|
|
|
|
|
|
|
|
|
|
|
|
|
|
|
|
|
|
|
|
|
|
|
|
|
|
|
|
|
|
|
|
|
|
|
|
|
|
|
|
|
|
|
|
|
|
|
|
|
|
|
|
|
|
|
|
|
|
|
|
|
|
|
|
|
|
|
|
|
|
|
|
|
|
|
|
|
|
|
|
|
|
|
|
|
|
|
|
|
|
|
|
|
|
|
|
|
|
|
|
|
|
|
|
|
|
|
|
|
|
|
|
|
|
|
|
|
|
|
|
|
|
|
|
|
|
|
|
|
|
|
|
|
|
|
|
|
|
|
|
|
|
|
|
|
|
|
|
|
|
|
|
|
|
|
|
|
|
|
|
|
|
|
|
|
|
|
|
|
|
|
|
|
|
|
|
|
|
|
|
|
|
|
|
|
|
|
|
|
|
|
|
|
|
|
|
|
|
|
|
|
|
|
|
|
|
|
|
|
|
|
|
|
|
|
|
|
|
|
|
|
|
|
|
|
|
|
|
|
|
|
|
|
|
|
|
|
|
|
|
|
|
|
|
|
|
|
|
|
|
|
|
|
|
|
|
|
|
|
|
|
|
|
|
|
|
|
|
|
|
|
|
|
|
|
|
|
|
|
|
|
|
|
|
|
|
|
|
|
|
|
|
|
|
|
|
|
|
|
|
|
|
|
|
|
|
|
|
|
|
|
|
|
|
|
|
|
|
|
|
|
|
|
|
|
|
|
|
|
|
|
|
|
|
|
|
|
|
|
|
|
a.All intercepts calculated using a 3.4 g/t Au cutoff and are uncapped; minimum intercept width is 1.0 meters; internal dilution is less than 20% total width.
b.Drill hole nomenclature: CMX Project area Hanson: followed by the year (25 for 2025) then hole number.
c.True width of intercepts are uncertain at this stage.
d.Included intervals calculated using a 10.0 g/t Au cutoff and are uncapped; minimum intercept width is 1.0 meters; internal dilution is less than 20% total width.
The drilling results for Hanson contained in this MD&A have been prepared in accordance with National Instrument 43-101 – Standards of Disclosure for Mineral Projects. All drill hole assay information has been manually reviewed and approved by staff geologists and re-checked by the project manager. Sample preparation and analyses are conducted by an independent laboratory, ALS minerals. Procedures are employed to ensure security of samples during their delivery from the drill rig to the laboratory. The quality assurance procedures, data verification and assay protocols used in connection with drilling and sampling at Hanson conform to industry accepted quality control methods.
14Porfiada, Veladero District, Argentina Significant Interceptsa
|
|
|
|
|
|
|
|
|
|
|
|
|
|
|
|
|
|
|
|
|
|
|
|
|
|
|
| Drill Results from Q2 2025 |
|
|
|
|
|
|
Including |
Drill Holeb |
Azimuth |
Dip |
Interval (m) |
Width (m)c |
Au (g/t) |
Interval (m) |
Width (m)c |
Au (g/t) |
| DDH-POR-05 |
140 |
(60) |
61-114.8 |
53.8 |
0.36 |
82.6-86.3 |
3.7 |
1.1 |
| DDH-POR-05 |
140 |
(60) |
301.5-336 |
34.5 |
1.93 |
322.5-332.2 |
9.7 |
5.8 |
|
|
|
|
|
|
|
|
|
|
|
|
|
|
|
|
|
|
|
|
|
|
|
|
|
|
|
|
|
|
|
|
|
|
|
|
|
|
|
|
|
|
|
|
|
|
|
|
|
|
|
|
|
|
|
|
|
|
|
|
|
|
|
|
|
|
|
|
|
|
|
|
|
|
|
|
|
|
|
|
|
|
|
|
|
|
|
|
|
|
|
|
|
|
|
|
|
|
|
|
|
|
|
|
|
|
|
|
|
|
|
|
|
|
|
|
|
|
|
|
|
|
|
|
|
|
|
|
|
|
|
|
|
|
|
|
|
|
|
|
|
|
|
|
|
|
|
|
|
|
|
|
|
|
|
|
|
|
|
|
|
|
|
|
|
|
|
|
|
|
|
|
|
|
|
|
|
|
|
|
|
|
|
|
|
|
|
|
|
|
|
|
|
|
|
|
|
|
|
|
|
|
|
|
|
|
|
|
|
|
|
|
|
|
|
|
|
|
|
|
|
|
|
|
|
|
|
|
|
|
|
|
|
|
|
|
|
|
|
|
|
|
|
|
|
|
|
|
|
|
|
|
|
|
|
|
|
|
|
|
|
|
|
|
|
|
|
|
|
|
|
|
|
|
|
|
|
|
|
|
|
|
|
|
|
|
|
|
|
|
|
|
|
|
|
|
|
|
|
|
|
|
|
|
|
|
|
|
|
|
|
|
|
|
|
|
|
|
|
|
|
|
|
|
|
|
|
|
|
|
|
|
|
|
|
|
|
|
|
|
|
|
|
|
|
|
|
|
|
|
|
|
|
|
|
|
|
|
|
|
|
|
|
|
|
|
|
|
|
|
|
|
|
|
|
|
|
|
|
|
|
|
|
|
|
|
|
|
|
|
|
|
|
|
|
|
|
|
|
|
|
|
|
|
|
|
|
|
|
|
|
|
|
|
|
|
|
|
|
|
|
|
|
|
|
|
|
|
|
|
|
|
|
|
|
|
|
|
|
|
|
|
|
|
|
|
|
|
|
|
|
|
|
|
|
|
|
|
|
|
|
|
|
|
|
|
|
|
|
|
|
|
|
|
|
|
|
|
|
|
|
|
|
|
|
|
|
|
|
|
|
|
|
|
|
|
|
|
|
|
|
|
|
|
a.No internal dilution applied.
b.Porfiada drill hole nomenclature: Drill system Diamond Drill Hole (DDH), Project Name (Porfiada-POR) followed by hole number.
c.True width of intercepts are estimated using the core axis and are uncertain at this stage.
The drilling results for the Porfiada property contained in this MD&A have been prepared in accordance with National Instrument 43-101 – Standards of Disclosure for Mineral Projects. All drill hole assay information has been manually reviewed and approved by staff geologists and re-checked by the project manager. Sample preparation and analyses are conducted by ALS laboratory, an independent laboratory. Procedures are employed to ensure security of samples during their delivery from the drill rig to the laboratory. The quality assurance procedures, data verification and assay protocols used in connection with drilling and sampling at Porfiada conform to industry accepted quality control methods.
15Argentina Block, Veladero District, Argentina Significant Interceptsa
|
|
|
|
|
|
|
|
|
|
|
|
|
|
|
|
|
|
|
|
|
|
|
|
|
|
|
| Drill Results from Q2 2025 |
|
|
|
|
|
|
Including |
Drill Holeb |
Azimuth |
Dip |
Interval (m) |
Width (m)c |
Au (g/t) |
Interval (m) |
Width (m)c |
Au (g/t) |
| DDH-ARG-014 |
183.6 |
(61.5) |
170 - 191.4 |
21.4 |
0.56 |
170.85 - 176 |
5.15 |
1.05 |
|
|
|
|
|
|
|
|
|
|
|
|
|
|
|
|
|
|
|
|
|
|
|
|
|
|
|
|
|
|
|
|
|
|
|
|
|
|
|
|
|
|
|
|
|
|
|
|
|
|
|
|
|
|
|
|
|
|
|
|
|
|
|
|
|
|
|
|
|
|
|
|
|
|
|
|
|
|
|
|
|
|
|
|
|
|
|
|
|
|
|
|
|
|
|
|
|
|
|
|
|
|
|
|
|
|
|
|
|
|
|
|
|
|
|
|
|
|
|
|
|
|
|
|
|
|
|
|
|
|
|
|
|
|
|
|
|
|
|
|
|
|
|
|
|
|
|
|
|
|
|
|
|
|
|
|
|
|
|
|
|
|
|
|
|
|
|
|
|
|
|
|
|
|
|
|
|
|
|
|
|
|
|
|
|
|
|
|
|
|
|
|
|
|
|
|
|
|
|
|
|
|
|
|
|
|
|
|
|
|
|
|
|
|
|
|
|
|
|
|
|
|
|
|
|
|
|
|
|
|
|
|
|
|
|
|
|
|
|
|
|
|
|
|
|
|
|
|
|
|
|
|
|
|
|
|
|
|
|
|
|
|
|
|
|
|
|
|
|
|
|
|
|
|
|
|
|
|
|
|
|
|
|
|
|
|
|
|
|
|
|
|
|
|
|
|
|
|
|
|
|
|
|
|
|
|
|
|
|
|
|
|
|
|
|
|
|
|
|
|
|
|
|
|
|
|
|
|
|
|
|
|
|
|
|
|
|
|
|
|
|
|
|
|
|
|
|
|
|
|
|
|
|
|
|
|
|
|
|
|
|
|
|
|
|
|
|
|
|
|
|
|
|
|
|
|
|
|
|
|
|
|
|
|
|
|
|
|
|
|
|
|
|
|
|
|
|
|
|
|
|
|
|
|
|
|
|
|
|
|
|
|
|
|
|
|
|
|
|
|
|
|
|
|
|
|
|
|
|
|
|
|
|
|
|
|
|
|
|
|
|
|
|
|
|
|
|
|
|
|
|
|
|
|
|
|
|
|
|
|
|
|
|
|
|
|
|
|
|
|
|
|
|
|
|
|
|
|
|
|
|
|
|
|
|
|
|
|
|
|
|
|
|
|
|
|
|
|
|
|
|
|
|
|
|
|
|
|
|
|
|
|
|
a.No internal dilution applied.
b.Argenta Block drill hole nomenclature: Drill system Diamond Drill Hole (DDH), Project Name (Argenta Block - ARG) followed by hole number.
c.True width of intercepts are estimated using the core axis and are uncertain at this stage.
The drilling results for Argenta Block contained in this MD&A have been prepared in accordance with National Instrument 43-101 – Standards of Disclosure for Mineral Projects. All drill hole assay information has been manually reviewed and approved by staff geologists and re-checked by the project manager. Sample preparation and analyses are conducted by ALS laboratory, an independent laboratory. Procedures are employed to ensure security of samples during their delivery from the drill rig to the laboratory. The quality assurance procedures, data verification and assay protocols used in connection with drilling and sampling at Argenta Block conform to industry accepted quality control methods.
16Reko Diq, Bukit Pasir Cu-Au Discovery Significant Interceptsa
|
|
|
|
|
|
|
|
|
|
|
|
|
|
|
|
|
|
|
|
|
|
|
|
|
|
|
|
|
|
|
|
|
| Drill Results from Q2 2025 |
|
|
|
|
|
|
|
Including |
Drill Holea,b,c |
Azimuth |
Dip |
Interval (m) |
Width (m)d |
Au (g/t) |
Cu (%) |
Interval (m) |
Width (m)d |
Au (g/t) |
Cu (%) |
| RD-001184 |
270 |
(65) |
24-998 |
974 |
0.25 |
0.51 |
356-986 |
630 |
0.26 |
0.60 |
| RD-001184 |
270 |
(65) |
|
|
|
|
474-962 |
488 |
0.26 |
0.65 |
| RD-001184 |
270 |
(65) |
|
|
|
|
614-800 |
186 |
0.26 |
0.70 |
| RD-001185 |
270 |
(60) |
146-692 |
546 |
0.19 |
0.32 |
380-514 |
134 |
0.24 |
0.40 |
| RD-001186 |
270 |
(60) |
28-626 |
598 |
0.14 |
0.26 |
340-604 |
264 |
0.15 |
0.30 |
| RD-001188 |
270 |
(60) |
22-1052 |
1,030 |
0.25 |
0.54 |
290-1052 |
762 |
0.30 |
0.66 |
| RD-001188 |
270 |
(60) |
|
|
|
|
570-1052 |
482 |
0.32 |
0.80 |
|
|
|
|
|
|
|
|
|
|
|
|
|
|
|
|
|
|
|
|
|
|
|
|
|
|
|
|
|
|
|
|
|
|
|
|
|
|
|
|
|
|
|
|
|
|
|
|
|
|
|
|
|
|
|
|
|
|
|
|
|
|
|
|
|
|
|
|
|
|
|
|
|
|
|
|
|
|
|
|
|
|
|
|
|
|
|
|
|
|
|
|
|
|
|
|
|
|
|
|
|
|
|
|
|
|
|
|
|
|
|
|
|
|
|
|
|
|
|
|
|
|
|
|
|
|
|
|
|
|
|
|
|
|
|
|
|
|
|
|
|
|
|
|
|
|
|
|
|
|
|
|
|
|
|
|
|
|
|
|
|
|
|
|
|
|
|
|
|
|
|
|
|
|
|
|
|
|
|
|
|
|
|
|
|
|
|
|
|
|
|
|
|
|
|
|
|
|
|
|
|
|
|
|
|
|
|
|
|
|
|
|
|
|
|
|
|
|
|
|
|
|
|
|
|
|
|
|
|
|
|
|
|
|
|
|
|
|
|
|
|
|
|
|
|
|
|
|
|
|
|
|
|
|
|
|
|
|
|
|
|
|
|
|
|
|
|
|
|
|
|
|
|
|
|
|
|
|
|
|
|
|
|
|
|
|
|
|
|
|
|
|
|
|
|
|
|
|
|
|
|
|
|
|
|
|
|
|
|
|
|
|
|
|
|
|
|
|
|
|
|
|
|
|
|
|
|
|
|
|
|
|
|
|
|
|
|
|
|
|
|
|
|
|
|
|
|
|
|
|
|
|
|
|
|
|
|
|
|
|
|
|
|
|
|
|
|
|
|
|
|
|
|
|
|
|
|
|
|
|
|
|
|
|
|
|
|
|
|
|
|
|
|
|
|
|
|
|
|
|
|
|
|
|
|
|
|
|
|
|
|
|
|
|
|
|
|
|
|
|
|
|
|
|
|
|
|
|
|
|
|
|
|
|
|
|
|
|
|
|
|
|
|
|
|
|
|
|
|
|
|
|
|
|
|
|
|
|
|
|
|
|
|
|
|
|
|
|
|
|
|
|
|
|
|
|
|
|
|
|
|
|
|
|
|
|
|
|
|
|
|
|
|
|
|
|
|
|
|
|
|
|
|
|
|
|
|
|
|
|
|
|
|
|
|
|
|
|
|
|
|
|
|
|
|
|
|
|
|
|
|
|
|
|
|
|
|
|
|
|
|
|
|
|
|
|
|
|
|
|
|
|
|
|
|
|
|
|
|
|
|
|
|
|
|
|
|
|
|
|
|
|
|
|
|
|
|
|
|
|
|
|
|
|
|
|
|
|
|
|
|
|
|
|
|
|
|
|
|
|
|
|
|
|
|
|
|
|
|
|
|
|
|
|
|
|
|
|
|
|
|
|
|
|
|
|
|
a.All intercepts calculated using a 0.15% Cu cutoff and are uncapped; minimum internal dilution of 16 meters below 0.15% Cu.
b.Reko Diq district drill hole nomenclature: Reko Diq District (RD) followed by hole number.
c.Drill method is diamond drilling.
d.True width of intercepts are estimated using the core axis and are uncertain at this stage.
|
|
|
|
|
|
|
|
|
BARRICK SECOND QUARTER 2025 |
61 |
MANAGEMENT'S DISCUSSION AND ANALYSIS |
The drilling results for Reko Diq - Bukit Pasir contained in this MD&A have been prepared in accordance with National Instrument 43-101 – Standards of Disclosure for Mineral Projects. All drill hole assay information has been manually reviewed and approved by staff geologists and re-checked by the project manager. Sample preparation and analyses are conducted by an independent laboratory, SGS - Karachi. Procedures are employed to ensure security of samples during their delivery from the drill rig to the laboratory. The quality assurance procedures, data verification and assay protocols used in connection with drilling and sampling at Reko Diq - Bukit Pasir conform to industry accepted quality control methods.
17Kibali Significant Interceptsa
|
|
|
|
|
|
|
|
|
|
|
|
|
|
|
|
|
|
|
|
|
|
|
|
|
|
|
| Drill Results from Q2 2025 |
|
|
|
|
|
|
Includingd |
Drill Holeb |
Azimuth |
Dip |
Interval (m) |
Width (m)c |
Au (g/t) |
Interval (m) |
Width (m)c |
Au (g/t) |
| ADD043 |
135 |
(75) |
213.70 - 227.50 |
13.80 |
1.23 |
|
|
|
| ADD043 |
135 |
(75) |
231.30 - 233.30 |
2.00 |
1.14 |
|
|
|
| ADD044 |
135 |
(75) |
170.85 - 172.85 |
2.00 |
2.77 |
|
|
|
| ADD044 |
135 |
(75) |
187.60 - 189.90 |
2.30 |
1.16 |
|
|
|
| ADD045 |
135 |
(75) |
287.60 - 308.00 |
20.40 |
1.63 |
|
|
|
| ADD045 |
135 |
(75) |
401.00 - 403.00 |
2.00 |
2.41 |
|
|
|
| ADD045 |
135 |
(75) |
406.00 - 412.80 |
6.80 |
2.15 |
|
|
|
| ADD045 |
135 |
(75) |
462.00 - 467.00 |
5.00 |
6.15 |
|
|
|
| ADD045 |
135 |
(75) |
539.00 - 551.00 |
12.00 |
2.23 |
|
|
|
| ADD045 |
135 |
(75) |
561.10 - 570.00 |
8.9 |
4.24 |
|
|
|
| ADD049 |
135 |
(75) |
337.00 - 342.00 |
5.00 |
2.47 |
|
|
|
| ADD049 |
135 |
(75) |
361.50 - 367.30 |
5.80 |
3.91 |
|
|
|
| ADD049 |
135 |
(75) |
371.60 - 382.00 |
10.40 |
3.06 |
375.00 - 382.00 |
7 |
4.00 |
| ADD049 |
135 |
(75) |
394.00 - 400.00 |
6.00 |
0.69 |
|
|
|
| ADD049 |
135 |
(75) |
405.70 - 411.60 |
5.90 |
0.57 |
|
|
|
| ADD049 |
135 |
(75) |
421.00 - 423.00 |
2.00 |
1.16 |
|
|
|
| ADD049 |
135 |
(75) |
425.80 - 433.80 |
8.00 |
1.05 |
|
|
|
| ADD049 |
135 |
(75) |
445.00 - 448.50 |
3.50 |
4.02 |
|
|
|
| ADD049 |
135 |
(75) |
451.50 - 453.50 |
2.00 |
1.05 |
|
|
|
| ADD049 |
135 |
(75) |
495.00 - 497.00 |
2.00 |
1.40 |
|
|
|
| ADD049 |
135 |
(75) |
508.00 - 512.00 |
4.00 |
0.81 |
|
|
|
| ADD051 |
138 |
(70) |
450.85 - 455.50 |
4.65 |
3.81 |
|
|
|
| ADD051 |
138 |
(70) |
464.37 - 466.40 |
2.03 |
1.05 |
|
|
|
| ADD051 |
138 |
(70) |
550.60 - 552.70 |
2.10 |
1.21 |
|
|
|
| ADD051 |
138 |
(70) |
562.00 - 569.00 |
7.00 |
1.62 |
|
|
|
| AGDD0032 |
140 |
(70) |
0.00 - 4.00 |
4.00 |
0.67 |
|
|
|
| AGDD0032 |
140 |
(70) |
10.00 - 13.00 |
3.00 |
7.40 |
|
|
|
| AGDD0032 |
140 |
(70) |
88.28 - 108.00 |
19.72 |
5.44 |
95.55 - 99.00 |
3.45 |
23.76 |
| AGDD0032 |
140 |
(70) |
224.00 - 229.35 |
5.35 |
1.19 |
|
|
|
| AGRC0005 |
140 |
(70) |
90.00 - 94.00 |
4.00 |
5.15 |
|
|
|
| AGRC0006 |
135 |
(50) |
88.00 - 100.00 |
12.00 |
2.13 |
|
|
|
| DDD622W2 |
97 |
(67) |
1041.20 - 1052.20 |
11.00 |
1.82 |
|
|
|
| DDD622W2 |
97 |
(67) |
1240.80 - 1248.55 |
7.75 |
2.01 |
|
|
|
| DDD622W2 |
97 |
(67) |
1296.90 - 1312.80 |
15.90 |
1.27 |
|
|
|
| DDD622W2 |
97 |
(67) |
1330.30 - 1333.40 |
3.10 |
1.70 |
|
|
|
| RKDD0061 |
214 |
(54) |
220.00 - 229.00 |
9.00 |
3.59 |
|
|
|
| RKDD0061 |
214 |
(54) |
266.00 - 285.10 |
19.1 |
3.08 |
268.31 - 273.00 |
4.9 |
7.99 |
|
|
|
|
|
|
|
|
|
|
|
|
|
|
|
|
|
|
|
|
|
|
|
|
|
|
|
|
|
|
|
|
|
|
|
|
|
|
|
|
|
|
|
|
|
|
|
|
|
|
|
|
|
|
|
|
|
|
|
|
|
|
|
|
|
|
|
|
|
|
|
|
|
|
|
|
|
|
|
|
|
|
|
|
|
|
|
|
|
|
|
|
|
|
|
|
|
|
|
|
|
|
|
|
|
|
|
|
|
|
|
|
|
|
|
|
|
|
|
|
|
|
|
|
|
|
|
|
|
|
|
|
|
|
|
|
|
|
|
|
|
|
|
|
|
|
|
|
|
|
|
|
|
|
|
|
|
|
|
|
|
|
|
|
|
|
|
|
|
|
|
|
|
|
|
|
|
|
|
|
|
|
|
|
|
|
|
|
|
|
|
|
|
|
|
|
|
|
|
|
|
|
|
|
|
|
|
|
|
|
|
|
|
|
|
|
a.All intercepts calculated using a 0.5 g/t Au cutoff and are uncapped; minimum intercept width is 2 meters; internal dilution is equal to or less than 25% total width.
b.Kibali drill hole nomenclature: prospect initial (A=Agbarabo; D=Durba; M=Mengu; RK=Kombokolo; ZB=Zambula) followed by the type of drilling (RC=Reverse Circulation ,DD=Diamond ,GC=Grade control) with no designation of the year. KCDU= KCD Underground.
c.True width of intercepts are uncertain at this stage.
d.All including intercepts, calculated using a 0.5 g/t Au cutoff and are uncapped; minimum intercept width is 1 meter; no internal dilution, with grade significantly above (>40%) the overall intercept grade.
The drilling results for the Kibali property contained in this MD&A have been prepared in accordance with National Instrument 43-101 – Standards of Disclosure for Mineral Projects. All drill hole assay information has been manually reviewed and approved by staff geologists and re-checked by the project manager. Sample preparation and analyses are conducted by SGS, an independent laboratory. Industry accepted best practices for preparation and fire assaying procedures are utilized to determine gold content. Procedures are employed to ensure security of samples during their delivery from the drill rig to the laboratory. The quality assurance procedures, data verification and assay protocols used in connection with drilling and sampling on the Kibali property conform to industry accepted quality control methods.
|
|
|
|
|
|
|
|
|
BARRICK SECOND QUARTER 2025 |
62 |
MANAGEMENT'S DISCUSSION AND ANALYSIS |
18Tanzania Significant Interceptsa
|
|
|
|
|
|
|
|
|
|
|
|
|
|
|
|
|
|
|
|
|
| Drill Results from Q2 2025 |
|
|
|
|
|
|
|
Drill Holeb |
Azimuth |
Dip |
Interval (m) |
Width (m)c |
Au (g/t) |
|
|
|
| TGRC054 |
200 |
(55) |
87 - 89 |
2 |
1.13 |
|
|
|
| TGRC054 |
200 |
(55) |
94 - 97 |
3 |
0.97 |
|
|
|
| TGRC054 |
200 |
(55) |
104 - 109 |
5 |
4.65 |
|
|
|
|
|
|
|
|
|
|
|
|
|
|
|
|
|
|
|
|
|
|
|
|
|
|
|
|
|
|
|
|
|
|
|
|
|
|
|
|
|
|
|
|
|
|
|
|
|
|
|
|
|
|
|
|
|
|
|
|
|
|
|
|
|
|
|
|
|
|
|
|
|
|
|
|
|
|
|
|
|
|
|
|
|
|
|
|
|
|
|
|
|
|
|
|
|
|
|
|
|
|
|
|
|
|
|
|
|
|
|
|
|
|
|
|
|
|
|
|
|
|
|
|
|
|
|
|
|
|
|
|
|
|
|
|
|
|
|
|
|
|
|
|
|
|
|
|
|
|
|
|
|
|
|
|
|
|
|
|
|
|
|
|
|
|
|
|
|
|
|
|
|
|
|
|
|
|
|
|
|
|
|
|
|
|
|
|
|
|
|
|
|
|
|
|
|
|
|
|
|
|
|
|
|
|
|
|
|
|
|
|
|
|
|
|
|
|
|
|
|
|
|
|
|
|
|
|
|
|
|
|
|
|
|
|
|
|
|
|
|
|
|
|
|
|
|
|
|
|
|
|
|
|
|
|
|
|
|
|
|
|
|
|
|
|
|
|
|
|
|
|
|
|
|
|
|
|
|
|
|
|
|
|
|
|
|
|
|
|
|
|
|
|
|
|
|
|
|
|
|
|
|
|
|
|
|
|
|
|
|
|
|
|
|
|
|
|
|
|
|
|
|
|
|
|
|
|
|
|
|
|
|
|
|
|
|
|
|
|
|
|
|
|
|
|
|
|
|
|
|
|
|
|
|
|
|
|
|
|
|
|
|
|
|
|
|
|
|
|
|
|
|
|
|
|
|
|
|
|
|
|
|
|
|
|
|
|
|
|
|
|
|
|
|
|
|
|
|
|
|
|
|
|
|
|
|
|
|
|
|
|
|
|
|
|
|
|
|
|
|
|
|
|
|
|
|
|
|
|
|
|
|
|
|
|
|
|
|
|
|
|
|
|
|
|
|
|
|
|
|
|
|
|
|
|
|
|
|
|
|
|
|
|
|
|
|
|
|
|
|
|
|
|
|
|
|
|
|
|
|
|
|
|
|
|
|
|
|
|
|
|
|
|
|
|
|
|
a.All intercepts calculated using a 0.5 g/t Au cutoff and are uncapped; minimum intercept width is 2 meters; internal dilution is equal to or less than 2 meters total width.
b.Tanzania drill hole nomenclature: prospect initial TG (Tagota) followed by type of drilling RC (Reverse Circulation) then hole number.
c.True width of intercepts are uncertain at this stage.
The drilling results for the Tanzania property contained in this MD&A have been prepared in accordance with National Instrument 43-101 – Standards of Disclosure for Mineral Projects. All drill hole assay information has been manually reviewed and approved by staff geologists and re-checked by the project manager. Sample preparation and analyses are conducted by MSALABS, an independent laboratory. Industry accepted best practices for preparation and fire assaying procedures are utilized to determine gold content. Procedures are employed to ensure security of samples during their delivery from the drill rig to the laboratory. The quality assurance procedures, data verification and assay protocols used in connection with drilling and sampling on the Tanzania property conform to industry accepted quality control methods.
|
|
|
|
|
|
|
|
|
BARRICK SECOND QUARTER 2025 |
63 |
MANAGEMENT'S DISCUSSION AND ANALYSIS |
Consolidated Statements of Income
|
|
|
|
|
|
|
|
|
|
|
|
|
|
|
Barrick Mining Corporation (formerly Barrick Gold Corporation)
(in millions of United States dollars, except per share data) (Unaudited) |
Three months ended June 30, |
Six months ended June 30, |
| |
2025 |
2024 |
2025 |
2024 |
| Revenue (notes 5 and 6) |
$3,681 |
|
$3,162 |
|
$6,811 |
|
$5,909 |
|
| Costs and expenses (income) |
|
|
|
|
| Cost of sales (notes 5 and 7) |
1,878 |
|
1,979 |
|
3,663 |
|
3,915 |
|
| General and administrative expenses |
39 |
|
32 |
|
81 |
|
60 |
|
| Exploration, evaluation and project expenses |
82 |
|
97 |
|
136 |
|
192 |
|
| Impairment charges (note 9b) |
— |
|
1 |
|
4 |
|
18 |
|
| (Gain) loss on currency translation |
(2) |
|
5 |
|
— |
|
17 |
|
| Closed mine rehabilitation |
(8) |
|
(9) |
|
11 |
|
(11) |
|
| Income from equity investees (note 12) |
(77) |
|
(115) |
|
(144) |
|
(163) |
|
|
|
|
|
|
| Other expense (note 9a) |
353 |
|
80 |
|
523 |
|
97 |
|
| Income before finance costs and income taxes |
$1,416 |
|
$1,092 |
|
$2,537 |
|
$1,784 |
|
| Finance costs, net |
(58) |
|
(51) |
|
(120) |
|
(82) |
|
| Income before income taxes |
$1,358 |
|
$1,041 |
|
$2,417 |
|
$1,702 |
|
| Income tax expense (note 10) |
(102) |
|
(407) |
|
(380) |
|
(581) |
|
| Net income |
$1,256 |
|
$634 |
|
$2,037 |
|
$1,121 |
|
| Attributable to: |
|
|
|
|
| Equity holders of Barrick Mining Corporation |
$811 |
|
$370 |
|
$1,285 |
|
$665 |
|
| Non-controlling interests (note 15) |
$445 |
|
$264 |
|
$752 |
|
$456 |
|
|
|
|
|
|
| Earnings per share attributable to the equity holders of Barrick Mining Corporation (note 8) |
|
|
|
|
| Net income |
|
|
|
|
| Basic |
$0.47 |
|
$0.21 |
|
$0.75 |
|
$0.38 |
|
| Diluted |
$0.47 |
|
$0.21 |
|
$0.75 |
|
$0.38 |
|
|
|
|
|
|
|
|
|
|
|
|
|
|
|
|
|
|
|
|
|
|
|
|
|
|
|
|
|
|
|
|
|
|
|
|
The accompanying notes are an integral part of these condensed interim consolidated financial statements.
|
|
|
|
|
|
|
|
|
BARRICK SECOND QUARTER 2025 |
64 |
FINANCIAL STATEMENTS (UNAUDITED) |
Consolidated Statements
of Comprehensive Income
|
|
|
|
|
|
|
|
|
|
|
|
|
|
|
Barrick Mining Corporation (formerly Barrick Gold Corporation)
(in millions of United States dollars) (Unaudited) |
Three months ended June 30, |
Six months ended June 30, |
| |
2025 |
2024 |
2025 |
2024 |
| Net income |
$1,256 |
|
$634 |
|
$2,037 |
|
$1,121 |
|
| Other comprehensive income (loss), net of taxes |
|
|
|
|
| Items that may be reclassified subsequently to profit or loss: |
|
|
|
|
Unrealized gains on derivatives designated as cash flow hedges, net of tax $nil, $nil, $nil and $nil |
— |
|
— |
|
— |
|
1 |
|
|
|
|
|
|
|
|
|
|
|
| Items that will not be reclassified to profit or loss: |
|
|
|
|
Actuarial loss on post employment benefit obligations, net of tax $nil, $nil, $nil and $nil |
(1) |
|
— |
|
(2) |
|
— |
|
Net change on equity investments, net of tax $(1), $1, $(1) and $1 |
12 |
|
8 |
|
17 |
|
9 |
|
|
|
|
|
|
| Total other comprehensive income |
11 |
|
8 |
|
15 |
|
10 |
|
| Total comprehensive income |
$1,267 |
|
$642 |
|
$2,052 |
|
$1,131 |
|
| Attributable to: |
|
|
|
|
| Equity holders of Barrick Mining Corporation |
$822 |
|
$378 |
|
$1,300 |
|
$675 |
|
| Non-controlling interests |
$445 |
|
$264 |
|
$752 |
|
$456 |
|
|
|
|
|
|
|
|
|
|
|
|
|
|
|
|
|
|
|
|
|
|
|
|
|
|
|
|
|
|
|
The accompanying notes are an integral part of these condensed interim consolidated financial statements.
|
|
|
|
|
|
|
|
|
BARRICK SECOND QUARTER 2025 |
65 |
FINANCIAL STATEMENTS (UNAUDITED) |
Consolidated Statements of Cash Flow
|
|
|
|
|
|
|
|
|
|
|
|
|
|
|
Barrick Mining Corporation (formerly Barrick Gold Corporation)
(in millions of United States dollars) (Unaudited) |
Three months ended June 30, |
Six months ended June 30, |
| |
2025 |
2024 |
2025 |
2024 |
| OPERATING ACTIVITIES |
|
|
|
|
| Net income |
$1,256 |
|
$634 |
|
$2,037 |
|
$1,121 |
|
| Adjustments for the following items: |
|
|
|
|
| Depreciation |
436 |
|
480 |
|
847 |
|
954 |
|
| Finance costs, net |
58 |
|
51 |
|
120 |
|
82 |
|
| Impairment charges (note 9b) |
— |
|
1 |
|
4 |
|
18 |
|
| Income tax expense (note 10) |
102 |
|
407 |
|
380 |
|
581 |
|
| Income from equity investees (note 12) |
(77) |
|
(115) |
|
(144) |
|
(163) |
|
| Gain on sale of non-current assets (note 9a) |
(745) |
|
(5) |
|
(745) |
|
(6) |
|
| Loulo-Gounkoto loss of control (note 9a and 16) |
1,035 |
|
— |
|
1,035 |
|
— |
|
| (Gain) loss on currency translation |
(2) |
|
5 |
|
— |
|
17 |
|
| Change in working capital (note 11) |
(129) |
|
112 |
|
(234) |
|
(129) |
|
| Other operating activities (note 11) |
(103) |
|
(29) |
|
(112) |
|
(99) |
|
| Operating cash flows before interest and income taxes |
1,831 |
|
1,541 |
|
3,188 |
|
2,376 |
|
| Interest paid |
(114) |
|
(131) |
|
(139) |
|
(158) |
|
| Interest received |
37 |
|
50 |
|
83 |
|
118 |
|
Income taxes paid1 |
(425) |
|
(301) |
|
(591) |
|
(417) |
|
| Net cash provided by operating activities |
1,329 |
|
1,159 |
|
2,541 |
|
1,919 |
|
| INVESTING ACTIVITIES |
|
|
|
|
| Property, plant and equipment |
|
|
|
|
| Capital expenditures (note 5) |
(934) |
|
(819) |
|
(1,771) |
|
(1,547) |
|
| Sales proceeds |
2 |
|
7 |
|
2 |
|
7 |
|
| Divestitures (note 4) |
999 |
|
— |
|
999 |
|
— |
|
| Income taxes paid on divestitures |
(87) |
|
— |
|
(87) |
|
— |
|
| Investment sales |
— |
|
33 |
|
— |
|
33 |
|
| Funding of equity method investments (note 12) |
— |
|
(11) |
|
— |
|
(55) |
|
| Dividends received from equity method investments (note 12) |
53 |
|
42 |
|
91 |
|
89 |
|
| Shareholder loan repayments from equity method investments |
53 |
|
45 |
|
113 |
|
90 |
|
| Net cash provided by (used in) investing activities |
86 |
|
(703) |
|
(653) |
|
(1,383) |
|
| FINANCING ACTIVITIES |
|
|
|
|
|
|
|
|
|
| Lease repayments |
(14) |
|
(4) |
|
(17) |
|
(7) |
|
|
|
|
|
|
|
|
|
|
|
| Debt repayments |
(2) |
|
— |
|
(2) |
|
— |
|
| Dividends |
(170) |
|
(175) |
|
(342) |
|
(350) |
|
| Share buyback program (note 14) |
(268) |
|
(49) |
|
(411) |
|
(49) |
|
| Funding from Reko Diq non-controlling interests (note 15) |
44 |
|
30 |
|
127 |
|
52 |
|
| Disbursements to non-controlling interests (note 15) |
(324) |
|
(169) |
|
(532) |
|
(290) |
|
| Pueblo Viejo JV partner shareholder loan |
13 |
|
5 |
|
17 |
|
(2) |
|
| Net cash used in financing activities |
(721) |
|
(362) |
|
(1,160) |
|
(646) |
|
| Effect of exchange rate changes on cash and equivalents |
— |
|
— |
|
— |
|
(2) |
|
| Net increase (decrease) in cash and equivalents |
694 |
|
94 |
|
728 |
|
(112) |
|
|
|
|
|
|
| Cash and equivalents at the beginning of period |
4,108 |
|
3,942 |
|
4,074 |
|
4,148 |
|
| Cash and equivalents at the end of period |
$4,802 |
|
$4,036 |
|
4,802 |
|
4,036 |
|
|
|
|
|
|
|
|
|
|
|
|
|
|
|
|
|
|
|
|
|
|
|
|
|
|
|
|
|
|
|
|
|
|
|
|
|
|
|
|
|
|
|
|
|
|
|
|
|
|
|
|
|
|
|
|
1Income taxes paid excludes $58 million (Q2 2024: $12 million) for Q2 2025 and $75 million (YTD 2024: $29 million) for YTD 2025 of income taxes payable that were settled against offsetting value added tax (“VAT”) receivables.
The accompanying notes are an integral part of these condensed interim consolidated financial statements.
|
|
|
|
|
|
|
|
|
BARRICK SECOND QUARTER 2025 |
66 |
FINANCIAL STATEMENTS (UNAUDITED) |
Consolidated Balance Sheets
|
|
|
|
|
|
|
|
|
| Barrick Mining Corporation (formerly Barrick Gold Corporation) |
As at June 30, |
As at December 31, |
| (in millions of United States dollars) (Unaudited) |
2025 |
2024 |
| ASSETS |
|
|
| Current assets |
|
|
| Cash and equivalents |
$4,802 |
|
$4,074 |
|
| Accounts receivable |
910 |
|
763 |
|
| Inventories |
1,748 |
|
1,942 |
|
| Other current assets |
689 |
|
853 |
|
|
|
|
|
|
|
| Total current assets |
$8,149 |
|
$7,632 |
|
| Non-current assets |
|
|
| Non-current portion of inventory |
2,648 |
|
2,783 |
|
| Equity in investees (note 12) |
4,147 |
|
4,112 |
|
| Property, plant and equipment |
25,965 |
|
28,559 |
|
| Intangible assets |
148 |
|
148 |
|
| Goodwill |
3,097 |
|
3,097 |
|
|
|
|
| Other assets |
3,133 |
|
1,295 |
|
| Total assets |
$47,287 |
|
$47,626 |
|
| LIABILITIES AND EQUITY |
|
|
| Current liabilities |
|
|
| Accounts payable |
$1,464 |
|
$1,613 |
|
| Debt |
73 |
|
24 |
|
| Current income tax liabilities |
505 |
|
545 |
|
| Other current liabilities |
493 |
|
460 |
|
|
|
|
|
|
|
| Total current liabilities |
$2,535 |
|
$2,642 |
|
| Non-current liabilities |
|
|
| Debt |
4,656 |
|
4,705 |
|
| Provisions |
1,942 |
|
1,962 |
|
| Deferred income tax liabilities |
3,544 |
|
3,887 |
|
| Other liabilities |
1,186 |
|
1,174 |
|
| Total liabilities |
$13,863 |
|
$14,370 |
|
| Equity |
|
|
| Capital stock (note 14) |
$27,323 |
|
$27,661 |
|
| Deficit |
(4,328) |
|
(5,269) |
|
| Accumulated other comprehensive income |
48 |
|
33 |
|
| Other |
1,786 |
|
1,865 |
|
| Total equity attributable to Barrick Mining Corporation shareholders |
$24,829 |
|
$24,290 |
|
| Non-controlling interests (note 15) |
8,595 |
|
8,966 |
|
| Total equity |
$33,424 |
|
$33,256 |
|
| Contingencies and commitments (notes 5 and 17) |
|
|
| Total liabilities and equity |
$47,287 |
|
$47,626 |
|
|
|
|
|
|
|
|
|
|
|
|
|
|
|
|
|
|
|
|
|
|
|
|
|
|
|
|
|
|
|
|
|
|
The accompanying notes are an integral part of these condensed interim consolidated financial statements.
|
|
|
|
|
|
|
|
|
BARRICK SECOND QUARTER 2025 |
67 |
FINANCIAL STATEMENTS (UNAUDITED) |
Consolidated Statements of Changes in Equity
|
|
|
|
|
|
|
|
|
|
|
|
|
|
|
|
|
|
|
|
|
|
|
|
|
|
|
|
|
|
| Barrick Mining Corporation (formerly Barrick Gold Corporation) |
|
Attributable to equity holders of the company |
|
|
|
|
|
| (in millions of United States dollars) (Unaudited) |
Common Shares (in thousands) |
Capital stock |
Retained earnings (deficit) |
Accumulated other comprehensive income (loss)1 |
Other2 |
Total equity attributable to shareholders |
Non-controlling interests |
Total equity |
|
|
|
| At January 1, 2025 |
1,727,100 |
|
$27,661 |
|
($5,269) |
|
$33 |
|
$1,865 |
|
$24,290 |
|
$8,966 |
|
$33,256 |
|
|
|
|
| Net income |
— |
|
— |
|
1,285 |
|
— |
|
— |
|
1,285 |
|
752 |
|
2,037 |
|
|
|
|
| Total other comprehensive income |
— |
|
— |
|
— |
|
15 |
|
— |
|
15 |
|
— |
|
15 |
|
|
|
|
| Total comprehensive income |
— |
|
— |
|
1,285 |
|
15 |
|
— |
|
1,300 |
|
752 |
|
2,052 |
|
|
|
|
| Transactions with owners |
|
|
|
|
|
|
|
|
|
|
|
| Dividends |
— |
|
— |
|
(342) |
|
— |
|
— |
|
(342) |
|
— |
|
(342) |
|
|
|
|
|
|
|
|
|
|
|
|
|
|
|
|
|
|
|
|
|
|
|
|
|
|
|
|
| Loulo-Gounkoto loss of control (note 16) |
— |
|
— |
|
— |
|
— |
|
— |
|
— |
|
(686) |
|
(686) |
|
|
|
|
|
|
|
|
|
|
|
|
|
|
|
|
| Funding from non-controlling interests (note 14) |
— |
|
— |
|
— |
|
— |
|
— |
|
— |
|
127 |
|
127 |
|
|
|
|
| Disbursements to non-controlling interests (note 14) |
— |
|
— |
|
— |
|
— |
|
— |
|
— |
|
(564) |
|
(564) |
|
|
|
|
| Dividend reinvestment plan (note 13) |
86 |
|
2 |
|
(2) |
|
— |
|
— |
|
— |
|
— |
|
— |
|
|
|
|
| Share buyback program (note 13) |
(21,192) |
|
(340) |
|
— |
|
— |
|
(79) |
|
(419) |
|
— |
|
(419) |
|
|
|
|
| Total transactions with owners |
(21,106) |
|
(338) |
|
(344) |
|
— |
|
(79) |
|
(761) |
|
(1,123) |
|
(1,884) |
|
|
|
|
| At June 30, 2025 |
1,705,994 |
|
$27,323 |
|
($4,328) |
|
$48 |
|
$1,786 |
|
$24,829 |
|
$8,595 |
|
$33,424 |
|
|
|
|
| |
|
|
|
|
|
|
|
|
|
|
|
|
|
|
|
|
|
|
|
|
|
|
|
|
|
|
|
|
|
|
|
|
|
|
|
| At January 1, 2024 |
1,755,570 |
|
$28,117 |
|
($6,713) |
|
$24 |
|
$1,913 |
|
$23,341 |
|
$8,661 |
|
$32,002 |
|
|
|
|
| Net income |
— |
|
— |
|
665 |
|
— |
|
— |
|
665 |
|
456 |
|
1,121 |
|
|
|
|
| Total other comprehensive income |
— |
|
— |
|
— |
|
10 |
|
— |
|
10 |
|
— |
|
10 |
|
|
|
|
| Total comprehensive income |
— |
|
— |
|
665 |
|
10 |
|
— |
|
675 |
|
456 |
|
1,131 |
|
|
|
|
| Transactions with owners |
|
|
|
|
|
|
|
|
|
|
|
| Dividends |
— |
|
— |
|
(350) |
|
— |
|
— |
|
(350) |
|
— |
|
(350) |
|
|
|
|
|
|
|
|
|
|
|
|
|
|
|
|
|
|
|
|
|
|
|
|
|
|
|
|
|
|
|
|
|
|
|
|
|
|
|
|
|
|
|
|
|
|
|
|
|
|
|
|
| Funding from non-controlling interests |
— |
|
— |
|
— |
|
— |
|
— |
|
— |
|
52 |
|
52 |
|
|
|
|
| Disbursements to non-controlling interests |
— |
|
— |
|
— |
|
— |
|
— |
|
— |
|
(290) |
|
(290) |
|
|
|
|
| Dividend reinvestment plan |
114 |
|
2 |
|
(2) |
|
— |
|
— |
|
— |
|
— |
|
— |
|
|
|
|
| Share buyback program |
(2,950) |
|
(48) |
|
— |
|
— |
|
(2) |
|
(50) |
|
— |
|
(50) |
|
|
|
|
| Total transactions with owners |
(2,836) |
|
(46) |
|
(352) |
|
— |
|
(2) |
|
(400) |
|
(238) |
|
(638) |
|
|
|
|
| At June 30, 2024 |
1,752,734 |
|
$28,071 |
|
($6,400) |
|
$34 |
|
$1,911 |
|
$23,616 |
|
$8,879 |
|
$32,495 |
|
|
|
|
|
|
|
|
|
|
|
|
|
|
|
|
|
|
|
|
|
|
|
|
|
|
|
|
|
|
|
|
|
|
|
|
|
|
|
|
|
|
|
|
|
|
|
|
|
|
|
|
|
|
|
|
|
|
|
|
|
|
|
|
|
|
|
|
|
|
|
|
|
|
|
|
|
|
|
|
|
|
|
|
|
|
|
|
|
|
|
|
|
|
|
|
|
|
|
|
|
|
|
|
|
|
|
|
|
|
|
|
|
|
|
|
|
|
|
|
|
|
|
|
|
|
|
|
|
|
|
|
|
|
|
|
|
|
|
|
|
|
|
|
|
|
|
|
|
|
|
|
|
|
|
|
|
|
|
|
|
|
|
|
|
|
|
|
|
|
|
|
1Includes cumulative translation losses at June 30, 2025: $95 million (December 31, 2024: $95 million; June 30, 2024: $95 million).
2Includes additional paid-in capital as at June 30, 2025: $1,748 million (December 31, 2024: $1,827 million; June 30, 2024: $1,873 million).
The accompanying notes are an integral part of these condensed interim consolidated financial statements.
|
|
|
|
|
|
|
|
|
BARRICK SECOND QUARTER 2025 |
68 |
FINANCIAL STATEMENTS (UNAUDITED) |
Notes to Consolidated Financial Statements
Barrick Mining Corporation. Tabular dollar amounts in millions of United States dollars, unless otherwise shown.
1 n Corporate Information
Barrick Mining Corporation (formerly Barrick Gold Corporation) (“Barrick”, “we” or the “Company”) is a corporation governed by the Business Corporations Act (British Columbia). The Company’s corporate office is located at Brookfield Place, TD Canada Trust Tower, 161 Bay Street, Suite 3700, Toronto, Ontario, M5J 2S1. The Company’s registered office is 925 West Georgia Street, Suite 1600, Vancouver, British Columbia, V6C 3L2. Barrick shares trade on the New York Stock Exchange under the symbol B (formerly GOLD) and the Toronto Stock Exchange under the symbol ABX. We are principally engaged in the production and sale of gold and copper, as well as related activities such as exploration and mine development. We sell our gold and copper into the world market.
We have ownership interests in producing gold mines that are located in Argentina, Canada, Côte d'Ivoire, the Democratic Republic of the Congo, the Dominican Republic, Mali, Papua New Guinea, Tanzania and the United States. Our mine in Mali was placed on temporary suspension in January 2025 and on June 16, 2025, the Bamako Commercial Tribunal placed the mine under a temporary provisional administration (refer to note 16 for further details). We have ownership interests in producing copper mines in Chile, Saudi Arabia and Zambia. We also have various projects located throughout the Americas, Asia and Africa.
2 n Material Accounting Policy Information
a) Statement of Compliance
These condensed interim consolidated financial statements have been prepared in accordance with IFRS Accounting Standards as issued by the International Accounting Standards Board (“IASB”) applicable to the preparation of interim financial statements, under International Accounting Standard 34, Interim Financial Reporting. These interim financial statements should be read in conjunction with Barrick’s most recently issued Annual Report, which includes information necessary or useful to understanding the Company’s business and financial statement presentation. In particular, the Company’s material accounting policy information was presented in Note 2 of the Annual Consolidated Financial Statements for the year ended December 31, 2024 ("2024 Annual Financial Statements"), and have been consistently applied in the preparation of these interim financial statements. These condensed interim consolidated financial statements were authorized for issuance by the Board of Directors on August 8, 2025.
b) New Accounting Standards Issued
Certain new accounting standards and interpretations have been published that are either applicable in the current year or not mandatory for the current period. We have assessed these standards and determined they do not have a material impact on Barrick in the current reporting period. In addition, the following standards have been issued by the IASB and we are currently assessing the impact on our consolidated financial statements.
■Amendments to the Classification and Measurement of Financial Instruments (IFRS 9 and IFRS 7) with mandatory application of the standard in annual reporting periods beginning on or after January 1, 2026.
■IFRS 18 Presentation and Disclosure in Financial Statements with mandatory application of the standard in annual reporting periods beginning on or after January 1, 2027.
No standards have been early adopted in the current period.
3 n Critical Judgements, Estimates, Assumptions and Risks
The judgments, estimates, assumptions and risks discussed here reflect updates from the 2024 Annual Financial Statements. For judgments, estimates, assumptions and risks related to other areas not discussed in these interim consolidated financial statements, please refer to Notes 3 and 28 of the 2024 Annual Financial Statements.
a) Provision for Environmental Rehabilitation (“PER”)
Provisions are updated each reporting period for changes to expected cash flows and for the effect of changes in the discount rate and foreign exchange rates. The change in estimate is added or deducted from the related asset and depreciated over the expected economic life of the operation to which it relates. In the case of closed sites, changes in estimates and assumptions are recognized immediately in the consolidated statements of income. For Q2 2025, we recorded a net decrease of $108 million (Q2 2024: $59 million net decrease) to the PER at our minesites and for YTD 2025, a net decrease of $82 million (YTD 2024: $100 million net decrease) primarily due to spending incurred during the year, combined with the deconsolidation of Loulo-Gounkoto upon loss of control (refer to note 16 for further details), partially offset by accretion.
Adjustments to the estimated amount and timing of future closure and rehabilitation cash flows are a normal occurrence in light of the significant judgments and estimates involved. Rehabilitation provisions are adjusted as a result of changes in estimates and assumptions and are accounted for prospectively. In Q4 of each year, our life of mine plans are updated and that typically results in an update to the rehabilitation provision.
b) Contingencies
Contingencies can be either possible assets or possible liabilities arising from past events which, by their nature, will be resolved only when one or more future events, not wholly within our control, occur or fail to occur. The assessment of such contingencies inherently involves the exercise of significant judgment and estimates of the outcome of future events. Refer to Note 17 for further details on contingencies.
c) Loulo-Gounkoto
On June 16, 2025, we lost control of the subsidiaries that hold our 80% interest in the Loulo-Gounkoto mine in Mali when they were placed under a temporary provisional administration. As a result of this event, we determined that we no longer had control of the mine and stopped consolidating it. As we retain legal ownership of 80% of the companies that hold the mine, we have recognized an investment at fair value to reflect our retained interest. Refer to note 16 for further details.
|
|
|
|
|
|
|
|
|
BARRICK SECOND QUARTER 2025 |
69 |
NOTES TO FINANCIAL STATEMENTS (UNAUDITED) |
4 n Acquisitions and Divestitures
a) Donlin Gold
On April 22, 2025, Barrick announced it had entered into an agreement to sell its 50% interest in the Donlin Gold project located in Alaska, USA to affiliates of Paulson Advisers LLC and NOVAGOLD Resources Inc. (“NOVAGOLD”) for total cash consideration of $1 billion. In addition, Barrick has granted NOVAGOLD an option to purchase the outstanding debt owed to Barrick (value of $160 million as at June 30, 2025, classified as fair value through profit or loss (“FVPL”) and presented in Other Assets) in connection with the Donlin Gold project for $90 million if purchased prior to
closing, or for $100 million if purchased within 18 months from closing, when the option expires. If that option is not exercised, the debt will remain outstanding, substantially in accordance with its existing terms which would largely defer repayment to the commencement of production.
The transaction closed on June 3, 2025 and we recognized a gain on sale of $745 million in Q2 2025. In addition, NOVAGOLD did not exercise the option to purchase the outstanding debt owed to Barrick at closing, but retains the option to purchase the outstanding debt for $100 million within 18 months from closing.
5 n Segment Information
Barrick’s business is organized into sixteen minesites. Barrick’s Chief Operating Decision Maker ("CODM") (Mark Bristow, President and Chief Executive Officer) reviews the operating results, assesses performance and makes capital allocation decisions at the minesite level. Our presentation of our reportable operating segments consists of eight gold mines (Carlin, Cortez, Turquoise Ridge, Pueblo Viejo, Loulo-Gounkoto, Kibali, North Mara and Bulyanhulu) and one copper mine (Lumwana). The remaining operating segments, including our remaining gold mines, have been grouped into an “Other Mines” category and will not be reported on individually. Segment performance is evaluated based on a number of measures including operating income before tax, production levels and unit production costs. Certain costs are managed on a consolidated basis and are therefore not reflected in segment income.
Consolidated Statement of Income Information
|
|
|
|
|
|
|
|
|
|
|
|
|
|
|
|
|
|
|
|
|
|
|
| |
|
Cost of Sales |
|
|
|
|
|
| For the three months ended June 30, 2025 |
Revenue |
Site operating costs, royalties and community relations |
Depreciation |
Exploration, evaluation and project expenses |
Other expenses (income)1 |
Segment income (loss) |
|
|
Carlin2 |
$898 |
|
$361 |
|
$68 |
|
$4 |
|
$1 |
|
$464 |
|
|
|
Cortez2 |
579 |
|
232 |
|
62 |
|
1 |
|
2 |
|
282 |
|
|
|
Turquoise Ridge2 |
410 |
|
172 |
|
44 |
|
— |
|
(5) |
|
199 |
|
|
|
Pueblo Viejo2 |
517 |
|
190 |
|
77 |
|
— |
|
3 |
|
247 |
|
|
|
Loulo-Gounkoto2 |
— |
|
— |
|
8 |
|
— |
|
63 |
|
(71) |
|
|
|
| Kibali |
226 |
|
76 |
|
32 |
|
— |
|
29 |
|
89 |
|
|
|
| Lumwana |
340 |
|
125 |
|
69 |
|
— |
|
2 |
|
144 |
|
|
|
|
|
|
|
|
|
|
|
|
North Mara2 |
201 |
|
65 |
|
19 |
|
— |
|
11 |
|
106 |
|
|
|
Bulyanhulu2 |
133 |
|
50 |
|
14 |
|
— |
|
2 |
|
67 |
|
|
|
Other Mines2 |
610 |
|
242 |
|
65 |
|
1 |
|
9 |
|
293 |
|
|
|
| Reportable segment total |
$3,914 |
|
$1,513 |
|
$458 |
|
$6 |
|
$117 |
|
$1,820 |
|
|
|
| Share of equity investees |
(226) |
|
(76) |
|
(32) |
|
— |
|
(29) |
|
(89) |
|
|
|
| Segment total |
$3,688 |
|
$1,437 |
|
$426 |
|
$6 |
|
$88 |
|
$1,731 |
|
|
|
|
|
|
|
|
|
|
|
|
|
|
|
|
|
|
|
|
|
|
|
|
|
|
|
|
|
|
|
|
|
|
|
|
|
|
|
Consolidated Statement of Income Information
|
|
|
|
|
|
|
|
|
|
|
|
|
|
|
|
|
|
|
|
|
|
|
| |
|
Cost of Sales |
|
|
|
|
|
| For the three months ended June 30, 2024 |
Revenue |
Site operating costs, royalties and community relations |
Depreciation |
Exploration, evaluation and project expenses |
Other expenses (income)1 |
Segment income (loss) |
|
|
Carlin2 |
$770 |
|
$381 |
|
$80 |
|
$3 |
|
$4 |
|
$302 |
|
|
|
Cortez2 |
385 |
|
167 |
|
57 |
|
3 |
|
1 |
|
157 |
|
|
|
Turquoise Ridge2 |
268 |
|
143 |
|
42 |
|
2 |
|
— |
|
81 |
|
|
|
Pueblo Viejo2 |
314 |
|
150 |
|
63 |
|
1 |
|
2 |
|
98 |
|
|
|
Loulo-Gounkoto2 |
404 |
|
136 |
|
62 |
|
— |
|
10 |
|
196 |
|
|
|
| Kibali |
189 |
|
71 |
|
36 |
|
— |
|
(2) |
|
84 |
|
|
|
| Lumwana |
219 |
|
102 |
|
70 |
|
— |
|
10 |
|
37 |
|
|
|
|
|
|
|
|
|
|
|
|
North Mara2 |
140 |
|
76 |
|
18 |
|
— |
|
3 |
|
43 |
|
|
|
Bulyanhulu2 |
129 |
|
58 |
|
16 |
|
— |
|
2 |
|
53 |
|
|
|
Other Mines2 |
530 |
|
287 |
|
65 |
|
3 |
|
6 |
|
169 |
|
|
|
| Reportable segment total |
$3,348 |
|
$1,571 |
|
$509 |
|
$12 |
|
$36 |
|
$1,220 |
|
|
|
| Share of equity investees |
(189) |
|
(71) |
|
(36) |
|
— |
|
2 |
|
(84) |
|
|
|
| Segment total |
$3,159 |
|
$1,500 |
|
$473 |
|
$12 |
|
$38 |
|
$1,136 |
|
|
|
|
|
|
|
|
|
|
|
|
|
|
|
|
|
|
|
|
|
|
|
|
|
|
|
|
|
|
|
|
|
|
|
|
|
|
|
|
|
|
|
|
|
|
|
|
BARRICK SECOND QUARTER 2025 |
70 |
NOTES TO FINANCIAL STATEMENTS (UNAUDITED) |
Consolidated Statement of Income Information
|
|
|
|
|
|
|
|
|
|
|
|
|
|
|
|
|
|
|
|
|
|
|
| |
|
Cost of Sales |
|
|
|
|
|
| For the six months ended June 30, 2025 |
Revenue |
Site operating costs, royalties and community relations |
Depreciation |
Exploration, evaluation and project expenses |
Other expenses (income)1 |
Segment income (loss) |
|
|
Carlin2 |
$1,576 |
|
$700 |
|
$130 |
|
$5 |
|
$4 |
|
$737 |
|
|
|
Cortez2 |
1,035 |
|
416 |
|
119 |
|
3 |
|
4 |
|
493 |
|
|
|
Turquoise Ridge2 |
774 |
|
328 |
|
91 |
|
— |
|
(4) |
|
359 |
|
|
|
Pueblo Viejo2 |
894 |
|
352 |
|
152 |
|
1 |
|
6 |
|
383 |
|
|
|
Loulo-Gounkoto2 |
— |
|
— |
|
14 |
|
1 |
|
142 |
|
(157) |
|
|
|
| Kibali |
418 |
|
157 |
|
64 |
|
— |
|
36 |
|
161 |
|
|
|
| Lumwana |
645 |
|
273 |
|
129 |
|
— |
|
4 |
|
239 |
|
|
|
|
|
|
|
|
|
|
|
|
North Mara2 |
436 |
|
146 |
|
40 |
|
— |
|
14 |
|
236 |
|
|
|
Bulyanhulu2 |
279 |
|
111 |
|
30 |
|
— |
|
4 |
|
134 |
|
|
|
Other Mines2 |
1,193 |
|
479 |
|
123 |
|
3 |
|
12 |
|
576 |
|
|
|
| Reportable segment total |
$7,250 |
|
$2,962 |
|
$892 |
|
$13 |
|
$222 |
|
$3,161 |
|
|
|
| Share of equity investees |
(418) |
|
(157) |
|
(64) |
|
— |
|
(36) |
|
(161) |
|
|
|
| Segment total |
$6,832 |
|
$2,805 |
|
$828 |
|
$13 |
|
$186 |
|
$3,000 |
|
|
|
|
|
|
|
|
|
|
|
|
|
|
|
|
|
|
|
|
|
|
|
|
|
|
|
|
|
|
|
|
|
|
|
|
|
|
|
Consolidated Statement of Income Information
|
|
|
|
|
|
|
|
|
|
|
|
|
|
|
|
|
|
|
|
|
|
|
| |
|
Cost of Sales |
|
|
|
|
|
| For the six months ended June 30, 2024 |
Revenue |
Site operating costs, royalties and community relations |
Depreciation |
Exploration, evaluation and project expenses |
Other expenses (income)1 |
Segment income (loss) |
|
|
Carlin2 |
$1,482 |
|
$766 |
|
$163 |
|
$6 |
|
$6 |
|
$541 |
|
|
|
Cortez2 |
798 |
|
353 |
|
132 |
|
4 |
|
3 |
|
306 |
|
|
|
Turquoise Ridge2 |
479 |
|
280 |
|
79 |
|
3 |
|
— |
|
117 |
|
|
|
Pueblo Viejo2 |
604 |
|
298 |
|
125 |
|
2 |
|
4 |
|
175 |
|
|
|
Loulo-Gounkoto2 |
765 |
|
275 |
|
129 |
|
— |
|
22 |
|
339 |
|
|
|
| Kibali |
341 |
|
129 |
|
64 |
|
— |
|
— |
|
148 |
|
|
|
| Lumwana |
382 |
|
210 |
|
130 |
|
— |
|
12 |
|
30 |
|
|
|
|
|
|
|
|
|
|
|
|
North Mara2 |
254 |
|
150 |
|
36 |
|
— |
|
8 |
|
60 |
|
|
|
Bulyanhulu2 |
235 |
|
114 |
|
31 |
|
— |
|
3 |
|
87 |
|
|
|
Other Mines2 |
912 |
|
511 |
|
112 |
|
6 |
|
11 |
|
272 |
|
|
|
| Reportable segment total |
$6,252 |
|
$3,086 |
|
$1,001 |
|
$21 |
|
$69 |
|
$2,075 |
|
|
|
| Share of equity investees |
(341) |
|
(129) |
|
(64) |
|
— |
|
— |
|
(148) |
|
|
|
| Segment total |
$5,911 |
|
$2,957 |
|
$937 |
|
$21 |
|
$69 |
|
$1,927 |
|
|
|
|
|
|
|
|
|
|
|
|
|
|
|
|
|
|
|
|
|
|
|
|
|
|
|
|
|
|
|
|
|
|
|
|
|
|
|
1Includes accretion expense, which is included within finance costs in the consolidated statement of income. For Q2 2025, accretion expense was $12 million (Q2 2024: $14 million) and for YTD 2025, accretion expense was $26 million (YTD 2024: $27 million).
2Includes non-controlling interest portion of revenues, cost of sales and segment income for Q2 2025 for Nevada Gold Mines $795 million, $398 million, $396 million (Q2 2024: $603 million, $369 million, $228 million), Pueblo Viejo $210 million, $108 million, $102 million (Q2 2024: $127 million, $84 million, $42 million), Loulo-Gounkoto $nil, $2 million, $(12) million (Q2 2024: $81 million, $40 million, $40 million), North Mara and Bulyanhulu $53 million, $23 million, $30 million (Q2 2024: $43 million, $27 million, $16 million), and Tongon $10 million, $8 million, $3 million (Q2 2024: $13 million, $10 million, $2 million) and for YTD 2025 for Nevada Gold Mines $1,439 million, $753 million, $680 million (YTD 2024: $1,175 million, $750 million, $414 million), Pueblo Viejo $359 million, $203 million, $156 million (YTD 2024: $245 million, $168 million, $76 million), Loulo-Gounkoto $nil, $3 million, $(29) million (YTD 2024: $153 million, $81 million, $69 million), North Mara and Bulyanhulu $114 million, $52 million, $61 million (YTD 2024: $78 million, $53 million, $24 million) and Tongon $20 million, $15 million, $5 million (YTD 2024: $21 million, $18 million, $3 million), respectively.
|
|
|
|
|
|
|
|
|
BARRICK SECOND QUARTER 2025 |
71 |
NOTES TO FINANCIAL STATEMENTS (UNAUDITED) |
Reconciliation of Segment Income to Income Before Income Taxes
|
|
|
|
|
|
|
|
|
|
|
|
|
|
|
| |
For the three months ended June 30 |
For the six months ended June 30 |
| |
2025 |
2024 |
2025 |
2024 |
| Segment income |
$1,731 |
|
$1,136 |
|
$3,000 |
|
$1,927 |
|
| Other revenue |
(7) |
|
3 |
|
(21) |
|
(2) |
|
| Other cost of sales/amortization |
(15) |
|
(6) |
|
(30) |
|
(21) |
|
| Exploration, evaluation and project expenses not attributable to segments |
(76) |
|
(85) |
|
(123) |
|
(171) |
|
| General and administrative expenses |
(39) |
|
(32) |
|
(81) |
|
(60) |
|
| Other expense not attributable to segments |
(276) |
|
(56) |
|
(362) |
|
(55) |
|
| Impairment charges |
— |
|
(1) |
|
(4) |
|
(18) |
|
| Gain (loss) on currency translation |
2 |
|
(5) |
|
— |
|
(17) |
|
| Closed mine rehabilitation |
8 |
|
9 |
|
(11) |
|
11 |
|
| Income from equity investees |
77 |
|
115 |
|
144 |
|
163 |
|
| Finance costs, net (includes non-segment accretion) |
(46) |
|
(37) |
|
(94) |
|
(55) |
|
| Loss on non-hedge derivatives |
(1) |
|
— |
|
(1) |
|
— |
|
| Income before income taxes |
$1,358 |
|
$1,041 |
|
$2,417 |
|
$1,702 |
|
|
|
|
|
|
|
|
|
|
|
|
|
|
|
|
|
|
|
|
|
|
|
|
|
|
|
|
|
|
|
|
|
|
|
|
Capital Expenditures Information |
Segment capital expenditures1 |
| |
For the three months ended June 30 |
For the six months ended June 30 |
| |
2025 |
2024 |
2025 |
2024 |
| Carlin |
$156 |
|
$226 |
|
$360 |
|
$429 |
|
| Cortez |
119 |
|
99 |
|
219 |
|
193 |
|
| Turquoise Ridge |
27 |
|
26 |
|
48 |
|
56 |
|
| Pueblo Viejo |
84 |
|
93 |
|
171 |
|
150 |
|
| Loulo-Gounkoto |
5 |
|
100 |
|
23 |
|
174 |
|
| Kibali |
33 |
|
36 |
|
67 |
|
61 |
|
| Lumwana |
183 |
|
114 |
|
253 |
|
193 |
|
|
|
|
|
|
| North Mara |
53 |
|
27 |
|
93 |
|
71 |
|
| Bulyanhulu |
36 |
|
30 |
|
74 |
|
61 |
|
| Other Mines |
71 |
|
64 |
|
142 |
|
114 |
|
| Reportable segment total |
$767 |
|
$815 |
|
$1,450 |
|
$1,502 |
|
| Other items not allocated to segments |
244 |
|
46 |
|
368 |
|
78 |
|
| Total |
$1,011 |
|
$861 |
|
$1,818 |
|
$1,580 |
|
| Share of equity investees |
(33) |
|
(36) |
|
(67) |
|
(61) |
|
| Total |
$978 |
|
$825 |
|
$1,751 |
|
$1,519 |
|
|
|
|
|
|
|
|
|
|
|
|
|
|
|
|
|
|
|
|
|
|
|
|
|
|
1Segment capital expenditures are presented for internal management reporting purposes on an accrual basis. Capital expenditures in the Consolidated Statements of Cash Flow are presented on a cash basis. For Q2 2025, cash expenditures were $934 million (Q2 2024: $819 million) and the increase in accrued expenditures was $44 million (2024: $6 million increase). For YTD 2025, cash expenditures were $1,771 million (2024: $1,547 million) and the decrease in accrued expenditures was $20 million (YTD 2024: $28 million decrease).
Purchase Commitments
At June 30, 2025, we had purchase obligations for supplies and consumables of $1,736 million (December 31, 2024: $1,621 million).
Capital Commitments
In addition to entering into various operational commitments in the normal course of business, we had capital commitments of $1,544 million at June 30, 2025 (December 31, 2024: $605 million).
|
|
|
|
|
|
|
|
|
BARRICK SECOND QUARTER 2025 |
72 |
NOTES TO FINANCIAL STATEMENTS (UNAUDITED) |
6 n Revenue
|
|
|
|
|
|
|
|
|
|
|
|
|
|
|
| |
For the three months ended June 30 |
For the six months ended June 30 |
| |
2025 |
2024 |
2025 |
2024 |
| Gold sales |
|
|
|
|
| Spot market sales |
$3,117 |
|
$2,754 |
|
$5,718 |
|
$5,170 |
|
| Concentrate sales |
155 |
|
109 |
|
304 |
|
212 |
|
| Provisional pricing adjustments |
8 |
|
5 |
|
24 |
|
14 |
|
|
$3,280 |
|
$2,868 |
|
$6,046 |
|
$5,396 |
|
| Copper sales |
|
|
|
|
| Concentrate sales |
$337 |
|
$223 |
|
$612 |
|
$382 |
|
| Provisional pricing adjustments |
— |
|
(4) |
|
29 |
|
— |
|
|
$337 |
|
$219 |
|
$641 |
|
$382 |
|
Other sales1 |
64 |
|
75 |
|
124 |
|
131 |
|
| Total |
$3,681 |
|
$3,162 |
|
$6,811 |
|
$5,909 |
|
|
|
|
|
|
|
|
|
|
|
|
|
|
|
|
|
|
|
|
|
|
|
|
|
|
|
|
|
|
|
|
|
|
|
|
1Revenues include the sale of by-products for our gold and copper mines.
7 n Cost of Sales
|
|
|
|
|
|
|
|
|
|
|
|
|
|
|
|
|
|
|
|
|
|
|
|
|
|
|
|
|
|
| |
Gold |
Copper |
Other3 |
Total |
|
|
|
| For the three months ended June 30 |
2025 |
2024 |
2025 |
2024 |
2025 |
2024 |
2025 |
2024 |
|
|
|
Site operating costs1,2 |
$1,179 |
|
$1,268 |
|
$99 |
|
$84 |
|
$— |
|
$— |
|
$1,278 |
|
$1,352 |
|
|
|
|
Depreciation1 |
359 |
|
401 |
|
68 |
|
71 |
|
9 |
|
8 |
|
436 |
|
480 |
|
|
|
|
| Royalty expense |
103 |
|
99 |
|
25 |
|
16 |
|
— |
|
— |
|
128 |
|
115 |
|
|
|
|
Mining and production taxes4 |
25 |
|
21 |
|
— |
|
— |
|
— |
|
— |
|
25 |
|
21 |
|
|
|
|
| Community relations |
10 |
|
10 |
|
1 |
|
1 |
|
— |
|
— |
|
11 |
|
11 |
|
|
|
|
|
$1,676 |
|
$1,799 |
|
$193 |
|
$172 |
|
$9 |
|
$8 |
|
$1,878 |
|
$1,979 |
|
|
|
|
| |
Gold |
Copper |
Other3 |
Total |
|
|
|
| For the six months ended June 30 |
2025 |
2024 |
2025 |
2024 |
2025 |
2024 |
2025 |
2024 |
|
|
|
Site operating costs1,2 |
$2,276 |
|
$2,509 |
|
$225 |
|
$179 |
|
$— |
|
$— |
|
$2,501 |
|
$2,688 |
|
|
|
|
Depreciation1 |
701 |
|
808 |
|
128 |
|
131 |
|
18 |
|
15 |
|
847 |
|
954 |
|
|
|
|
| Royalty expense |
198 |
|
187 |
|
46 |
|
28 |
|
— |
|
— |
|
244 |
|
215 |
|
|
|
|
Mining and production taxes4 |
48 |
|
37 |
|
— |
|
— |
|
— |
|
— |
|
48 |
|
37 |
|
|
|
|
| Community relations |
21 |
|
19 |
|
2 |
|
2 |
|
— |
|
— |
|
23 |
|
21 |
|
|
|
|
|
$3,244 |
|
$3,560 |
|
$401 |
|
$340 |
|
$18 |
|
$15 |
|
$3,663 |
|
$3,915 |
|
|
|
|
|
|
|
|
|
|
|
|
|
|
|
|
|
|
|
|
|
|
|
|
|
|
|
|
|
|
|
|
|
|
|
|
|
|
|
|
|
|
|
|
|
|
|
|
|
|
|
|
|
|
|
|
|
|
|
|
|
|
|
|
1Site operating costs and depreciation include charges to reduce the cost of inventory to net realizable value as follows: $nil for Q2 2025 (Q2 2024: $11 million) and $1 million for YTD 2025 (YTD 2024: $33 million).
2Site operating costs includes the costs of extracting by-products.
3Other includes corporate amortization.
42024 figures have been changed to present mining and production taxes separately from site operating costs.
8 n Earnings Per Share
|
|
|
|
|
|
|
|
|
|
|
|
|
|
|
|
|
|
|
|
|
|
|
|
|
|
|
| |
For the three months ended June 30 |
For the six months ended June 30 |
| |
2025 |
2024 |
2025 |
2024 |
| |
Basic |
Diluted |
Basic |
Diluted |
Basic |
Diluted |
Basic |
Diluted |
| Net income |
$1,256 |
|
$1,256 |
|
$634 |
|
$634 |
|
$2,037 |
|
$2,037 |
|
$1,121 |
|
$1,121 |
|
| Net income attributable to non-controlling interests |
(445) |
|
(445) |
|
(264) |
|
(264) |
|
(752) |
|
(752) |
|
(456) |
|
(456) |
|
| Net income attributable to equity holders of Barrick Mining Corporation |
$811 |
|
$811 |
|
$370 |
|
$370 |
|
$1,285 |
|
$1,285 |
|
$665 |
|
$665 |
|
| Weighted average shares outstanding |
1,716 |
|
1,716 |
|
1,755 |
|
1,755 |
|
1,721 |
|
1,721 |
|
1,755 |
|
1,755 |
|
|
|
|
|
|
|
|
|
|
| Basic and diluted earnings per share attributable to the equity holders of Barrick Mining Corporation |
$0.47 |
|
$0.47 |
|
$0.21 |
|
$0.21 |
|
$0.75 |
|
$0.75 |
|
$0.38 |
|
$0.38 |
|
|
|
|
|
|
|
|
|
|
|
|
|
|
|
|
|
|
|
|
|
|
|
|
|
|
|
|
|
|
|
|
|
|
|
|
|
|
|
|
|
|
|
|
|
|
|
|
|
|
|
|
|
|
|
BARRICK SECOND QUARTER 2025 |
73 |
NOTES TO FINANCIAL STATEMENTS (UNAUDITED) |
9 n Other Expense
a) Other Expense (Income)
|
|
|
|
|
|
|
|
|
|
|
|
|
|
|
| |
For the three months ended June 30 |
For the six months ended June 30 |
| |
2025 |
2024 |
2025 |
2024 |
| Other expense: |
|
|
|
|
| Bank charges |
$2 |
|
$2 |
|
$3 |
|
$3 |
|
|
|
|
|
|
Loulo-Gounkoto loss of control1 |
1,035 |
|
— |
|
1,035 |
|
— |
|
| Loss on non-hedge derivatives |
1 |
|
— |
|
1 |
|
— |
|
| Litigation legal expenses |
16 |
|
7 |
|
20 |
|
11 |
|
|
|
|
|
|
| Loss (gain) on warrant investments at FVPL |
(1) |
|
1 |
|
(1) |
|
3 |
|
| Loulo-Gounkoto reduced operations costs |
58 |
|
— |
|
125 |
|
— |
|
| Litigation settlement accruals |
— |
|
— |
|
91 |
|
— |
|
|
|
|
|
|
| Tax interest and penalties |
— |
|
61 |
|
— |
|
61 |
|
| Other |
(1) |
|
18 |
|
17 |
|
34 |
|
| Total other expense |
$1,110 |
|
$89 |
|
$1,291 |
|
$112 |
|
| Other income: |
|
|
|
|
Gain on sale of non-current assets2 |
($745) |
|
($5) |
|
($745) |
|
($6) |
|
|
|
|
|
|
|
|
|
|
|
|
|
|
|
|
| Interest income on other assets |
(12) |
|
(4) |
|
(23) |
|
(9) |
|
|
|
|
|
|
| Total other income |
($757) |
|
($9) |
|
($768) |
|
($15) |
|
| Total |
$353 |
|
$80 |
|
$523 |
|
$97 |
|
|
|
|
|
|
|
|
|
|
|
|
|
|
|
|
|
|
|
|
|
|
|
|
|
|
|
|
|
|
|
1Refer to note 16 for further details.
22025 includes a gain of $745 million related to the sale of the Donlin Gold project. Refer to note 4 for further details.
b) Impairment Charges
|
|
|
|
|
|
|
|
|
|
|
|
|
|
|
| |
For the three months ended June 30 |
For the six months ended June 30 |
| |
2025 |
2024 |
2025 |
2024 |
| Impairment charges of non-current assets |
$— |
|
$1 |
|
$4 |
|
$18 |
|
|
|
|
|
|
| Total |
$— |
|
$1 |
|
$4 |
|
$18 |
|
|
|
|
|
|
|
|
|
|
|
10 n Income Tax Expense
|
|
|
|
|
|
|
|
|
|
|
|
|
|
|
| |
For the three months ended June 30 |
For the six months ended June 30 |
| |
2025 |
2024 |
2025 |
2024 |
| Current |
$465 |
|
$412 |
|
$752 |
|
$552 |
|
| Deferred |
(363) |
|
(5) |
|
(372) |
|
29 |
|
| Total |
$102 |
|
$407 |
|
$380 |
|
$581 |
|
|
|
|
|
|
|
|
|
|
|
|
|
|
|
|
|
|
|
|
|
Income tax expense was $380 million for YTD 2025 (YTD 2024: $581 million). The unadjusted effective income tax rate for YTD 2025 was 16% of income before income taxes.
The underlying effective income tax rate on ordinary income for YTD 2025 was 26% after adjusting for the impact of foreign currency translation losses on deferred tax balances; the impact of the sale of the Donlin Gold project; the impact of the signing of agreements to settle legacy legal matters in the Philippines related to Placer Dome Inc.; the impact of Loulo-Gounkoto’s loss of control (derecognition of $437 million in current and deferred tax balances); the impact of Loulo-Gounkoto's
reduced operations costs; and the impact of other expense adjustments.
Currency Translation
Current and deferred tax balances are subject to remeasurement for changes in foreign currency exchange rates each period. This is required in countries where tax is paid in local currency and the subsidiary has a different functional currency (typically US dollars). The most significant balances relate to Argentine and Malian tax balances.
In YTD 2025, a tax recovery of $47 million (YTD 2024: $36 million tax expense) arose primarily from net translation gains on deferred tax balances in Mali (prior to their deconsolidation) and Argentina due to the strengthening of the West African CFA, partially offset by the weakening of the Argentine peso against the US dollar. These net translation gains are included within income tax expense.
Withholding Taxes
For YTD 2025, we have recorded $50 million (YTD 2024: $20 million related to Peru and the United States) of dividend withholding taxes related to the distributed earnings of our subsidiaries in Argentina, Tanzania and Saudi Arabia, and undistributed earnings of our subsidiaries in Argentina, Saudi Arabia and the United States.
United States Tax Reform
Under the Inflation Reduction Act signed in August 2022, the United States implemented a 15% corporate alternative minimum tax (“CAMT”) on applicable financial statement income, effective for tax years beginning after December 31, 2022, with CAMT credit carryforwards having an indefinite life. Barrick is subject to CAMT as it meets the requisite income thresholds for a foreign-parented multi-national group.
While final regulations are still awaited, since its introduction, Barrick has recognized a deferred tax asset from the CAMT credit carryforwards anticipating recovery against future US Federal Income Tax liabilities. No additional deferred tax asset related to CAMT has been recognized for YTD 2025 due to the anticipated application of a portion of the existing balance to our federal income tax payable; however, the timing and amount of such offset may be subject to change pending issuance of final regulations.
Organization for Economic Co-operation and Development (“OECD”) Pillar Two model rules
These rules apply to multi-national enterprises with annual consolidated revenues of at least €750 million in at least two of the prior four fiscal years immediately preceding the relevant fiscal year, which is reflective of our status.
Canada enacted Pillar Two legislation in Q2 2024, effective for fiscal years commencing on or after December 31, 2023. Other jurisdictions in which the group operates have either enacted or are in the process of enacting similar legislation.
In terms of the income tax accounting, we have applied the exception available under the amendments to IAS 12 published by the IASB in May 2023 and are not recognizing or disclosing information about deferred tax assets and liabilities related to Pillar Two income taxes. Our review of Pillar Two for the current year, based on the OECD’s Transitional Safe Harbour rules as implemented in the Global Minimum Tax Act in Canada, has not identified any material amounts to be accrued for Q2 2025. As the law is evolving, both in Canada and elsewhere, we will continue to monitor the impact of this legislation.
|
|
|
|
|
|
|
|
|
BARRICK SECOND QUARTER 2025 |
74 |
NOTES TO FINANCIAL STATEMENTS (UNAUDITED) |
11 n Cash Flow - Other Items
|
|
|
|
|
|
|
|
|
|
|
|
|
|
|
| Operating Cash Flows – Other Items |
For the three months ended June 30 |
For the six months ended June 30 |
| |
2025 |
2024 |
2025 |
2024 |
| Adjustments for non-cash income statement items: |
|
|
|
|
| Loss on non-hedge derivatives |
$1 |
|
$— |
|
$1 |
|
$— |
|
| Loss (gain) on warrant investments at FVPL |
(1) |
|
1 |
|
($1) |
|
$3 |
|
| Litigation settlement accruals |
— |
|
— |
|
91 |
|
— |
|
| Tax interest and penalties |
— |
|
61 |
|
— |
|
61 |
|
| Share-based compensation expense |
27 |
|
5 |
|
69 |
|
18 |
|
| Change in estimate of rehabilitation costs at closed mines |
(17) |
|
(15) |
|
(7) |
|
(27) |
|
|
|
|
|
|
| Inventory impairment charges |
— |
|
8 |
|
1 |
|
22 |
|
| Non-cash revenue recognized on Pueblo Viejo gold and silver streaming agreement |
(8) |
|
(9) |
|
(15) |
|
(16) |
|
| Change in other assets and liabilities |
(66) |
|
(34) |
|
(108) |
|
(43) |
|
| Settlement of share-based compensation |
— |
|
(7) |
|
(53) |
|
(46) |
|
| Settlement of rehabilitation obligations |
(39) |
|
(39) |
|
(90) |
|
(71) |
|
|
|
|
|
|
| Other operating activities |
($103) |
|
($29) |
|
($112) |
|
($99) |
|
| Cash flow arising from changes in: |
|
|
|
|
| Accounts receivable |
($216) |
|
$42 |
|
($204) |
|
$81 |
|
| Inventory |
2 |
|
40 |
|
(65) |
|
12 |
|
Value added taxes receivable1 |
(36) |
|
(52) |
|
(96) |
|
(151) |
|
| Other current assets |
(15) |
|
(12) |
|
(17) |
|
(13) |
|
| Accounts payable |
64 |
|
91 |
|
40 |
|
(50) |
|
| Other current liabilities |
72 |
|
3 |
|
108 |
|
(8) |
|
| Change in working capital |
($129) |
|
$112 |
|
($234) |
|
($129) |
|
|
|
|
|
|
|
|
|
|
|
|
|
|
|
|
|
|
|
|
|
|
|
|
|
|
|
|
|
|
|
|
|
|
|
|
|
|
|
|
|
|
|
|
|
|
|
|
|
|
|
|
|
|
|
|
|
|
|
|
|
|
|
|
|
|
|
|
|
|
|
|
|
|
|
|
|
|
|
|
|
|
|
|
|
|
|
|
|
|
|
|
1 Excludes $58 million (Q2 2024: $12 million) for Q2 2025 and $75 million (YTD 2024: $29 million) for YTD 2025 of VAT receivables that were settled against offsetting of income taxes payable and $4 million (Q2 2024: $8 million) for Q2 2025 and $48 million (YTD 2024: $8 million) for YTD 2025 of VAT receivables that were settled against offsetting of other duties and liabilities.
12 n Equity Accounting Method Investment Continuity
|
|
|
|
|
|
|
|
|
|
|
|
|
|
|
|
|
|
|
|
|
|
|
|
|
|
Kibali |
|
|
Jabal Sayid |
Zaldívar |
Porgera |
Other |
Total |
|
|
| At January 1, 2024 |
$2,119 |
|
|
|
$391 |
|
$874 |
|
$703 |
|
$46 |
|
$4,133 |
|
|
|
| Investment in equity accounting method investment |
— |
|
|
|
— |
|
— |
|
7 |
|
— |
|
7 |
|
|
|
|
|
|
|
|
|
|
|
|
|
|
| Equity pick-up (loss) from equity investees |
108 |
|
|
|
119 |
|
1 |
|
22 |
|
(2) |
|
248 |
|
|
|
| Funds invested |
— |
|
|
|
— |
|
— |
|
55 |
|
4 |
|
59 |
|
|
|
| Dividends received from equity investees |
(88) |
|
|
|
(109) |
|
— |
|
— |
|
(1) |
|
(198) |
|
|
|
| Non-cash dividends received from equity investees |
(124) |
|
|
|
— |
|
— |
|
— |
|
— |
|
(124) |
|
|
|
| Equity earnings adjustment |
— |
|
|
|
— |
|
— |
|
(7) |
|
— |
|
(7) |
|
|
|
| Shareholder loan repayment |
— |
|
|
|
— |
|
— |
|
— |
|
(6) |
|
(6) |
|
|
|
| At December 31, 2024 |
$2,015 |
|
|
|
$401 |
|
$875 |
|
$780 |
|
$41 |
|
$4,112 |
|
|
|
| Equity earnings adjustment |
— |
|
|
|
— |
|
— |
|
(1) |
|
— |
|
(1) |
|
|
|
| Equity pick-up from equity investees |
33 |
|
|
|
61 |
|
1 |
|
50 |
|
— |
|
145 |
|
|
|
|
|
|
|
|
|
|
|
|
|
|
| Dividends received from equity investees |
— |
|
|
|
(73) |
|
— |
|
— |
|
— |
|
(73) |
|
|
|
| Shareholder loan repayment |
— |
|
|
|
— |
|
— |
|
(33) |
|
(3) |
|
(36) |
|
|
|
| At June 30, 2025 |
$2,048 |
|
|
|
$389 |
|
$876 |
|
$796 |
|
$38 |
|
$4,147 |
|
|
|
|
|
|
|
|
|
|
|
|
|
|
|
|
|
|
|
|
|
|
|
|
|
|
|
|
|
|
|
|
|
|
|
|
|
|
|
|
|
|
|
|
|
|
|
|
|
|
|
|
|
|
|
|
|
|
|
|
|
|
|
|
|
|
|
BARRICK SECOND QUARTER 2025 |
75 |
NOTES TO FINANCIAL STATEMENTS (UNAUDITED) |
13 n Fair Value Measurements
a) Assets and Liabilities Measured at Fair Value on a Recurring Basis
|
|
|
|
|
|
|
|
|
|
|
|
|
|
|
|
|
| As at June 30, 2025 |
Quoted prices in active markets for identical assets |
Significant other observable inputs |
Significant unobservable inputs |
Aggregate fair value |
|
|
| (Level 1) |
(Level 2) |
(Level 3) |
|
|
|
|
|
|
|
|
|
|
Other investments1 |
$60 |
|
$— |
|
$— |
|
$60 |
|
|
|
|
|
|
|
|
|
|
| Receivables from provisional copper and gold sales |
— |
|
330 |
|
— |
|
330 |
|
|
|
Receivable from NOVAGOLD2 |
— |
|
— |
|
160 |
|
160 |
|
|
|
Investment in Loulo-Gounkoto3 |
— |
|
— |
|
1,700 |
|
1,700 |
|
|
|
|
$60 |
|
$330 |
|
$1,860 |
|
$2,250 |
|
|
|
|
|
|
|
|
|
|
|
|
|
|
|
|
|
|
|
|
|
|
|
|
|
|
|
|
|
|
|
|
|
|
|
|
|
|
1 Includes equity investments in other mining companies.
2 Refer to note 4 for further details.
3 Refer to note 16 for further details.
b) Fair Values of Financial Assets and Liabilities
|
|
|
|
|
|
|
|
|
|
|
|
|
|
|
| |
As at June 30, 2025 |
As at December 31, 2024 |
|
Carrying amount |
Estimated fair value |
Carrying amount |
Estimated fair value |
| Financial assets |
|
|
|
|
Other assets1 |
$716 |
|
$716 |
|
$776 |
|
$776 |
|
Other investments2 |
60 |
|
60 |
|
42 |
|
42 |
|
|
|
|
|
|
|
$776 |
|
$776 |
|
$818 |
|
$818 |
|
| Financial liabilities |
|
|
|
|
Debt3 |
$4,729 |
|
$4,930 |
|
$4,729 |
|
$4,821 |
|
|
|
|
|
|
| Other liabilities |
598 |
|
598 |
|
595 |
|
595 |
|
|
$5,327 |
|
$5,528 |
|
$5,324 |
|
$5,416 |
|
|
|
|
|
|
|
|
|
|
|
|
|
|
|
|
|
|
|
|
|
|
|
|
|
|
1Includes restricted cash and amounts due from our partners.
2Includes equity investments in other mining companies. Recorded at fair value. Quoted market prices are used to determine fair value.
3Debt is generally recorded at amortized cost. The fair value of debt is primarily determined using quoted market prices. Balance includes both current and long-term portions of debt.
The Company’s valuation techniques were presented in Note 26 of the 2024 Annual Financial Statements and have been consistently applied in these interim financial statements.
14 n Capital Stock
a) Authorized Capital Stock
Our authorized capital stock is composed of an unlimited number of common shares (issued 1,705,993,790 common shares as at June 30, 2025). Our common shares have no par value.
b) Dividends
The Company’s practice has been to declare dividends after a quarter as part of the announcement of the results for the quarter. Dividends declared are paid in the same quarter.
The Company’s dividend reinvestment plan resulted in 85,199 common shares being issued to shareholders for YTD 2025.
c) Share Buyback Program
At the February 11, 2025 meeting, the Board of Directors authorized a new share buyback program for the repurchase of up to $1.0 billion of the Company’s outstanding common shares over the next 12 months. During YTD 2025, Barrick purchased 21.19 million common shares for a total cash amount of $411 million under this program and accrued $8 million in related taxes.
The actual number of common shares that may be purchased, and the timing of any such purchases, will be determined by Barrick based on a number of factors, including the Company's financial performance, the availability of cash flows, and the consideration of other uses of cash, including capital investment opportunities, returns to shareholders, and debt reduction.
The repurchase program does not obligate the Company to acquire any particular number of common shares, and the repurchase program may be suspended or discontinued at any time at the Company's discretion.
|
|
|
|
|
|
|
|
|
BARRICK SECOND QUARTER 2025 |
76 |
NOTES TO FINANCIAL STATEMENTS (UNAUDITED) |
15 n Non-controlling Interests Continuity
|
|
|
|
|
|
|
|
|
|
|
|
|
|
|
|
|
|
|
|
|
|
|
|
|
|
|
|
Nevada Gold Mines |
Pueblo Viejo |
Tanzania Mines1 |
Loulo-Gounkoto |
Tongon |
Reko Diq |
Other |
Total |
| NCI in subsidiary at June 30, 2025 |
38.5 |
% |
40 |
% |
16 |
% |
20 |
% |
10.3 |
% |
50 |
% |
Various |
|
| At January 1, 2024 |
$6,162 |
|
$1,143 |
|
$322 |
|
$760 |
|
$16 |
|
$338 |
|
($80) |
|
$8,661 |
|
|
|
|
|
|
|
|
|
|
| Share of income (loss) |
884 |
|
101 |
|
53 |
|
(31) |
|
— |
|
(63) |
|
— |
|
944 |
|
| Cash contributed |
— |
|
— |
|
— |
|
— |
|
— |
|
146 |
|
— |
|
146 |
|
|
|
|
|
|
|
|
|
|
| Disbursements |
(667) |
|
(84) |
|
— |
|
(34) |
|
— |
|
— |
|
— |
|
(785) |
|
| At December 31, 2024 |
$6,379 |
|
$1,160 |
|
$375 |
|
$695 |
|
$16 |
|
$421 |
|
($80) |
|
$8,966 |
|
|
|
|
|
|
|
|
|
|
| Share of income (loss) |
632 |
|
87 |
|
39 |
|
(9) |
|
5 |
|
(2) |
|
— |
|
752 |
|
| Cash contributed |
— |
|
— |
|
— |
|
— |
|
— |
|
127 |
|
— |
|
127 |
|
Loss of control2 |
— |
|
— |
|
— |
|
(686) |
|
— |
|
— |
|
— |
|
(686) |
|
| Disbursements |
(441) |
|
(88) |
|
(35) |
|
— |
|
— |
|
— |
|
— |
|
(564) |
|
| At June 30, 2025 |
$6,570 |
|
$1,159 |
|
$379 |
|
$— |
|
$21 |
|
$546 |
|
($80) |
|
$8,595 |
|
|
|
|
|
|
|
|
|
|
1Tanzania mines consist of the two operating mines, North Mara and Bulyanhulu.
2Refer to note 16 for further details.
16 n Loulo-Gounkoto Loss of Control
Barrick owns 80% of Société des Mines de Loulo SA (“Somilo”) and Société des Mines de Gounkoto (“Gounkoto”) with the Republic of Mali owning the other 20%. As previously disclosed, the Company and the Government of Mali (“GoM”) have been engaged in an ongoing dispute over the existing mining conventions of these two companies (together, the “Conventions”).
The Loulo and Gounkoto permits each have a 30 year term from their date of grant, after which they are renewable if production is still taking place. The Loulo permit renewal date is February 2026 and we submitted a renewal application on February 13, 2025.
On December 18, 2024, after multiple good faith attempts to resolve the dispute, Somilo and Gounkoto submitted a request for arbitration to the International Centre for the Settlement of Investment Disputes (“ICSID”) in accordance with the provisions of their respective Conventions. On January 14, 2025, due to the restrictions imposed by the GoM on gold shipments, the Company announced that the Loulo-Gounkoto complex would temporarily suspend operations.
On June 16, 2025, the Bamako Commercial Tribunal placed Loulo-Gounkoto under temporary provisional administration. While Barrick retains its 80% legal ownership of the mine, control over operations has been transferred to an external administrator. Following this action by the Malian courts, we concluded that Barrick had lost control of the subsidiaries that hold our interest in Loulo-Gounkoto because we cannot effectively exercise power over the relevant activities related to the mine, nor can we affect the returns of the mine through managerial involvement. As a result of the loss of control event, we deconsolidated the subsidiaries, and derecognized the assets, liabilities and non-controlling interest of Loulo-Gounkoto at their carrying amounts at the date when control was lost.
Upon deconsolidation, IFRS Accounting Standards require the retained interest in the former subsidiaries to be recognized at fair value. Barrick will account for the retained interest in Somilo and Gounkoto in accordance with IFRS 9. Fair value is the price that would be received to sell an asset in an orderly transaction between market participants. Barrick’s estimate of the initial fair value of the retained is $1.7 billion. This fair value was calculated using our life of mine plan with updates to reflect the situation as at June 30, 2025 inclusive of the adverse measures taken by the GoM against the subsidiaries. This included an increase in the weighted average cost of capital (“WACC”) from the 9% applied as at December 31, 2024 to 18% as at June 30, 2025. We have also lowered the Net Asset Value (“NAV”) multiple to 1.1 and used a long-term gold price of $2,000/oz. Finally, the fiscal terms were amended to be in line with
2023 Mining Code, primarily increased royalties and duties; and certain adjustments were made to reflect a period of disruption to the steady state operations. This fair value calculation includes a high level of uncertainty is subject to change based on further developments that may require an update of these assumptions. Under certain scenarios the fair value could be materially higher or lower. The calculation does not include any value for Barrick’s or its subsidiaries arbitration claims, which are now before the arbitration tribunal.
We performed a sensitivity analysis on the fair value calculation where we flexed the gold prices, WACC and NAV multiple, which are the most significant assumptions that impact the fair value calculations. We first assumed a +/- $100 per ounce change in our gold price assumptions, while holding all other assumptions constant. We then assumed a +/-1% change in our WACC, independent from the change in gold prices, while holding all other assumptions constant. Finally, we assumed a +/- 0.1 change in the NAV multiple, while holding all other assumptions constant. These sensitivities help to determine the theoretical change in fair value that would be recorded with these changes in gold prices, WACC and NAV multiple.
|
|
|
|
|
|
| Change in fair value based on: |
|
| Increase in gold price of $100/oz |
134 |
| Decrease in gold price of $100/oz |
(170) |
| Increase in WACC of 1% |
(67) |
| Decrease in WACC of 1% |
72 |
| Increase in NAV multiple of 0.1 |
155 |
| Decrease in NAV multiple of 0.1 |
(156) |
A loss on the change of control of $1,035 million, equal to the carrying value of the net assets and non-controlling interest of Loulo-Gounkoto at the date when control was lost, partially offset by the value of the retained investment in Loulo-Gounkoto, was recognized in Q2 2025. The details are summarized in the following table:
|
|
|
|
|
|
| Carrying value of net assets derecognized |
$(3,421) |
| Carrying value of non-controlling interest derecognized |
686 |
| Investment in Loulo-Gounkoto recognized |
1,700 |
| Loss of control |
$ |
(1,035) |
|
Refer to note 17 for further details of the legal matters related to this topic.
|
|
|
|
|
|
|
|
|
BARRICK SECOND QUARTER 2025 |
77 |
NOTES TO FINANCIAL STATEMENTS (UNAUDITED) |
17 n Contingencies
Certain conditions may exist as of the date the financial statements are issued that may result in a loss to the Company, but which will only be resolved when one or more future events occur or fail to occur. The impact of any resulting loss from such matters affecting these financial statements and noted below may be material.
Except as noted below, no material changes have occurred with respect to the matters disclosed in Note 35 “Contingencies” to the 2024 Annual Financial Statements, and no new contingencies have occurred that are material to the Company since the issuance of the 2024 Annual Financial Statements.
The description set out below should be read in conjunction with Note 35 “Contingencies” to the 2024 Annual Financial Statements.
Litigation and Claims Update
Pascua-Lama — Proposed Canadian Securities Class Actions
In the Quebec proceeding, Barrick filed its Statement of Defence on February 12, 2025. No trial date has been set as of this time. In the Ontario proceeding, a hearing on the Plaintiffs’ motion for class certification has been scheduled for January 2026.
Legacy Philippines Matters
On April 4, 2025, Barrick and the Provincial Government of Marinduque (the “PGM”) signed agreements to settle, without admission of liability by Barrick, all proceedings and claims related to alleged environmental issues associated with the Marcopper mine in the Province of Marinduque, Philippines. The settlement is subject to various conditions precedent, including the approval of the Court of Appeals of the Republic of the Philippines and the issuance of certain confirmations by the Department of Environment and Natural Resources, the Philippines agency in charge of mining and the environment. Once all conditions are satisfied, Barrick will pay a settlement amount of $100 million to the PGM over a period of three years. This amount was recorded as part of Other Expense in Q1 2025.
Loulo-Gounkoto Mining Conventions Dispute
On January 2, 2025, an interim attachment order was issued by the Senior Investigating Judges of the Pôle National Économique et Financier (“Pôle Économique”) against the existing gold stock on the site of the Loulo- Gounkoto mining complex, which was executed on January 11, 2025, when the gold was removed from the site to a custodial bank. On January 14, 2025, due to the restrictions imposed by the Government of Mali on gold shipments, the Company temporarily suspended operations at the Loulo- Gounkoto complex.
On April 11, 2025, Somilo and Gounkoto received a notice from the Malian Tax Administration stating that if certain outstanding taxes were not paid, the Administration would close the companies’ administrative office in Bamako. Somilo and Gounkoto responded to the Tax Administrator to explain that the companies are unable to make timely payment of those taxes due to the restrictions imposed by the Government of Mali on exporting gold. On April 15, 2025, the authorities closed the Bamako offices.
On April 17, 2025, Somilo and Gounkoto received a notice from the Government of Mali alleging that the companies’ decision to temporarily suspend operations at the Loulo- Gounkoto complex was prejudicial to the Government’s interest in the complex and further stating that unless the mines resumed operations by April 20, 2025, the Minister would seek to have a judicial administrator appointed. Somilo and Gounkoto responded to the Minister to clarify that they could only resume mining operations when the
restrictions imposed by the Government of Mali on exporting gold had been lifted.
On June 16, 2025, the Bamako Commercial Tribunal placed Somilo and Gounkoto under a temporary provisional administration and appointed a Provisional Administrator. On June 17 2025, Somilo and Gounkoto filed an appeal against this decision.
Following the appointment of the Provisional Administrator, on June 23, 2025, the authorities lifted the closure order over the Bamako offices. This was immediately followed by the Provisional Administrator taking over day-to-day management of the operations of the Loulo-Gounkoto complex.
The ICSID arbitration process initiated on December 18, 2024 is ongoing and the Tribunal is now fully constituted. On July 21, 2025, the Tribunal held its first session as well as a hearing on the request filed by Somilo and Gounkoto for provisional measures to prevent further escalation and to safeguard their rights under the Mining Conventions during the pendency of the arbitration. The Tribunal has not yet issued a decision on the provisional measures application.
Barrick remains committed to engage with the Government of Mali in parallel to resolve the dispute.
Abuse of Criminal Proceedings
On March 3, 2025, the Investigating Judge at the Pôle Économique denied a second application seeking the release of the four detained employees. The employees’ appeal of that decision was denied on July 22, 2025, and the employees remain imprisoned unjustifiably.
The Company continues to vigorously defend its rights, as well as those of its Malian subsidiaries and the affected employees, in connection with these proceedings.
North Mara — Ontario Litigation
On November 26, 2024, the court granted Barrick’s motion to dismiss both actions on the grounds that the Ontario Superior Court of Justice lacks jurisdiction and that Tanzania is a more appropriate forum in which to litigate this matter. On December 27, 2024, the plaintiffs’ appealed this decision to the Ontario Court of Appeal. The hearing of this appeal has been scheduled for November 27, 2025.
Pueblo Viejo - Amparo Actions
In May 2025, two constitutional actions were filed in an administrative court in the Dominican Republic against Pueblo Viejo Dominicana Jersey 2 Limited (“PV”), the joint venture company that operates the Pueblo Viejo mine, and the Dominican Ministry of Environment and Natural Resources. The actions, which are styled as “amparo” remedies, were brought by local individuals and environmental non-governmental organizations seeking to suspend construction of Pueblo Viejo’s new Naranjo tailings storage facility and revoke the underlying environmental license for such facility on the basis of alleged environmental and human rights concerns.
A hearing for one of the two amparo actions has been scheduled for September 2, 2025. The court has not yet scheduled a hearing for the other action.
The Company believes that there is no merit to these actions and intends to defend its position vigorously. No amounts have been recorded for any potential liability arising from these actions as the Company cannot reasonably predict the outcome.
|
|
|
|
|
|
|
|
|
BARRICK SECOND QUARTER 2025 |
78 |
NOTES TO FINANCIAL STATEMENTS (UNAUDITED) |