Shareholder Report
|
6 Months Ended |
|
May 31, 2025
USD ($)
Holding
|
|---|
| Shareholder Report [Line Items] |
|
| Document Type |
N-CSRS
|
| Amendment Flag |
false
|
| Registrant Name |
Zacks Trust
|
| Entity Central Index Key |
0001760588
|
| Entity Investment Company Type |
N-1A
|
| Document Period End Date |
May 31, 2025
|
| C000214795 |
|
| Shareholder Report [Line Items] |
|
| Fund Name |
Zacks Earnings Consistent Portfolio ETF
|
| Trading Symbol |
ZECP
|
| Security Exchange Name |
NYSEArca
|
| Shareholder Report Annual or Semi-Annual |
Semi-Annual Shareholder Report
|
| Additional Information Phone Number |
1-855-813-3507
|
| Expenses [Text Block] |
What were the Fund’s costs for the last six months?(based on a hypothetical $10,000 investment)Fund Name | Costs of a $10,000 investment | Costs paid as a percentage of a $10,000 investment |
|---|
Zacks Earnings Consistent Portfolio ETF | $27 | 0.55% |
|---|
|
| Expenses Paid, Amount |
$ 27
|
| Expense Ratio, Percent |
0.55%
|
| AssetsNet |
$ 232,796,808
|
| Holdings Count | Holding |
60
|
| Advisory Fees Paid, Amount |
$ 468,473
|
| InvestmentCompanyPortfolioTurnover |
29.00%
|
| Additional Fund Statistics [Text Block] |
Net Assets | $232,796,808 |
|---|
Number of Portfolio Holdings | 60 |
|---|
Advisory Fee (net of waivers) | $468,473 |
|---|
Portfolio Turnover | 29% |
|---|
|
| Holdings [Text Block] |
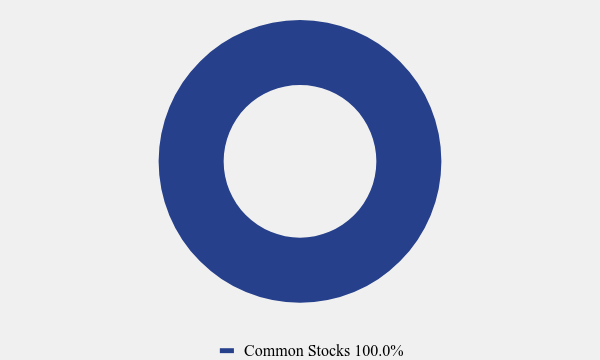
Asset Weighting (% of total investments)Value | Value |
|---|
Common Stocks | 100.0% |
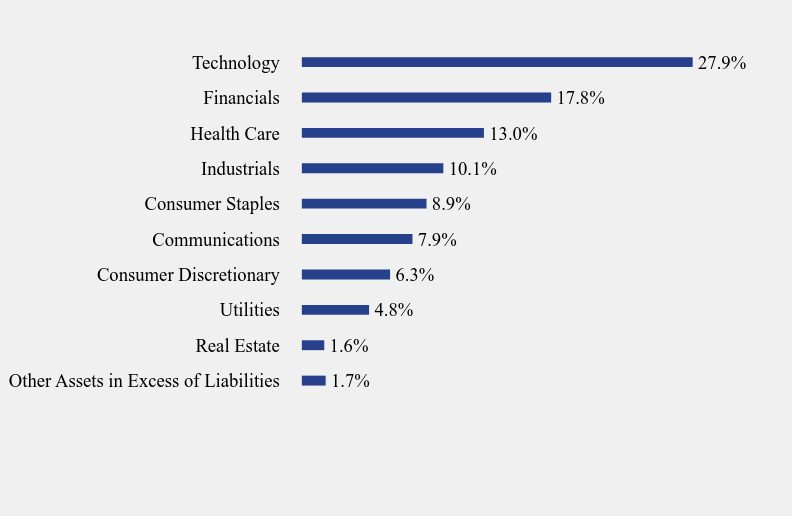
Sector Weighting (% of net assets)Value | Value |
|---|
Other Assets in Excess of Liabilities | 1.7% | Real Estate | 1.6% | Utilities | 4.8% | Consumer Discretionary | 6.3% | Communications | 7.9% | Consumer Staples | 8.9% | Industrials | 10.1% | Health Care | 13.0% | Financials | 17.8% | Technology | 27.9% |
|
| Largest Holdings [Text Block] |
Top 10 Holdings (% of net assets)Holding Name | % of Net Assets |
|---|
Microsoft Corporation | 6.4% |
|---|
Apple, Inc. | 5.6% |
|---|
Alphabet, Inc., Class A | 4.6% |
|---|
Netflix, Inc. | 3.3% |
|---|
JPMorgan Chase & Company | 3.1% |
|---|
Walmart, Inc. | 3.0% |
|---|
Procter & Gamble Company (The) | 2.7% |
|---|
American Express Company | 2.6% |
|---|
Caterpillar, Inc. | 2.4% |
|---|
Home Depot, Inc. (The) | 2.3% |
|---|
|
| Material Fund Change [Text Block] |
No material changes occurred during the period ended May 31, 2025. |
| C000253655 |
|
| Shareholder Report [Line Items] |
|
| Fund Name |
Zacks Focus Growth ETF
|
| Trading Symbol |
GROZ
|
| Security Exchange Name |
NYSEArca
|
| Shareholder Report Annual or Semi-Annual |
Semi-Annual Shareholder Report
|
| Additional Information Phone Number |
1-855-813-3507
|
| Expenses Paid, Amount |
$ 27
|
| Expense Ratio, Percent |
0.55%
|
| AssetsNet |
$ 25,364,911
|
| Holdings Count | Holding |
43
|
| Advisory Fees Paid, Amount |
$ 127,815
|
| InvestmentCompanyPortfolioTurnover |
40.00%
|
| C000245117 |
|
| Shareholder Report [Line Items] |
|
| Fund Name |
Zacks Small/Mid Cap ETF
|
| Trading Symbol |
SMIZ
|
| Security Exchange Name |
NYSEArca
|
| Annual or Semi-Annual Statement [Text Block] |
This semi-annual shareholder report contains important information about Zacks Small/Mid Cap ETF for the period of December 1, 2024 to May 31, 2025.
|
| Shareholder Report Annual or Semi-Annual |
Semi-Annual Shareholder Report
|
| Additional Information [Text Block] |
You can find additional information about the Fund at https://zacksetfs.com/resources.php. You can also request this information by contacting us at 1-855-813-3507.
|
| Additional Information Phone Number |
1-855-813-3507
|
| Additional Information Website |
https://zacksetfs.com/resources.php
|
| Expenses [Text Block] |
What were the Fund’s costs for the last six months?(based on a hypothetical $10,000 investment)Fund Name | Costs of a $10,000 investment | Costs paid as a percentage of a $10,000 investment |
|---|
Zacks Small/Mid Cap ETF | $26 | 0.55% |
|---|
|
| Expenses Paid, Amount |
$ 26
|
| Expense Ratio, Percent |
0.55%
|
| AssetsNet |
$ 122,645,241
|
| Holdings Count | Holding |
199
|
| Advisory Fees Paid, Amount |
$ 202,403
|
| InvestmentCompanyPortfolioTurnover |
102.00%
|
| Additional Fund Statistics [Text Block] |
Net Assets | $122,645,241 |
|---|
Number of Portfolio Holdings | 199 |
|---|
Advisory Fee (net of waivers) | $202,403 |
|---|
Portfolio Turnover | 102% |
|---|
|
| Holdings [Text Block] |
Asset Weighting (% of total investments)Value | Value |
|---|
Common Stocks | 100.0% |
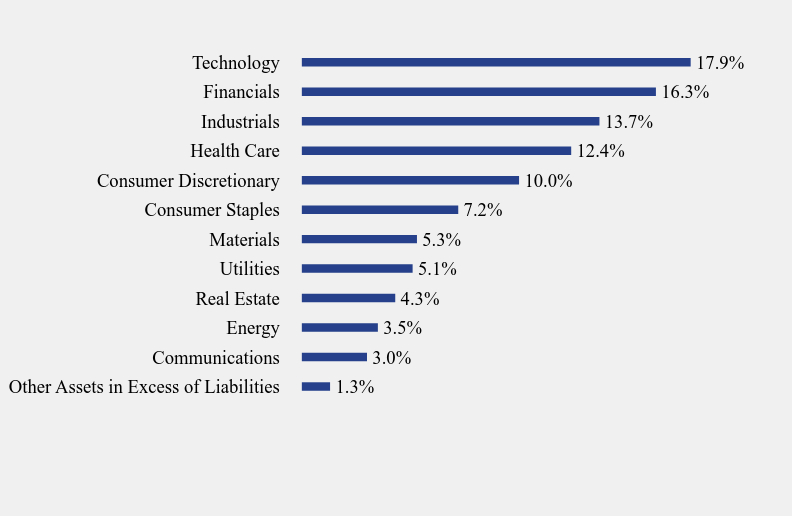
Sector Weighting (% of net assets)Value | Value |
|---|
Other Assets in Excess of Liabilities | 1.3% | Communications | 3.0% | Energy | 3.5% | Real Estate | 4.3% | Utilities | 5.1% | Materials | 5.3% | Consumer Staples | 7.2% | Consumer Discretionary | 10.0% | Health Care | 12.4% | Industrials | 13.7% | Financials | 16.3% | Technology | 17.9% |
|
| Largest Holdings [Text Block] |
Top 10 Holdings (% of net assets)Holding Name | % of Net Assets |
|---|
EMCOR Group, Inc. | 1.7% |
|---|
Stride, Inc. | 1.1% |
|---|
McKesson Corporation | 1.1% |
|---|
Onity Group, Inc. | 1.0% |
|---|
Amphenol Corporation, Class A | 1.1% |
|---|
Insulet Corporation | 1.0% |
|---|
Badger Meter, Inc. | 1.0% |
|---|
National Fuel Gas Company | 1.0% |
|---|
Northern Trust Corporation | 1.0% |
|---|
Premier, Inc., Class A | 1.0% |
|---|
|
| Material Fund Change [Text Block] |
No material changes occurred during the period ended May 31, 2025. |