Shareholder Report
|
12 Months Ended |
|
May 31, 2025
USD ($)
Holding
|
|---|
| Shareholder Report [Line Items] |
|
| Document Type |
N-CSR/A
|
| Amendment Flag |
true
|
| Amendment Description |
The Registrant is filing this amendment to its Form N-CSR for the fiscal year ended May 31, 20254, originally filed with the Securities and Exchange Commission on August 8, 2025 (Accession Number 0001580642-24-003419). The purpose of this amendment is to remove “Unaudited” from page 120 of the Annual Financial Statements and Additional Information in the Notes Financial Statements that inadvertently included in the original filing. Except as set forth above, this amendment does not amend, update or change any other items or disclosures found in the original Form N-CSR filing.
|
| Registrant Name |
EXCHANGE PLACE ADVISORS TRUST
|
| Entity Central Index Key |
0001750821
|
| Entity Investment Company Type |
N-1A
|
| Document Period End Date |
May 31, 2025
|
| C000258541 |
|
| Shareholder Report [Line Items] |
|
| Fund Name |
North Square Small Cap Value Fund
|
| Class Name |
Class I
|
| Trading Symbol |
DRISX
|
| Shareholder Report Annual or Semi-Annual |
Annual Shareholder Report
|
| Additional Information Phone Number |
1-855-551-5521
|
| Additional Information Website |
https://northsquareinvest.com/fund-reports-holdings-2/
|
| Expenses [Text Block] |
What were the Fund’s costs for the last year?(based on a hypothetical $10,000 investment) Class Name | Costs of a $10,000 investment | Costs paid as a percentage of a $10,000 investment |
|---|
Class I | $59Footnote Reference* | 1.05% |
|---|
| Footnote | Description | Footnote* | The reporting period is less than a full annual reporting period. Expenses paid for a full annual reporting period would be higher. |
|
| Expenses Paid, Amount |
$ 59
|
| Expense Ratio, Percent |
1.05%
|
| Performance Past Does Not Indicate Future [Text] |
The Fund's past performance is not a good predictor of how the Fund will perform in the future.
|
| No Deduction of Taxes [Text Block] |
The graph and table do not reflect the deduction of taxes that a shareholder would pay on Fund distributions or redemption of Fund shares.
|
| AssetsNet |
$ 194,516,865
|
| Holdings Count | Holding |
77
|
| Advisory Fees Paid, Amount |
$ 1,367,040
|
| InvestmentCompanyPortfolioTurnover |
46.00%
|
| Additional Fund Statistics [Text Block] |
- Net Assets$194,516,865
- Number of Portfolio Holdings77
- Advisory Fee $1,367,040
- Portfolio Turnover46%
|
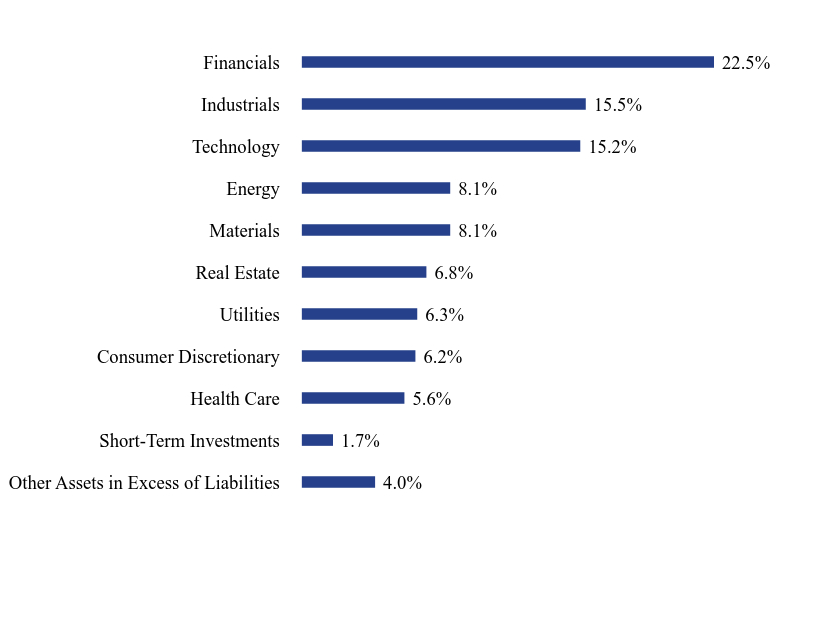
| Holdings [Text Block] |
Sector Weighting (% of net assets)Value | Value |
|---|
Other Assets in Excess of Liabilities | 4.0% | Short-Term Investments | 1.7% | Health Care | 5.6% | Consumer Discretionary | 6.2% | Utilities | 6.3% | Real Estate | 6.8% | Materials | 8.1% | Energy | 8.1% | Technology | 15.2% | Industrials | 15.5% | Financials | 22.5% |
Top 10 Holdings (% of net assets)Holding Name | % of Net Assets |
|---|
Hancock Whitney Corp. | 2.9% |
|---|
International Bancshares Corp. | 2.5% |
|---|
Cousins Properties, Inc. | 2.4% |
|---|
Pathward Financial Group, Inc. | 2.4% |
|---|
StoneX Group, Inc. | 2.3% |
|---|
OFG Bancorp | 2.2% |
|---|
Whitecap Resources, Inc. | 2.0% |
|---|
Cathay General Bancorp | 1.9% |
|---|
Penguin Solutions, Inc. | 1.8% |
|---|
First American Government Obligations Fund, Class X | 1.7% |
|---|
|
| C000258542 |
|
| Shareholder Report [Line Items] |
|
| Fund Name |
North Square Small Cap Value Fund
|
| Class Name |
Investor Class
|
| Trading Symbol |
DRSVX
|
| Shareholder Report Annual or Semi-Annual |
Annual Shareholder Report
|
| Additional Information Phone Number |
1-855-551-5521
|
| Additional Information Website |
https://northsquareinvest.com/fund-reports-holdings-2/
|
| Expenses [Text Block] |
What were the Fund’s costs for the last year?(based on a hypothetical $10,000 investment) Class Name | Costs of a $10,000 investment | Costs paid as a percentage of a $10,000 investment |
|---|
Investor Class | $73Footnote Reference* | 1.30% |
|---|
| Footnote | Description | Footnote* | The reporting period is less than a full annual reporting period. Expenses paid for a full annual reporting period would be higher. |
|
| Expenses Paid, Amount |
$ 73
|
| Expense Ratio, Percent |
1.30%
|
| Performance Past Does Not Indicate Future [Text] |
The Fund's past performance is not a good predictor of how the Fund will perform in the future.
|
| No Deduction of Taxes [Text Block] |
The graph and table do not reflect the deduction of taxes that a shareholder would pay on Fund distributions or redemption of Fund shares.
|
| AssetsNet |
$ 194,516,865
|
| Holdings Count | Holding |
77
|
| Advisory Fees Paid, Amount |
$ 1,367,040
|
| InvestmentCompanyPortfolioTurnover |
46.00%
|
| Additional Fund Statistics [Text Block] |
- Net Assets$194,516,865
- Number of Portfolio Holdings77
- Advisory Fee $1,367,040
- Portfolio Turnover46%
|
| Holdings [Text Block] |
Sector Weighting (% of net assets)Value | Value |
|---|
Other Assets in Excess of Liabilities | 4.0% | Short-Term Investments | 1.7% | Health Care | 5.6% | Consumer Discretionary | 6.2% | Utilities | 6.3% | Real Estate | 6.8% | Materials | 8.1% | Energy | 8.1% | Technology | 15.2% | Industrials | 15.5% | Financials | 22.5% |
Top 10 Holdings (% of net assets)Holding Name | % of Net Assets |
|---|
Hancock Whitney Corp. | 2.9% |
|---|
International Bancshares Corp. | 2.5% |
|---|
Cousins Properties, Inc. | 2.4% |
|---|
Pathward Financial Group, Inc. | 2.4% |
|---|
StoneX Group, Inc. | 2.3% |
|---|
OFG Bancorp | 2.2% |
|---|
Whitecap Resources, Inc. | 2.0% |
|---|
Cathay General Bancorp | 1.9% |
|---|
Penguin Solutions, Inc. | 1.8% |
|---|
First American Government Obligations Fund, Class X | 1.7% |
|---|
|
| C000222264 |
|
| Shareholder Report [Line Items] |
|
| Fund Name |
North Square Altrinsic International Equity Fund
|
| Class Name |
Class I
|
| Trading Symbol |
NSIVX
|
| Annual or Semi-Annual Statement [Text Block] |
This annual shareholder report contains important information about North Square Altrinsic International Equity Fund (the "Fund") for the period of November 1, 2024, to May 31, 2025.
|
| Shareholder Report Annual or Semi-Annual |
Annual Shareholder Report
|
| Additional Information [Text Block] |
You can find additional information about the Fund at https://northsquareinvest.com/fund-reports-holdings-2/. You can also request this information by contacting us at 1-855-551-5521.
|
| Additional Information Phone Number |
1-855-551-5521
|
| Additional Information Website |
https://northsquareinvest.com/fund-reports-holdings-2/
|
| Expenses [Text Block] |
What were the Fund’s costs for the last year?(based on a hypothetical $10,000 investment) Class Name | Costs of a $10,000 investment | Costs paid as a percentage of a $10,000 investment |
|---|
Class I | $60Footnote Reference* | 0.98% |
|---|
| Footnote | Description | Footnote* | The reporting period is less than a full annual reporting period. Expenses paid for a full annual reporting period would be higher. |
|
| Expenses Paid, Amount |
$ 60
|
| Expense Ratio, Percent |
0.98%
|
| Performance Past Does Not Indicate Future [Text] |
The Fund's past performance is not a good predictor of how the Fund will perform in the future.
|
| Performance Inception Date |
Dec. 04, 2020
|
| No Deduction of Taxes [Text Block] |
The graph and table do not reflect the deduction of taxes that a shareholder would pay on fund distributions or redemption of fund shares.
|
| AssetsNet |
$ 107,811,561
|
| Holdings Count | Holding |
67
|
| Advisory Fees Paid, Amount |
$ 427,133
|
| InvestmentCompanyPortfolioTurnover |
18.00%
|
| Additional Fund Statistics [Text Block] |
Net Assets | $107,811,561 |
|---|
Number of Portfolio Holdings | 67 |
|---|
Advisory Fee (net of waivers) | $427,133 |
|---|
Portfolio Turnover | 18% |
|---|
|
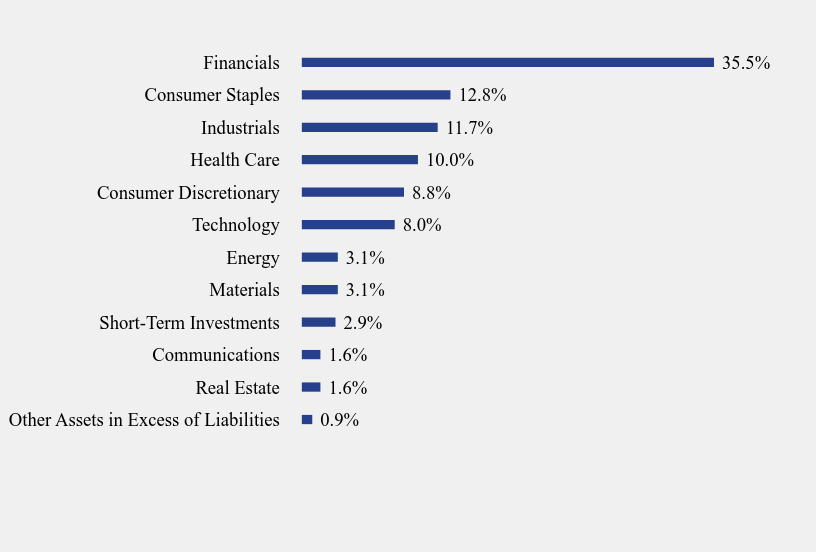
| Holdings [Text Block] |
Sector Weighting (% of net assets)Value | Value |
|---|
Other Assets in Excess of Liabilities | 0.9% | Real Estate | 1.6% | Communications | 1.6% | Short-Term Investments | 2.9% | Materials | 3.1% | Energy | 3.1% | Technology | 8.0% | Consumer Discretionary | 8.8% | Health Care | 10.0% | Industrials | 11.7% | Consumer Staples | 12.8% | Financials | 35.5% |
Top 10 Holdings (% of net assets)Holding Name | % of Net Assets |
|---|
Chubb Ltd. | 3.6% |
|---|
Everest Re Group, Ltd. | 3.1% |
|---|
KB Financial Group, Inc. | 2.4% |
|---|
Aon PLC - Class A | 2.4% |
|---|
Sony Group Corp. | 2.4% |
|---|
Bureau Veritas SA | 2.3% |
|---|
Heineken N.V. | 2.3% |
|---|
GSK PLC | 2.2% |
|---|
Sanofi | 2.2% |
|---|
Suzuki Motor Corp. | 2.2% |
|---|
|
| C000224843 |
|
| Shareholder Report [Line Items] |
|
| Fund Name |
North Square Core Plus Bond Fund
|
| Class Name |
Class I
|
| Trading Symbol |
STTIX
|
| Shareholder Report Annual or Semi-Annual |
Annual Shareholder Report
|
| Additional Information Phone Number |
1-855-551-5521
|
| Additional Information Website |
https://northsquareinvest.com/fund-reports-holdings-2/
|
| Expenses Paid, Amount |
$ 94
|
| Expense Ratio, Percent |
0.91%
|
| Performance Past Does Not Indicate Future [Text] |
The Fund's past performance is not a good predictor of how the Fund will perform in the future.
|
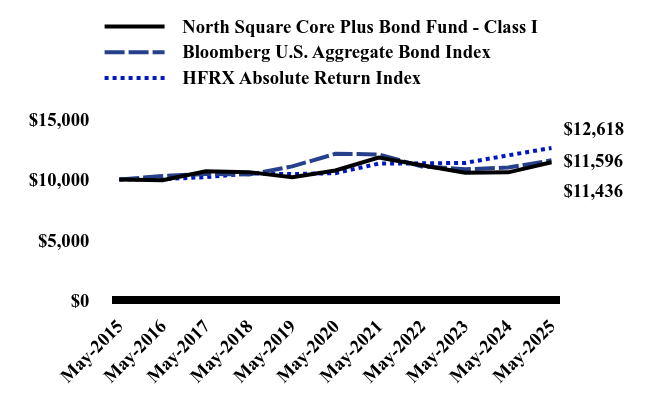
| Line Graph [Table Text Block] |
| North Square Core Plus Bond Fund - Class I | Bloomberg U.S. Aggregate Bond Index | HFRX Absolute Return Index |
|---|
May-2015 | $10,000 | $10,000 | $10,000 |
|---|
May-2016 | $9,946 | $10,299 | $10,039 |
|---|
May-2017 | $10,694 | $10,462 | $10,205 |
|---|
May-2018 | $10,617 | $10,423 | $10,505 |
|---|
May-2019 | $10,203 | $11,090 | $10,459 |
|---|
May-2020 | $10,753 | $12,134 | $10,533 |
|---|
May-2021 | $11,826 | $12,085 | $11,320 |
|---|
May-2022 | $11,189 | $11,091 | $11,345 |
|---|
May-2023 | $10,567 | $10,854 | $11,379 |
|---|
May-2024 | $10,601 | $10,995 | $12,012 |
|---|
May-2025 | $11,436 | $11,596 | $12,618 |
|---|
|
| Average Annual Return [Table Text Block] |
| 1 Year | 5 Years | 10 Years |
|---|
North Square Core Plus Bond Fund - Class I | 7.88% | 1.24% | 1.35% |
|---|
Bloomberg U.S. Aggregate Bond Index | 5.46% | -0.90% | 1.49% |
|---|
HFRX Absolute Return Index | 5.05% | 3.68% | 2.35% |
|---|
|
| No Deduction of Taxes [Text Block] |
The graph and table do not reflect the deduction of taxes that a shareholder would pay on Fund distributions or redemption of Fund shares.
|
| AssetsNet |
$ 23,373,464
|
| Holdings Count | Holding |
256
|
| Advisory Fees Paid, Amount |
$ 0
|
| InvestmentCompanyPortfolioTurnover |
224.00%
|
| Additional Fund Statistics [Text Block] |
- Net Assets$23,373,464
- Number of Portfolio Holdings256
- Advisory Fee (net of waivers)$0
- Portfolio Turnover224%
|
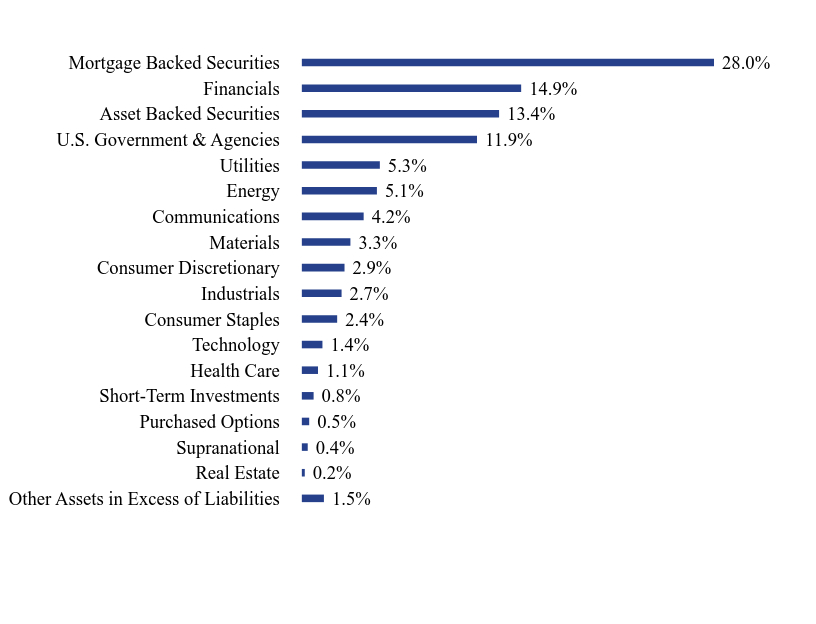
| Holdings [Text Block] |
Composition of Net Assets (% of net assets)Value | Value |
|---|
Other Assets in Excess of Liabilities | 1.5% | Real Estate | 0.2% | Supranational | 0.4% | Purchased Options | 0.5% | Short-Term Investments | 0.8% | Health Care | 1.1% | Technology | 1.4% | Consumer Staples | 2.4% | Industrials | 2.7% | Consumer Discretionary | 2.9% | Materials | 3.3% | Communications | 4.2% | Energy | 5.1% | Utilities | 5.3% | U.S. Government & Agencies | 11.9% | Asset Backed Securities | 13.4% | Financials | 14.9% | Mortgage Backed Securities | 28.0% |
Top 10 Holdings (% of net assets)Holding Name | % of Net Assets |
|---|
Federal National Mortgage Association | 1.7% |
|---|
United States Treasury Note/Bond | 1.6% |
|---|
United States Treasury Note/Bond | 1.6% |
|---|
United States Treasury Note/Bond | 1.5% |
|---|
United States Treasury Note/Bond | 1.4% |
|---|
United States Treasury Note/Bond | 1.3% |
|---|
Ginnie Mae II Pool | 1.3% |
|---|
United States Treasury Note/Bond | 1.2% |
|---|
Fannie Mae Pool | 1.1% |
|---|
United States Treasury Note/Bond | 1.0% |
|---|
|
| Material Fund Change [Text Block] |
This is a summary of certain changes to the Fund since June 1, 2024. For more complete information you may review the Fund’s prospectus dated September 27, 2024, which is available upon request at 1-855-551-5521 or on the Fund's website at https://northsquareinvest.com/fund-reports-holdings-2/ Effective September 27, 2024, the Fund changed its name from the North Square Trilogy Alternative Return Fund to the North Square Core Plus Bond Fund. The Fund also changed: (i) its investment objective to seek high current income and long-term capital appreciation; (ii) its principal investment strategies and principal risks to reflect the Fund's principal investments in fixed income investments; and (iii) its sub-advisers to CSM Advisors, LLC and Red Cedar Investment Management, LLC. In addition, effective September 27, 2024, the Fund converted Class A and Class C shares into Class I shares. |
| C000205678 |
|
| Shareholder Report [Line Items] |
|
| Fund Name |
North Square Dynamic Small Cap Fund
|
| Class Name |
Class A
|
| Trading Symbol |
ORSAX
|
| Annual or Semi-Annual Statement [Text Block] |
This annual shareholder report contains important information about North Square Dynamic Small Cap Fund (the "Fund") for the period of June 1, 2024, to May 31, 2025.
|
| Shareholder Report Annual or Semi-Annual |
Annual Shareholder Report
|
| Additional Information [Text Block] |
You can find additional information about the Fund at https://northsquareinvest.com/fund-reports-holdings-2/. You can also request this information by contacting us at 1-855-551-5521.
|
| Additional Information Phone Number |
1-855-551-5521
|
| Additional Information Website |
https://northsquareinvest.com/fund-reports-holdings-2/
|
| Expenses [Text Block] |
What were the Fund’s costs for the last year?(based on a hypothetical $10,000 investment) Class Name | Costs of a $10,000 investment | Costs paid as a percentage of a $10,000 investment |
|---|
Class A | $124 | 1.24% |
|---|
|
| Expenses Paid, Amount |
$ 124
|
| Expense Ratio, Percent |
1.24%
|
| Performance Past Does Not Indicate Future [Text] |
The Fund's past performance is not a good predictor of how the Fund will perform in the future.
|
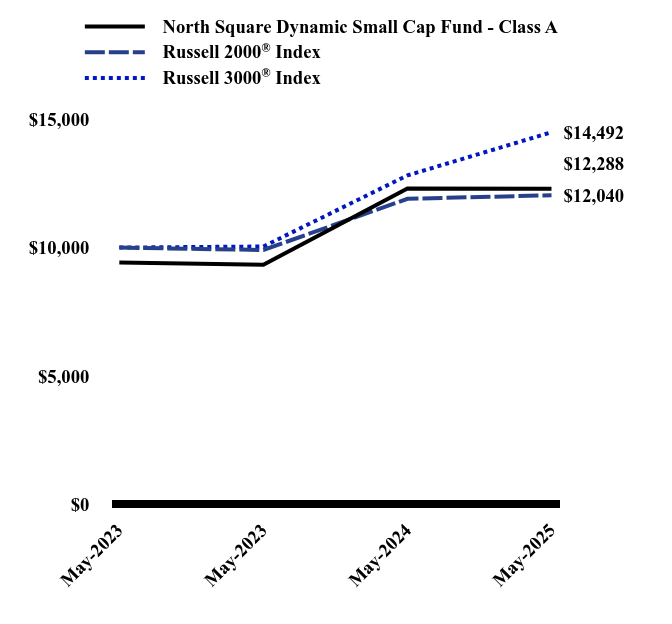
| Line Graph [Table Text Block] |
| North Square Dynamic Small Cap Fund - Class A | Russell 2000® Index | Russell 3000® Index |
|---|
May-2023 | $9,423 | $10,000 | $10,000 |
|---|
May-2023 | $9,331 | $9,906 | $10,042 |
|---|
May-2024 | $12,305 | $11,899 | $12,811 |
|---|
May-2025 | $12,288 | $12,040 | $14,492 |
|---|
|
| Average Annual Return [Table Text Block] |
| 1 Year | Since Inception (May 1, 2023) |
|---|
North Square Dynamic Small Cap Fund - Class A | | |
|---|
Without Load | -0.14% | 13.60% |
|---|
With Load* | -5.90% | 10.40% |
|---|
Russell 2000® Index | 1.19% | 9.33% |
|---|
Russell 3000® Index | 13.12% | 19.50% |
|---|
|
| Performance Inception Date |
May 01, 2023
|
| No Deduction of Taxes [Text Block] |
The graph and table do not reflect the deduction of taxes that a shareholder would pay on fund distributions or redemption of fund shares.
|
| AssetsNet |
$ 486,384,942
|
| Holdings Count | Holding |
243
|
| Advisory Fees Paid, Amount |
$ 2,871,917
|
| InvestmentCompanyPortfolioTurnover |
168.00%
|
| Additional Fund Statistics [Text Block] |
- Net Assets$486,384,942
- Number of Portfolio Holdings243
- Advisory Fee (net of waivers)$2,871,917
- Portfolio Turnover168%
|
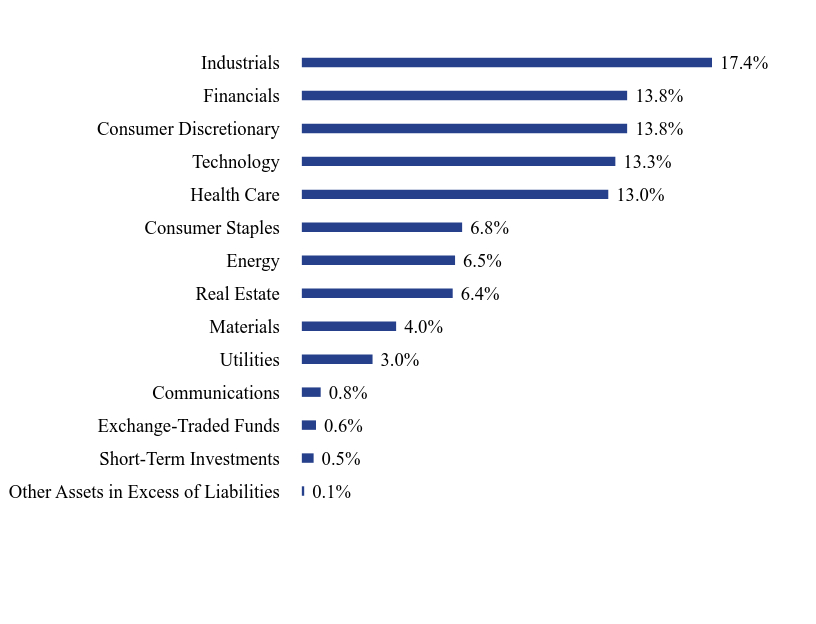
| Holdings [Text Block] |
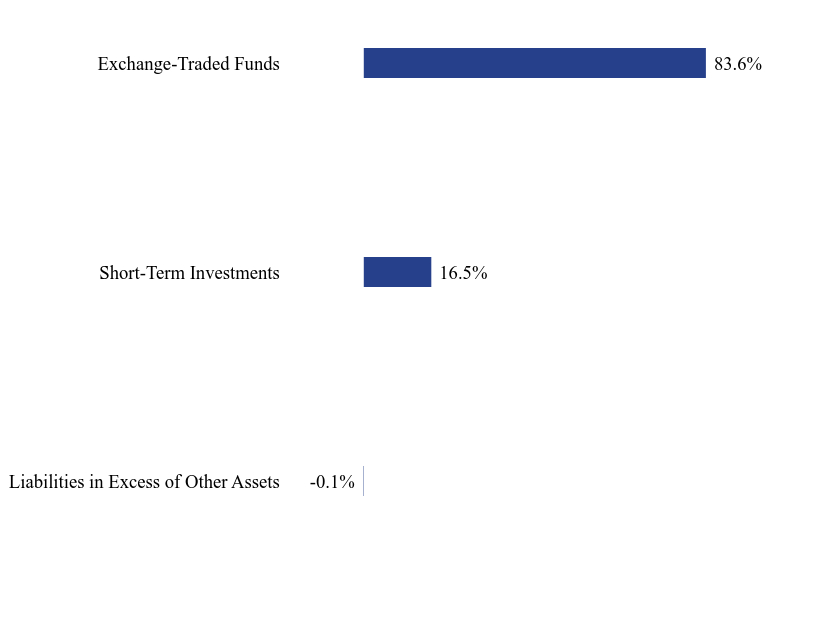
Composition of Net Assets (% of net assets)Value | Value |
|---|
Other Assets in Excess of Liabilities | 0.1% | Short-Term Investments | 0.5% | Exchange-Traded Funds | 0.6% | Communications | 0.8% | Utilities | 3.0% | Materials | 4.0% | Real Estate | 6.4% | Energy | 6.5% | Consumer Staples | 6.8% | Health Care | 13.0% | Technology | 13.3% | Consumer Discretionary | 13.8% | Financials | 13.8% | Industrials | 17.4% |
Top 10 Holdings (% of net assets)Holding Name | % of Net Assets |
|---|
Itron, Inc. | 1.7% |
|---|
Mueller Industries, Inc. | 1.6% |
|---|
Carpenter Technology Corp. | 1.6% |
|---|
Adtalem Global Education, Inc. | 1.4% |
|---|
Primoris Services Corp. | 1.3% |
|---|
Sprouts Farmers Market, Inc. | 1.3% |
|---|
Axos Financial, Inc. | 1.2% |
|---|
NEXTracker, Inc., Class A | 1.2% |
|---|
Portland General Electric Co. | 1.2% |
|---|
SkyWest, Inc. | 1.2% |
|---|
|
| Material Fund Change [Text Block] |
No material changes occured since June 1, 2024. |
| C000205677 |
|
| Shareholder Report [Line Items] |
|
| Fund Name |
North Square Dynamic Small Cap Fund
|
| Class Name |
Class I
|
| Trading Symbol |
ORSIX
|
| Annual or Semi-Annual Statement [Text Block] |
This annual shareholder report contains important information about North Square Dynamic Small Cap Fund (the "Fund") for the period of June 1, 2024, to May 31, 2025.
|
| Shareholder Report Annual or Semi-Annual |
Annual Shareholder Report
|
| Additional Information [Text Block] |
You can find additional information about the Fund at https://northsquareinvest.com/fund-reports-holdings-2/. You can also request this information by contacting us at 1-855-551-5521.
|
| Additional Information Phone Number |
1-855-551-5521
|
| Additional Information Website |
https://northsquareinvest.com/fund-reports-holdings-2/
|
| Expenses [Text Block] |
What were the Fund’s costs for the last year?(based on a hypothetical $10,000 investment) Class Name | Costs of a $10,000 investment | Costs paid as a percentage of a $10,000 investment |
|---|
Class I | $99 | 0.99% |
|---|
|
| Expenses Paid, Amount |
$ 99
|
| Expense Ratio, Percent |
0.99%
|
| Performance Past Does Not Indicate Future [Text] |
The Fund's past performance is not a good predictor of how the Fund will perform in the future.
|
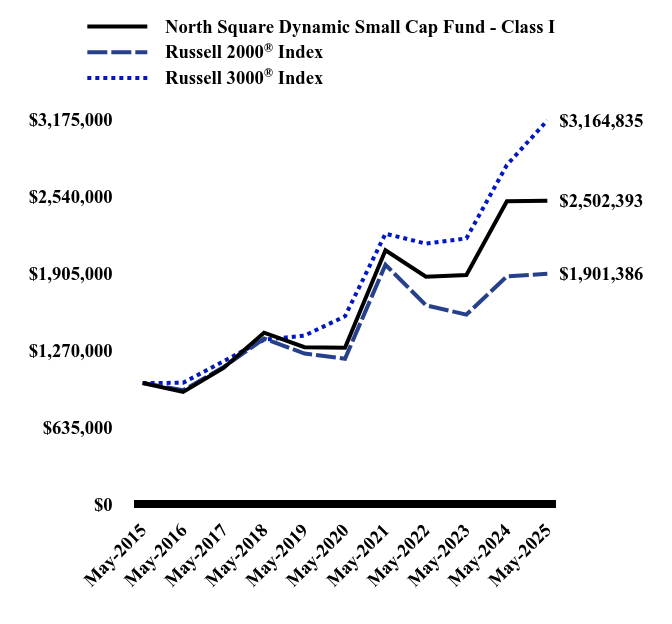
| Line Graph [Table Text Block] |
| North Square Dynamic Small Cap Fund - Class I | Russell 2000® Index | Russell 3000® Index |
|---|
May-2015 | $999,987 | $1,000,000 | $1,000,000 |
|---|
May-2016 | $927,240 | $940,273 | $1,002,233 |
|---|
May-2017 | $1,124,630 | $1,131,726 | $1,179,539 |
|---|
May-2018 | $1,415,166 | $1,366,724 | $1,357,195 |
|---|
May-2019 | $1,296,042 | $1,243,104 | $1,391,074 |
|---|
May-2020 | $1,290,320 | $1,200,356 | $1,550,539 |
|---|
May-2021 | $2,094,937 | $1,975,361 | $2,231,406 |
|---|
May-2022 | $1,876,861 | $1,641,226 | $2,149,203 |
|---|
May-2023 | $1,891,075 | $1,564,427 | $2,192,933 |
|---|
May-2024 | $2,498,822 | $1,879,112 | $2,797,809 |
|---|
May-2025 | $2,502,393 | $1,901,386 | $3,164,835 |
|---|
|
| Average Annual Return [Table Text Block] |
| 1 Year | 5 Years | 10 Years |
|---|
North Square Dynamic Small Cap Fund - Class I | 0.14% | 14.16% | 9.60% |
|---|
Russell 2000® Index | 1.19% | 9.64% | 6.64% |
|---|
Russell 3000® Index | 13.12% | 15.34% | 12.21% |
|---|
|
| No Deduction of Taxes [Text Block] |
The graph and table do not reflect the deduction of taxes that a shareholder would pay on fund distributions or redemption of fund shares.
|
| AssetsNet |
$ 486,384,942
|
| Holdings Count | Holding |
243
|
| Advisory Fees Paid, Amount |
$ 2,871,917
|
| InvestmentCompanyPortfolioTurnover |
168.00%
|
| Additional Fund Statistics [Text Block] |
- Net Assets$486,384,942
- Number of Portfolio Holdings243
- Advisory Fee (net of waivers)$2,871,917
- Portfolio Turnover168%
|
| Holdings [Text Block] |
Composition of Net Assets (% of net assets)Value | Value |
|---|
Other Assets in Excess of Liabilities | 0.1% | Short-Term Investments | 0.5% | Exchange-Traded Funds | 0.6% | Communications | 0.8% | Utilities | 3.0% | Materials | 4.0% | Real Estate | 6.4% | Energy | 6.5% | Consumer Staples | 6.8% | Health Care | 13.0% | Technology | 13.3% | Consumer Discretionary | 13.8% | Financials | 13.8% | Industrials | 17.4% |
Top 10 Holdings (% of net assets)Holding Name | % of Net Assets |
|---|
Itron, Inc. | 1.7% |
|---|
Mueller Industries, Inc. | 1.6% |
|---|
Carpenter Technology Corp. | 1.6% |
|---|
Adtalem Global Education, Inc. | 1.4% |
|---|
Primoris Services Corp. | 1.3% |
|---|
Sprouts Farmers Market, Inc. | 1.3% |
|---|
Axos Financial, Inc. | 1.2% |
|---|
NEXTracker, Inc., Class A | 1.2% |
|---|
Portland General Electric Co. | 1.2% |
|---|
SkyWest, Inc. | 1.2% |
|---|
|
| Material Fund Change [Text Block] |
No material changes occured since June 1, 2024. |
| C000250358 |
|
| Shareholder Report [Line Items] |
|
| Fund Name |
North Square Kennedy MicroCap Fund
|
| Class Name |
Class I
|
| Trading Symbol |
NKMCX
|
| Annual or Semi-Annual Statement [Text Block] |
This annual shareholder report contains important information about North Square Kennedy MicroCap Fund (the "Fund") for the period of June 10, 2024, to May 31, 2025.
|
| Shareholder Report Annual or Semi-Annual |
Annual Shareholder Report
|
| Additional Information [Text Block] |
You can find additional information about the Fund at https://northsquareinvest.com/fund-reports-holdings-2/. You can also request this information by contacting us at 1-855-551-5521.
|
| Additional Information Phone Number |
1-855-551-5521
|
| Additional Information Website |
https://northsquareinvest.com/fund-reports-holdings-2/
|
| Expenses Paid, Amount |
$ 158
|
| Expense Ratio, Percent |
1.47%
|
| Performance Past Does Not Indicate Future [Text] |
The Fund's past performance is not a good predictor of how the Fund will perform in the future.
|
| Performance Inception Date |
Jun. 10, 2024
|
| No Deduction of Taxes [Text Block] |
The graph and table do not reflect the deduction of taxes that a shareholder would pay on fund distributions or redemption of fund shares.
|
| AssetsNet |
$ 21,779,995
|
| Holdings Count | Holding |
132
|
| Advisory Fees Paid, Amount |
$ 66,181
|
| InvestmentCompanyPortfolioTurnover |
67.00%
|
| C000222265 |
|
| Shareholder Report [Line Items] |
|
| Fund Name |
North Square McKee Bond Fund
|
| Class Name |
Class I
|
| Trading Symbol |
NMKYX
|
| Shareholder Report Annual or Semi-Annual |
Annual Shareholder Report
|
| Additional Information Phone Number |
1-855-551-5521
|
| Additional Information Website |
https://northsquareinvest.com/fund-reports-holdings-2/
|
| Expenses [Text Block] |
What were the Fund’s costs for the last year?(based on a hypothetical $10,000 investment) Class Name | Costs of a $10,000 investment | Costs paid as a percentage of a $10,000 investment |
|---|
Class I | $28Footnote Reference* | 0.47% |
|---|
| Footnote | Description | Footnote* | The reporting period is less than a full annual reporting period. Expenses paid for a full annual reporting period would be higher. |
|
| Expenses Paid, Amount |
$ 28
|
| Expense Ratio, Percent |
0.47%
|
| Factors Affecting Performance [Text Block] |
How did the Fund perform during the reporting period? The North Square McKee Bond Fund for the seven-month period ending May 31, 2025, underperformed the Bloomberg US Aggregate Bond Index's return. Consistent with our investment philosophy and long-term results, excess returns mainly came from active security selection, though yield curve positioning and sector allocation detracted from performance. Leading contributors to performance included security selection in the corporate sector, adding 5 bps. Incremental value was also gained from managing the agency sector, contributing an additional 7 bps. Mortgage selection produced 4 bps of return. The 9% overweight in the mortgage sector cost the portfolio 4 bps, while the overweight in agency debentures was a 3 bps drag. The combined performance impact from duration and yield curve management totaled -11 bps. The April 2nd tariff announcement drove market volatility significantly higher, penalizing the performance of all spread sectors versus equal maturity Treasuries. Investment-grade corporate yield spreads continued to recover from the tariff-induced under performance versus Treasuries, leaving agency debenture and mortgage securities as our only active overweight as of May 31st. The inflation rate has yet to show any material impact from changes in trade/tariff policy, though we expect to see increasing upward pressure in the coming months. Given the pace of negotiations and questions surrounding the consumer’s share of price hikes, inflation should remain above the Fed’s target into next year. |
| Performance Past Does Not Indicate Future [Text] |
The Fund's past performance is not a good predictor of how the Fund will perform in the future.
|
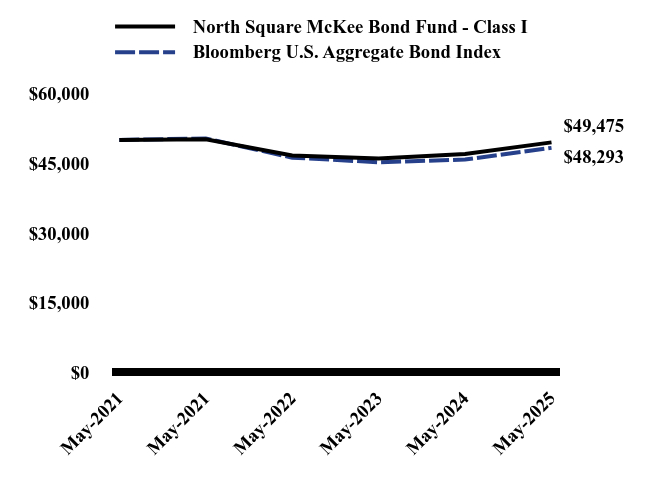
| Line Graph [Table Text Block] |
| North Square McKee Bond Fund - Class I | Bloomberg U.S. Aggregate Bond Index |
|---|
May-2021 | $50,000 | $50,000 |
|---|
May-2021 | $50,152 | $50,331 |
|---|
May-2022 | $46,639 | $46,193 |
|---|
May-2023 | $46,018 | $45,203 |
|---|
May-2024 | $46,960 | $45,793 |
|---|
May-2025 | $49,475 | $48,293 |
|---|
|
| Average Annual Return [Table Text Block] |
| 7 Months | Since Inception (May 19, 2021) |
|---|
North Square McKee Bond Fund- Class I | 1.67% | -0.44% |
|---|
Bloomberg U.S. Aggregate Bond Index | 1.84% | -0.86% |
|---|
|
| No Deduction of Taxes [Text Block] |
The graph and table do not reflect the deduction of taxes that a shareholder would pay on fund distributions or redemption of fund shares.
|
| AssetsNet |
$ 179,579,237
|
| Holdings Count | Holding |
418
|
| Advisory Fees Paid, Amount |
$ 15,393
|
| InvestmentCompanyPortfolioTurnover |
107.00%
|
| Additional Fund Statistics [Text Block] |
- Net Assets$179,579,237
- Number of Portfolio Holdings418
- Advisory Fee (net of waivers)$15,393
- Portfolio Turnover107%
|
| Holdings [Text Block] |
Composition of Net Assets (% of net assets)Value | Value |
|---|
Other Assets in Excess of Liabilities | 0.5% | Real Estate | 0.2% | Sovereign | 0.4% | Supranational | 0.6% | Short-Term Investments | 0.7% | Health Care | 0.8% | Consumer Staples | 1.6% | Technology | 1.8% | Communications | 1.8% | Consumer Discretionary | 2.6% | Energy | 2.7% | Asset Backed Securities | 2.8% | Industrials | 3.2% | Utilities | 3.7% | Financials | 12.5% | U.S. Government & Agencies | 19.4% | Mortgage Backed Securities | 44.7% |
Top 10 Holdings (% of net assets)Holding
Name | % of Net Assets |
|---|
United States Treasury Note/Bond, 3.875% | 2.5% |
|---|
United States Treasury Note/Bond, 4.750% | 2.5% |
|---|
United States Treasury Note/Bond, 3.125% | 2.4% |
|---|
United States Treasury Note/Bond, 4.500% | 2.2% |
|---|
United States Treasury Note/Bond, 3.750% | 2.0% |
|---|
United States Treasury Note/Bond, 4.000% | 1.8% |
|---|
United States Treasury Note/Bond, 4.250% | 1.6% |
|---|
Fannie Mae Pool, 5.000% | 1.3% |
|---|
Ginnie Mae II Pool, 2.000% | 1.2% |
|---|
United States Treasury Note, 3.750% | 1.1% |
|---|
|
| Material Fund Change [Text Block] |
The Fund changed its fiscal year end to May 31. |
| C000222266 |
|
| Shareholder Report [Line Items] |
|
| Fund Name |
North Square McKee Bond Fund
|
| Class Name |
Class R6
|
| Trading Symbol |
NMKBX
|
| Shareholder Report Annual or Semi-Annual |
Annual Shareholder Report
|
| Additional Information Phone Number |
1-855-551-5521
|
| Additional Information Website |
https://northsquareinvest.com/fund-reports-holdings-2/
|
| Expenses [Text Block] |
What were the Fund’s costs for the last year?(based on a hypothetical $10,000 investment) Class Name | Costs of a $10,000 investment | Costs paid as a percentage of a $10,000 investment |
|---|
Class R6 | $16Footnote Reference* | 0.28% |
|---|
| Footnote | Description | Footnote* | The reporting period is less than a full annual reporting period. Expenses paid for a full annual reporting period would be higher. |
|
| Expenses Paid, Amount |
$ 16
|
| Expense Ratio, Percent |
0.28%
|
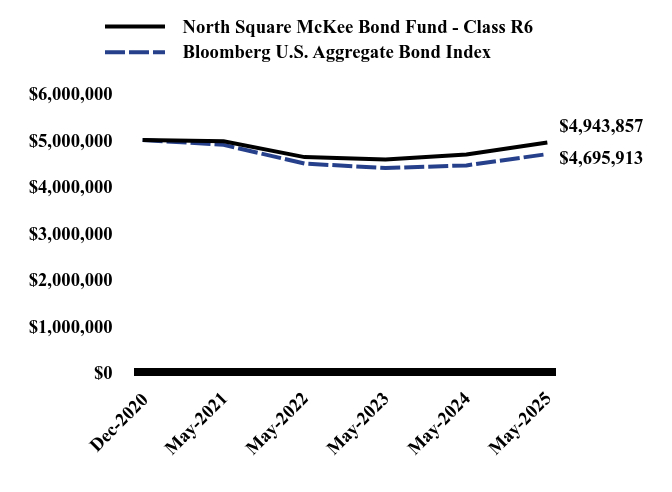
| Factors Affecting Performance [Text Block] |
How did the Fund perform during the reporting period? The North Square McKee Bond Fund for the seven-month period ending May 31, 2025, underperformed the Bloomberg US Aggregate Bond Index's return. Consistent with our investment philosophy and long-term results, excess returns mainly came from active security selection, though yield curve positioning and sector allocation detracted from performance. Leading contributors to performance included security selection in the corporate sector, adding 5 bps. Incremental value was also gained from managing the agency sector, contributing an additional 7 bps. Mortgage selection produced 4 bps of return. The 9% overweight in the mortgage sector cost the portfolio 4 bps, while the overweight in agency debentures was a 3 bps drag. The combined performance impact from duration and yield curve management totaled -11 bps. The April 2nd tariff announcement drove market volatility significantly higher, penalizing the performance of all spread sectors versus equal maturity Treasuries. Investment-grade corporate yield spreads continued to recover from the tariff-induced under performance versus Treasuries, leaving agency debenture and mortgage securities as our only active overweight as of May 31st. The inflation rate has yet to show any material impact from changes in trade/tariff policy, though we expect to see increasing upward pressure in the coming months. Given the pace of negotiations and questions surrounding the consumer’s share of price hikes, inflation should remain above the Fed’s target into next year. |
| Performance Past Does Not Indicate Future [Text] |
The Fund's past performance is not a good predictor of how the Fund will perform in the future.
|
| Line Graph [Table Text Block] |
| North Square McKee Bond Fund - Class R6 | Bloomberg U.S. Aggregate Bond Index |
|---|
Dec-2020 | $5,000,000 | $5,000,000 |
|---|
May-2021 | $4,969,573 | $4,894,087 |
|---|
May-2022 | $4,630,563 | $4,491,687 |
|---|
May-2023 | $4,579,187 | $4,395,448 |
|---|
May-2024 | $4,688,691 | $4,452,823 |
|---|
May-2025 | $4,943,857 | $4,695,913 |
|---|
|
| Average Annual Return [Table Text Block] |
| 7 Months | Since Inception (December 28, 2020) |
|---|
North Square McKee Bond Fund - Class R6 | 1.66% | -0.26% |
|---|
Bloomberg U.S. Aggregate Bond Index | 1.84% | -1.41% |
|---|
|
| Performance Inception Date |
Dec. 28, 2020
|
| No Deduction of Taxes [Text Block] |
The graph and table do not reflect the deduction of taxes that a shareholder would pay on fund distributions or redemption of fund shares.
|
| AssetsNet |
$ 179,579,237
|
| Holdings Count | Holding |
418
|
| Advisory Fees Paid, Amount |
$ 15,393
|
| InvestmentCompanyPortfolioTurnover |
107.00%
|
| Additional Fund Statistics [Text Block] |
- Net Assets$179,579,237
- Number of Portfolio Holdings418
- Advisory Fee (net of waivers)$15,393
- Portfolio Turnover107%
|
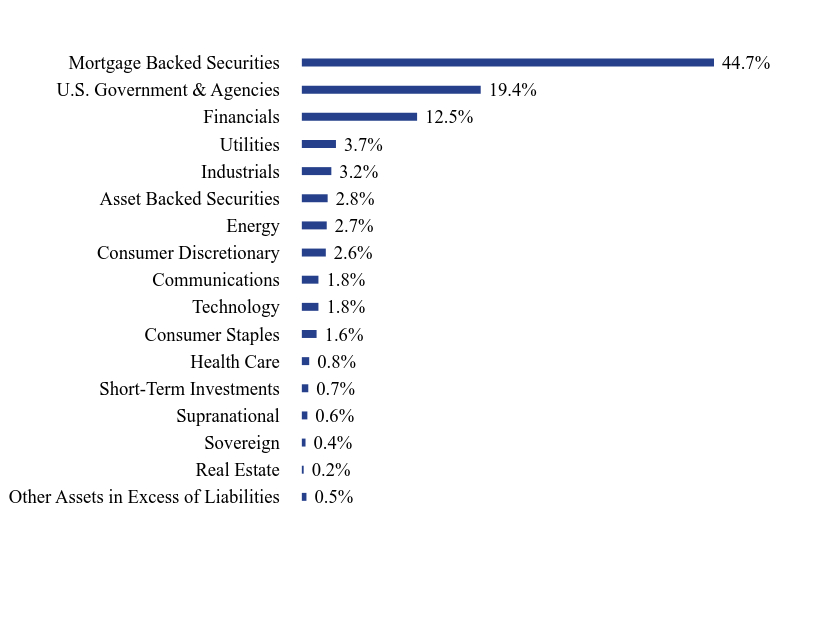
| Holdings [Text Block] |
Composition of Net Assets (% of net assets)Value | Value |
|---|
Other Assets in Excess of Liabilities | 0.5% | Real Estate | 0.2% | Sovereign | 0.4% | Supranational | 0.6% | Short-Term Investments | 0.7% | Health Care | 0.8% | Consumer Staples | 1.6% | Technology | 1.8% | Communications | 1.8% | Consumer Discretionary | 2.6% | Energy | 2.7% | Asset Backed Securities | 2.8% | Industrials | 3.2% | Utilities | 3.7% | Financials | 12.5% | U.S. Government & Agencies | 19.4% | Mortgage Backed Securities | 44.7% |
Top 10 Holdings (% of net assets)Holding Name | % of Net Assets |
|---|
United States Treasury Note/Bond, 3.875% | 2.5% |
|---|
United States Treasury Note/Bond, 4.750% | 2.5% |
|---|
United States Treasury Note/Bond, 3.125% | 2.4% |
|---|
United States Treasury Note/Bond, 4.500% | 2.2% |
|---|
United States Treasury Note/Bond, 3.750% | 2.0% |
|---|
United States Treasury Note/Bond, 4.000% | 1.8% |
|---|
United States Treasury Note/Bond, 4.250% | 1.6% |
|---|
Fannie Mae Pool, 5.000% | 1.3% |
|---|
Ginnie Mae II Pool, 2.000% | 1.2% |
|---|
United States Treasury Note, 3.750% | 1.1% |
|---|
|
| Material Fund Change [Text Block] |
The Fund changed its fiscal year end to May 31. |
| C000205681 |
|
| Shareholder Report [Line Items] |
|
| Fund Name |
North Square Multi Strategy Fund
|
| Class Name |
Class A
|
| Trading Symbol |
ORILX
|
| Shareholder Report Annual or Semi-Annual |
Annual Shareholder Report
|
| Additional Information Phone Number |
1-855-551-5521
|
| Additional Information Website |
https://northsquareinvest.com/fund-reports-holdings-2/
|
| Expenses Paid, Amount |
$ 104
|
| Expense Ratio, Percent |
1.00%
|
| Performance Past Does Not Indicate Future [Text] |
The Fund's past performance is not a good predictor of how the Fund will perform in the future.
|
| No Deduction of Taxes [Text Block] |
The graph and table do not reflect the deduction of taxes that a shareholder would pay on Fund distributions or redemption of Fund shares.
|
| AssetsNet |
$ 37,417,528
|
| Holdings Count | Holding |
12
|
| Advisory Fees Paid, Amount |
$ 84,766
|
| InvestmentCompanyPortfolioTurnover |
26.00%
|
| C000205683 |
|
| Shareholder Report [Line Items] |
|
| Fund Name |
North Square Multi Strategy Fund
|
| Class Name |
Class I
|
| Trading Symbol |
PORYX
|
| Shareholder Report Annual or Semi-Annual |
Annual Shareholder Report
|
| Additional Information Phone Number |
1-855-551-5521
|
| Additional Information Website |
https://northsquareinvest.com/fund-reports-holdings-2/
|
| Expenses Paid, Amount |
$ 78
|
| Expense Ratio, Percent |
0.75%
|
| Performance Past Does Not Indicate Future [Text] |
The Fund's past performance is not a good predictor of how the Fund will perform in the future.
|
| No Deduction of Taxes [Text Block] |
The graph and table do not reflect the deduction of taxes that a shareholder would pay on Fund distributions or redemption of Fund shares.
|
| AssetsNet |
$ 37,417,528
|
| Holdings Count | Holding |
12
|
| Advisory Fees Paid, Amount |
$ 84,766
|
| InvestmentCompanyPortfolioTurnover |
26.00%
|
| C000205685 |
|
| Shareholder Report [Line Items] |
|
| Fund Name |
North Square Preferred and Income Securities Fund
|
| Class Name |
Class I
|
| Trading Symbol |
ORDNX
|
| Annual or Semi-Annual Statement [Text Block] |
This annual shareholder report contains important information about North Square Preferred and Income Securities Fund (the "Fund") for the period of June 1, 2024, to May 31, 2025.
|
| Shareholder Report Annual or Semi-Annual |
Annual Shareholder Report
|
| Additional Information [Text Block] |
You can find additional information about the Fund at https://northsquareinvest.com/fund-reports-holdings-2/. You can also request this information by contacting us at 1-855-551-5521.
|
| Additional Information Phone Number |
1-855-551-5521
|
| Additional Information Website |
https://northsquareinvest.com/fund-reports-holdings-2/
|
| Expenses [Text Block] |
What were the Fund’s costs for the last year?(based on a hypothetical $10,000 investment) Class Name | Costs of a $10,000 investment | Costs paid as a percentage of a $10,000 investment |
|---|
Class I | $102 | 0.97% |
|---|
|
| Expenses Paid, Amount |
$ 102
|
| Expense Ratio, Percent |
0.97%
|
| Performance Past Does Not Indicate Future [Text] |
The Fund's past performance is not a good predictor of how the Fund will perform in the future.
|
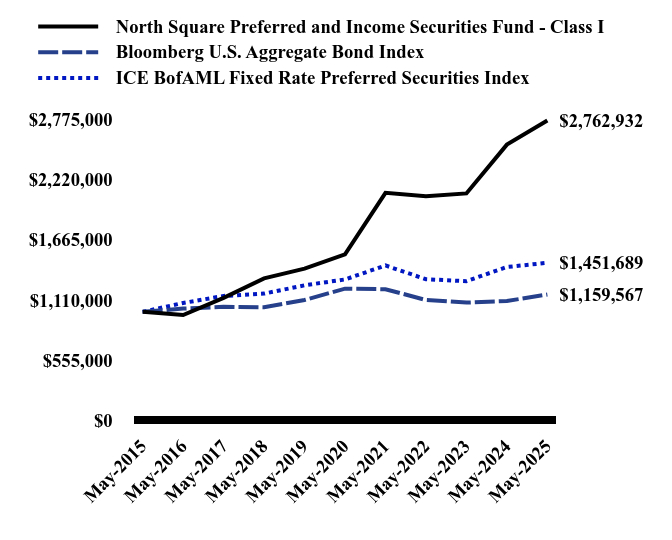
| Line Graph [Table Text Block] |
| North Square Preferred and Income Securities Fund - Class I | Bloomberg U.S. Aggregate Bond Index | ICE BofAML Fixed Rate Preferred Securities Index |
|---|
May-2015 | $1,000,000 | $1,000,000 | $1,000,000 |
|---|
May-2016 | $970,754 | $1,029,949 | $1,081,613 |
|---|
May-2017 | $1,128,545 | $1,046,205 | $1,146,295 |
|---|
May-2018 | $1,307,865 | $1,042,286 | $1,167,815 |
|---|
May-2019 | $1,398,643 | $1,108,998 | $1,244,480 |
|---|
May-2020 | $1,529,340 | $1,213,415 | $1,298,281 |
|---|
May-2021 | $2,096,259 | $1,208,503 | $1,427,203 |
|---|
May-2022 | $2,065,260 | $1,109,138 | $1,300,465 |
|---|
May-2023 | $2,090,986 | $1,085,373 | $1,282,471 |
|---|
May-2024 | $2,540,785 | $1,099,541 | $1,413,217 |
|---|
May-2025 | $2,762,932 | $1,159,567 | $1,451,689 |
|---|
|
| Average Annual Return [Table Text Block] |
| 1 Year | 5 Years | 10 Years |
|---|
North Square Preferred and Income Securities Fund - Class I | 8.74% | 12.56% | 10.70% |
|---|
Bloomberg U.S. Aggregate Bond Index | 5.46% | -0.90% | 1.49% |
|---|
ICE BofAML Fixed Rate Preferred Securities Index | 2.72% | 2.26% | 3.80% |
|---|
|
| No Deduction of Taxes [Text Block] |
The graph and table do not reflect the deduction of taxes that a shareholder would pay on fund distributions or redemption of fund shares.
|
| AssetsNet |
$ 321,042,266
|
| Holdings Count | Holding |
59
|
| Advisory Fees Paid, Amount |
$ 1,827,328
|
| InvestmentCompanyPortfolioTurnover |
92.00%
|
| Additional Fund Statistics [Text Block] |
- Net Assets$321,042,266
- Number of Portfolio Holdings59
- Advisory Fee (net of waivers)$1,827,328
- Portfolio Turnover92%
|
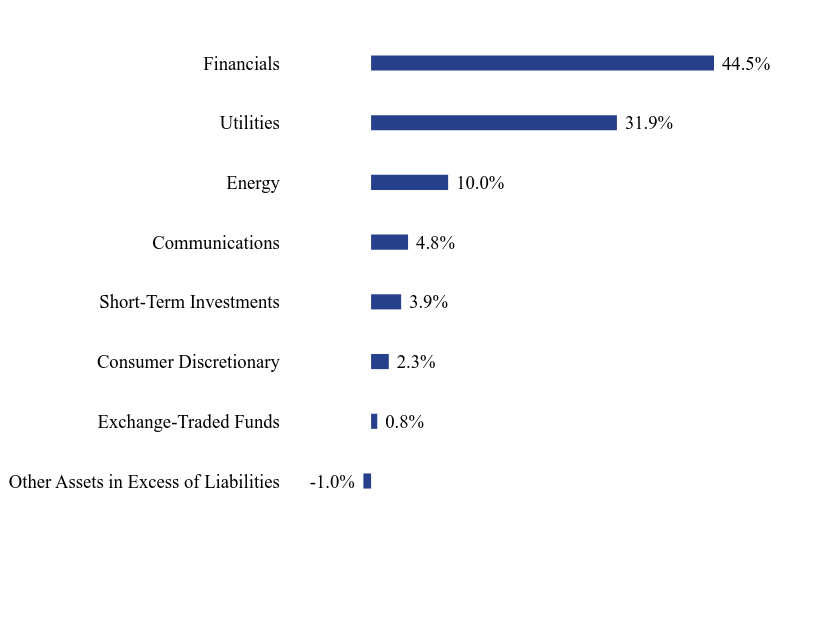
| Holdings [Text Block] |
Composition of Net Assets (% of net assets)Value | Value |
|---|
Other Assets in Excess of Liabilities | -1.0% | Exchange-Traded Funds | 0.8% | Consumer Discretionary | 2.3% | Short-Term Investments | 3.9% | Communications | 4.8% | Energy | 10.0% | Utilities | 31.9% | Financials | 44.5% |
Top 10 Holdings (% of net assets)Holding Name | % of Net Assets |
|---|
Charles Schwab Corp. (The), 5.375%, Perpetual | 4.0% |
|---|
First American Treasury Government Obligations Fund, 4.230%, | 3.9% |
|---|
Wells Fargo & Co., 5.875%, Perpetual | 3.4% |
|---|
Capital One Financial Corp, 6.125%, Perpetual | 3.4% |
|---|
Vistra Corp., 8.875%, Perpetual | 3.3% |
|---|
Truist Financial Corp., 4.950%, Perpetual | 3.1% |
|---|
NextEra Energy Capital Holdings, Inc., 6.500%, 06/15/54 | 2.9% |
|---|
American Electric Power Co., Inc., 6.950%, 12/15/54 | 2.8% |
|---|
Duke Energy Corp., 6.450%, 09/1/54 | 2.7% |
|---|
CMS Energy Corp., 4.750%, 06/1/50 | 2.6% |
|---|
|
| Material Fund Change [Text Block] |
No material changes occurred since June 1, 2024. |
| C000255877 |
|
| Shareholder Report [Line Items] |
|
| Fund Name |
North Square RCIM Tax-Advantaged Preferred and Income Securities ETF
|
| Trading Symbol |
QTPI
|
| Security Exchange Name |
NYSEArca
|
| Shareholder Report Annual or Semi-Annual |
Annual Shareholder Report
|
| Additional Information Phone Number |
1-855-514-7733
|
| Additional Information Website |
https://northsquareinvest.com/fund-reports-holdings-2/
|
| Expenses Paid, Amount |
$ 61
|
| Expense Ratio, Percent |
0.60%
|
| Performance Past Does Not Indicate Future [Text] |
The Fund's past performance is not a good predictor of how the Fund will perform in the future.
|
| Performance Inception Date |
Dec. 18, 2024
|
| No Deduction of Taxes [Text Block] |
The graph and table do not reflect the deduction of taxes that a shareholder would pay on fund distributions or redemption of fund shares.
|
| AssetsNet |
$ 12,004,048
|
| Holdings Count | Holding |
43
|
| Advisory Fees Paid, Amount |
$ 29,438
|
| InvestmentCompanyPortfolioTurnover |
10.00%
|
| C000217840 |
|
| Shareholder Report [Line Items] |
|
| Fund Name |
North Square Select Small Cap Fund
|
| Class Name |
Class I
|
| Trading Symbol |
ADVGX
|
| Shareholder Report Annual or Semi-Annual |
Annual Shareholder Report
|
| Material Fund Change Notice [Text Block] |
This report describes changes to the Fund that occurred during the reporting period.
|
| Additional Information Phone Number |
1-855-551-5521
|
| Additional Information Website |
https://northsquareinvest.com/fund-reports-holdings-2/
|
| Expenses [Text Block] |
What were the Fund’s costs for the last year?(based on a hypothetical $10,000 investment) Class Name | Costs of a $10,000 investment | Costs paid as a percentage of a $10,000 investment |
|---|
Class I | $53Footnote Reference* | 0.94% |
|---|
| Footnote | Description | Footnote* | The reporting period is less than a full annual reporting period. Expenses paid for a full annual reporting period would be higher. |
|
| Expenses Paid, Amount |
$ 53
|
| Expense Ratio, Percent |
0.94%
|
| Performance Past Does Not Indicate Future [Text] |
The Fund's past performance is not a good predictor of how the Fund will perform in the future.
|
| No Deduction of Taxes [Text Block] |
The graph and table do not reflect the deduction of taxes that a shareholder would pay on Fund distributions or redemption of Fund shares.
|
| AssetsNet |
$ 23,716,377
|
| Holdings Count | Holding |
33
|
| Advisory Fees Paid, Amount |
$ 80,094
|
| InvestmentCompanyPortfolioTurnover |
33.00%
|
| Additional Fund Statistics [Text Block] |
- Net Assets$23,716,377
- Number of Portfolio Holdings33
- Advisory Fee #ERROR:A result could not be returned because the conditional could not be evaluated to a True/False value ((history))$80,094
- Portfolio Turnover33%
|
| Holdings [Text Block] |
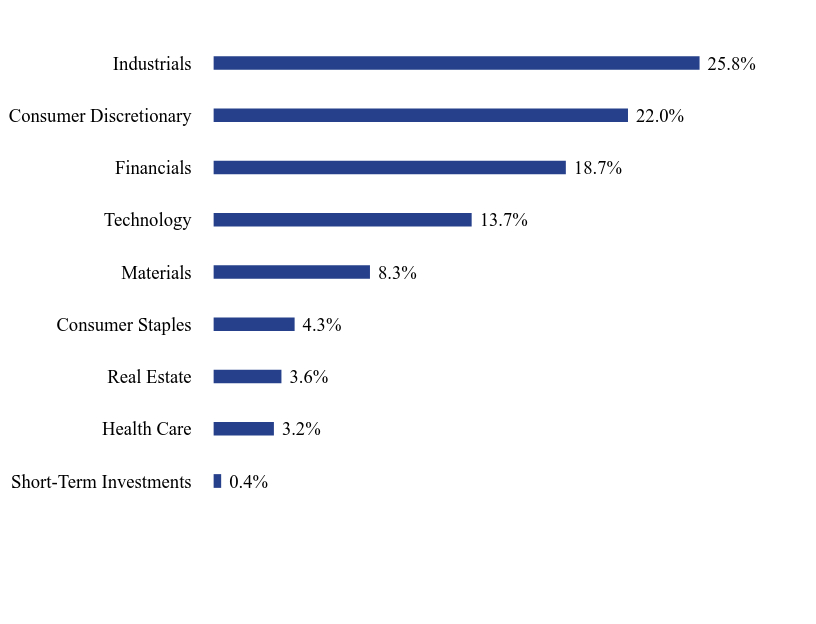
Sector Weighting (% of net assets)Value | Value |
|---|
Short-Term Investments | 0.4% | Health Care | 3.2% | Real Estate | 3.6% | Consumer Staples | 4.3% | Materials | 8.3% | Technology | 13.7% | Financials | 18.7% | Consumer Discretionary | 22.0% | Industrials | 25.8% |
Top 10 Holdings (% of net assets)Holding Name | % of Net Assets |
|---|
Bel Fuse, Inc., Class B | 5.8% |
|---|
TriMas Corp. | 5.0% |
|---|
JBT Marel Corp. | 4.7% |
|---|
Nicolet Bankshares, Inc. | 4.6% |
|---|
Performance Food Group Co. | 4.3% |
|---|
Openlane, Inc. | 3.8% |
|---|
Legacy Housing Corp. | 3.6% |
|---|
Daily Journal Corp. | 3.5% |
|---|
First Merchants Corp. | 3.5% |
|---|
Pitney Bowes, Inc. | 3.5% |
|---|
|
| C000205671 |
|
| Shareholder Report [Line Items] |
|
| Fund Name |
North Square Spectrum Alpha Fund
|
| Class Name |
Class A
|
| Trading Symbol |
ORIGX
|
| Shareholder Report Annual or Semi-Annual |
Annual Shareholder Report
|
| Additional Information Phone Number |
1-855-551-5521
|
| Additional Information Website |
https://northsquareinvest.com/fund-reports-holdings-2/
|
| Expenses [Text Block] |
What were the Fund’s costs for the last year?(based on a hypothetical $10,000 investment) Class Name | Costs of a $10,000 investment | Costs paid as a percentage of a $10,000 investment |
|---|
Class A | $132 | 1.30% |
|---|
|
| Expenses Paid, Amount |
$ 132
|
| Expense Ratio, Percent |
1.30%
|
| Performance Past Does Not Indicate Future [Text] |
The Fund's past performance is not a good predictor of how the Fund will perform in the future.
|
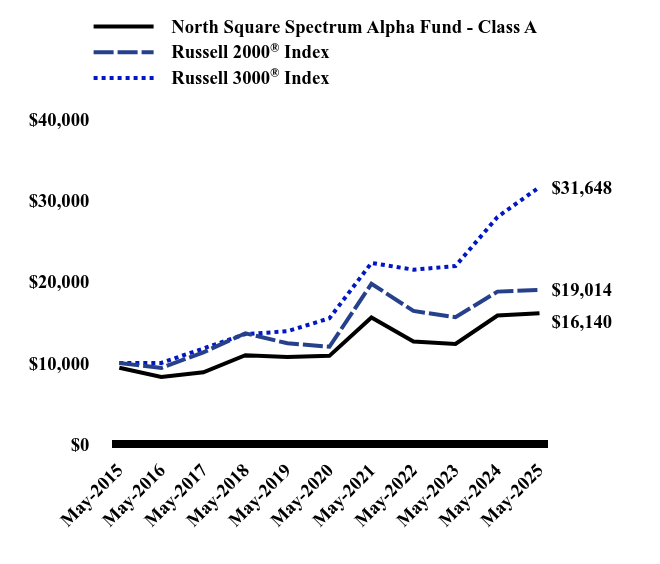
| Line Graph [Table Text Block] |
| North Square Spectrum Alpha Fund - Class A | Russell 2000® Index | Russell 3000® Index |
|---|
May-2015 | $9,424 | $10,000 | $10,000 |
|---|
May-2016 | $8,293 | $9,403 | $10,022 |
|---|
May-2017 | $8,859 | $11,317 | $11,795 |
|---|
May-2018 | $10,971 | $13,667 | $13,572 |
|---|
May-2019 | $10,757 | $12,431 | $13,911 |
|---|
May-2020 | $10,885 | $12,004 | $15,505 |
|---|
May-2021 | $15,611 | $19,754 | $22,314 |
|---|
May-2022 | $12,642 | $16,412 | $21,492 |
|---|
May-2023 | $12,357 | $15,644 | $21,929 |
|---|
May-2024 | $15,846 | $18,791 | $27,978 |
|---|
May-2025 | $16,140 | $19,014 | $31,648 |
|---|
|
| Average Annual Return [Table Text Block] |
| 1 Year | 5 Years | 10 Years |
|---|
North Square Spectrum Alpha Fund - Class A | | | |
|---|
Without Load | 1.86% | 8.20% | 5.53% |
|---|
With Load | -4.00% | 6.92% | 4.90% |
|---|
Russell 2000® Index | 1.19% | 9.64% | 6.64% |
|---|
Russell 3000® Index | 13.12% | 15.34% | 12.21% |
|---|
|
| No Deduction of Taxes [Text Block] |
The graph and table do not reflect the deduction of taxes that a shareholder would pay on Fund distributions or redemption of Fund shares.
|
| AssetsNet |
$ 68,734,171
|
| Holdings Count | Holding |
5
|
| Advisory Fees Paid, Amount |
$ 406,941
|
| InvestmentCompanyPortfolioTurnover |
19.00%
|
| Additional Fund Statistics [Text Block] |
- Net Assets$68,734,171
- Number of Portfolio Holdings5
- Advisory Fee (net of waivers)$406,941
- Portfolio Turnover19%
|
| Holdings [Text Block] |
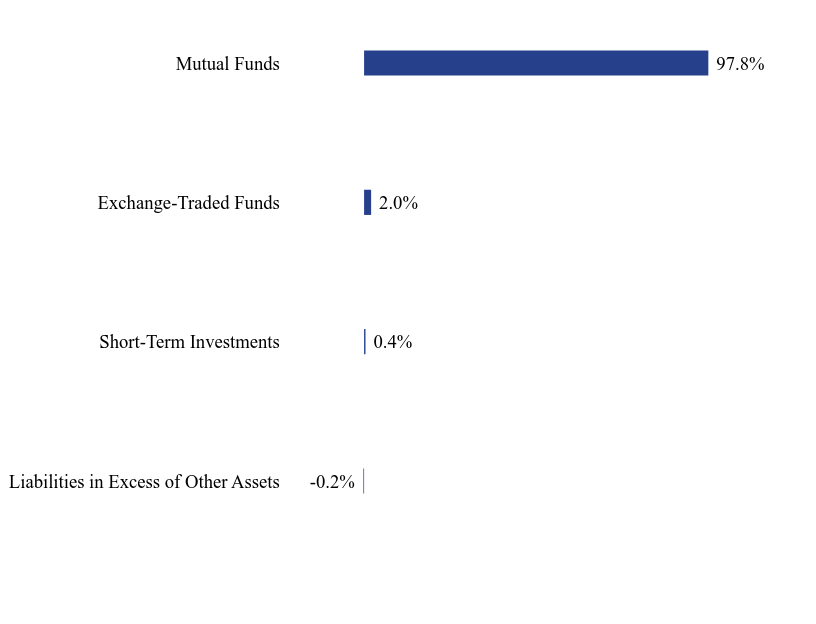
Composition of Net Assets (% of net assets)Value | Value |
|---|
Liabilities in Excess of Other Assets | -0.2% | Short-Term Investments | 0.4% | Exchange-Traded Funds | 2.0% | Mutual Funds | 97.8% |
|
| Largest Holdings [Text Block] |
Top Holdings (% of net assets)Holding Name | % of Net Assets |
|---|
North Square Dynamic Small Cap Fund, Class I | 56.2% |
|---|
North Square Select Small Cap Fund, Class I | 27.6% |
|---|
North Square Kennedy MicroCap Fund, Class I | 14.0% |
|---|
iShares® Russell 2000 ETF | 2.0% |
|---|
First American Treasury Government Obligations Fund, Class X | 0.4% |
|---|
|
| Material Fund Change [Text Block] |
This is a summary of certain changes to the Fund since June 1, 2024. For more complete information you may review the Fund's current prospectus, dated September 27, 2024, as supplemented on December 20, 2024, which is available upon request at 1-855-551-5521 or on the Fund's website at https://northsquareinvest.com/fund-reports-holdings-2/. Effective December 20, 2024, pursuant to a novation of the Sub-Advisory Agreement between North Square Investments, LLC and NSI Retail Advisors, LLC (“NSI Retail”) with respect to the Fund, CSM Advisors, LLC (“CSM”), an affiliate of NSI Retail, became the investment sub-adviser to the Fund and is responsible for its day-to-day portfolio management. The novation of the Sub-Advisory Agreement occurred in connection with an internal restructuring of NSI Retail and did not result in any changes to: (i) the level of sub-advisory services provided to the Fund; (ii) the manner in which the Fund is managed or operated; (iii) the personnel who are responsible for providing sub-advisory services to the Fund, including the portfolio managers; or (iv) the terms of the Sub-Advisory Agreement, including the compensation paid to the Fund's sub-adviser |
| C000205673 |
|
| Shareholder Report [Line Items] |
|
| Fund Name |
North Square Spectrum Alpha Fund
|
| Class Name |
Class I
|
| Trading Symbol |
ORIYX
|
| Shareholder Report Annual or Semi-Annual |
Annual Shareholder Report
|
| Additional Information Phone Number |
1-855-551-5521
|
| Additional Information Website |
https://northsquareinvest.com/fund-reports-holdings-2/
|
| Expenses [Text Block] |
What were the Fund’s costs for the last year?(based on a hypothetical $10,000 investment) Class Name | Costs of a $10,000 investment | Costs paid as a percentage of a $10,000 investment |
|---|
Class I | $106 | 1.05% |
|---|
|
| Expenses Paid, Amount |
$ 106
|
| Expense Ratio, Percent |
1.05%
|
| Performance Past Does Not Indicate Future [Text] |
The Fund's past performance is not a good predictor of how the Fund will perform in the future.
|
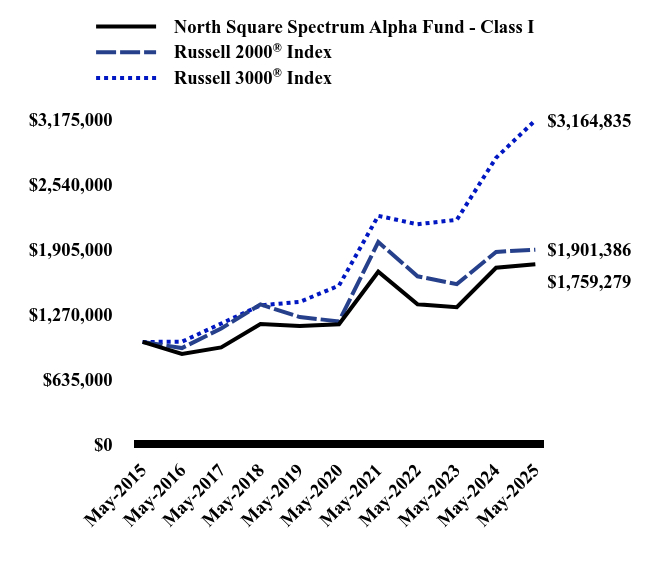
| Line Graph [Table Text Block] |
| North Square Spectrum Alpha Fund - Class I | Russell 2000® Index | Russell 3000® Index |
|---|
May-2015 | $1,000,000 | $1,000,000 | $1,000,000 |
|---|
May-2016 | $882,642 | $940,273 | $1,002,233 |
|---|
May-2017 | $946,420 | $1,131,726 | $1,179,539 |
|---|
May-2018 | $1,175,319 | $1,366,724 | $1,357,195 |
|---|
May-2019 | $1,155,725 | $1,243,104 | $1,391,074 |
|---|
May-2020 | $1,172,159 | $1,200,356 | $1,550,539 |
|---|
May-2021 | $1,685,960 | $1,975,361 | $2,231,406 |
|---|
May-2022 | $1,367,495 | $1,641,226 | $2,149,203 |
|---|
May-2023 | $1,339,074 | $1,564,427 | $2,192,933 |
|---|
May-2024 | $1,724,407 | $1,879,112 | $2,797,809 |
|---|
May-2025 | $1,759,279 | $1,901,386 | $3,164,835 |
|---|
|
| Average Annual Return [Table Text Block] |
| 1 Year | 5 Years | 10 Years |
|---|
North Square Spectrum Alpha Fund - Class
I | 2.02% | 8.46% | 5.81% |
|---|
Russell 2000® Index | 1.19% | 9.64% | 6.64% |
|---|
Russell 3000® Index | 13.12% | 15.34% | 12.21% |
|---|
|
| No Deduction of Taxes [Text Block] |
The graph and table do not reflect the deduction of taxes that a shareholder would pay on Fund distributions or redemption of Fund shares.
|
| AssetsNet |
$ 68,734,171
|
| Holdings Count | Holding |
5
|
| Advisory Fees Paid, Amount |
$ 406,941
|
| InvestmentCompanyPortfolioTurnover |
19.00%
|
| Additional Fund Statistics [Text Block] |
- Net Assets$68,734,171
- Number of Portfolio Holdings5
- Advisory Fee (net of waivers)$406,941
- Portfolio Turnover19%
|
| Holdings [Text Block] |
Composition of Net Assets (% of net assets)Value | Value |
|---|
Liabilities in Excess of Other Assets | -0.2% | Short-Term Investments | 0.4% | Exchange-Traded Funds | 2.0% | Mutual Funds | 97.8% |
|
| Largest Holdings [Text Block] |
Top Holdings (% of net assets)Holding Name | % of Net Assets |
|---|
North Square Dynamic Small Cap Fund, Class I | 56.2% |
|---|
North Square Select Small Cap Fund, Class I | 27.6% |
|---|
North Square Kennedy MicroCap Fund, Class I | 14.0% |
|---|
iShares® Russell 2000 ETF | 2.0% |
|---|
First American Treasury Government Obligations Fund, Class X | 0.4% |
|---|
|
| Material Fund Change [Text Block] |
This is a summary of certain changes to the Fund since June 1, 2024. For more complete information you may review the Fund's current prospectus, dated September 27, 2024, as supplemented on December 20, 2024, which is available upon request at 1-855-551-5521 or on the Fund's website at https://northsquareinvest.com/fund-reports-holdings-2/. Effective December 20, 2024, pursuant to a novation of the Sub-Advisory Agreement between North Square Investments, LLC and NSI Retail Advisors, LLC (“NSI Retail”) with respect to the Fund, CSM Advisors, LLC (“CSM”), an affiliate of NSI Retail, became the investment sub-adviser to the Fund and is responsible for its day-to-day portfolio management. The novation of the Sub-Advisory Agreement occurred in connection with an internal restructuring of NSI Retail and did not result in any changes to: (i) the level of sub-advisory services provided to the Fund; (ii) the manner in which the Fund is managed or operated; (iii) the personnel who are responsible for providing sub-advisory services to the Fund, including the portfolio managers; or (iv) the terms of the Sub-Advisory Agreement, including the compensation paid to the Fund's sub-adviser |
| C000217841 |
|
| Shareholder Report [Line Items] |
|
| Fund Name |
North Square Strategic Income Fund
|
| Class Name |
Class A
|
| Trading Symbol |
ADVAX
|
| Shareholder Report Annual or Semi-Annual |
Annual Shareholder Report
|
| Additional Information Phone Number |
1-855-551-5521
|
| Additional Information Website |
https://northsquareinvest.com/fund-reports-holdings-2/
|
| Expenses [Text Block] |
What were the Fund’s costs for the last year?(based on a hypothetical $10,000 investment) Class Name | Costs of a $10,000 investment | Costs paid as a percentage of a $10,000 investment |
|---|
Class A | $59Footnote Reference* | 0.99% |
|---|
| Footnote | Description | Footnote* | The reporting period is less than a full annual reporting period. Expenses paid for a full annual reporting period would be higher. |
|
| Expenses Paid, Amount |
$ 59
|
| Expense Ratio, Percent |
0.99%
|
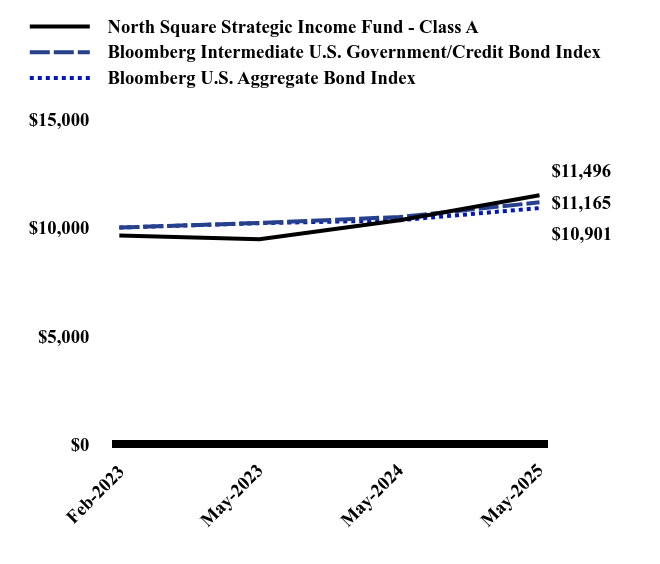
| Factors Affecting Performance [Text Block] |
How did the Fund perform during the reporting period? During the period November 1, 2024 - May 31, 2025, uncertainty in financial markets remained elevated as investors grappled with fears of a recession, despite resilient economic data. Throughout this period, Red Cedar Investment Management (RCIM) maintained a cautious but opportunistic approach, capitalizing on market volatility driven by ongoing interest rate fluctuations and heightened geopolitical tensions. By remaining skeptical of overly pessimistic economic forecasts, RCIM has been able to take advantage of opportunities in the market. Fiscal year 2025 saw periods of elevated volatility, most notably in August 2024 and April 2025 when VIX spiked to levels typically observed only during crisis periods. The Fund’s long volatility exposure helped to mitigate downside risk by generating 270 bps of alpha during the period. Preferred Securities contributed 174 bps of alpha to outperformance. AT1’s benefitted from increased certainty after the French election and issuance in the space was met with high demand at tighter spreads. Corporate Hybrids benefitted from Moody’s decision to increase equity credit for hybrid securities from 25% to 50% earlier in the year and Institutional Preferreds also posted strong results as those securities continued to be called on their first call dates. Security selection in securitized products enhanced returns, particularly through agency Commercial Mortgage-Backed Securities (CMBS) interest-only tranches. These securities, backed by 2020-2021 vintage loans originated at historically low rates, garnered strong demand for their extended duration and reliable income streams. In addition, select below investment grade non-agency CMBS positions also outperformed following positive loan restructuring developments. Equity holdings emerged as another top performer. Specifically, gold miners benefitted from the global economic reordering taking place and growing unease with fiat currencies. |
| Performance Past Does Not Indicate Future [Text] |
The Fund's past performance is not a good predictor of how the Fund will perform in the future.
|
| Line Graph [Table Text Block] |
| North Square Strategic Income Fund - Class A | Bloomberg Intermediate U.S. Government/Credit Bond Index | Bloomberg U.S. Aggregate Bond Index |
|---|
Feb-2023 | $9,630 | $10,000 | $10,000 |
|---|
May-2023 | $9,460 | $10,216 | $10,204 |
|---|
May-2024 | $10,335 | $10,488 | $10,337 |
|---|
May-2025 | $11,496 | $11,165 | $10,901 |
|---|
|
| Average Annual Return [Table Text Block] |
| 7 Months | Since Inception (February 28, 2023) |
|---|
North Square Strategic Income Fund - Class A (without load) | 5.54% | 8.18% |
|---|
North Square Strategic Income Fund - Class A (with load) | 1.63% | 6.39% |
|---|
Bloomberg Intermediate U.S. Government/Credit Bond Index | 3.03% | 5.01% |
|---|
Bloomberg U.S. Aggregate Bond Index | 1.84% | 3.91% |
|---|
|
| Performance Inception Date |
Feb. 28, 2023
|
| No Deduction of Taxes [Text Block] |
The graph and table do not reflect the deduction of taxes that a shareholder would pay on Fund distributions or redemption of Fund shares.
|
| AssetsNet |
$ 458,902,248
|
| Holdings Count | Holding |
227
|
| Advisory Fees Paid, Amount |
$ 752,295
|
| InvestmentCompanyPortfolioTurnover |
53.00%
|
| Additional Fund Statistics [Text Block] |
- Net Assets$458,902,248
- Number of Portfolio Holdings227
- Advisory Fee (net of waivers)$752,295
- Portfolio Turnover53%
|
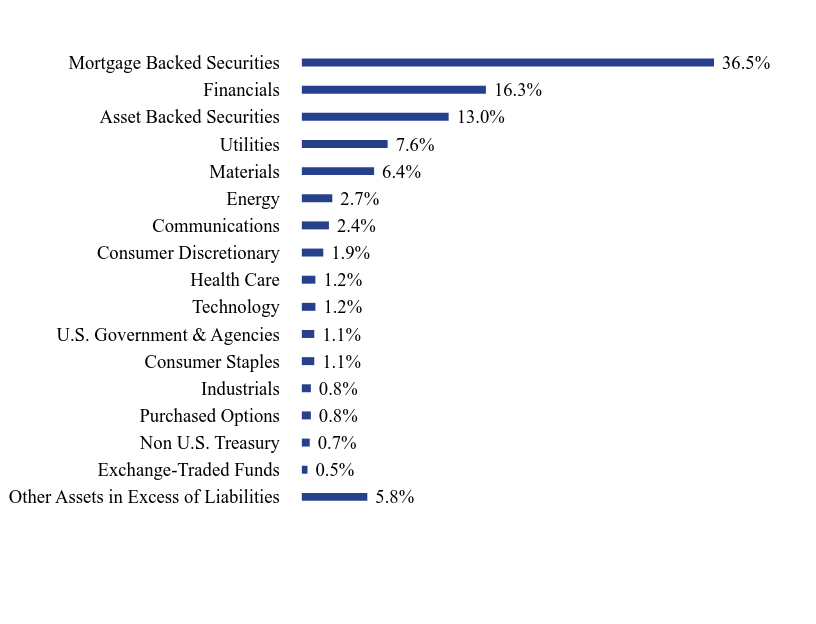
| Holdings [Text Block] |
Composition of Net Assets (% of net assets)Value | Value |
|---|
Other Assets in Excess of Liabilities | 5.8% | Exchange-Traded Funds | 0.5% | Non U.S. Treasury | 0.7% | Purchased Options | 0.8% | Industrials | 0.8% | Consumer Staples | 1.1% | U.S. Government & Agencies | 1.1% | Technology | 1.2% | Health Care | 1.2% | Consumer Discretionary | 1.9% | Communications | 2.4% | Energy | 2.7% | Materials | 6.4% | Utilities | 7.6% | Asset Backed Securities | 13.0% | Financials | 16.3% | Mortgage Backed Securities | 36.5% |
Top 10 Holdings (% of net assets)Holding Name | % of Net Assets |
|---|
Fannie Mae Pool, 4.000% | 1.7% |
|---|
Charles Schwab Corp. (The), 5.375% | 1.3% |
|---|
Freddie Mac Pool, 2.000% | 1.3% |
|---|
Freddie Mac Pool, 6.500% | 1.1% |
|---|
Bank of America Corp., 5.875% | 1.1% |
|---|
MetLife, Inc., 3.850% | 1.1% |
|---|
CyrusOne Data Centers Issuer I LLC, 4.500% | 1.1% |
|---|
HSBC Holdings PLC, 7.050% | 1.0% |
|---|
Capital One Financial Corp., 6.125% | 1.0% |
|---|
Ginnie Mae II Pool, 2.500% | 1.0% |
|---|
|
| Material Fund Change [Text Block] |
This is a summary of certain changes to the Fund since November 1, 2024. For more complete information on the change in the Adviser's advisory fees and expense limitation agreement, you may review the Fund’s prospectus, dated February 28, 2025, as supplemented on May 20, 2025, which is available upon request at 1-855-551-5521 or on the Fund's website at https://northsquareinvest.com/fund-reports-holdings-2/. Effective January 1, 2025, the Adviser reduced the contractual adviser fee of the Fund from an annual rate of 0.70% to 0.56% of the Fund's average daily net assets. Additionally, the Adviser has contractually agreed to waive the advisory fees and/or reimburse operating expenses of the Fund to ensure that the total annual fund operating expenses do not exceed 0.93% and 0.68% for the Class A shares and Class I shares, respectively. Prior to January 1, 2025, the Fund’s contractual expense limitations were 1.15% and 0.90% for the Class A shares and Class I shares, respectively. The Fund changed it's fiscal year end to May 31. |
| C000217842 |
|
| Shareholder Report [Line Items] |
|
| Fund Name |
North Square Strategic Income Fund
|
| Class Name |
Class I
|
| Trading Symbol |
ADVNX
|
| Shareholder Report Annual or Semi-Annual |
Annual Shareholder Report
|
| Additional Information Phone Number |
1-855-551-5521
|
| Additional Information Website |
https://northsquareinvest.com/fund-reports-holdings-2/
|
| Expenses [Text Block] |
What were the Fund’s costs for the last year?(based on a hypothetical $10,000 investment) Class Name | Costs of a $10,000 investment | Costs paid as a percentage of a $10,000 investment |
|---|
Class I | $44Footnote Reference* | 0.74% |
|---|
| Footnote | Description | Footnote* | The reporting period is less than a full annual reporting period. Expenses paid for a full annual reporting period would be higher. |
|
| Expenses Paid, Amount |
$ 44
|
| Expense Ratio, Percent |
0.74%
|
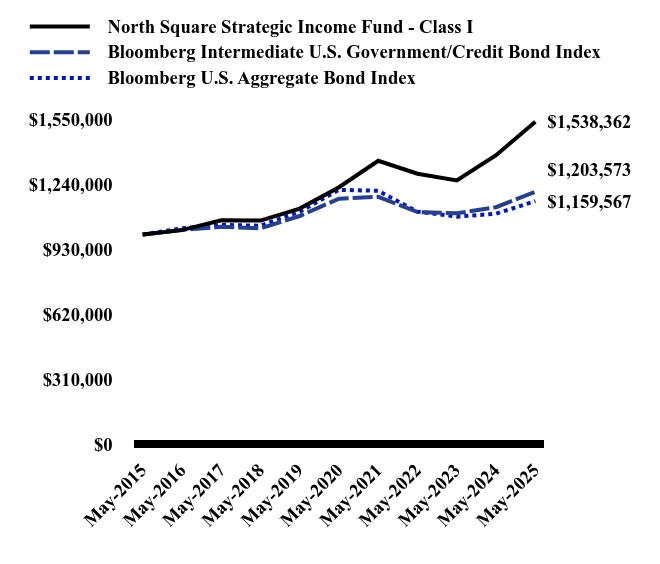
| Factors Affecting Performance [Text Block] |
How did the Fund perform during the reporting period? During the period November 1, 2024 - May 31, 2025, uncertainty in financial markets remained elevated as investors grappled with fears of a recession, despite resilient economic data. Throughout this period, Red Cedar Investment Management (RCIM) maintained a cautious but opportunistic approach, capitalizing on market volatility driven by ongoing interest rate fluctuations and heightened geopolitical tensions. By remaining skeptical of overly pessimistic economic forecasts, RCIM has been able to take advantage of opportunities in the market. Fiscal year 2025 saw periods of elevated volatility, most notably in August 2024 and April 2025 when VIX spiked to levels typically observed only during crisis periods. The Fund’s long volatility exposure helped to mitigate downside risk by generating 270 bps of alpha during the period. Preferred Securities contributed 174 bps of alpha to outperformance. AT1’s benefitted from increased certainty after the French election and issuance in the space was met with high demand at tighter spreads. Corporate Hybrids benefitted from Moody’s decision to increase equity credit for hybrid securities from 25% to 50% earlier in the year and Institutional Preferreds also posted strong results as those securities continued to be called on their first call dates. Security selection in securitized products enhanced returns, particularly through agency Commercial Mortgage-Backed Securities (CMBS) interest-only tranches. These securities, backed by 2020-2021 vintage loans originated at historically low rates, garnered strong demand for their extended duration and reliable income streams. In addition, select below investment grade non-agency CMBS positions also outperformed following positive loan restructuring developments. Equity holdings emerged as another top performer. Specifically, gold miners benefitted from the global economic reordering taking place and growing unease with fiat currencies. |
| Performance Past Does Not Indicate Future [Text] |
The Fund's past performance is not a good predictor of how the Fund will perform in the future.
|
| Line Graph [Table Text Block] |
| North Square Strategic Income Fund - Class I | Bloomberg Intermediate U.S. Government/Credit Bond Index | Bloomberg U.S. Aggregate Bond Index |
|---|
May-2015 | $1,000,000 | $1,000,000 | $1,000,000 |
|---|
May-2016 | $1,021,280 | $1,022,445 | $1,029,949 |
|---|
May-2017 | $1,067,990 | $1,036,748 | $1,046,205 |
|---|
May-2018 | $1,066,649 | $1,029,564 | $1,042,286 |
|---|
May-2019 | $1,123,775 | $1,088,551 | $1,108,998 |
|---|
May-2020 | $1,225,719 | $1,171,280 | $1,213,415 |
|---|
May-2021 | $1,351,887 | $1,179,806 | $1,208,503 |
|---|
May-2022 | $1,289,887 | $1,107,111 | $1,109,138 |
|---|
May-2023 | $1,258,398 | $1,101,243 | $1,085,373 |
|---|
May-2024 | $1,378,394 | $1,130,597 | $1,099,541 |
|---|
May-2025 | $1,538,362 | $1,203,573 | $1,159,567 |
|---|
|
| Average Annual Return [Table Text Block] |
| 7 Months | 5 Years | 10 Years |
|---|
North Square Strategic Income Fund - Class I | 5.74% | 4.65% | 4.40% |
|---|
Bloomberg Intermediate U.S. Government/Credit Bond Index | 3.03% | 0.55% | 1.87% |
|---|
Bloomberg U.S. Aggregate Bond Index | 1.84% | -0.90% | 1.49% |
|---|
|
| No Deduction of Taxes [Text Block] |
The graph and table do not reflect the deduction of taxes that a shareholder would pay on Fund distributions or redemption of Fund shares.
|
| AssetsNet |
$ 458,902,248
|
| Holdings Count | Holding |
227
|
| Advisory Fees Paid, Amount |
$ 752,295
|
| InvestmentCompanyPortfolioTurnover |
53.00%
|
| Additional Fund Statistics [Text Block] |
- Net Assets$458,902,248
- Number of Portfolio Holdings227
- Advisory Fee (net of waivers)$752,295
- Portfolio Turnover53%
|
| Holdings [Text Block] |
Composition of Net Assets (% of net assets)Value | Value |
|---|
Other Assets in Excess of Liabilities | 5.8% | Exchange-Traded Funds | 0.5% | Non U.S. Treasury | 0.7% | Purchased Options | 0.8% | Industrials | 0.8% | Consumer Staples | 1.1% | U.S. Government & Agencies | 1.1% | Technology | 1.2% | Health Care | 1.2% | Consumer Discretionary | 1.9% | Communications | 2.4% | Energy | 2.7% | Materials | 6.4% | Utilities | 7.6% | Asset Backed Securities | 13.0% | Financials | 16.3% | Mortgage Backed Securities | 36.5% |
Top 10 Holdings (% of net assets)Holding Name | % of Net Assets |
|---|
Fannie Mae Pool, 4.000% | 1.7% |
|---|
Charles Schwab Corp. (The), 5.375% | 1.3% |
|---|
Freddie Mac Pool, 2.000% | 1.3% |
|---|
Freddie Mac Pool, 6.500% | 1.1% |
|---|
Bank of America Corp., 5.875% | 1.1% |
|---|
MetLife, Inc., 3.850% | 1.1% |
|---|
CyrusOne Data Centers Issuer I LLC, 4.500% | 1.1% |
|---|
HSBC Holdings PLC, 7.050% | 1.0% |
|---|
Capital One Financial Corp., 6.125% | 1.0% |
|---|
Ginnie Mae II Pool, 2.500% | 1.0% |
|---|
|
| Material Fund Change [Text Block] |
This is a summary of certain changes to the Fund since November 1, 2024. For more complete information on the change in the Adviser's advisory fees and expense limitation agreement, you may review the Fund’s prospectus, dated February 28, 2025, as supplemented on May 20, 2025, which is available upon request at 1-855-551-5521 or on the Fund's website at https://northsquareinvest.com/fund-reports-holdings-2/. Effective January 1, 2025, the Adviser reduced the contractual adviser fee of the Fund from an annual rate of 0.70% to 0.56% of the Fund's average daily net assets. Additionally, the Adviser has contractually agreed to waive the advisory fees and/or reimburse operating expenses of the Fund to ensure that the total annual fund operating expenses do not exceed 0.93% and 0.68% for the Class A shares and Class I shares, respectively. Prior to January 1, 2025, the Fund’s contractual expense limitations were 1.15% and 0.90% for the Class A shares and Class I shares, respectively. The Fund changed it's fiscal year end to May 31. |
| C000224841 |
|
| Shareholder Report [Line Items] |
|
| Fund Name |
North Square Tactical Defensive Fund
|
| Class Name |
Class A
|
| Trading Symbol |
ETFRX
|
| Shareholder Report Annual or Semi-Annual |
Annual Shareholder Report
|
| Additional Information Phone Number |
1-855-551-5521
|
| Additional Information Website |
https://northsquareinvest.com/fund-reports-holdings-2/
|
| Expenses [Text Block] |
What were the Fund’s costs for the last year?(based on a hypothetical $10,000 investment) Class Name | Costs of a $10,000 investment | Costs paid as a percentage of a $10,000 investment |
|---|
Class A | $193 | 1.95% |
|---|
|
| Expenses Paid, Amount |
$ 193
|
| Expense Ratio, Percent |
1.95%
|
| Performance Past Does Not Indicate Future [Text] |
The Fund's past performance is not a good predictor of how the Fund will perform in the future.
|
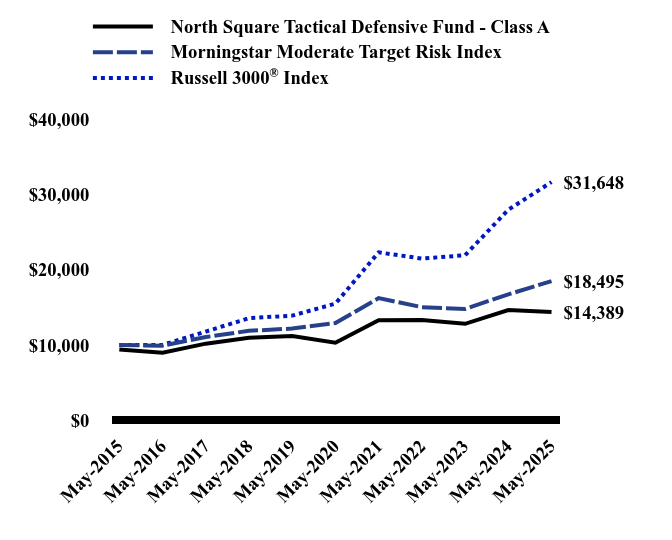
| Line Graph [Table Text Block] |
| North Square Tactical Defensive Fund - Class A | Morningstar Moderate Target Risk Index | Russell 3000® Index |
|---|
May-2015 | $9,426 | $10,000 | $10,000 |
|---|
May-2016 | $8,973 | $9,926 | $10,022 |
|---|
May-2017 | $10,188 | $11,064 | $11,795 |
|---|
May-2018 | $10,980 | $11,893 | $13,572 |
|---|
May-2019 | $11,195 | $12,192 | $13,911 |
|---|
May-2020 | $10,317 | $12,932 | $15,505 |
|---|
May-2021 | $13,301 | $16,235 | $22,314 |
|---|
May-2022 | $13,343 | $15,030 | $21,492 |
|---|
May-2023 | $12,819 | $14,798 | $21,929 |
|---|
May-2024 | $14,648 | $16,735 | $27,978 |
|---|
May-2025 | $14,389 | $18,495 | $31,648 |
|---|
|
| Average Annual Return [Table Text Block] |
| 1 Year | 5 Years | 10 Years |
|---|
North Square Tactical Defensive Fund - Class A | | | |
|---|
Without Load | -1.77% | 6.88% | 4.32% |
|---|
With Load | -7.39% | 5.62% | 3.71% |
|---|
Morningstar Moderate Target Risk Index | 10.52% | 7.42% | 6.34% |
|---|
Russell 3000® Index | 13.12% | 15.34% | 12.21% |
|---|
|
| No Deduction of Taxes [Text Block] |
The graph and table do not reflect the deduction of taxes that a shareholder would pay on Fund distributions or redemption of Fund shares.
|
| AssetsNet |
$ 50,605,005
|
| Holdings Count | Holding |
3
|
| Advisory Fees Paid, Amount |
$ 645,278
|
| InvestmentCompanyPortfolioTurnover |
225.00%
|
| Additional Fund Statistics [Text Block] |
- Net Assets$50,605,005
- Number of Portfolio Holdings3
- Advisory Fee (net of waivers)$645,278
- Portfolio Turnover225%
|
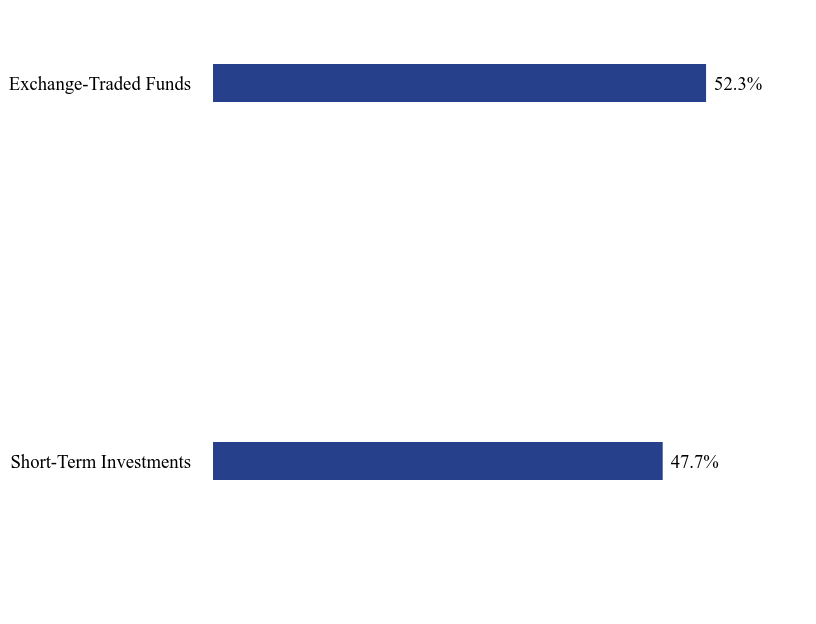
| Holdings [Text Block] |
Composition of Net Assets (% of net assets)Value | Value |
|---|
Short-Term Investments | 47.7% | Exchange-Traded Funds | 52.3% |
Top Holdings (% of net assets)Holding Name | % of Net Assets |
|---|
First American Treasury Government Obligations Fund, Class X | 47.7% |
|---|
Invesco QQQ Trust, Series 1 | 26.6% |
|---|
SPDR® S&P 500® ETF Trust | 25.7% |
|---|
|
| Material Fund Change [Text Block] |
This is a summary of certain changes to the Fund since June 1, 2024. For more complete information you may review the Fund's current prospectus, dated September 27, 2024, as supplemented on December 20, 2024, which is available upon request at 1-855-551-5521 or on the Fund's website at https://northsquareinvest.com/fund-reports-holdings-2/. Effective December 20, 2024, pursuant to a novation of the Sub-Advisory Agreement between North Square Investments, LLC and NSI Retail Advisors, LLC (“NSI Retail”) with respect to the Fund, CSM Advisors, LLC (“CSM”), an affiliate of NSI Retail, became the investment sub-adviser to the Fund and is responsible for its day-to-day portfolio management. The novation of the Sub-Advisory Agreement occurred in connection with an internal restructuring of NSI Retail and did not result in any changes to: (i) the level of sub-advisory services provided to the Fund; (ii) the manner in which the Fund is managed or operated; (iii) the personnel who are responsible for providing sub-advisory services to the Fund, including the portfolio managers; or (iv) the terms of the Sub-Advisory Agreement, including the compensation paid to the Fund's sub-adviser. |
| C000224840 |
|
| Shareholder Report [Line Items] |
|
| Fund Name |
North Square Tactical Defensive Fund
|
| Class Name |
Class C
|
| Trading Symbol |
ETFZX
|
| Shareholder Report Annual or Semi-Annual |
Annual Shareholder Report
|
| Additional Information Phone Number |
1-855-551-5521
|
| Additional Information Website |
https://northsquareinvest.com/fund-reports-holdings-2/
|
| Expenses [Text Block] |
What were the Fund’s costs for the last year?(based on a hypothetical $10,000 investment) Class Name | Costs of a $10,000 investment | Costs paid as a percentage of a $10,000 investment |
|---|
Class C | $266 | 2.70% |
|---|
|
| Expenses Paid, Amount |
$ 266
|
| Expense Ratio, Percent |
2.70%
|
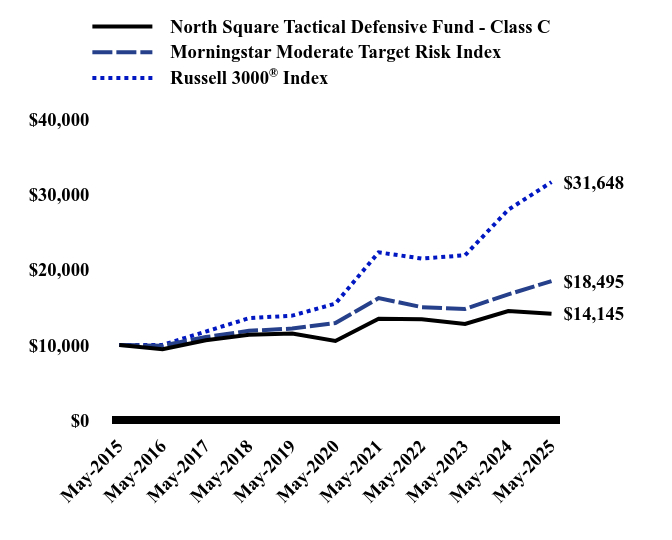
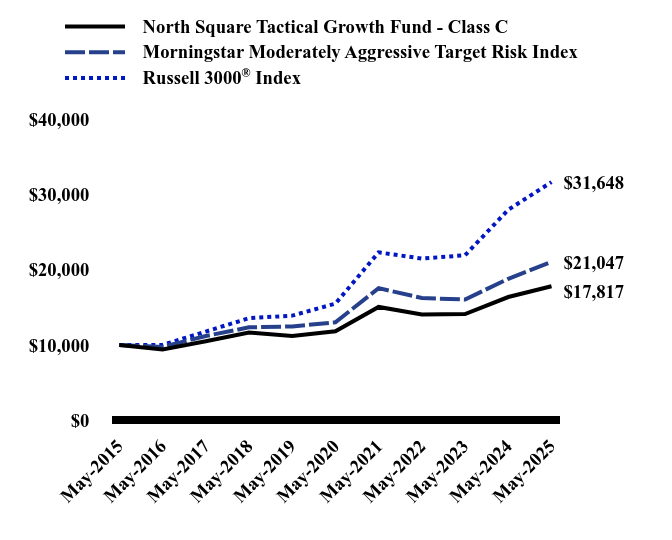
| Performance Past Does Not Indicate Future [Text] |
The Fund's past performance is not a good predictor of how the Fund will perform in the future.
|
| Line Graph [Table Text Block] |
| North Square Tactical Defensive Fund - Class C | Morningstar Moderate Target Risk Index | Russell 3000® Index |
|---|
May-2015 | $10,000 | $10,000 | $10,000 |
|---|
May-2016 | $9,444 | $9,926 | $10,022 |
|---|
May-2017 | $10,642 | $11,064 | $11,795 |
|---|
May-2018 | $11,384 | $11,893 | $13,572 |
|---|
May-2019 | $11,522 | $12,192 | $13,911 |
|---|
May-2020 | $10,538 | $12,932 | $15,505 |
|---|
May-2021 | $13,487 | $16,235 | $22,314 |
|---|
May-2022 | $13,423 | $15,030 | $21,492 |
|---|
May-2023 | $12,794 | $14,798 | $21,929 |
|---|
May-2024 | $14,513 | $16,735 | $27,978 |
|---|
May-2025 | $14,145 | $18,495 | $31,648 |
|---|
|
| Average Annual Return [Table Text Block] |
| 1 Year | 5 Years | 10 Years |
|---|
North Square Tactical Defensive Fund - Class C | | | |
|---|
Without Load | -2.54% | 6.06% | 3.53% |
|---|
With Load | -3.51% | 6.06% | 3.53% |
|---|
Morningstar Moderate Target Risk Index | 10.52% | 7.42% | 6.34% |
|---|
Russell 3000® Index | 13.12% | 15.34% | 12.21% |
|---|
|
| No Deduction of Taxes [Text Block] |
The graph and table do not reflect the deduction of taxes that a shareholder would pay on Fund distributions or redemption of Fund shares.
|
| AssetsNet |
$ 50,605,005
|
| Holdings Count | Holding |
3
|
| Advisory Fees Paid, Amount |
$ 645,278
|
| InvestmentCompanyPortfolioTurnover |
225.00%
|
| Additional Fund Statistics [Text Block] |
- Net Assets$50,605,005
- Number of Portfolio Holdings3
- Advisory Fee (net of waivers)$645,278
- Portfolio Turnover225%
|
| Holdings [Text Block] |
Composition of Net Assets (% of net assets)Value | Value |
|---|
Short-Term Investments | 47.7% | Exchange-Traded Funds | 52.3% |
Top Holdings (% of net assets)Holding Name | % of Net Assets |
|---|
First American Treasury Government Obligations Fund, Class X | 47.7% |
|---|
Invesco QQQ Trust, Series 1 | 26.6% |
|---|
SPDR® S&P 500® ETF Trust | 25.7% |
|---|
|
| Material Fund Change [Text Block] |
This is a summary of certain changes to the Fund since June 1, 2024. For more complete information you may review the Fund's current prospectus, dated September 27, 2024, as supplemented on December 20, 2024, which is available upon request at 1-855-551-5521 or on the Fund's website at https://northsquareinvest.com/fund-reports-holdings-2/. Effective December 20, 2024, pursuant to a novation of the Sub-Advisory Agreement between North Square Investments, LLC and NSI Retail Advisors, LLC (“NSI Retail”) with respect to the Fund, CSM Advisors, LLC (“CSM”), an affiliate of NSI Retail, became the investment sub-adviser to the Fund and is responsible for its day-to-day portfolio management. The novation of the Sub-Advisory Agreement occurred in connection with an internal restructuring of NSI Retail and did not result in any changes to: (i) the level of sub-advisory services provided to the Fund; (ii) the manner in which the Fund is managed or operated; (iii) the personnel who are responsible for providing sub-advisory services to the Fund, including the portfolio managers; or (iv) the terms of the Sub-Advisory Agreement, including the compensation paid to the Fund's sub-adviser. |
| C000224839 |
|
| Shareholder Report [Line Items] |
|
| Fund Name |
North Square Tactical Defensive Fund
|
| Class Name |
Class I
|
| Trading Symbol |
ETFWX
|
| Shareholder Report Annual or Semi-Annual |
Annual Shareholder Report
|
| Additional Information Phone Number |
1-855-551-5521
|
| Additional Information Website |
https://northsquareinvest.com/fund-reports-holdings-2/
|
| Expenses [Text Block] |
What were the Fund’s costs for the last year?(based on a hypothetical $10,000 investment) Class Name | Costs of a $10,000 investment | Costs paid as a percentage of a $10,000 investment |
|---|
Class I | $169 | 1.70% |
|---|
|
| Expenses Paid, Amount |
$ 169
|
| Expense Ratio, Percent |
1.70%
|
| Performance Past Does Not Indicate Future [Text] |
The Fund's past performance is not a good predictor of how the Fund will perform in the future.
|
| Line Graph [Table Text Block] |
| North Square Tactical Defensive Fund - Class I | Morningstar Moderate Target Risk Index | Russell 3000® Index |
|---|
May-2015 | $1,000,000 | $1,000,000 | $1,000,000 |
|---|
May-2016 | $954,160 | $992,648 | $1,002,233 |
|---|
May-2017 | $1,085,856 | $1,106,378 | $1,179,539 |
|---|
May-2018 | $1,173,031 | $1,189,289 | $1,357,195 |
|---|
May-2019 | $1,198,230 | $1,219,209 | $1,391,074 |
|---|
May-2020 | $1,107,060 | $1,293,192 | $1,550,539 |
|---|
May-2021 | $1,429,844 | $1,623,523 | $2,231,406 |
|---|
May-2022 | $1,436,823 | $1,502,987 | $2,149,203 |
|---|
May-2023 | $1,383,607 | $1,479,826 | $2,192,933 |
|---|
May-2024 | $1,585,129 | $1,673,529 | $2,797,809 |
|---|
May-2025 | $1,560,387 | $1,849,512 | $3,164,835 |
|---|
|
| Average Annual Return [Table Text Block] |
| 1 Year | 5 Years | 10 Years |
|---|
North Square Tactical Defensive Fund - Class I | -1.56% | 7.11% | 4.55% |
|---|
Morningstar Moderate Target Risk Index | 10.52% | 7.42% | 6.34% |
|---|
Russell 3000® Index | 13.12% | 15.34% | 12.21% |
|---|
|
| No Deduction of Taxes [Text Block] |
The graph and table do not reflect the deduction of taxes that a shareholder would pay on Fund distributions or redemption of Fund shares.
|
| AssetsNet |
$ 50,605,005
|
| Holdings Count | Holding |
3
|
| Advisory Fees Paid, Amount |
$ 645,278
|
| InvestmentCompanyPortfolioTurnover |
225.00%
|
| Additional Fund Statistics [Text Block] |
- Net Assets$50,605,005
- Number of Portfolio Holdings3
- Advisory Fee (net of waivers)$645,278
- Portfolio Turnover225%
|
| Holdings [Text Block] |
Composition of Net Assets (% of net assets)Value | Value |
|---|
Short-Term Investments | 47.7% | Exchange-Traded Funds | 52.3% |
Top Holdings (% of net assets)Holding Name | % of Net Assets |
|---|
First American Treasury Government Obligations Fund, Class X | 47.7% |
|---|
Invesco QQQ Trust, Series 1 | 26.6% |
|---|
SPDR® S&P 500® ETF Trust | 25.7% |
|---|
|
| Material Fund Change [Text Block] |
This is a summary of certain changes to the Fund since June 1, 2024. For more complete information you may review the Fund's current prospectus, dated September 27, 2024, as supplemented on December 20, 2024, which is available upon request at 1-855-551-5521 or on the Fund's website at https://northsquareinvest.com/fund-reports-holdings-2/. Effective December 20, 2024, pursuant to a novation of the Sub-Advisory Agreement between North Square Investments, LLC and NSI Retail Advisors, LLC (“NSI Retail”) with respect to the Fund, CSM Advisors, LLC (“CSM”), an affiliate of NSI Retail, became the investment sub-adviser to the Fund and is responsible for its day-to-day portfolio management. The novation of the Sub-Advisory Agreement occurred in connection with an internal restructuring of NSI Retail and did not result in any changes to: (i) the level of sub-advisory services provided to the Fund; (ii) the manner in which the Fund is managed or operated; (iii) the personnel who are responsible for providing sub-advisory services to the Fund, including the portfolio managers; or (iv) the terms of the Sub-Advisory Agreement, including the compensation paid to the Fund's sub-adviser. |
| C000224838 |
|
| Shareholder Report [Line Items] |
|
| Fund Name |
North Square Tactical Growth Fund
|
| Class Name |
Class A
|
| Trading Symbol |
ETFAX
|
| Shareholder Report Annual or Semi-Annual |
Annual Shareholder Report
|
| Additional Information Phone Number |
1-855-551-5521
|
| Additional Information Website |
https://northsquareinvest.com/fund-reports-holdings-2/
|
| Expenses [Text Block] |
What were the Fund’s costs for the last year?(based on a hypothetical $10,000 investment) Class Name | Costs of a $10,000 investment | Costs paid as a percentage of a $10,000 investment |
|---|
Class A | $162 | 1.55% |
|---|
|
| Expenses Paid, Amount |
$ 162
|
| Expense Ratio, Percent |
1.55%
|
| Performance Past Does Not Indicate Future [Text] |
The Fund's past performance is not a good predictor of how the Fund will perform in the future.
|
| Line Graph [Table Text Block] |
| North Square Tactical Growth Fund - Class A | Morningstar Moderately Aggressive Target Risk Index | Russell 3000® Index |
|---|
May-2015 | $9,421 | $10,000 | $10,000 |
|---|
May-2016 | $8,932 | $9,750 | $10,022 |
|---|
May-2017 | $10,047 | $11,203 | $11,795 |
|---|
May-2018 | $11,232 | $12,351 | $13,572 |
|---|
May-2019 | $10,870 | $12,472 | $13,911 |
|---|
May-2020 | $11,580 | $13,029 | $15,505 |
|---|
May-2021 | $14,855 | $17,558 | $22,314 |
|---|
May-2022 | $13,977 | $16,252 | $21,492 |
|---|
May-2023 | $14,123 | $16,048 | $21,929 |
|---|
May-2024 | $16,523 | $18,799 | $27,978 |
|---|
May-2025 | $18,102 | $21,047 | $31,648 |
|---|
|
| Average Annual Return [Table Text Block] |
| 1 Year | 5 Years | 10 Years |
|---|
North Square Tactical Growth Fund - Class A | | | |
|---|
Without Load | 9.56% | 9.35% | 6.75% |
|---|
With Load | 3.28% | 8.06% | 6.11% |
|---|
Morningstar Moderately Aggressive Target Risk Index | 11.96% | 10.07% | 7.73% |
|---|
Russell 3000® Index | 13.12% | 15.34% | 12.21% |
|---|
|
| No Deduction of Taxes [Text Block] |
The graph and table do not reflect the deduction of taxes that a shareholder would pay on Fund distributions or redemption of Fund shares.
|
| AssetsNet |
$ 531,865,371
|
| Holdings Count | Holding |
9
|
| Advisory Fees Paid, Amount |
$ 5,519,512
|
| InvestmentCompanyPortfolioTurnover |
47.00%
|
| Additional Fund Statistics [Text Block] |
- Net Assets$531,865,371
- Number of Portfolio Holdings9
- Advisory Fee (net of waivers)$5,519,512
- Portfolio Turnover47%
|
| Holdings [Text Block] |
Composition of Net Assets (% of net assets)Value | Value |
|---|
Liabilities in Excess of Other Assets | -0.1% | Short-Term Investments | 16.5% | Exchange-Traded Funds | 83.6% |
Top Holdings (% of net assets)Holding Name | % of Net Assets |
|---|
First American Treasury Government Obligations Fund, Class X | 16.5% |
|---|
Vanguard Growth ETF | 15.1% |
|---|
Invesco QQQ Trust, Series 1 | 14.9% |
|---|
SPDR® S&P 500® ETF Trust | 14.4% |
|---|
Vanguard Value ETF | 11.4% |
|---|
iShares® 3-7 Year Treasury Bond ETF | 9.4% |
|---|
iShares® MSCI Eurozone ETF | 8.0% |
|---|
Financial Select Sector SPDR® Fund | 6.6% |
|---|
VanEck Gold Miners ETF | 3.8% |
|---|
|
| C000224836 |
|
| Shareholder Report [Line Items] |
|
| Fund Name |
North Square Tactical Growth Fund
|
| Class Name |
Class C
|
| Trading Symbol |
ETFCX
|
| Shareholder Report Annual or Semi-Annual |
Annual Shareholder Report
|
| Additional Information Phone Number |
1-855-551-5521
|
| Additional Information Website |
https://northsquareinvest.com/fund-reports-holdings-2/
|
| Expenses [Text Block] |
What were the Fund’s costs for the last year?(based on a hypothetical $10,000 investment) Class Name | Costs of a $10,000 investment | Costs paid as a percentage of a $10,000 investment |
|---|
Class C | $240 | 2.30% |
|---|
|
| Expenses Paid, Amount |
$ 240
|
| Expense Ratio, Percent |
2.30%
|
| Performance Past Does Not Indicate Future [Text] |
The Fund's past performance is not a good predictor of how the Fund will perform in the
future.
|
| Line Graph [Table Text Block] |
| North Square Tactical Growth Fund - Class C | Morningstar Moderately Aggressive Target Risk Index | Russell 3000® Index |
|---|
May-2015 | $10,000 | $10,000 | $10,000 |
|---|
May-2016 | $9,407 | $9,750 | $10,022 |
|---|
May-2017 | $10,502 | $11,203 | $11,795 |
|---|
May-2018 | $11,656 | $12,351 | $13,572 |
|---|
May-2019 | $11,199 | $12,472 | $13,911 |
|---|
May-2020 | $11,841 | $13,029 | $15,505 |
|---|
May-2021 | $15,064 | $17,558 | $22,314 |
|---|
May-2022 | $14,067 | $16,252 | $21,492 |
|---|
May-2023 | $14,110 | $16,048 | $21,929 |
|---|
May-2024 | $16,382 | $18,799 | $27,978 |
|---|
May-2025 | $17,817 | $21,047 | $31,648 |
|---|
|
| Average Annual Return [Table Text Block] |
| 1 Year | 5 Years | 10 Years |
|---|
North Square Tactical Growth Fund - Class C | | | |
|---|
Without Load | 8.76% | 8.51% | 5.95% |
|---|
With Load | 7.76% | 8.51% | 5.95% |
|---|
Morningstar Moderately Aggressive Target Risk Index | 11.96% | 10.07% | 7.73% |
|---|
Russell 3000® Index | 13.12% | 15.34% | 12.21% |
|---|
|
| No Deduction of Taxes [Text Block] |
The graph and table do not reflect the deduction of taxes that a shareholder would pay on Fund distributions or redemption of Fund shares.
|
| AssetsNet |
$ 531,865,371
|
| Holdings Count | Holding |
9
|
| Advisory Fees Paid, Amount |
$ 5,519,512
|
| InvestmentCompanyPortfolioTurnover |
47.00%
|
| Additional Fund Statistics [Text Block] |
- Net Assets$531,865,371
- Number of Portfolio Holdings9
- Advisory Fee (net of waivers)$5,519,512
- Portfolio Turnover47%
|
| Holdings [Text Block] |
Composition of Net Assets (% of net assets)Value | Value |
|---|
Liabilities in Excess of Other Assets | -0.1% | Short-Term Investments | 16.5% | Exchange-Traded Funds | 83.6% |
Top Holdings (% of net assets)Holding Name | % of Net Assets |
|---|
First American Treasury Government Obligations Fund, Class X | 16.5% |
|---|
Vanguard Growth ETF | 15.1% |
|---|
Invesco QQQ Trust, Series 1 | 14.9% |
|---|
SPDR® S&P 500® ETF Trust | 14.4% |
|---|
Vanguard Value ETF | 11.4% |
|---|
iShares® 3-7 Year Treasury Bond ETF | 9.4% |
|---|
iShares® MSCI Eurozone ETF | 8.0% |
|---|
Financial Select Sector SPDR® Fund | 6.6% |
|---|
VanEck Gold Miners ETF | 3.8% |
|---|
|
| C000224837 |
|
| Shareholder Report [Line Items] |
|
| Fund Name |
North Square Tactical Growth Fund
|
| Class Name |
Class I
|
| Trading Symbol |
ETFOX
|
| Shareholder Report Annual or Semi-Annual |
Annual Shareholder Report
|
| Additional Information Phone Number |
1-855-551-5521
|
| Additional Information Website |
https://northsquareinvest.com/fund-reports-holdings-2/
|
| Expenses [Text Block] |
What were the Fund’s costs for the last year?(based on a hypothetical $10,000 investment) Class Name | Costs of a $10,000 investment | Costs paid as a percentage of a $10,000 investment |
|---|
Class I | $136 | 1.30% |
|---|
|
| Expenses Paid, Amount |
$ 136
|
| Expense Ratio, Percent |
1.30%
|
| Performance Past Does Not Indicate Future [Text] |
The Fund's past performance is not a good predictor of how the Fund will perform in the future.
|
| Line Graph [Table Text Block] |
| North Square Tactical Growth Fund - Class I | Morningstar Moderately Aggressive Target Risk Index | Russell 3000® Index |
|---|
May-2015 | $1,000,000 | $1,000,000 | $1,000,000 |
|---|
May-2016 | $950,559 | $974,991 | $1,002,233 |
|---|
May-2017 | $1,072,116 | $1,120,338 | $1,179,539 |
|---|
May-2018 | $1,201,692 | $1,235,083 | $1,357,195 |
|---|
May-2019 | $1,165,374 | $1,247,246 | $1,391,074 |
|---|
May-2020 | $1,245,574 | $1,302,937 | $1,550,539 |
|---|
May-2021 | $1,600,896 | $1,755,825 | $2,231,406 |
|---|
May-2022 | $1,509,071 | $1,625,221 | $2,149,203 |
|---|
May-2023 | $1,529,105 | $1,604,802 | $2,192,933 |
|---|
May-2024 | $1,792,883 | $1,879,925 | $2,797,809 |
|---|
May-2025 | $1,970,623 | $2,104,690 | $3,164,835 |
|---|
|
| Average Annual Return [Table Text Block] |
| 1 Year | 5 Years | 10 Years |
|---|
North Square Tactical Growth Fund - Class I | 9.91% | 9.61% | 7.02% |
|---|
Morningstar Moderately Aggressive Target Risk Index | 11.96% | 10.07% | 7.73% |
|---|
Russell 3000® Index | 13.12% | 15.34% | 12.21% |
|---|
|
| No Deduction of Taxes [Text Block] |
The graph and table do not reflect the deduction of taxes that a shareholder would pay on Fund distributions or redemption of Fund shares.
|
| AssetsNet |
$ 531,865,371
|
| Holdings Count | Holding |
9
|
| Advisory Fees Paid, Amount |
$ 5,519,512
|
| InvestmentCompanyPortfolioTurnover |
47.00%
|
| Additional Fund Statistics [Text Block] |
- Net Assets$531,865,371
- Number of Portfolio Holdings9
- Advisory Fee (net of waivers)$5,519,512
- Portfolio Turnover47%
|
| Holdings [Text Block] |
Composition of Net Assets (% of net assets)Value | Value |
|---|
Liabilities in Excess of Other Assets | -0.1% | Short-Term Investments | 16.5% | Exchange-Traded Funds | 83.6% |
Top Holdings (% of net assets)Holding Name | % of Net Assets |
|---|
First American Treasury Government Obligations Fund, Class X | 16.5% |
|---|
Vanguard Growth ETF | 15.1% |
|---|
Invesco QQQ Trust, Series 1 | 14.9% |
|---|
SPDR® S&P 500® ETF Trust | 14.4% |
|---|
Vanguard Value ETF | 11.4% |
|---|
iShares® 3-7 Year Treasury Bond ETF | 9.4% |
|---|
iShares® MSCI Eurozone ETF | 8.0% |
|---|
Financial Select Sector SPDR® Fund | 6.6% |
|---|
VanEck Gold Miners ETF | 3.8% |
|---|
|