| Q2 2025 SUPPLEMENTAL |

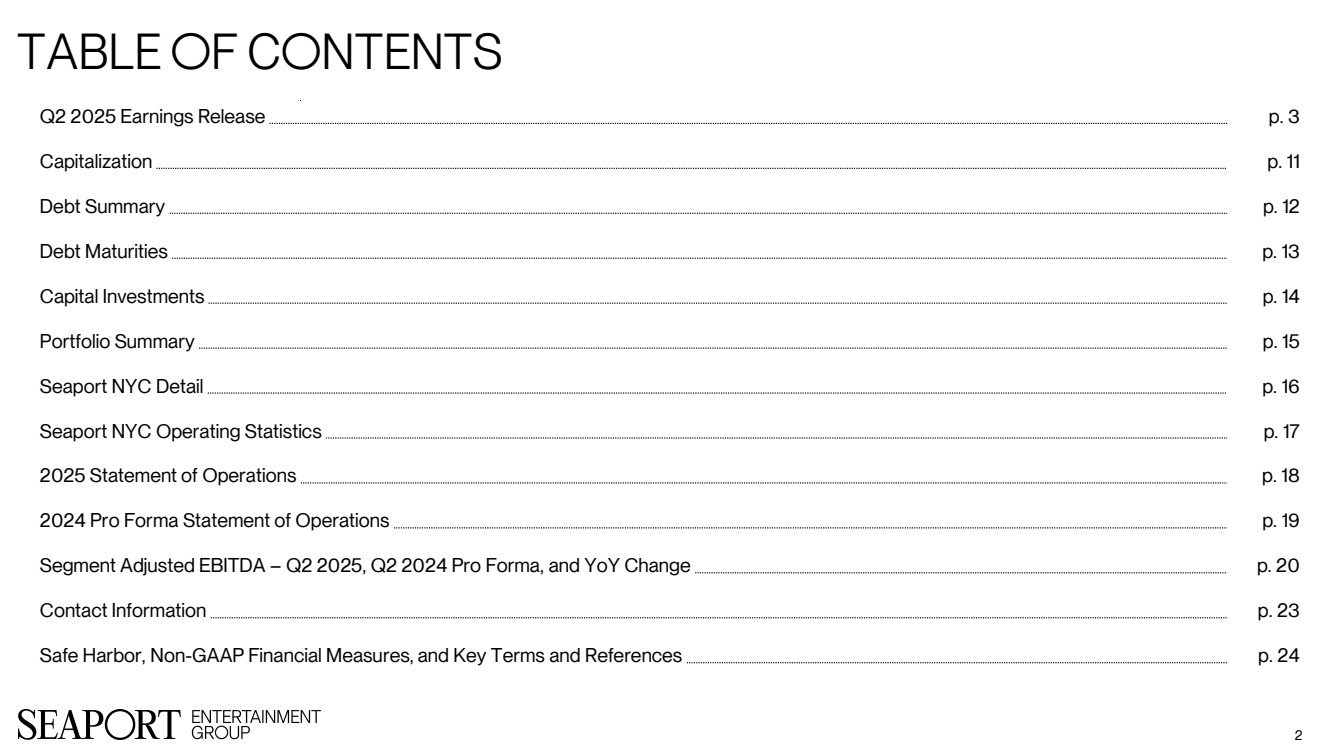
| Table of Contents 2 Q2 2025 Earnings Release p. 3 Capitalization p. 11 Debt Summary p. 12 Debt Maturities p. 13 Capital Investments p. 14 Portfolio Summary p. 15 Seaport NYC Detail p. 16 Seaport NYC Operating Statistics p. 17 2025 Statement of Operations p. 18 2024 Pro Forma Statement of Operations p. 19 Segment Adjusted EBITDA – Q2 2025, Q2 2024 Pro Forma, and YoY Change p. 20 Contact Information p. 23 Safe Harbor, Non-GAAP Financial Measures, and Key Terms and References p. 24 |
| SEAPORT ENTERTAINMENT GROUP REPORTS SECOND QUARTER 2025 RESULTS NEW YORK, NY, August 11, 2025 – Seaport Entertainment Group Inc. (NYSE: SEG) (“Seaport Entertainment Group,” “SEG”, “we,” “our," or the “Company”) announced today its operating and financial results for the quarter ended June 30, 2025. “In just our first year as a standalone publicly traded company, we’ve made tremendous progress in establishing a strong foundation for success and future growth. I’m proud of our team’s relentless focus and execution as we create unforgettable experiences for our guests at the Seaport and Las Vegas Ballpark,” said Anton Nikodemus, Chairman, President and Chief Executive Officer of Seaport Entertainment Group. “I’m optimistic that the year-over-year gains we achieved in the second quarter across all lines of business will carry into the third quarter, fueled by the strength of the Seaport Concert Series on The Rooftop at Pier 17, continued diversification and optimization of our hospitality offerings, execution of our broader real estate strategy at the Seaport, and the Las Vegas Aviators’ push for a September playoff run. Our progress is building, our opportunities are growing, and we believe we are on track to deliver long-term value for our stakeholders.” Select Second Quarter 2025 Results ▪ Net Loss of ($14.8) million, or ($1.16) per basic and diluted share attributable to common stockholders. ▪ Non-GAAP Adjusted Net Loss Attributable to Common Stockholders of ($7.4) million, or ($0.58) per basic and diluted share. ▪ Announced the exploration of strategic alternatives for the Company’s 250 Water Street development site. ▪ Signed a 4,478 square foot long-term lease with Willett’s NYC, a café, tavern, and whiskey and cocktail bar reminiscent of “Old New York,” and a 1,442 square foot long-term lease with Cork Wine Bar, both in the historic Cobblestones area of the Seaport neighborhood. ▪ Nike exercised an early termination right related to their office space at Pier 17. As part of the termination agreement, the Company received half of the termination payment in Q2 2025, with the remaining balance of the termination payment due at the end of the revised lease term in 2027. ▪ Completed the Company’s corporate restructuring in partnership with Jean-Georges Restaurants, collapsing the Tin Building joint venture and various management agreement structures, while converting the Tin Building by Jean-Georges and The Fulton management agreements into new Jean-Georges Restaurants license agreements. ▪ Uplisted to the NYSE from the NYSE American and added to the Russell 2000 Index and Russell Microcap Index. Select Year-to-Date 2025 Results ▪ Net Loss of ($46.7) million, or ($3.68) per basic and diluted share attributable to common stockholders. ▪ Non-GAAP Adjusted Net Loss Attributable to Common Stockholders of ($30.2) million, or ($2.38) per basic and diluted share. ▪ Hired and onboarded employees of Creative Culinary Management Company LLC (“CCMC”), an indirect wholly owned subsidiary of Jean-Georges Restaurants, to internalize food and beverage operations at most of the Company’s wholly owned and joint venture-owned restaurants in the Seaport. |
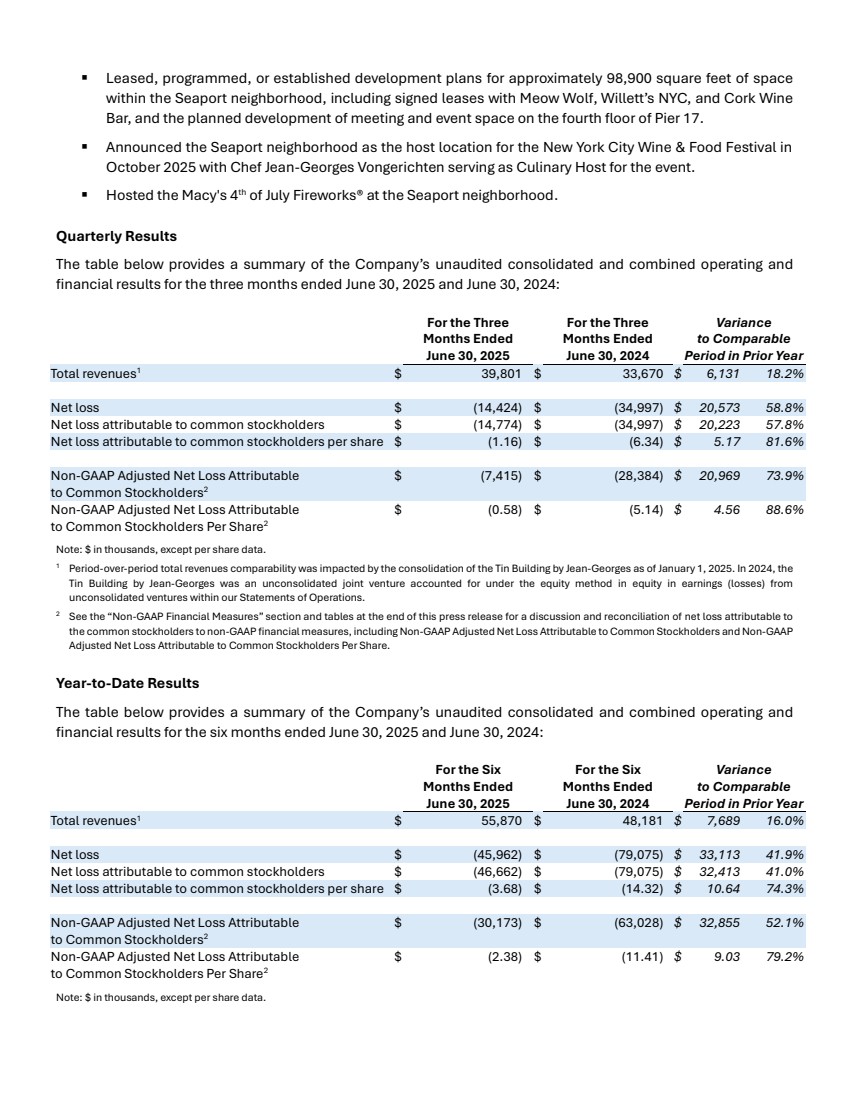
| ▪ Leased, programmed, or established development plans for approximately 98,900 square feet of space within the Seaport neighborhood, including signed leases with Meow Wolf, Willett’s NYC, and Cork Wine Bar, and the planned development of meeting and event space on the fourth floor of Pier 17. ▪ Announced the Seaport neighborhood as the host location for the New York City Wine & Food Festival in October 2025 with Chef Jean-Georges Vongerichten serving as Culinary Host for the event. ▪ Hosted the Macy's 4th of July Fireworks® at the Seaport neighborhood. Quarterly Results The table below provides a summary of the Company’s unaudited consolidated and combined operating and financial results for the three months ended June 30, 2025 and June 30, 2024: For the Three Months Ended June 30, 2025 For the Three Months Ended June 30, 2024 Variance to Comparable Period in Prior Year Total revenues1 $ 39,801 $ 33,670 $ 6,131 18.2% Net loss $ (14,424) $ (34,997) $ 20,573 58.8% Net loss attributable to common stockholders $ (14,774) $ (34,997) $ 20,223 57.8% Net loss attributable to common stockholders per share $ (1.16) $ (6.34) $ 5.17 81.6% Non-GAAP Adjusted Net Loss Attributable to Common Stockholders2 $ (7,415) $ (28,384) $ 20,969 73.9% Non-GAAP Adjusted Net Loss Attributable to Common Stockholders Per Share2 $ (0.58) $ (5.14) $ 4.56 88.6% Note: $ in thousands, except per share data. 1 Period-over-period total revenues comparability was impacted by the consolidation of the Tin Building by Jean-Georges as of January 1, 2025. In 2024, the Tin Building by Jean-Georges was an unconsolidated joint venture accounted for under the equity method in equity in earnings (losses) from unconsolidated ventures within our Statements of Operations. 2 See the “Non-GAAP Financial Measures” section and tables at the end of this press release for a discussion and reconciliation of net loss attributable to the common stockholders to non-GAAP financial measures, including Non-GAAP Adjusted Net Loss Attributable to Common Stockholders and Non-GAAP Adjusted Net Loss Attributable to Common Stockholders Per Share. Year-to-Date Results The table below provides a summary of the Company’s unaudited consolidated and combined operating and financial results for the six months ended June 30, 2025 and June 30, 2024: For the Six Months Ended June 30, 2025 For the Six Months Ended June 30, 2024 Variance to Comparable Period in Prior Year Total revenues1 $ 55,870 $ 48,181 $ 7,689 16.0% Net loss $ (45,962) $ (79,075) $ 33,113 41.9% Net loss attributable to common stockholders $ (46,662) $ (79,075) $ 32,413 41.0% Net loss attributable to common stockholders per share $ (3.68) $ (14.32) $ 10.64 74.3% Non-GAAP Adjusted Net Loss Attributable to Common Stockholders2 $ (30,173) $ (63,028) $ 32,855 52.1% Non-GAAP Adjusted Net Loss Attributable to Common Stockholders Per Share2 $ (2.38) $ (11.41) $ 9.03 79.2% Note: $ in thousands, except per share data. |
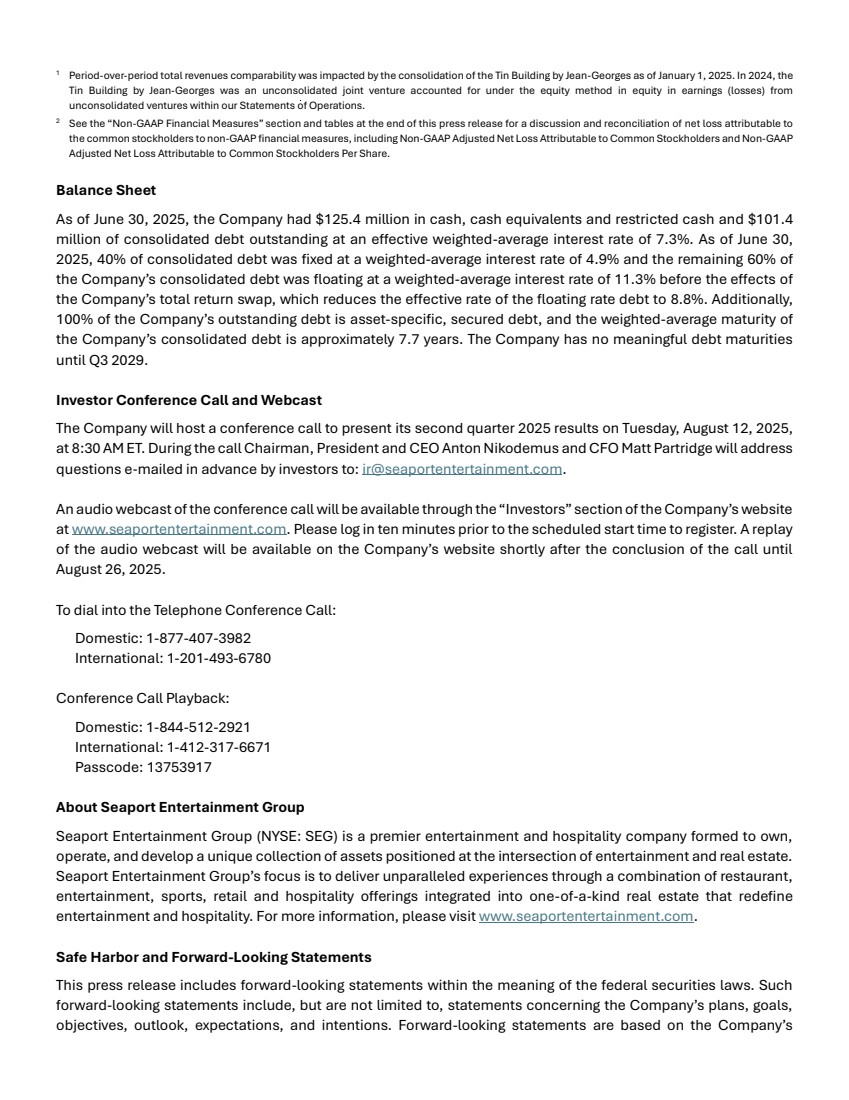
| 1 Period-over-period total revenues comparability was impacted by the consolidation of the Tin Building by Jean-Georges as of January 1, 2025. In 2024, the Tin Building by Jean-Georges was an unconsolidated joint venture accounted for under the equity method in equity in earnings (losses) from unconsolidated ventures within our Statements of Operations. 2 See the “Non-GAAP Financial Measures” section and tables at the end of this press release for a discussion and reconciliation of net loss attributable to the common stockholders to non-GAAP financial measures, including Non-GAAP Adjusted Net Loss Attributable to Common Stockholders and Non-GAAP Adjusted Net Loss Attributable to Common Stockholders Per Share. Balance Sheet As of June 30, 2025, the Company had $125.4 million in cash, cash equivalents and restricted cash and $101.4 million of consolidated debt outstanding at an effective weighted-average interest rate of 7.3%. As of June 30, 2025, 40% of consolidated debt was fixed at a weighted-average interest rate of 4.9% and the remaining 60% of the Company’s consolidated debt was floating at a weighted-average interest rate of 11.3% before the effects of the Company’s total return swap, which reduces the effective rate of the floating rate debt to 8.8%. Additionally, 100% of the Company’s outstanding debt is asset-specific, secured debt, and the weighted-average maturity of the Company’s consolidated debt is approximately 7.7 years. The Company has no meaningful debt maturities until Q3 2029. Investor Conference Call and Webcast The Company will host a conference call to present its second quarter 2025 results on Tuesday, August 12, 2025, at 8:30 AM ET. During the call Chairman, President and CEO Anton Nikodemus and CFO Matt Partridge will address questions e‐mailed in advance by investors to: ir@seaportentertainment.com. An audio webcast of the conference call will be available through the “Investors” section of the Company’s website at www.seaportentertainment.com. Please log in ten minutes prior to the scheduled start time to register. A replay of the audio webcast will be available on the Company’s website shortly after the conclusion of the call until August 26, 2025. To dial into the Telephone Conference Call: Domestic: 1-877-407-3982 International: 1-201-493-6780 Conference Call Playback: Domestic: 1-844-512-2921 International: 1-412-317-6671 Passcode: 13753917 About Seaport Entertainment Group Seaport Entertainment Group (NYSE: SEG) is a premier entertainment and hospitality company formed to own, operate, and develop a unique collection of assets positioned at the intersection of entertainment and real estate. Seaport Entertainment Group’s focus is to deliver unparalleled experiences through a combination of restaurant, entertainment, sports, retail and hospitality offerings integrated into one-of-a-kind real estate that redefine entertainment and hospitality. For more information, please visit www.seaportentertainment.com. Safe Harbor and Forward-Looking Statements This press release includes forward-looking statements within the meaning of the federal securities laws. Such forward-looking statements include, but are not limited to, statements concerning the Company’s plans, goals, objectives, outlook, expectations, and intentions. Forward-looking statements are based on the Company’s |
| current expectations and involve risks and uncertainties that could cause actual results to differ materially from those expressed or implied in such forward-looking statements. Factors that could cause the Company’s results to differ materially from current expectations include, but are not limited to: risks related to our recent separation from, and relationship with, Howard Hughes; risks related to macroeconomic conditions; risks related to the impact of tariffs and global trade disruptions on us and our tenants, including the impact on inflation, interest rates, supply chains and consumer sentiment and spending; changes in discretionary consumer spending patterns or consumer tastes or preferences; risks associated with the Company’s investments in real estate assets and trends in the real estate industry; the Company’s ability to obtain operating and development capital on favorable terms, or at all; the availability of debt and equity capital; the Company’s ability to renew its leases or re-lease available space; the Company’s ability to compete effectively; the Company’s ability to successfully identify, acquire, develop, and manage properties on terms that are favorable to it; the impact of uncertainty around, and disruptions to, the Company’s supply chain; risks related to the concentration of the Company’s properties and operations in Manhattan and the Las Vegas area; extreme weather conditions or climate change that may cause property damage or interrupt business; the impact of water and electricity shortages on the Company’s business; the contamination of the Company’s properties by hazardous or toxic substances; catastrophic events or geopolitical conditions that may disrupt the Company’s business; actual or threatened terrorist activity and other acts of violence, or the perception of a heightened threat of such events; losses that are not insured or that excess the applicable insurance limits; risks related to the disruption or failure of information technology networks and related systems – both ours and those operated and managed by third parties; regulatory and legal requirements applicable to our assets; the Company’s ability to attract and retain key personnel; the Company’s inability to control certain properties due to the joint ownership of such property and inability to successfully attract desirable strategic partners, including joint venture partners; risks related to the concentration of ownership of our common stock by Pershing Square; and the other factors detailed in the Company’s filings with the Securities and Exchange Commission (the “SEC”). Forward-looking statements speak only as of the date of this press release. The Company is under no obligation to publicly update or revise and forward-looking statements, whether as a result of new information, future events or otherwise, except as required by applicable law. Non-GAAP Financial Measures Our reported results are presented in accordance with accounting principles generally accepted in the United States of America (“GAAP”). We also disclose Non-GAAP Adjusted Net Loss Attributable to Common Stockholders and Non-GAAP Adjusted Net Loss Attributable to Common Stockholders Per Share, each of which are non-GAAP financial measures. We believe these non-GAAP financial measures are useful to investors because they provide a meaningful supplement to the Company’s operating performance and period-over-period changes without regard to certain potential distortions or certain non-cash items. Non-GAAP Adjusted Net Loss Attributable to Common Stockholders and Non-GAAP Adjusted Net Loss Attributable to Common Stockholders Per Share do not represent cash generated from operating activities and are not necessarily indicative of cash available to fund cash requirements. Accordingly, they should not be considered alternatives to net income as a performance measure or cash flows from operating activities as reported on our statement of cash flows as a liquidity measure and should be considered in addition to, and not in lieu of, GAAP financial measures. To derive Non-GAAP Adjusted Net Loss Attributable to Common Stockholders, GAAP net income (loss) attributable to common stockholders is adjusted to exclude depreciation and amortization, as well as gains and losses from the sale of assets, gains or losses on extinguishment of debt, and provision for impairment, and these adjustments include the pro rata share of such adjustments of unconsolidated subsidiaries. Additionally, adjustments are made for non-cash revenues and expenses such as straight-line rental revenue and expenses, amortization of |
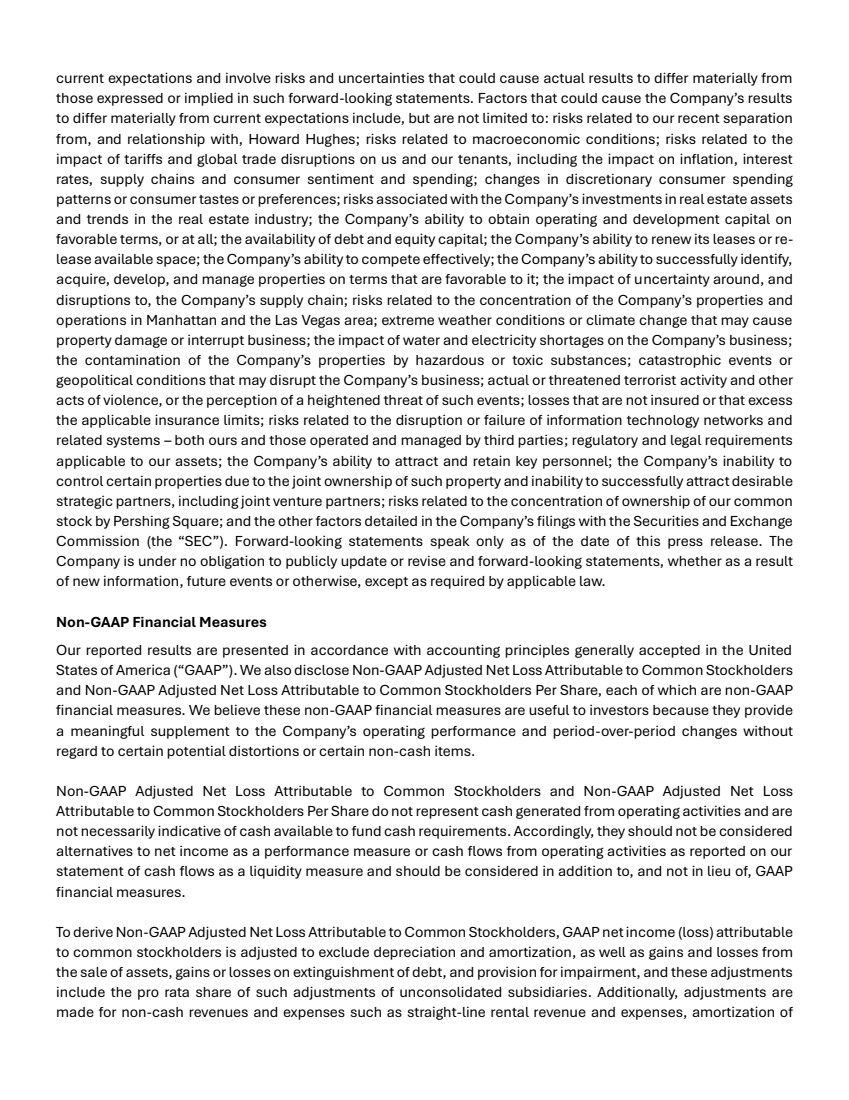
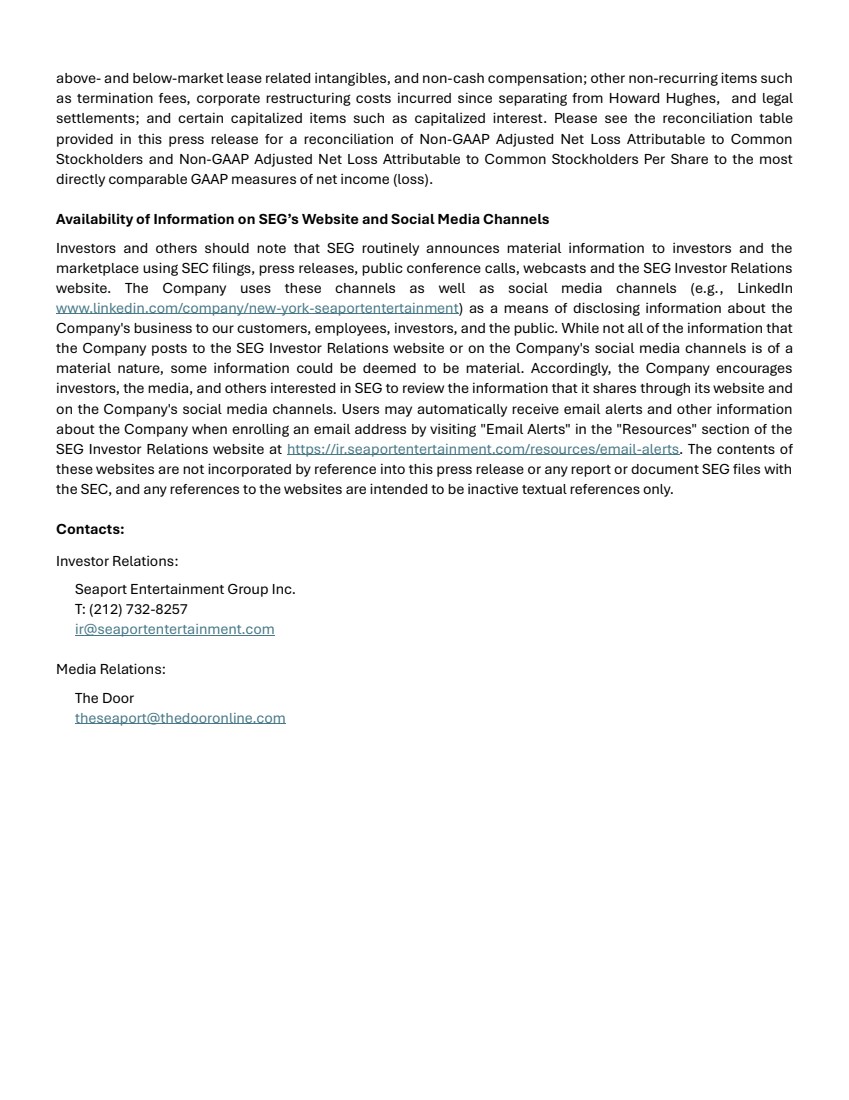
| above- and below-market lease related intangibles, and non-cash compensation; other non-recurring items such as termination fees, corporate restructuring costs incurred since separating from Howard Hughes, and legal settlements; and certain capitalized items such as capitalized interest. Please see the reconciliation table provided in this press release for a reconciliation of Non-GAAP Adjusted Net Loss Attributable to Common Stockholders and Non-GAAP Adjusted Net Loss Attributable to Common Stockholders Per Share to the most directly comparable GAAP measures of net income (loss). Availability of Information on SEG’s Website and Social Media Channels Investors and others should note that SEG routinely announces material information to investors and the marketplace using SEC filings, press releases, public conference calls, webcasts and the SEG Investor Relations website. The Company uses these channels as well as social media channels (e.g., LinkedIn www.linkedin.com/company/new-york-seaportentertainment) as a means of disclosing information about the Company's business to our customers, employees, investors, and the public. While not all of the information that the Company posts to the SEG Investor Relations website or on the Company's social media channels is of a material nature, some information could be deemed to be material. Accordingly, the Company encourages investors, the media, and others interested in SEG to review the information that it shares through its website and on the Company's social media channels. Users may automatically receive email alerts and other information about the Company when enrolling an email address by visiting "Email Alerts" in the "Resources" section of the SEG Investor Relations website at https://ir.seaportentertainment.com/resources/email-alerts. The contents of these websites are not incorporated by reference into this press release or any report or document SEG files with the SEC, and any references to the websites are intended to be inactive textual references only. Contacts: Investor Relations: Seaport Entertainment Group Inc. T: (212) 732-8257 ir@seaportentertainment.com Media Relations: The Door theseaport@thedooronline.com |
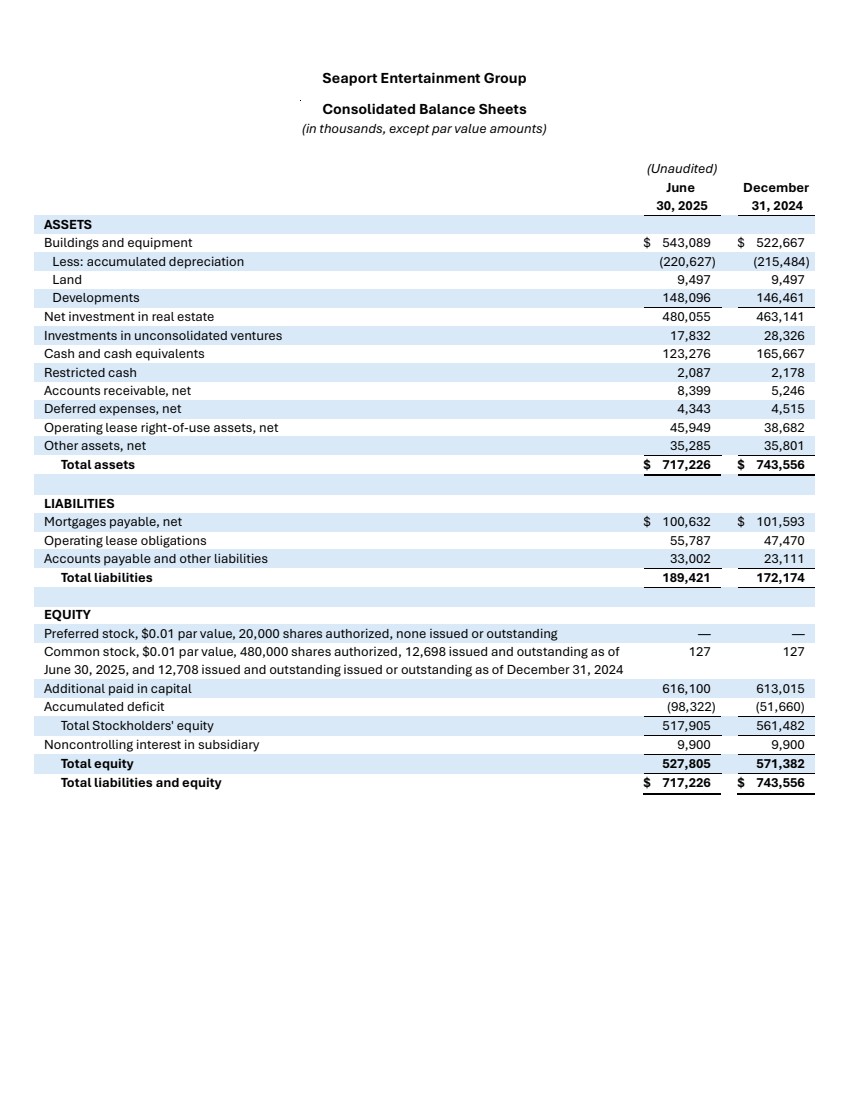
| Seaport Entertainment Group Consolidated Balance Sheets (in thousands, except par value amounts) (Unaudited) June 30, 2025 December 31, 2024 ASSETS Buildings and equipment $ 543,089 $ 522,667 Less: accumulated depreciation (220,627) (215,484) Land 9,497 9,497 Developments 148,096 146,461 Net investment in real estate 480,055 463,141 Investments in unconsolidated ventures 17,832 28,326 Cash and cash equivalents 123,276 165,667 Restricted cash 2,087 2,178 Accounts receivable, net 8,399 5,246 Deferred expenses, net 4,343 4,515 Operating lease right-of-use assets, net 45,949 38,682 Other assets, net 35,285 35,801 Total assets $ 717,226 $ 743,556 LIABILITIES Mortgages payable, net $ 100,632 $ 101,593 Operating lease obligations 55,787 47,470 Accounts payable and other liabilities 33,002 23,111 Total liabilities 189,421 172,174 EQUITY Preferred stock, $0.01 par value, 20,000 shares authorized, none issued or outstanding — — Common stock, $0.01 par value, 480,000 shares authorized, 12,698 issued and outstanding as of June 30, 2025, and 12,708 issued and outstanding issued or outstanding as of December 31, 2024 127 127 Additional paid in capital 616,100 613,015 Accumulated deficit (98,322) (51,660) Total Stockholders' equity 517,905 561,482 Noncontrolling interest in subsidiary 9,900 9,900 Total equity 527,805 571,382 Total liabilities and equity $ 717,226 $ 743,556 |
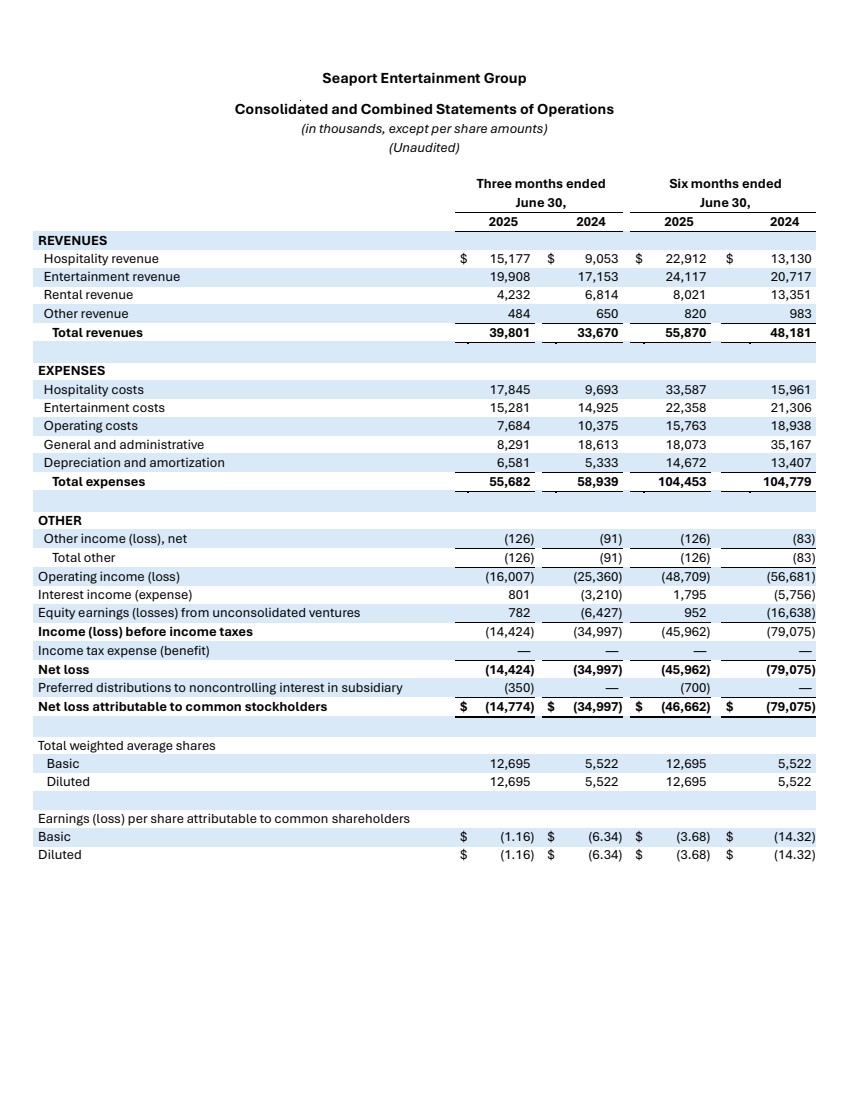
| Seaport Entertainment Group Consolidated and Combined Statements of Operations (in thousands, except per share amounts) (Unaudited) Three months ended June 30, Six months ended June 30, 2025 2024 2025 2024 REVENUES Hospitality revenue $ 15,177 $ 9,053 $ 22,912 $ 13,130 Entertainment revenue 19,908 17,153 24,117 20,717 Rental revenue 4,232 6,814 8,021 13,351 Other revenue 484 650 820 983 Total revenues 39,801 33,670 55,870 48,181 EXPENSES Hospitality costs 17,845 9,693 33,587 15,961 Entertainment costs 15,281 14,925 22,358 21,306 Operating costs 7,684 10,375 15,763 18,938 General and administrative 8,291 18,613 18,073 35,167 Depreciation and amortization 6,581 5,333 14,672 13,407 Total expenses 55,682 58,939 104,453 104,779 OTHER Other income (loss), net (126) (91) (126) (83) Total other (126) (91) (126) (83) Operating income (loss) (16,007) (25,360) (48,709) (56,681) Interest income (expense) 801 (3,210) 1,795 (5,756) Equity earnings (losses) from unconsolidated ventures 782 (6,427) 952 (16,638) Income (loss) before income taxes (14,424) (34,997) (45,962) (79,075) Income tax expense (benefit) — — — — Net loss (14,424) (34,997) (45,962) (79,075) Preferred distributions to noncontrolling interest in subsidiary (350) — (700) — Net loss attributable to common stockholders $ (14,774) $ (34,997) $ (46,662) $ (79,075) Total weighted average shares Basic 12,695 5,522 12,695 5,522 Diluted 12,695 5,522 12,695 5,522 Earnings (loss) per share attributable to common shareholders Basic $ (1.16) $ (6.34) $ (3.68) $ (14.32) Diluted $ (1.16) $ (6.34) $ (3.68) $ (14.32) |
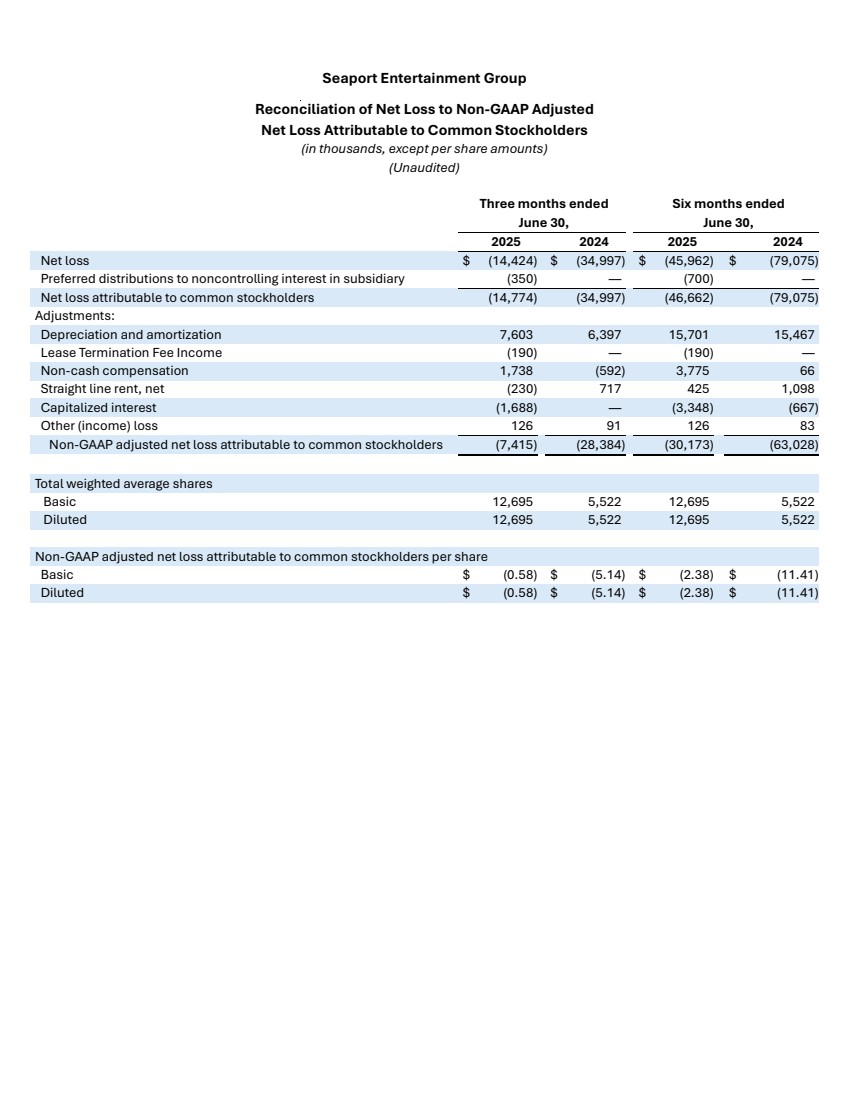
| Seaport Entertainment Group Reconciliation of Net Loss to Non-GAAP Adjusted Net Loss Attributable to Common Stockholders (in thousands, except per share amounts) (Unaudited) Three months ended June 30, Six months ended June 30, 2025 2024 2025 2024 Net loss $ (14,424) $ (34,997) $ (45,962) $ (79,075) Preferred distributions to noncontrolling interest in subsidiary (350) — (700) — Net loss attributable to common stockholders (14,774) (34,997) (46,662) (79,075) Adjustments: Depreciation and amortization 7,603 6,397 15,701 15,467 Lease Termination Fee Income (190) — (190) — Non-cash compensation 1,738 (592) 3,775 66 Straight line rent, net (230) 717 425 1,098 Capitalized interest (1,688) — (3,348) (667) Other (income) loss 126 91 126 83 Non-GAAP adjusted net loss attributable to common stockholders (7,415) (28,384) (30,173) (63,028) Total weighted average shares Basic 12,695 5,522 12,695 5,522 Diluted 12,695 5,522 12,695 5,522 Non-GAAP adjusted net loss attributable to common stockholders per share Basic $ (0.58) $ (5.14) $ (2.38) $ (11.41) Diluted $ (0.58) $ (5.14) $ (2.38) $ (11.41) |
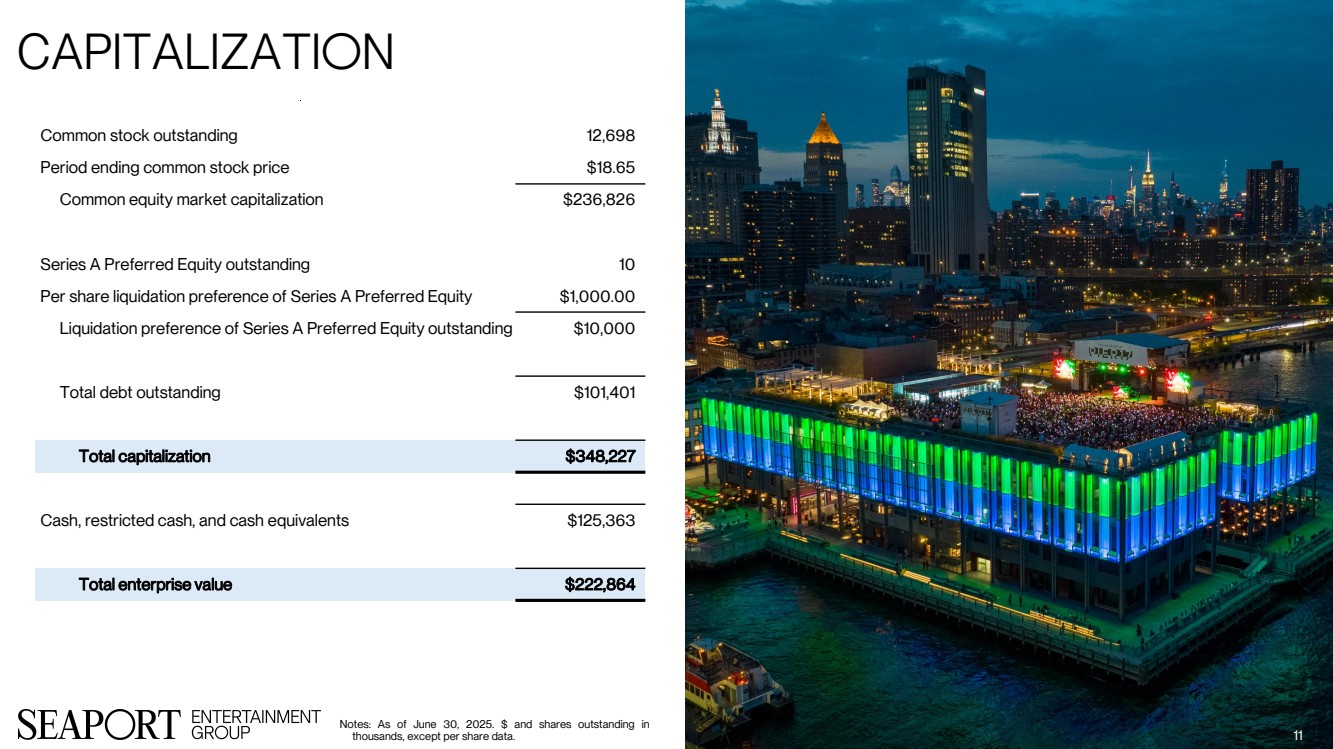
| Common stock outstanding 12,698 Period ending common stock price $18.65 Common equity market capitalization $236,826 Series A Preferred Equity outstanding 10 Per share liquidation preference of Series A Preferred Equity $1,000.00 Liquidation preference of Series A Preferred Equity outstanding $10,000 Total debt outstanding $101,401 Total capitalization $348,227 Cash, restricted cash, and cash equivalents $125,363 Total enterprise value $222,864 Capitalization 11 Notes: As of June 30, 2025. $ and shares outstanding in thousands, except per share data. |
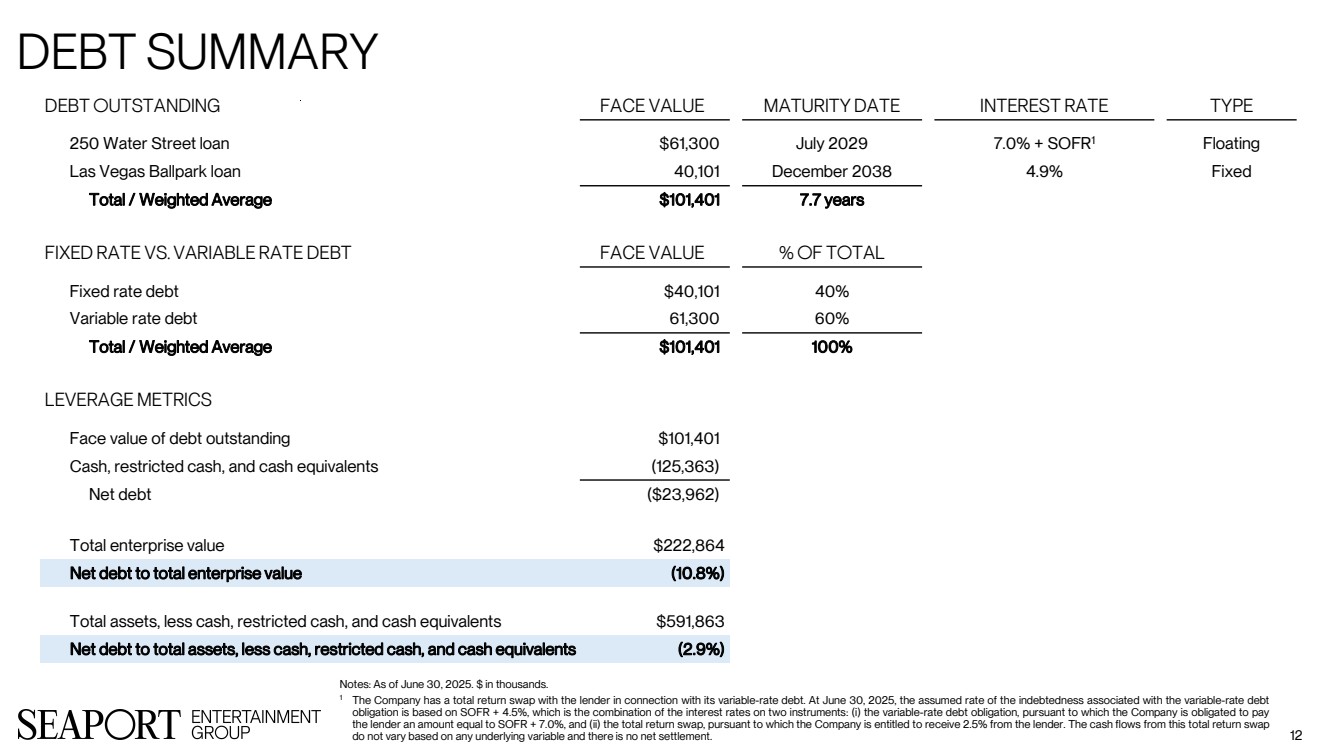
| Debt Summary 12 Debt Outstanding Face Value Maturity Date Interest Rate Type 250 Water Street loan $61,300 July 2029 7.0% + SOFR1 Floating Las Vegas Ballpark loan 40,101 December 2038 4.9% Fixed Total / Weighted Average $101,401 7.7 years Fixed Rate vs. Variable Rate Debt Face Value % of Total Fixed rate debt $40,101 40% Variable rate debt 61,300 60% Total / Weighted Average $101,401 100% Leverage Metrics Face value of debt outstanding $101,401 Cash, restricted cash, and cash equivalents (125,363) Net debt ($23,962) Total enterprise value $222,864 Net debt to total enterprise value (10.8%) Total assets, less cash, restricted cash, and cash equivalents $591,863 Net debt to total assets, less cash, restricted cash, and cash equivalents (2.9%) Notes: As of June 30, 2025. $ in thousands. 1 The Company has a total return swap with the lender in connection with its variable-rate debt. At June 30, 2025, the assumed rate of the indebtedness associated with the variable-rate debt obligation is based on SOFR + 4.5%, which is the combination of the interest rates on two instruments: (i) the variable-rate debt obligation, pursuant to which the Company is obligated to pay the lender an amount equal to SOFR + 7.0%, and (ii) the total return swap, pursuant to which the Company is entitled to receive 2.5% from the lender. The cash flows from this total return swap do not vary based on any underlying variable and there is no net settlement. |
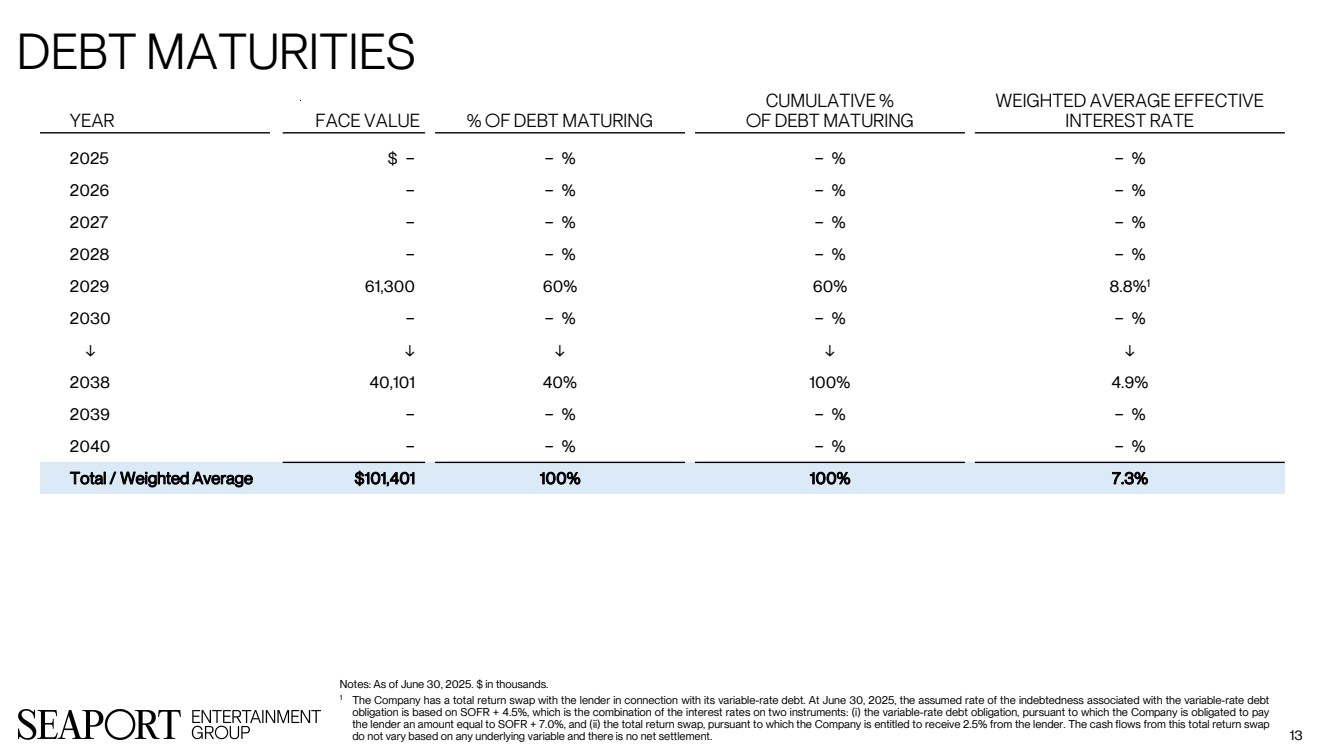
| Debt Maturities 13 Year Face Value % of Debt Maturing Cumulative % of Debt Maturing Weighted Average Effective Interest Rate 2025 $ − − % − % − % 2026 − − % − % − % 2027 − − % − % − % 2028 − − % − % − % 2029 61,300 60% 60% 8.8%1 2030 − − % − % − % ↓ ↓ ↓ ↓ ↓ 2038 40,101 40% 100% 4.9% 2039 − − % − % − % 2040 − − % − % − % Total / Weighted Average $101,401 100% 100% 7.3% Notes: As of June 30, 2025. $ in thousands. 1 The Company has a total return swap with the lender in connection with its variable-rate debt. At June 30, 2025, the assumed rate of the indebtedness associated with the variable-rate debt obligation is based on SOFR + 4.5%, which is the combination of the interest rates on two instruments: (i) the variable-rate debt obligation, pursuant to which the Company is obligated to pay the lender an amount equal to SOFR + 7.0%, and (ii) the total return swap, pursuant to which the Company is entitled to receive 2.5% from the lender. The cash flows from this total return swap do not vary based on any underlying variable and there is no net settlement. |
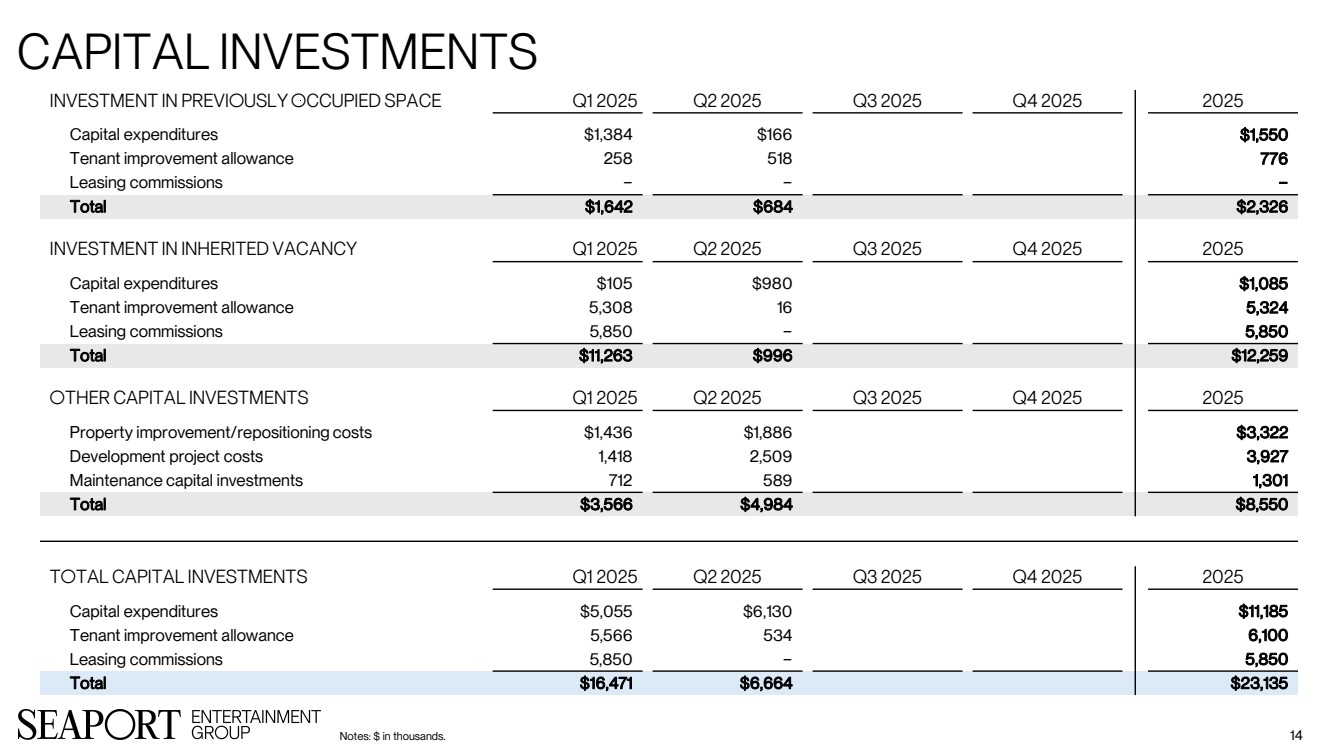
| Capital investments 14 Investment in Previously Occupied Space Q1 2025 Q2 2025 Q3 2025 Q4 2025 2025 Capital expenditures $1,384 $166 $1,550 Tenant improvement allowance 258 518 776 Leasing commissions − − − Total $1,642 $684 $2,326 Investment in Inherited Vacancy Q1 2025 Q2 2025 Q3 2025 Q4 2025 2025 Capital expenditures $105 $980 $1,085 Tenant improvement allowance 5,308 16 5,324 Leasing commissions 5,850 − 5,850 Total $11,263 $996 $12,259 Other Capital Investments Q1 2025 Q2 2025 Q3 2025 Q4 2025 2025 Property improvement/repositioning costs $1,436 $1,886 $3,322 Development project costs 1,418 2,509 3,927 Maintenance capital investments 712 589 1,301 Total $3,566 $4,984 $8,550 Total Capital investments Q1 2025 Q2 2025 Q3 2025 Q4 2025 2025 Capital expenditures $5,055 $6,130 $11,185 Tenant improvement allowance 5,566 534 6,100 Leasing commissions 5,850 − 5,850 Total $16,471 $6,664 $23,135 Notes: $ in thousands. |
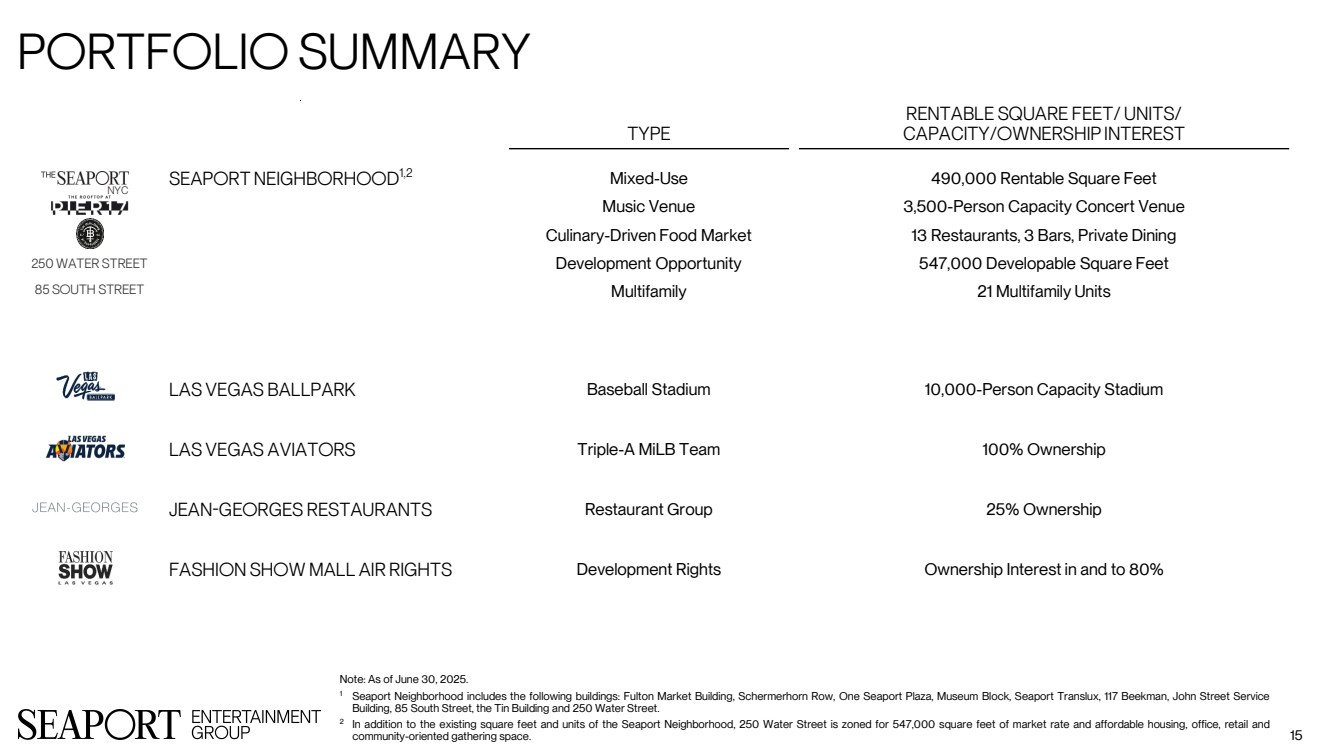
| Portfolio Summary 15 Note: As of June 30, 2025. 1 Seaport Neighborhood includes the following buildings: Fulton Market Building, Schermerhorn Row, One Seaport Plaza, Museum Block, Seaport Translux, 117 Beekman, John Street Service Building, 85 South Street, the Tin Building and 250 Water Street. 2 In addition to the existing square feet and units of the Seaport Neighborhood, 250 Water Street is zoned for 547,000 square feet of market rate and affordable housing, office, retail and community-oriented gathering space. Type Rentable Square Feet/ Units/ Capacity/Ownership Interest Seaport Neighborhood1,2 Mixed-Use Music Venue Culinary-Driven Food Market Development Opportunity Multifamily 490,000 Rentable Square Feet 3,500-Person Capacity Concert Venue 13 Restaurants, 3 Bars, Private Dining 547,000 Developable Square Feet 21 Multifamily Units Las Vegas Ballpark Baseball Stadium 10,000-Person Capacity Stadium Las Vegas Aviators Triple-A MiLB Team 100% Ownership Jean-Georges Restaurants Restaurant Group 25% Ownership Fashion Show Mall Air Rights Development Rights Ownership Interest in and to 80% NYC 250 Water Street 85 South Street |
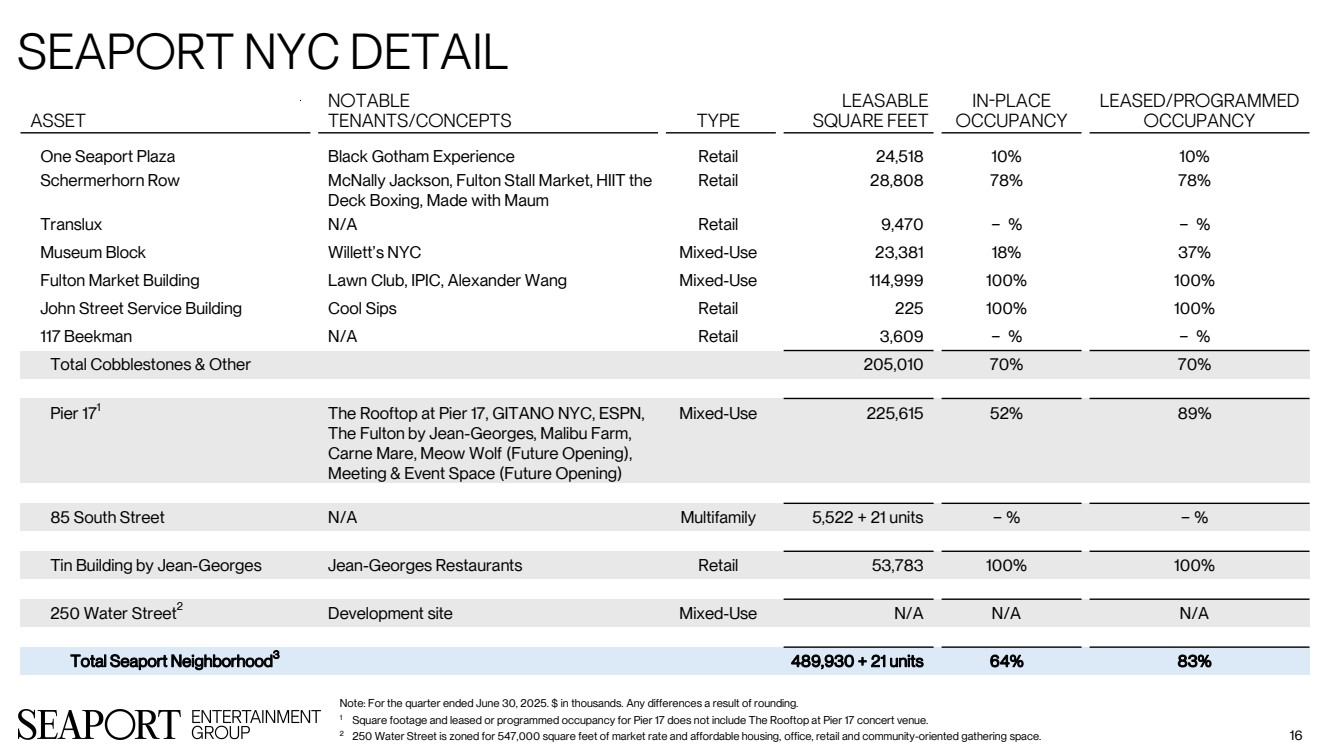
| Seaport NYC Detail 16 Note: For the quarter ended June 30, 2025. $ in thousands. Any differences a result of rounding. 1 Square footage and leased or programmed occupancy for Pier 17 does not include The Rooftop at Pier 17 concert venue. 2 250 Water Street is zoned for 547,000 square feet of market rate and affordable housing, office, retail and community-oriented gathering space. Asset Notable Tenants/Concepts Type Leasable Square Feet In-Place Occupancy Leased/Programmed Occupancy One Seaport Plaza Black Gotham Experience Retail 24,518 10% 10% Schermerhorn Row McNally Jackson, Fulton Stall Market, HIIT the Deck Boxing, Made with Maum Retail 28,808 78% 78% Translux N/A Retail 9,470 − % − % Museum Block Willett’s NYC Mixed-Use 23,381 18% 37% Fulton Market Building Lawn Club, IPIC, Alexander Wang Mixed-Use 114,999 100% 100% John Street Service Building Cool Sips Retail 225 100% 100% 117 Beekman N/A Retail 3,609 − % − % Total Cobblestones & Other 205,010 70% 70% Pier 171 The Rooftop at Pier 17, GITANO NYC, ESPN, The Fulton by Jean-Georges, Malibu Farm, Carne Mare, Meow Wolf (Future Opening), Meeting & Event Space (Future Opening) Mixed-Use 225,615 52% 89% 85 South Street N/A Multifamily 5,522 + 21 units − % − % Tin Building by Jean-Georges Jean-Georges Restaurants Retail 53,783 100% 100% 250 Water Street2 Development site Mixed-Use N/A N/A N/A Total Seaport Neighborhood3 489,930 + 21 units 64% 83% |
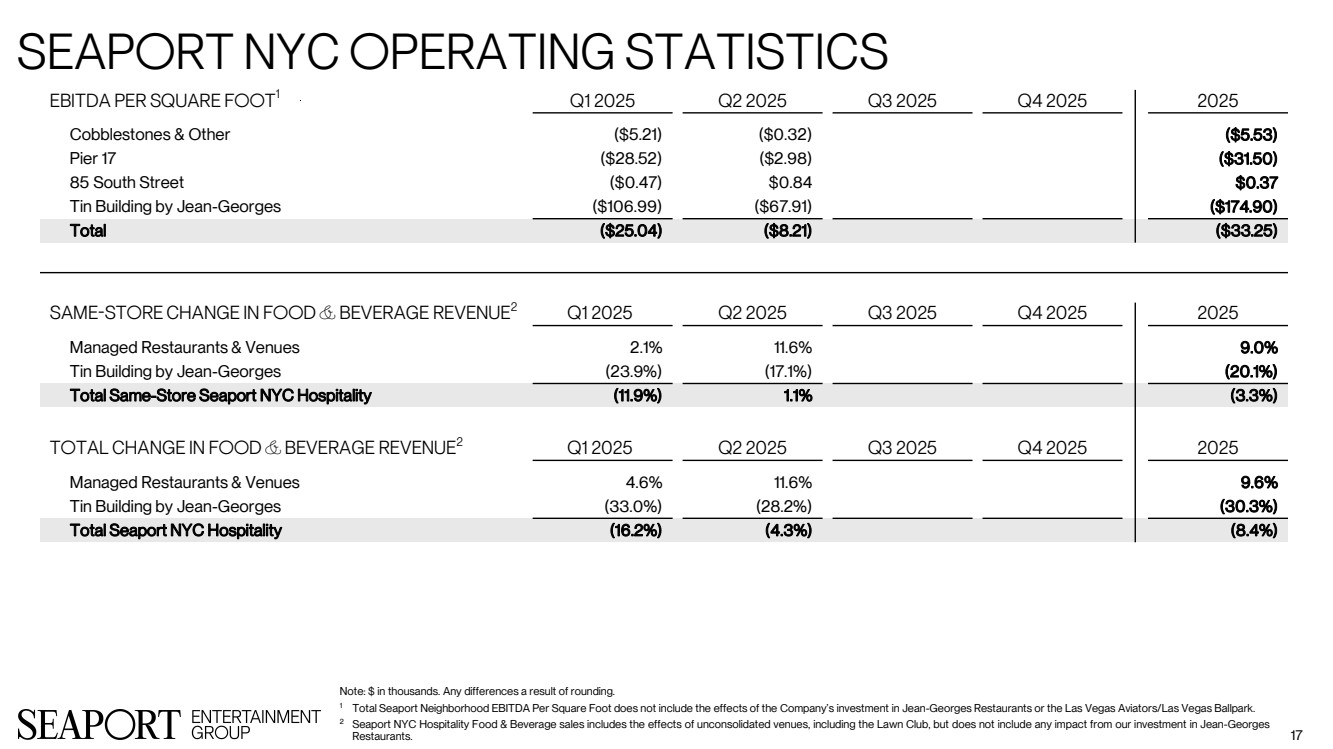
| Seaport NYC Operating Statistics 17 EBITDA Per Square Foot1 Q1 2025 Q2 2025 Q3 2025 Q4 2025 2025 Cobblestones & Other ($5.21) ($0.32) ($5.53) Pier 17 ($28.52) ($2.98) ($31.50) 85 South Street ($0.47) $0.84 $0.37 Tin Building by Jean-Georges ($106.99) ($67.91) ($174.90) Total ($25.04) ($8.21) ($33.25) Same-Store Change in Food & Beverage Revenue2 Q1 2025 Q2 2025 Q3 2025 Q4 2025 2025 Managed Restaurants & Venues 2.1% 11.6% 9.0% Tin Building by Jean-Georges (23.9%) (17.1%) (20.1%) Total Same-Store Seaport NYC Hospitality (11.9%) 1.1% (3.3%) Total Change in Food & Beverage Revenue2 Q1 2025 Q2 2025 Q3 2025 Q4 2025 2025 Managed Restaurants & Venues 4.6% 11.6% 9.6% Tin Building by Jean-Georges (33.0%) (28.2%) (30.3%) Total Seaport NYC Hospitality (16.2%) (4.3%) (8.4%) Note: $ in thousands. Any differences a result of rounding. 1 Total Seaport Neighborhood EBITDA Per Square Foot does not include the effects of the Company’s investment in Jean-Georges Restaurants or the Las Vegas Aviators/Las Vegas Ballpark. 2 Seaport NYC Hospitality Food & Beverage sales includes the effects of unconsolidated venues, including the Lawn Club, but does not include any impact from our investment in Jean-Georges Restaurants. |
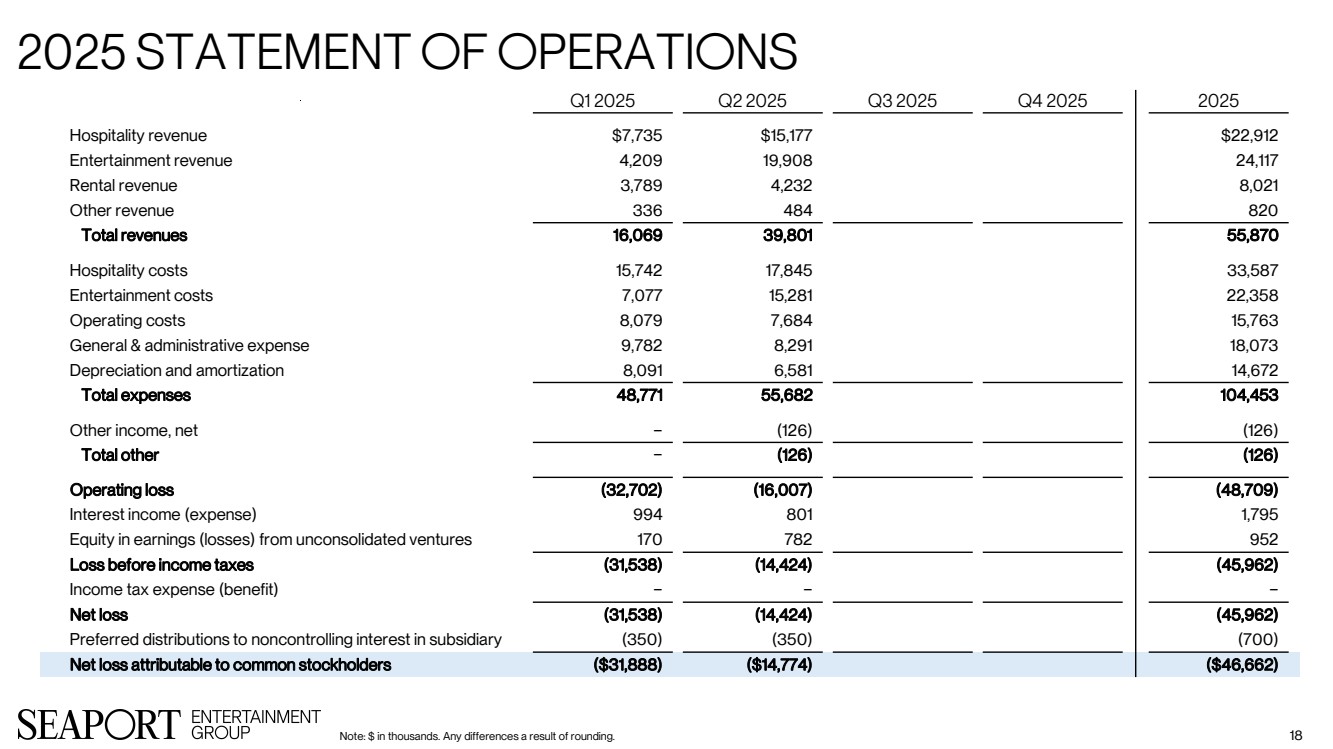
| 2025 Statement of Operations Note: $ in thousands. Any differences a result of rounding. 18 Q1 2025 Q2 2025 Q3 2025 Q4 2025 2025 Hospitality revenue $7,735 $15,177 $22,912 Entertainment revenue 4,209 19,908 24,117 Rental revenue 3,789 4,232 8,021 Other revenue 336 484 820 Total revenues 16,069 39,801 55,870 Hospitality costs 15,742 17,845 33,587 Entertainment costs 7,077 15,281 22,358 Operating costs 8,079 7,684 15,763 General & administrative expense 9,782 8,291 18,073 Depreciation and amortization 8,091 6,581 14,672 Total expenses 48,771 55,682 104,453 Other income, net − (126) (126) Total other − (126) (126) Operating loss (32,702) (16,007) (48,709) Interest income (expense) 994 801 1,795 Equity in earnings (losses) from unconsolidated ventures 170 782 952 Loss before income taxes (31,538) (14,424) (45,962) Income tax expense (benefit) − − − Net loss (31,538) (14,424) (45,962) Preferred distributions to noncontrolling interest in subsidiary (350) (350) (700) Net loss attributable to common stockholders ($31,888) ($14,774) ($46,662) |
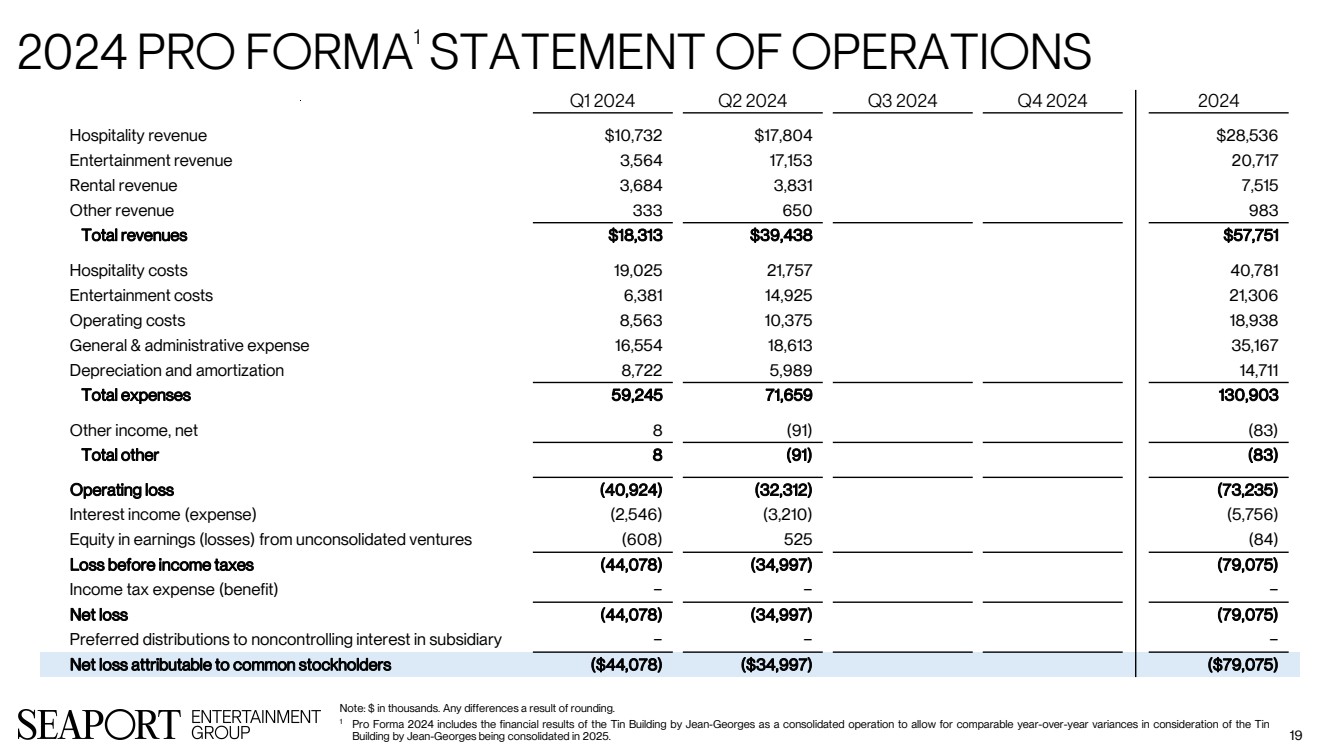
| 2024 Pro Forma1 Statement of Operations 19 Q1 2024 Q2 2024 Q3 2024 Q4 2024 2024 Hospitality revenue $10,732 $17,804 $28,536 Entertainment revenue 3,564 17,153 20,717 Rental revenue 3,684 3,831 7,515 Other revenue 333 650 983 Total revenues $18,313 $39,438 $57,751 Hospitality costs 19,025 21,757 40,781 Entertainment costs 6,381 14,925 21,306 Operating costs 8,563 10,375 18,938 General & administrative expense 16,554 18,613 35,167 Depreciation and amortization 8,722 5,989 14,711 Total expenses 59,245 71,659 130,903 Other income, net 8 (91) (83) Total other 8 (91) (83) Operating loss (40,924) (32,312) (73,235) Interest income (expense) (2,546) (3,210) (5,756) Equity in earnings (losses) from unconsolidated ventures (608) 525 (84) Loss before income taxes (44,078) (34,997) (79,075) Income tax expense (benefit) − − − Net loss (44,078) (34,997) (79,075) Preferred distributions to noncontrolling interest in subsidiary − − − Net loss attributable to common stockholders ($44,078) ($34,997) ($79,075) Note: $ in thousands. Any differences a result of rounding. 1 Pro Forma 2024 includes the financial results of the Tin Building by Jean-Georges as a consolidated operation to allow for comparable year-over-year variances in consideration of the Tin Building by Jean-Georges being consolidated in 2025. |
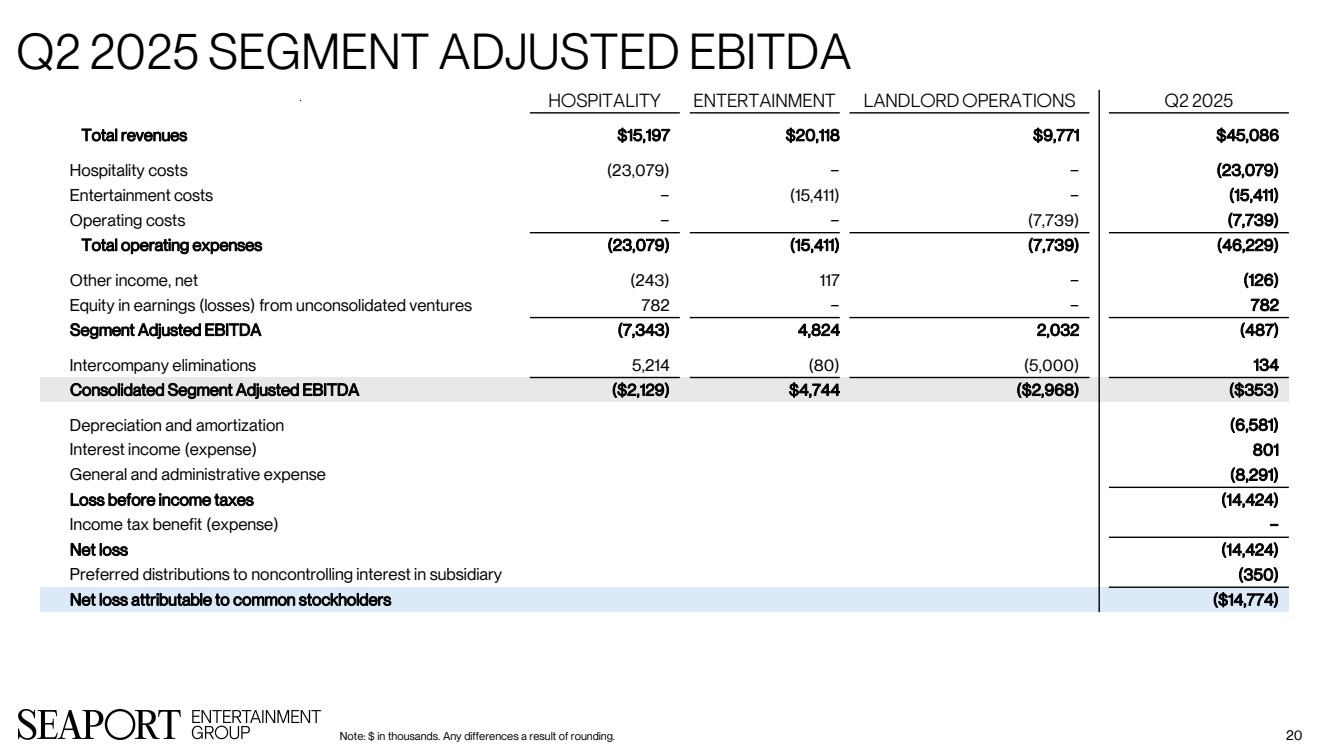
| Q2 2025 Segment Adjusted EBITDA Note: $ in thousands. Any differences a result of rounding. 20 Hospitality Entertainment Landlord Operations Q2 2025 Total revenues $15,197 $20,118 $9,771 $45,086 Hospitality costs (23,079) − − (23,079) Entertainment costs − (15,411) − (15,411) Operating costs − − (7,739) (7,739) Total operating expenses (23,079) (15,411) (7,739) (46,229) Other income, net (243) 117 − (126) Equity in earnings (losses) from unconsolidated ventures 782 − − 782 Segment Adjusted EBITDA (7,343) 4,824 2,032 (487) Intercompany eliminations 5,214 (80) (5,000) 134 Consolidated Segment Adjusted EBITDA ($2,129) $4,744 ($2,968) ($353) Depreciation and amortization (6,581) Interest income (expense) 801 General and administrative expense (8,291) Loss before income taxes (14,424) Income tax benefit (expense) − Net loss (14,424) Preferred distributions to noncontrolling interest in subsidiary (350) Net loss attributable to common stockholders ($14,774) |
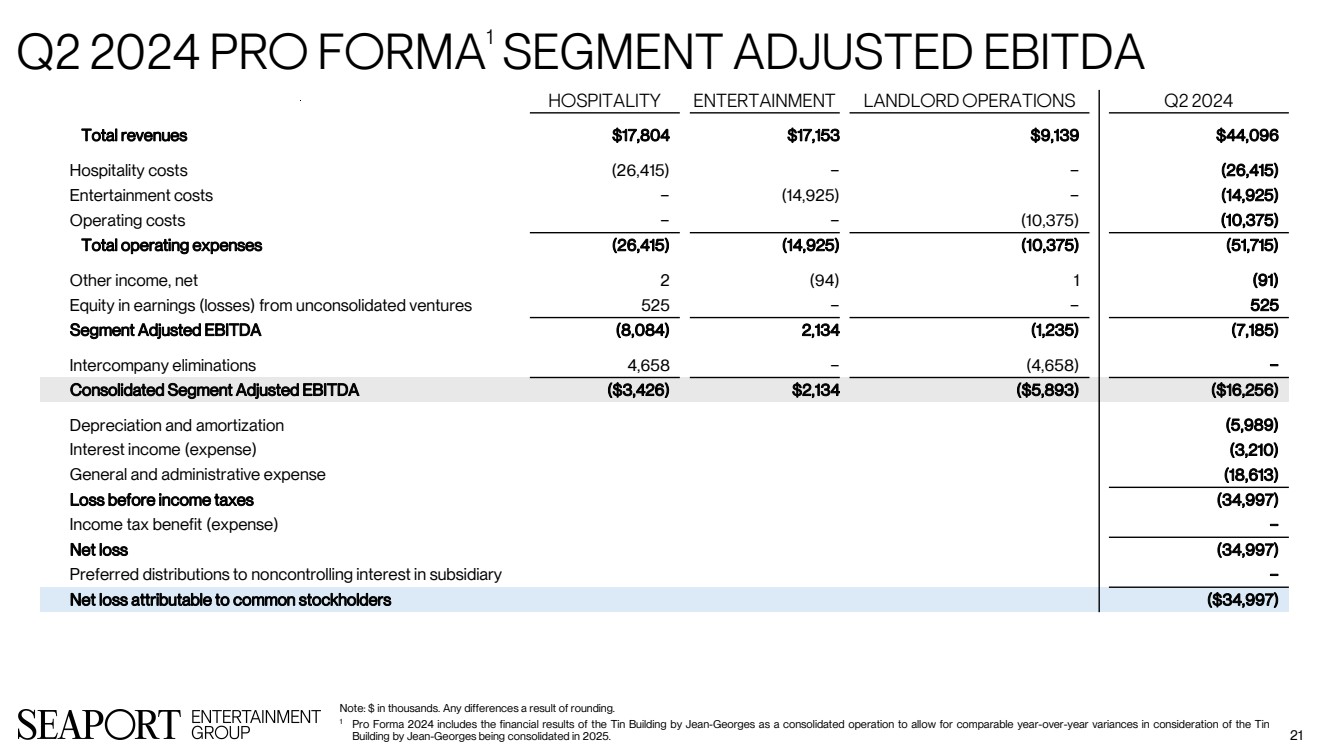
| Q2 2024 Pro Forma1 Segment Adjusted EBITDA 21 Note: $ in thousands. Any differences a result of rounding. 1 Pro Forma 2024 includes the financial results of the Tin Building by Jean-Georges as a consolidated operation to allow for comparable year-over-year variances in consideration of the Tin Building by Jean-Georges being consolidated in 2025. Hospitality Entertainment Landlord Operations Q2 2024 Total revenues $17,804 $17,153 $9,139 $44,096 Hospitality costs (26,415) − − (26,415) Entertainment costs − (14,925) − (14,925) Operating costs − − (10,375) (10,375) Total operating expenses (26,415) (14,925) (10,375) (51,715) Other income, net 2 (94) 1 (91) Equity in earnings (losses) from unconsolidated ventures 525 − − 525 Segment Adjusted EBITDA (8,084) 2,134 (1,235) (7,185) Intercompany eliminations 4,658 − (4,658) − Consolidated Segment Adjusted EBITDA ($3,426) $2,134 ($5,893) ($16,256) Depreciation and amortization (5,989) Interest income (expense) (3,210) General and administrative expense (18,613) Loss before income taxes (34,997) Income tax benefit (expense) − Net loss (34,997) Preferred distributions to noncontrolling interest in subsidiary − Net loss attributable to common stockholders ($34,997) |
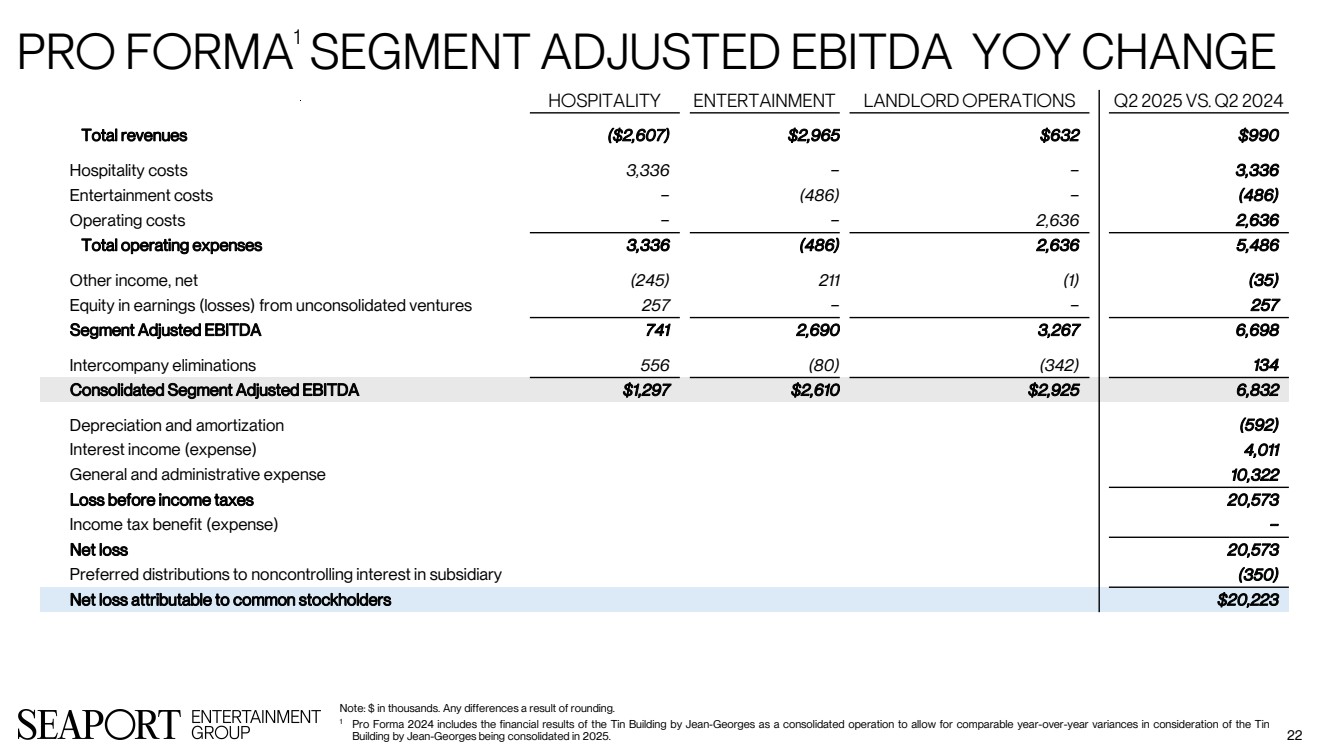
| Pro Forma1 Segment Adjusted EBITDA YoY Change 22 Note: $ in thousands. Any differences a result of rounding. 1 Pro Forma 2024 includes the financial results of the Tin Building by Jean-Georges as a consolidated operation to allow for comparable year-over-year variances in consideration of the Tin Building by Jean-Georges being consolidated in 2025. Hospitality Entertainment Landlord Operations Q2 2025 vs. Q2 2024 Total revenues ($2,607) $2,965 $632 $990 Hospitality costs 3,336 − − 3,336 Entertainment costs − (486) − (486) Operating costs − − 2,636 2,636 Total operating expenses 3,336 (486) 2,636 5,486 Other income, net (245) 211 (1) (35) Equity in earnings (losses) from unconsolidated ventures 257 − − 257 Segment Adjusted EBITDA 741 2,690 3,267 6,698 Intercompany eliminations 556 (80) (342) 134 Consolidated Segment Adjusted EBITDA $1,297 $2,610 $2,925 6,832 Depreciation and amortization (592) Interest income (expense) 4,011 General and administrative expense 10,322 Loss before income taxes 20,573 Income tax benefit (expense) − Net loss 20,573 Preferred distributions to noncontrolling interest in subsidiary (350) Net loss attributable to common stockholders $20,223 |
| Contact Information 23 Corporate Office 199 Water Street, 28th Floor New York, NY 10038 Investor Relations (212) 732-8257 ir@seaportentertainment.com Transfer Agent Computershare Trust Company, N.A. (800) 368-5948 www.computershare.com NYSE Ticket Symbol: SEG www.seaportentertainment.com |

| This presentation and accompanying statements contain forward-looking statements that are subject to risks and uncertainties. All statements other than statements of historical facts or relating to present facts or current conditions included in this presentation are forward-looking statements. Forward-looking statements give Seaport Entertainment Group Inc.’s (“Seaport Entertainment,” the “Company,” “we,” “us,” “our” and “SEG”) current expectations relating to its financial condition, results of operations, plans, objectives, future performance and business. You can identify forward-looking statements by the fact that they do not relate strictly to historical or current facts. These statements may include words such as “may,” “could,” “seek,” “potential,” “likely,” “believe,” “will,” “expect,” “anticipate,” “estimate,” “plan,” “intend,” “forecast,” “aim,” “objectives,” “target,” “transform,” “project,” “realize” or variations of these terms and similar expressions, or the negative of these terms or similar expressions, although not all forward-looking statements contain these identifying words. This presentation includes forward-looking statements within the meaning of the federal securities laws. Such forward-looking statements include, but are not limited to, statements concerning the Company’s plans, goals, objectives, outlook, expectations, and intentions. Forward-looking statements are based on the Company’s current expectations and involve risks and uncertainties that could cause actual results to differ materially from those expressed or implied in such forward-looking statements. Factors that could cause the Company’s results to differ materially from current expectations include, but are not limited to: risks related to our recent separation from, and relationship with, Howard Hughes; risks related to macroeconomic conditions; risks related to the impact of tariffs and global trade disruptions on us and our tenants, including the impact on inflation, interest rates, supply chains and consumer sentiment and spending; changes in discretionary consumer spending patterns or consumer tastes or preferences; risks associated with the Company’s investments in real estate assets and trends in the real estate industry; the Company’s ability to obtain operating and development capital on favorable terms, or at all; the availability of debt and equity capital; the Company’s ability to renew its leases or re-lease available space; the Company’s ability to compete effectively; the Company’s ability to successfully identify, acquire, develop, and manage properties on terms that are favorable to it; the impact of uncertainty around, and disruptions to, the Company’s supply chain; risks related to the concentration of the Company’s properties and operations in Manhattan and the Las Vegas area; extreme weather conditions or climate change that may cause property damage or interrupt business; the impact of water and electricity shortages on the Company’s business; the contamination of the Company’s properties by hazardous or toxic substances; catastrophic events or geopolitical conditions that may disrupt the Company’s business; actual or threatened terrorist activity and other acts of violence, or the perception of a heightened threat of such events; losses that are not insured or that excess the applicable insurance limits; risks related to the disruption or failure of information technology networks and related systems – both ours and those operated and managed by third parties; regulatory and legal requirements applicable to our assets; the Company’s ability to attract and retain key personnel; the Company’s inability to control certain properties due to the joint ownership of such property and inability to successfully attract desirable strategic partners, including joint venture partners; risks related to the concentration of ownership of our common stock by Pershing Square; and the other factors detailed in the Company’s filings with the Securities and Exchange Commission (the “SEC”). All forward-looking statements in this presentation are made as of (i) the date hereof, in the case of information about the Company, and (ii) the date of such information, in the case of information from persons other than the Company. While management believes the information underlying any estimates and projections forms a reasonable basis for the statements in this presentation, such information may be limited or incomplete and should not be read to indicate that the Company has conducted an exhaustive inquiry into, or review of, all potentially available relevant information. The Company is under no obligation to publicly update or revise and forward-looking statements, whether as a result of new information, future events or otherwise, except as required by applicable law. This presentation and related discussion shall not constitute an offer to sell, or the solicitation of an offer to buy, these securities, nor shall there be any sale of these securities in any state or jurisdiction in which such offer, solicitation or sale would be unlawful prior to registration or qualification under the securities laws of any such state or jurisdiction. Sales and offers to sell our securities will only be made in accordance with the Securities Act of 1933, as amended, and applicable SEC regulations, including written prospectus requirements. This presentation is not intended to form the basis of any investment decision by the recipient and does not constitute investment, tax or legal advice. All trademarks and logos depicted in this presentation are the property of their respective owners and are displayed solely for purposes of illustration. Such use should not be construed as an endorsement of the products or services of the Company. 24 Safe Harbor |
| Our reported results are presented in accordance with accounting principles generally accepted in the United States of America (“GAAP”). We also disclose Non-GAAP Adjusted Net Loss Attributable to Common Stockholders and Non-GAAP Adjusted Net Loss Attributable to Common Stockholders Per Share, each of which are non-GAAP financial measures. We believe these non-GAAP financial measures are useful to investors because they provide a meaningful supplement of the Company’s operating performance and period-over-period changes without regard to certain potential distortions or certain non-cash items. Non-GAAP Adjusted Net Loss Attributable to Common Stockholders and Non-GAAP Adjusted Net Loss Attributable to Common Stockholders Per Share do not represent cash generated from operating activities and are not necessarily indicative of cash available to fund cash requirements. Accordingly, they should not be considered alternatives to net income as a performance measure or cash flows from operating activities as reported on our statement of cash flows as a liquidity measure and should be considered in addition to, and not in lieu of, GAAP financial measures. To derive Non-GAAP Adjusted Net Loss Attributable to Common Stockholders, GAAP net income (loss) attributable to common stockholders is adjusted to exclude depreciation and amortization, as well as gains and losses from the sale of assets, gains or losses on extinguishment of debt, and provision for impairment, and these adjustments include the pro rata share of such adjustments of unconsolidated subsidiaries. Additionally, adjustments are made for non-cash revenues and expenses such as straight-line rental revenue and expenses, amortization of above- and below-market lease related intangibles, and non-cash compensation; other non-recurring items such as termination fees, corporate restructuring costs incurred since separating from Howard Hughes, and legal settlements; and certain capitalized items such as capitalized interest. Please see the reconciliation table provided in this press release for a reconciliation of Non-GAAP Adjusted Net Loss Attributable to Common Stockholders and Non-GAAP Adjusted Net Loss Attributable to Common Stockholders Per Share to the most directly comparable GAAP measures of net income (loss). 25 Non-GAAP Financial Measures |
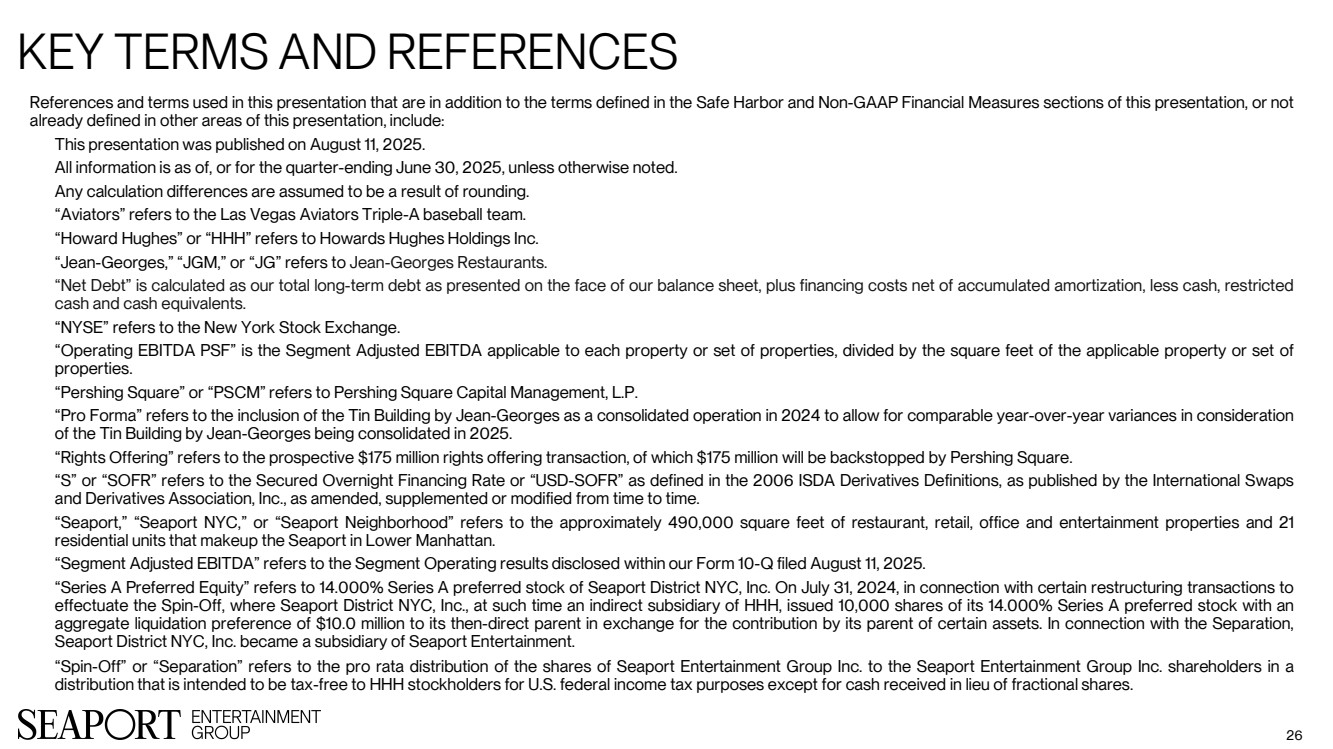
| Key terms and references References and terms used in this presentation that are in addition to the terms defined in the Safe Harbor and Non-GAAP Financial Measures sections of this presentation, or not already defined in other areas of this presentation, include: This presentation was published on August 11, 2025. All information is as of, or for the quarter-ending June 30, 2025, unless otherwise noted. Any calculation differences are assumed to be a result of rounding. “Aviators” refers to the Las Vegas Aviators Triple-A baseball team. “Howard Hughes” or “HHH” refers to Howards Hughes Holdings Inc. “Jean-Georges,” “JGM,” or “JG” refers to Jean-Georges Restaurants. “Net Debt” is calculated as our total long-term debt as presented on the face of our balance sheet, plus financing costs net of accumulated amortization, less cash, restricted cash and cash equivalents. “NYSE” refers to the New York Stock Exchange. “Operating EBITDA PSF” is the Segment Adjusted EBITDA applicable to each property or set of properties, divided by the square feet of the applicable property or set of properties. “Pershing Square” or “PSCM” refers to Pershing Square Capital Management, L.P. “Pro Forma” refers to the inclusion of the Tin Building by Jean-Georges as a consolidated operation in 2024 to allow for comparable year-over-year variances in consideration of the Tin Building by Jean-Georges being consolidated in 2025. “Rights Offering” refers to the prospective $175 million rights offering transaction, of which $175 million will be backstopped by Pershing Square. “S” or “SOFR” refers to the Secured Overnight Financing Rate or “USD-SOFR” as defined in the 2006 ISDA Derivatives Definitions, as published by the International Swaps and Derivatives Association, Inc., as amended, supplemented or modified from time to time. “Seaport,” “Seaport NYC,” or “Seaport Neighborhood” refers to the approximately 490,000 square feet of restaurant, retail, office and entertainment properties and 21 residential units that makeup the Seaport in Lower Manhattan. “Segment Adjusted EBITDA” refers to the Segment Operating results disclosed within our Form 10-Q filed August 11, 2025. “Series A Preferred Equity” refers to 14.000% Series A preferred stock of Seaport District NYC, Inc. On July 31, 2024, in connection with certain restructuring transactions to effectuate the Spin-Off, where Seaport District NYC, Inc., at such time an indirect subsidiary of HHH, issued 10,000 shares of its 14.000% Series A preferred stock with an aggregate liquidation preference of $10.0 million to its then-direct parent in exchange for the contribution by its parent of certain assets. In connection with the Separation, Seaport District NYC, Inc. became a subsidiary of Seaport Entertainment. “Spin-Off” or “Separation” refers to the pro rata distribution of the shares of Seaport Entertainment Group Inc. to the Seaport Entertainment Group Inc. shareholders in a distribution that is intended to be tax-free to HHH stockholders for U.S. federal income tax purposes except for cash received in lieu of fractional shares. 26 |
|