Shareholder Report
|
6 Months Ended |
|
May 31, 2025
USD ($)
Holdings
|
|---|
| Shareholder Report [Line Items] |
|
| Document Type |
N-CSRS
|
| Amendment Flag |
false
|
| Registrant Name |
Tidal
Trust III
|
| Entity Central Index Key |
0001722388
|
| Entity Investment Company Type |
N-1A
|
| Document Period End Date |
May 31, 2025
|
| NestYield Total Return Guard ETF |
|
| Shareholder Report [Line Items] |
|
| Fund Name |
NestYield Total Return Guard ETF
|
| Class Name |
NestYield Total Return Guard ETF
|
| Trading Symbol |
EGGS
|
| Security Exchange Name |
NYSEArca
|
| Annual or Semi-Annual Statement [Text Block] |
This semi-annual shareholder report contains important information about the NestYield Total Return Guard ETF (the "Fund") for the period December 26, 2024 to May 31, 2025.
|
| Shareholder Report Annual or Semi-Annual |
semi-annual shareholder report
|
| Additional Information [Text Block] |
You can find additional information about the Fund at https://nestyield.com/. You can also request this information by contacting us at (855) 879‑5979 or by writing to NestYield Total Return Guard ETF, c/o U.S. Bank Global Fund Services, P.O. Box 701, Milwaukee, Wisconsin 53201-0701.
|
| Additional Information Phone Number |
(855) 879‑5979
|
| Additional Information Website |
https://nestyield.com/
|
| Expenses [Text Block] |
What were the Fund costs for the period?
(based on a hypothetical $10,000 investment) Fund Name | Costs of a $10,000 investment | Costs paid as a percentage of a $10,000 investment |
|---|
NestYield Total Return Guard ETF | $38 | 0.89% |
|
| Expenses Paid, Amount |
$ 38
|
| Expense Ratio, Percent |
0.89%
|
| Net Assets |
$ 19,817,000
|
| Holdings Count | Holdings |
61
|
| Advisory Fees Paid, Amount |
$ 48,439
|
| Investment Company, Portfolio Turnover |
44.00%
|
| Additional Fund Statistics [Text Block] |
Key Fund Statistics (as of May 31, 2025)
| |
|---|
Fund Size (Thousands) | $19,817 | Number of Holdings | 61 | Total Advisory Fee Paid | $48,439 | Portfolio Turnover Rate | 44% |
|
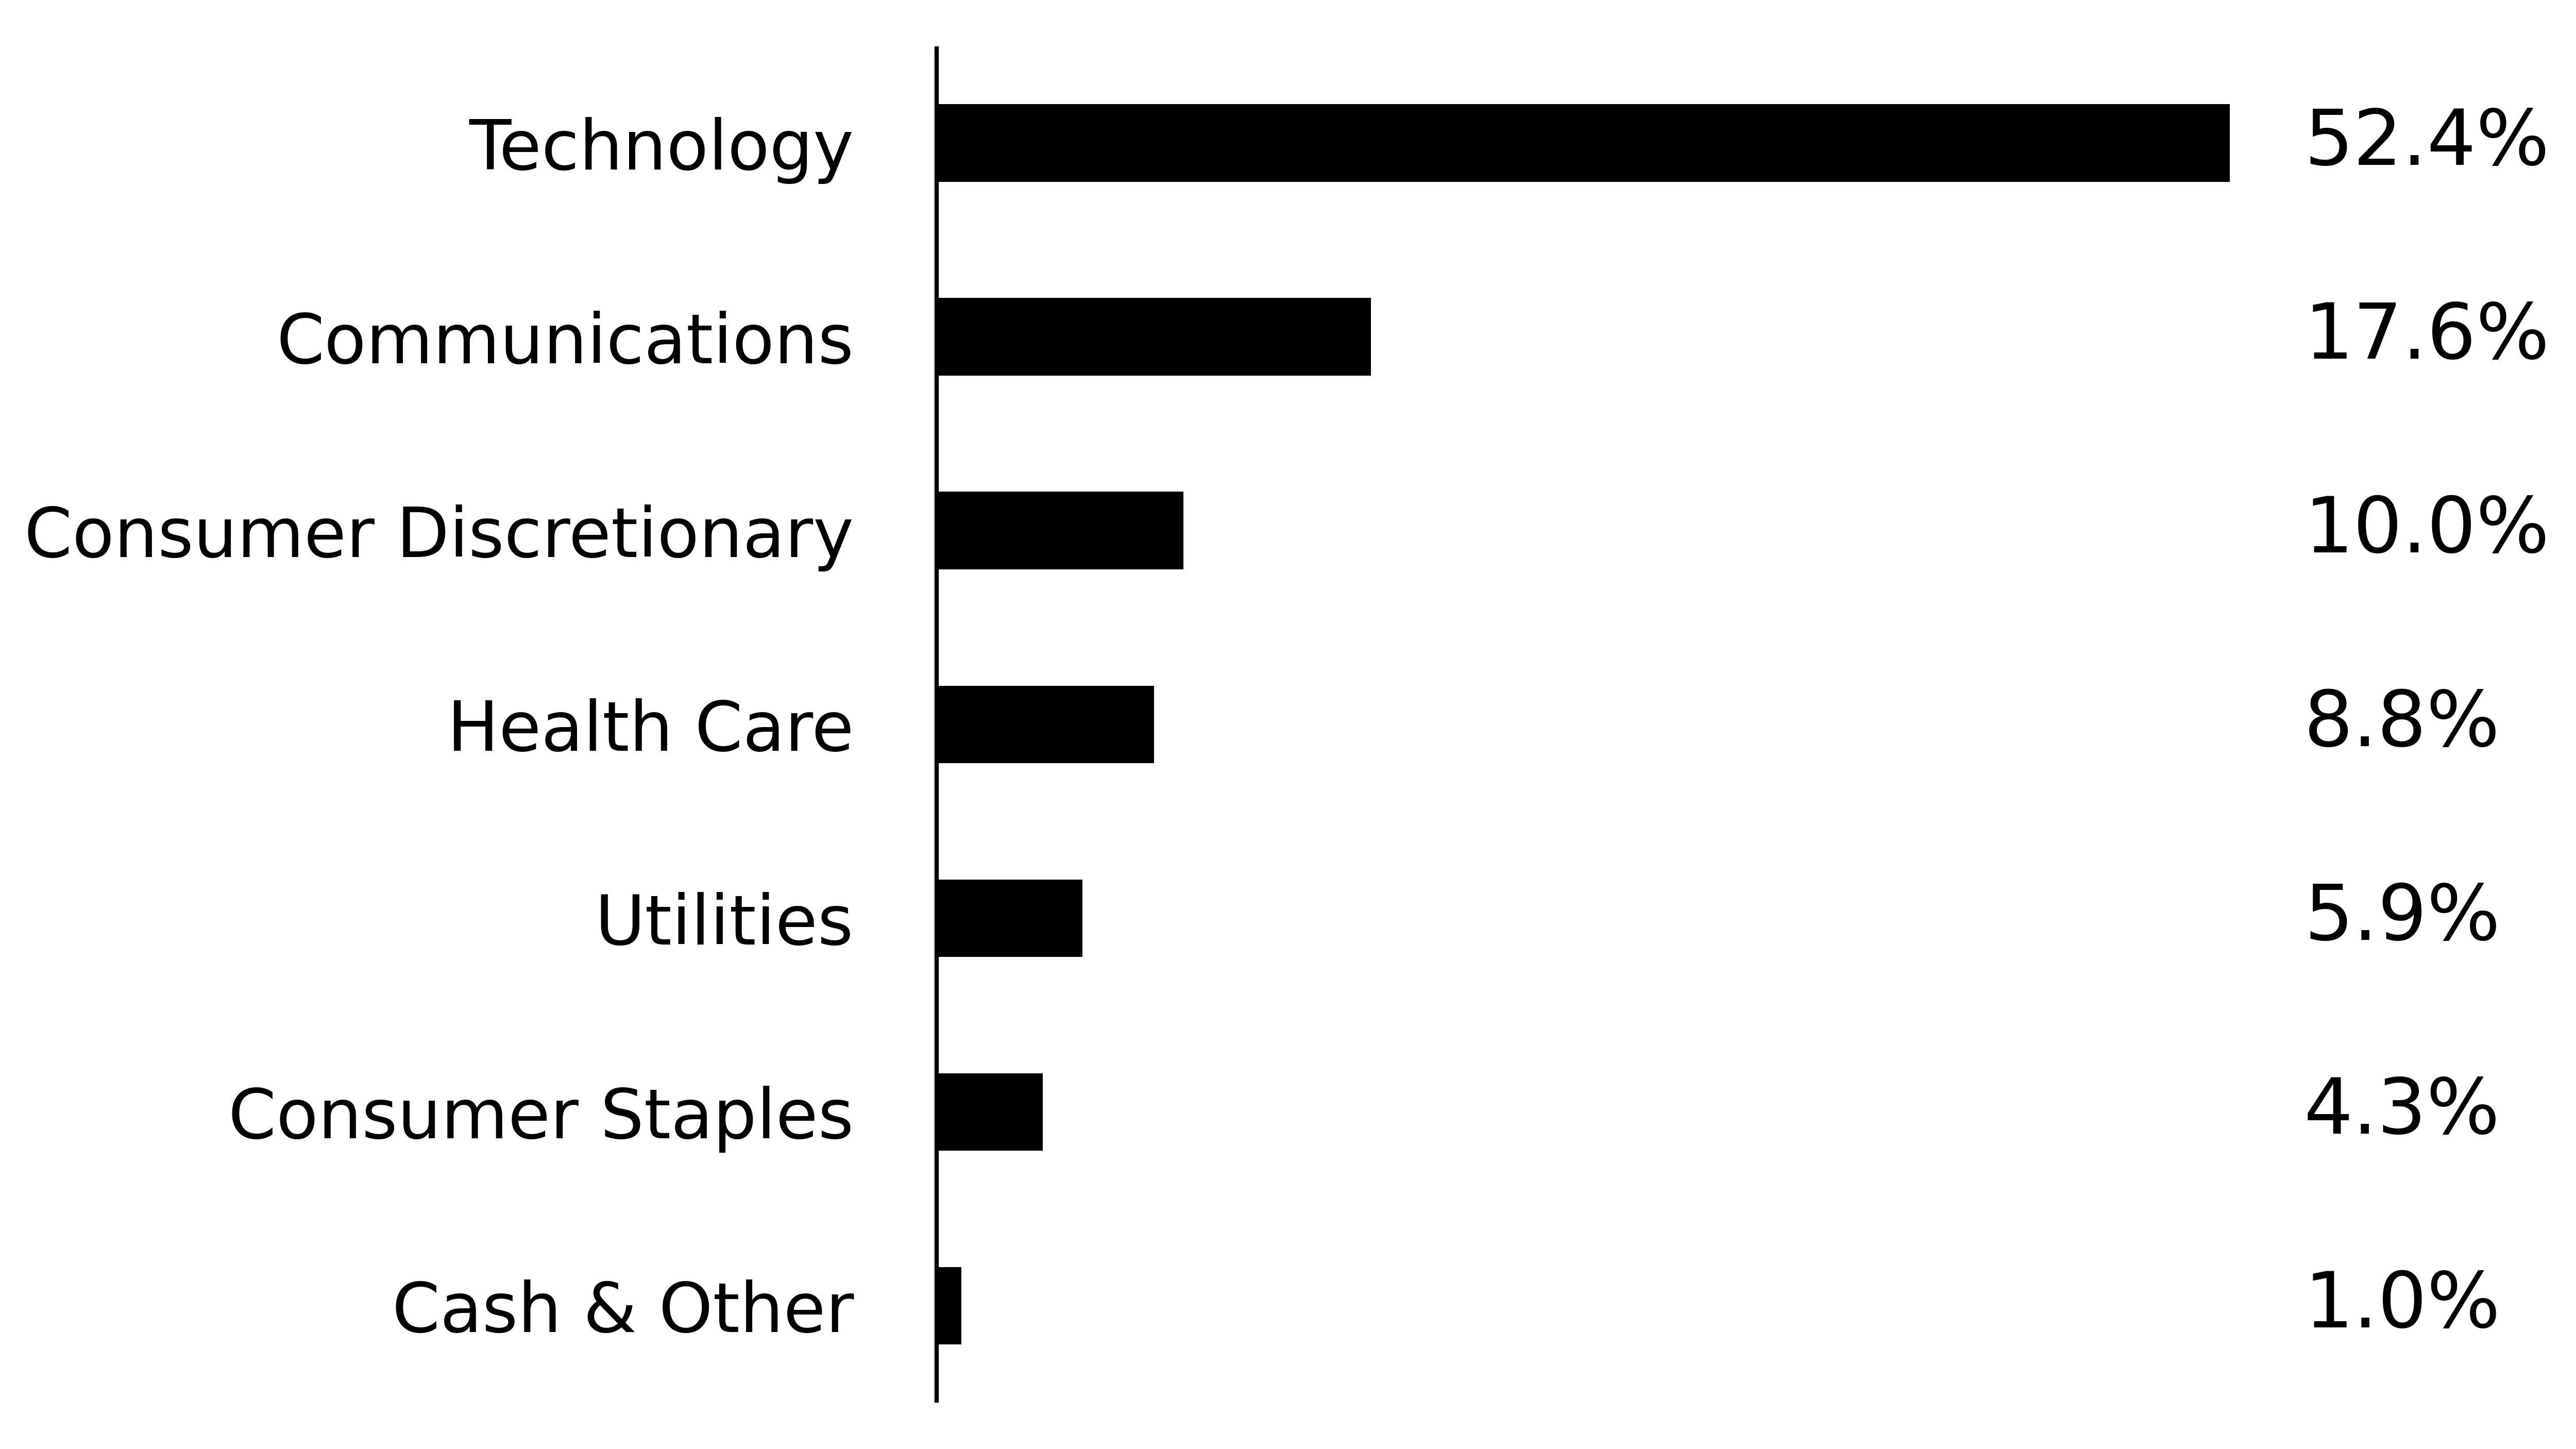
| Holdings [Text Block] |
Sector Breakdown
(% of Total Net Assets)
|
| Largest Holdings [Text Block] |
What did the Fund invest in? (as of May 31, 2025)
Top Ten Holdings | (Percentage of Net Assets) |
|---|
NVIDIA Corp. | 12.6 | Broadcom, Inc. | 12.3 | Eli Lilly & Co. | 6.9 | Tesla, Inc. | 5.6 | Vistra Corp. | 5.5 | Netflix, Inc. | 5.3 | MicroStrategy, Inc. | 5.3 | Microsoft Corp. | 5.0 | Taiwan Semiconductor Manufacturing Co. Ltd. | 4.9 | Meta Platforms, Inc. | 4.6 |
|
| Material Fund Change [Text Block] |
How Has the Fund Changed? There we no material changes during the reporting period.
|
| Accountant Change Statement [Text Block] |
Changes in and Disagreements with Accountants There were no changes in or disagreements with accountants during the reporting period.
|
| NestYield Dynamic Income ETF |
|
| Shareholder Report [Line Items] |
|
| Fund Name |
NestYield Dynamic Income ETF
|
| Class Name |
NestYield Dynamic Income ETF
|
| Trading Symbol |
EGGY
|
| Security Exchange Name |
NYSEArca
|
| Annual or Semi-Annual Statement [Text Block] |
This semi-annual shareholder report contains important information about the NestYield Dynamic Income ETF (the "Fund") for the period December 26, 2024 to May 31, 2025.
|
| Shareholder Report Annual or Semi-Annual |
semi-annual shareholder report
|
| Additional Information [Text Block] |
You can find additional information about the Fund at https://nestyield.com/. You can also request this information by contacting us at (855) 879‑5979 or by writing to NestYield Dynamic Income ETF, c/o U.S. Bank Global Fund Services, P.O. Box 701, Milwaukee, Wisconsin 53201-0701.
|
| Additional Information Phone Number |
(855) 879‑5979
|
| Additional Information Website |
https://nestyield.com/
|
| Expenses [Text Block] |
What were the Fund costs for the period?
(based on a hypothetical $10,000 investment) Fund Name | Costs of a $10,000 investment | Costs paid as a percentage of a $10,000 investment |
|---|
NestYield Dynamic Income ETF | $38 | 0.89% |
|
| Expenses Paid, Amount |
$ 38
|
| Expense Ratio, Percent |
0.89%
|
| Net Assets |
$ 22,907,000
|
| Holdings Count | Holdings |
57
|
| Advisory Fees Paid, Amount |
$ 51,053
|
| Investment Company, Portfolio Turnover |
53.00%
|
| Additional Fund Statistics [Text Block] |
Key Fund Statistics (as of May 31, 2025)
| |
|---|
Fund Size (Thousands) | $22,907 | Number of Holdings | 57 | Total Advisory Fee Paid | $51,053 | Portfolio Turnover Rate | 53% |
|
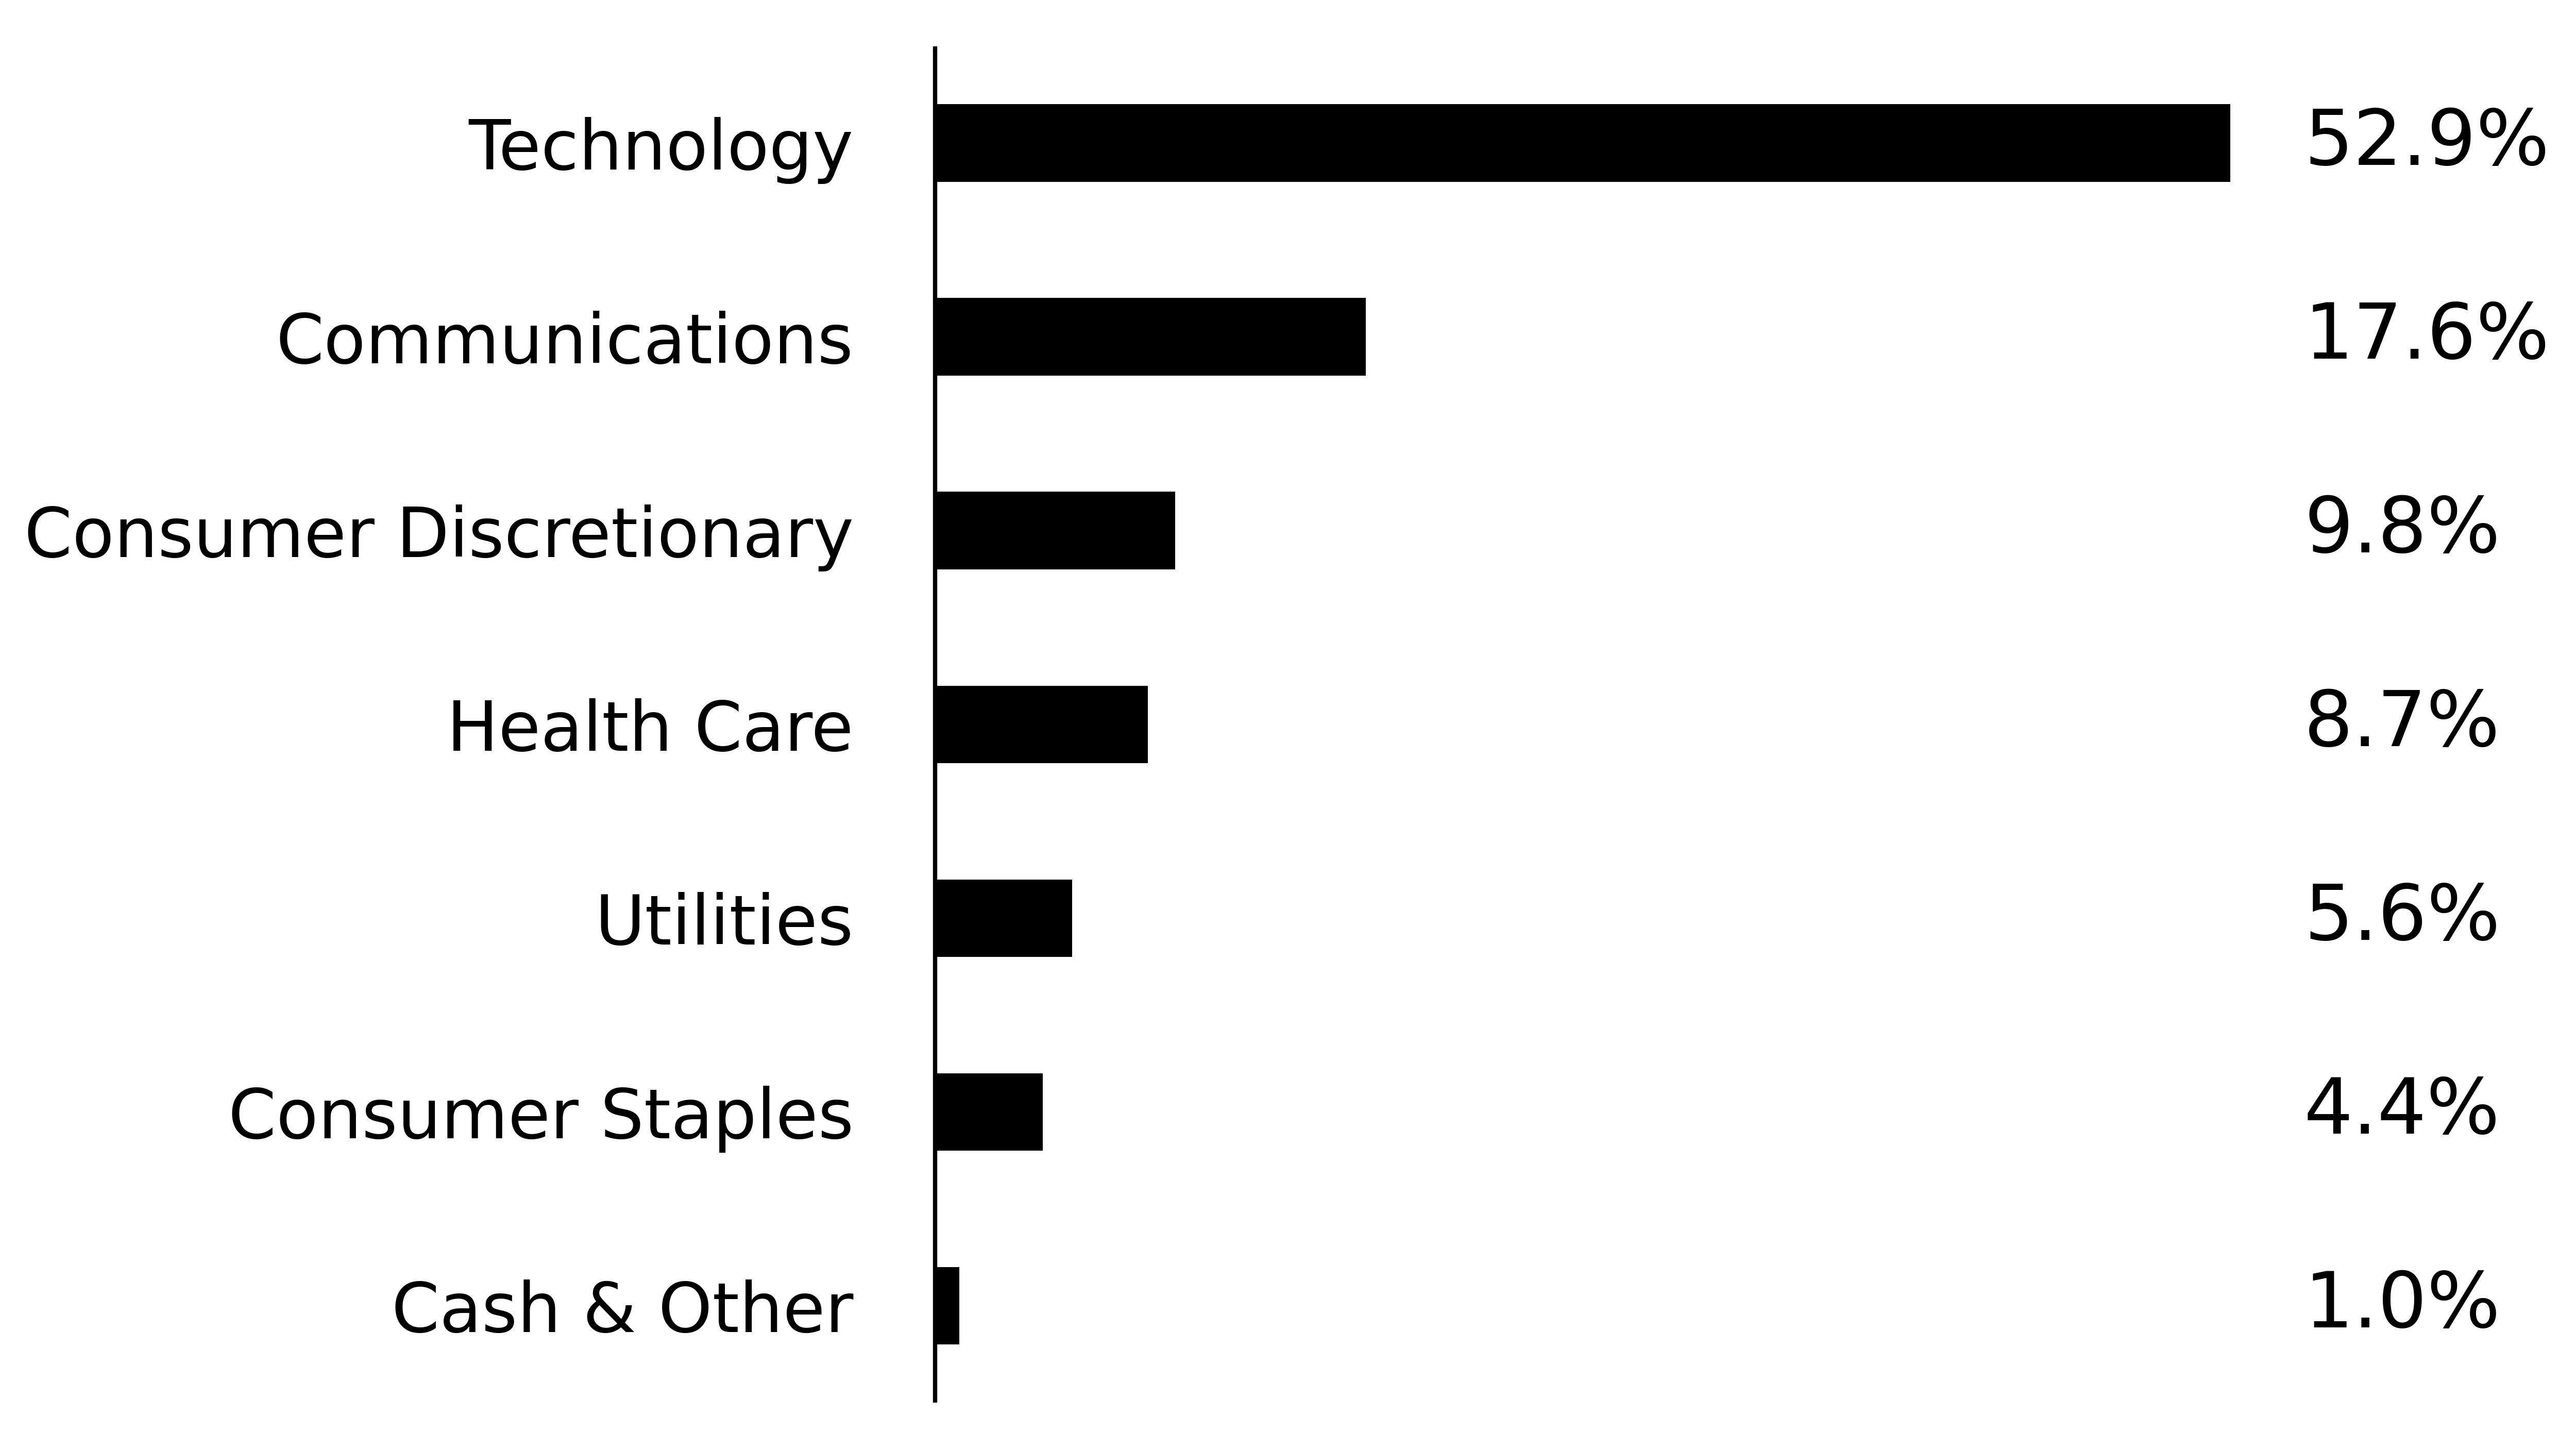
| Holdings [Text Block] |
Sector Breakdown
(% of Total Net Assets)
|
| Largest Holdings [Text Block] |
What did the Fund invest in? (as of May 31, 2025)
Top Ten Holdings | (Percentage of Net Assets) |
|---|
NVIDIA Corp. | 12.7 | Broadcom, Inc. | 12.4 | Eli Lilly & Co. | 7.0 | Vistra Corp. | 5.3 | Tesla, Inc. | 5.3 | Netflix, Inc. | 5.2 | MicroStrategy, Inc. | 5.1 | Microsoft Corp. | 5.0 | Taiwan Semiconductor Manufacturing Co. Ltd. | 5.0 | Meta Platforms, Inc. | 4.7 |
|
| Material Fund Change [Text Block] |
How Has the Fund Changed? There we no material changes during the reporting period.
|
| Accountant Change Statement [Text Block] |
Changes in and Disagreements with Accountants There were no changes in or disagreements with accountants during the reporting period.
|
| NestYield Visionary ETF |
|
| Shareholder Report [Line Items] |
|
| Fund Name |
NestYield Visionary ETF
|
| Class Name |
NestYield Visionary ETF
|
| Trading Symbol |
EGGQ
|
| Security Exchange Name |
NASDAQ
|
| Annual or Semi-Annual Statement [Text Block] |
This semi-annual shareholder report contains important information about the NestYield Visionary ETF (the "Fund") for the period December 27, 2024 to May 31, 2025.
|
| Shareholder Report Annual or Semi-Annual |
semi-annual shareholder report
|
| Additional Information [Text Block] |
You can find additional information about the Fund at https://nestyield.com/. You can also request this information by contacting us at (855) 879-5979 or by writing to NestYield Visionary ETF, c/o U.S. Bank Global Fund Services, P.O. Box 701, Milwaukee, Wisconsin 53201-0701.
|
| Additional Information Phone Number |
(855) 879-5979
|
| Additional Information Website |
https://nestyield.com/
|
| Expenses [Text Block] |
What were the Fund costs for the period?
(based on a hypothetical $10,000 investment) Fund Name | Costs of a $10,000 investment | Costs paid as a percentage of a $10,000 investment |
|---|
NestYield Visionary ETF | $39 | 0.89% |
|
| Expenses Paid, Amount |
$ 39
|
| Expense Ratio, Percent |
0.89%
|
| Net Assets |
$ 32,475,000
|
| Holdings Count | Holdings |
24
|
| Advisory Fees Paid, Amount |
$ 58,970
|
| Investment Company, Portfolio Turnover |
61.00%
|
| Additional Fund Statistics [Text Block] |
Key Fund Statistics (as of May 31, 2025)
| |
|---|
Fund Size (Thousands) | $32,475 | Number of Holdings | 24 | Total Advisory Fee Paid | $58,970 | Portfolio Turnover Rate | 61% |
|
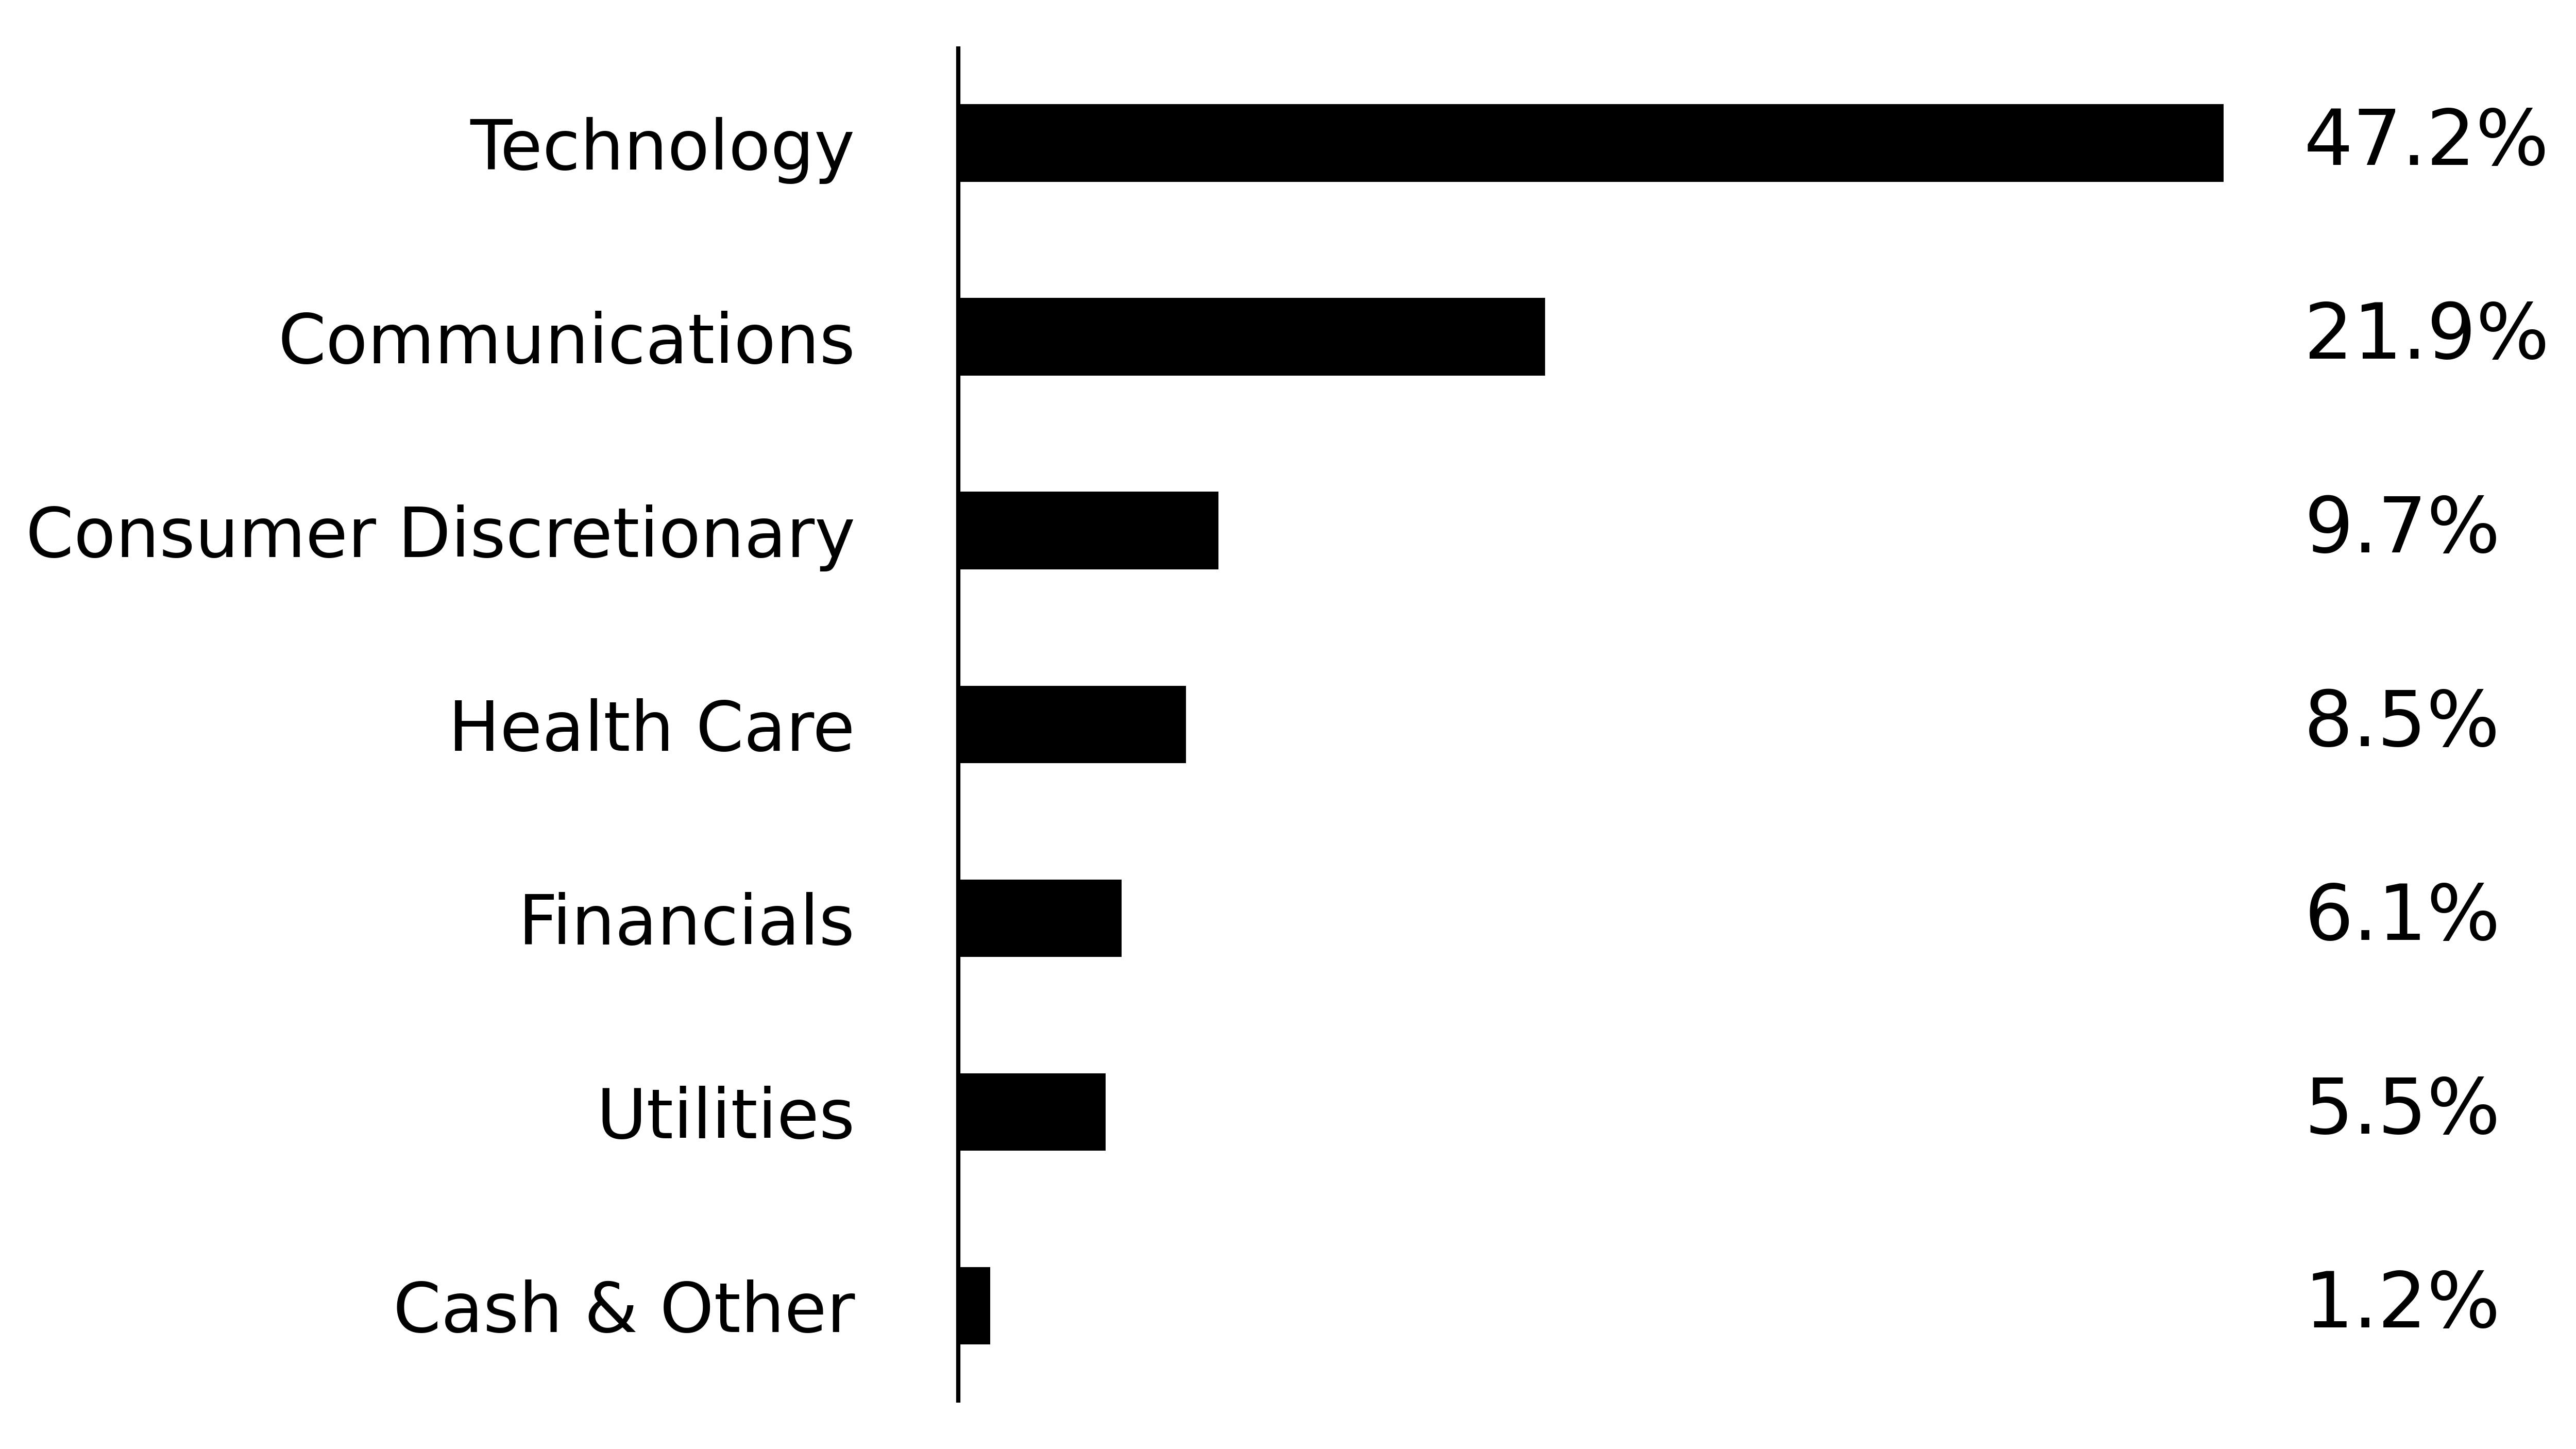
| Holdings [Text Block] |
Sector Breakdown
(% of Total Net Assets)
|
| Largest Holdings [Text Block] |
What did the Fund invest in? (as of May 31, 2025)
Top Ten Holdings | (Percentage of Net Assets) |
|---|
NVIDIA Corp. | 12.5 | Broadcom, Inc. | 11.5 | Meta Platforms, Inc. | 7.0 | Eli Lilly & Co. | 6.5 | MicroStrategy, Inc. | 6.0 | Vistra Corp. | 5.5 | Netflix, Inc. | 5.4 | Tesla, Inc. | 5.4 | Microsoft Corp. | 5.0 | Taiwan Semiconductor Manufacturing Co. Ltd. | 4.7 |
|
| Material Fund Change [Text Block] |
How Has the Fund Changed? There we no material changes during the reporting period.
|
| Accountant Change Statement [Text Block] |
Changes in and Disagreements with Accountants There were no changes in or disagreements with accountants during the reporting period.
|