Shareholder Report
May 31, 2025
USD ($)
Holding
contains
important information about Capital Group Dividend Value ETF (the "fund") for the period from June 1, 2024 to May 31, 2025.
capitalgroup.com/ETF-literature
(800) 421-4225
.
What were the fund costs for the last year?
(based on a hypothetica
l
$10,000 investment)Fund | Cost of $10,000 Investment | Costs paid as a percentage of a $10,000 investment |
| CGDV | $ 35 | 0.33 % |
Management's discussion of fund performance
The fund's shares gained 14.91% on a net asset value (NAV) basis and 14.77% on a market price basis for the year ended
May 31, 2025. These results compare with a 13.52% gain for the S&P 500 Index. For information on returns for additional periods, including the fund lifetime, please refer to.
May 31, 2025. These results compare with a 13.52% gain for the S&P 500 Index. For information on returns for additional periods, including the fund lifetime, please refer to
capitalgroup.com/ETF-returns
What factors influenced results
U.S. equity markets delivered strong returns, rebounding from early 2025 volatility on the back of a late-stage rally in the technology sector. The financials and consumer discretionary sectors led the gains, supported by shifting interest rates and a pickup in consumer spending. Overall, during the fund's fiscal year the U.S. economy maintained steady growth, despite witnessing a contraction in the first quarter of 2025 amid rising tariff tensions. As inflation moderated, the Federal Reserve implemented three rate cuts in 2024 to stimulate the economy and improve consumer sentiment.
Within the fund, most sectors added positive returns to the overall portfolio, with information technology, industrial and consumer staples companies contributing the most. Likewise, holdings in financials and communication services saw returns above those of the overall portfolio. Consumer discretionary and energy shares were also positive, though below the portfolio’s total return.
In terms of detractors, holdings in the materials, utilities and health care sectors posted negative returns during the period.
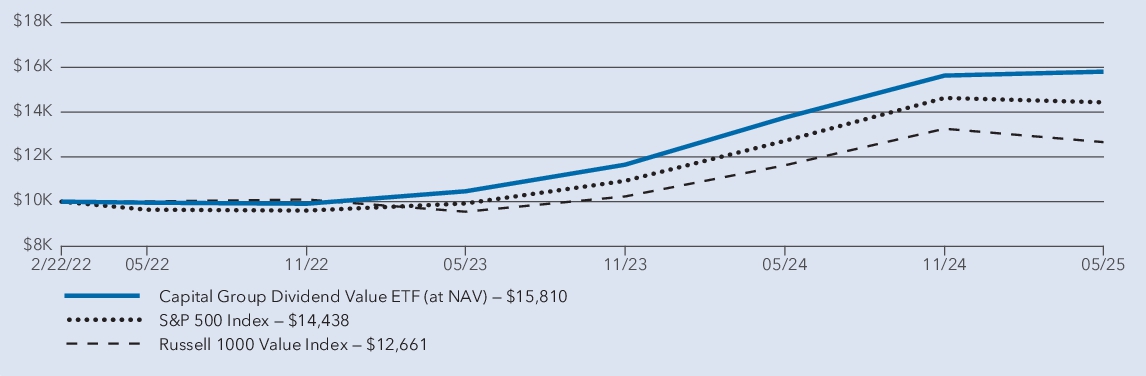
Average annual total returns
1 year | Since inception 1 | |
| Capital Group Dividend Value ETF (at NAV) 2 | 14.91 % | 15.04 % |
| S&P 500 Index 3 | 13.52 % | 11.89 % |
| Russell 1000 Value Index 3 | 8.91 % | 7.48 % |
1
The fund began investment operations on February 22, 2022.2
Investment results assume all distributions are reinvested and reflect applicable fees and expenses. When applicable, results reflect fee waivers and/or expense reimbursements, without which they would have been lower.3
Results assume all distributions are reinvested. Any market index shown is unmanaged, and therefore, has no expenses. Investors cannot invest directly in an index. Source(s): S&P Dow Jones Indices LLC and London
Stock Exchange Group.Key fund statistics
| Fund net assets (in millions ) | $ 16,677 |
| Total number of portfolio holdings | 53 |
| Total advisory fees paid (in millions) | $ 40 |
| Portfolio turnover rate | 29 % |
Portfolio holdings by sector
(percent of net assets)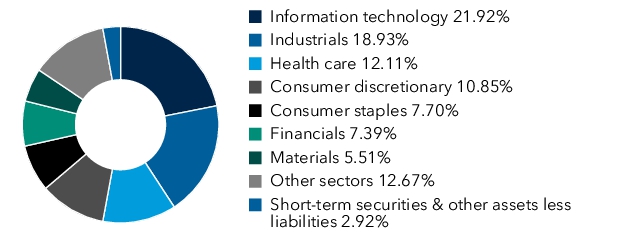
Changes in and disagreements with accountants
On July 3, 2025, PricewaterhouseCoopers LLP (“PwC”) was dismissed and Deloitte & Touche LLP was appointed as the fund’s independent registered public accounting firm for the fiscal year 2026 audit. The change in the fund’s independent registered public accounting firm was approved by the fund’s board of trustees, including a majority of the independent trustees, upon recommendation of the audit committee, as part of a broader effort to update board oversight and fund operations. At no point during the fund’s fiscal years ended May 31, 2024 and May 31, 2025 and the subsequent interim period through July 14, 2025, were there any disagreements between management and PwC on any matter of accounting principles or practices, financial statement disclosure or auditing scope or procedure.