Shareholder Report
May 31, 2025
USD ($)
Holding
Fund Expenses
What were the Fund costs for the last year ?
(Based on a hypothetical $10,000 investment)
| Fund | Costs of a $10,000 investment | Costs paid as a percentage of a $10,000 investment |
| Asset Allocation Fund* | $68 | 0.65% |
| * |
The expenses shown in the table are meant to highlight your ongoing costs only and do not reflect any fees and expenses that may be charged by the variable annuity contracts and variable life insurance policies (“Variable Contracts”) that invest in the Fund.
|
Management’s Discussion of Fund Performance
SUMMARY OF RESULTS
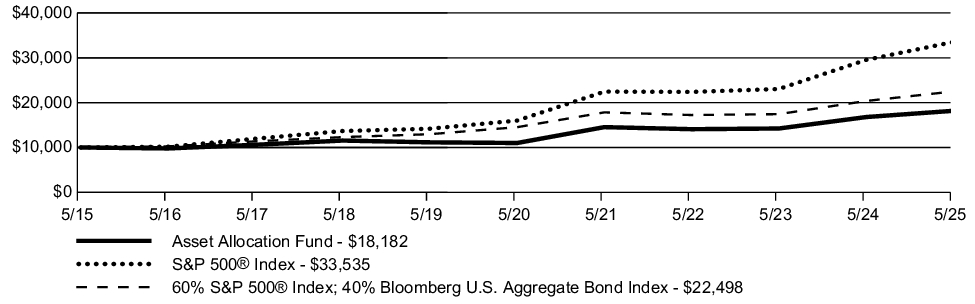
The Fund posted a return of 8.30% for the year ended May 31,2025, compared to 13.52% for the S&P 500® Index (a broad-based securities market index) and 10.40% for the Blended Index (the "Performance Index") comprised of 60% S&P 500® Index; 40% Bloomberg U.S. Aggregate Bond Index. Over the period, U.S. large-cap equities outperformed small-cap equities. The U.S. Treasury curve bull steepened. The two-year U.S. Treasury yield decreased by 98 bps to 3.90%, the five-year yield decreased by 55 bps ending at 3.96%, the ten-year yield decreased by 10 bps to 4.40%, and the thirty-year yield increased by 28 bps to 4.93%.
The following is a summary of the top contributors and detractors that impacted the Fund's performance during the year relative to the Performance Index.
TOP PERFORMANCE CONTRIBUTORS
For the equity segment of the fund | Allocations in the following sectors: consumer discretionary; industrials; consumer staples. Security selection in the following sectors: financials; energy; industrials. Position weightings: Howmet Aerospace, Inc.; Wells Fargo & Co.; Merck & Co., Inc.
For the fixed income segment of the fund | Allocations in the following sectors: Treasuries; agency mortgage-backed securities; non-agency mortgage-backed securities. Security selection in the following sectors: corporate credit; asset-backed securities; collateralized mortgage-backed securities
TOP PERFORMANCE DETRACTORS
For the equity segment of the fund | Allocations in the following sectors: energy; cash; communication services. Security selection in the following sectors: information technology; consumer discretionary; health care. Position Weightings: Regeneron Pharmaceuticals, Inc.; NXP Semiconductors NV; Tesla, Inc.
For the fixed income segment of the fund | Allocations in the following sectors: corporate credit. Security selection in the following sectors: none
Fund Performance
The following graph compares a $10,000 initial investment in the Fund to the index(es) listed below for the last 10 fiscal years of the Fund.
GROWTH OF $10,000
| AVERAGE ANNUAL TOTAL RETURN | 1 Year | 5 Year | 10 Year |
| Asset Allocation Fund | 8.30% | 10.58% | 6.16% |
| S&P 500® Index | 13.52% | 15.94% | 12.86% |
| 60% S&P 500® Index; 40% Bloomberg U.S. Aggregate Bond Index | 10.40% | 9.14% | 8.45% |
Key Fund Statistics
The following table outlines key fund statistics.
| Net assets | $145M |
| Total number of portfolio holdings | 607 |
| Total net advisory fee paid | $0.7M |
| Portfolio turnover rate during the reporting period | 35% |
Graphical Representation of Holdings
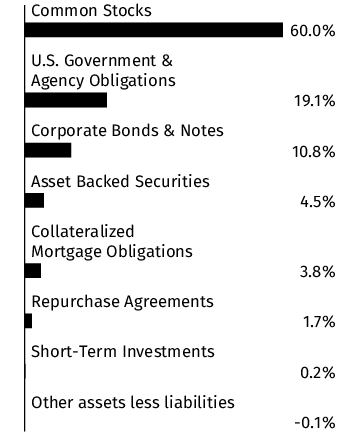
The information below represents the composition of the Fund's net assets as of the end of the period.
Top Industries*
| U.S. Government & Agency Obligations | 19.1% |
| Semiconductors | 7.6% |
| Software | 7.5% |
| Internet | 6.9% |
| Banks | 6.4% |
| Diversified Financial Services | 5.3% |
| Retail | 4.6% |
| Electric | 4.1% |
| Computers | 3.9% |
| Collateralized Mortgage Obligations | 3.8% |
| Other Asset Backed Securities | 2.8% |
| Building Materials | 2.7% |
| Healthcare-Products | 2.4% |
| Insurance | 2.4% |
| Aerospace/Defense | 2.2% |
Portfolio Composition
* Percentages exclude derivatives (other than purchased options), if any.
Material Fund Changes
There were no material fund changes during the period.
Changes in and Disagreements with Accountants
There were no disagreements with the accountants during the period.
This report describes changes to the Fund that occurred during the reporting period.
Fund Expenses
What were the Fund costs for the last year ?
(Based on a hypothetical $10,000 investment)
| Fund | Costs of a $10,000 investment | Costs paid as a percentage of a $10,000 investment |
| International Equities Index Fund* | $45 | 0.42% |
| * |
The expenses shown in the table are meant to highlight your ongoing costs only and do not reflect any fees and expenses that may be charged by the variable annuity contracts and variable life insurance policies (“Variable Contracts”) that invest in the Fund.
|
Management’s Discussion of Fund Performance
SUMMARY OF RESULTS
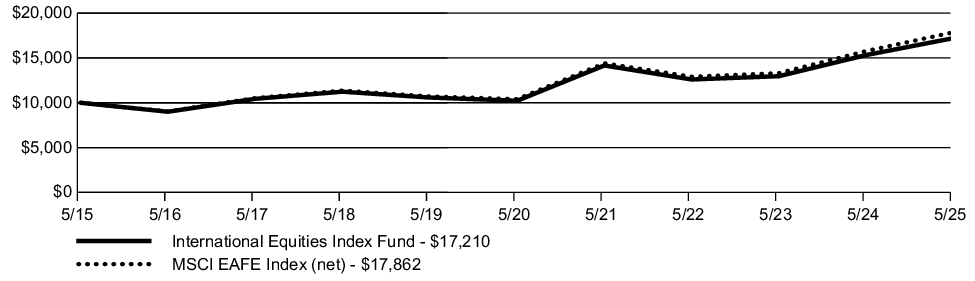
The Fund is managed to seek to track the performance of the Index. The Subadviser may endeavor to track the Index by purchasing every stock included in the Index, in the same proportions; or, in the alternative, the Subadviser may invest in a sampling of Index stocks by utilizing a statistical technique known as "optimization".
The Fund posted a return of 12.32% for the year ended May 31, 2025, compared to a return of 13.33% for the MSCI EAFE Index (net) (a broad-based securities market & Performance Index). Over the period, international equity markets outperformed U.S. equities, according to the MSCI® family of indices. Developed markets outside the U.S. slightly outperformed emerging markets.
The following is a summary of the top contributors and detractors that impacted the Fund's performance during the year.
TOP PERFORMANCE CONTRIBUTORS
BlackRock Investment Management, LLC - see Material Fund Changes for the time period covered | Allocations in the following sectors: financials; industrials; information technology. Position weightings: ASML Holding NV; Mitsubishi UFJ Financial Group, Inc.; Rheinmetall AG. Exposure to the following countries: Japan; United Kingdom; Germany
SunAmerica Asset Management, LLC - see Material Fund Changes for the time period covered | Allocations in the following sectors: financials; industrials; communication services. Position weightings: SAP SE; HSBC Holdings PLC; Sony Group Corp. Exposure to the following countries: Germany; United Kingdom; Japan
TOP PERFORMANCE DETRACTORS
BlackRock Investment Management, LLC - see Material Fund Changes for the time period covered | Allocations in the following sectors: health care. Position weightings: Allianz SE; Sanofi SA; Alcon AG. Exposure to the following countries: New Zealand
SunAmerica Asset Management, LLC - see Material Fund Changes for the time period covered | Allocations in the following sectors: health care; materials; energy. Position weightings: Novo Nordisk A/S, Class B; ASML Holding NV; LVMH Moet Hennessy Louis Vuitton SE. Exposure to the following countries: Denmark; Netherlands; Portugal
Fund Performance
The following graph compares a $10,000 initial investment in the Fund to the index(es) listed below for the last 10 fiscal years of the Fund.
GROWTH OF $10,000
| AVERAGE ANNUAL TOTAL RETURN | 1 Year | 5 Year | 10 Year |
| International Equities Index Fund | 12.32% | 10.98% | 5.58% |
| MSCI EAFE Index (net) | 13.33% | 11.42% | 5.97% |
Key Fund Statistics
The following table outlines key fund statistics.
| Net assets | $1,707M |
| Total number of portfolio holdings | 698 |
| Total net advisory fee paid | $4.9M |
| Portfolio turnover rate during the reporting period | 12% |
Graphical Representation of Holdings
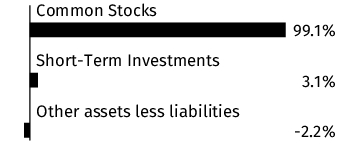
The information below represents the composition of the Fund's net assets as of the end of the period.
Top Industries*
| Banks | 14.5% |
| Pharmaceuticals | 7.9% |
| Insurance | 6.2% |
| Food | 3.5% |
| Aerospace/Defense | 3.4% |
| Telecommunications | 3.2% |
| Oil & Gas | 3.2% |
| Short-Term Investments | 3.1% |
| Semiconductors | 3.0% |
| Electric | 2.7% |
| Commercial Services | 2.7% |
| Software | 2.7% |
| Auto Manufacturers | 2.6% |
| Chemicals | 2.4% |
| Retail | 2.3% |
Portfolio Composition
Country
* Percentages exclude derivatives (other than purchased options), if any.
Material Fund Changes
This is a summary of certain changes to the Fund since the beginning of the period. Effective April 30, 2025, BlackRock Investment Management, LLC was appointed as subadviser to the Fund, replacing the existing subadvisor, SunAmerica Asset Management, LLC. Additionally, changes to the Fund’s investment strategies and techniques were adjusted to match the investment processes and techniques used by the subadviser. As a result of these changes, derivatives risk was added as a principal risk. Additionally, effective September 28, 2024, Japan exposure risk was added as a principal risk of the Fund. For more comprehensive information, you may review the Fund’s next prospectus, which we expect to be available by September 30, 2025 at www.corebridgefinancial.com/rs/prospectus-and-reports/annuities#underlyingfunds or upon special request at 1-800-448-2542 or by sending an e-mail request to Forms.Request@valic.com.
Changes in and Disagreements with Accountants
There were no disagreements with the accountants during the period.
This report describes changes to the Fund that occurred during the reporting period.
Fund Expenses
What were the Fund costs for the last year ?
(Based on a hypothetical $10,000 investment)
| Fund | Costs of a $10,000 investment | Costs paid as a percentage of a $10,000 investment |
| International Government Bond Fund* | $87 | 0.84% |
| * |
The expenses shown in the table are meant to highlight your ongoing costs only and do not reflect any fees and expenses that may be charged by the variable annuity contracts and variable life insurance policies (“Variable Contracts”) that invest in the Fund.
|
Management’s Discussion of Fund Performance
SUMMARY OF RESULTS
The Fund posted a return of 6.04% for the year ended May 31, 2025, compared to 6.06% for the Bloomberg Global Aggregate Index (USD hedged) (a broad-based securities market index) and 6.96% for the Blended Index (the "Performance Index") comprised of 70% FTSE WGBI Index (unhedged); 30% JPMorgan EMBI Global Diversified Index. Global bonds delivered positive total returns over the past twelve months, despite volatility in global bond yields. Hard currency emerging market bonds outperformed, delivering higher carry throughout the year.
The following is a summary of the top contributors and detractors that impacted the Fund's performance during the year relative to the Performance Index.
TOP PERFORMANCE CONTRIBUTORS
In aggregate | yield curve positioning; foreign currency exposure
Exposure to the following countries | Pakistan; Senegal; France
TOP PERFORMANCE DETRACTORS
In aggregate | country allocations
Exposure to the following countries | lack of exposure to Ukraine; United States; lack of exposure to Lebanon
Fund Performance
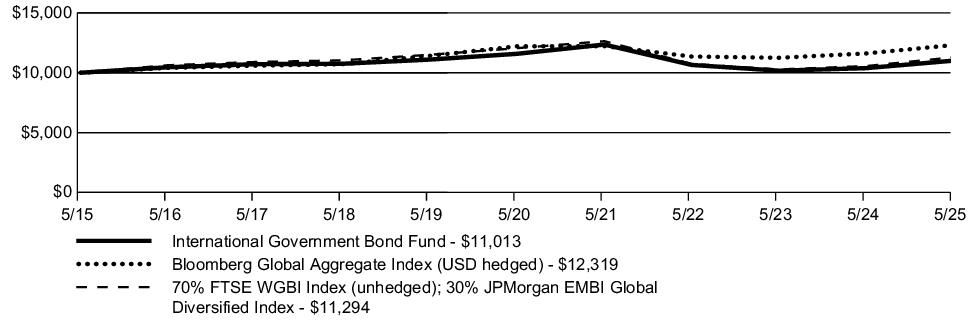
The following graph compares a $10,000 initial investment in the Fund to the index(es) listed below for the last 10 fiscal years of the Fund.
GROWTH OF $10,000
| AVERAGE ANNUAL TOTAL RETURN | 1 Year | 5 Year | 10 Year |
| International Government Bond Fund | 6.04% | (1.01)% | 0.97% |
| Bloomberg Global Aggregate Index (USD hedged) | 6.06% | 0.17% | 2.11% |
| 70% FTSE WGBI Index (unhedged); 30% JPMorgan EMBI Global Diversified Index | 6.96% | (1.30)% | 1.22% |
Key Fund Statistics
The following table outlines key fund statistics.
| Net assets | $55M |
| Total number of portfolio holdings | 144 |
| Total net advisory fee paid | $0.3M |
| Portfolio turnover rate during the reporting period | 108% |
Graphical Representation of Holdings
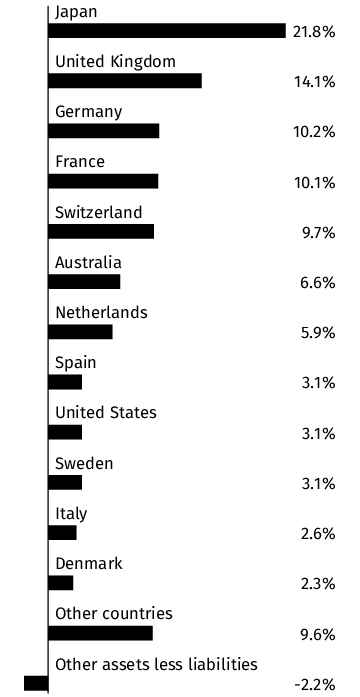
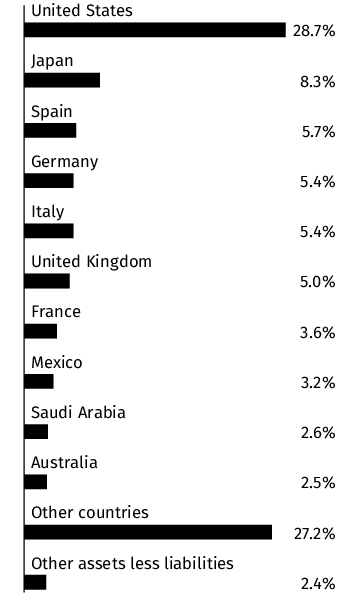
The information below represents the composition of the Fund as of the end of the period.
Top Industries*
(% of net assets)
(% of net assets)
| Foreign Government Obligations | 64.7% |
| U.S. Government & Agency Obligations | 28.3% |
| Oil & Gas | 1.1% |
| Electric | 0.9% |
| Chemicals | 0.8% |
| Investment Companies | 0.5% |
| Telecommunications | 0.5% |
| Commercial Services | 0.4% |
| Distribution/Wholesale | 0.4% |
Country
(% of net assets)
(% of net assets)
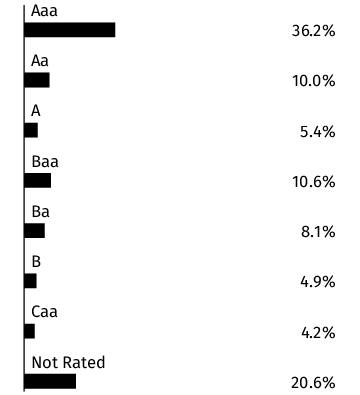
Credit Quality **
(% of total debt issues)
(% of total debt issues)
* Percentages exclude derivatives (other than purchased options), if any.
** Credit quality ratings shown above reflect the rating assigned by Moody's Investors Service, Inc. Where Moody's ratings are not available, we have used Standard & Poor's ratings. Unrated investments do not necessarily indicate low credit quality. Credit quality ratings are subject to change. Percentages exclude short-term securities.
Material Fund Changes
This is a summary of certain changes to the Fund since the beginning of the period. Effective September 30, 2024, the Fund entered into a contractual advisory fee waiver to lower the advisory fee rate payable by the Fund to VALIC to 0.48% of the Fund’s average daily net assets on the first $250 million, 0.43% of the Fund’s average daily net assets on the next $250 million, 0.38% of the Fund’s average daily net assets on the next $500 million, and 0.33% of the Fund’s average daily net assets over $1 billion. For more comprehensive information, you may review the Fund’s next prospectus, which we expect to be available by September 30, 2025 at www.corebridgefinancial.com/rs/prospectus-and-reports/annuities#underlyingfunds or upon special request at 1-800-448-2542 or by sending an e-mail request to Forms.Request@valic.com.
Changes in and Disagreements with Accountants
There were no disagreements with the accountants during the period.
This report describes changes to the Fund that occurred during the reporting period.
Fund Expenses
What were the Fund costs for the last year ?
(Based on a hypothetical $10,000 investment)
| Fund | Costs of a $10,000 investment | Costs paid as a percentage of a $10,000 investment |
| International Growth Fund* | $92 | 0.84% |
| * |
The expenses shown in the table are meant to highlight your ongoing costs only and do not reflect any fees and expenses that may be charged by the variable annuity contracts and variable life insurance policies (“Variable Contracts”) that invest in the Fund.
|
Management’s Discussion of Fund Performance
SUMMARY OF RESULTS
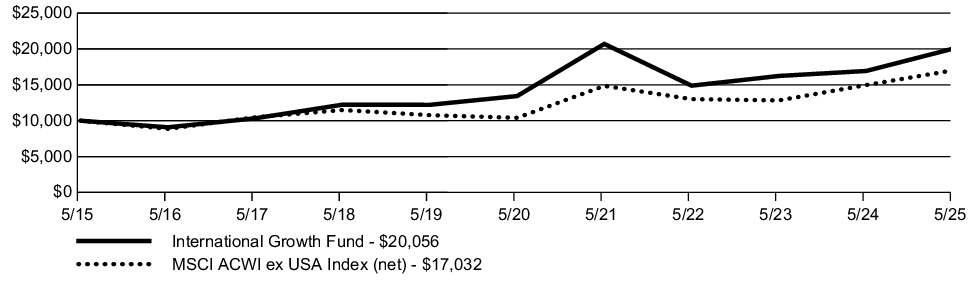
The Fund posted a return of 18.44% for the year ended May 31, 2025, compared to a return of 13.75% for the MSCI ACWI ex USA Index (net) (a broad-based securities market & Performance Index). International equities advanced, despite heightened volatility amid increased macroeconomic uncertainty during the 12-month period ending May 31, 2025.
The following is a summary of the top contributors and detractors that impacted the Fund's performance during the year relative to the Performance Index.
TOP PERFORMANCE CONTRIBUTORS
In aggregate | sector allocations; position weightings
Allocations in the following sectors | lack of allocation in energy; lack of allocation in materials; health care
Security selection in the following sectors | communication services; industrials; information technology
Position weightings | Spotify Technology SA; DSV A/S; Shopify, Inc., Class A
Exposure to the following countries | Sweden; Denmark; Canada
TOP PERFORMANCE DETRACTORS
In aggregate | country allocations
Allocations in the following sectors | consumer discretionary; financials; cash
Security selection in the following sectors | financials; health care; consumer staples
Position weightings | ASML Holding NV; LVMH Moet Hennessy Louis Vuitton SE; Evolution AB
Exposure to the following countries | Italy; Germany; France
Fund Performance
The following graph compares a $10,000 initial investment in the Fund to the index(es) listed below for the last 10 fiscal years of the Fund.
GROWTH OF $10,000
| AVERAGE ANNUAL TOTAL RETURN | 1 Year | 5 Year | 10 Year |
| International Growth Fund | 18.44% | 8.35% | 7.21% |
| MSCI ACWI ex USA Index (net) | 13.75% | 10.37% | 5.47% |
Key Fund Statistics
The following table outlines key fund statistics.
| Net assets | $381M |
| Total number of portfolio holdings | 31 |
| Total net advisory fee paid | $2.6M |
| Portfolio turnover rate during the reporting period | 17% |
Graphical Representation of Holdings
The information below represents the composition of the Fund's net assets as of the end of the period.
Top Industries*
| Internet | 15.9% |
| Apparel | 13.4% |
| Transportation | 11.8% |
| Retail | 8.9% |
| Semiconductors | 8.5% |
| Banks | 8.4% |
| Electrical Components & Equipment | 4.7% |
| Healthcare-Products | 4.2% |
| Cosmetics/Personal Care | 4.1% |
| Machinery-Diversified | 3.8% |
| Diversified Financial Services | 3.2% |
| Insurance | 2.7% |
| Media | 2.4% |
| Private Equity | 2.2% |
| Commercial Services | 1.8% |
Portfolio Composition

Country
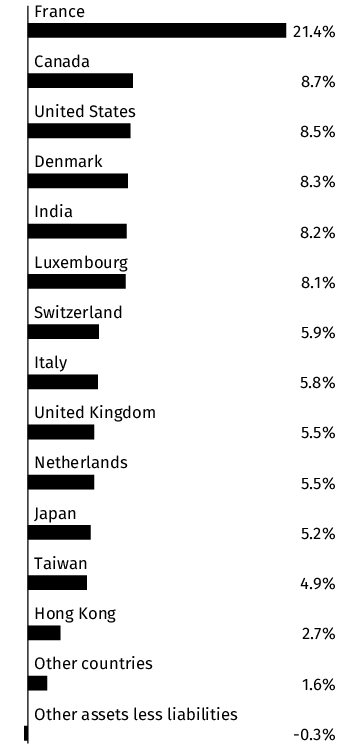
* Percentages exclude derivatives (other than purchased options), if any.
Material Fund Changes
This is a summary of certain changes to the Fund since the beginning of the period. Effective September 30, 2024, the Fund clarified that its subadvisor, Morgan Stanley Investment Management Inc., may delegate certain of its investment advisory services to Morgan Stanley Investment Management Company, an affiliated investment adviser. Additionally, effective September 30, 2024, the contractual advisory fee waiver was amended to lower the advisory fee rate payable by the Fund to VALIC to 0.69% of the Fund’s average daily net assets on the first $250 million, 0.64% of the Fund’s average daily net assets on the next $250 million, 0.59% of the Fund’s average daily net assets on the next $500 million and 0.54% of the Fund’s average daily net assets over $1 billion. For more comprehensive information, you may review the Fund’s next prospectus, which we expect to be available by September 30, 2025 at www.corebridgefinancial.com/rs/prospectus-and-reports/annuities#underlyingfunds or upon special request at 1-800-448-2542 or by sending an e-mail request to Forms.Request@valic.com.
Changes in and Disagreements with Accountants
There were no disagreements with the accountants during the period.
This report describes changes to the Fund that occurred during the reporting period.
Fund Expenses
What were the Fund costs for the last year ?
(Based on a hypothetical $10,000 investment)
| Fund | Costs of a $10,000 investment | Costs paid as a percentage of a $10,000 investment |
| Large Capital Growth Fund* | $74 | 0.72% |
| * |
The expenses shown in the table are meant to highlight your ongoing costs only and do not reflect any fees and expenses that may be charged by the variable annuity contracts and variable life insurance policies (“Variable Contracts”) that invest in the Fund.
|
Management’s Discussion of Fund Performance
SUMMARY OF RESULTS
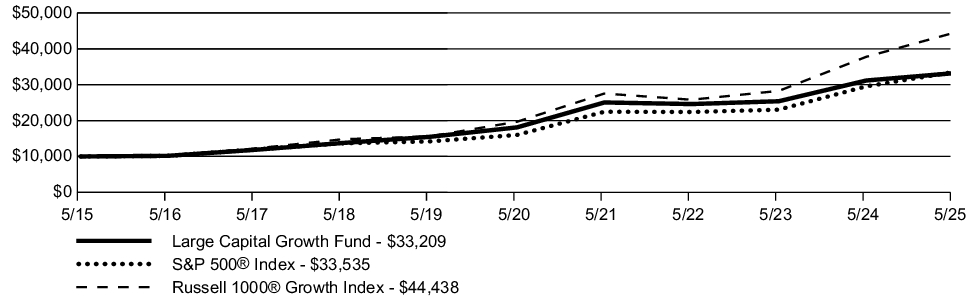
The Fund posted a return of 6.55% for the year ended May 31, 2025, compared to a return of 13.52% for the S&P 500® Index (a broad-based securities market index) and 17.62% for the Russell 1000® Growth Index (the "Performance Index"). Over the period, U.S. large-cap equities outperformed mid- and small-cap equities, according to the Russell® family of indices. Growth-oriented stocks outperformed value stocks across the market-cap spectrum.
The following is a summary of the top contributors and detractors that impacted the Fund's performance during the year relative to the Performance Index.
TOP PERFORMANCE CONTRIBUTORS
Allocations in the following sectors | utilities; financials; industrials
Security selection in the following sectors | financials; materials
Position weightings | Apple, Inc.; lack of a position in Eli Lilly & Co.; Alphabet, Inc., Class A
TOP PERFORMANCE DETRACTORS
In aggregate | position weightings
Allocations in the following sectors | health care; consumer discretionary; consumer staples
Security selection in the following sectors | consumer discretionary; consumer staples; industrials
Position weightings | lack of a position in Broadcom, Inc.; lack of a position in Tesla, Inc.; ICON PLC
Fund Performance
The following graph compares a $10,000 initial investment in the Fund to the index(es) listed below for the last 10 fiscal years of the Fund.
GROWTH OF $10,000
| AVERAGE ANNUAL TOTAL RETURN | 1 Year | 5 Year | 10 Year |
| Large Capital Growth Fund | 6.55% | 12.89% | 12.75% |
| S&P 500® Index | 13.52% | 15.94% | 12.86% |
| Russell 1000® Growth Index | 17.62% | 17.69% | 16.08% |
Key Fund Statistics
The following table outlines key fund statistics.
| Net assets | $587M |
| Total number of portfolio holdings | 57 |
| Total net advisory fee paid | $3.8M |
| Portfolio turnover rate during the reporting period | 18% |
Graphical Representation of Holdings
The information below represents the composition of the Fund's net assets as of the end of the period.
Top Industries*
| Software | 18.6% |
| Diversified Financial Services | 9.0% |
| Semiconductors | 8.6% |
| Computers | 8.6% |
| Healthcare-Products | 7.6% |
| Electronics | 6.7% |
| Internet | 4.0% |
| Insurance | 3.7% |
| Commercial Services | 3.7% |
| Electrical Components & Equipment | 3.0% |
| Retail | 2.9% |
| Household Products/Wares | 2.3% |
| Electric | 2.1% |
| Cosmetics/Personal Care | 2.1% |
| REITS | 2.0% |
Portfolio Composition

* Percentages exclude derivatives (other than purchased options), if any.
Material Fund Changes
This is a summary of certain changes to the Fund since the beginning of the period. Effective September 30, 2024, the Fund entered into a contractual advisory fee waiver to lower the advisory fee rate payable by the Fund to VALIC to 0.59% of the Fund’s average daily net assets on the first $750 million, and 0.54% of the Fund’s average daily net assets over $750 million. For more comprehensive information, you may review the Fund’s next prospectus, which we expect to be available by September 30, 2025 at www.corebridgefinancial.com/rs/prospectus-and-reports/annuities#underlyingfunds or upon special request at 1-800-448-2542 or by sending an e-mail request to Forms.Request@valic.com.
Changes in and Disagreements with Accountants
There were no disagreements with the accountants during the period.
This report describes changes to the Fund that occurred during the reporting period.
Fund Expenses
What were the Fund costs for the last year ?
(Based on a hypothetical $10,000 investment)
| Fund | Costs of a $10,000 investment | Costs paid as a percentage of a $10,000 investment |
| Mid Cap Index Fund* | $36 | 0.36% |
| * |
The expenses shown in the table are meant to highlight your ongoing costs only and do not reflect any fees and expenses that may be charged by the variable annuity contracts and variable life insurance policies (“Variable Contracts”) that invest in the Fund.
|
Management’s Discussion of Fund Performance
SUMMARY OF RESULTS
The Fund is managed to seek to track the performance of the Index. The Subadviser may endeavor to track the Index by purchasing every stock included in the Index, in the same proportions; or, in the alternative, the Subadviser may invest in a sampling of Index stocks by utilizing a statistical technique known as "optimization".
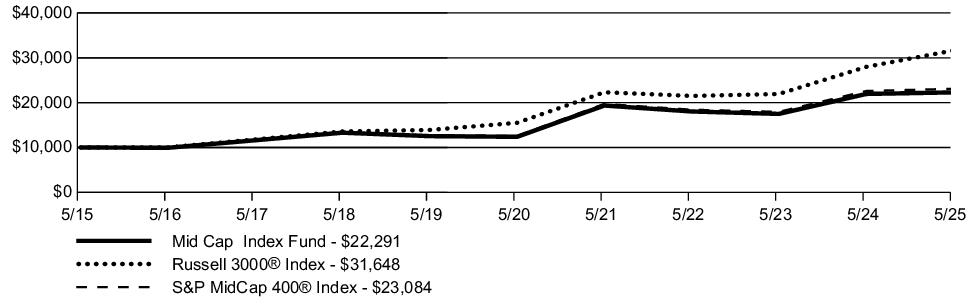
The Fund posted a return of 1.60% for the year ended May 31, 2025, compared to a return of 13.12% for the Russell 3000® Index (a broad-based securities market index) and 2.17% for the S&P MidCap 400® Index (the "Performance Index"). Over the period, U.S. large-cap equities outperformed mid- and small-cap equities, according to the Russell® family of indices. Growth-oriented stocks outperformed value stocks across the market-cap spectrum.
The following is a summary of the top contributors and detractors that impacted the Fund's performance during the year.
TOP PERFORMANCE CONTRIBUTORS
BlackRock Investment Management, LLC - see Material Fund Changes for the time period covered | Allocations in the following sectors: industrials; consumer discretionary; financials. Position weightings: Duolingo, Inc. Class A; Hims & Hers Health, Inc.; Interactive Brokers Group, Inc., Class A
SunAmerica Asset Management, LLC - see Material Fund Changes for the time period covered | Allocations in the following sectors: finance; utilities; business services. Position weightings: Texas Pacific Land Corp.; Sprouts Farmers Market, Inc.; Duolingo, Inc., Class A
TOP PERFORMANCE DETRACTORS
BlackRock Investment Management, LLC - see Material Fund Changes for the time period covered | Allocations in the following sectors: none. Position weightings: Okta, Inc.; Sarepta Therapeutics, Inc.; Fidelity National Financial, Inc.
SunAmerica Asset Management, LLC - see Material Fund Changes for the time period covered | Allocations in the following sectors: consumer cyclicals; energy; industrials. Position weightings: Celsius Holdings, Inc.; e.l.f. Beauty, Inc.; Avantor, Inc.
Fund Performance
The following graph compares a $10,000 initial investment in the Fund to the index(es) listed below for the last 10 fiscal years of the Fund.
GROWTH OF $10,000
| AVERAGE ANNUAL TOTAL RETURN | 1 Year | 5 Year | 10 Year |
| Mid Cap Index Fund | 1.60% | 12.49% | 8.35% |
| Russell 3000® Index | 13.12% | 15.34% | 12.21% |
| S&P MidCap 400® Index | 2.17% | 12.93% | 8.73% |
Key Fund Statistics
The following table outlines key fund statistics.
| Net assets | $2,550M |
| Total number of portfolio holdings | 404 |
| Total net advisory fee paid | $7.4M |
| Portfolio turnover rate during the reporting period | 18% |
Graphical Representation of Holdings
The information below represents the composition of the Fund's net assets as of the end of the period.
Top Industries*
| REITS | 7.2% |
| Banks | 6.2% |
| Retail | 6.2% |
| Insurance | 5.2% |
| Software | 4.4% |
| Diversified Financial Services | 3.8% |
| Commercial Services | 3.7% |
| Computers | 3.6% |
| Machinery-Diversified | 3.4% |
| Electronics | 3.1% |
| Engineering & Construction | 2.9% |
| Food | 2.9% |
| Oil & Gas | 2.7% |
| Biotechnology | 2.6% |
| Healthcare-Services | 2.4% |
Portfolio Composition
* Percentages exclude derivatives (other than purchased options), if any.
Material Fund Changes
This is a summary of certain changes to the Fund since the beginning of the period. Effective April 30, 2025, BlackRock Investment Management, LLC was appointed as subadviser to the Fund, replacing the existing subadvisor, SunAmerica Asset Management, LLC. Additionally, changes to the Fund’s investment strategies and techniques were adjusted to match the investment processes and techniques used by the subadviser. As a result of these changes, derivatives risk was added as a principal risk. Additionally, effective September 30, 2024, the Fund entered into a contractual advisory fee waiver to lower the advisory fee rate payable by the Fund to VALIC to 0.34% of the Fund’s average daily net assets on the first $500 million, 0.24% of the Fund’s average daily net assets on the next $2.5 billion, 0.19% of the Fund’s average daily net assets on the next $2 billion, and 0.14% of the Fund’s average daily net assets over $5 billion. For more comprehensive information, you may review the Fund’s next prospectus, which we expect to be available by September 30, 2025 at www.corebridgefinancial.com/rs/prospectus-and-reports/annuities#underlyingfunds or upon special request at 1-800-448-2542 or by sending an e-mail request to Forms.Request@valic.com.
Changes in and Disagreements with Accountants
There were no disagreements with the accountants during the period.
Fund Expenses
What were the Fund costs for the last year ?
(Based on a hypothetical $10,000 investment)
| Fund | Costs of a $10,000 investment | Costs paid as a percentage of a $10,000 investment |
| Mid Cap Strategic Growth Fund* | $79 | 0.74% |
| * |
The expenses shown in the table are meant to highlight your ongoing costs only and do not reflect any fees and expenses that may be charged by the variable annuity contracts and variable life insurance policies (“Variable Contracts”) that invest in the Fund.
|
Management’s Discussion of Fund Performance
SUMMARY OF RESULTS
The Fund posted a return of 13.34% for the year ended May 31, 2025, compared to a return of 13.12% for the Russell 3000® Index (a broad-based securities market index) and 23.23% for the Russell Midcap® Growth Index (the "Performance Index"). The U.S. equity market delivered positive returns for the 12-month period ended May 31, 2025. TheU.S. economy continued to grow, supported by relatively low unemployment. The equity market advance was narrow, however, with investors favoring mostly large-cap growth stocks with exposure to artificial intelligence (AI) in the second half of 2024. Moderating inflation led the Federal Reserve to cut rates three times in the second half of 2024, but policymakers signaled they would be slow to cut rates in 2025 given persistent inflation risks.
The following is a summary, by subadviser, of the top contributors and detractors that impacted their portion of the Fund's performance during the year relative to the Performance Index.
TOP PERFORMANCE CONTRIBUTORS
Janus Henderson Investors US LLC | In aggregate: sector allocations. Allocations in the following sectors: utilities; consumer discretionary; consumer staples. Security selection in the following sectors: consumer discretionary; materials; cash. Position weightings: lack of position in Super Micro Computer, Inc.; lack of position in Dexcom, Inc.; lack of position in Deckers Outdoor Corp.
Voya Investment Management Co. LLC | Allocations in the following sectors: consumer discretionary; real estate; industrials. Security selection in the following sectors: information technology; financials; materials. Position weightings: lack of position in Super Micro Computer, Inc.; AppLovin Corp., Class A; Interactive Brokers Group Inc., Class A
TOP PERFORMANCE DETRACTORS
Janus Henderson Investors US LLC | In aggregate: position weightings. Allocations in the following sectors: health care; cash; real estate. Security selection in the following sectors: information technology; industrials; health care. Position weightings: lack of position in Palantir Technologies, Inc., Class A; Teleflex, Inc.; ON Semiconductor Corp.
Voya Investment Management Co. LLC | In aggregate: position weightings; sector allocations. Allocations in the following sectors: materials; health care; cash. Security selection in the following sectors: industrials; energy; consumer discretionary. Position weightings: lack of position in Axon Enterprise, Inc.; CACI International, Inc., Class A; lack of position in ROBLOX Corp., Class A
Fund Performance
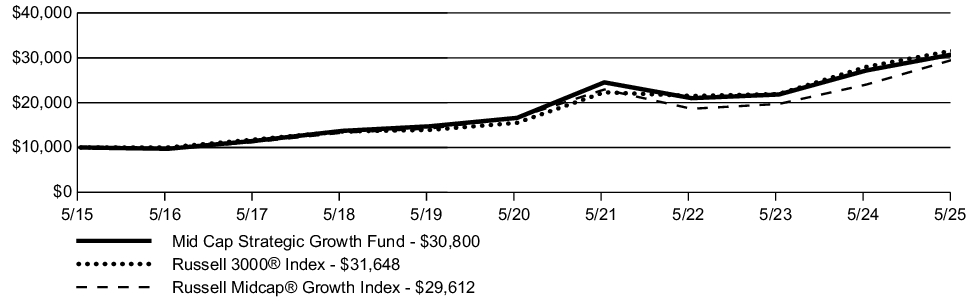
The following graph compares a $10,000 initial investment in the Fund to the index(es) listed below for the last 10 fiscal years of the Fund.
GROWTH OF $10,000
| AVERAGE ANNUAL TOTAL RETURN | 1 Year | 5 Year | 10 Year |
| Mid Cap Strategic Growth Fund | 13.34% | 13.15% | 11.91% |
| Russell 3000® Index | 13.12% | 15.34% | 12.21% |
| Russell Midcap® Growth Index | 23.23% | 12.22% | 11.47% |
Key Fund Statistics
The following table outlines key fund statistics.
| Net assets | $1,190M |
| Total number of portfolio holdings | 145 |
| Total net advisory fee paid | $6.7M |
| Portfolio turnover rate during the reporting period | 52% |
Graphical Representation of Holdings
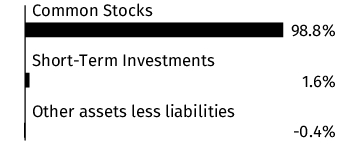
The information below represents the composition of the Fund's net assets as of the end of the period.
Top Industries*
| Software | 19.5% |
| Healthcare-Products | 8.6% |
| Diversified Financial Services | 6.0% |
| Retail | 5.9% |
| Computers | 4.0% |
| Insurance | 4.0% |
| Commercial Services | 3.8% |
| Internet | 3.7% |
| Aerospace/Defense | 3.6% |
| Semiconductors | 3.4% |
| Electric | 3.0% |
| Electronics | 3.0% |
| Entertainment | 2.9% |
| Short-Term Investments | 2.2% |
| Pipelines | 2.0% |
Portfolio Composition

* Percentages exclude derivatives (other than purchased options), if any.
Material Fund Changes
There were no material fund changes during the period.
Changes in and Disagreements with Accountants
There were no disagreements with the accountants during the period.
This report describes changes to the Fund that occurred during the reporting period.
Fund Expenses
What were the Fund costs for the last year ?
(Based on a hypothetical $10,000 investment)
| Fund | Costs of a $10,000 investment | Costs paid as a percentage of a $10,000 investment |
| Nasdaq-100® Index Fund* | $45 | 0.42% |
| * |
The expenses shown in the table are meant to highlight your ongoing costs only and do not reflect any fees and expenses that may be charged by the variable annuity contracts and variable life insurance policies (“Variable Contracts”) that invest in the Fund.
|
Management’s Discussion of Fund Performance
SUMMARY OF RESULTS
The Fund is managed to seek to track the performance of the Index. The Subadviser may endeavor to track the Index by purchasing every stock included in the Index, in the same proportions; or, in the alternative, the Subadviser may invest in a sampling of Index stocks by utilizing a statistical technique known as "optimization".
The Fund posted a return of 15.41% for the year ended May 31, 2025, compared to a return of 13.52% for the S&P 500® Index (a broad-based securities market index) and 16.02% for the Nasdaq-100® Index (the "Performance Index"). Over the period, U.S. large-cap equities outperformed mid- and small-cap equities, according to the Russell® family of indices. Growth-oriented stocks outperformed value stocks across the market-cap spectrum.
The following is a summary of the top contributors and detractors that impacted the Fund's performance during the year.
TOP PERFORMANCE CONTRIBUTORS
BlackRock Investment Management, LLC - see Material Fund Changes for the time period covered | Allocations in the following sectors: information technology; consumer discretionary; communication services. Position weightings: Microsoft Corp.; NVIDIA Corp.; Broadcom, Inc.
SunAmerica Asset Management, LLC - see Material Fund Changes for the time period covered | Allocations in the following sectors: technology; consumer cyclicals; business services. Position weightings: Broadcom, Inc.; Tesla, Inc.; Netflix, Inc.
TOP PERFORMANCE DETRACTORS
BlackRock Investment Management, LLC - see Material Fund Changes for the time period covered | Allocations in the following sectors: real estate. Position weightings: Apple, Inc.; Vertex Pharmaceuticals, Inc.; Regeneron Pharmaceuticals, Inc.
SunAmerica Asset Management, LLC - see Material Fund Changes for the time period covered | Allocations in the following sectors: healthcare; energy; industrials. Position weightings: Advanced Micro Devices, Inc.; QUALCOMM, Inc.; Intel Corp.
Fund Performance
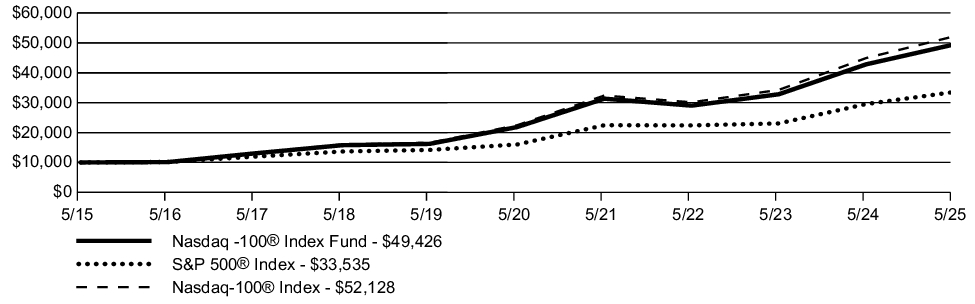
The following graph compares a $10,000 initial investment in the Fund to the index(es) listed below for the last 10 fiscal years of the Fund.
GROWTH OF $10,000
| AVERAGE ANNUAL TOTAL RETURN | 1 Year | 5 Year | 10 Year |
| Nasdaq-100® Index Fund | 15.41% | 17.75% | 17.33% |
| S&P 500® Index | 13.52% | 15.94% | 12.86% |
| Nasdaq-100® Index | 16.02% | 18.37% | 17.96% |
Key Fund Statistics
The following table outlines key fund statistics.
| Net assets | $1,018M |
| Total number of portfolio holdings | 105 |
| Total net advisory fee paid | $3.0M |
| Portfolio turnover rate during the reporting period | 10% |
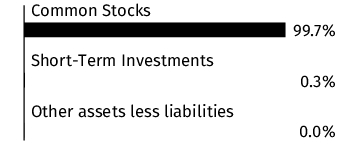
Graphical Representation of Holdings
The information below represents the composition of the Fund's net assets as of the end of the period.
Top Industries*
| Internet | 22.1% |
| Semiconductors | 21.6% |
| Software | 17.6% |
| Computers | 9.3% |
| Retail | 4.4% |
| Auto Manufacturers | 3.5% |
| Telecommunications | 3.3% |
| Biotechnology | 3.0% |
| Commercial Services | 2.1% |
| Beverages | 2.0% |
| Healthcare-Products | 1.7% |
| Electric | 1.5% |
| Chemicals | 1.4% |
| Media | 1.3% |
| Electronics | 0.9% |
Portfolio Composition
* Percentages exclude derivatives (other than purchased options), if any.
Material Fund Changes
This is a summary of certain changes to the Fund since the beginning of the period. Effective April 30, 2025, BlackRock Investment Management, LLC was appointed as subadviser to the Fund, replacing the existing subadvisor, SunAmerica Asset Management, LLC. Additionally, changes to the Fund’s investment strategies and techniques were adjusted to match the investment processes and techniques used by the subadviser. For more comprehensive information, you may review the Fund’s next prospectus, which we expect to be available by September 30, 2025 at www.corebridgefinancial.com/rs/prospectus-and-reports/annuities#underlyingfunds or upon special request at 1-800-448-2542 or by sending an e-mail request to Forms.Request@valic.com.
Changes in and Disagreements with Accountants
There were no disagreements with the accountants during the period.
This report describes changes to the Fund that occurred during the reporting period.
Fund Expenses
What were the Fund costs for the last year ?
(Based on a hypothetical $10,000 investment)
| Fund | Costs of a $10,000 investment | Costs paid as a percentage of a $10,000 investment |
| Science & Technology Fund* | $97 | 0.90% |
| * |
The expenses shown in the table are meant to highlight your ongoing costs only and do not reflect any fees and expenses that may be charged by the variable annuity contracts and variable life insurance policies (“Variable Contracts”) that invest in the Fund.
|
Management’s Discussion of Fund Performance
SUMMARY OF RESULTS
The Fund posted a return of 16.20% for the year ended May 31, 2025, compared to 13.52% for the S&P 500® Index (a broad-based securities market index) and 16.50% for the S&P North American Technology Sector Index (the "Performance Index"). Over the annual period, global equity markets have provided strong results across broad indices. Technology stocks were higher thanks to favorable underlying fundamentals and earnings growth.
The following is a summary, by subadviser, of the top contributors and detractors that impacted their portion of the Fund's performance during the year relative to the Performance Index.
TOP PERFORMANCE CONTRIBUTORS
BlackRock Investment Management, LLC | In aggregate: position weightings. Allocations in the following industries: entertainment; automobiles; financial services. Security selection in the following industries: semiconductors & semiconductor equipment; entertainment; technology hardware, storage & peripherals. Position weightings: Spotify Technology SA; Alphabet, Inc., Class A; QUALCOMM, Inc.
Voya Investment Management Co. LLC | In aggregate: position weightings. Allocations in the following industries: entertainment; capital markets; technology hardware storage & peripherals. Security selection in the following industries: software; entertainment; semiconductors & semiconductor equipment. Position weightings: Palantir Technologies, Inc., Class A; Cloudflare, Inc., Class A; Netflix, Inc.
Wellington Management Company, LLP - see Material Fund Changes for the time period covered | Allocations in the following industries: semiconductors & semiconductor equipment; professional services; ground transportation. Security selection in the following industries: electronic equipment, instruments & components; technology hardware, storage & peripherals; semiconductors & semiconductor equipment. Position weightings: lack of position in QUALCOMM, Inc.; lack of position in Intel Corp.; Chroma ATE, Inc.
TOP PERFORMANCE DETRACTORS
BlackRock Investment Management, LLC | In aggregate: industry allocations. Allocations in the following industries: IT services; semiconductors & semiconductor equipment; electrical equipment. Security selection in the following industries: software; IT services; communications equipment. Position weightings: lack of a position in Palantir Technologies, Inc., Class A; ASML Holding NV; Meta Platforms, Inc., Class A
Voya Investment Management Co. LLC | Allocations in the following industries: IT services; communication equipment; broadline retail. Security selection in the following industries: interactive media & services; technology hardware storage & peripherals; communication equipment. Position weightings: Alphabet, Inc., Class C; KraneShares CSI China Internet ETF; MicroStrategy, Inc., Class A
Wellington Management Company, LLP - see Material Fund Changes for the time period covered | Allocations in the following industries: technology hardware, storage & peripherals; IT services; electronic equipment, instruments & components. Security selection in the following industries: software; IT services . Position weightings: Broadcom, Inc.; Apple, Inc.; lack of position in Oracle Corp.
Fund Performance
The following graph compares a $10,000 initial investment in the Fund to the index(es) listed below for the last 10 fiscal years of the Fund.
GROWTH OF $10,000
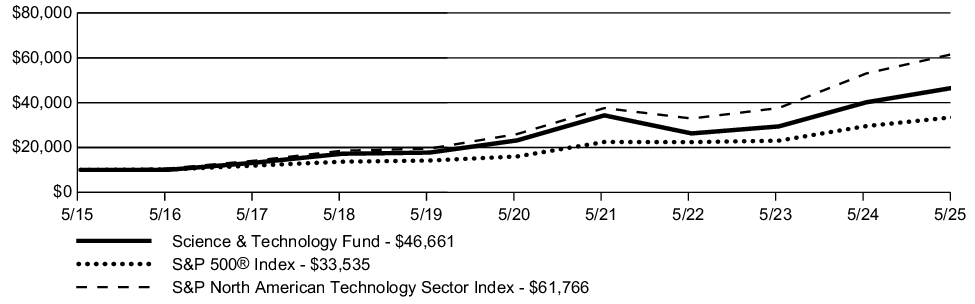
| AVERAGE ANNUAL TOTAL RETURN | 1 Year | 5 Year | 10 Year |
| Science & Technology Fund | 16.20% | 15.03% | 16.65% |
| S&P 500® Index | 13.52% | 15.94% | 12.86% |
| S&P North American Technology Sector Index | 16.50% | 18.91% | 19.97% |
Key Fund Statistics
The following table outlines key fund statistics.
| Net assets | $2,778M |
| Total number of portfolio holdings | 103 |
| Total net advisory fee paid | $22.6M |
| Portfolio turnover rate during the reporting period | 67% |
Graphical Representation of Holdings
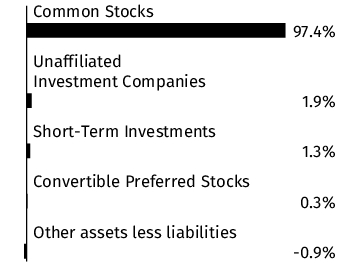
The information below represents the composition of the Fund's net assets as of the end of the period.
Top Industries*
| Software | 30.6% |
| Semiconductors | 26.6% |
| Internet | 18.5% |
| Computers | 12.9% |
| Unaffiliated Investment Companies | 1.9% |
| Commercial Services | 1.8% |
| Diversified Financial Services | 1.8% |
| Telecommunications | 1.3% |
| Short-Term Investments | 1.3% |
| Electronics | 1.2% |
| Media | 0.8% |
| Auto Manufacturers | 0.7% |
| Machinery-Construction & Mining | 0.7% |
| Toys/Games/Hobbies | 0.4% |
| Automotive - Cars & Lt. Trucks | 0.1% |
Portfolio Composition
* Percentages exclude derivatives (other than purchased options), if any.
Material Fund Changes
This is a summary of certain changes to the Fund since the beginning of the period. Effective September 30, 2024, BlackRock Investment Management, LLC and Voya Investment Management Co. LLC replaced Wellington Management Company LLP as subadvisers to the Fund. For more comprehensive information, you may review the Fund’s next prospectus, which we expect to be available by September 30, 2025 at www.corebridgefinancial.com/rs/prospectus-and-reports/annuities#underlyingfunds or upon special request at 1-800-448-2542 or by sending an e-mail request to Forms.Request@valic.com.
Changes in and Disagreements with Accountants
There were no disagreements with the accountants during the period.
This report describes changes to the Fund that occurred during the reporting period.
Fund Expenses
What were the Fund costs for the last year ?
(Based on a hypothetical $10,000 investment)
| Fund | Costs of a $10,000 investment | Costs paid as a percentage of a $10,000 investment |
| Systematic Growth Fund* | $69 | 0.64% |
| * |
The expenses shown in the table are meant to highlight your ongoing costs only and do not reflect any fees and expenses that may be charged by the variable annuity contracts and variable life insurance policies (“Variable Contracts”) that invest in the Fund.
|
Management’s Discussion of Fund Performance
SUMMARY OF RESULTS
The Fund posted a return of 15.29% for the year ended May 31, 2025, compared to a return of 13.52% for the S&P 500® Index (a broad-based securities market index) and 17.62% for the Russell 1000® Growth Index (the "Performance Index"). U.S. growth stocks, as measured by the Russell 1000® Growth Index, rose during the 1-year period. Against this backdrop, factor behavior was mixed, as investors reacted to ever evolving uncertainties. During the period, growth stocks with positive fundamental trend outperformed, while higher quality growth and attractively priced growth stocks generally underperformed.
The following is a summary, by subadviser, of the top contributors and detractors that impacted their portion of the Fund's performance during the year relative to the Performance Index.
TOP PERFORMANCE CONTRIBUTORS
Goldman Sachs Asset Management, LLC | Allocations in the following sectors: health care; utilities; financials. Security selection in the following sectors: consumer staples; utilities. Position weightings: Advanced Micro Devices, Inc.; AppLovin Corp., Class A; Twilio, Inc., Class A
Wellington Management Company, LLP | Allocations in the following sectors: financials; consumer staples; communication services. Security selection in the following sectors: information technology; industrials; financials. Position weightings: Comfort Systems USA, Inc.; Broadcom, Inc.; lack of position QUALCOMM, Inc.
TOP PERFORMANCE DETRACTORS
Goldman Sachs Asset Management, LLC | In aggregate: position weightings. Allocations in the following sectors: industrials; cash; communication services. Security selection in the following sectors: consumer discretionary; communication services; information technology. Position weightings: Tesla, Inc.; Palantir Technologies, Inc., Class A; Broadcom, Inc.
Wellington Management Company, LLP | Allocations in the following sectors: health care; cash; consumer discretionary. Security selection in the following sectors: consumer discretionary; health care; consumer staples. Position weightings: Merck & Co., Inc.; Palantir Technologies, Inc., Class A; Tesla, Inc.
Fund Performance
The following graph compares a $10,000 initial investment in the Fund to the index(es) listed below for the last 10 fiscal years of the Fund.
GROWTH OF $10,000
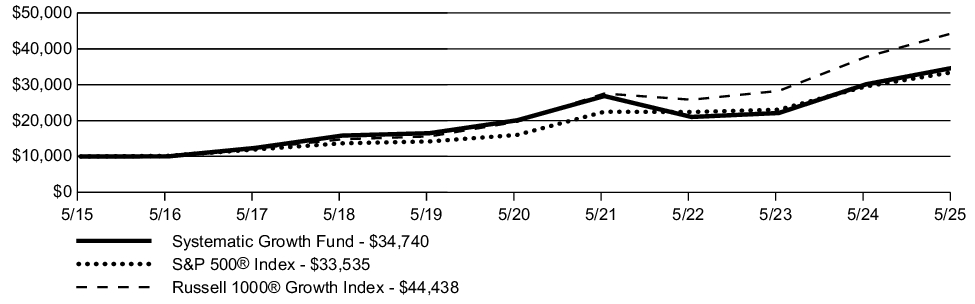
| AVERAGE ANNUAL TOTAL RETURN | 1 Year | 5 Year | 10 Year |
| Systematic Growth Fund | 15.29% | 11.59% | 13.26% |
| S&P 500® Index | 13.52% | 15.94% | 12.86% |
| Russell 1000® Growth Index | 17.62% | 17.69% | 16.08% |
Key Fund Statistics
The following table outlines key fund statistics.
| Net assets | $986M |
| Total number of portfolio holdings | 299 |
| Total net advisory fee paid | $5.4M |
| Portfolio turnover rate during the reporting period | 46% |
Graphical Representation of Holdings
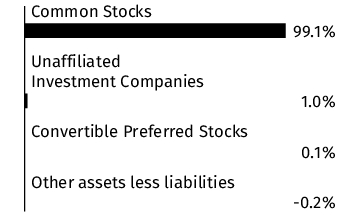
The information below represents the composition of the Fund's net assets as of the end of the period.
Top Industries*
| Internet | 21.6% |
| Software | 18.7% |
| Semiconductors | 16.3% |
| Computers | 10.6% |
| Diversified Financial Services | 5.5% |
| Retail | 4.4% |
| Pharmaceuticals | 3.9% |
| Auto Manufacturers | 2.7% |
| Commercial Services | 2.5% |
| Insurance | 1.8% |
| Engineering & Construction | 1.1% |
| Unaffiliated Investment Companies | 1.0% |
| Healthcare-Products | 1.0% |
| Electronics | 0.9% |
| Biotechnology | 0.9% |
Portfolio Composition
* Percentages exclude derivatives (other than purchased options), if any.
Material Fund Changes
This is a summary of certain changes to the Fund since the beginning of the period. Effective September 30, 2024, active trading risk was added as a principal risk of the Fund. For more comprehensive information, you may review the Fund’s next prospectus, which we expect to be available by September 30, 2025 at www.corebridgefinancial.com/rs/prospectus-and-reports/annuities#underlyingfunds or upon special request at 1-800-448-2542 or by sending an e-mail request to Forms.Request@valic.com.
Changes in and Disagreements with Accountants
There were no disagreements with the accountants during the period.
This report describes changes to the Fund that occurred during the reporting period.
Fund Expenses
What were the Fund costs for the last year ?
(Based on a hypothetical $10,000 investment)
| Fund | Costs of a $10,000 investment | Costs paid as a percentage of a $10,000 investment |
| Small Cap Index Fund* | $38 | 0.38% |
| * |
The expenses shown in the table are meant to highlight your ongoing costs only and do not reflect any fees and expenses that may be charged by the variable annuity contracts and variable life insurance policies (“Variable Contracts”) that invest in the Fund.
|
Management’s Discussion of Fund Performance
SUMMARY OF RESULTS
The Fund is managed to seek to track the performance of the Index. The Subadviser may endeavor to track the Index by purchasing every stock included in the Index, in the same proportions; or, in the alternative, the Subadviser may invest in a sampling of Index stocks by utilizing a statistical technique known as "optimization".
The Fund posted a return of 0.73% for the year ended May 31, 2025, compared to a return of 13.12% for the Russell 3000® Index (a broad-based securities market index) and 1.19% for the Russell 2000® Index (the "Performance Index"). Over the period, U.S. large-cap equities outperformed mid- and small-cap equities, according to the Russell® family of indices. Growth-oriented stocks outperformed value stocks across the market-cap spectrum.
The following is a summary of the top contributors and detractors that impacted the Fund's performance during the year.
TOP PERFORMANCE CONTRIBUTORS
BlackRock Investment Management, LLC - see Material Fund Changes for the time period covered | Allocations in the following sectors: industrials, information technology; consumer discretionary. Position weightings: Hims & Hers Health, Inc.; FTAI Aviation, Ltd.; IonQ, Inc.
SunAmerica Asset Management, LLC - see Material Fund Changes for the time period covered | Allocations in the following sectors: finance; consumer non-cyclicals; utilities. Position weightings: Sprouts Farmers Market, Inc.; Rocket Lab USA, Inc.; Carpenter Technology Corp.
TOP PERFORMANCE DETRACTORS
BlackRock Investment Management, LLC - see Material Fund Changes for the time period covered | Allocations in the following sectors: health care; utilities. Position weightings: Lantheus Holdings, Inc.; TG Therapeutics, Inc.; Lyell Immunopharma, Inc.
SunAmerica Asset Management, LLC - see Material Fund Changes for the time period covered | Allocations in the following sectors: energy; consumer cyclicals; healthcare. Position weightings: Abercrombie & Fitch Co., Class A; Vaxcyte, Inc.; Tidewater, Inc.
Fund Performance
The following graph compares a $10,000 initial investment in the Fund to the index(es) listed below for the last 10 fiscal years of the Fund.
GROWTH OF $10,000
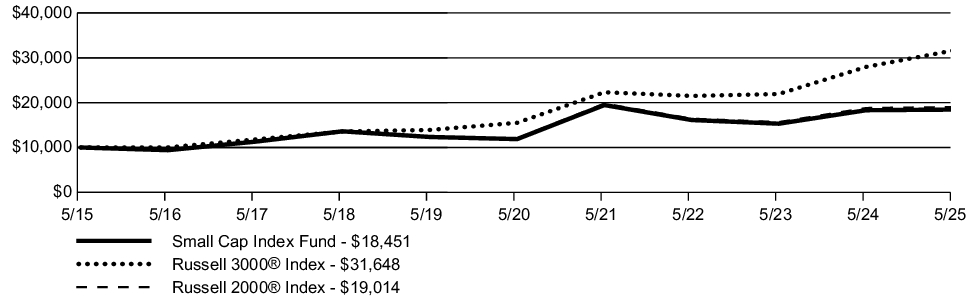
| AVERAGE ANNUAL TOTAL RETURN | 1 Year | 5 Year | 10 Year |
| Small Cap Index Fund | 0.73% | 9.22% | 6.32% |
| Russell 3000® Index | 13.12% | 15.34% | 12.21% |
| Russell 2000® Index | 1.19% | 9.64% | 6.64% |
Key Fund Statistics
The following table outlines key fund statistics.
| Net assets | $1,055M |
| Total number of portfolio holdings | 1,888 |
| Total net advisory fee paid | $2.6M |
| Portfolio turnover rate during the reporting period | 28% |
Graphical Representation of Holdings
The information below represents the composition of the Fund's net assets as of the end of the period.
Top Industries*
| Banks | 8.7% |
| Biotechnology | 7.0% |
| REITS | 6.2% |
| Short-Term Investments | 5.9% |
| Software | 5.4% |
| Commercial Services | 4.7% |
| Retail | 3.7% |
| Diversified Financial Services | 3.1% |
| Healthcare-Products | 2.9% |
| Electronics | 2.7% |
| Insurance | 2.5% |
| Pharmaceuticals | 2.5% |
| Computers | 2.3% |
| Aerospace/Defense | 2.3% |
| Engineering & Construction | 2.2% |
Portfolio Composition
* Percentages exclude derivatives (other than purchased options), if any.
Material Fund Changes
This is a summary of certain changes to the Fund since the beginning of the period. Effective April 30, 2025, BlackRock Investment Management, LLC was appointed as subadviser to the Fund, replacing the existing subadvisor, SunAmerica Asset Management, LLC. Additionally, changes to the Fund’s investment strategies and techniques were adjusted to match the investment processes and techniques used by the subadviser. As a result of these changes, derivatives risk was added as a principal risk. Additionally, effective September 30, 2024, the contractual advisory fee waiver was amended to lower the advisory fee rate payable by the Fund to VALIC to 0.29% of the Fund’s average daily net assets on the first $500 million, 0.19% of the Fund’s average daily net assets on the next $2.5 billion, 0.14% of the Fund’s average daily net assets on the next $2 billion, and 0.09% of the Fund’s average daily net assets over $5 billion. For more comprehensive information, you may review the Fund’s next prospectus, which we expect to be available by September 30, 2025 at www.corebridgefinancial.com/rs/prospectus-and-reports/annuities#underlyingfunds or upon special request at 1-800-448-2542 or by sending an e-mail request to Forms.Request@valic.com.
Changes in and Disagreements with Accountants
There were no disagreements with the accountants during the period.
This report describes changes to the Fund that occurred during the reporting period.
Fund Expenses
What were the Fund costs for the last year ?
(Based on a hypothetical $10,000 investment)
| Fund | Costs of a $10,000 investment | Costs paid as a percentage of a $10,000 investment |
| International Socially Responsible Fund* | $61 | 0.58% |
| * |
The expenses shown in the table are meant to highlight your ongoing costs only and do not reflect any fees and expenses that may be charged by the variable annuity contracts and variable life insurance policies (“Variable Contracts”) that invest in the Fund.
|
Management’s Discussion of Fund Performance
SUMMARY OF RESULTS
The Fund is an optimized portfolio which seeks to track the MSCI EAFE Index (net), while investing in socially responsive companies. The Fund's criteria do not permit investment in companies whose businesses rely significantly on alcohol, firearms, gambling, tobacco, nuclear power, production of weaponry, have poor labor/employee relations or environmental records. These criteria may create differences in Fund performance relative to that of the Benchmark.
The Fund posted a return of 11.22% for the year ended May 31, 2025, compared to a return of 13.33% for the MSCI EAFE Index (net) (a broad-based securities market & Performance Index). Over the period, international equity markets outperformed U.S. equities, according to the MSCI® family of indices. Developed markets outside the U.S. slightly outperformed emerging markets.
The following is a summary of the top contributors and detractors that impacted the Fund's performance during the year relative to the Performance Index.
TOP PERFORMANCE CONTRIBUTORS
BlackRock Investment Management, LLC - see Material Fund Changes for the time period covered | Allocations in the following sectors: consumer staples; financials; information technology. Security selection in the following sectors: consumer staples; consumer discretionary; materials. Position weightings: lack of position in Roche Holding AG; lack of position in Sanofi SA; lack of position in Nestle SA. Exposure to the following countries: France; Japan; Netherlands
SunAmerica Asset Management, LLC - see Material Fund Changes for the time period covered | Allocations in the following sectors: financials; energy; consumer discretionary. Security selection in the following sectors: consumer discretionary; consumer staples; energy. Position weightings: lack of a position in LVMH Moet Hennessy Louis Vuitton SE.; lack of a position in Toyota Motor Corp.; lack of a position in TotalEnergies SE. Exposure to the following countries: France; Italy; Netherlands
TOP PERFORMANCE DETRACTORS
BlackRock Investment Management, LLC - see Material Fund Changes for the time period covered | Allocations in the following sectors: industrials; materials; real estate. Security selection in the following sectors: financials; industrials; communication services. Position weightings: lack of position in Mitsubishi Heavy Industries, Ltd.; lack of position in Rheinmetall AG; lack of position in Banco Santander SA. Exposure to the following countries: Germany; United Kingdom; Italy
SunAmerica Asset Management, LLC - see Material Fund Changes for the time period covered | In aggregate: position weightings. Allocations in the following sectors: consumer staples; health care; information technology. Security selection in the following sectors: industrials; communication services; health care. Position weightings: lack of a position in HSBC Holdings PLC; lack of a position in Rheinmetall AG; lack of a position in Roche Holding AG. Exposure to the following countries: Germany; United Kingdom; Spain
Fund Performance
The following graph compares a $10,000 initial investment in the Fund to the index(es) listed below for the last 10 fiscal years of the Fund.
GROWTH OF $10,000
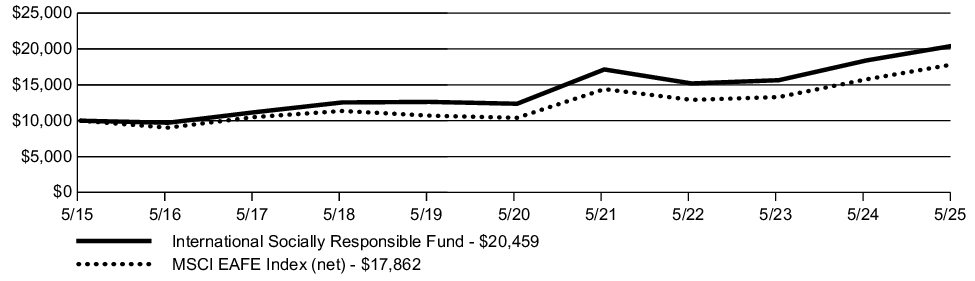
| AVERAGE ANNUAL TOTAL RETURN | 1 Year | 5 Year | 10 Year |
| International Socially Responsible Fund | 11.22% | 10.60% | 7.42% |
| MSCI EAFE Index (net) | 13.33% | 11.42% | 5.97% |
Key Fund Statistics
The following table outlines key fund statistics.
| Net assets | $557M |
| Total number of portfolio holdings | 449 |
| Total net advisory fee paid | $2.2M |
| Portfolio turnover rate during the reporting period | 17% |
Graphical Representation of Holdings
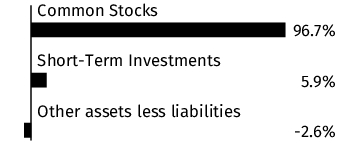
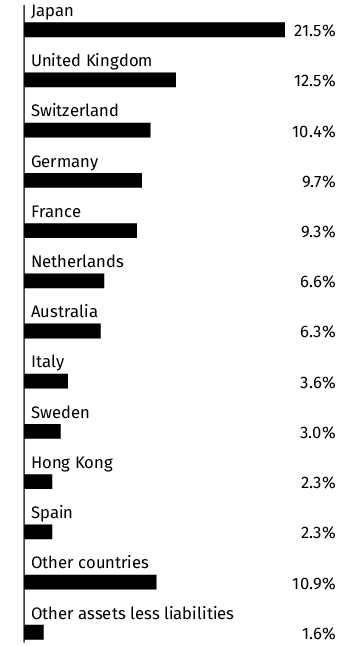
The information below represents the composition of the Fund's net assets as of the end of the period.
Top Industries*
| Banks | 12.6% |
| Insurance | 9.4% |
| Pharmaceuticals | 6.1% |
| Chemicals | 3.5% |
| Commercial Services | 3.4% |
| Semiconductors | 3.1% |
| Oil & Gas | 2.8% |
| Healthcare-Products | 2.8% |
| Software | 2.8% |
| Engineering & Construction | 2.8% |
| Electric | 2.7% |
| Auto Manufacturers | 2.3% |
| Food | 2.2% |
| Diversified Financial Services | 2.1% |
| Telecommunications | 2.1% |
Portfolio Composition

Country
* Percentages exclude derivatives (other than purchased options), if any.
Material Fund Changes
This is a summary of certain changes to the Fund since the beginning of the period. Effective April 30, 2025, BlackRock Investment Management, LLC was appointed as subadviser to the Fund, replacing the existing subadvisor, SunAmerica Asset Management, LLC. Additionally, changes to the Fund’s investment strategies and techniques were adjusted to match the investment processes and techniques used by the subadviser. As a result of these changes, derivatives risk and failure to match index performance risk were added as principal risks, and enhanced index strategy risk was removed as a principal risk. Additionally, effective April 30, 2025, the contractual advisory fee waiver was amended to lower the advisory fee rate payable by the Fund to VALIC to 0.410% of the Fund’s average daily net assets on the first $500 million, 0.385% of the Fund’s average daily net assets on the next $500 million, and 0.360% of the Fund’s average daily net assets over $1 billion. For more comprehensive information, you may review the Fund’s next prospectus, which we expect to be available by September 30, 2025 at www.corebridgefinancial.com/rs/prospectus-and-reports/annuities#underlyingfunds or upon special request at 1-800-448-2542 or by sending an e-mail request to Forms.Request@valic.com.
Changes in and Disagreements with Accountants
There were no disagreements with the accountants during the period.
This report describes changes to the Fund that occurred during the reporting period.
Fund Expenses
What were the Fund costs for the last year ?
(Based on a hypothetical $10,000 investment)
| Fund | Costs of a $10,000 investment | Costs paid as a percentage of a $10,000 investment |
| Stock Index Fund* | $25 | 0.23% |
| * |
The expenses shown in the table are meant to highlight your ongoing costs only and do not reflect any fees and expenses that may be charged by the variable annuity contracts and variable life insurance policies (“Variable Contracts”) that invest in the Fund.
|
Management’s Discussion of Fund Performance
SUMMARY OF RESULTS
The Fund is managed to seek to track the performance of the Index. The Subadviser may endeavor to track the Index by purchasing every stock included in the Index, in the same proportions; or, in the alternative, the Subadviser may invest in a sampling of Index stocks by utilizing a statistical technique known as "optimization".
The Fund posted a return of 13.17% for the year ended May 31, 2025, compared to a return of 13.52% for the S&P 500® Index (a broad-based securities market & Performance Index). Over the period, U.S. large-cap equities outperformed mid- and small-cap equities, according to the Russell® family of indices. Growth-oriented stocks outperformed value stocks across the market-cap spectrum.
The following is a summary of the top contributors and detractors that impacted the Fund's performance during the year.
TOP PERFORMANCE CONTRIBUTORS
BlackRock Investment Management, LLC - see Material Fund Changes for the time period covered | Allocations in the following sectors: information technology; consumer discretionary; communication services. Position weightings: NVIDIA Corp.; Microsoft Corp.; Broadcom, Inc.
SunAmerica Asset Management, LLC - see Material Fund Changes for the time period covered | Allocations in the following sectors: finance; technology; consumer non-cyclicals. Position weightings: Tesla, Inc.; Broadcom, Inc.; Apple, Inc.
TOP PERFORMANCE DETRACTORS
BlackRock Investment Management, LLC - see Material Fund Changes for the time period covered | Allocations in the following sectors: health care. Position weightings: Apple, Inc.; Eli Lilly & Co.; UnitedHealth Group, Inc.
SunAmerica Asset Management, LLC - see Material Fund Changes for the time period covered | Allocations in the following sectors: energy; healthcare; non-energy materials. Position weightings: Advanced Micro Devices, Inc.; Merck & Co., Inc.; Microsoft Corp.
Fund Performance
The following graph compares a $10,000 initial investment in the Fund to the index(es) listed below for the last 10 fiscal years of the Fund.
GROWTH OF $10,000
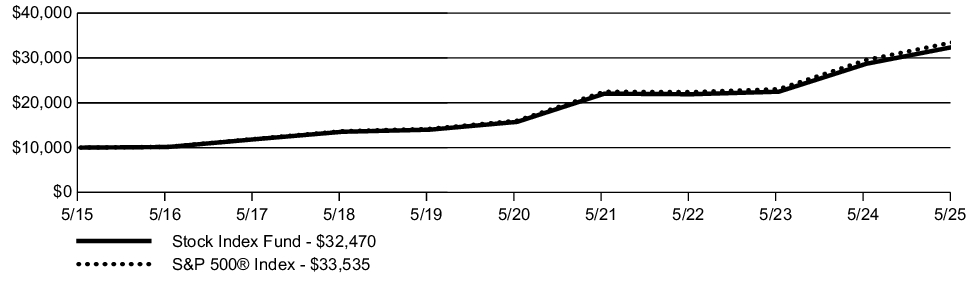
| AVERAGE ANNUAL TOTAL RETURN | 1 Year | 5 Year | 10 Year |
| Stock Index Fund | 13.17% | 15.59% | 12.50% |
| S&P 500® Index | 13.52% | 15.94% | 12.86% |
Key Fund Statistics
The following table outlines key fund statistics.
| Net assets | $6,430M |
| Total number of portfolio holdings | 508 |
| Total net advisory fee paid | $9.0M |
| Portfolio turnover rate during the reporting period | 3% |
Graphical Representation of Holdings
The information below represents the composition of the Fund's net assets as of the end of the period.
Top Industries*
| Internet | 12.9% |
| Semiconductors | 11.4% |
| Software | 11.2% |
| Computers | 7.8% |
| Retail | 4.8% |
| Banks | 4.4% |
| Diversified Financial Services | 4.4% |
| Pharmaceuticals | 4.3% |
| Insurance | 4.1% |
| Healthcare-Products | 2.9% |
| Oil & Gas | 2.4% |
| Electric | 2.3% |
| Auto Manufacturers | 2.3% |
| Aerospace/Defense | 2.1% |
| REITS | 2.0% |
Portfolio Composition

* Percentages exclude derivatives (other than purchased options), if any.
Material Fund Changes
This is a summary of certain changes to the Fund since the beginning of the period. Effective April 30, 2025, BlackRock Investment Management, LLC was appointed as subadviser to the Fund, replacing the existing subadvisor, SunAmerica Asset Management, LLC. Additionally, changes to the Fund’s investment strategies and techniques were adjusted to match the investment processes and techniques used by the subadviser. As a result of these changes, derivatives risk was added as a principal risk. Additionally, effective September 30, 2024, the contractual advisory fee waiver was amended to lower the advisory fee rate payable by the Fund to VALIC to 0.265% of the Fund’s average daily net assets on the first $500 million, 0.165% of the Fund’s average daily net assets on the next $2.5 billion, 0.115% of the Fund’s average daily net assets on the next $2 billion, and 0.065% of the Fund’s average daily net assets over $5 billion. Finally, effective September 30, 2024, the expense limitation agreement that limited expenses of the Fund to 0.26% of average daily net assets was terminated. For more comprehensive information, you may review the Fund’s next prospectus, which we expect to be available by September 30, 2025 at www.corebridgefinancial.com/rs/prospectus-and-reports/annuities#underlyingfunds or upon special request at 1-800-448-2542 or by sending an e-mail request to Forms.Request@valic.com.
Changes in and Disagreements with Accountants
There were no disagreements with the accountants during the period.
This report describes changes to the Fund that occurred during the reporting period.
Fund Expenses
What were the Fund costs for the last year ?
(Based on a hypothetical $10,000 investment)
| Fund | Costs of a $10,000 investment | Costs paid as a percentage of a $10,000 investment |
| Government Securities Fund* | $66 | 0.64% |
| * |
The expenses shown in the table are meant to highlight your ongoing costs only and do not reflect any fees and expenses that may be charged by the variable annuity contracts and variable life insurance policies (“Variable Contracts”) that invest in the Fund.
|
Management’s Discussion of Fund Performance
SUMMARY OF RESULTS
The Fund posted a return of 4.93% for the year ended May 31, 2025, compared to a return of 5.46% for the Bloomberg U.S. Aggregate Bond Index (a broad-based securities market index) and 5.05% for the Bloomberg U.S. Government Bond Index (the "Performance Index"). Over the period, the U.S. Treasury curve bull steepened. The two-year U.S. Treasury yield decreased to 3.90%, the five-year yield decreased to 3.96%, the ten-year yield decreased to 4.40%, and the thirty-year yield increased to 4.93%. Mortgaged-backed securities modestly outperformed U.S. Treasury and Agency securities.
The following is a summary of the top contributors and detractors that impacted the Fund's performance during the year relative to the Performance Index.
TOP PERFORMANCE CONTRIBUTORS
In aggregate | sector allocations; position weightings
Allocations in the following sectors | agency mortgage-backed securities; cash; corporate credit
Security selection in the following sectors | treasuries; U.S. agency debt securities
TOP PERFORMANCE DETRACTORS
In aggregate | yield curve positioning
Allocations in the following sectors | U.S. agency debt securities
Security selection in the following sectors | none
Fund Performance
The following graph compares a $10,000 initial investment in the Fund to the index(es) listed below for the last 10 fiscal years of the Fund.
GROWTH OF $10,000
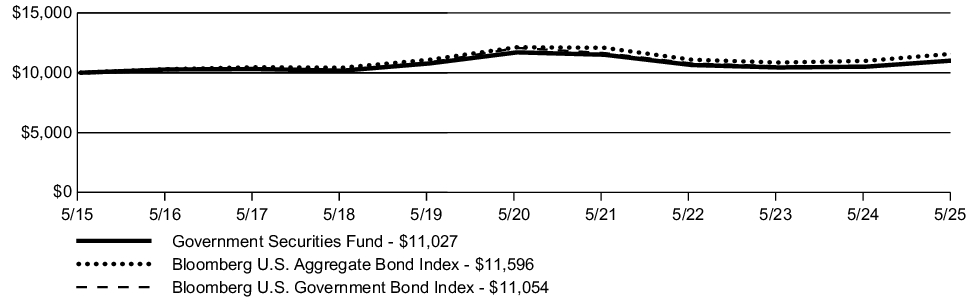
| AVERAGE ANNUAL TOTAL RETURN | 1 Year | 5 Year | 10 Year |
| Government Securities Fund | 4.93% | (1.19)% | 0.98% |
| Bloomberg U.S. Aggregate Bond Index | 5.46% | (0.90)% | 1.49% |
| Bloomberg U.S. Government Bond Index | 5.05% | (1.76)% | 1.01% |
Key Fund Statistics
The following table outlines key fund statistics.
| Net assets | $157M |
| Total number of portfolio holdings | 199 |
| Total net advisory fee paid | $0.6M |
| Portfolio turnover rate during the reporting period | 13% |
Graphical Representation of Holdings
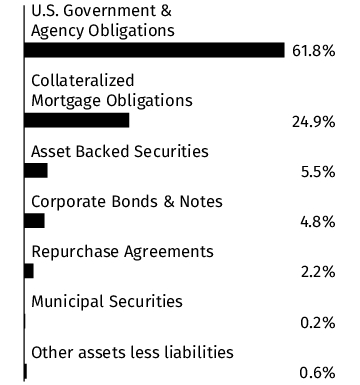
The information below represents the composition of the Fund as of the end of the period.
Portfolio Composition
(% of net assets)
(% of net assets)
Credit Quality **
(% of total debt issues)
(% of total debt issues)
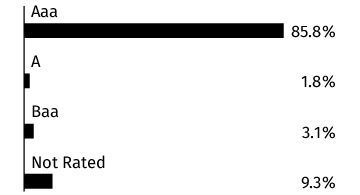
** Credit quality ratings shown above reflect the rating assigned by Moody's Investors Service, Inc. Where Moody's ratings are not available, we have used Standard & Poor's ratings. Unrated investments do not necessarily indicate low credit quality. Credit quality ratings are subject to change. Percentages exclude short-term securities.
Material Fund Changes
This is a summary of certain changes to the Fund since the beginning of the period. Effective September 30, 2024, the Fund entered into a contractual advisory fee waiver to lower the advisory fee rate payable by the Fund to VALIC to 0.42% of the Fund’s average daily net assets on the first $250 million, 0.37% of the Fund’s average daily net assets on the next $250 million, 0.32% of the Fund’s average daily net assets on the next $500 million, and 0.27% of the Fund’s average daily net assets over $1 billion. For more comprehensive information, you may review the Fund’s next prospectus, which we expect to be available by September 30, 2025 at www.corebridgefinancial.com/rs/prospectus-and-reports/annuities#underlyingfunds or upon special request at 1-800-448-2542 or by sending an e-mail request to Forms.Request@valic.com.
Changes in and Disagreements with Accountants
There were no disagreements with the accountants during the period.
Fund Expenses
What were the Fund costs for the last year ?
(Based on a hypothetical $10,000 investment)
| Fund | Costs of a $10,000 investment | Costs paid as a percentage of a $10,000 investment |
| Systematic Core Fund* | $68 | 0.64% |
| * |
The expenses shown in the table are meant to highlight your ongoing costs only and do not reflect any fees and expenses that may be charged by the variable annuity contracts and variable life insurance policies (“Variable Contracts”) that invest in the Fund.
|
Management’s Discussion of Fund Performance
SUMMARY OF RESULTS
The Fund posted a return of 11.71% for the year ended May 31, 2025, compared to a return of 13.73% for the Russell 1000® Index (a broad-based securities market & Performance Index). Over the period, U.S. large-cap equities outperformed mid- and small-cap equities significantly, according to the Russell® family of indices. Growth-oriented stocks outperformed value stocks across the market-cap spectrum.
The following is a summary of the top contributors and detractors that impacted the Fund's performance during the year relative to the Performance Index.
TOP PERFORMANCE CONTRIBUTORS
Allocations in the following sectors | energy; health care; materials
Security selection in the following sectors | utilities; health care; energy
Position weightings | AppLovin Corp., Class A; Advanced Micro Devices, Inc.; Twilio, Inc., Class A
TOP PERFORMANCE DETRACTORS
In aggregate | position weightings
Allocations in the following sectors | cash; communication service; information technology
Security selection in the following sectors | consumer discretionary; industrials; communication services
Position weightings | Tesla, Inc.; Palantir Technologies, Inc., Class A; Netflix, Inc.
Fund Performance
The following graph compares a $10,000 initial investment in the Fund to the index(es) listed below for the last 10 fiscal years of the Fund.
GROWTH OF $10,000
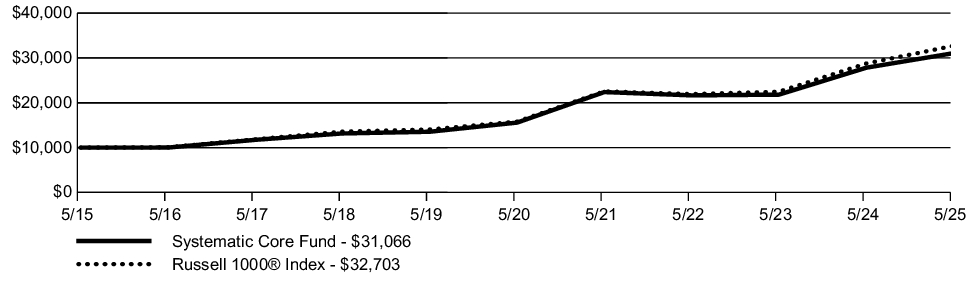
| AVERAGE ANNUAL TOTAL RETURN | 1 Year | 5 Year | 10 Year |
| Systematic Core Fund | 11.71% | 14.80% | 12.00% |
| Russell 1000® Index | 13.73% | 15.66% | 12.58% |
Key Fund Statistics
The following table outlines key fund statistics.
| Net assets | $694M |
| Total number of portfolio holdings | 792 |
| Total net advisory fee paid | $3.2M |
| Portfolio turnover rate during the reporting period | 36% |
Graphical Representation of Holdings
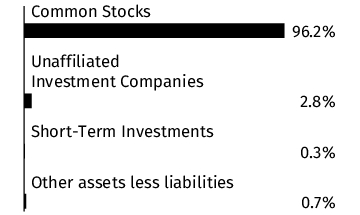
The information below represents the composition of the Fund's net assets as of the end of the period.
Top Industries*
| Software | 11.1% |
| Internet | 10.8% |
| Semiconductors | 8.7% |
| Computers | 7.6% |
| Retail | 5.9% |
| Insurance | 5.1% |
| Diversified Financial Services | 4.6% |
| Pharmaceuticals | 3.9% |
| Banks | 3.3% |
| Unaffiliated Investment Companies | 2.8% |
| REITS | 2.2% |
| Commercial Services | 2.1% |
| Healthcare-Products | 2.0% |
| Electric | 1.9% |
| Media | 1.8% |
Portfolio Composition
* Percentages exclude derivatives (other than purchased options), if any.
Material Fund Changes
There were no material fund changes during the period.
Changes in and Disagreements with Accountants
There were no disagreements with the accountants during the period.
This report describes changes to the Fund that occurred during the reporting period.
Fund Expenses
What were the Fund costs for the last year ?
(Based on a hypothetical $10,000 investment)
| Fund | Costs of a $10,000 investment | Costs paid as a percentage of a $10,000 investment |
| Dividend Value Fund* | $71 | 0.68% |
| * |
The expenses shown in the table are meant to highlight your ongoing costs only and do not reflect any fees and expenses that may be charged by the variable annuity contracts and variable life insurance policies (“Variable Contracts”) that invest in the Fund.
|
Management’s Discussion of Fund Performance
SUMMARY OF RESULTS
The Fund posted a return of 9.75% for the year ended May 31, 2025, 13.52% for the S&P 500® Index (a broad-based securities market index) and 8.91% for the Russell 1000® Value Index (the "Performance Index"). Equities delivered positive returns in the period. A resilient U.S. economy, declining inflation, enthusiasm for AI-related stocks, a Fed pivot to cutting interest rates and expectations of a business-friendly U.S. administration helped markets make gains despite concerns later in the period over tariffs and their potential to reduce international trade, reignite inflation and slow economic growth.
The following is a summary, by subadviser, of the top contributors and detractors that impacted their portion of the Fund's performance during the year relative to the Performance Index.
TOP PERFORMANCE CONTRIBUTORS
BlackRock Investment Management, LLC | Allocations in the following sectors: communication services; energy; information technology. Security selection in the following sectors: health care; consumer discretionary; industrials. Position weightings: Cardinal Health, Inc.; UnitedHealth Group, Inc.; Sony Group Corp.
ClearBridge Investments, LLC | In aggregate: position weightings. Allocations in the following sectors: communication services; health care; consumer staples. Security selection in the following sectors: energy; information technology; materials. Position weightings: Broadcom, Inc.; Williams Cos., Inc.; Enbridge, Inc.
TOP PERFORMANCE DETRACTORS
BlackRock Investment Management, LLC | In aggregate: sector allocations. Allocations in the following sectors: health care; cash; financials. Security selection in the following sectors: consumer staples; communication services; financials. Position weightings: Samsung Electronics Co., Ltd; BP PLC; HP, Inc.
ClearBridge Investments, LLC | Allocations in the following sectors: financials; materials; energy. Security selection in the following sectors: consumer staples; utilities; communication services. Position weightings: Merck & Co., Inc.; Becton Dickinson & Co.; lack of position in Walmart, Inc.
Fund Performance
The following graph compares a $10,000 initial investment in the Fund to the index(es) listed below for the last 10 fiscal years of the Fund.
GROWTH OF $10,000
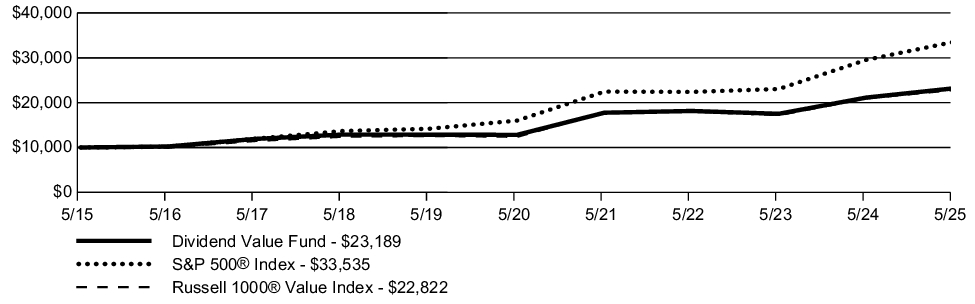
| AVERAGE ANNUAL TOTAL RETURN | 1 Year | 5 Year | 10 Year |
| Dividend Value Fund | 9.75% | 12.60% | 8.77% |
| S&P 500® Index | 13.52% | 15.94% | 12.86% |
| Russell 1000® Value Index | 8.91% | 13.02% | 8.60% |
Key Fund Statistics
The following table outlines key fund statistics.
| Net assets | $681M |
| Total number of portfolio holdings | 133 |
| Total net advisory fee paid | $4.2M |
| Portfolio turnover rate during the reporting period | 57% |
Graphical Representation of Holdings
The information below represents the composition of the Fund's net assets as of the end of the period.
Top Industries*
| Banks | 8.9% |
| Pharmaceuticals | 8.5% |
| Software | 7.5% |
| Insurance | 5.0% |
| Electric | 4.8% |
| Aerospace/Defense | 4.6% |
| Diversified Financial Services | 4.4% |
| Oil & Gas | 4.1% |
| Semiconductors | 3.9% |
| Computers | 3.6% |
| REITS | 3.5% |
| Short-Term Investments | 3.0% |
| Media | 3.0% |
| Healthcare-Products | 2.8% |
| Pipelines | 2.7% |
Portfolio Composition

* Percentages exclude derivatives (other than purchased options), if any.
Material Fund Changes
This is a summary of certain changes to the Fund since the beginning of the period. Effective September 30, 2024, the contractual advisory fee waiver was amended to lower the advisory fee rate payable by the Fund to VALIC to 0.60% of the Fund’s average daily net assets on the first $250 million, 0.57% of the Fund’s average daily net assets on the next $250 million, 0.52% of the Fund’s average daily net assets on the next $500 million and 0.47% of the Fund’s average daily net assets over $1 billion. For more comprehensive information, you may review the Fund’s next prospectus, which we expect to be available by September 30, 2025 at www.corebridgefinancial.com/rs/prospectus-and-reports/annuities#underlyingfunds or upon special request at 1-800-448-2542 or by sending an e-mail request to Forms.Request@valic.com.
Changes in and Disagreements with Accountants
There were no disagreements with the accountants during the period.
Fund Expenses
What were the Fund costs for the last year ?
(Based on a hypothetical $10,000 investment)
| Fund | Costs of a $10,000 investment | Costs paid as a percentage of a $10,000 investment |
| Inflation Protected Fund* | $61 | 0.60% |
| * |
The expenses shown in the table are meant to highlight your ongoing costs only and do not reflect any fees and expenses that may be charged by the variable annuity contracts and variable life insurance policies (“Variable Contracts”) that invest in the Fund.
|
Management’s Discussion of Fund Performance
SUMMARY OF RESULTS
The Fund posted a return of 3.51% for the year ended May 31, 2025, compared to a return of 5.46% for the Bloomberg U.S. Aggregate Bond Index (a broad-based securities market index) and 5.67% for the Bloomberg U.S. Treasury Inflation-Protected Securities (“TIPS”) Index (the "Performance Index"). Global inflation linked bonds underperformed US TIPS during the period according to the Bloomberg Global Inflation Linked Bond index and Bloomberg US TIPS index.
The following is a summary of the top contributors and detractors that impacted the Fund's performance during the year relative to the Performance Index.
TOP PERFORMANCE CONTRIBUTORS
Allocations in the following sectors | U.S. Government; high yield credit; asset backed securities
TOP PERFORMANCE DETRACTORS
Allocations in the following sectors | developed non-US dollar; emerging market
Security selection in the following sectors | U.S. Government
Fund Performance
The following graph compares a $10,000 initial investment in the Fund to the index(es) listed below for the last 10 fiscal years of the Fund.
GROWTH OF $10,000
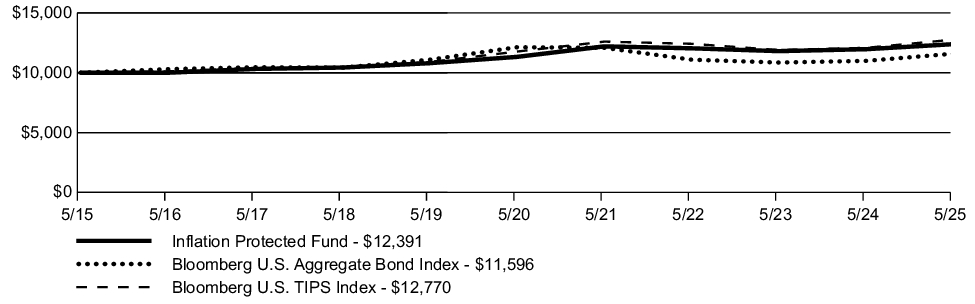
| AVERAGE ANNUAL TOTAL RETURN | 1 Year | 5 Year | 10 Year |
| Inflation Protected Fund | 3.51% | 1.81% | 2.17% |
| Bloomberg U.S. Aggregate Bond Index | 5.46% | (0.90)% | 1.49% |
| Bloomberg U.S. TIPS Index | 5.67% | 1.64% | 2.47% |
Key Fund Statistics
The following table outlines key fund statistics.
| Net assets | $367M |
| Total number of portfolio holdings | 115 |
| Total net advisory fee paid | $1.8M |
| Portfolio turnover rate during the reporting period | 18% |
Graphical Representation of Holdings
The information below represents the composition of the Fund as of the end of the period.
Portfolio Composition
(% of net assets)
(% of net assets)
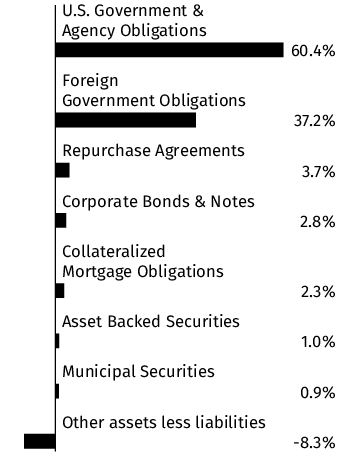
Credit Quality **
(% of total debt issues)
(% of total debt issues)
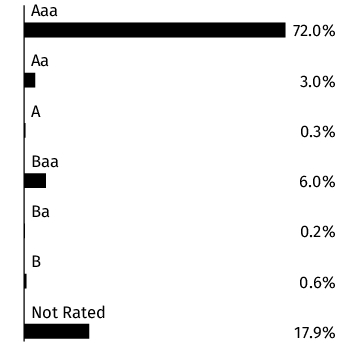
** Credit quality ratings shown above reflect the rating assigned by Moody's Investors Service, Inc. Where Moody's ratings are not available, we have used Standard & Poor's ratings. Unrated investments do not necessarily indicate low credit quality. Credit quality ratings are subject to change. Percentages exclude short-term securities.
Material Fund Changes
There were no material fund changes during the period.
Changes in and Disagreements with Accountants
There were no disagreements with the accountants during the period.
This report describes changes to the Fund that occurred during the reporting period.
Fund Expenses
What were the Fund costs for the last year ?
(Based on a hypothetical $10,000 investment)
| Fund | Costs of a $10,000 investment | Costs paid as a percentage of a $10,000 investment |
| Systematic Value Fund* | $64 | 0.60% |
| * |
The expenses shown in the table are meant to highlight your ongoing costs only and do not reflect any fees and expenses that may be charged by the variable annuity contracts and variable life insurance policies (“Variable Contracts”) that invest in the Fund.
|
Management’s Discussion of Fund Performance
SUMMARY OF RESULTS
The Fund posted a return of 12.47% for the year ended May 31, 2025, compared to a return of 13.52% for the S&P 500® Index (a broad-based securities market index) and 8.91% for the Russell 1000® Value Index (the "Performance Index"). U.S. value stocks, as measured by the Russell 1000® Value Index, rose during the 1-year period ending May 31, 2025. Against this backdrop, factor behavior was mixed, as investors reacted to ever evolving uncertainties. During the period, higher quality value stocks generally outperformed, while deeper value stocks generally underperformed. Value stocks with positive fundamental trend showed mixed performance
The following is a summary of the top contributors and detractors that impacted the Fund's performance during the year relative to the Performance Index.
TOP PERFORMANCE CONTRIBUTORS
In aggregate | position weightings
Allocations in the following sectors | energy; financials; consumer staples
Security selection in the following sectors | health care; utilities; financials
Position weightings | Exelixis, Inc.; Amphenol Corp., Class A.; National Fuel Gas Co.
TOP PERFORMANCE DETRACTORS
Allocations in the following sectors | health care; utilities; communication services
Security selection in the following sectors | communication services; energy; consumer discretionary
Position weightings | lack of position in GE Vernova, Inc.; PepsiCo, Inc.; lack of position in AT&T, Inc.
Fund Performance
The following graph compares a $10,000 initial investment in the Fund to the index(es) listed below for the last 10 fiscal years of the Fund.
GROWTH OF $10,000
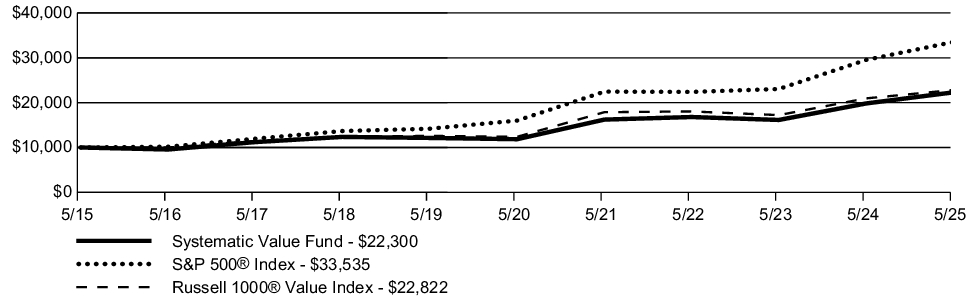
| AVERAGE ANNUAL TOTAL RETURN | 1 Year | 5 Year | 10 Year |
| Systematic Value Fund | 12.47% | 13.48% | 8.35% |
| S&P 500® Index | 13.52% | 15.94% | 12.86% |
| Russell 1000® Value Index | 8.91% | 13.02% | 8.60% |
Key Fund Statistics
The following table outlines key fund statistics.
| Net assets | $457M |
| Total number of portfolio holdings | 146 |
| Total net advisory fee paid | $2.2M |
| Portfolio turnover rate during the reporting period | 55% |
Graphical Representation of Holdings
The information below represents the composition of the Fund's net assets as of the end of the period.
Top Industries*
| Insurance | 9.9% |
| Banks | 8.0% |
| Diversified Financial Services | 6.5% |
| Computers | 6.2% |
| REITS | 5.4% |
| Biotechnology | 5.2% |
| Pharmaceuticals | 4.4% |
| Media | 4.2% |
| Healthcare-Products | 4.1% |
| Aerospace/Defense | 4.1% |
| Oil & Gas | 4.0% |
| Retail | 3.7% |
| Electronics | 2.9% |
| Electrical Components & Equipment | 2.8% |
| Agriculture | 2.0% |
Portfolio Composition
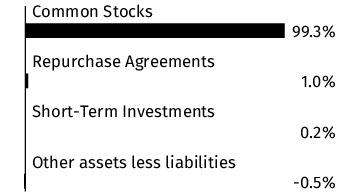
* Percentages exclude derivatives (other than purchased options), if any.
Material Fund Changes
This is a summary of certain changes to the Fund since the beginning of the period. Effective September 30, 2024, warrants and rights risk replaced warrants risk as a principal risk, and factor-based investing risk was added as a principal risk of the Fund. Additionally, effective September 30, 2024, the contractual advisory fee waiver was amended to lower the advisory fee rate payable by the Fund to VALIC to 0.56% of the Fund’s average daily net assets on the first $250 million, 0.51% of the Fund’s average daily net assets on the next $250 million, 0.46% of the Fund’s average daily net assets on the next $500 million, and 0.41% of the Fund’s average daily net assets over $1 billion. For more comprehensive information, you may review the Fund’s next prospectus, which we expect to be available by September 30, 2025 at www.corebridgefinancial.com/rs/prospectus-and-reports/annuities#underlyingfunds or upon special request at 1-800-448-2542 or by sending an e-mail request to Forms.Request@valic.com.
Changes in and Disagreements with Accountants
There were no disagreements with the accountants during the period.
Fund Expenses
What were the Fund costs for the last year ?
(Based on a hypothetical $10,000 investment)
| Fund | Costs of a $10,000 investment | Costs paid as a percentage of a $10,000 investment |
| International Value Fund* | $88 | 0.81% |
| * |
The expenses shown in the table are meant to highlight your ongoing costs only and do not reflect any fees and expenses that may be charged by the variable annuity contracts and variable life insurance policies (“Variable Contracts”) that invest in the Fund.
|
Management’s Discussion of Fund Performance
SUMMARY OF RESULTS
The Fund posted a return of 16.84% for the year ended May 31, 2025, compared to a return of 13.75% for the MSCI ACWI ex USA Index (net) (a broad-based securities market) and 18.72% for the MSCI EAFE Value Index (net) (the "Performance Index"). Over the period, U.S. large-cap equities slightly outperformed international large-cap equities, according to the Russell 1000® Index and MSCI EAFE Index (net). Within international, value-oriented stocks outperformed growth stocks, and mid-cap stocks outperformed large- and small-cap stocks, according to the MSCI EAFE family of indices.
The following is a summary, by subadviser, of the top contributors and detractors that impacted their portion of the Fund's performance during the year relative to the Performance Index.
TOP PERFORMANCE CONTRIBUTORS
Columbia Management Investments Advisers, LLC | In aggregate: position weightings; country allocations. Allocations in the following sectors: materials; real estate; health care. Security selection in the following sectors: materials; consumer discretionary; consumer staples. Position weightings: Sankyo Co., Ltd.; Piraeus Financial Holdings SA; Imperial Brands PLC. Exposure to the following countries: Japan; United States; Australia
Goldman Sachs Asset Management, LLC | In aggregate: sector allocations; country allocations. Allocations in the following sectors: consumer discretionary; materials; consumer staples. Security selection in the following sectors: materials; utilities; consumer staples. Position weightings: DS Smith PLC; Societe Generale SA; Koninklijke Ahold Delhaize NV. Exposure to the following countries: Netherlands; Australia; Singapore
TOP PERFORMANCE DETRACTORS
Columbia Management Investments Advisers, LLC | In aggregate: sector allocations. Allocations in the following sectors: energy; financials; cash. Security selection in the following sectors: financials; health care; industrials. Position weightings: UPM-Kymmene Oyj; Vermilion Energy, Inc.; TotalEnergies SE. Exposure to the following countries: United Kingdom; Germany; Canada
Goldman Sachs Asset Management, LLC | In aggregate: position weightings. Allocations in the following sectors: financials; information technology; communication services. Security selection in the following sectors: health care; information technology; industrials. Position weightings: LVMH Moet Hennessy Louis Vuitton SE; Novo Nordisk A/S, Class B; Tokyo Electron, Ltd. Exposure to the following countries: France; Japan; Denmark
Fund Performance
The following graph compares a $10,000 initial investment in the Fund to the index(es) listed below for the last 10 fiscal years of the Fund.
GROWTH OF $10,000
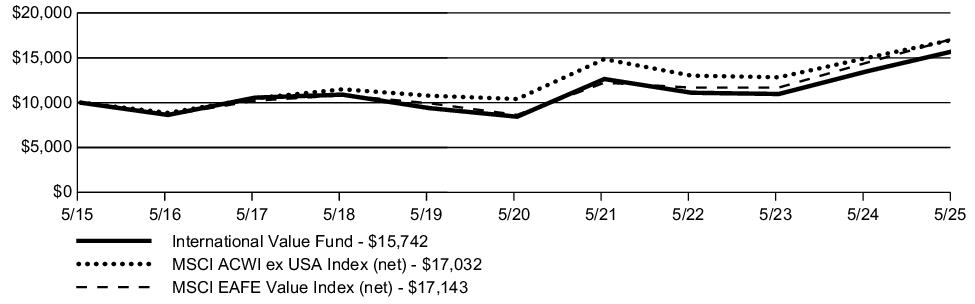
| AVERAGE ANNUAL TOTAL RETURN | 1 Year | 5 Year | 10 Year |
| International Value Fund | 16.84% | 13.30% | 4.64% |
| MSCI ACWI ex USA Index (net) | 13.75% | 10.37% | 5.47% |
| MSCI EAFE Value Index (net) | 18.72% | 14.70% | 5.54% |
Key Fund Statistics
The following table outlines key fund statistics.
| Net assets | $397M |
| Total number of portfolio holdings | 138 |
| Total net advisory fee paid | $2.8M |
| Portfolio turnover rate during the reporting period | 48% |
Graphical Representation of Holdings
The information below represents the composition of the Fund's net assets as of the end of the period.
Top Industries*
| Banks | 19.1% |
| Pharmaceuticals | 7.3% |
| Oil & Gas | 7.0% |
| Insurance | 6.8% |
| Electric | 6.7% |
| Food | 5.7% |
| Mining | 4.4% |
| Diversified Financial Services | 4.2% |
| Telecommunications | 3.7% |
| Distribution/Wholesale | 3.6% |
| Computers | 2.5% |
| Commercial Services | 2.3% |
| Beverages | 2.0% |
| Engineering & Construction | 2.0% |
| Auto Manufacturers | 2.0% |
Portfolio Composition
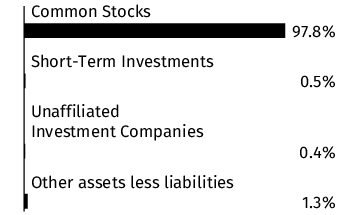
Country
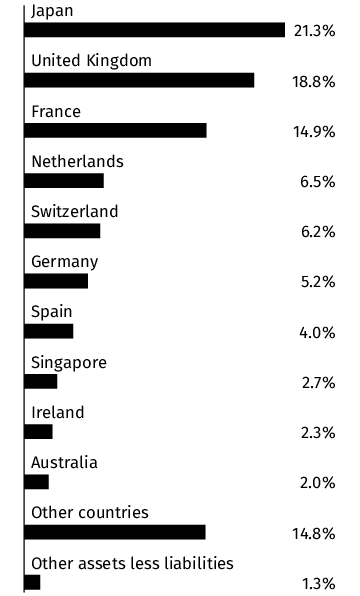
* Percentages exclude derivatives (other than purchased options), if any.
Material Fund Changes
There were no material fund changes during the period.
Changes in and Disagreements with Accountants
There were no disagreements with the accountants during the period.
Fund Expenses
What were the Fund costs for the last year ?
(Based on a hypothetical $10,000 investment)
| Fund | Costs of a $10,000 investment | Costs paid as a percentage of a $10,000 investment |
| Emerging Economies Fund* | $108 | 1.02% |
| * |
The expenses shown in the table are meant to highlight your ongoing costs only and do not reflect any fees and expenses that may be charged by the variable annuity contracts and variable life insurance policies (“Variable Contracts”) that invest in the Fund.
|
Management’s Discussion of Fund Performance
SUMMARY OF RESULTS
The Fund posted a return of 11.67% for the year ended May 31, 2025, compared to a return of 13.75% for the MSCI ACWI ex USA Index (net) (a broad-based securities market index) and 13.04% for the MSCI Emerging Markets Index (net) (the "Performance Index"). Emerging Market equities experienced a recovery over the past year driven by a confluence of factors. China benefited from a rebound in investor sentiment in the latter half of 2024 driven by stimulus measures aimed at stabilizing the property sector and boosting consumption. The continued AI-fueled growth of semiconductor industry earnings globally was an important tailwind for the Taiwan market. Finally, the U.S. Federal Reserve’s shift away from a hawkish tone combined with tariff policy uncertainty contributed to U.S. dollar weakness and renewed flows into emerging markets.
The following is a summary, by subadviser, of the top contributors and detractors that impacted their portion of the Fund's performance during the year relative to the Performance Index.
TOP PERFORMANCE CONTRIBUTORS
Allocations in the following sectors | energy; materials; health care
Security selection in the following sectors | materials; financials; communication services
Position weightings | 3SBio, Inc.; Alibaba Group Holding, Ltd.; Reliance Industries, Ltd.
Exposure to the following countries | China; Korea; Taiwan
TOP PERFORMANCE DETRACTORS
Allocations in the following sectors | industrials; financials; consumer discretionary
Security selection in the following sectors | consumer staples; industrials; health care
Position weightings | Walmart de Mexico SAB de CV; Hanwha Aerospace Co., Ltd.; Alsea SAB de CV
Exposure to the following countries | India; Thailand; Mexico
Fund Performance
The following graph compares a $10,000 initial investment in the Fund to the index(es) listed below for the last 10 fiscal years of the Fund.
GROWTH OF $10,000
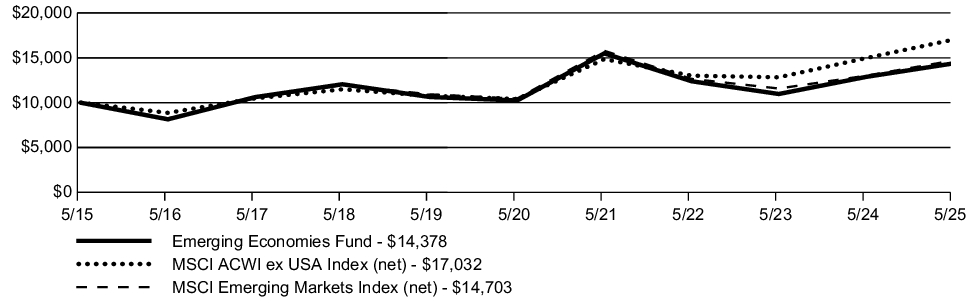
| AVERAGE ANNUAL TOTAL RETURN | 1 Year | 5 Year | 10 Year |
| Emerging Economies Fund | 11.67% | 7.03% | 3.70% |
| MSCI ACWI ex USA Index (net) | 13.75% | 10.37% | 5.47% |
| MSCI Emerging Markets Index (net) | 13.04% | 7.07% | 3.93% |
Key Fund Statistics
The following table outlines key fund statistics.
| Net assets | $705M |
| Total number of portfolio holdings | 469 |
| Total net advisory fee paid | $5.6M |
| Portfolio turnover rate during the reporting period | 154% |
Graphical Representation of Holdings
The information below represents the composition of the Fund's net assets as of the end of the period.
Top Industries*
| Banks | 16.4% |
| Semiconductors | 15.1% |
| Internet | 13.6% |
| Telecommunications | 6.2% |
| Diversified Financial Services | 4.8% |
| Computers | 3.9% |
| Oil & Gas | 3.4% |
| Auto Manufacturers | 3.3% |
| Insurance | 2.7% |
| Beverages | 2.4% |
| Retail | 2.3% |
| Mining | 2.2% |
| Short-Term Investments | 2.1% |
| Engineering & Construction | 1.9% |
| Electronics | 1.7% |
Portfolio Composition

Country
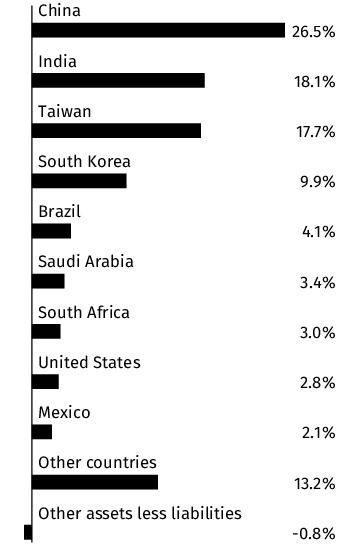
* Percentages exclude derivatives (other than purchased options), if any.
Material Fund Changes
There were no material fund changes during the period.
Changes in and Disagreements with Accountants
There were no disagreements with the accountants during the period.
Fund Expenses
What were the Fund costs for the last year ?
(Based on a hypothetical $10,000 investment)
| Fund | Costs of a $10,000 investment | Costs paid as a percentage of a $10,000 investment |
| Global Strategy Fund* | $66 | 0.63% |
| * |
The expenses shown in the table are meant to highlight your ongoing costs only and do not reflect any fees and expenses that may be charged by the variable annuity contracts and variable life insurance policies (“Variable Contracts”) that invest in the Fund.
|
Management’s Discussion of Fund Performance
SUMMARY OF RESULTS
The Fund posted a return of 9.68% for the year ended May 31, 2025, compared to a return of 13.65% for the MSCI ACWI Index (net) (a broad-based securities market index) and 10.65% for the Blended Index (the "Performance Index") comprised of 60% MSCI ACWI Index (net); 40% Bloomberg Global Aggregate Index (USD hedged). Over the 12-month period, U.S. equities slightly outperformed international developed equities and outperformed emerging markets equities. Global fixed income delivered weak results in 2024, though some opportunities emerged. Longer-term bond yields rose, driven by late-year selloffs amid expectations of President-elect Trump’s fiscal policies.
The following is a summary, by subadviser, of the top contributors and detractors that impacted their portion of the Fund's performance during the year relative to the Performance Index.
TOP PERFORMANCE CONTRIBUTORS
Brandywine Global Investments, LLC - Global Debt portion | In aggregate: yield curve positioning. Allocations in the following sectors: U.S. corporate credit; U.S. agency MBS; emerging markets sovereign debt. Exposure to the following countries: United States; Mexico; Egypt
Franklin Advisers, Inc. - Global Equity portion | Allocations in the following sectors: energy; health care; information technology. Security selection in the following sectors: health care; materials; financials. Position weightings: AppLovin Corp., Class A; UniCredit SpA; lack of position in UnitedHealth Group, Inc. Exposure to the following countries: United Kingdom; Italy; South Korea
TOP PERFORMANCE DETRACTORS
Brandywine Global Investments, LLC - Global Debt portion | Allocations in the following sectors: U.S. Treasury; developed market sovereign bonds. Exposure to the following countries: China; United Kingdom; Italy
Franklin Advisers, Inc. - Global Equity portion | Allocations in the following sectors: cash; materials; financials. Security selection in the following sectors: consumer discretionary; industrials; communication services. Position weightings: Tesla, Inc.; Broadcom, Inc.; QUALCOMM, Inc. Exposure to the following countries: United States; Taiwan; Brazil
Fund Performance
The following graph compares a $10,000 initial investment in the Fund to the index(es) listed below for the last 10 fiscal years of the Fund.
GROWTH OF $10,000
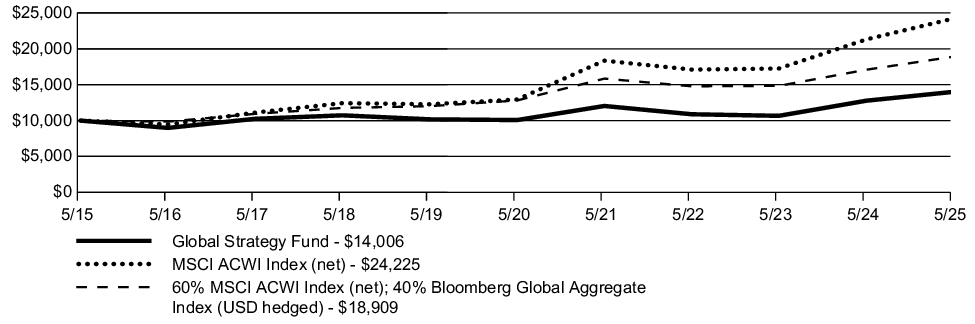
| AVERAGE ANNUAL TOTAL RETURN | 1 Year | 5 Year | 10 Year |
| Global Strategy Fund | 9.68% | 6.82% | 3.43% |
| MSCI ACWI Index (net) | 13.65% | 13.37% | 9.25% |
| 60% MSCI ACWI Index (net); 40% Bloomberg Global Aggregate Index (USD hedged) | 10.65% | 8.11% | 6.58% |
Key Fund Statistics
The following table outlines key fund statistics.
| Net assets | $226M |
| Total number of portfolio holdings | 614 |
| Total net advisory fee paid | $1.0M |
| Portfolio turnover rate during the reporting period | 54% |
Graphical Representation of Holdings
The information below represents the composition of the Fund's net assets as of the end of the period.
Top Industries*
| Short-Term Investments | 8.7% |
| Internet | 7.2% |
| Semiconductors | 6.7% |
| Banks | 6.7% |
| Software | 5.9% |
| Diversified Financial Services | 5.4% |
| Foreign Government Obligations | 5.4% |
| Investment Companies | 4.0% |
| Oil & Gas | 3.7% |
| Collateralized Mortgage Obligations | 3.1% |
| Computers | 2.9% |
| Pharmaceuticals | 2.8% |
| Electric | 2.5% |
| Insurance | 2.4% |
| Other Asset Backed Securities | 2.3% |
Portfolio Composition
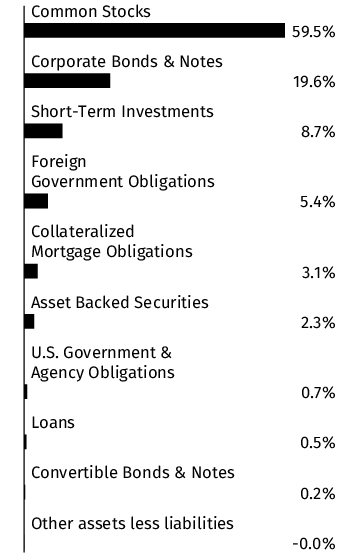
Country
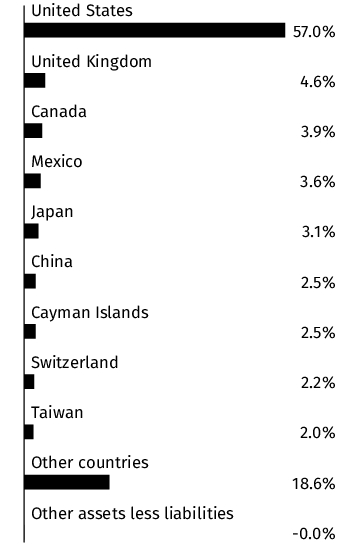
* Percentages exclude derivatives (other than purchased options), if any.
Material Fund Changes
There were no material fund changes during the period.
Changes in and Disagreements with Accountants
There were no disagreements with the accountants during the period.
Fund Expenses
What were the Fund costs for the last year ?
(Based on a hypothetical $10,000 investment)
| Fund | Costs of a $10,000 investment | Costs paid as a percentage of a $10,000 investment |
| Small Cap Special Values Fund* | $87 | 0.90% |
| * |
The expenses shown in the table are meant to highlight your ongoing costs only and do not reflect any fees and expenses that may be charged by the variable annuity contracts and variable life insurance policies (“Variable Contracts”) that invest in the Fund.
|
Management’s Discussion of Fund Performance
SUMMARY OF RESULTS
The Fund posted a return of -7.66% for the year ended May 31, 2025, compared to a return of 13.12% for the Russell 3000® Index (a broad-based securities market index) and -1.14% for the Russell 2000® Value Index (the "Performance Index"). Over the period, U.S. large- and mid-cap equities outperformed small-cap equities, according to the Russell® family of indices. Growth-oriented stocks outperformed value stocks across the market-cap spectrum.
The following is a summary of the top contributors and detractors that impacted the Fund's performance during the year relative to the Performance Index.
TOP PERFORMANCE CONTRIBUTORS
In aggregate | sector allocations
Allocations in the following sectors | consumer staples; energy; health care
Security selection in the following sectors | health care; utilities; real estate
Position weightings | Mueller Industries, Inc.; UMB Financial Corp.; Hanover Insurance Group, Inc.
TOP PERFORMANCE DETRACTORS
In aggregate | position weightings
Allocations in the following sectors | financials; utilities; real estate
Security selection in the following sectors | consumer staples; materials; consumer discretionary
Position weightings | Innospec, Inc.; Compass Diversified Holdings; J&J Snack Foods Corp.
Fund Performance
The following graph compares a $10,000 initial investment in the Fund to the index(es) listed below for the last 10 fiscal years of the Fund.
GROWTH OF $10,000
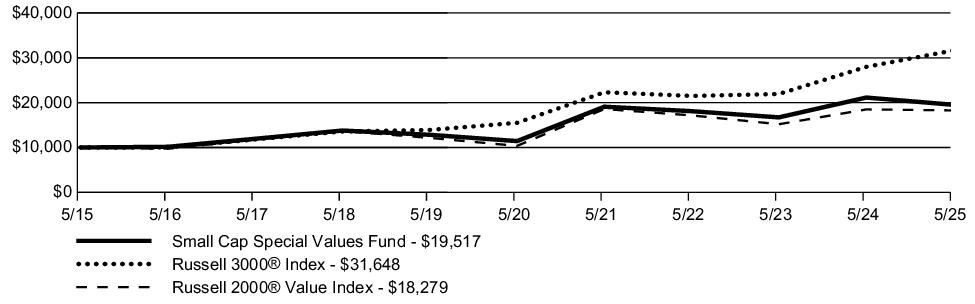
| AVERAGE ANNUAL TOTAL RETURN | 1 Year | 5 Year | 10 Year |
| Small Cap Special Values Fund | (7.66)% | 11.31% | 6.92% |
| Russell 3000® Index | 13.12% | 15.34% | 12.21% |
| Russell 2000® Value Index | (1.14)% | 12.03% | 6.22% |
Key Fund Statistics
The following table outlines key fund statistics.
| Net assets | $173M |
| Total number of portfolio holdings | 121 |
| Total net advisory fee paid | $1.5M |
| Portfolio turnover rate during the reporting period | 21% |
Graphical Representation of Holdings
The information below represents the composition of the Fund's net assets as of the end of the period.
Top Industries*
| Banks | 11.4% |
| Chemicals | 9.3% |
| Building Materials | 5.9% |
| Insurance | 5.6% |
| Metal Fabricate/Hardware | 5.3% |
| Food | 5.2% |
| Commercial Services | 4.9% |
| Packaging & Containers | 4.7% |
| Household Products/Wares | 4.0% |
| REITS | 3.9% |
| Oil & Gas | 3.5% |
| Machinery-Diversified | 3.5% |
| Hand/Machine Tools | 3.2% |
| Cosmetics/Personal Care | 2.8% |
| Computers | 2.7% |
Portfolio Composition
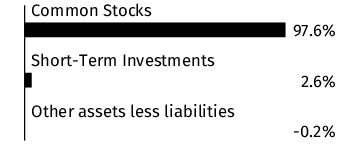
* Percentages exclude derivatives (other than purchased options), if any.
Material Fund Changes
There were no material fund changes during the period.
Changes in and Disagreements with Accountants
There were no disagreements with the accountants during the period.
This report describes changes to the Fund that occurred during the reporting period.
Fund Expenses
What were the Fund costs for the last year ?
(Based on a hypothetical $10,000 investment)
| Fund | Costs of a $10,000 investment | Costs paid as a percentage of a $10,000 investment |
| Growth Fund* | $66 | 0.61% |
| * |
The expenses shown in the table are meant to highlight your ongoing costs only and do not reflect any fees and expenses that may be charged by the variable annuity contracts and variable life insurance policies (“Variable Contracts”) that invest in the Fund.
|
Management’s Discussion of Fund Performance
SUMMARY OF RESULTS
The Fund posted a return of 15.84% for the year ended May 31, 2025, compared to a return of 13.52% for the S&P 500® Index (a broad-based securities market index) and 17.62% for the Russell 1000® Growth Index (the "Performance Index"). Over the period, U.S. large-cap equities outperformed mid- and small-cap equities, according to the Russell® family of indices. Growth-oriented stocks outperformed value stocks across the market-cap spectrum.
The following is a summary, by subadviser, of the top contributors and detractors that impacted their portion of the Fund's performance during the year relative to the Performance Index.
TOP PERFORMANCE CONTRIBUTORS
BlackRock Investment Management, LLC (active) | Allocations in the following sectors: consumer staples; communication services; real estate. Security selection in the following sectors: communication services; materials; financials. Position weightings: Netflix, Inc.; Broadcom, Inc.; Merck & Co., Inc.
BlackRock Investment Management, LLC (passive) - see Material Fund Changes for the time period covered | Allocations in the following sectors: information technology; consumer discretionary; communication services. Position weightings: NVIDIA Corp.; Microsoft Corp.; Broadcom, Inc.
SunAmerica Asset Management, LLC - see Material Fund Changes for the time period covered | In aggregate: sector allocations. Allocations in the following sectors: finance; technology; industrials. Security selection in the following sectors: consumer non-cyclicals; health care; finance. Position weightings: Berkshire Hathaway, Inc., Class B; Apple, Inc.; Philip Morris International, Inc.
TOP PERFORMANCE DETRACTORS
BlackRock Investment Management, LLC (active) | In aggregate: position weightings. Allocations in the following sectors: cash; health care; utilities. Security selection in the following sectors: information technology; consumer discretionary; industrials. Position weightings: ASML Holding NV; Tesla, Inc.; Palantir Technologies, Inc., Class A
BlackRock Investment Management, LLC (passive) - see Material Fund Changes for the time period covered | Allocations in the following sectors: health care; real estate; energy. Position weightings: Apple, Inc.; Eli Lilly & Co.; Merck & Co., Inc.
SunAmerica Asset Management, LLC - see Material Fund Changes for the time period covered | Allocations in the following sectors: consumer cyclicals; business services; non-energy materials. Security selection in the following sectors: technology; energy; industrials. Position weightings: lack of position in AppLovin Corp., Class A; NVIDIA Corp.; lack of position in Spotify Technology SA
Fund Performance
The following graph compares a $10,000 initial investment in the Fund to the index(es) listed below for the last 10 fiscal years of the Fund.
GROWTH OF $10,000
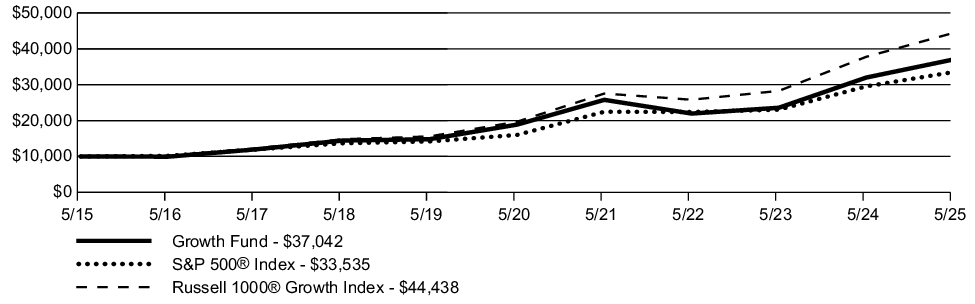
| AVERAGE ANNUAL TOTAL RETURN | 1 Year | 5 Year | 10 Year |
| Growth Fund | 15.84% | 14.44% | 13.99% |
| S&P 500® Index | 13.52% | 15.94% | 12.86% |
| Russell 1000® Growth Index | 17.62% | 17.69% | 16.08% |
Key Fund Statistics
The following table outlines key fund statistics.
| Net assets | $1,720M |
| Total number of portfolio holdings | 396 |
| Total net advisory fee paid | $8.7M |
| Portfolio turnover rate during the reporting period | 44% |
Graphical Representation of Holdings
The information below represents the composition of the Fund's net assets as of the end of the period.
Top Industries*
| Internet | 25.4% |
| Software | 20.3% |
| Semiconductors | 19.1% |
| Computers | 7.1% |
| Diversified Financial Services | 4.5% |
| Auto Manufacturers | 3.9% |
| Healthcare-Products | 3.8% |
| Pharmaceuticals | 3.2% |
| Aerospace/Defense | 1.6% |
| Private Equity | 1.5% |
| Building Materials | 1.3% |
| Commercial Services | 1.3% |
| Retail | 1.1% |
| Distribution/Wholesale | 1.1% |
| Media | 0.9% |
Portfolio Composition
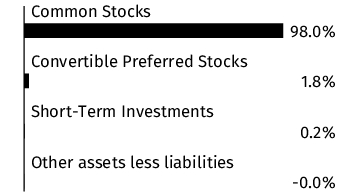
* Percentages exclude derivatives (other than purchased options), if any.
Material Fund Changes
This is a summary of certain changes to the Fund since the beginning of the period. Effective April 30, 2025, BlackRock Investment Management, LLC (“BlackRock”) was appointed to replace SunAmerica Asset Management, LLC as the subadvisor to the Fund, making BlackRock the sole subadvisor to the Fund. Additionally, changes to the Fund’s investment strategies and techniques were adjusted to match the investment processes and techniques used by the BlackRock. As a result of these changes, derivatives risk was added as a principal risk. For more comprehensive information, you may review the Fund’s next prospectus, which we expect to be available by September 30, 2025 at www.corebridgefinancial.com/rs/prospectus-and-reports/annuities#underlyingfunds or upon special request at 1-800-448-2542 or by sending an e-mail request to Forms.Request@valic.com.
Changes in and Disagreements with Accountants
There were no disagreements with the accountants during the period.
This report describes changes to the Fund that occurred during the reporting period.
Fund Expenses
What were the Fund costs for the last year ?
(Based on a hypothetical $10,000 investment)
| Fund | Costs of a $10,000 investment | Costs paid as a percentage of a $10,000 investment |
| Global Real Estate Fund* | $94 | 0.90% |
| * |
The expenses shown in the table are meant to highlight your ongoing costs only and do not reflect any fees and expenses that may be charged by the variable annuity contracts and variable life insurance policies (“Variable Contracts”) that invest in the Fund.
|
Management’s Discussion of Fund Performance
SUMMARY OF RESULTS
The Fund posted a return of 9.87% for the year ended May 31, 2025, compared to a return of 13.65% for the MSCI ACWI Index (net) (a broad-based securities market index) and 10.59% for the FTSE EPRA/NAREIT Developed Index (net) (the "Performance Index"). Over the last twelve months global financial markets performed well across market sectors on the heels of slightly lower interest rates, continued economic growth, and softening monetary policy globally. The U.S. dollar moved markedly lower compared to other developed nations during the year as uncertainty over the implications and actual rate of U.S. as tariff announcements and how they may impact U.S. growth. Real estate securities moderately underperformed the broader equity markets in nations whose markets are deemed Developed by index provider FTSE.
The following is a summary, by subadviser, of the top contributors and detractors that impacted their portion of the Fund's performance during the year relative to the Performance Index.
TOP PERFORMANCE CONTRIBUTORS
Duff & Phelps Investment Management Company | In aggregate: position weightings. Allocations in the following industries: data centers; health care; self-storage. Security selection in the following industries: health care; retail; lodging / resorts. Position weightings: Welltower, Inc.; lack of position in Alexandria Real Estate Equities, Inc.; Goodman Group. Exposure to the following countries: Australia; United States; Sweden
Massachusetts Financial Services Company | Allocations in the following industries: health care facilities; self-storage REITS; telecom tower REITS. Security selection in the following industries: multi-family residential REITS; single-family residential REITS; real estate development. Position weightings: Ventas, Inc; Mid-America Apartment Communities, Inc.; lack of position in Lineage, Inc. Exposure to the following countries: lack of exposure to Sweden; United States; France
TOP PERFORMANCE DETRACTORS
Duff & Phelps Investment Management Company | Allocations in the following sectors: industrial; lodging / resorts; specialty. Security selection in the following sectors: self storage; residential; industrial. Position weightings: Rexford Industrial Realty, Inc.; Safestore Holdings PLC; Americold Realty Trust, Inc. Exposure to the following countries: lack of exposure to Switzerland; Hong Kong; lack of exposure to Israel & United Kingdom
Massachusetts Financial Services Company | In aggregate: position weightings; sector allocations. Allocations in the following industries: timber REITS; health care REITS; integrated telecommunication services. Security selection in the following industries: self-storage REITS; retail REITS; health care REITS. Position weightings: lack of exposure to Welltower, Inc.; Rexford Industrial Realty, Inc.; Weyerhaeuser Co. Exposure to the following countries: United Kingdom; lack of exposure to Switzerland; Mexico
Fund Performance
The following graph compares a $10,000 initial investment in the Fund to the index(es) listed below for the last 10 fiscal years of the Fund.
GROWTH OF $10,000
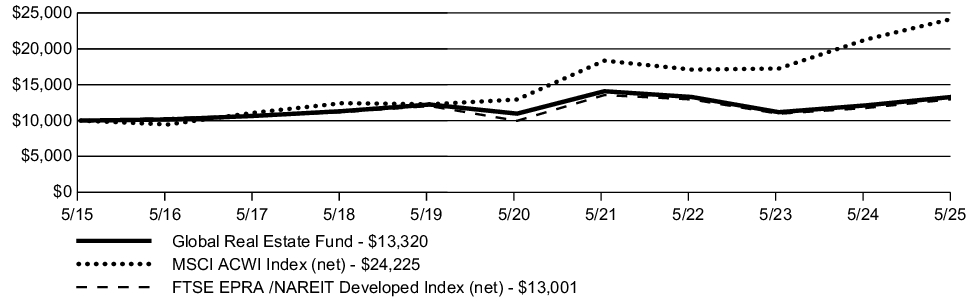
| AVERAGE ANNUAL TOTAL RETURN | 1 Year | 5 Year | 10 Year |
| Global Real Estate Fund | 9.87% | 3.96% | 2.91% |
| MSCI ACWI Index (net) | 13.65% | 13.37% | 9.25% |
| FTSE EPRA /NAREIT Developed Index (net) | 10.59% | 5.45% | 2.66% |
Key Fund Statistics
The following table outlines key fund statistics.
| Net assets | $247M |
| Total number of portfolio holdings | 81 |
| Total net advisory fee paid | $2.5M |
| Portfolio turnover rate during the reporting period | 54% |
Graphical Representation of Holdings
The information below represents the composition of the Fund's net assets as of the end of the period.
Top Industries*
| Diversified REITS | 19.0% |
| Warehouse/Industrial REITS | 13.3% |
| Apartment REITS | 13.0% |
| Real Estate | 10.6% |
| Health Care REITS | 9.7% |
| Shopping Centers REITS | 8.8% |
| Storage REITS | 7.4% |
| Office Property REITS | 4.0% |
| Regional Malls REITS | 3.7% |
| Hotel REITS | 2.8% |
| Manufactured Homes REITS | 2.7% |
| Single Tenant REITS | 1.5% |
| Engineering & Construction | 1.0% |
| Short-Term Investments | 0.9% |
| Healthcare-Services | 0.6% |
Portfolio Composition

Country
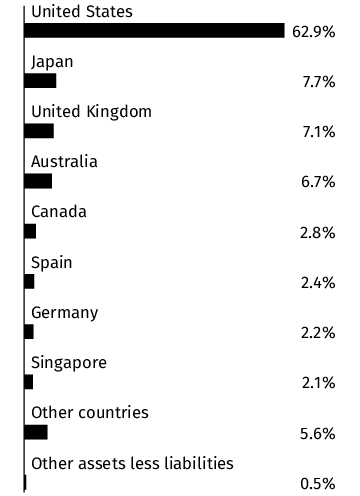
* Percentages exclude derivatives (other than purchased options), if any.
Material Fund Changes
This is a summary of certain changes to the Fund since the beginning of the period. Effective September 30, 2024, the Fund entered into a contractual advisory fee waiver to lower the advisory fee rate payable by the Fund to VALIC to 0.74% of the Fund’s average daily net assets on the first $250 million, 0.69% of the Fund’s average daily net assets on the next $250 million, and 0.64% of the Fund’s average daily net assets over $500 million. For more comprehensive information, you may review the Fund’s next prospectus, which we expect to be available by September 30, 2025 at www.corebridgefinancial.com/rs/prospectus-and-reports/annuities#underlyingfunds or upon special request at 1-800-448-2542 or by sending an e-mail request to Forms.Request@valic.com.
Changes in and Disagreements with Accountants
There were no disagreements with the accountants during the period.
Fund Expenses
What were the Fund costs for the last year ?
(Based on a hypothetical $10,000 investment)
| Fund | Costs of a $10,000 investment | Costs paid as a percentage of a $10,000 investment |
| Dynamic Allocation Fund* | $37 | 0.36% |
| * |
The expenses shown in the table are meant to highlight your ongoing costs only and do not reflect any fees and expenses that may be charged by the variable annuity contracts and variable life insurance policies (“Variable Contracts”) that invest in the Fund.
|
Management’s Discussion of Fund Performance
SUMMARY OF RESULTS
The Fund consists of two components: A fund-of-funds component representing investments in VC I Funds, and an overlay component which invests in cash, treasuries, and futures, to manage the Fund's net equity exposure.
The Fund posted a return of 8.22% for the year ended May 31, 2025, compared to a return of 13.52% S&P 500® Index (a broad-based securities market index) and 10.40% for the Blended Index (the "Performance Index") comprised of 60% S&P 500® Index; 40% Bloomberg U.S. Aggregate Bond Index. While equity markets posted positive returns during the fiscal year, this was punctuated by periods of high volatility surrounding U.S. presidential election and subsequent tariff implementation. The bond market saw positive returns as the Federal Reserve started to lower the Federal Funds Rate in the latter part of 2024.
The following is a summary, by subadviser, of the top contributors and detractors that impacted their portion of the Fund's performance during the year relative to the Performance Index.
TOP PERFORMANCE CONTRIBUTORS
AllianceBernstein, L.P. | Allocations in the following strategies: equity futures contracts used to adjust exposures and manage risk of the Fund; options overlay
SunAmerica Asset Management, LLC | Allocations in the following sectors: fixed income; international equity. Allocation to the following funds: Growth Fund; Systematic Growth Fund; Capital Appreciation Fund
TOP PERFORMANCE DETRACTORS
AllianceBernstein, L.P. | Allocations in the following strategies: tactical equity; fixed income overlay
SunAmerica Asset Management, LLC | Allocations in the following sectors: small-cap equity, mid-cap equity, global real estate. Allocation to the following funds: Large Capital Growth Fund; Dividend Value Fund; U.S. Socially Responsible Fund
Fund Performance
The following graph compares a $10,000 initial investment in the Fund to the index(es) listed below for the last 10 fiscal years of the Fund.
GROWTH OF $10,000
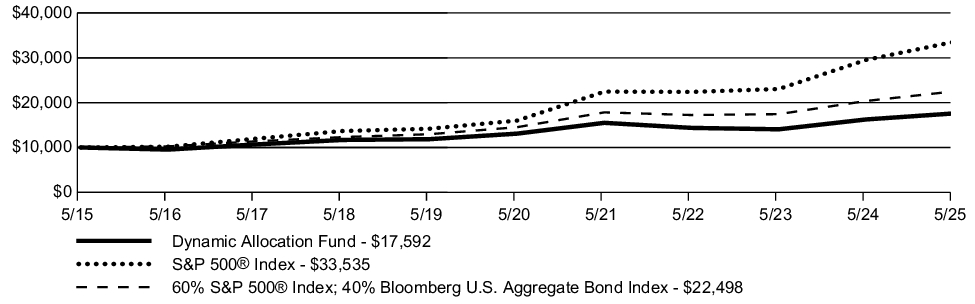
| AVERAGE ANNUAL TOTAL RETURN | 1 Year | 5 Year | 10 Year |
| Dynamic Allocation Fund | 8.22% | 6.09% | 5.81% |
| S&P 500® Index | 13.52% | 15.94% | 12.86% |
| 60% S&P 500® Index; 40% Bloomberg U.S. Aggregate Bond Index | 10.40% | 9.14% | 8.45% |
Key Fund Statistics
The following table outlines key fund statistics.
| Net assets | $131M |
| Total number of portfolio holdings | 50 |
| Total net advisory fee paid | $0.3M |
| Portfolio turnover rate during the reporting period | 20% |
Graphical Representation of Holdings
The information below represents the composition of the Fund's net assets as of the end of the period.
Portfolio Composition
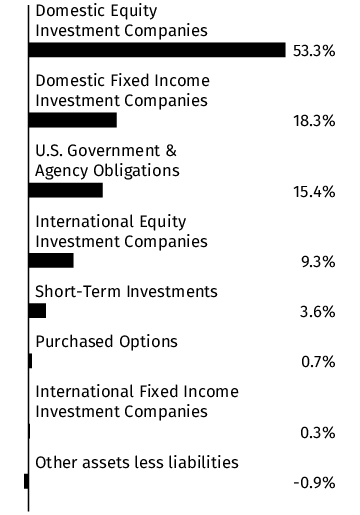
Material Fund Changes
There were no material fund changes during the period.
Changes in and Disagreements with Accountants
There were no disagreements with the accountants during the period.
Fund Expenses
What were the Fund costs for the last year ?
(Based on a hypothetical $10,000 investment)
| Fund | Costs of a $10,000 investment | Costs paid as a percentage of a $10,000 investment |
| Aggressive Growth Lifestyle Fund* | $12 | 0.11% |
| * |
The expenses shown in the table are meant to highlight your ongoing costs only and do not reflect any fees and expenses that may be charged by the variable annuity contracts and variable life insurance policies (“Variable Contracts”) that invest in the Fund.
|
Management’s Discussion of Fund Performance
SUMMARY OF RESULTS
The Aggressive Growth Lifestyle Fund invests in a combination of affiliated funds, also known as “fund of funds.” The Fund does not select specific sectors, securities, or countries and thus these factors do not influence performance. Rather, the key indicators of performance are asset allocation and manager selection.
The Fund posted a return of 10.55% for the year ended May 31, 2025, compared to 13.52% for the S&P 500® Index (a broad-based securities market index) and 11.44% for the Blended Index (the "Performance Index") comprised of 56% Russell 3000® Index; 19% MSCI EAFE Index (net); 25% Bloomberg U.S. Aggregate Bond Index. Over the period, U.S. equities outperformed international developed and emerging markets equities. Credit markets showed resilience, particularly in high yield segments.
The following is a summary of the top contributors and detractors that impacted the Fund's performance during the year relative to the Performance Index.
TOP PERFORMANCE CONTRIBUTORS
Allocations in the following funds | Systematic Value Fund; Core Bond Fund; Emerging Economies Fund
TOP PERFORMANCE DETRACTORS
Allocations in the following funds | International Equities Index Fund; Mid Cap Index Fund; Systematic Growth Fund
Fund Performance
The following graph compares a $10,000 initial investment in the Fund to the index(es) listed below for the last 10 fiscal years of the Fund.
GROWTH OF $10,000
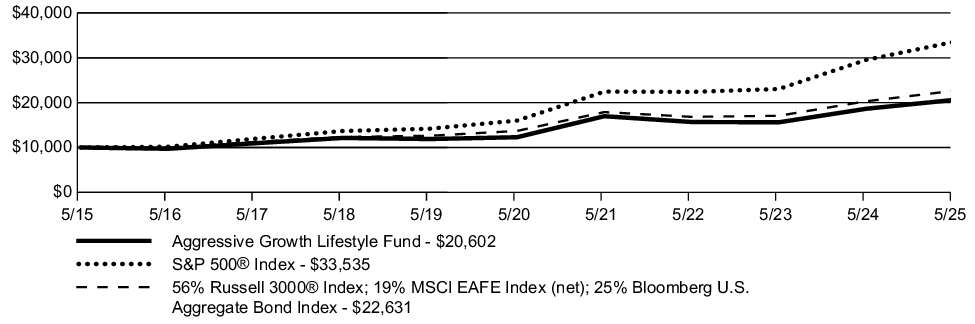
| AVERAGE ANNUAL TOTAL RETURN | 1 Year | 5 Year | 10 Year |
| Aggressive Growth Lifestyle Fund | 10.55% | 10.88% | 7.50% |
| S&P 500® Index | 13.52% | 15.94% | 12.86% |
| 56% Russell 3000® Index; 19% MSCI EAFE Index (net); 25% Bloomberg U.S. Aggregate Bond Index | 11.44% | 10.57% | 8.51% |
Key Fund Statistics
The following table outlines key fund statistics.
| Net assets | $713M |
| Total number of portfolio holdings | 11 |
| Total net advisory fee paid | $0.5M |
| Portfolio turnover rate during the reporting period | 22% |
Graphical Representation of Holdings
The information below represents the composition of the Fund's net assets as of the end of the period.
Portfolio Composition
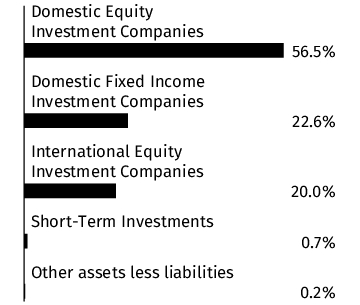
Material Fund Changes
There were no material fund changes during the period.
Changes in and Disagreements with Accountants
There were no disagreements with the accountants during the period.
This report describes changes to the Fund that occurred during the reporting period.
Fund Expenses
What were the Fund costs for the last year ?
(Based on a hypothetical $10,000 investment)
| Fund | Costs of a $10,000 investment | Costs paid as a percentage of a $10,000 investment |
| U.S. Socially Responsible Fund* | $39 | 0.37% |
| * |
The expenses shown in the table are meant to highlight your ongoing costs only and do not reflect any fees and expenses that may be charged by the variable annuity contracts and variable life insurance policies (“Variable Contracts”) that invest in the Fund.
|
Management’s Discussion of Fund Performance
SUMMARY OF RESULTS
The Fund is an optimized portfolio which seeks to track the S&P 500® Index while investing in socially responsive companies. The Fund's criteria do not permit investment in companies whose businesses rely significantly on alcohol, firearms, gambling, tobacco, nuclear power, or production of weaponry. Furthermore, companies deemed to have poor labor/employee relations or environmental records are also screened out of the investable universe. These criteria may create differences in Fund performance relative to the Benchmark.
The Fund posted a return of 11.18% for the year ended May 31, 2025, compared to a return of 13.52% for the S&P 500® Index (a broad-based securities market & Performance Index). Over the period, U.S. large-cap equities outperformed mid- and small-cap equities, according to the Russell® family of indices. Growth-oriented stocks outperformed value stocks across the market-cap spectrum.
The following is a summary of the top contributors and detractors that impacted the Fund's performance during the year relative to the Performance Index.
TOP PERFORMANCE CONTRIBUTORS
BlackRock Investment Management, LLC - see Material Fund Changes for the time period covered | Allocations in the following sectors: health care; information technology; consumer staples . Security selection in the following sectors: information technology; health care; financials. Position weightings: lack of position in Apple, Inc.; lack of position in Eli Lilly & Co.; lack of position in UnitedHealth Group, Inc.
SunAmerica Asset Management, LLC - see Material Fund Changes for the time period covered | Allocations in the following sectors: business services; healthcare; finance. Security selection in the following sectors: finance; utilities; non-energy materials. Position weightings: Netflix, Inc.; Visa, Inc., Class A; lack of a position in Merck & Co., Inc.
TOP PERFORMANCE DETRACTORS
BlackRock Investment Management, LLC - see Material Fund Changes for the time period covered | Allocations in the following sectors: communication services; real estate; financials. Security selection in the following sectors: consumer discretionary; utilities; communication services. Position weightings: lack of position in Microsoft Corp.; lack of position in Meta Platforms, Inc., Class A; lack of position in Tesla, Inc.
SunAmerica Asset Management, LLC - see Material Fund Changes for the time period covered | Allocations in the following sectors: consumer non-cyclicals; technology; non-energy materials. Security selection in the following sectors: technology; consumer non-cyclicals; healthcare. Position weightings: lack of a position in Tesla, Inc.; HP, Inc.; NetApp, Inc.
Fund Performance
The following graph compares a $10,000 initial investment in the Fund to the index(es) listed below for the last 10 fiscal years of the Fund.
GROWTH OF $10,000
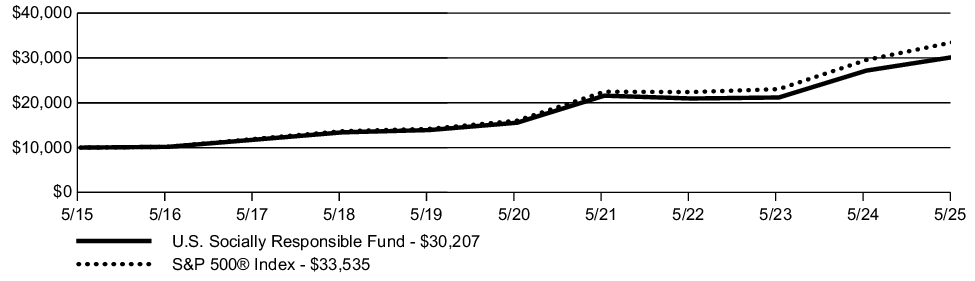
| AVERAGE ANNUAL TOTAL RETURN | 1 Year | 5 Year | 10 Year |
| U.S. Socially Responsible Fund | 11.18% | 14.20% | 11.69% |
| S&P 500® Index | 13.52% | 15.94% | 12.86% |
Key Fund Statistics
The following table outlines key fund statistics.
| Net assets | $560M |
| Total number of portfolio holdings | 185 |
| Total net advisory fee paid | $1.6M |
| Portfolio turnover rate during the reporting period | 26% |
Graphical Representation of Holdings
The information below represents the composition of the Fund's net assets as of the end of the period.
Top Industries*
| Semiconductors | 15.4% |
| Software | 11.3% |
| Diversified Financial Services | 9.6% |
| Computers | 7.5% |
| Internet | 6.5% |
| Retail | 5.0% |
| Commercial Services | 4.3% |
| REITS | 3.7% |
| Healthcare-Products | 3.6% |
| Telecommunications | 3.2% |
| Electric | 3.0% |
| Insurance | 2.9% |
| Chemicals | 2.4% |
| Media | 2.2% |
| Pipelines | 1.7% |
Portfolio Composition

* Percentages exclude derivatives (other than purchased options), if any.
Material Fund Changes
This is a summary of certain changes to the Fund since the beginning of the period. Effective April 30, 2025, BlackRock Investment Management, LLC was appointed as subadviser to the Fund, replacing the existing subadvisor, SunAmerica Asset Management, LLC. Additionally, changes to the Fund’s investment strategies and techniques were adjusted to match the investment processes and techniques used by the subadviser. As a result of these changes, derivatives risk and failure to match index performance risk were added as principal risks, and enhanced index strategy risk was removed as a principal risk. Additionally, effective April 30, 2025, the Fund entered into a contractual advisory fee waiver to lower the advisory fee rate payable by the Fund to VALIC to 0.23% of the Fund’s average daily net assets on the first $1 billion and 0.22% of the Fund’s average daily net assets over $1 billion. For more comprehensive information, you may review the Fund’s next prospectus, which we expect to be available by September 30, 2025 at www.corebridgefinancial.com/rs/prospectus-and-reports/annuities#underlyingfunds or upon special request at 1-800-448-2542 or by sending an e-mail request to Forms.Request@valic.com.
Changes in and Disagreements with Accountants
There were no disagreements with the accountants during the period.
This report describes changes to the Fund that occurred during the reporting period.
Fund Expenses
What were the Fund costs for the last year ?
(Based on a hypothetical $10,000 investment)
| Fund | Costs of a $10,000 investment | Costs paid as a percentage of a $10,000 investment |
| Capital Appreciation Fund* | $78 | 0.73% |
| * |
The expenses shown in the table are meant to highlight your ongoing costs only and do not reflect any fees and expenses that may be charged by the variable annuity contracts and variable life insurance policies (“Variable Contracts”) that invest in the Fund.
|
Management’s Discussion of Fund Performance
SUMMARY OF RESULTS
The Fund posted a return of 14.63% for the year ended May 31, 2025, compared to a return of 13.52% for the S&P 500® Index (a broad-based securities market index) and 17.62% for the Russell 1000® Growth Index (the "Performance Index"). Over the period, U.S. large-cap equities outperformed mid- and small-cap equities, according to the Russell® family of indices. Growth-oriented stocks outperformed value stocks across the market-cap spectrum.
The following is a summary of the top contributors and detractors that impacted the Fund's performance during the year relative to the Performance Index.
TOP PERFORMANCE CONTRIBUTORS
Allocations in the following sectors | utilities; financials; consumer staples
Security selection in the following sectors | consumer discretionary; industrials
Position weightings | Axon Enterprise, Inc.; DoorDash, Inc., Class A; Broadcom, Inc.
TOP PERFORMANCE DETRACTORS
In aggregate | position weightings
Allocations in the following sectors | health care; cash; communication services
Security selection in the following sectors | information technology; financials; communication services
Position weightings | Tesla, Inc.; lack of position in Palantir Technologies, Inc., Class A; UnitedHealth Group, Inc.
Fund Performance
The following graph compares a $10,000 initial investment in the Fund to the index(es) listed below for the last 10 fiscal years of the Fund.
GROWTH OF $10,000
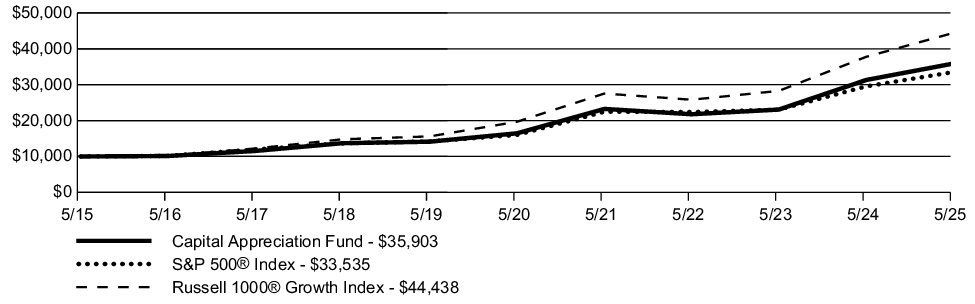
| AVERAGE ANNUAL TOTAL RETURN | 1 Year | 5 Year | 10 Year |
| Capital Appreciation Fund | 14.63% | 16.89% | 13.64% |
| S&P 500® Index | 13.52% | 15.94% | 12.86% |
| Russell 1000® Growth Index | 17.62% | 17.69% | 16.08% |
Key Fund Statistics
The following table outlines key fund statistics.
| Net assets | $328M |
| Total number of portfolio holdings | 64 |
| Total net advisory fee paid | $1.3M |
| Portfolio turnover rate during the reporting period | 52% |
Graphical Representation of Holdings
The information below represents the composition of the Fund's net assets as of the end of the period.
Top Industries*
| Internet | 21.2% |
| Software | 18.3% |
| Semiconductors | 15.1% |
| Computers | 10.8% |
| Diversified Financial Services | 6.7% |
| Pharmaceuticals | 4.6% |
| Commercial Services | 4.2% |
| Auto Manufacturers | 3.8% |
| Telecommunications | 3.0% |
| Biotechnology | 2.6% |
| Short-Term Investments | 2.2% |
| Insurance | 1.6% |
| Healthcare-Services | 1.4% |
| Electric | 0.9% |
| Engineering & Construction | 0.9% |
Portfolio Composition

* Percentages exclude derivatives (other than purchased options), if any.
Material Fund Changes
This is a summary of certain changes to the Fund since the beginning of the period. Effective September 30, 2024, changes to the Fund’s investment strategies and techniques were adjusted to match the investment processes and techniques used by the Fund’s subadvisor. As a result of these changes, ESG investment risk was added as a principal risk. For more comprehensive information, you may review the Fund’s next prospectus, which we expect to be available by September 30, 2025 at www.corebridgefinancial.com/rs/prospectus-and-reports/annuities#underlyingfunds or upon special request at 1-800-448-2542 or by sending an e-mail request to Forms.Request@valic.com.
Changes in and Disagreements with Accountants
There were no disagreements with the accountants during the period.
Fund Expenses
What were the Fund costs for the last year ?
(Based on a hypothetical $10,000 investment)
| Fund | Costs of a $10,000 investment | Costs paid as a percentage of a $10,000 investment |
| Conservative Growth Lifestyle Fund* | $14 | 0.13% |
| * |
The expenses shown in the table are meant to highlight your ongoing costs only and do not reflect any fees and expenses that may be charged by the variable annuity contracts and variable life insurance policies (“Variable Contracts”) that invest in the Fund.
|
Management’s Discussion of Fund Performance
SUMMARY OF RESULTS
The Conservative Growth Lifestyle Fund invests in a combination of affiliated funds, also known as “fund of funds.” The Fund does not select specific sectors, securities, or countries and thus these factors do not influence performance. Rather, the key indicators of performance are asset allocation and manager selection.
The Fund posted a return of 7.73% for the year ended May 31, 2025, compared to 13.52% for the S&P 500® Index (a broad-based securities market index) and 8.28% for the Blended Index (the "Performance Index") comprised of 26% Russell 3000® Index; 9% MSCI EAFE Index (net); 65% Bloomberg U.S. Aggregate Bond Index. Over the period, U.S. equities outperformed international developed and emerging markets equities. Credit markets showed resilience, particularly in high yield segments.
The following is a summary of the top contributors and detractors that impacted the Fund's performance during the year relative to the Performance Index.
TOP PERFORMANCE CONTRIBUTORS
Allocations in the following funds | Systematic Value Fund; Core Bond Fund; Emerging Economies Fund
TOP PERFORMANCE DETRACTORS
Allocations in the following funds | Mid Cap Index Fund; International Equities Index Fund; Systematic Growth Fund
Fund Performance
The following graph compares a $10,000 initial investment in the Fund to the index(es) listed below for the last 10 fiscal years of the Fund.
GROWTH OF $10,000
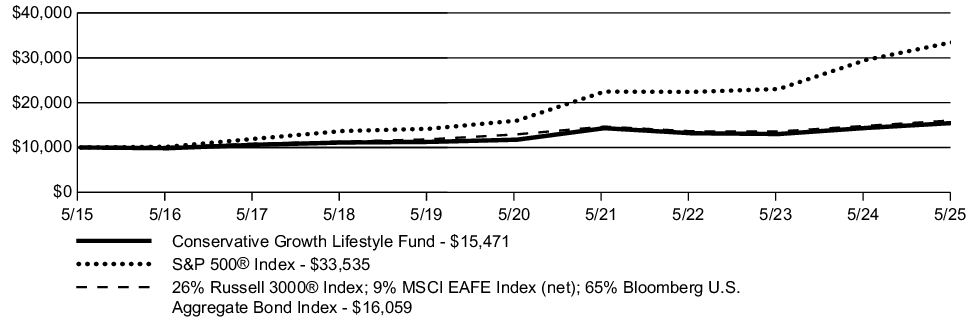
| AVERAGE ANNUAL TOTAL RETURN | 1 Year | 5 Year | 10 Year |
| Conservative Growth Lifestyle Fund | 7.73% | 5.68% | 4.46% |
| S&P 500® Index | 13.52% | 15.94% | 12.86% |
| 26% Russell 3000® Index; 9% MSCI EAFE Index (net); 65% Bloomberg U.S. Aggregate Bond Index | 8.28% | 4.42% | 4.85% |
Key Fund Statistics
The following table outlines key fund statistics.
| Net assets | $280M |
| Total number of portfolio holdings | 11 |
| Total net advisory fee paid | $0.2M |
| Portfolio turnover rate during the reporting period | 20% |
Graphical Representation of Holdings
The information below represents the composition of the Fund's net assets as of the end of the period.
Portfolio Composition
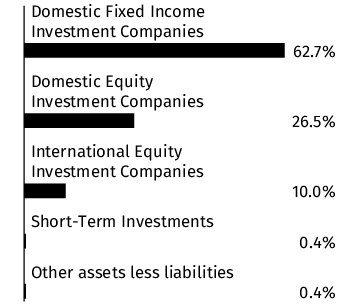
Material Fund Changes
There were no material fund changes during the period.
Changes in and Disagreements with Accountants
There were no disagreements with the accountants during the period.
Fund Expenses
What were the Fund costs for the last year ?
(Based on a hypothetical $10,000 investment)
| Fund | Costs of a $10,000 investment | Costs paid as a percentage of a $10,000 investment |
| Core Bond Fund* | $49 | 0.48% |
| * |
The expenses shown in the table are meant to highlight your ongoing costs only and do not reflect any fees and expenses that may be charged by the variable annuity contracts and variable life insurance policies (“Variable Contracts”) that invest in the Fund.
|
Management’s Discussion of Fund Performance
SUMMARY OF RESULTS
The Fund posted a return of 5.68% for the year ending May 31, 2025, compared to a return of 5.46% for the Bloomberg U.S. Aggregate Bond Index (a broad-based securities market & Performance Index). The Treasury market witnessed very high volatility over the last 12 months, driven by tariff uncertainty and markets focused on fiscal spending. The mortgage-backed securities markets also had periods of spread widening driven by rate volatility. The credit market spreads peaked to the widest levels in a year in April 2025 due to tariff announcements, but since the tariff pause announcements the credit spreads continued to grind tighter.
The following is a summary, by subadviser, of the top contributors and detractors that impacted their portion of the Fund's performance during the year relative to the Performance Index.
TOP PERFORMANCE CONTRIBUTORS
J.P. Morgan Investment Management | Allocations in the following sectors: Treasuries; agency mortgage-backed securities; non-agency mortgage-backed securities. Security selection in the following sectors: corporate credit; asset-backed securities; collateralized mortgage-backed securities
PineBridge Investments, LLC | In aggregate: position weightings; sector allocations. Allocations in the following sectors: Treasuries; industrials; financials. Security selection in the following sectors: industrials; financials; agency mortgage-backed securities
TOP PERFORMANCE DETRACTORS
J.P. Morgan Investment Management | Allocations in the following sectors: corporate credit
PineBridge Investments, LLC | In aggregate: yield curve positioning. Allocations in the following sectors: collateralized mortgage-backed securities; sovereign. Security selection in the following sectors: sovereign
Fund Performance
The following graph compares a $10,000 initial investment in the Fund to the index(es) listed below for the last 10 fiscal years of the Fund.
GROWTH OF $10,000
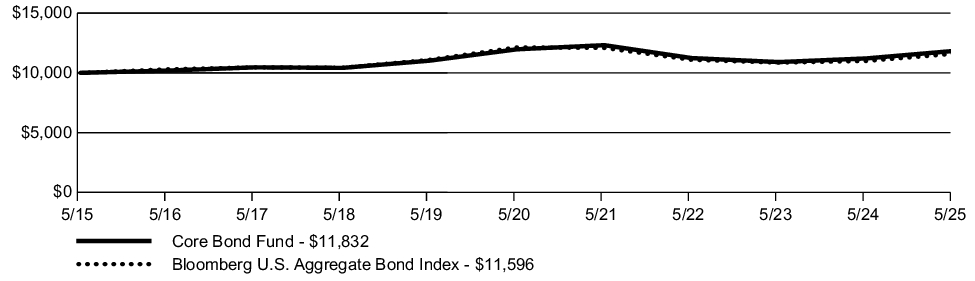
| AVERAGE ANNUAL TOTAL RETURN | 1 Year | 5 Year | 10 Year |
| Core Bond Fund | 5.68% | (0.23)% | 1.70% |
| Bloomberg U.S. Aggregate Bond Index | 5.46% | (0.90)% | 1.49% |
Key Fund Statistics
The following table outlines key fund statistics.
| Net assets | $2,707M |
| Total number of portfolio holdings | 1,722 |
| Total net advisory fee paid | $9.9M |
| Portfolio turnover rate during the reporting period | 44% |
Graphical Representation of Holdings
The information below represents the composition of the Fund as of the end of the period.
Top Industries*
(% of net assets)
(% of net assets)
| U.S. Government & Agency Obligations | 53.3% |
| Banks | 8.3% |
| Collateralized Mortgage Obligations | 4.0% |
| Other Asset Backed Securities | 3.8% |
| Electric | 3.2% |
| Short-Term Investments | 3.1% |
| Auto Loan Receivables | 2.7% |
| Diversified Financial Services | 1.6% |
| Pipelines | 1.3% |
| Pharmaceuticals | 1.2% |
| Oil & Gas | 1.1% |
| Foreign Government Obligations | 1.1% |
| Telecommunications | 1.0% |
| Insurance | 1.0% |
| Healthcare-Services | 0.9% |
Portfolio Composition
(% of net assets)
(% of net assets)
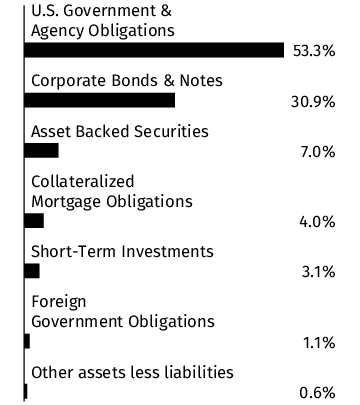
Credit Quality **
(% of total debt issues)
(% of total debt issues)
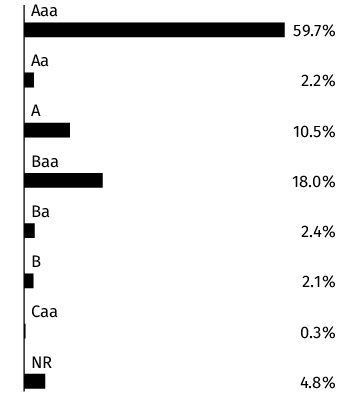
* Percentages exclude derivatives (other than purchased options), if any.
** Credit quality ratings shown above reflect the rating assigned by Moody's Investors Service, Inc. Where Moody's ratings are not available, we have used Standard & Poor's ratings. Unrated investments do not necessarily indicate low credit quality. Credit quality ratings are subject to change. Percentages exclude short-term securities.
Material Fund Changes
There were no material fund changes during the period.
Changes in and Disagreements with Accountants
There were no disagreements with the accountants during the period.
Fund Expenses
What were the Fund costs for the last year ?
(Based on a hypothetical $10,000 investment)
| Fund | Costs of a $10,000 investment | Costs paid as a percentage of a $10,000 investment |
| High Yield Bond Fund* | $71 | 0.68% |
| * |
The expenses shown in the table are meant to highlight your ongoing costs only and do not reflect any fees and expenses that may be charged by the variable annuity contracts and variable life insurance policies (“Variable Contracts”) that invest in the Fund.
|
Management’s Discussion of Fund Performance
SUMMARY OF RESULTS
The Fund posted a return of 8.42% for the year ended May 31, 2025, compared to a return of 5.84% for the Bloomberg U.S. Universal Index (a broad-based securities market index) and 9.58% for the FTSE US High-Yield Market Index (the "Performance Index"). Over the twelve-month period spreads widened by 7 basis points (bps) to 315 bps. Yields decreased by 46 bps to 7.72% according to the Bloomberg U.S. Corporate High Yield index
The following is a summary of the top contributors and detractors that impacted the Fund's performance during the year relative to the Performance Index.
TOP PERFORMANCE CONTRIBUTORS
Allocations in the following industries | automotive; consumer products; retailers
Security selection in the following industries | financial institutions; energy; wireless
Position weightings | lack of position in New Fortress Energy LLC; E.W. Scripps Co.; Canary Wharf Group
TOP PERFORMANCE DETRACTORS
Allocations in the following industries | building materials; pharmaceuticals; energy
Security selection in the following industries | technology; wirelines; cable and satellite
Position weightings | Endurance International; lack of position in Commscope Holdings Co. Inc.; US LBM Holdings LLC
Fund Performance
The following graph compares a $10,000 initial investment in the Fund to the index(es) listed below for the last 10 fiscal years of the Fund.
GROWTH OF $10,000
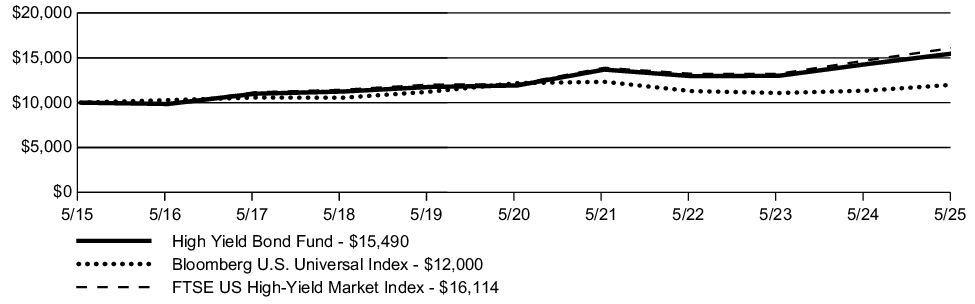
| AVERAGE ANNUAL TOTAL RETURN | 1 Year | 5 Year | 10 Year |
| High Yield Bond Fund | 8.42% | 5.39% | 4.47% |
| Bloomberg U.S. Universal Index | 5.84% | (0.29)% | 1.84% |
| FTSE US High-Yield Market Index | 9.58% | 5.98% | 4.89% |
Key Fund Statistics
The following table outlines key fund statistics.
| Net assets | $416M |
| Total number of portfolio holdings | 313 |
| Total net advisory fee paid | $2.3M |
| Portfolio turnover rate during the reporting period | 57% |
Graphical Representation of Holdings
The information below represents the composition of the Fund as of the end of the period.
Top Industries*
(% of net assets)
(% of net assets)
| Short-Term Investments | 11.3% |
| Media | 7.4% |
| Retail | 6.9% |
| Oil & Gas | 6.3% |
| Telecommunications | 5.6% |
| Diversified Financial Services | 5.3% |
| Commercial Services | 5.3% |
| Repurchase Agreements | 5.0% |
| Software | 4.8% |
| Entertainment | 4.3% |
| Packaging & Containers | 3.7% |
| Insurance | 3.6% |
| REITS | 3.6% |
| Computers | 3.4% |
| Home Builders | 2.9% |
Portfolio Composition
(% of net assets)
(% of net assets)
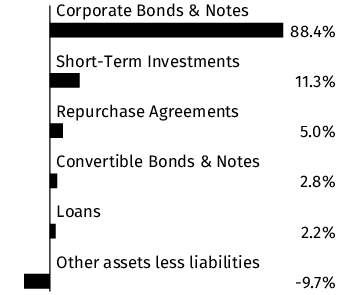
Credit Quality **
(% of total debt issues)
(% of total debt issues)
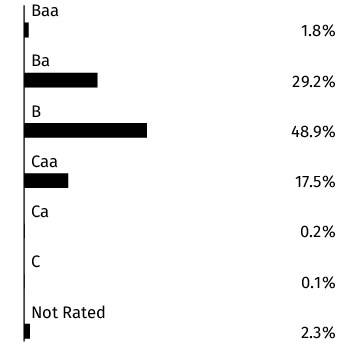
* Percentages exclude derivatives (other than purchased options), if any.
** Credit quality ratings shown above reflect the rating assigned by Moody's Investors Service, Inc. Where Moody's ratings are not available, we have used Standard & Poor's ratings. Unrated investments do not necessarily indicate low credit quality. Credit quality ratings are subject to change. Percentages exclude short-term securities.
Material Fund Changes
There were no material fund changes during the period.
Changes in and Disagreements with Accountants
There were no disagreements with the accountants during the period.
This report describes changes to the Fund that occurred during the reporting period.
Fund Expenses
What were the Fund costs for the last year ?
(Based on a hypothetical $10,000 investment)
| Fund | Costs of a $10,000 investment | Costs paid as a percentage of a $10,000 investment |
| International Opportunities Fund* | $106 | 1.01% |
| * |
The expenses shown in the table are meant to highlight your ongoing costs only and do not reflect any fees and expenses that may be charged by the variable annuity contracts and variable life insurance policies (“Variable Contracts”) that invest in the Fund.
|
Management’s Discussion of Fund Performance
SUMMARY OF RESULTS
The Fund posted a return of 10.84% for the year ended May 31, 2025, compared to a return of 13.75% for the MSCI ACWI ex USA Index (net) (a broad-based securities market) and 13.90% for the MSCI ACWI ex USA SMID Cap Index (net) (the "Performance Index"). Over the period, international stocks outperformed U.S. stocks, largely due to recent trade uncertainty. International small caps underperformed international core. However, quality stocks have diverged from the broader equity markets as investors have shortened their time horizons in the face of continued trade and budget uncertainty.
The following is a summary, by subadviser, of the top contributors and detractors that impacted their portion of the Fund's performance during the year relative to the Performance Index.
TOP PERFORMANCE CONTRIBUTORS
Invesco Advisers, Inc. | In aggregate: country allocations. Allocations in the following sectors: energy; industrials; materials. Security selection in the following sectors: information technology; communication services; consumer discretionary. Position weightings: VZ Holding AG; Belimo Holding AG; Obic Co., Ltd. Exposure to the following countries: Japan; India; Taiwan
Wellington Management Company, LLP | In aggregate: country allocations. Allocations in the following sectors: consumer staples; materials; industrials. Security selection in the following sectors: financials; materials; health care. Position weightings: Verona Pharma PLC ADR; BAWAG Group AG; Rakuten Bank, Ltd. Exposure to the following countries: Austria; Japan; Taiwan
TOP PERFORMANCE DETRACTORS
Invesco Advisers, Inc. | In aggregate: position weightings. Allocations in the following sectors: financials; information technology; cash. Security selection in the following sectors: health care; industrials; financials. Position weightings: ICON PLC; Carl Zeiss Meditec AG; lack of position in Rheinmetall AG. Exposure to the following countries: Germany; Italy; United States
Wellington Management Company, LLP | Allocations in the following sectors: cash; financials; consumer discretionary. Security selection in the following sectors: information technology; communication services; consumer discretionary. Position weightings: lack of position in Rheinmetall AG; Kyushu Electric Power Co., Inc.; JCDecaux SE. Exposure to the following countries: Germany; Israel; Australia
Fund Performance
The following graph compares a $10,000 initial investment in the Fund to the index(es) listed below for the last 10 fiscal years of the Fund.
GROWTH OF $10,000
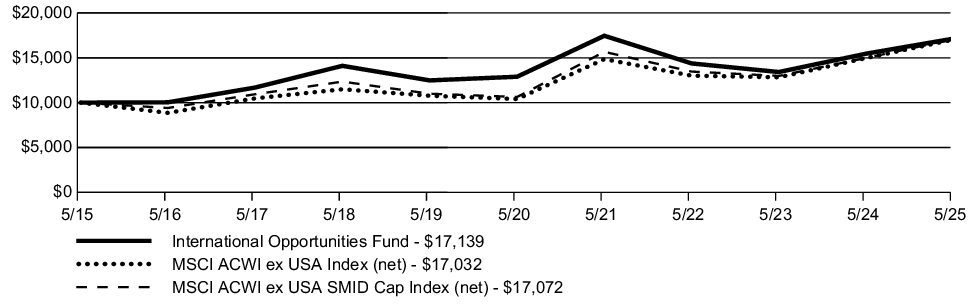
| AVERAGE ANNUAL TOTAL RETURN | 1 Year | 5 Year | 10 Year |
| International Opportunities Fund | 10.84% | 5.87% | 5.54% |
| MSCI ACWI ex USA Index (net) | 13.75% | 10.37% | 5.47% |
| MSCI ACWI ex USA SMID Cap Index (net) | 13.90% | 9.94% | 5.49% |
Key Fund Statistics
The following table outlines key fund statistics.
| Net assets | $329M |
| Total number of portfolio holdings | 349 |
| Total net advisory fee paid | $3.1M |
| Portfolio turnover rate during the reporting period | 61% |
Graphical Representation of Holdings
The information below represents the composition of the Fund's net assets as of the end of the period.
Top Industries*
| Machinery-Diversified | 6.2% |
| Retail | 6.2% |
| Banks | 5.9% |
| Commercial Services | 4.9% |
| Electronics | 4.3% |
| Internet | 4.2% |
| Healthcare-Products | 4.1% |
| Miscellaneous Manufacturing | 3.9% |
| Computers | 3.8% |
| Software | 3.8% |
| Short-Term Investments | 3.2% |
| Semiconductors | 2.9% |
| Chemicals | 2.8% |
| Diversified Financial Services | 2.7% |
| Engineering & Construction | 2.7% |
Portfolio Composition
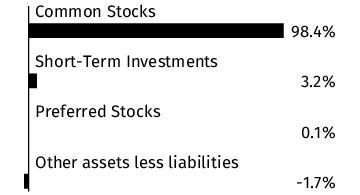
Country
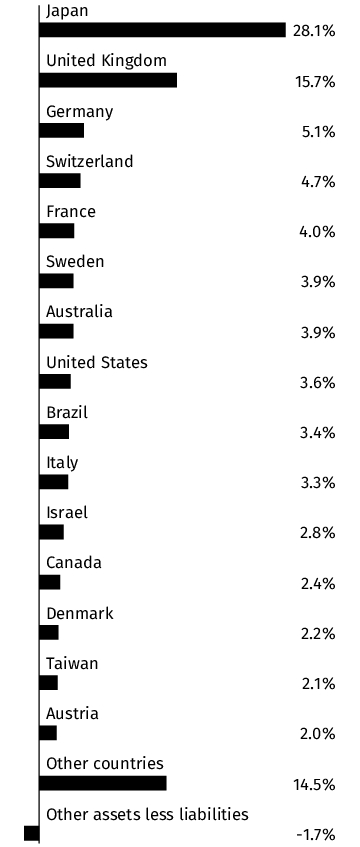
* Percentages exclude derivatives (other than purchased options), if any.
Material Fund Changes
This is a summary of certain changes to the Fund since the beginning of the period. Effective September 30, 2024, Japan exposure risk was added as a principal risk of the Fund. For more comprehensive information, you may review the Fund’s next prospectus, which we expect to be available by September 30, 2025 at www.corebridgefinancial.com/rs/prospectus-and-reports/annuities#underlyingfunds or upon special request at 1-800-448-2542 or by sending an e-mail request to Forms.Request@valic.com.
Changes in and Disagreements with Accountants
There were no disagreements with the accountants during the period.
Fund Expenses
What were the Fund costs for the last year ?
(Based on a hypothetical $10,000 investment)
| Fund | Costs of a $10,000 investment | Costs paid as a percentage of a $10,000 investment |
| Mid Cap Value Fund* | $83 | 0.82% |
| * |
The expenses shown in the table are meant to highlight your ongoing costs only and do not reflect any fees and expenses that may be charged by the variable annuity contracts and variable life insurance policies (“Variable Contracts”) that invest in the Fund.
|
Management’s Discussion of Fund Performance
SUMMARY OF RESULTS
The Fund posted a return of 3.31% for the year ended May 31, 2025, compared to a return of 13.12% for the Russell 3000® Index (a broad-based securities market index) and 6.03% for the Russell Midcap® Value Index (the "Performance Index"). During the period mid cap value stocks underperformed mid cap growth stocks when measured using the Russell Midcap Value and Growth Indices. Mid cap stocks outperformed small cap stocks, but underperformed large cap stocks for the year, as measured by the Russell Midcap, Russell 2000, and Russell 1000 Indices respectively.
The following is a summary, by subadviser, of the top contributors and detractors that impacted their portion of the Fund's performance during the year relative to the Performance Index.
TOP PERFORMANCE CONTRIBUTORS
Boston Partners Global Investors, Inc. | Allocations in the following sectors: health care; consumer staples; information technology. Security selection in the following sectors: consumer discretionary; health care; utilities. Position weightings: Howmet Aerospace, Inc.; LPL Financial Holdings, Inc.; Check Point Software Technologies, Ltd.
Wellington Management Company, LLP | In aggregate: sector allocations. Allocations in the following sectors: financials; cash; health care. Security selection in the following sectors: real estate; consumer staples; utilities. Position weightings: American Healthcare REIT, Inc.; US Foods Holding Corp.; Coherent Corp.
TOP PERFORMANCE DETRACTORS
Boston Partners Global Investors, Inc. | Allocations in the following sectors: communication services; utilities; cash. Security selection in the following sectors: energy; financials; real estate. Position weightings: Weatherford International PLC; ICON PLC; Chord Energy Corp.
Wellington Management Company, LLP | In aggregate: position weightings. Allocations in the following sectors: communication services. Security selection in the following sectors: consumer discretionary; financials; health care. Position weightings: Integra LifeSciences Holdings Corp.; Charles River Laboratories International, Inc.; Chord Energy Corp.
Fund Performance
The following graph compares a $10,000 initial investment in the Fund to the index(es) listed below for the last 10 fiscal years of the Fund.
GROWTH OF $10,000
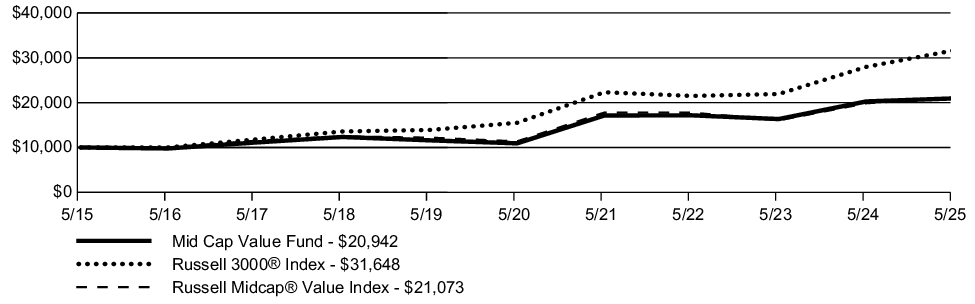
| AVERAGE ANNUAL TOTAL RETURN | 1 Year | 5 Year | 10 Year |
| Mid Cap Value Fund | 3.31% | 13.90% | 7.67% |
| Russell 3000® Index | 13.12% | 15.34% | 12.21% |
| Russell Midcap® Value Index | 6.03% | 13.18% | 7.74% |
Key Fund Statistics
The following table outlines key fund statistics.
| Net assets | $594M |
| Total number of portfolio holdings | 206 |
| Total net advisory fee paid | $5.2M |
| Portfolio turnover rate during the reporting period | 141% |
Graphical Representation of Holdings
The information below represents the composition of the Fund's net assets as of the end of the period.
Top Industries*
| Diversified Financial Services | 8.7% |
| REITS | 7.7% |
| Banks | 5.7% |
| Oil & Gas | 5.5% |
| Insurance | 4.8% |
| Electronics | 3.9% |
| Computers | 3.5% |
| Retail | 3.3% |
| Aerospace/Defense | 3.2% |
| Commercial Services | 3.1% |
| Electric | 2.9% |
| Machinery-Diversified | 2.8% |
| Food | 2.8% |
| Chemicals | 2.7% |
| Internet | 2.7% |
Portfolio Composition
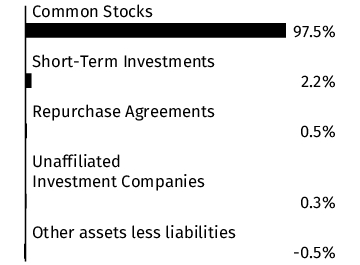
* Percentages exclude derivatives (other than purchased options), if any.
Material Fund Changes
There were no material fund changes during the period.
Changes in and Disagreements with Accountants
There were no disagreements with the accountants during the period.
Fund Expenses
What were the Fund costs for the last year ?
(Based on a hypothetical $10,000 investment)
| Fund | Costs of a $10,000 investment | Costs paid as a percentage of a $10,000 investment |
| Moderate Growth Lifestyle Fund* | $10 | 0.10% |
| * |
The expenses shown in the table are meant to highlight your ongoing costs only and do not reflect any fees and expenses that may be charged by the variable annuity contracts and variable life insurance policies (“Variable Contracts”) that invest in the Fund.
|
Management’s Discussion of Fund Performance
SUMMARY OF RESULTS
The Moderate Growth Lifestyle Fund invests in a combination of affiliated funds, also known as “fund of funds.” The Fund does not select specific sectors, securities, or countries and thus these factors do not influence performance. Rather, the key indicators of performance are asset allocation and manager selection.
The Fund posted a return of 9.14% for the year ended May 31, 2025, compared to 13.52% for the S&P 500® Index (a broad-based securities market index) and 9.87% for the Blended Index (the "Performance Index") comprised of 41% Russell 3000® Index; 14% MSCI EAFE Index (net); 45% Bloomberg U.S. Aggregate Bond Index. Over the period, U.S. equities outperformed international developed and emerging markets equities. Credit markets showed resilience, particularly in high yield segments.
The following is a summary of the top contributors and detractors that impacted the Fund's performance during the year relative to the Performance Index.
TOP PERFORMANCE CONTRIBUTORS
Allocations in the following funds | Systematic Value Fund; Core Bond Fund; Emerging Economies Fund
TOP PERFORMANCE DETRACTORS
Allocations in the following funds | Mid Cap Index Fund; International Equities Index Fund; Systematic Growth Fund
Fund Performance
The following graph compares a $10,000 initial investment in the Fund to the index(es) listed below for the last 10 fiscal years of the Fund.
GROWTH OF $10,000
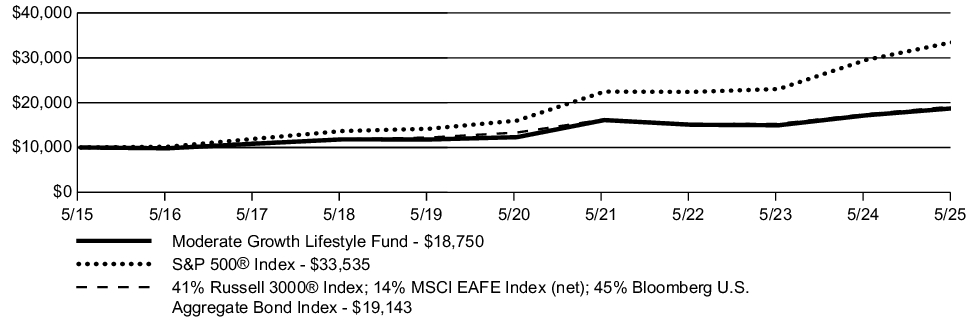
| AVERAGE ANNUAL TOTAL RETURN | 1 Year | 5 Year | 10 Year |
| Moderate Growth Lifestyle Fund | 9.14% | 8.79% | 6.49% |
| S&P 500® Index | 13.52% | 15.94% | 12.86% |
| 41% Russell 3000® Index; 14% MSCI EAFE Index (net); 45% Bloomberg U.S. Aggregate Bond Index | 9.87% | 7.49% | 6.71% |
Key Fund Statistics
The following table outlines key fund statistics.
| Net assets | $997M |
| Total number of portfolio holdings | 9 |
| Total net advisory fee paid | $0.7M |
| Portfolio turnover rate during the reporting period | 21% |
Graphical Representation of Holdings
The information below represents the composition of the Fund's net assets as of the end of the period.
Portfolio Composition
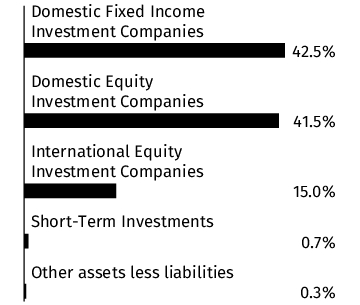
Material Fund Changes
There were no material fund changes during the period.
Changes in and Disagreements with Accountants
There were no disagreements with the accountants during the period.
Fund Expenses
What were the Fund costs for the last year ?
(Based on a hypothetical $10,000 investment)
| Fund | Costs of a $10,000 investment | Costs paid as a percentage of a $10,000 investment |
| Small Cap Value Fund* | $83 | 0.84% |
| * |
The expenses shown in the table are meant to highlight your ongoing costs only and do not reflect any fees and expenses that may be charged by the variable annuity contracts and variable life insurance policies (“Variable Contracts”) that invest in the Fund.
|
Management’s Discussion of Fund Performance
SUMMARY OF RESULTS
The Fund posted a return of -2.78% for the year ended May 31, 2025, compared to a return of 13.12% for the Russell 3000® Index (a broad-based securities market index) and -1.14% for the Russell 2000® Value Index (the "Performance Index"). Over the period, U.S. large-cap equities outperformed small-cap equities. Growth-oriented stocks outperformed value stocks across the market-cap spectrum.
The following is a summary of the top contributors and detractors that impacted the Fund's performance during the year relative to the Performance Index.
TOP PERFORMANCE CONTRIBUTORS
Allocations in the following sectors | health care; energy; materials
Security selection in the following sectors | financials; consumer discretionary; real estate
Position weightings | Rigetti Computing, Inc.; Pediatrix Medical Group, Inc.; Mueller Industries, Inc.
TOP PERFORMANCE DETRACTORS
Allocations in the following sectors | utilities; communication services; consumer staples
Security selection in the following sectors | communication services; materials; energy
Position weightings | Liberty Latin America, Ltd, Class A.; Lumen Technologies, Inc.; Tenaya Therapeutics, Inc.
Fund Performance
The following graph compares a $10,000 initial investment in the Fund to the index(es) listed below for the last 10 fiscal years of the Fund.
GROWTH OF $10,000
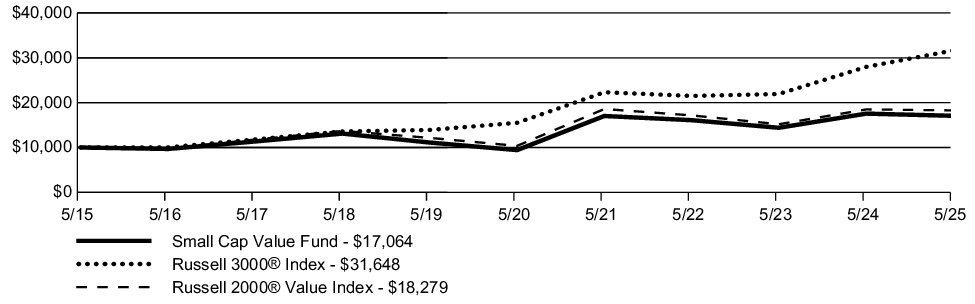
| AVERAGE ANNUAL TOTAL RETURN | 1 Year | 5 Year | 10 Year |
| Small Cap Value Fund | (2.78)% | 12.63% | 5.49% |
| Russell 3000® Index | 13.12% | 15.34% | 12.21% |
| Russell 2000® Value Index | (1.14)% | 12.03% | 6.22% |
Key Fund Statistics
The following table outlines key fund statistics.
| Net assets | $245M |
| Total number of portfolio holdings | 419 |
| Total net advisory fee paid | $2.3M |
| Portfolio turnover rate during the reporting period | 80% |
Graphical Representation of Holdings
The information below represents the composition of the Fund's net assets as of the end of the period.
Top Industries*
| Banks | 18.7% |
| REITS | 11.8% |
| Commercial Services | 5.2% |
| Diversified Financial Services | 4.1% |
| Insurance | 3.4% |
| Retail | 3.4% |
| Biotechnology | 3.1% |
| Electric | 3.0% |
| Oil & Gas | 2.9% |
| Electronics | 2.6% |
| Telecommunications | 2.2% |
| Transportation | 2.1% |
| Gas | 2.1% |
| Distribution/Wholesale | 2.1% |
| Home Builders | 2.0% |
Portfolio Composition
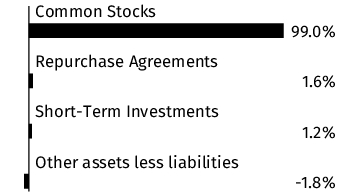
* Percentages exclude derivatives (other than purchased options), if any.
Material Fund Changes
There were no material fund changes during the period.
Changes in and Disagreements with Accountants
There were no disagreements with the accountants during the period.
This report describes changes to the Fund that occurred during the reporting period.
Fund Expenses
What were the Fund costs for the last year ?
(Based on a hypothetical $10,000 investment)
| Fund | Costs of a $10,000 investment | Costs paid as a percentage of a $10,000 investment |
| Small Cap Growth Fund* | $90 | 0.89% |
| * |
The expenses shown in the table are meant to highlight your ongoing costs only and do not reflect any fees and expenses that may be charged by the variable annuity contracts and variable life insurance policies (“Variable Contracts”) that invest in the Fund.
|
Management’s Discussion of Fund Performance
SUMMARY OF RESULTS
The Fund posted a return of 2.41% for the year ended May 31, 2025, compared to a return of 13.12% for the Russell 3000® Index (a broad-based securities market index) and 3.45% for the Russell 2000® Growth Index (the "Performance Index"). Over the period, U.S. large-cap equities outperformed small-cap equities. Growth stocks outperformed value in all market cap ranges.
The following is a summary of the top contributors and detractors that impacted the Fund's performance during the year relative to the Performance Index.
TOP PERFORMANCE CONTRIBUTORS
American Century Investment Management, Inc. - see Material Fund Changes for the time period covered | In aggregate: position weightings. Allocations in the following sectors: energy; cash; utilities. Security selection in the following sectors: health care; consumer discretionary; financials. Position weightings: Stride, Inc.; Alphatec Holdings, Inc.; Inari Medical, Inc.
J.P. Morgan Investment Management, Inc. - see Material Fund Changes for the time period covered | Allocations in the following sectors: materials; consumer discretionary; utilities. Security selection in the following sectors: energy; financials; materials. Position weightings: AAON, Inc.; Vaxcyte, Inc.; Life Time Group Holdings, Inc.
TOP PERFORMANCE DETRACTORS
American Century Investment Management, Inc. - see Material Fund Changes for the time period covered | Allocations in the following sectors: real estate; consumer staples; information technology. Security selection in the following sectors: energy; information technology; real estate. Position weightings: Kosmos Energy, Ltd.; lack of position in Hims & Hers Health, Inc.; Neogen Corp.
J.P. Morgan Investment Management, Inc. - see Material Fund Changes for the time period covered | In aggregate: position weightings. Allocations in the following sectors: financials; industrials; communication services. Security selection in the following sectors: health care; information technology; industrials. Position weightings: Allegro MicroSystems, Inc.; Six Flags Entertainment Corp.; e.l.f. Beauty, Inc.
Fund Performance
The following graph compares a $10,000 initial investment in the Fund to the index(es) listed below for the last 10 fiscal years of the Fund.
GROWTH OF $10,000
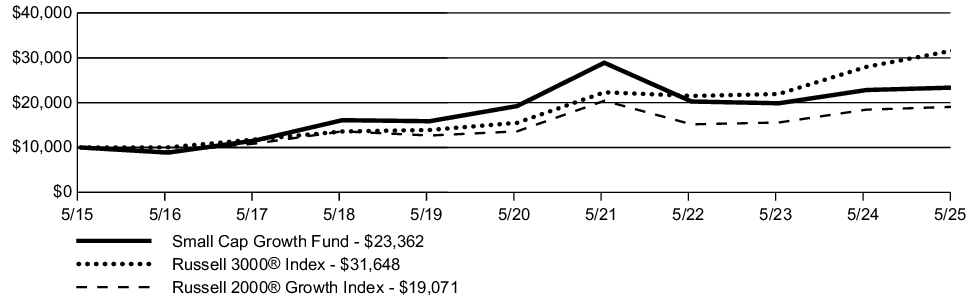
| AVERAGE ANNUAL TOTAL RETURN | 1 Year | 5 Year | 10 Year |
| Small Cap Growth Fund | 2.41% | 3.97% | 8.86% |
| Russell 3000® Index | 13.12% | 15.34% | 12.21% |
| Russell 2000® Growth Index | 3.45% | 7.00% | 6.67% |
Key Fund Statistics
The following table outlines key fund statistics.
| Net assets | $538M |
| Total number of portfolio holdings | 156 |
| Total net advisory fee paid | $4.0M |
| Portfolio turnover rate during the reporting period | 163% |
Graphical Representation of Holdings
The information below represents the composition of the Fund's net assets as of the end of the period.
Top Industries*
| Software | 8.7% |
| Biotechnology | 8.4% |
| Commercial Services | 6.6% |
| Retail | 5.8% |
| Healthcare-Services | 5.4% |
| Healthcare-Products | 5.0% |
| Building Materials | 4.6% |
| Insurance | 4.3% |
| Semiconductors | 4.0% |
| Short-Term Investments | 3.4% |
| Environmental Control | 3.0% |
| Leisure Time | 3.0% |
| Iron/Steel | 2.8% |
| Pharmaceuticals | 2.7% |
| Internet | 2.3% |
Portfolio Composition
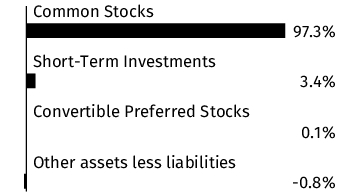
* Percentages exclude derivatives (other than purchased options), if any.
Material Fund Changes
This is a summary of certain changes to the Fund since the beginning of the period. Effective September 30, 2024, American Century Investment Management, Inc. (“ACIM”) was appointed as a subadviser to the Fund, replacing an existing subadvisor, J.P. Morgan Investment Management Inc. Additionally, changes to the Fund’s investment strategies and techniques were adjusted to match the investment processes and techniques used by ACIM. Additionally, effective September 30, 2024, the contractual advisory fee waiver was amended to lower the advisory fee rate payable by the Fund to VALIC to 0.80% of the Fund’s average daily net assets on the first $100 million, and 0.75% of the Fund’s average daily net assets over $100 million. For more comprehensive information, you may review the Fund’s next prospectus, which we expect to be available by September 30, 2025 at www.corebridgefinancial.com/rs/prospectus-and-reports/annuities#underlyingfunds or upon special request at 1-800-448-2542 or by sending an e-mail request to Forms.Request@valic.com.
Changes in and Disagreements with Accountants
There were no disagreements with the accountants during the period.
| [1] | The expenses shown in the table are meant to highlight your ongoing costs only and do not reflect any fees and expenses that may be charged by the variable annuity contracts and variable life insurance policies (“Variable Contracts”) that invest in the Fund. |
| [2] | The expenses shown in the table are meant to highlight your ongoing costs only and do not reflect any fees and expenses that may be charged by the variable annuity contracts and variable life insurance policies (“Variable Contracts”) that invest in the Fund. |
| [3] | The expenses shown in the table are meant to highlight your ongoing costs only and do not reflect any fees and expenses that may be charged by the variable annuity contracts and variable life insurance policies (“Variable Contracts”) that invest in the Fund. |
| [4] | The expenses shown in the table are meant to highlight your ongoing costs only and do not reflect any fees and expenses that may be charged by the variable annuity contracts and variable life insurance policies (“Variable Contracts”) that invest in the Fund. |
| [5] | The expenses shown in the table are meant to highlight your ongoing costs only and do not reflect any fees and expenses that may be charged by the variable annuity contracts and variable life insurance policies (“Variable Contracts”) that invest in the Fund. |
| [6] | The expenses shown in the table are meant to highlight your ongoing costs only and do not reflect any fees and expenses that may be charged by the variable annuity contracts and variable life insurance policies (“Variable Contracts”) that invest in the Fund. |
| [7] | The expenses shown in the table are meant to highlight your ongoing costs only and do not reflect any fees and expenses that may be charged by the variable annuity contracts and variable life insurance policies (“Variable Contracts”) that invest in the Fund. |
| [8] | The expenses shown in the table are meant to highlight your ongoing costs only and do not reflect any fees and expenses that may be charged by the variable annuity contracts and variable life insurance policies (“Variable Contracts”) that invest in the Fund. |
| [9] | The expenses shown in the table are meant to highlight your ongoing costs only and do not reflect any fees and expenses that may be charged by the variable annuity contracts and variable life insurance policies (“Variable Contracts”) that invest in the Fund. |
| [10] | The expenses shown in the table are meant to highlight your ongoing costs only and do not reflect any fees and expenses that may be charged by the variable annuity contracts and variable life insurance policies (“Variable Contracts”) that invest in the Fund. |
| [11] | The expenses shown in the table are meant to highlight your ongoing costs only and do not reflect any fees and expenses that may be charged by the variable annuity contracts and variable life insurance policies (“Variable Contracts”) that invest in the Fund. |
| [12] | The expenses shown in the table are meant to highlight your ongoing costs only and do not reflect any fees and expenses that may be charged by the variable annuity contracts and variable life insurance policies (“Variable Contracts”) that invest in the Fund. |
| [13] | The expenses shown in the table are meant to highlight your ongoing costs only and do not reflect any fees and expenses that may be charged by the variable annuity contracts and variable life insurance policies (“Variable Contracts”) that invest in the Fund. |
| [14] | The expenses shown in the table are meant to highlight your ongoing costs only and do not reflect any fees and expenses that may be charged by the variable annuity contracts and variable life insurance policies (“Variable Contracts”) that invest in the Fund. |
| [15] | The expenses shown in the table are meant to highlight your ongoing costs only and do not reflect any fees and expenses that may be charged by the variable annuity contracts and variable life insurance policies (“Variable Contracts”) that invest in the Fund. |
| [16] | The expenses shown in the table are meant to highlight your ongoing costs only and do not reflect any fees and expenses that may be charged by the variable annuity contracts and variable life insurance policies (“Variable Contracts”) that invest in the Fund. |
| [17] | The expenses shown in the table are meant to highlight your ongoing costs only and do not reflect any fees and expenses that may be charged by the variable annuity contracts and variable life insurance policies (“Variable Contracts”) that invest in the Fund. |
| [18] | The expenses shown in the table are meant to highlight your ongoing costs only and do not reflect any fees and expenses that may be charged by the variable annuity contracts and variable life insurance policies (“Variable Contracts”) that invest in the Fund. |
| [19] | The expenses shown in the table are meant to highlight your ongoing costs only and do not reflect any fees and expenses that may be charged by the variable annuity contracts and variable life insurance policies (“Variable Contracts”) that invest in the Fund. |
| [20] | The expenses shown in the table are meant to highlight your ongoing costs only and do not reflect any fees and expenses that may be charged by the variable annuity contracts and variable life insurance policies (“Variable Contracts”) that invest in the Fund. |
| [21] | The expenses shown in the table are meant to highlight your ongoing costs only and do not reflect any fees and expenses that may be charged by the variable annuity contracts and variable life insurance policies (“Variable Contracts”) that invest in the Fund. |
| [22] | The expenses shown in the table are meant to highlight your ongoing costs only and do not reflect any fees and expenses that may be charged by the variable annuity contracts and variable life insurance policies (“Variable Contracts”) that invest in the Fund. |
| [23] | The expenses shown in the table are meant to highlight your ongoing costs only and do not reflect any fees and expenses that may be charged by the variable annuity contracts and variable life insurance policies (“Variable Contracts”) that invest in the Fund. |
| [24] | The expenses shown in the table are meant to highlight your ongoing costs only and do not reflect any fees and expenses that may be charged by the variable annuity contracts and variable life insurance policies (“Variable Contracts”) that invest in the Fund. |
| [25] | The expenses shown in the table are meant to highlight your ongoing costs only and do not reflect any fees and expenses that may be charged by the variable annuity contracts and variable life insurance policies (“Variable Contracts”) that invest in the Fund. |
| [26] | The expenses shown in the table are meant to highlight your ongoing costs only and do not reflect any fees and expenses that may be charged by the variable annuity contracts and variable life insurance policies (“Variable Contracts”) that invest in the Fund. |
| [27] | The expenses shown in the table are meant to highlight your ongoing costs only and do not reflect any fees and expenses that may be charged by the variable annuity contracts and variable life insurance policies (“Variable Contracts”) that invest in the Fund. |
| [28] | The expenses shown in the table are meant to highlight your ongoing costs only and do not reflect any fees and expenses that may be charged by the variable annuity contracts and variable life insurance policies (“Variable Contracts”) that invest in the Fund. |
| [29] | The expenses shown in the table are meant to highlight your ongoing costs only and do not reflect any fees and expenses that may be charged by the variable annuity contracts and variable life insurance policies (“Variable Contracts”) that invest in the Fund. |
| [30] | The expenses shown in the table are meant to highlight your ongoing costs only and do not reflect any fees and expenses that may be charged by the variable annuity contracts and variable life insurance policies (“Variable Contracts”) that invest in the Fund. |
| [31] | The expenses shown in the table are meant to highlight your ongoing costs only and do not reflect any fees and expenses that may be charged by the variable annuity contracts and variable life insurance policies (“Variable Contracts”) that invest in the Fund. |
| [32] | The expenses shown in the table are meant to highlight your ongoing costs only and do not reflect any fees and expenses that may be charged by the variable annuity contracts and variable life insurance policies (“Variable Contracts”) that invest in the Fund. |
| [33] | The expenses shown in the table are meant to highlight your ongoing costs only and do not reflect any fees and expenses that may be charged by the variable annuity contracts and variable life insurance policies (“Variable Contracts”) that invest in the Fund. |
| [34] | The expenses shown in the table are meant to highlight your ongoing costs only and do not reflect any fees and expenses that may be charged by the variable annuity contracts and variable life insurance policies (“Variable Contracts”) that invest in the Fund. |
| [35] | The expenses shown in the table are meant to highlight your ongoing costs only and do not reflect any fees and expenses that may be charged by the variable annuity contracts and variable life insurance policies (“Variable Contracts”) that invest in the Fund. |
| [36] | The expenses shown in the table are meant to highlight your ongoing costs only and do not reflect any fees and expenses that may be charged by the variable annuity contracts and variable life insurance policies (“Variable Contracts”) that invest in the Fund. |