DECEMBER 2024 EUROPEAN INVESTMENT BANK GROUP RISK MANAGEMENT DISCLOSURE REPORT
DECEMBER 2024 EUROPEAN INVESTMENT BANK GROUP RISK MANAGEMENT DISCLOSURE REPORT
December 2024 European Investment Bank Group Risk Management Disclosure Report ©
European Investment Bank, 2025. All rights reserved. All questions on rights and licensing should be addressed to publications@eib.org. European Investment Bank 98 -100, boulevard Konrad Adenauer L-2950 Luxembourg For further information on the EIB’s
activities, please consult our website, www.eib.org. You can also contact our Info Desk, info@eib.org. Get our e-newsletter at www.eib.org/sign-up. For further information on the European Investment Fund’s activities, please consult our website,
www.eif.org. Disclaimer: The information presented in this report has not been subject to external audit. Published by the European Investment Bank. Printed on FSC®
Paper.

TABLE OF CONTENTS 1 INTRODUCTION 1 1.1 Executive summary 2 1.2 Key risk metrics 5 2 BASIS OF PREPARATION 9 2.1 Scope of consolidation 9 2.2 Reconciliation with
financial statements 9 2.3 Disclosure criteria 10 2.4 Frequency, extent and means of disclosures 12 2.5 Disclosure policy 13 2.6 Approval process 13 3 GOVERNANCE AND RISK MANAGEMENT 14 3.1 Risk management structure and organisation 14 3.2 Risk
management framework 16 3.3 Corporate governance 21 4 CAPITAL ADEQUACY AND RISK-WEIGHTED EXPOSURE AMOUNTS 25 4.1 Capital requirements 25 4.2 Own funds 30 5 CREDIT RISK 39 5.1 Internal framework for credit risk management 39 5.2 Credit risk
mitigation 52 5.3 Use of the standardised approach 53 5.4 Use of the Internal Ratings Based approach 56 5.5 Equity risk 80 6 COUNTERPARTY CREDIT RISK 82 7 SECURITISATION 90 8 LEVERAGE RATIO 99 9 LIQUIDITY RISK 104 9.1 Internal framework for
liquidity risk management 104 9.2 Internal Liquidity Adequacy Assessment Process (ILAAP) 106 9.3 Liquidity coverage ratio (LCR) 107

9.4 Net stable funding ratio (NSFR) 110 9.5 Asset encumbrance 113 10 MARKET RISK 115 10.1 Foreign exchange risk 115 11 INTEREST RATE AND CREDIT SPREAD RISK IN THE
BANKING BOOK 117 11.1 Interest rate risk in the banking book (IRRBB) 117 11.2 Credit spread risk in the banking book (CSRBB) 123 12 OPERATIONAL RISK 124 13 OTHER RISKS 136 13.1 Pension and health insurance risks 136 13.2 Reputational and strategic
risks 137 13.3 Environmental, social and governance risks 137 14 REMUNERATION 178 14.1 EIB Group annual self-assessment 178 14.2 EIB Group remuneration data 181 15 APPENDIX 185 15.1 Appendix I – Overview of the EIB Group 185 15.2 Appendix II –
Abbreviations 188 15.3 Appendix III – CRR Disclosure compliance reference 195 -
1 INTRODUCTION The EIB Group (the ‘EIBG’ or the ‘Group’’) does not fall within the scope of application of the European Union (EU)’s legislation applicable to credit
institutions, in particular the Capital Requirements Directive and Regulation (Directive 2013/36/EU or ‘CRD’, Regulation 575/2013 or ‘CRR’, as amended from time to time). The EIB, therefore, is not legally obliged to meet the requirements of the
above-mentioned Directive and Regulation. However, reflecting its statutory duty to conform with best banking practice (BBP), the EIB aims to apply both at individual and consolidated level relevant EU banking legislative acts and guidelines, to the
extent determined by its competent governing bodies and in line with the BBP Guiding Principles approved, as further described in Section 2.3 below. Following on from the above, the December 2024 EIB’s Group Risk Management Disclosure Report
(‘GRMDR’ or the ‘Report’) has been prepared in line with the prudential disclosure requirements as set out in Articles 431 to 455 of Part Eight of CRR seek to increase the efficiency of banks’ disclosures and reinforce market discipline through a
comprehensive framework with consistent and comparable Pillar III disclosures1 and the related technical standards, guidelines and opinions of the European Banking Authority (‘EBA’), deemed applicable to the EIB as BBP. These disclosure requirements
and the corresponding European Commission Implementing Regulation2 3. 1 Part Eight (Articles 431 to 455) of Regulation (EU) No 575/2013 of the European Parliament and of the Council, of 26 June 2013 (CRR), as subsequently amended, notably by
Regulation (EU) 2019/876 of the European Parliament and of the Council, of 20 May 2019. 2 (i) Commission Implementing Regulation 2021/637 of 15 March 2021 laying down implementing technical standards with regard to public disclosures by institutions
of the information referred to in Titles II and III of Part Eight of Regulation (EU) No 575/2013 of the European Parliament and of the Council and repealing Commission Implementing Regulation (EU) No 1423/2013, Commission Delegated Regulation (EU)
2015/1555, Commission Implementing Regulation (EU) 2016/200 and Commission Delegated Regulation (EU) 2017/2295 (based on EBA/ITS/2020/04), as amended by Commission Implementing Regulations (EU) 2021/1018 of 22 June 2021, (EU) 2022/631 of 13 April
2022, and (EU) 2022/2453 of 30 November 2022. (ii) Commission Implementing Regulation (EU) 2022/631 of 13 April 2022 amending the implementing technical standards laid down in the Implementing Regulation (EU) 2021/637 as regards the disclosure of
exposures to interest rate risk on positions not held in the trading book (based on EBA/ITS/2021/07); and (iii) Commission Implementing Regulation (EU) 2022/2453 of 30 November 2022 amending the implementing technical standards laid down in
Implementing Regulation (EU) 2021/637 as regards the disclosure of environmental, social and governance risks (based on EBA/ITS/2022/01), also jointly referred to in the current report as “EBA ITS”. 3 The disclosure report in the context of the
Basel Framework is also referred to as “Pillar III”, representing the third Basel pillar based on market discipline. Further, in this edition of the Report, disclosures reflect the non-applicability as BBP or non-availability of certain templates,
as described in Section 2.3 below. Accordingly, the EIB Group’s disclosures are not fully comparable with those published by EU credit institutions, financial holding companies and mixed financial holding companies, directly within the subjective
scope of CRD/CRR, owing that to the EIB’s status as an EU body pursuant to the Treaty on the Functioning of the European Union. The EIBG consists of the European Investment Bank (the ‘EIB’ or the ‘Bank’) and the European Investment Fund (the ‘EIF’
or the ‘Fund’). For a more detailed overview of the Group entities please refer to Section 15. Appendix (Appendix I – Overview of the EIB Group). The information provided in this report is unaudited. Due to rounding, numbers presented throughout
this document may not add up precisely to the totals provided and percentages may not precisely reflect the absolute figures. For the purpose of the certifications foreseen in Articles 435(1)(e) and 431(3) of the CRR, applicable to the EIB on an
individual and consolidated basis as BBP, the EIB President confirms that the EIB’s risk management systems are adequate with regard to the institution's profile and strategy and that the disclosures in this report have been prepared in accordance
with the EIB’s policies, internal processes, systems and controls.
The format and headings of most of the quantitative disclosures presented in this report are consistent with the relevant European Commission Implementing Regulation
as referred to in this report with some adaptations on the basis of the BBP Guiding Principles, to reflect compatibility with the EIB’s statutory framework. Reference to the respective regulatory templates is provided in the disclosure’s respective
headings. 1.1 Executive summary Business strategy and overall risk profile The 2024-2027 Strategic Roadmap outlines the eight key priorities and programmes that contribute in closing Europe’s investment gap. The Strategic Roadmap allows the EIB
Group to maintain its very high policy relevance. In order for the EIB to keep a strong capital position, the roadmap foresees the maintenance of an appropriate volume of mandates and guarantees from the EU budget. Financing amounts and programming
of the Group’s activities, including the business mix and the level of higher- risk activities, are subject to the annual Group operational planning process. The EIB Group Operational Plan 2025-2027 (“Group Operational Plan”) defines business
targets for 2025 and orientations for 2026 and 2027. It summarises the key priorities and activities to deliver the EIB Group’s strategy for the next three years. It also proposes financing targets using the EIB Group's own and third-party
resources. The approach to determining annual operational targets and orientations takes into account the Group’s objective of maintaining a robust credit standing, the long-term nature of its lending business and the granularity of its portfolio.
The Strategic Roadmap sets a clear focus for the Group’s priorities until 2027. To implement these, the EIB Group’s public policy goals (PPG) framework, including two transversal objectives and four primary goals, continues to serve as a core
planning and eligibility tool for the Group Operational Plan. In March 2025, the EIB Board of Directors approved the creation of an additional horizontal PPG for Security and Defence. The EIB Group remains very vigilant to ensure that activity levels
are both financially sustainable and aligned with the Group’s business model. The Group Operational Plan is deemed financially sustainable over the long term. The EIB Group manages credit, market and liquidity risk in line with its risk appetite and
public mission. By pursuing a prudent financial policy, the Bank seeks to generate financial resources organically to support its growth in the long term. The risk appetite is the level of risk that the Group is willing and, in line with the EIB
statutory framework, able to incur in pursuing its activities in the context of its public mission and objectives. Key to this is the Group’s capacity to provide attractive long-term financing to serve EU objectives across all EU Member States (and
beyond in partner countries). A primary pillar of the Group’s business model is the Bank’s high credit standing and its status as prime issuer in the capital markets underpinned by the long-term AAA issuer rating from the major credit rating
agencies. The Group’s risk appetite, as well as the processes and activities performed by the Group to manage its risk appetite, are formalised in the Group Risk Appetite Framework (‘RAF’) approved by the Board of Directors (BoD). The Group RAF
covers the major financial risks and non-financial risks categories. It helps to embed a healthy organisational risk culture within the Group through the implementation and monitoring of measurable risk appetite metrics, which are subject to risk
limits and (where applicable) cascaded further down within the Group entities. Short and longer-term capital needs of the Group are closely monitored. The EIB Group’s capital position is projected to remain solid over the planning horizon.
The EIB Group Risk Appetite Statement 2024 as included in Section 3.2., together with the Group RAF Policy 2024, were approved by the EIB Board of Directors on 20 June
2024. For a full overview of the key business developments of the Bank’s and the Fund’s activities over the last financial year, please refer to, respectively, the Overview of the EIB Financial Report and the EIF’s Annual Report. For a full overview
on financial and business planning of the EIB Group, please refer to the latest EIB Group Operational Plan, available on the EIB website. EIB Global The EIB’s development finance role has moved forward and intensified in recent years through the
establishment of EIB Global whose goal is to increase the impact of the EIB’s activities outside the European Union aligned with the European Union’s priorities. EIB Global is an internal organisational unit within the EIB, operating under the
Bank’s legal framework. It brings together EIB development staff under a dedicated management team. EIB Global has a specific capital allocation provided annually by the EIB Board of Directors under the Group Operational Plan, and benefits from a
dedicated Board Advisory Group involving European development stakeholders. It has flexibility to establish its own policies and strategies and develop its own products. EIB Global nonetheless operates fully within EIB Group-wide policies on areas
such as risk management, as determined by the EIB Board of Directors. As part of its operating model, EIB Global maintains a strong local presence on the ground through a network of external representations located in partner countries where local
presence has the greatest impact by bringing the Bank closer to its clients. Most of EIB Global’s outstanding portfolio is covered by guarantees from the European Union in the form of either comprehensive guarantees, political risk guarantees or
other guarantees from the EU Member States. Under the current EU long-term budget (Multiannual Financial Framework), EIB Global’s business implementation relies on a mix of EU guarantees under NDICI-Global Europe and third-party funds, allowing to
de-risk the EIB portfolio. These guarantees are complemented by lending from EIB Global’s own risk facilities. EIB support for Ukraine Since 2014, the Bank has stopped its lending activities in Russia, consistent with the overall objectives of EU
common foreign and security policy, including applicable sanctions. Moreover, the Bank has compliance controls and procedures in place, including a dedicated Sanctions Compliance Programme, aiming to ensure that its activities, including those that
may involve Russia, comply with all applicable sanctions. Since the start of Russia’s invasion in 2022 and with the support of the European Commission, the EIB has provided EUR 2 billion in emergency relief and project support to Ukraine. In 2024,
the EIB Group was selected as one of the main implementing partners of the Ukraine Investment Framework (part of the EU’s Ukraine Facility), comprising guarantees and grants for European and other development finance institutions. At least EUR 2
billion in guarantees for public sector operations are foreseen to be allocated to the EIB, with first signatures expected to take place in 2025. Additional funding for existing programmes in support of SMEs in Ukraine have been awarded to the EIB
Group. In 2024, the EU for Ukraine (EU4U) Initiative, approved by the EIB’s Board of Directors in 2023, was implemented. This included the setting-up of the EU4U Fund, a trust fund providing guarantees for EIB Global lending, impact finance
investments and grants (such as investment grants or interest rate subsidies) with additional operations signed and approved during 2024.
At the same time, the EIB set up the EU4U Advisory Programme, a EUR 100 million technical assistance package from the EIB’s own resources to support Ukraine and
Moldova. The EU4U Fund will enable continued lending to Ukraine and will serve as a temporary bridge solution until longer-term EU measures become available. In 2024 the EU4U Advisory Programme approved and allocated EUR 41 million for technical
assistance. The EIB remains committed to supporting the recovery and reconstruction of Ukraine by financing new critical economic and social infrastructure as needed, as soon as conditions permit it. As detailed in the Overview of the EIB Financial
Report, the EIB’s disbursed exposure in Ukraine is predominantly covered by EU Comprehensive Guarantees and EU Political Risk Guarantees under the EU External Lending Mandate. A summary of the EIB’s exposure in Russia, Belarus, Israel and Palestine4
is provided in the Overview of the EIB Financial Report 2024. 4 This designation shall not be construed as recognition of a State of Palestine and is without prejudice to the individual positions of the Member States on this issue. Quality of the
EIB loan portfolio The overall asset quality of the EIB’s loan portfolio is deemed stable in 2024. Preserving the quality of the Bank’s loan portfolio is enabled mainly by a comprehensive due diligence process, adequate lending structures and
security, and standard protective clauses included in loan agreements. In addition, the Bank has established a loan portfolio monitoring framework allowing for timely risk management decisions. Credit enhancements are largely in the form of
portfolio guarantees from EU sovereigns, the EU budget, investment-grade banks and corporates and high-quality financial collateral and assignments of rights or pledges at transaction level. Climate and sustainability In 2020, the EIB Group
developed the EIB Group Climate Bank Roadmap (CBR) 2021-2025 to put its new climate, environmental and social goals into action. Under the CBR, the EIB Group aims to build on its past successes and solidify its role as the climate bank, in alignment
with the Strategic Roadmap which sets a clear focus for the Groups priorities until 2027. It contains three commitments: (i) aligning all new operations with the principles and goals of the Paris Agreement for addressing climate change, (ii)
gradually increasing EIB annual financing dedicated to climate action and environmental sustainability to exceed 50% of total financing by 2025 and beyond, and (iii) supporting EUR 1 trillion of investment in climate action and environmental
sustainability from 2021-2030. The Strategic Roadmap published in 2024 recognises supporting climate action as the top strategic priority of our time and in addition to the EIB’s support for REPowerEU+, identifies two new flagship programmes: a
water programme in support of the blue economy and an energy efficiency programme for small and medium-sized enterprises (SMEs). The EIBG upholds transparency and accountability by proactively publishing information about its projects and
activities, engaging regularly with a broad spectrum of stakeholders and providing diverse reporting on its climate implementation on the EIB website. The EIB Group also reports annually on progress in implementing its 2021- 2025 Climate Bank
Roadmap. All reports are available on a dedicated page on the Bank’s website. Additional information on the EIB Group’s climate and sustainability actions may be found in section 13.3 of this report.
Group Operational Plan The 2025-2027 Group Operational Plan was approved by the EIB’s BoD in December 2024 in line with the Statutes and Rules of Procedures of the
Bank. It summarises the major financing activities to deliver the Group’s Strategic Roadmap for the period. The financing programme for the EIB Group activities of the EIB and the EIF has been defined to optimise additionality and impact whilst
ensuring the Group maintains an extremely solid financial performance with strong profitability and long-term sustainability. To maximise its impact in mobilising private investment and addressing market failures, the EIB Group will continue to
increase its risk appetite, while maintaining its very strong financing capacity. Adequate provision and efficient use of mandates and guarantees is indispensable to ensure the maintenance of current investment volumes and higher risk-taking, while
safeguarding the EIB’s top credit rating. This overall increase in risk-taking ambition will also reinforce support for the innovation, digital and human capital PPGs in the coming years. These smaller high-risk projects, which are also important
considering the tightening financing conditions for young and innovative firms, require significant additional origination and delivery efforts but are expected to be highly impactful. Further details on the Group Operational Plan approved are
available on the EIB website. EIB’s and EIF’s credit ratings The Bank’s high credit rating is a core feature of the business model and facilitates broad and deep investor support, even in times of turbulence. The EIB retains a ‘AAA’ rating with a
‘Stable’ outlook from the three major credit rating agencies (Fitch, Moody’s and S&P). The rating continues to be supported by the Bank’s central EU policy role, the high credit quality of the loan portfolio, robust liquidity, access to European
Central Bank refinancing facilities and strong risk management framework. The EIF’s AAA rating and stable outlook were also affirmed by the three major credit rating agencies. The agencies recognise the EIF’s exceptional capitalisation, robust
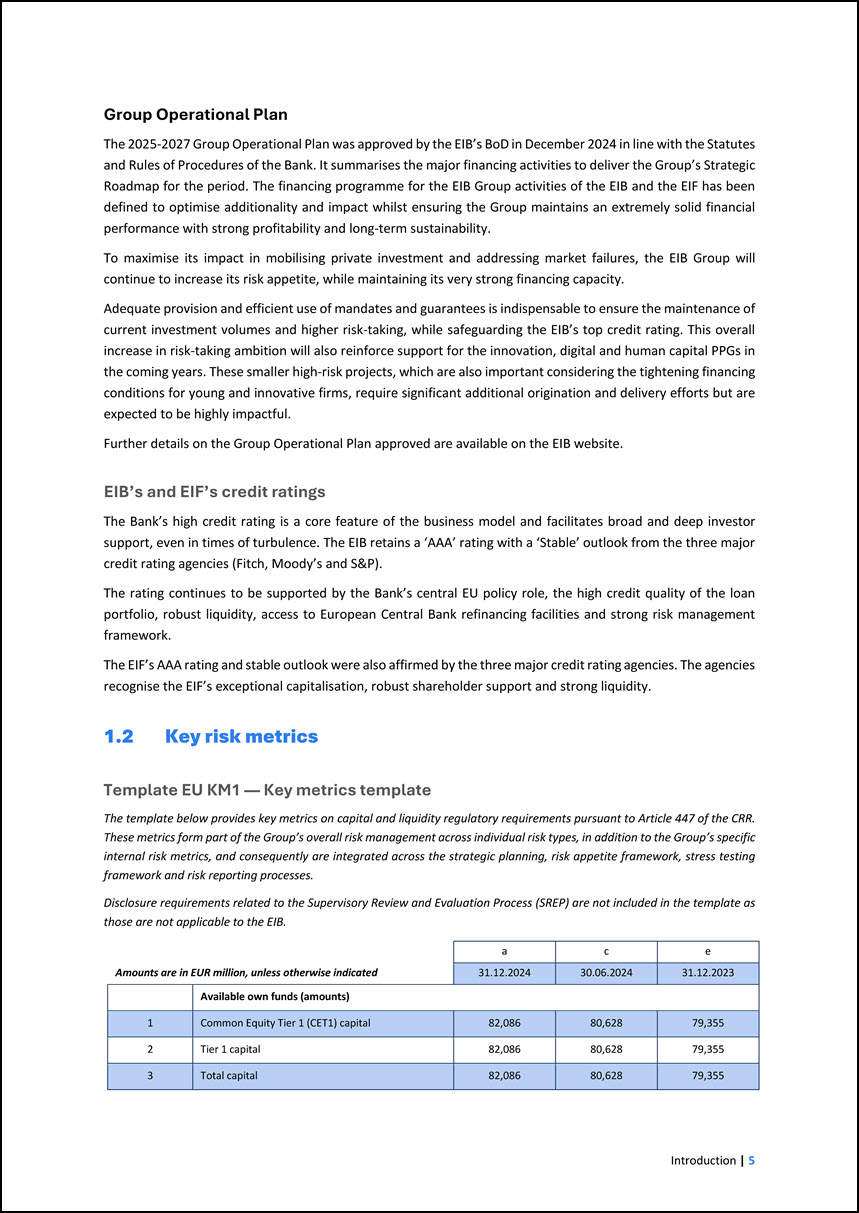
shareholder support and strong liquidity. 1.2 Key risk metrics Template EU KM1 — Key metrics template The template below provides key metrics on capital and liquidity regulatory requirements pursuant to Article 447 of the CRR. These metrics form
part of the Group’s overall risk management across individual risk types, in addition to the Group’s specific internal risk metrics, and consequently are integrated across the strategic planning, risk appetite framework, stress testing framework and
risk reporting processes. Disclosure requirements related to the Supervisory Review and Evaluation Process (SREP) are not included in the template as those are not applicable to the EIB. Amounts are in EUR million, unless otherwise indicated a c
e 31.12.2024 30.06.2024 31.12.2023 Available own funds (amounts) 1 Common Equity Tier 1 (CET1) capital 82,086 80,628 79,355 2 Tier 1 capital 82,086 80,628 79,355 3 Total capital 82,086 80,628 79,355
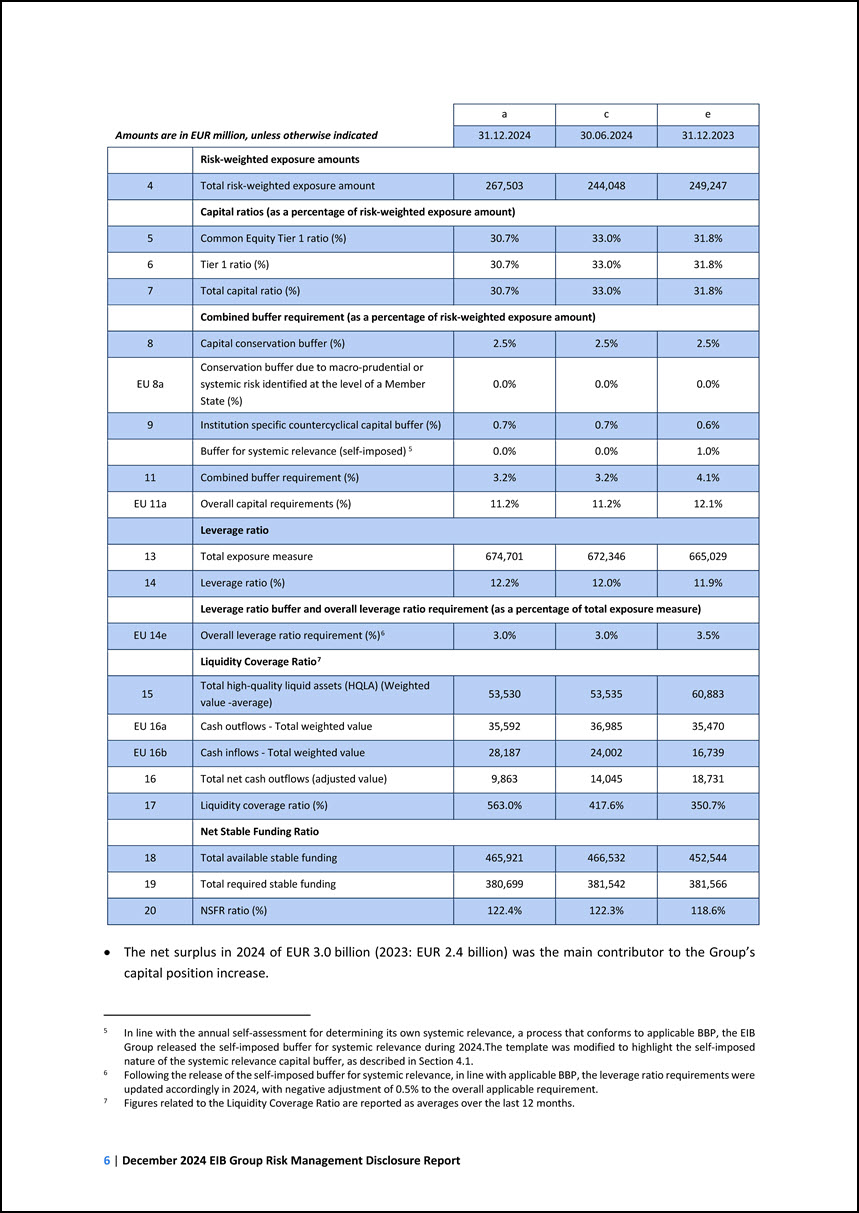
Amounts are in EUR million, unless otherwise indicated a c e 31.12.2024 30.06.2024 31.12.2023 Risk-weighted exposure amounts 4 Total risk-weighted exposure
amount 267,503 244,048 249,247 Capital ratios (as a percentage of risk-weighted exposure amount) 5 Common Equity Tier 1 ratio (%) 30.7% 33.0% 31.8% 6 Tier 1 ratio (%) 30.7% 33.0% 31.8% 7 Total capital ratio (%) 30.7% 33.0% 31.8%
Combined buffer requirement (as a percentage of risk-weighted exposure amount) 8 Capital conservation buffer (%) 2.5% 2.5% 2.5% EU 8a Conservation buffer due to macro-prudential or systemic risk identified at the level of a Member State (%)
0.0% 0.0% 0.0% 9 Institution specific countercyclical capital buffer (%) 0.7% 0.7% 0.6% Buffer for systemic relevance (self-imposed) 5 0.0% 0.0% 1.0% 11 Combined buffer requirement (%) 3.2% 3.2% 4.1% EU 11a Overall capital
requirements (%) 11.2% 11.2% 12.1% Leverage ratio 13 Total exposure measure 674,701 672,346 665,029 14 Leverage ratio (%) 12.2% 12.0% 11.9% Leverage ratio buffer and overall leverage ratio requirement (as a percentage of total
exposure measure) EU 14e Overall leverage ratio requirement (%)6 3.0% 3.0% 3.5% Liquidity Coverage Ratio7 15 Total high-quality liquid assets (HQLA) (Weighted value -average) 53,530 53,535 60,883 EU 16a Cash outflows - Total weighted
value 35,592 36,985 35,470 EU 16b Cash inflows - Total weighted value 28,187 24,002 16,739 16 Total net cash outflows (adjusted value) 9,863 14,045 18,731 17 Liquidity coverage ratio (%) 563.0% 417.6% 350.7% Net Stable Funding
Ratio 18 Total available stable funding 465,921 466,532 452,544 19 Total required stable funding 380,699 381,542 381,566 20 NSFR ratio (%) 122.4% 122.3% 118.6% 5 In line with the annual self-assessment for determining its own
systemic relevance, a process that conforms to applicable BBP, the EIB Group released the self-imposed buffer for systemic relevance during 2024.The template was modified to highlight the self-imposed nature of the systemic relevance capital buffer,
as described in Section 4.1. 6 Following the release of the self-imposed buffer for systemic relevance, in line with applicable BBP, the leverage ratio requirements were updated accordingly in 2024, with negative adjustment of 0.5% to the overall
applicable requirement. 7 Figures related to the Liquidity Coverage Ratio are reported as averages over the last 12 months. • The net surplus in 2024 of EUR 3.0 billion (2023: EUR 2.4 billion) was the main contributor to the Group’s capital
position increase.
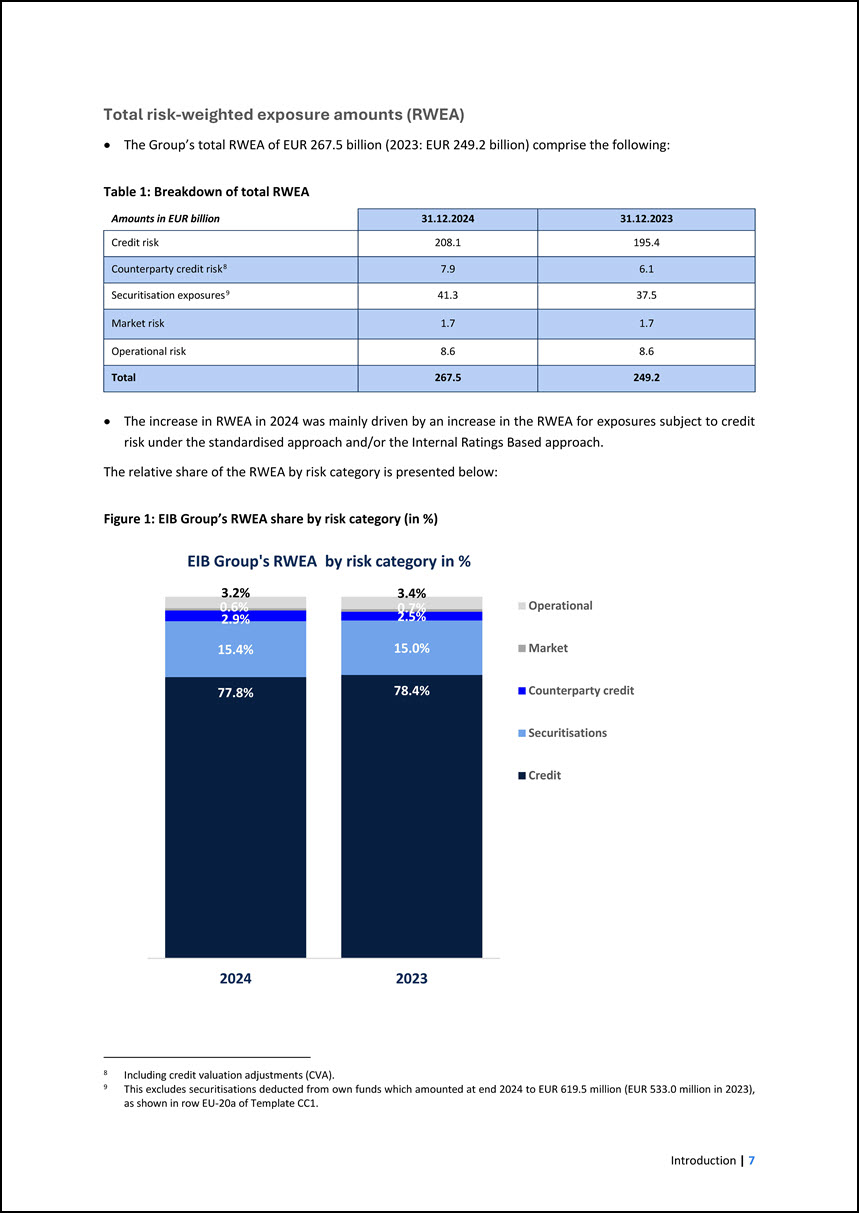
0.6% 2.9% 15.4% 0.7%2.5% 15.0% 78.4%77.8% Total risk-weighted exposure amounts (RWEA) •The Group’s total RWEA of EUR267.5billion(2023: EUR 249.2billion) comprise the
following: Table1: Breakdown oftotalRWEA Amounts in EUR billion31.12.202431.12.2023Credit risk208.1195.4Counterparty credit risk87.96.1Securitisation exposures941.337.5Market risk1.71.7Operationalrisk8.68.6Total267.5249.2 •Theincrease inRWEAin2024
wasmainly driven byanincrease in the RWEA forexposures subject tocreditriskunder the standardised approach and/orthe Internal Ratings Basedapproach. The relative share of the RWEAby risk categoryispresented below: Figure1: EIB Group’s RWEA share by
risk category (in %) EIB Group'sRWEAbyriskcategoryin % 3.2%3.4% OperationalMarketCounterparty creditSecuritisationsCredit 20242023 8Including credit valuation adjustments (CVA). 9This excludes securitisations deducted from own funds which amounted at
end 2024toEUR 619.5million(EUR 533.0millionin 2023), as shown in row EU-20a ofTemplate CC1. Introduction| 7
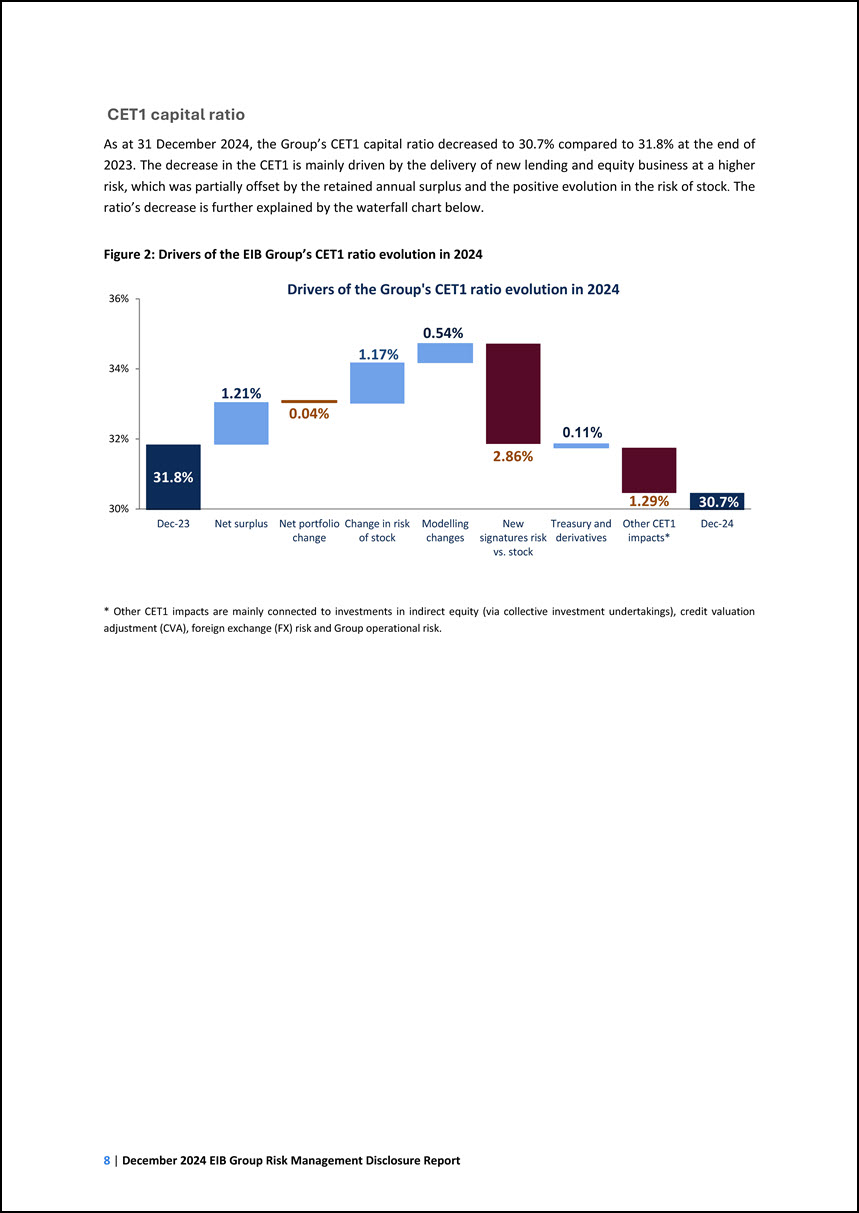
CET1 capital ratio As at 31 December2024, the Group’s CET1 capitalratio decreasedto 30.7%compared to 31.8%at the endof 2023. The decrease in the CET1 ismainly driven
by the delivery ofnew lending and equity business at a higherrisk,which was partiallyoffsetby the retained annual surplusand the positive evolution in the risk of stock.Theratio’sdecreaseisfurtherexplainedbythewaterfallchartbelow. Figure2: Drivers of
the EIB Group’s CET1 ratio evolution in2024 Driversof the Group's CET1 ratioevolutionin 2024 36% 0.54% 1.17% 34% 1.21% 0.04% 0.11% 32% 31.8% 2.86% 1.29% 30% 30.7% Dec-23Net surplusNet portfolioChange in riskModellingNewTreasury andOther
CET1Dec-24changeof stockchangessignatures riskderivativesimpacts* vs. stock * Other CET1 impactsare mainly connected to investments in indirect equity(viacollective investment undertakings), credit valuationadjustment (CVA),foreign exchange (FX)risk
and Groupoperational risk. 8|December 2024 EIB GroupRisk Management DisclosureReport
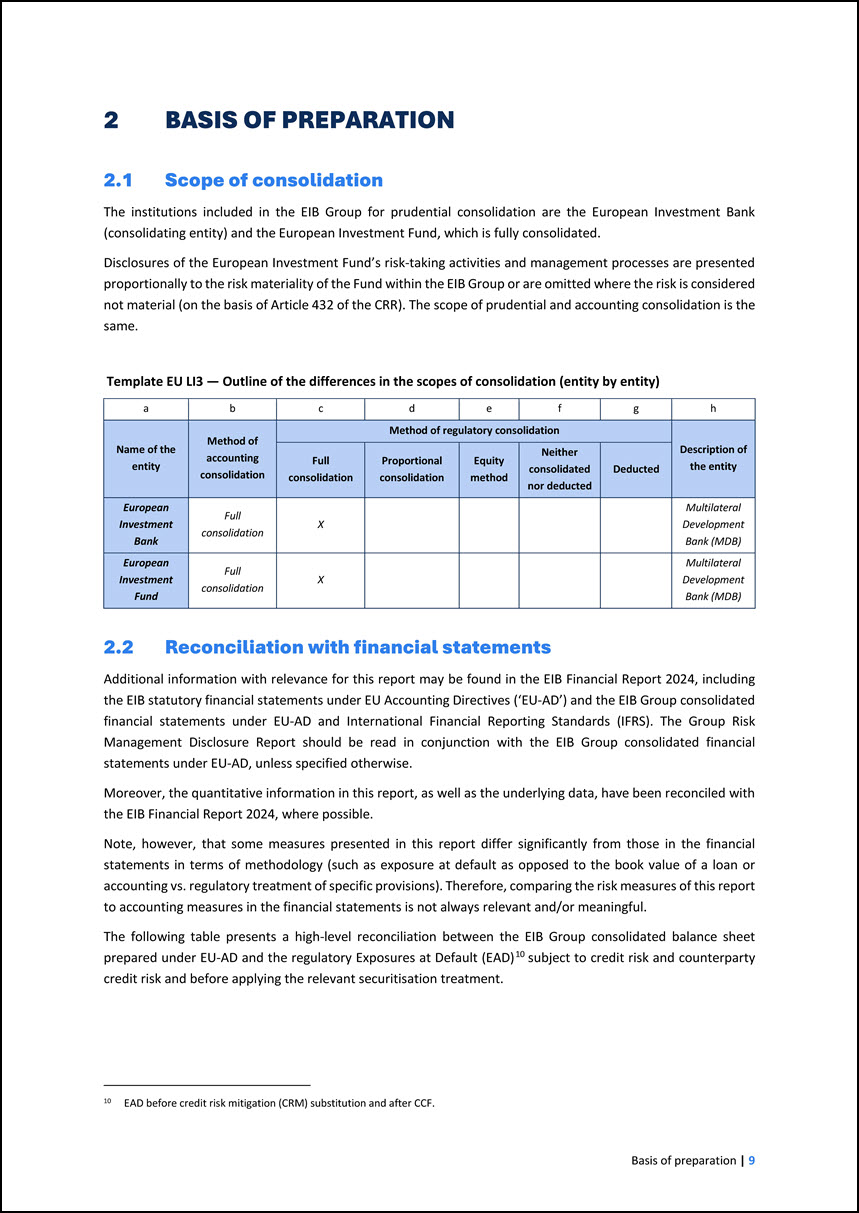
2 BASIS OF PREPARATION 2.1 Scope of consolidation The institutions included in the EIB Group for prudential consolidation are the European Investment Bank
(consolidating entity) and the European Investment Fund, which is fully consolidated. Disclosures of the European Investment Fund’s risk-taking activities and management processes are presented proportionally to the risk materiality of the Fund
within the EIB Group or are omitted where the risk is considered not material (on the basis of Article 432 of the CRR). The scope of prudential and accounting consolidation is the same. Template EU LI3 — Outline of the differences in the scopes of
consolidation (entity by entity) a b c d e f g h Name of the entity Method of accounting consolidation Method of regulatory consolidation Description of the entity Full consolidation Proportional consolidation Equity method Neither
consolidated nor deducted Deducted European Investment Bank Full consolidation X Multilateral Development Bank (MDB) European Investment Fund Full consolidation X Multilateral Development Bank (MDB) 2.2 Reconciliation with
financial statements Additional information with relevance for this report may be found in the EIB Financial Report 2024, including the EIB statutory financial statements under EU Accounting Directives (‘EU-AD’) and the EIB Group consolidated
financial statements under EU-AD and International Financial Reporting Standards (IFRS). The Group Risk Management Disclosure Report should be read in conjunction with the EIB Group consolidated financial statements under EU-AD, unless specified
otherwise. Moreover, the quantitative information in this report, as well as the underlying data, have been reconciled with the EIB Financial Report 2024, where possible. Note, however, that some measures presented in this report differ
significantly from those in the financial statements in terms of methodology (such as exposure at default as opposed to the book value of a loan or accounting vs. regulatory treatment of specific provisions). Therefore, comparing the risk measures of
this report to accounting measures in the financial statements is not always relevant and/or meaningful. The following table presents a high-level reconciliation between the EIB Group consolidated balance sheet prepared under EU-AD and the
regulatory Exposures at Default (EAD)10 subject to credit risk and counterparty credit risk and before applying the relevant securitisation treatment. 10 EAD before credit risk mitigation (CRM) substitution and after CCF.
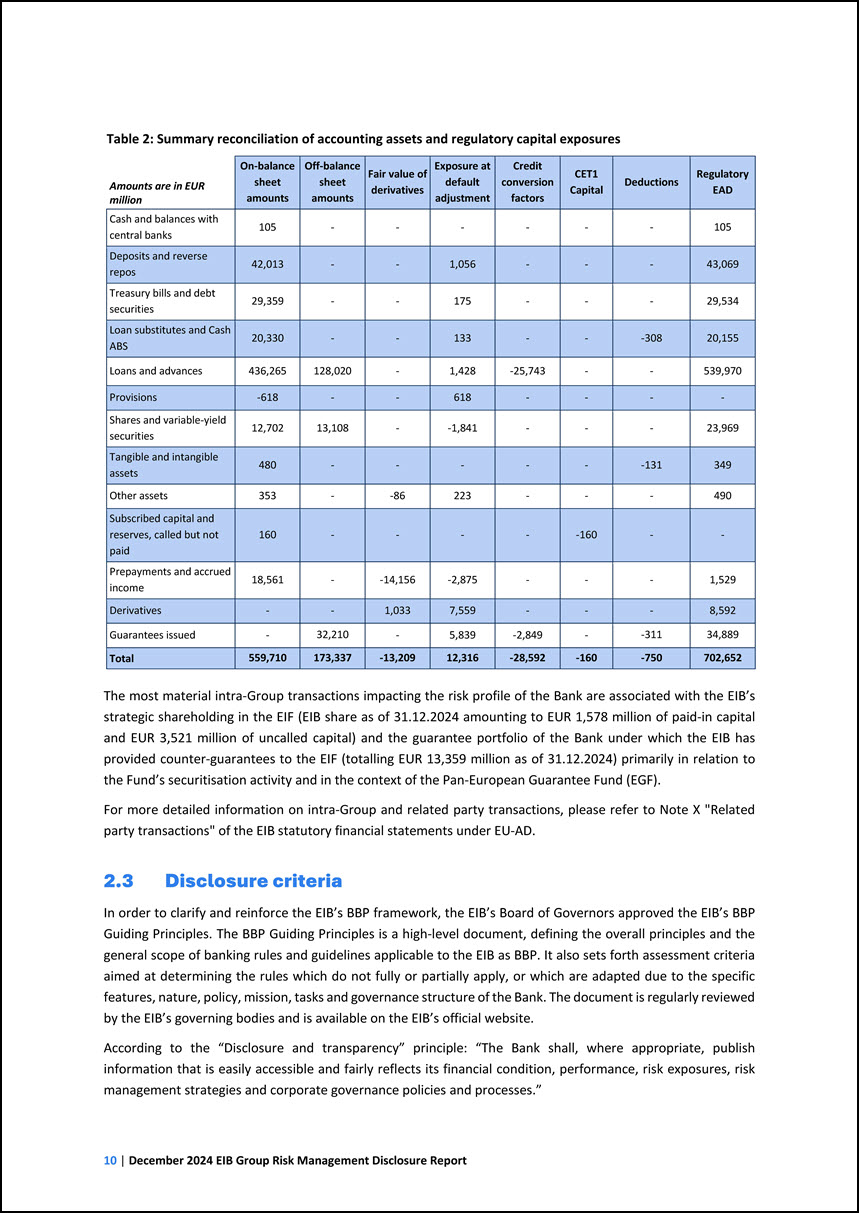
Table 2: Summary reconciliation of accounting assets and regulatory capital exposures Amounts are in EUR million On-balance sheet amounts Off-balance sheet amounts
Fair value of derivatives Exposure at default adjustment Credit conversion factors CET1 Capital Deductions Regulatory EAD Cash and balances with central banks 105 - - - - - - 105 Deposits and reverse repos 42,013 - - 1,056 - -
- 43,069 Treasury bills and debt securities 29,359 - - 175 - - - 29,534 Loan substitutes and Cash ABS 20,330 - - 133 - - -308 20,155 Loans and advances 436,265 128,020 - 1,428 -25,743 - - 539,970 Provisions -618 - -
618 - - - - Shares and variable-yield securities 12,702 13,108 - -1,841 - - - 23,969 Tangible and intangible assets 480 - - - - - -131 349 Other assets 353 - -86 223 - - - 490 Subscribed capital and reserves, called
but not paid 160 - - - - -160 - - Prepayments and accrued income 18,561 - -14,156 -2,875 - - - 1,529 Derivatives - - 1,033 7,559 - - - 8,592 Guarantees issued - 32,210 - 5,839 -2,849 - -311 34,889 Total 559,710
173,337 -13,209 12,316 -28,592 -160 -750 702,652 The most material intra-Group transactions impacting the risk profile of the Bank are associated with the EIB’s strategic shareholding in the EIF (EIB share as of 31.12.2024 amounting to EUR
1,578 million of paid-in capital and EUR 3,521 million of uncalled capital) and the guarantee portfolio of the Bank under which the EIB has provided counter-guarantees to the EIF (totalling EUR 13,359 million as of 31.12.2024) primarily in relation
to the Fund’s securitisation activity and in the context of the Pan-European Guarantee Fund (EGF). For more detailed information on intra-Group and related party transactions, please refer to Note X "Related party transactions" of the EIB statutory
financial statements under EU-AD. 2.3 Disclosure criteria In order to clarify and reinforce the EIB’s BBP framework, the EIB’s Board of Governors approved the EIB’s BBP Guiding Principles. The BBP Guiding Principles is a high-level document,
defining the overall principles and the general scope of banking rules and guidelines applicable to the EIB as BBP. It also sets forth assessment criteria aimed at determining the rules which do not fully or partially apply, or which are adapted due
to the specific features, nature, policy, mission, tasks and governance structure of the Bank. The document is regularly reviewed by the EIB’s governing bodies and is available on the EIB’s official website. According to the “Disclosure and
transparency” principle: “The Bank shall, where appropriate, publish information that is easily accessible and fairly reflects its financial condition, performance, risk exposures, risk management strategies and corporate governance policies and
processes.”
In applying the BBP Guiding Principles, the Bank shall implement and follow EU legislative acts and guidelines applicable for commercial banks except for those rules,
or parts of them, which are adapted or which the Bank does not fully or partially apply, based on the internal assessment mentioned above. The Bank may also determine the implementation date from which it shall follow such rules. When the Bank
follows adapted rules or does not apply certain provisions, where appropriate, mitigating measures in line with the Bank’s public policy nature and mission are enacted. Adaptations and exemptions follow a strict internal assessment procedure and are
approved by the EIB’s BoD, following consultation with the EIB’s Audit Committee. The EIB shall apply the BBP Guiding Principles on an individual basis. In addition, the EIB, as a majority shareholder of the EIF and within the powers provided to the
majority shareholder by the EIF statutory framework, shall: • seek to ensure that certain quantitative prudential requirements are met on a consolidated basis; • seek to ensure that the EIF implements sound internal policies, procedures and
practices required for compliance with certain qualitative prudential and non-prudential requirements on a consolidated basis consistently and in an adequately integrated manner with the EIB. Disclosures with regard to the EIB’s fully consolidated
subsidiary, the EIF, are subject to the proportionality of the EIF’s risk in the context of the Group and may be omitted on the grounds of immateriality, as appropriate. The EIB Group has not identified information to be omitted for proprietary or
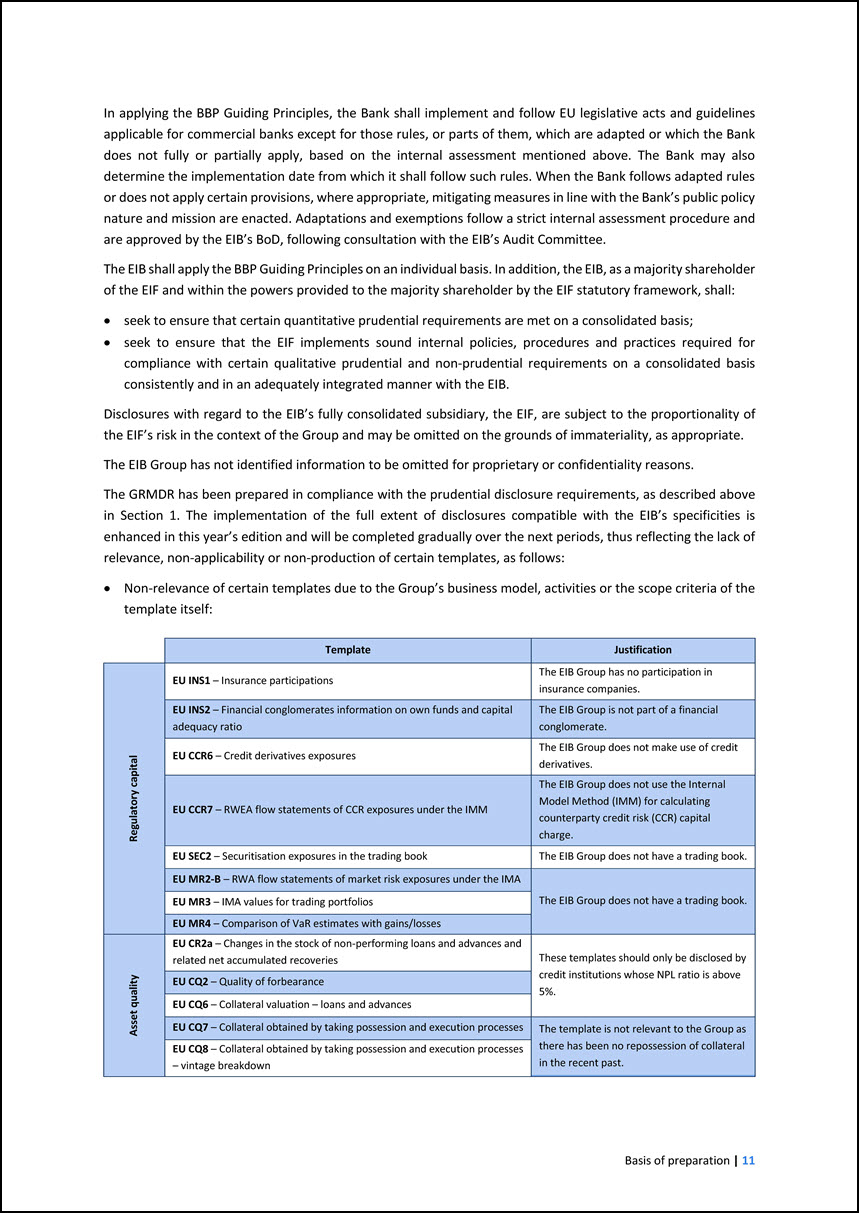
confidentiality reasons. The GRMDR has been prepared in compliance with the prudential disclosure requirements, as described above in Section 1. The implementation of the full extent of disclosures compatible with the EIB’s specificities is enhanced
in this year’s edition and will be completed gradually over the next periods, thus reflecting the lack of relevance, non-applicability or non-production of certain templates, as follows: • Non-relevance of certain templates due to the Group’s
business model, activities or the scope criteria of the template itself: Template Justification Regulatory capital EU INS1 – Insurance participations The EIB Group has no participation in insurance companies. EU INS2 – Financial conglomerates
information on own funds and capital adequacy ratio The EIB Group is not part of a financial conglomerate. EU CCR6 – Credit derivatives exposures The EIB Group does not make use of credit derivatives. EU CCR7 – RWEA flow statements of CCR
exposures under the IMM The EIB Group does not use the Internal Model Method (IMM) for calculating counterparty credit risk (CCR) capital charge. EU SEC2 – Securitisation exposures in the trading book The EIB Group does not have a trading book.
EU MR2-B – RWA flow statements of market risk exposures under the IMA The EIB Group does not have a trading book. EU MR3 – IMA values for trading portfolios EU MR4 – Comparison of VaR estimates with gains/losses Asset quality EU CR2a – Changes
in the stock of non-performing loans and advances and related net accumulated recoveries These templates should only be disclosed by credit institutions whose NPL ratio is above 5%. EU CQ2 – Quality of forbearance EU CQ6 – Collateral valuation –
loans and advances EU CQ7 – Collateral obtained by taking possession and execution processes The template is not relevant to the Group as there has been no repossession of collateral in the recent past. EU CQ8 – Collateral obtained by taking
possession and execution processes – vintage breakdown
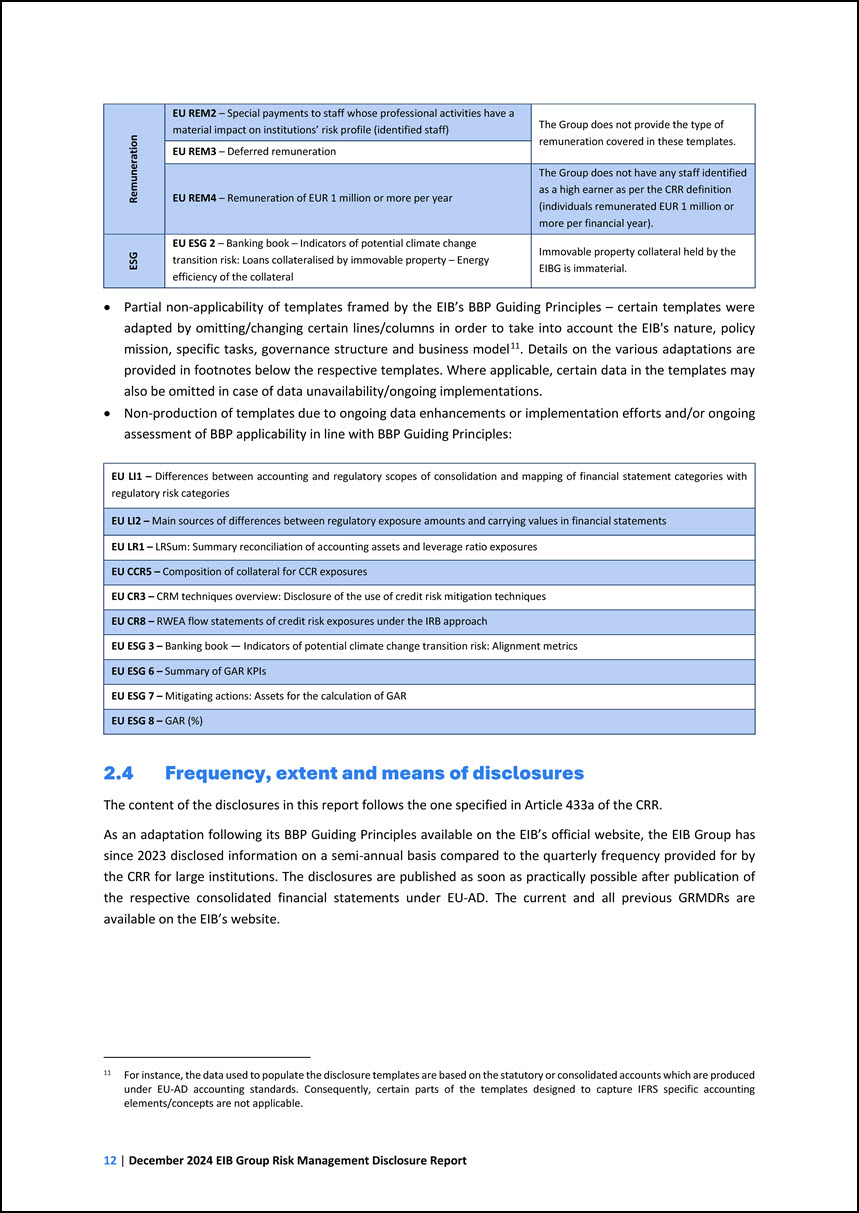
Remuneration EU REM2 – Special payments to staff whose professional activities have a material impact on institutions’ risk profile (identified staff) The Group does
not provide the type of remuneration covered in these templates. EU REM3 – Deferred remuneration EU REM4 – Remuneration of EUR 1 million or more per year The Group does not have any staff identified as a high earner as per the CRR definition
(individuals remunerated EUR 1 million or more per financial year). ESG EU ESG 2 – Banking book – Indicators of potential climate change transition risk: Loans collateralised by immovable property – Energy efficiency of the collateral Immovable
property collateral held by the EIBG is immaterial. • Partial non-applicability of templates framed by the EIB’s BBP Guiding Principles – certain templates were adapted by omitting/changing certain lines/columns in order to take into account the
EIB's nature, policy mission, specific tasks, governance structure and business model11. Details on the various adaptations are provided in footnotes below the respective templates. Where applicable, certain data in the templates may also be omitted
in case of data unavailability/ongoing implementations. • Non-production of templates due to ongoing data enhancements or implementation efforts and/or ongoing assessment of BBP applicability in line with BBP Guiding Principles: 11 For instance, the
data used to populate the disclosure templates are based on the statutory or consolidated accounts which are produced under EU-AD accounting standards. Consequently, certain parts of the templates designed to capture IFRS specific accounting
elements/concepts are not applicable. EU LI1 – Differences between accounting and regulatory scopes of consolidation and mapping of financial statement categories with regulatory risk categories EU LI2 – Main sources of differences between
regulatory exposure amounts and carrying values in financial statements EU LR1 – LRSum: Summary reconciliation of accounting assets and leverage ratio exposures EU CCR5 – Composition of collateral for CCR exposures EU CR3 – CRM techniques
overview: Disclosure of the use of credit risk mitigation techniques EU CR8 – RWEA flow statements of credit risk exposures under the IRB approach EU ESG 3 – Banking book — Indicators of potential climate change transition risk: Alignment metrics
EU ESG 6 – Summary of GAR KPIs EU ESG 7 – Mitigating actions: Assets for the calculation of GAR EU ESG 8 – GAR (%) 2.4 Frequency, extent and means of disclosures The content of the disclosures in this report follows the one specified in Article
433a of the CRR. As an adaptation following its BBP Guiding Principles available on the EIB’s official website, the EIB Group has since 2023 disclosed information on a semi-annual basis compared to the quarterly frequency provided for by the CRR for
large institutions. The disclosures are published as soon as practically possible after publication of the respective consolidated financial statements under EU-AD. The current and all previous GRMDRs are available on the EIB’s website.
2.5 Disclosure policy The GRMD Report is prepared in accordance with the applicable disclosure policy disciplining the EIB Group’s approach for applying risk
management best practice public disclosure requirements, as applicable to the EIB Group, the approval process and governance of preparation of disclosure. 2.6 Approval process This report and its external publication have been approved by the EIB
BoD on the basis of a proposal by the EIB’s Management Committee (‘MC’) and upon the recommendation of the EIB Board Committee on Risk Policy (hereinafter ‘RPC’ or ‘Risk Policy Committee’). In parallel to the EIB BoD, the report is also distributed
for information and discussion to the EIB’s Audit Committee (‘AC’). Any AC recommendations thereon are taken into account for the next reporting iteration. The general approval process of this report entails thorough consultation with the EIF and
the participation of its representatives in the main steps of the process, notably in the discussions and approvals at the level of the EIB’s governing bodies.
3 GOVERNANCE AND RISK MANAGEMENT This chapter provides an overview of the EIB Group’s risk governance structure, outlining the key roles and responsibilities
regarding risk-taking and oversight in the Group, as well as its key governance arrangements. 3.1 Risk management structure and organisation Both the EIB and the EIF have established their risk management functions responsible for risk management
on an institutional level and in respect of financial and non-financial risks. Each EIB Group entity has defined specific risk management policies, procedures and controls in line with the Group Risk Management Charter (‘GRMC’) and any applicable
Group risk management policies, described below. Group Risk Management Charter and Framework The GRMC codifies the sound principles-based approach to risk management to ensure that Group risks are managed in an effective and consistent manner and
defines the Group Risk Management Framework (‘GRMF’). The GRMF, extending across all relevant business lines of the EIB Group, aims to fully recognise the economic substance of all EIB Group risk exposures and to enable the Group to make fully
informed decisions on risk-taking. The GRMC sets out the key principles of the GRMF aimed at ensuring that all Group risks are overseen and managed in an effective and consistent manner. The GRMC applies on an individual basis and on a consolidated
basis, which means the situation as if the EIB formed together with its subsidiaries (entities controlled by the EIB) a single entity (“on a consolidated basis”). The procedural and organisational aspects are implemented by GRMC implementing
provisions, approved by the EIB and the EIF. The following principles, as defined by the GRMC, are the fundamentals of the Group Risk Management Framework and shall be adhered to at all times: • Risk culture: The Group promotes a sound risk culture
in the performance of its activities. • Best banking practice: The Group operates in adherence to the best banking practice applicable to it. • Risk appetite framework: Risk awareness and sustainability of the business model of the Group are
supported by the application of the Group Risk Appetite Framework (Group RAF). • Risk management policies, procedures, risk limits and controls: The EIB as the parent entity sets and oversees risk management policies, procedures, risk limits and
controls related to Group risks and commensurate with the entities’ respective statutes and activities, in compliance with the principles of the Charter. • Proactive, adaptive and ongoing risk management: Each institution continuously identifies,
assesses, measures, monitors, mitigates and reports risks inherent to its activities. • Capital and liquidity adequacy: Strategic decision-making shall be supported by a comprehensive and forward-looking view of the Group’s capital and liquidity
resources in relation to its risk profile and operating environment. • Information exchange, risk reporting and data aggregation: Appropriate arrangements shall be in place to enable the exchange and aggregation of information and data across the
Group for the purposes of sound and effective risk management.
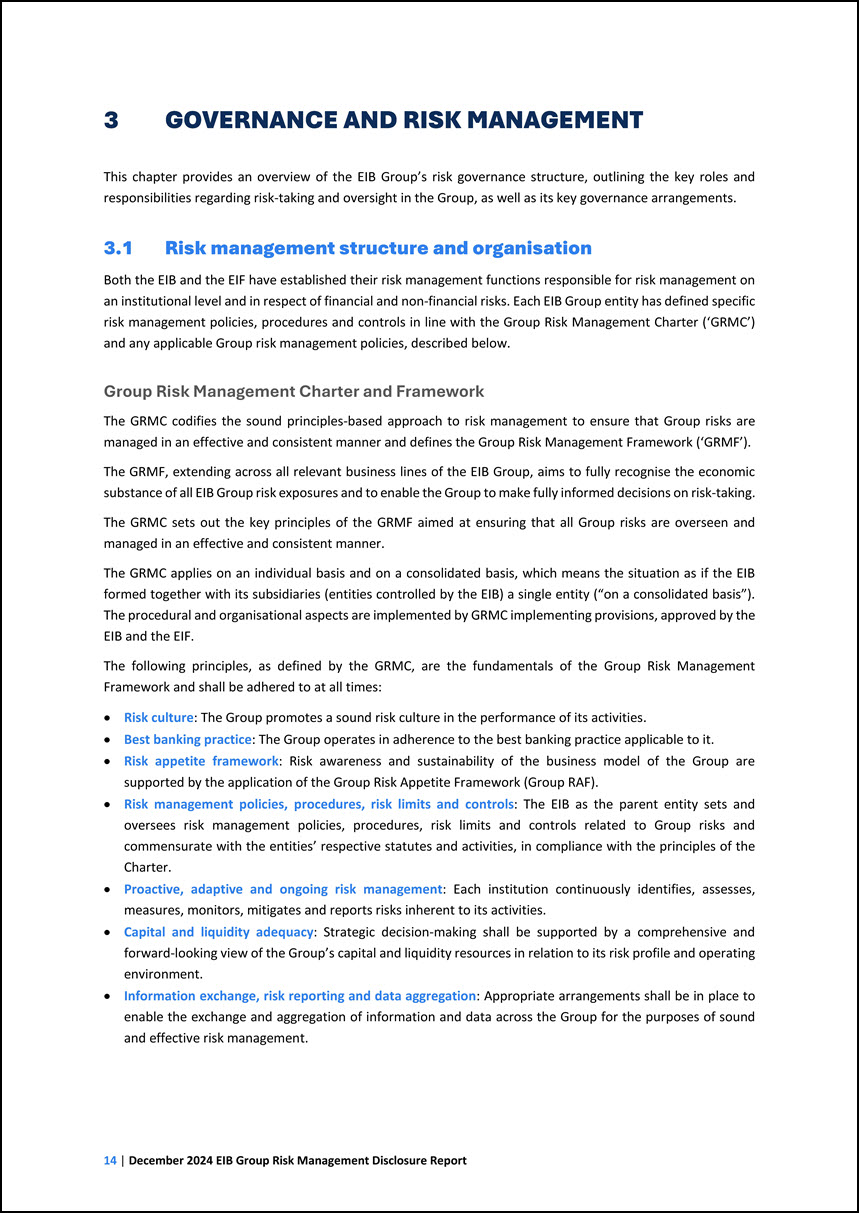
Organisational structure functions The EIB Group Risk and Compliance Directorate (‘GR&C’) is responsible for both financial risks and non-financial risks relating
to the EIB Group’s business. The Directorate independently identifies, assesses, monitors and reports on the risks to which the Group is exposed in its capacity as an independent second line of defence with direct access to the Bank’s governing
bodies. GR&C is split into a risk function (GR&C-RM) covering three risk departments, and a compliance function (GR&C-OCCO) covering the compliance department and the non-financial risk department as per Figure 3 below. The GR&C is
headed by the Group Chief Risk Officer (‘GCRO’). Without prejudice to the statutory responsibilities of the President and the EIB Management Committee, respectively, the GCRO reports on Group risks to the EIB Management Committee under the oversight
of the MC member in charge of risk. The GCRO participates in all MC meetings relating to matters within their terms of reference and relevant meetings of the other EIB governing bodies. In particular, the GCRO has direct access to the Risk Policy
Committee of the EIB BoD and can write directly to and communicate with the EIB BoD on any matter of their field of attribution. Furthermore, the GCRO is invited to relevant meetings of the EIF BoD and has direct access to the EIF’s Chief Executive
and Deputy Chief Executive. The GCRO also meets regularly with the EIB Audit Committee and is invited to meet with the EIF Audit Board. The Group Chief Compliance Officer (‘GCCO’) is responsible for independent oversight of compliance risk and a
number of non-financial risks at Group level, in consultation with the EIF and under oversight of the GCRO, ensuring identification, assessment and measurement of the Group’s compliance risks and monitoring of these risks. Without prejudice to the
responsibilities of the GCRO, the EIB Compliance function, headed by the GCCO, has direct access to the President, the MC, the AC as well as the EIB Board Working Group on Tax and Compliance and the Ethics and Compliance Committee. The detailed EIB
GR&C and EIF RO organisational structure is set out in the figures below to divisional level. Figure 3: Organisational structure of the EIB Group Risk and Compliance Directorate A screenshot of a computer screen
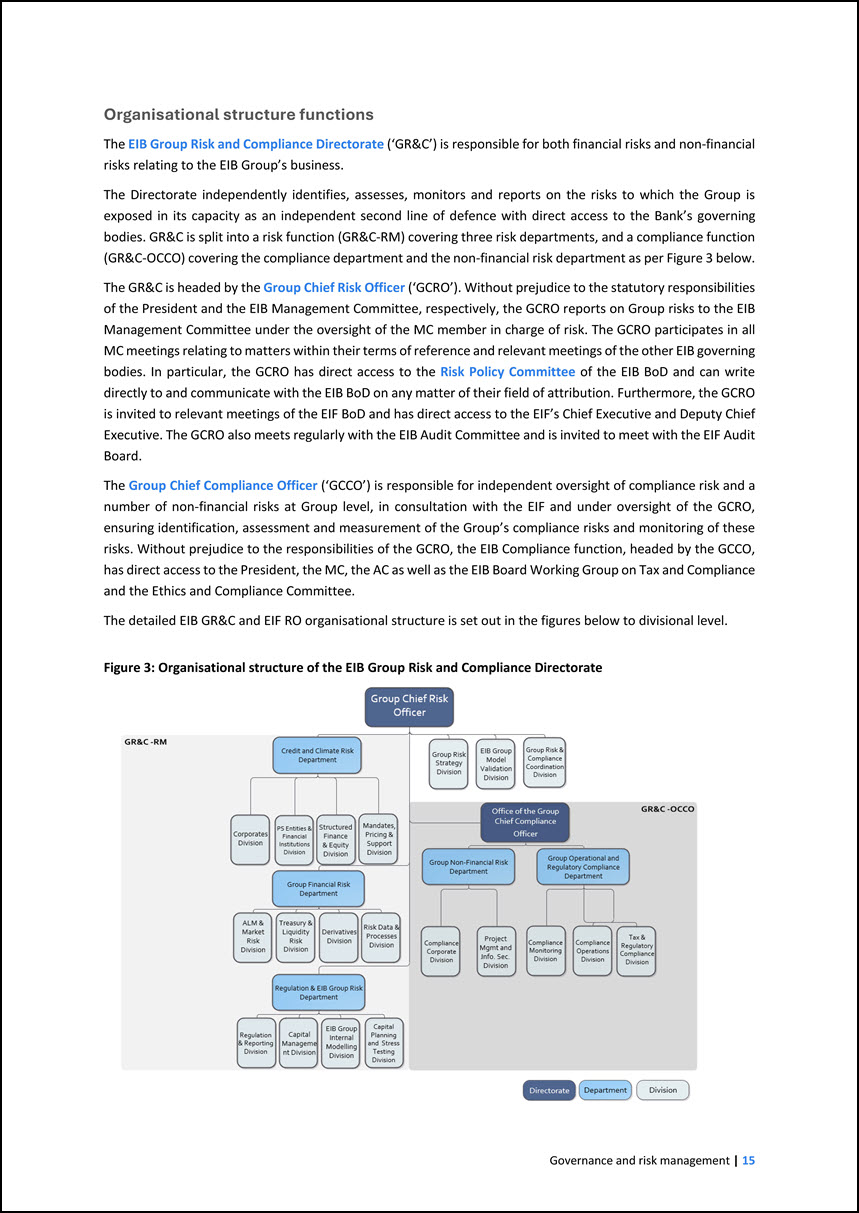
The EIF ensures appropriate risk identification and management through its Risk Office (see figure below for the structure of the EIF’s Risk Office), which is
responsible for measuring and managing the main risk types of the Fund and ensuring compliance with best market practices. The EIB as the parent entity of the Group is responsible for exercising oversight of Group risks via the GCRO, while respecting
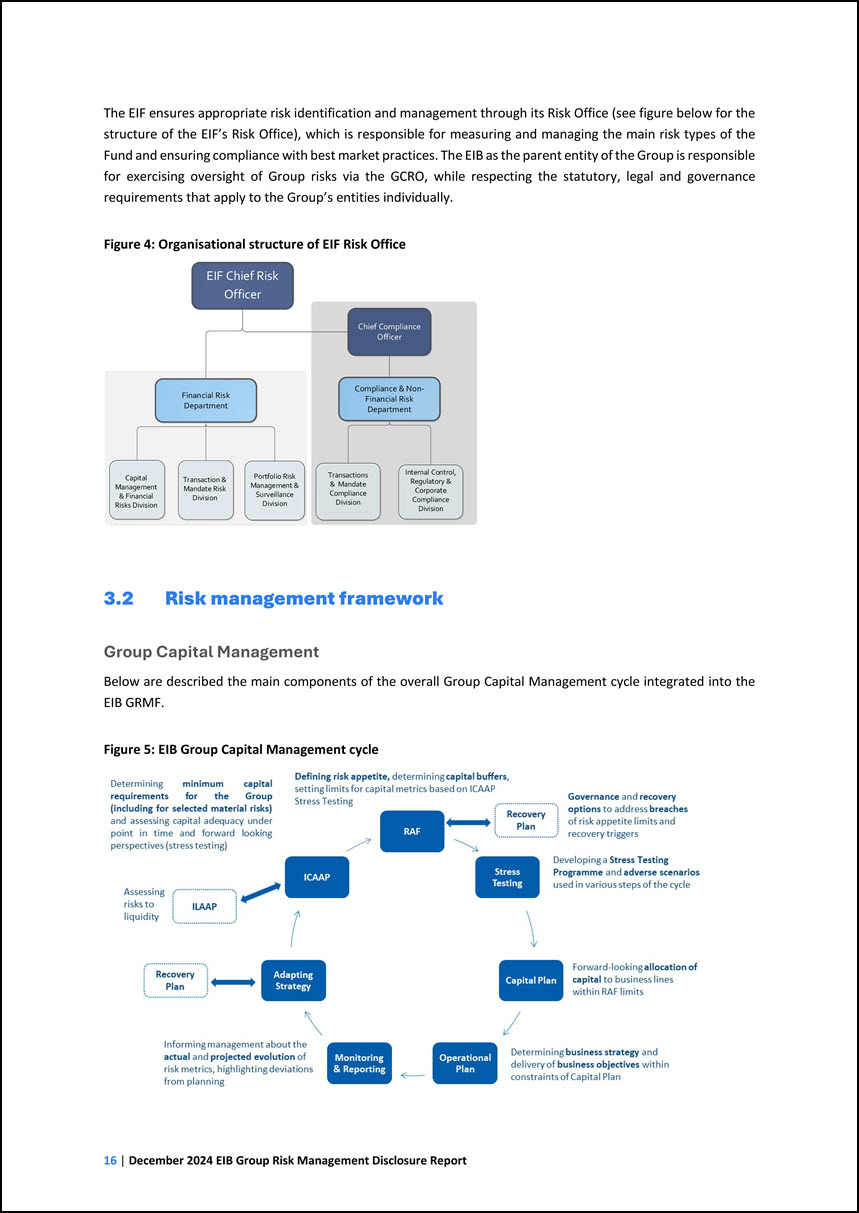
the statutory, legal and governance requirements that apply to the Group’s entities individually. Figure 4: Organisational structure of EIF Risk Office 3.2 Risk management framework Group Capital Management Below are described the main
components of the overall Group Capital Management cycle integrated into the EIB GRMF. Figure 5: EIB Group Capital Management cycle EIF Chief Risk OfficerTransaction & Mandate Risk DivisionFinancial Risk Department Chief Compliance
OfficerCompliance & Non- Financial Risk Department Capital Management& Financial Risks DivisionPortfolio Risk Management & Surveillance DivisionTransactions & Mandate Compliance DivisionInternal Control, Regulatory & Corporate
Compliance Division
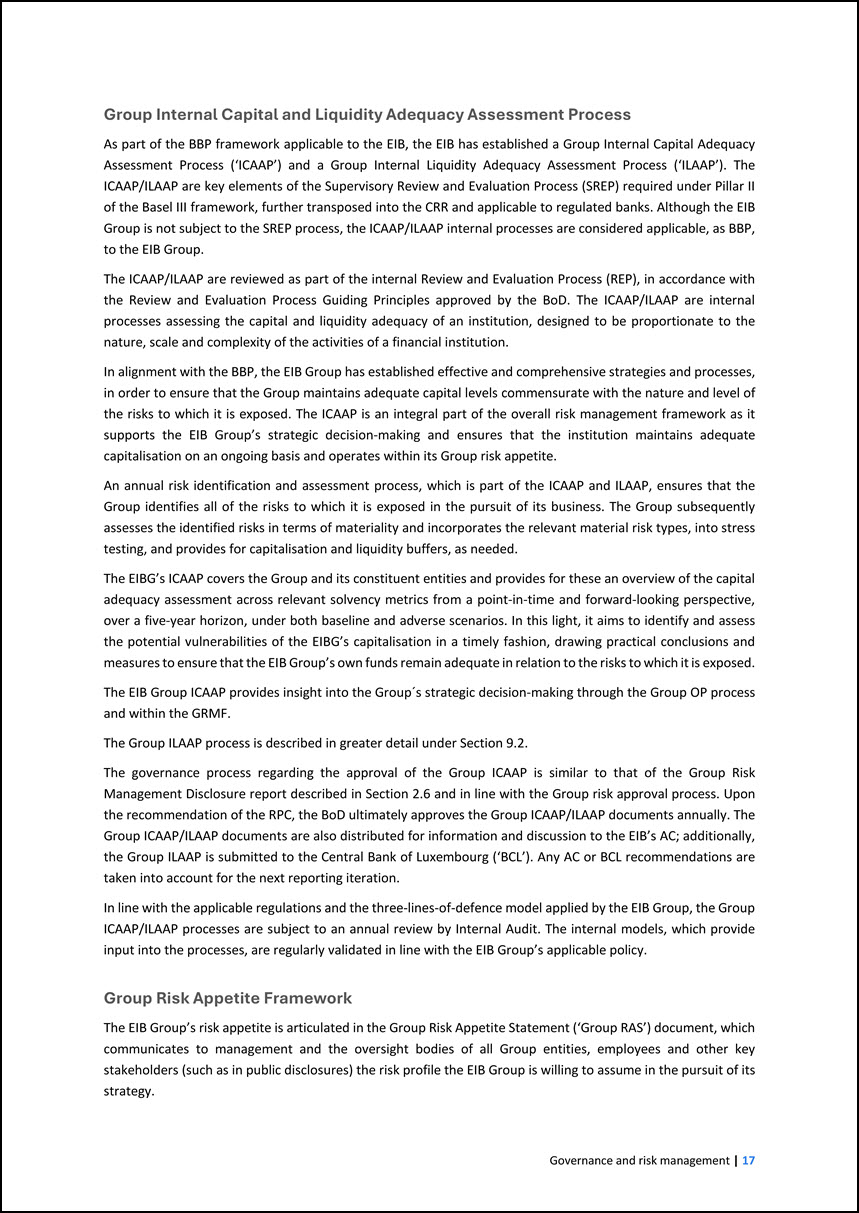
Group Internal Capital and Liquidity Adequacy Assessment Process As part of the BBP framework applicable to the EIB, the EIB has established a Group Internal Capital
Adequacy Assessment Process (‘ICAAP’) and a Group Internal Liquidity Adequacy Assessment Process (‘ILAAP’). The ICAAP/ILAAP are key elements of the Supervisory Review and Evaluation Process (SREP) required under Pillar II of the Basel III framework,
further transposed into the CRR and applicable to regulated banks. Although the EIB Group is not subject to the SREP process, the ICAAP/ILAAP internal processes are considered applicable, as BBP, to the EIB Group. The ICAAP/ILAAP are reviewed as
part of the internal Review and Evaluation Process (REP), in accordance with the Review and Evaluation Process Guiding Principles approved by the BoD. The ICAAP/ILAAP are internal processes assessing the capital and liquidity adequacy of an
institution, designed to be proportionate to the nature, scale and complexity of the activities of a financial institution. In alignment with the BBP, the EIB Group has established effective and comprehensive strategies and processes, in order to
ensure that the Group maintains adequate capital levels commensurate with the nature and level of the risks to which it is exposed. The ICAAP is an integral part of the overall risk management framework as it supports the EIB Group’s strategic
decision-making and ensures that the institution maintains adequate capitalisation on an ongoing basis and operates within its Group risk appetite. An annual risk identification and assessment process, which is part of the ICAAP and ILAAP, ensures
that the Group identifies all of the risks to which it is exposed in the pursuit of its business. The Group subsequently assesses the identified risks in terms of materiality and incorporates the relevant material risk types, into stress testing, and
provides for capitalisation and liquidity buffers, as needed. The EIBG’s ICAAP covers the Group and its constituent entities and provides for these an overview of the capital adequacy assessment across relevant solvency metrics from a point-in-time
and forward-looking perspective, over a five-year horizon, under both baseline and adverse scenarios. In this light, it aims to identify and assess the potential vulnerabilities of the EIBG’s capitalisation in a timely fashion, drawing practical
conclusions and measures to ensure that the EIB Group’s own funds remain adequate in relation to the risks to which it is exposed. The EIB Group ICAAP provides insight into the Group´s strategic decision-making through the Group OP process and
within the GRMF. The Group ILAAP process is described in greater detail under Section 9.2. The governance process regarding the approval of the Group ICAAP is similar to that of the Group Risk Management Disclosure report described in Section 2.6
and in line with the Group risk approval process. Upon the recommendation of the RPC, the BoD ultimately approves the Group ICAAP/ILAAP documents annually. The Group ICAAP/ILAAP documents are also distributed for information and discussion to the
EIB’s AC; additionally, the Group ILAAP is submitted to the Central Bank of Luxembourg (‘BCL’). Any AC or BCL recommendations are taken into account for the next reporting iteration. In line with the applicable regulations and the
three-lines-of-defence model applied by the EIB Group, the Group ICAAP/ILAAP processes are subject to an annual review by Internal Audit. The internal models, which provide input into the processes, are regularly validated in line with the EIB
Group’s applicable policy. Group Risk Appetite Framework The EIB Group’s risk appetite is articulated in the Group Risk Appetite Statement (‘Group RAS’) document, which communicates to management and the oversight bodies of all Group entities,
employees and other key stakeholders (such as in public disclosures) the risk profile the EIB Group is willing to assume in the pursuit of its strategy.
The main building blocks through which the Group RAS is derived and embedded are listed below: • Stakeholders’ expectations and public mission; • Strategy and
business models of the Group entities; • Risk Identification process; • Risk Appetite Statement. The Group’s risk appetite setting process starts by identifying its main stakeholders and their respective expectations. Subsequently, the process
entails the assessment of the Group entities’ long-term policy objectives and business models in conjunction with the identification and assessment of the main risk categories to which the Group is exposed, which subsequently is articulated into the
Group RAS and the related risk metrics. The core of the Group’s business model is to provide financing at attractive terms to promote the attainment of the European Union’s policy objectives to which the Group entities play an integral and essential
role. The EIB mainly funds itself through the capital markets at relatively attractive terms and it passes on its attractive funding cost to clients by offering debt and equity-type financing either directly or via intermediated channels. The EIF
finances its activities out of its capital base and through third-party mandates and cooperation schemes with public and private counterparts, including the EIB and the European Union, represented by the European Commission (EC). The Group
originates business either (a) at its own risk; (b) through a risk-sharing mechanism by which a third party (such as the European Commission, Member States) provides credit enhancement to the Bank and/or to the EIF; or (c) on behalf of third parties
at their own risk. Exposures to the Member States benefit from the EIB’s Preferred Creditor Status (‘PCS’) based on international law practice and the EIB’s statutory framework12. 12 Except for exposures in the form of debt instruments with
collective action clauses. Furthermore, the EIB Group mobilises additional funds from other parties (private investors, European Commission, Member States) to maximise the financing impact within the scope of the EU policy goals. In this catalysing
role, the Group thereby creates a multiplier effect. In order to provide financing on attractive terms, the Group needs to maintain broad access to attractive funding from the capital markets by preserving the EIB’s AAA rating13, which is mainly a
function of its capital resources14, available liquidity, risk management practices and shareholders’ support. Consequently, for risk appetite purposes, the Group operates in such a way as to retain its AAA rating. 13 To some extent the preservation
of the AAA rating is subject to external parties’ (credit rating agencies’) judgment, hence not entirely under the Group’s control. 14 Commonly measured by credit rating agencies with respect to the consolidated risk position. The Group RAS
integrates all the elements described above by stating the level of appetite for the Group by each risk category and by translating these statements into risk metrics and related limits that constitute the Group RAF. Quantitative limits are set for
both financial risks and non-financial risk categories. Group Risk Appetite Statement15 15 The Group RAS 2024 and Group RAF Policy 2024 were approved by the BoD on 20 June 2024. The EIB Group is committed to retaining its long-term AAA rating,
which is a primary pillar of its business model. To this end, the EIB Group has implemented a strong risk management framework supported by a multitude of statutory, regulatory and internally developed risk appetite metrics.
As a public financial institution, the Group does not focus on making profits from speculative exposures to risks. As a consequence, the Group does not consider its
treasury or funding activities as profit-maximising centres and does not engage in speculative operations. The EIB Group is focused on the stability of earnings and preservation of the economic value of own funds in order to ensure the
sustainability and self-financing of its growth in the long term. The EIB Group monitors and manages its ability to fulfil this dual objective through related risk appetite metrics. The EIB Group is committed to maintaining its business model and
strategy whilst ensuring a robust operating environment with regard to operational, strategic, climate and reputational risks through a strong internal control framework supported by risk appetite metrics capturing a broad range of risks. The EIB
Group is committed to doing business in an ethical and fair way with zero tolerance for fraud, money laundering and financing of terrorism and from being used, intentionally or unintentionally, for criminal activities. The EIB Group aligns with best
practice anti-money laundering and combating the financing of terrorism standards, promoting high ethical and professional behaviour in the financial sector. For this purpose, the Group promotes a strong compliance and risk culture and manages
conduct and compliance risks through an appropriate internal control framework and specific risk appetite metrics. The EIB Group takes concrete actions to counter the rapid growth in ICT (Information and Communications Technology), information
security and cyber risks and the increasing severity and impacts that these risks pose to the Group’s business operation and to its reputation towards stakeholders, clients and employees. The EIB Group is committed to preserving the reputation of
the Group amongst its stakeholders in line with the highest standards and is monitoring risk appetite metrics related both to external and internal developments, such as media coverage and staff engagement and well-being. The EIB Group is committed
to supporting the Paris Agreement in order to limit the impact of climate change and related environmental, economic and social systemic risks. As the climate bank and a leader in climate- related financing, the EIB Group aims to adapt its processes
and risk management framework to address the financial and non-financial risks induced by climate change and incorporate climate and environmental risk- related considerations into the ongoing management of operations and business priorities. Group
Stress Testing Framework As part of the Group Stress Testing Framework, the EIB Group develops a Stress Testing Programme on an annual basis, which identifies the list of stress and sensitivity tests to be performed over a year, by the Group or by
each Group entity, and which is approved by the MC and the Chief Executive of the EIF for its relevant parts. Group Recovery Planning The Group Recovery Plan (‘Group RP’) describes how the EIB Group would identify and manage actual and potential
crises threatening the Group’s capital adequacy and/or liquidity position. The Group RP covers the recovery stage for both capital adequacy and liquidity risk indicators and the contingency stage for capital adequacy indicators. The contingency stage
for liquidity risk indicators is covered by the Group Contingency Funding Plan (‘Group CFP’), while reference is made to the latter also at the recovery stage for liquidity risk indicators. The Group RP complements the Group RAF as it elaborates on a
range of contingency and recovery options and actions in response to breaches of risk appetite limits/recovery triggers, in order to avoid exceeding the Group’s risk capacity.
Group Capital Sustainability Policy The Group Capital Sustainability Policy (‘GCSP’) aims to ensure that the Group’s business strategy and Operational Plan remain
sustainable from a capital perspective, as in that the Group’s and the Group Entities’ capital risk metrics remain within their risk appetite limits over the planning horizon. The Group Capital Plan (’GCP’) enacts the key objectives of the Group
Capital Sustainability Policy, by determining the maximum available capital headroom and allocating the capital to be deployed through the Group Operational Plan. The GCP ensures that capital is used efficiently to support the Group’s mission and the
delivery and implementation of the Group entities’ business plans, while safeguarding the Bank’s AAA rating and retaining flexibility to respond to market downturns and new EU policy initiatives. Group Risk Reporting The GCRO is responsible for
overseeing internal risk reporting to the MC, the BoD, the RPC and the AC. Several risk reporting processes are in place within the EIB Group to support managerial decisions with a focus on the various risks and limit monitoring. Based on the
function, risk monitored, audience and purpose, reports may have a customised level of detail and be produced with frequencies ranging from daily to quarterly as needed. Two overarching EIB Group Risk Reports provides to senior management the
overview of the Group‘s financial and non-financial risks respectively, including regular monitoring of Group and entity-level RAF metrics. Quarterly and monthly versions of these reports provide different levels of detail to management and support
managerial decision-making for the governing bodies of the EIB (MC and BoD). The reports are also provided to and discussed at the RPC and AC on a regular basis. The EIB Group aims at applying BCBS (Basel Committee on Banking Supervision) 239
principles in its risk reporting activity.
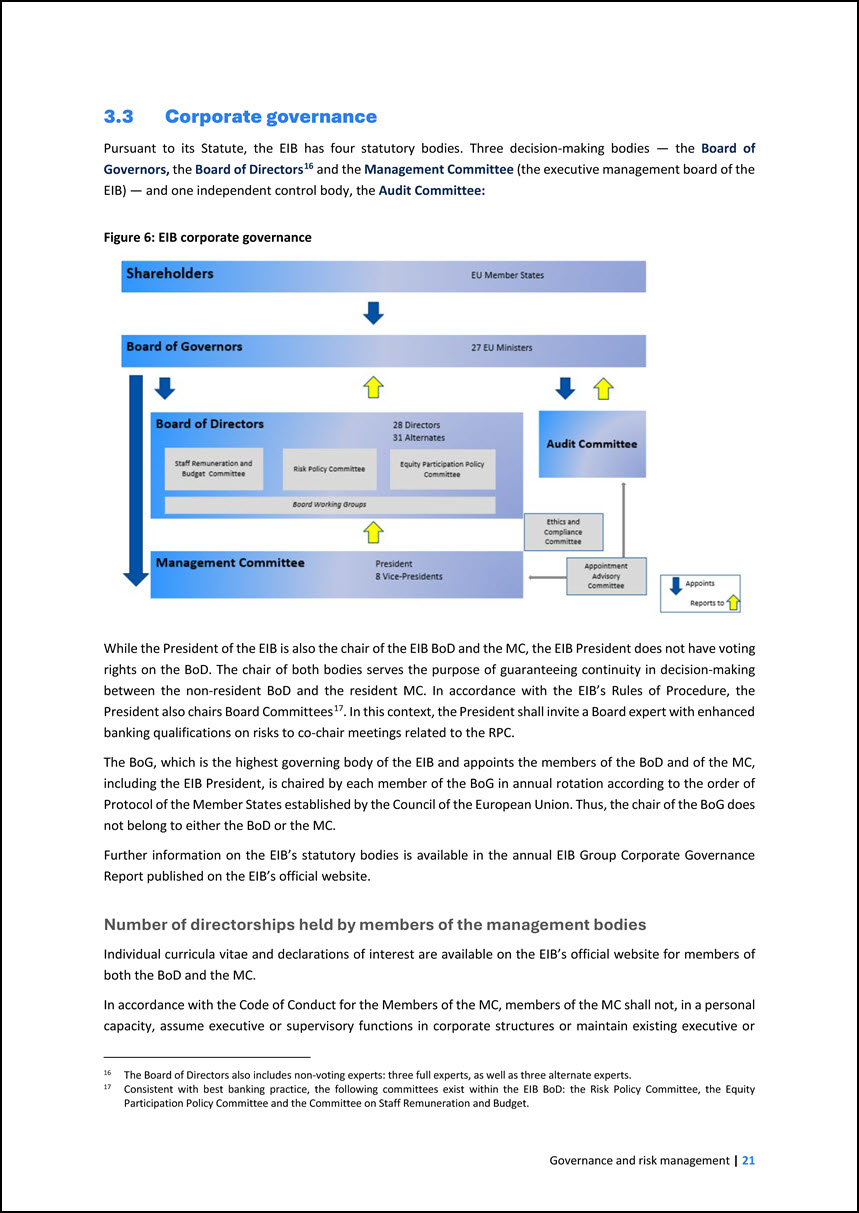
3.3 Corporate governance Pursuant to its Statute, the EIB has four statutory bodies. Three decision-making bodies — the Board of Governors, the Board of DirectorsEIB)
— and one independent control body, the Audit Committee: 16 and the Management Committee (the executive management board of the 16 The Board of Directors also includes non-voting experts: three full experts, as well as three alternate experts.
Figure 6: EIB corporate governance While the President of the EIB is also the chair of the EIB BoD and the MC, the EIB President does not have voting rights on the BoD. The chair of both bodies serves the purpose of guaranteeing continuity in
decision-making between the non-resident BoD and the resident MC. In accordance with the EIB’s Rules of Procedure, the President also chairs Board Committeesbanking qualifications on risks to co-chair meetings related to the RPC. 17. In this context,
the President shall invite a Board expert with enhanced 17 Consistent with best banking practice, the following committees exist within the EIB BoD: the Risk Policy Committee, the Equity Participation Policy Committee and the Committee on Staff
Remuneration and Budget. The BoG, which is the highest governing body of the EIB and appoints the members of the BoD and of the MC, including the EIB President, is chaired by each member of the BoG in annual rotation according to the order of
Protocol of the Member States established by the Council of the European Union. Thus, the chair of the BoG does not belong to either the BoD or the MC. Further information on the EIB’s statutory bodies is available in the annual EIB Group Corporate
Governance Report published on the EIB’s official website. Number of directorships held by members of the management bodies Individual curricula vitae and declarations of interest are available on the EIB’s official website for members of both the
BoD and the MC. In accordance with the Code of Conduct for the Members of the MC, members of the MC shall not, in a personal capacity, assume executive or supervisory functions in corporate structures or maintain existing executive or
supervisory functions when joining the Bank. This prohibition does not apply when the executive or supervisory function is performed at the request of the Bank and is
connected to the Bank’s work. In accordance with their respective Codes of Conduct, members of both the MC and of the BoD shall disclose to the Ethics and Compliance Committee (ECC) any official or professional position they hold at the time of
their appointment, as well as any subsequent changes thereto. Information regarding the recruitment policy for the selection of members of the management bodies and their actual knowledge, skills and expertise The Appointment Advisory Committee,
pursuant to Articles 23.a.2 and 27.8 of the Rules of Procedure of the EIB, shall give an opinion on candidates' suitability to perform the duties of a member of the EIB MC and those of a full member or observer of the EIB’s AC, before the Board of
Governors makes the statutory appointment. In the context of the assessment of the collective knowledge and expertise of the MC pursuant to the Operating Rules of the Appointment Advisory Committee, the Committee shall consult the President of the
Bank for nominations to the MC on any potential specific need within the MC, at the time of appointment. The Secretary General shall inform the nominating Member State of any such specific need within the MC, at the time of a vacancy. In accordance
with the Statute of the Bank, the EIB’s Board of Directors consists of 28 directors and 31 alternate directors who shall be chosen from persons whose independence and competence are beyond doubt and appointed by the BoG for a collective five-year
mandate that is renewable. To broaden its professional expertise, the BoD has made use of the possibility of co-opting non-voting experts (three full experts as well as three alternate experts). The end of their mandate coincides with that of the
entire BoD. In accordance with Article 23.a, first paragraph, of the Rules of Procedure of the Bank, the members of the MC shall be persons of independence and competence and have experience in financial, banking and/or EU matters. They shall at all
times be of sound integrity and enjoy high reputation, and possess sufficient knowledge, skills and expertise to perform their duties. Information on the knowledge, skills and expertise of members of the EIB management bodies is available in their
individual curricula vitae on the EIB’s website. Information on diversity18 policies with regard to the members of the management bodies 18 Reflecting the EIB statutory framework, the process and rules relating to the nomination and appointment of
the members of the EIB governance bodies are not all based on the same suitability requirements applicable to commercial banks, namely the diversity requirements in the CRD and in the joint European Securities and Markets Authority (ESMA) and
European Banking Authority (EBA) Guidelines on the assessment of the suitability of members of the management body and key function holders; hence, no diversity policy as such is in place in that regard. In accordance with the Rules of Procedure of
the Bank, the overall composition of the BoD and of the MC shall aim to reflect an adequately broad range of expertise as well as gender diversity. Gender diversity in the BoD is reported in Annex 2 to the annual EIB Group Corporate Governance
Report available on the EIB’s website.
Risk Policy Committee Within the BoD, the Risk Policy Committee (RPC) is the EIB’s risk committee, composed of nine members of the BoD19. Its role is to discuss and
advise the BoD on the Bank’s risk policies, including those policies that are relevant for aspects of the EIB Group regarding risk appetite, tolerance and strategy. The RPC provides non-binding opinions and/or recommendations to the BoD so as to
facilitate the decision-making process of the BoD. 19 Members are nominated by the Member States or groups of Member States that nominate alternate Directors as specified under Article 9(2) of the Statute. Nominations shall be effective upon
recording of receipt by the chair of the Board. More specifically, the Committee advises the BoD on the EIB’s policies regarding overall risk appetite, tolerance and strategy by reviewing the EIB Group Risk Management Framework with respect to
credit, market and liquidity risks. It provides opinions and makes recommendations to the BoD as to whether the policies related to identification, assessment and management of risks are appropriate to the Bank's risk profile. Furthermore, it
discusses policies associated with all risks relevant to the EIB Group. The Committee advises the BoD on risk policies by reviewing and providing opinions and/or recommendations to the BoD on the following high-level risk policy documents upon
proposal from the Bank: • Group Risk Management Charter; • Group Capital Sustainability Policy; • Group Risk Appetite Framework; • Group Internal Capital Adequacy Assessment Process (‘ICAAP’); • Group Internal Liquidity Adequacy Assessment Process
(‘ILAAP’); • Group Contingency Funding Plan; • Group Recovery Plan; • Group Stress Testing Framework. The Committee also reviews and discusses: • The Group Capital Plan, and recommends the capital allocation as part of the Operational Plan; • The
EIB Group Risk Reports on a quarterly basis; • The annual report prepared by the Bank on the implemented restructurings of existing operations; • The main changes to the Credit Risk Guidelines (CRGs) and Financial Risk Guidelines (FRGs), as approved
from time to time by the MC of the Bank; • Any written contributions submitted to it by the GCRO, in accordance with Article 11.3 of the Rules of Procedure. Further details on the RPC Terms of Reference are available on the EIB’s website. In 2024,
the RPC met seven times. Three lines of defence The EIB Group’s internal control functions and risk management systems are consistent with the three-lines-of- defence model. As a first line of defence, the business units are responsible, within
their respective areas, for managing risks within the established set of limits and boundaries. Amongst other functions, the second line of defence includes the respective Risk Management and Compliance functions as well as IT resources. The Chief
Financial Controller Directorate as a second line of defence function is responsible for the maintenance, development and oversight of the internal control framework. The second line of defence also includes functions in the EIB's Projects
Directorate and the Legal Directorate.
The third line of defence is ensured by the Internal Audit function, which provides an independent review of the risk management practices and internal control
framework and reports to the AC or to the EIF's Audit Board, as relevant. At both the EIB and the EIF, the segregation of duties is supported by the fact that internal control functions are separate functions, each having direct access to the
relevant executive body (President/MC for the EIB, Chief Executive for the EIF) and to the BoD. Furthermore, the Audit Committee has an internal and specific review and evaluation process (the “EIB REP”) in place. This process has been framed by the
EIB’s Review and Evaluation Guiding Principles, available on the Bank’s website, which were complemented by implementing rules and a methodology specific to the EIB Group. Globally, this framework is based on the EBA’s Guidelines on the Supervisory
Review and Evaluation Process, while considering the EIB’s specific nature, policy mission, tasks and governance structure. The EIB REP supports the AC in its role to ensure that the Bank conforms with applicable BBP.
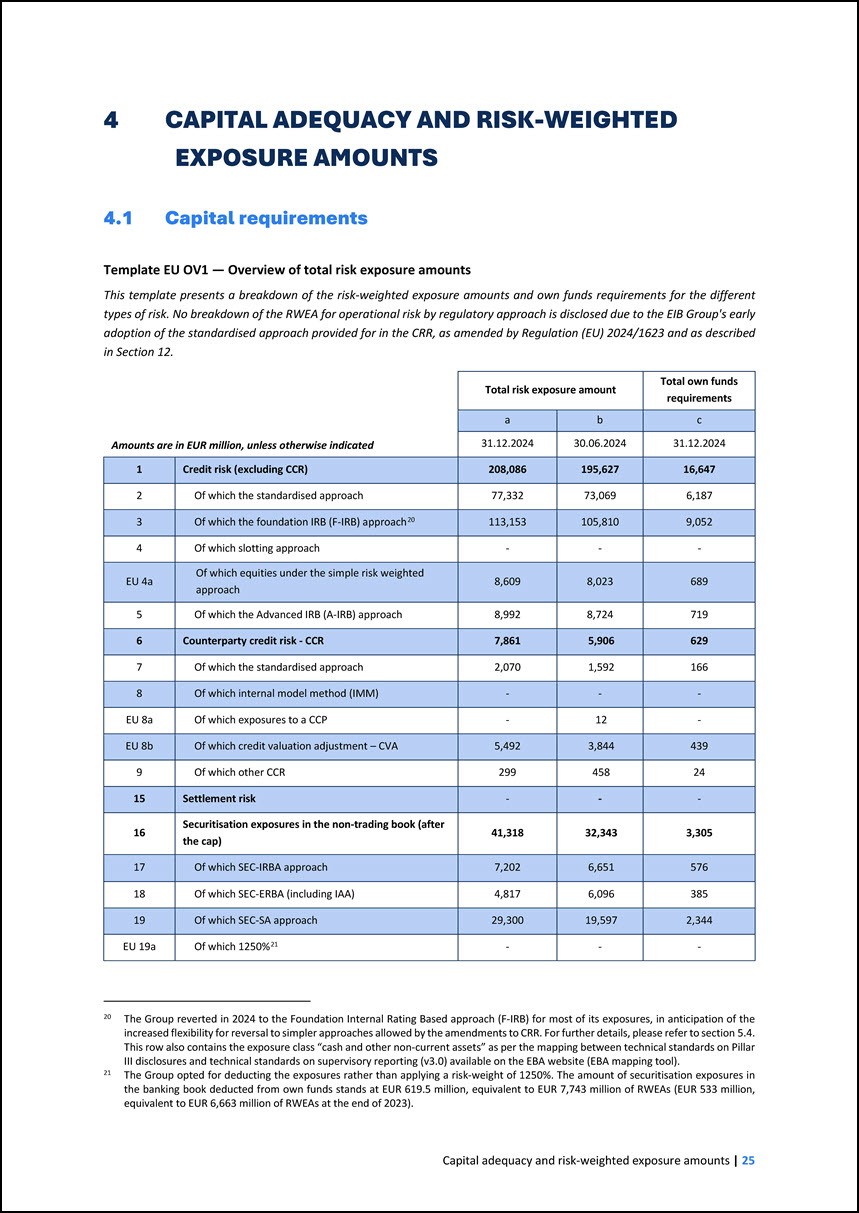
4 CAPITAL ADEQUACY AND RISK-WEIGHTED EXPOSURE AMOUNTS 4.1 Capital requirements Template EU OV1 — Overview of total risk exposure amounts This template presents a
breakdown of the risk-weighted exposure amounts and own funds requirements for the different types of risk. No breakdown of the RWEA for operational risk by regulatory approach is disclosed due to the EIB Group's early adoption of the standardised
approach provided for in the CRR, as amended by Regulation (EU) 2024/1623 and as described in Section 12. Amounts are in EUR million, unless otherwise indicated Total risk exposure amount Total own funds requirements a b c 31.12.2024
30.06.2024 31.12.2024 1 Credit risk (excluding CCR) 208,086 195,627 16,647 2 Of which the standardised approach 77,332 73,069 6,187 3 Of which the foundation IRB (F-IRB) approach20 113,153 105,810 9,052 4 Of which slotting approach
- - - EU 4a Of which equities under the simple risk weighted approach 8,609 8,023 689 5 Of which the Advanced IRB (A-IRB) approach 8,992 8,724 719 6 Counterparty credit risk - CCR 7,861 5,906 629 7 Of which the standardised
approach 2,070 1,592 166 8 Of which internal model method (IMM) - - - EU 8a Of which exposures to a CCP - 12 - EU 8b Of which credit valuation adjustment – CVA 5,492 3,844 439 9 Of which other CCR 299 458 24 15 Settlement
risk - - - 16 Securitisation exposures in the non-trading book (after the cap) 41,318 32,343 3,305 17 Of which SEC-IRBA approach 7,202 6,651 576 18 Of which SEC-ERBA (including IAA) 4,817 6,096 385 19 Of which SEC-SA approach
29,300 19,597 2,344 EU 19a Of which 1250%21 - - - 20 The Group reverted in 2024 to the Foundation Internal Rating Based approach (F-IRB) for most of its exposures, in anticipation of the increased flexibility for reversal to simpler
approaches allowed by the amendments to CRR. For further details, please refer to section 5.4. This row also contains the exposure class “cash and other non-current assets” as per the mapping between technical standards on Pillar III disclosures and
technical standards on supervisory reporting (v3.0) available on the EBA website (EBA mapping tool). 21 The Group opted for deducting the exposures rather than applying a risk-weight of 1250%. The amount of securitisation exposures in the banking
book deducted from own funds stands at EUR 619.5 million, equivalent to EUR 7,743 million of RWEAs (EUR 533 million, equivalent to EUR 6,663 million of RWEAs at the end of 2023).
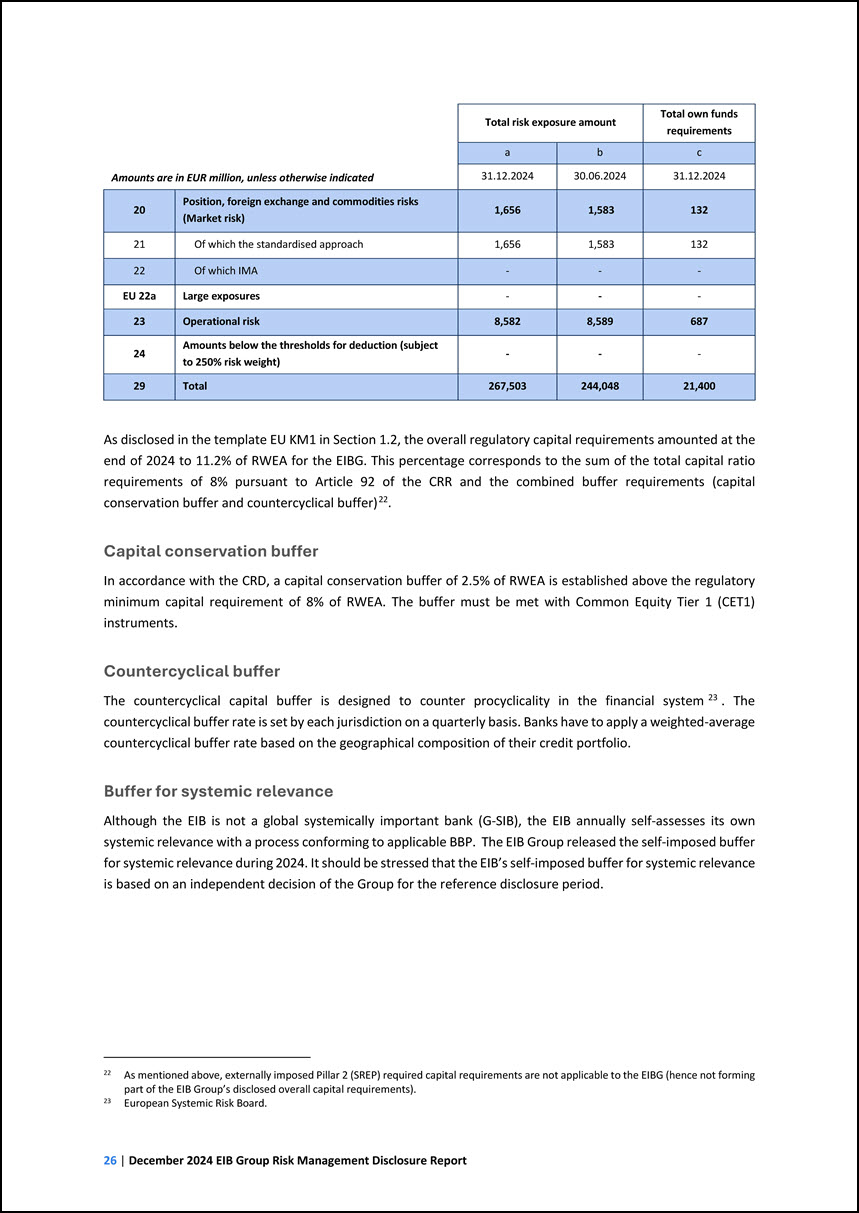
Amounts are in EUR million, unless otherwise indicated Total risk exposure amount Total own funds requirements a b c 31.12.2024 30.06.2024 31.12.2024 20
Position, foreign exchange and commodities risks (Market risk) 1,656 1,583 132 21 Of which the standardised approach 1,656 1,583 132 22 Of which IMA - - - EU 22a Large exposures - - - 23 Operational risk 8,582 8,589 687 24
Amounts below the thresholds for deduction (subject to 250% risk weight) - - - 29 Total 267,503 244,048 21,400 As disclosed in the template EU KM1 in Section 1.2, the overall regulatory capital requirements amounted at the end of 2024 to
11.2% of RWEA for the EIBG. This percentage corresponds to the sum of the total capital ratio requirements of 8% pursuant to Article 92 of the CRR and the combined buffer requirements (capital conservation buffer and countercyclical buffer)22. 22 As
mentioned above, externally imposed Pillar 2 (SREP) required capital requirements are not applicable to the EIBG (hence not forming part of the EIB Group’s disclosed overall capital requirements). Capital conservation buffer In accordance with the
CRD, a capital conservation buffer of 2.5% of RWEA is established above the regulatory minimum capital requirement of 8% of RWEA. The buffer must be met with Common Equity Tier 1 (CET1) instruments. Countercyclical buffer The countercyclical
capital buffer is designed to counter procyclicality in the financial system23. The countercyclical buffer rate is set by each jurisdiction on a quarterly basis. Banks have to apply a weighted-average countercyclical buffer rate based on the
geographical composition of their credit portfolio. 23 European Systemic Risk Board. Buffer for systemic relevance Although the EIB is not a global systemically important bank (G-SIB), the EIB annually self-assesses its own systemic relevance with
a process conforming to applicable BBP. The EIB Group released the self-imposed buffer for systemic relevance during 2024. It should be stressed that the EIB’s self-imposed buffer for systemic relevance is based on an independent decision of the
Group for the reference disclosure period.
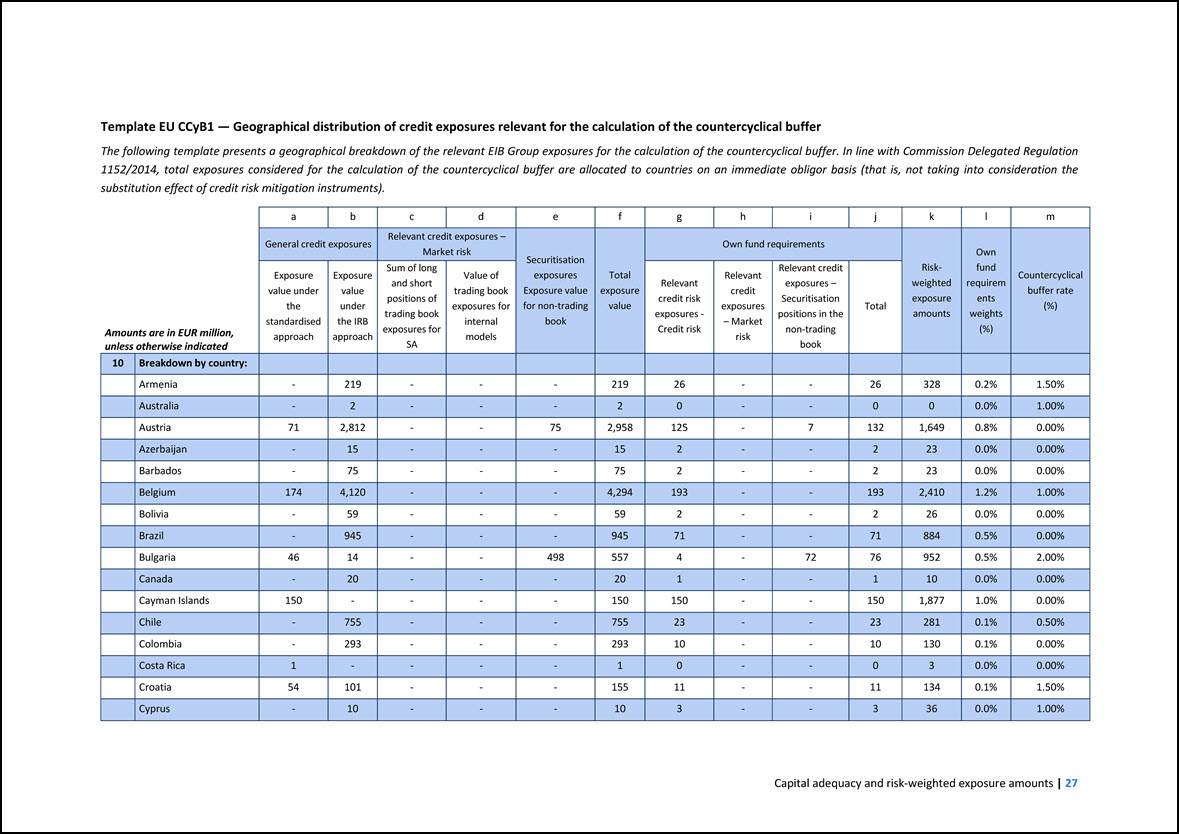
Template EU CCyB1 — Geographical distribution of credit exposures relevant for the calculation of the countercyclical buffer The following template presents a
geographical breakdown of the relevant EIB Group exposures for the calculation of the countercyclical buffer. In line with Commission Delegated Regulation 1152/2014, total exposures considered for the calculation of the countercyclical buffer are
allocated to countries on an immediate obligor basis (that is, not taking into consideration the substitution effect of credit risk mitigation instruments). Amounts are in EUR million, unless otherwise indicated a b c d e f g h i j k l
m General credit exposures Relevant credit exposures – Market risk Securitisation exposures Exposure value for non-trading book Total exposure value Own fund requirements Risk- weighted exposure amounts Own fund requirements weights (%)
Countercyclical buffer rate (%) Exposure value under the standardised approach Exposure value under the IRB approach Sum of long and short positions of trading book exposures for SA Value of trading book exposures for internal models Relevant
credit risk exposures - Credit risk Relevant credit exposures – Market risk Relevant credit exposures – Securitisation positions in the non-trading book Total 10 Breakdown by country: Armenia - 219 - - - 219 26 -
- 26 328 0.2% 1.50% Australia - 2 - - - 2 0 - - 0 0 0.0% 1.00% Austria 71 2,812 - - 75 2,958 125 - 7 132 1,649 0.8% 0.00% Azerbaijan - 15 - - - 15 2 - - 2 23 0.0% 0.00% Barbados - 75 - - - 75
2 - - 2 23 0.0% 0.00% Belgium 174 4,120 - - - 4,294 193 - - 193 2,410 1.2% 1.00% Bolivia - 59 - - - 59 2 - - 2 26 0.0% 0.00% Brazil - 945 - - - 945 71 - - 71 884 0.5% 0.00% Bulgaria 46 14 - -
498 557 4 - 72 76 952 0.5% 2.00% Canada - 20 - - - 20 1 - - 1 10 0.0% 0.00% Cayman Islands 150 - - - - 150 150 - - 150 1,877 1.0% 0.00% Chile - 755 - - - 755 23 - - 23 281 0.1% 0.50% Colombia -
293 - - - 293 10 - - 10 130 0.1% 0.00% Costa Rica 1 - - - - 1 0 - - 0 3 0.0% 0.00% Croatia 54 101 - - - 155 11 - - 11 134 0.1% 1.50% Cyprus - 10 - - - 10 3 - - 3 36 0.0% 1.00%
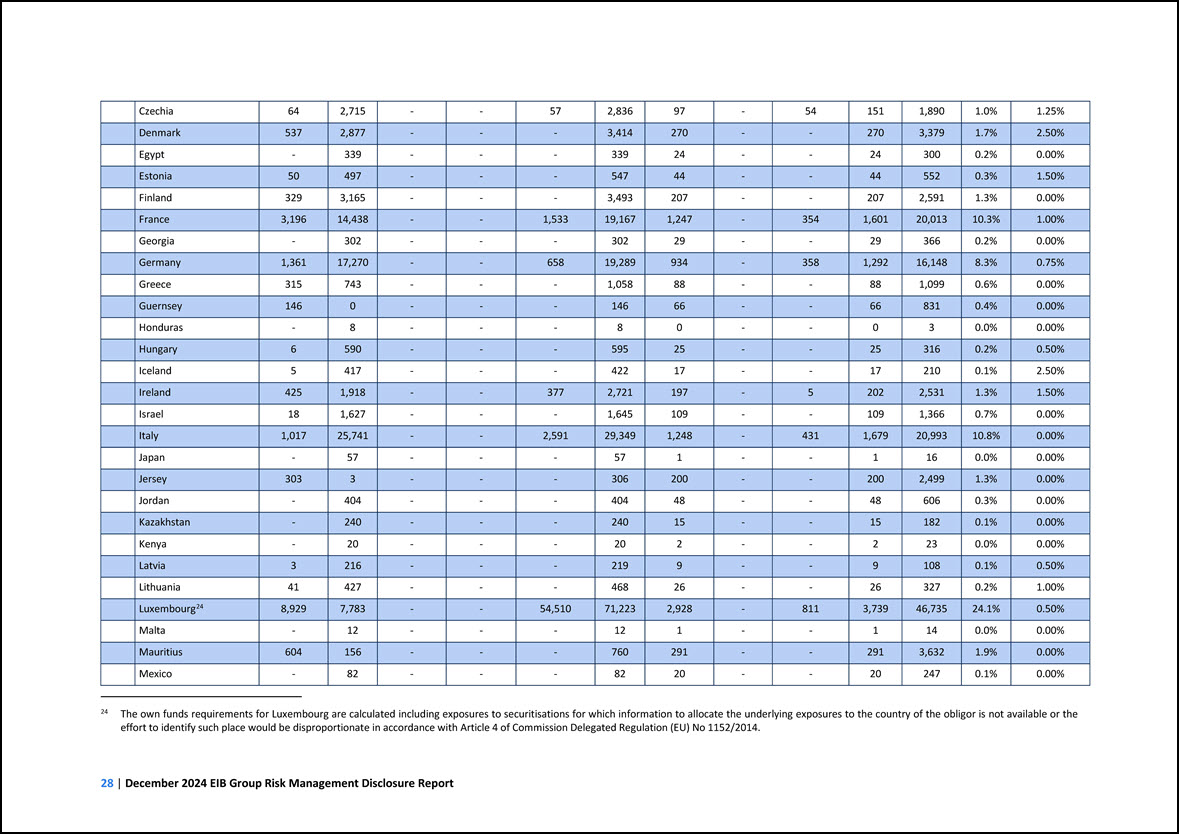
Czechia 64 2,715 - - 57 2,836 97 - 54 151 1,890 1.0% 1.25% Denmark 537 2,877 - - - 3,414 270 - - 270 3,379 1.7% 2.50% Egypt - 339 -
- - 339 24 - - 24 300 0.2% 0.00% Estonia 50 497 - - - 547 44 - - 44 552 0.3% 1.50% Finland 329 3,165 - - - 3,493 207 - - 207 2,591 1.3% 0.00% France 3,196 14,438 - - 1,533 19,167 1,247 - 354 1,601
20,013 10.3% 1.00% Georgia - 302 - - - 302 29 - - 29 366 0.2% 0.00% Germany 1,361 17,270 - - 658 19,289 934 - 358 1,292 16,148 8.3% 0.75% Greece 315 743 - - - 1,058 88 - - 88 1,099 0.6% 0.00% Guernsey
146 0 - - - 146 66 - - 66 831 0.4% 0.00% Honduras - 8 - - - 8 0 - - 0 3 0.0% 0.00% Hungary 6 590 - - - 595 25 - - 25 316 0.2% 0.50% Iceland 5 417 - - - 422 17 - - 17 210 0.1% 2.50% Ireland
425 1,918 - - 377 2,721 197 - 5 202 2,531 1.3% 1.50% Israel 18 1,627 - - - 1,645 109 - - 109 1,366 0.7% 0.00% Italy 1,017 25,741 - - 2,591 29,349 1,248 - 431 1,679 20,993 10.8% 0.00% Japan - 57 - - -
57 1 - - 1 16 0.0% 0.00% Jersey 303 3 - - - 306 200 - - 200 2,499 1.3% 0.00% Jordan - 404 - - - 404 48 - - 48 606 0.3% 0.00% Kazakhstan - 240 - - - 240 15 - - 15 182 0.1% 0.00% Kenya - 20 - -
- 20 2 - - 2 23 0.0% 0.00% Latvia 3 216 - - - 219 9 - - 9 108 0.1% 0.50% Lithuania 41 427 - - - 468 26 - - 26 327 0.2% 1.00% Luxembourg 24 8,929 7,783 - - 54,510 71,223 2,928 - 811 3,739 46,735
24.1% 0.50% Malta - 12 - - - 12 1 - - 1 14 0.0% 0.00% Mauritius 604 156 - - - 760 291 - - 291 3,632 1.9% 0.00% Mexico - 82 - - - 82 20 - - 20 247 0.1% 0.00% 24 The own funds requirements for Luxembourg
are calculated including exposures to securitisations for which information to allocate the underlying exposures to the country of the obligor is not available or the effort to identify such place would be disproportionate in accordance with Article
4 of Commission Delegated Regulation (EU) No 1152/2014.
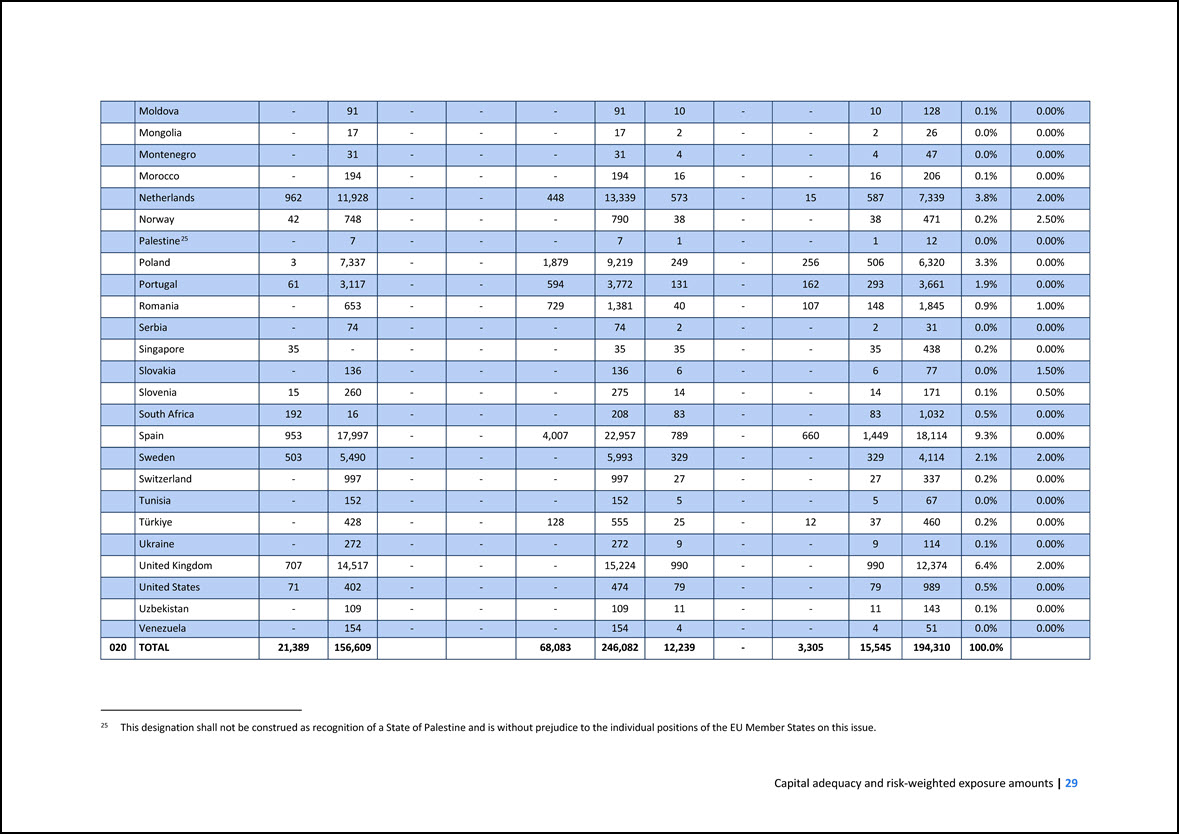
Moldova - 91 - - - 91 10 - - 10 128 0.1% 0.00% Mongolia - 17 - - - 17 2 - - 2 26 0.0% 0.00% Montenegro - 31 - - - 31 4 - - 4
47 0.0% 0.00% Morocco - 194 - - - 194 16 - - 16 206 0.1% 0.00% Netherlands 962 11,928 - - 448 13,339 573 - 15 587 7,339 3.8% 2.00% Norway 42 748 - - - 790 38 - - 38 471 0.2% 2.50% Palestine 25 - 7
- - - 7 1 - - 1 12 0.0% 0.00% Poland 3 7,337 - - 1,879 9,219 249 - 256 506 6,320 3.3% 0.00% Portugal 61 3,117 - - 594 3,772 131 - 162 293 3,661 1.9% 0.00% Romania - 653 - - 729 1,381 40 - 107 148
1,845 0.9% 1.00% Serbia - 74 - - - 74 2 - - 2 31 0.0% 0.00% Singapore 35 - - - - 35 35 - - 35 438 0.2% 0.00% Slovakia - 136 - - - 136 6 - - 6 77 0.0% 1.50% Slovenia 15 260 - - - 275 14 - -
14 171 0.1% 0.50% South Africa 192 16 - - - 208 83 - - 83 1,032 0.5% 0.00% Spain 953 17,997 - - 4,007 22,957 789 - 660 1,449 18,114 9.3% 0.00% Sweden 503 5,490 - - - 5,993 329 - - 329 4,114 2.1% 2.00%
Switzerland - 997 - - - 997 27 - - 27 337 0.2% 0.00% Tunisia - 152 - - - 152 5 - - 5 67 0.0% 0.00% Türkiye - 428 - - 128 555 25 - 12 37 460 0.2% 0.00% Ukraine - 272 - - - 272 9 - - 9 114 0.1%
0.00% United Kingdom 707 14,517 - - - 15,224 990 - - 990 12,374 6.4% 2.00% United States 71 402 - - - 474 79 - - 79 989 0.5% 0.00% Uzbekistan - 109 - - - 109 11 - - 11 143 0.1% 0.00% Venezuela - 154
- - - 154 4 - - 4 51 0.0% 0.00% 020 TOTAL 21,389 156,609 68,083 246,082 12,239 - 3,305 15,545 194,310 100.0% 25 This designation shall not be construed as recognition of a State of Palestine and is without prejudice to the
individual positions of the EU Member States on this issue.
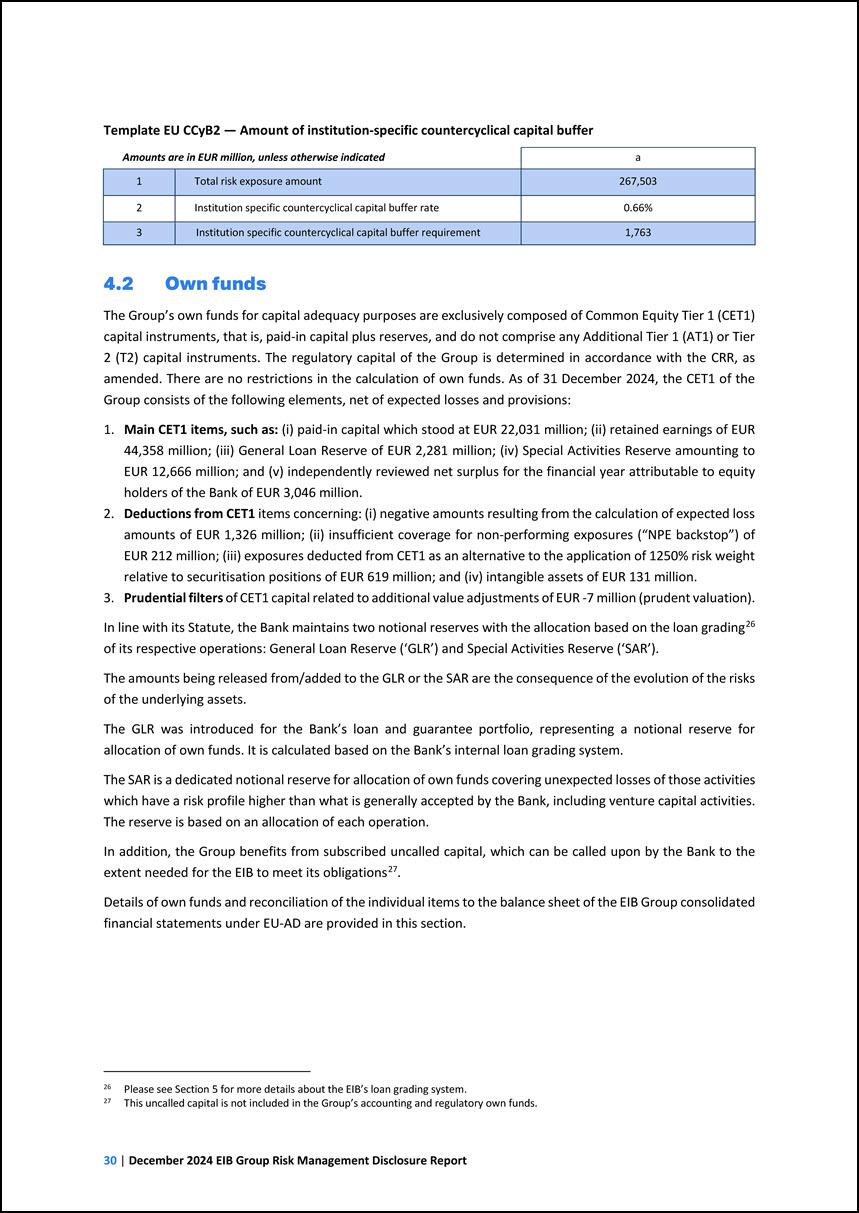
Template EU CCyB2 — Amount of institution-specific countercyclical capital buffer Amounts are in EUR million, unless otherwise indicated a 1 Total risk exposure
amount 267,503 2 Institution specific countercyclical capital buffer rate 0.66% 3 Institution specific countercyclical capital buffer requirement 1,763 4.2 Own funds The Group’s own funds for capital adequacy purposes are exclusively
composed of Common Equity Tier 1 (CET1) capital instruments, that is, paid-in capital plus reserves, and do not comprise any Additional Tier 1 (AT1) or Tier 2 (T2) capital instruments. The regulatory capital of the Group is determined in accordance
with the CRR, as amended. There are no restrictions in the calculation of own funds. As of 31 December 2024, the CET1 of the Group consists of the following elements, net of expected losses and provisions: 1. Main CET1 items, such as: (i) paid-in
capital which stood at EUR 22,031 million; (ii) retained earnings of EUR 44,358 million; (iii) General Loan Reserve of EUR 2,281 million; (iv) Special Activities Reserve amounting to EUR 12,666 million; and (v) independently reviewed net surplus for
the financial year attributable to equity holders of the Bank of EUR 3,046 million. 2. Deductions from CET1 items concerning: (i) negative amounts resulting from the calculation of expected loss amounts of EUR 1,326 million; (ii) insufficient
coverage for non-performing exposures (“NPE backstop”) of EUR 212 million; (iii) exposures deducted from CET1 as an alternative to the application of 1250% risk weight relative to securitisation positions of EUR 619 million; and (iv) intangible
assets of EUR 131 million. 3. Prudential filters of CET1 capital related to additional value adjustments of EUR -7 million (prudent valuation). In line with its Statute, the Bank maintains two notional reserves with the allocation based on the loan
grading26 of its respective operations: General Loan Reserve (‘GLR’) and Special Activities Reserve (‘SAR’). 26 Please see Section 5 for more details about the EIB’s loan grading system. The amounts being released from/added to the GLR or the SAR
are the consequence of the evolution of the risks of the underlying assets. The GLR was introduced for the Bank’s loan and guarantee portfolio, representing a notional reserve for allocation of own funds. It is calculated based on the Bank’s
internal loan grading system. The SAR is a dedicated notional reserve for allocation of own funds covering unexpected losses of those activities which have a risk profile higher than what is generally accepted by the Bank, including venture capital
activities. The reserve is based on an allocation of each operation. In addition, the Group benefits from subscribed uncalled capital, which can be called upon by the Bank to the extent needed for the EIB to meet its obligations27. 27 This uncalled
capital is not included in the Group’s accounting and regulatory own funds. Details of own funds and reconciliation of the individual items to the balance sheet of the EIB Group consolidated financial statements under EU-AD are provided in this
section.
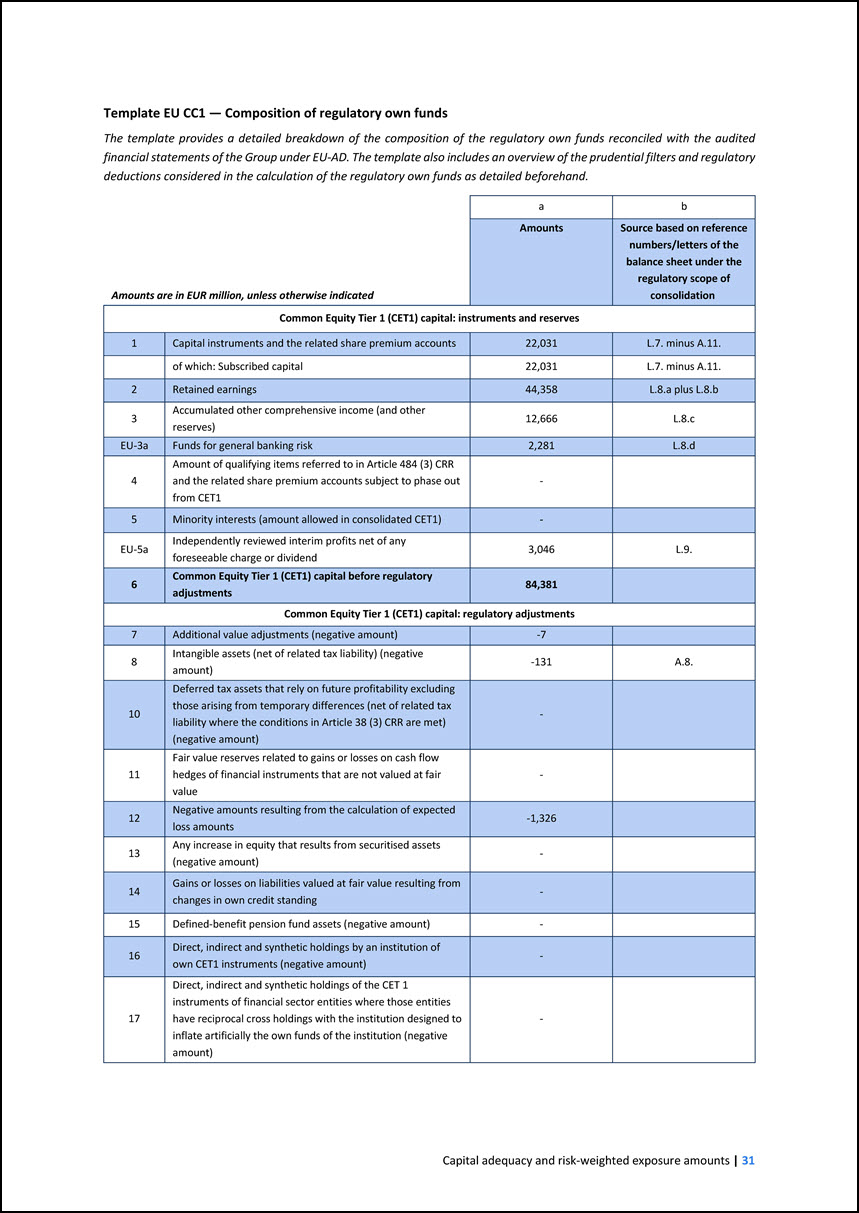
Template EU CC1 — Composition of regulatory own funds The template provides a detailed breakdown of the composition of the regulatory own funds reconciled with the
audited financial statements of the Group under EU-AD. The template also includes an overview of the prudential filters and regulatory deductions considered in the calculation of the regulatory own funds as detailed beforehand. Amounts are in EUR
million, unless otherwise indicated a b Amounts Source based on reference numbers/letters of the balance sheet under the regulatory scope of consolidation Common Equity Tier 1 (CET1) capital: instruments and reserves 1 Capital instruments and
the related share premium accounts 22,031 L.7. minus A.11. of which: Subscribed capital 22,031 L.7. minus A.11. 2 Retained earnings 44,358 L.8.a plus L.8.b 3 Accumulated other comprehensive income (and other reserves) 12,666 L.8.c
EU-3a Funds for general banking risk 2,281 L.8.d 4 Amount of qualifying items referred to in Article 484 (3) CRR and the related share premium accounts subject to phase out from CET1 - 5 Minority interests (amount allowed in consolidated
CET1) - EU-5a Independently reviewed interim profits net of any foreseeable charge or dividend 3,046 L.9. 6 Common Equity Tier 1 (CET1) capital before regulatory adjustments 84,381 Common Equity Tier 1 (CET1) capital: regulatory
adjustments 7 Additional value adjustments (negative amount) -7 8 Intangible assets (net of related tax liability) (negative amount) -131 A.8. 10 Deferred tax assets that rely on future profitability excluding those arising from temporary
differences (net of related tax liability where the conditions in Article 38 (3) CRR are met) (negative amount) - 11 Fair value reserves related to gains or losses on cash flow hedges of financial instruments that are not valued at fair value
- 12 Negative amounts resulting from the calculation of expected loss amounts -1,326 13 Any increase in equity that results from securitised assets (negative amount) - 14 Gains or losses on liabilities valued at fair value resulting from
changes in own credit standing - 15 Defined-benefit pension fund assets (negative amount) - 16 Direct, indirect and synthetic holdings by an institution of own CET1 instruments (negative amount) - 17 Direct, indirect and synthetic
holdings of the CET 1 instruments of financial sector entities where those entities have reciprocal cross holdings with the institution designed to inflate artificially the own funds of the institution (negative amount) -
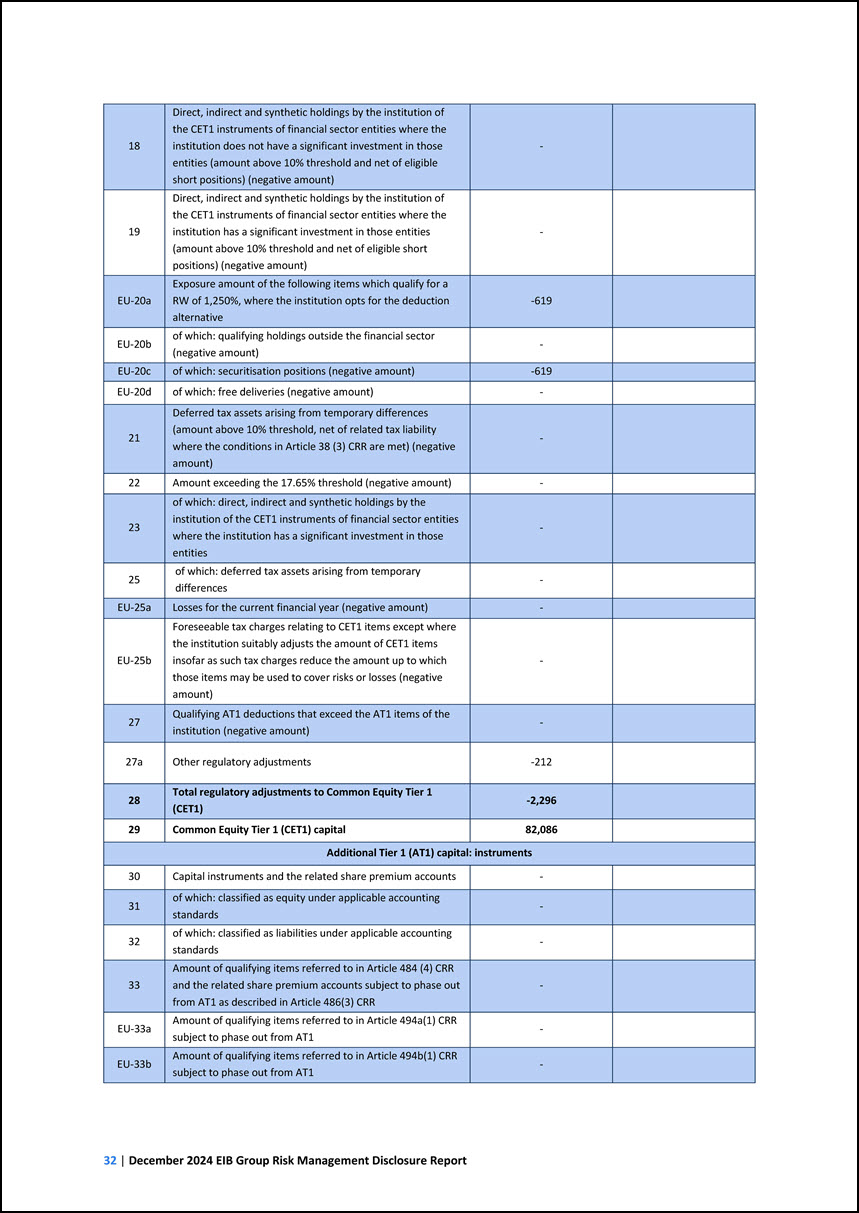
18 Direct, indirect and synthetic holdings by the institution of the CET1 instruments of financial sector entities where the institution does not have a significant
investment in those entities (amount above 10% threshold and net of eligible short positions) (negative amount) - 19 Direct, indirect and synthetic holdings by the institution of the CET1 instruments of financial sector entities where the
institution has a significant investment in those entities (amount above 10% threshold and net of eligible short positions) (negative amount) - EU-20a Exposure amount of the following items which qualify for a RW of 1,250%, where the institution
opts for the deduction alternative -619 EU-20b of which: qualifying holdings outside the financial sector (negative amount) - EU-20c of which: securitisation positions (negative amount) -619 EU-20d of which: free deliveries (negative
amount) - 21 Deferred tax assets arising from temporary differences (amount above 10% threshold, net of related tax liability where the conditions in Article 38 (3) CRR are met) (negative amount) - 22 Amount exceeding the 17.65% threshold
(negative amount) - 23 of which: direct, indirect and synthetic holdings by the institution of the CET1 instruments of financial sector entities where the institution has a significant investment in those entities - 25 of which: deferred tax
assets arising from temporary differences - EU-25a Losses for the current financial year (negative amount) - EU-25b Foreseeable tax charges relating to CET1 items except where the institution suitably adjusts the amount of CET1 items insofar
as such tax charges reduce the amount up to which those items may be used to cover risks or losses (negative amount) - 27 Qualifying AT1 deductions that exceed the AT1 items of the institution (negative amount) - 27a Other regulatory
adjustments -212 28 Total regulatory adjustments to Common Equity Tier 1 (CET1) -2,296 29 Common Equity Tier 1 (CET1) capital 82,086 Additional Tier 1 (AT1) capital: instruments 30 Capital instruments and the related share premium
accounts - 31 of which: classified as equity under applicable accounting standards - 32 of which: classified as liabilities under applicable accounting standards - 33 Amount of qualifying items referred to in Article 484 (4) CRR and the
related share premium accounts subject to phase out from AT1 as described in Article 486(3) CRR - EU-33a Amount of qualifying items referred to in Article 494a(1) CRR subject to phase out from AT1 - EU-33b Amount of qualifying items referred
to in Article 494b(1) CRR subject to phase out from AT1 -
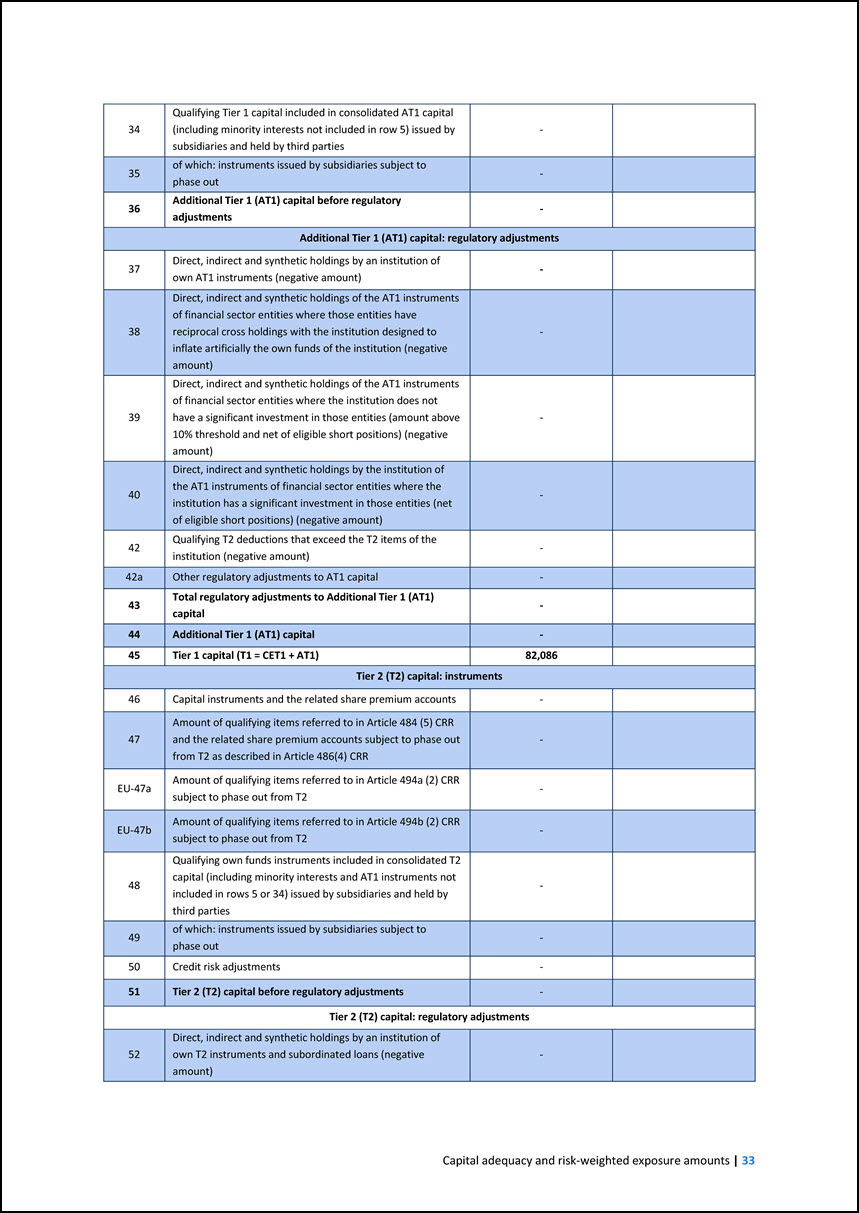
34 Qualifying Tier 1 capital included in consolidated AT1 capital (including minority interests not included in row 5) issued by subsidiaries and held by third
parties - 35 of which: instruments issued by subsidiaries subject to phase out - 36 Additional Tier 1 (AT1) capital before regulatory adjustments - Additional Tier 1 (AT1) capital: regulatory adjustments 37 Direct, indirect and
synthetic holdings by an institution of own AT1 instruments (negative amount) - 38 Direct, indirect and synthetic holdings of the AT1 instruments of financial sector entities where those entities have reciprocal cross holdings with the
institution designed to inflate artificially the own funds of the institution (negative amount) - 39 Direct, indirect and synthetic holdings of the AT1 instruments of financial sector entities where the institution does not have a significant
investment in those entities (amount above 10% threshold and net of eligible short positions) (negative amount) - 40 Direct, indirect and synthetic holdings by the institution of the AT1 instruments of financial sector entities where the
institution has a significant investment in those entities (net of eligible short positions) (negative amount) - 42 Qualifying T2 deductions that exceed the T2 items of the institution (negative amount) - 42a Other regulatory adjustments to
AT1 capital - 43 Total regulatory adjustments to Additional Tier 1 (AT1) capital - 44 Additional Tier 1 (AT1) capital - 45 Tier 1 capital (T1 = CET1 + AT1) 82,086 Tier 2 (T2) capital: instruments 46 Capital instruments and the
related share premium accounts - 47 Amount of qualifying items referred to in Article 484 (5) CRR and the related share premium accounts subject to phase out from T2 as described in Article 486(4) CRR - EU-47a Amount of qualifying items
referred to in Article 494a (2) CRR subject to phase out from T2 - EU-47b Amount of qualifying items referred to in Article 494b (2) CRR subject to phase out from T2 - 48 Qualifying own funds instruments included in consolidated T2 capital
(including minority interests and AT1 instruments not included in rows 5 or 34) issued by subsidiaries and held by third parties - 49 of which: instruments issued by subsidiaries subject to phase out - 50 Credit risk adjustments - 51
Tier 2 (T2) capital before regulatory adjustments - Tier 2 (T2) capital: regulatory adjustments 52 Direct, indirect and synthetic holdings by an institution of own T2 instruments and subordinated loans (negative amount) -
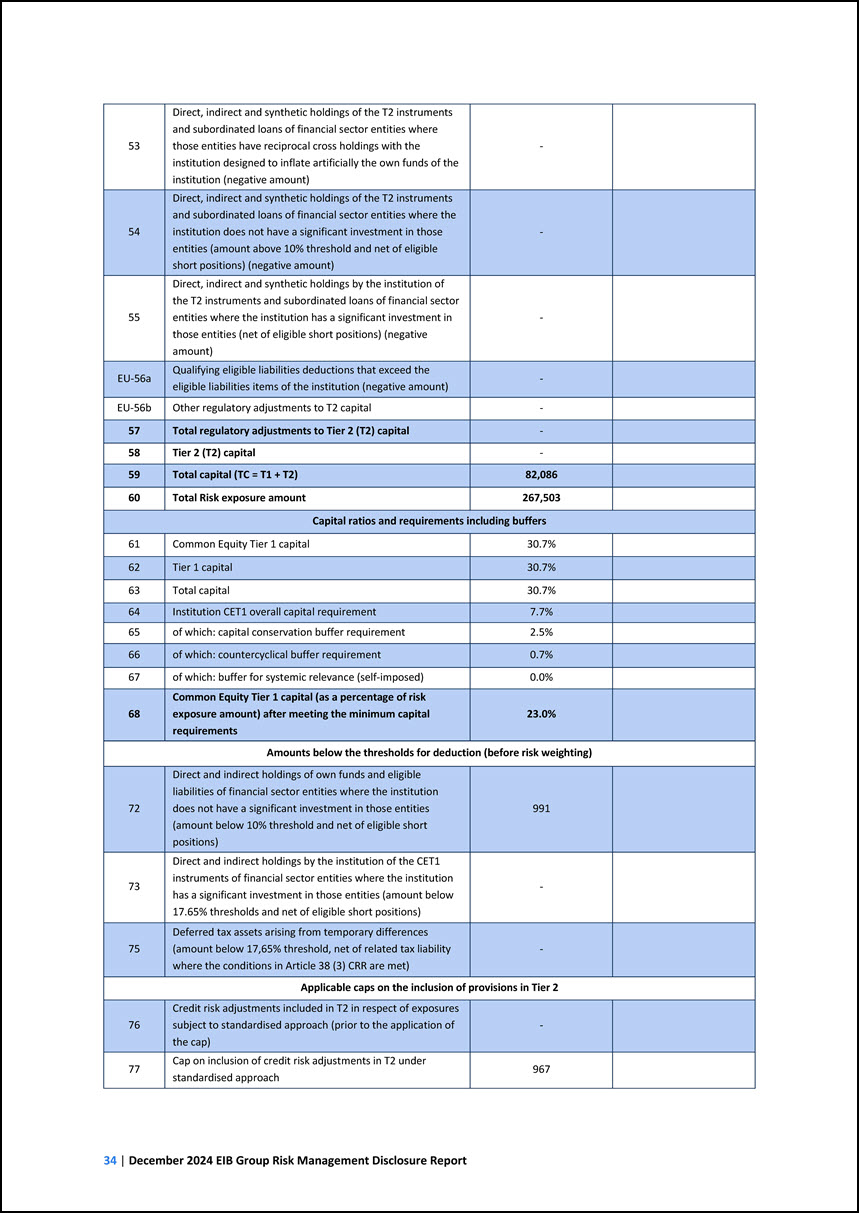
53 Direct, indirect and synthetic holdings of the T2 instruments and subordinated loans of financial sector entities where those entities have reciprocal cross
holdings with the institution designed to inflate artificially the own funds of the institution (negative amount) - 54 Direct, indirect and synthetic holdings of the T2 instruments and subordinated loans of financial sector entities where the
institution does not have a significant investment in those entities (amount above 10% threshold and net of eligible short positions) (negative amount) - 55 Direct, indirect and synthetic holdings by the institution of the T2 instruments and
subordinated loans of financial sector entities where the institution has a significant investment in those entities (net of eligible short positions) (negative amount) - EU-56a Qualifying eligible liabilities deductions that exceed the eligible
liabilities items of the institution (negative amount) - EU-56b Other regulatory adjustments to T2 capital - 57 Total regulatory adjustments to Tier 2 (T2) capital - 58 Tier 2 (T2) capital - 59 Total capital (TC = T1 + T2) 82,086
60 Total Risk exposure amount 267,503 Capital ratios and requirements including buffers 61 Common Equity Tier 1 capital 30.7% 62 Tier 1 capital 30.7% 63 Total capital 30.7% 64 Institution CET1 overall capital requirement 7.7% 65
of which: capital conservation buffer requirement 2.5% 66 of which: countercyclical buffer requirement 0.7% 67 of which: buffer for systemic relevance (self-imposed) 0.0% 68 Common Equity Tier 1 capital (as a percentage of risk exposure
amount) after meeting the minimum capital requirements 23.0% Amounts below the thresholds for deduction (before risk weighting) 72 Direct and indirect holdings of own funds and eligible liabilities of financial sector entities where the
institution does not have a significant investment in those entities (amount below 10% threshold and net of eligible short positions) 991 73 Direct and indirect holdings by the institution of the CET1 instruments of financial sector entities
where the institution has a significant investment in those entities (amount below 17.65% thresholds and net of eligible short positions) - 75 Deferred tax assets arising from temporary differences (amount below 17,65% threshold, net of related
tax liability where the conditions in Article 38 (3) CRR are met) - Applicable caps on the inclusion of provisions in Tier 2 76 Credit risk adjustments included in T2 in respect of exposures subject to standardised approach (prior to the
application of the cap) - 77 Cap on inclusion of credit risk adjustments in T2 under standardised approach 967
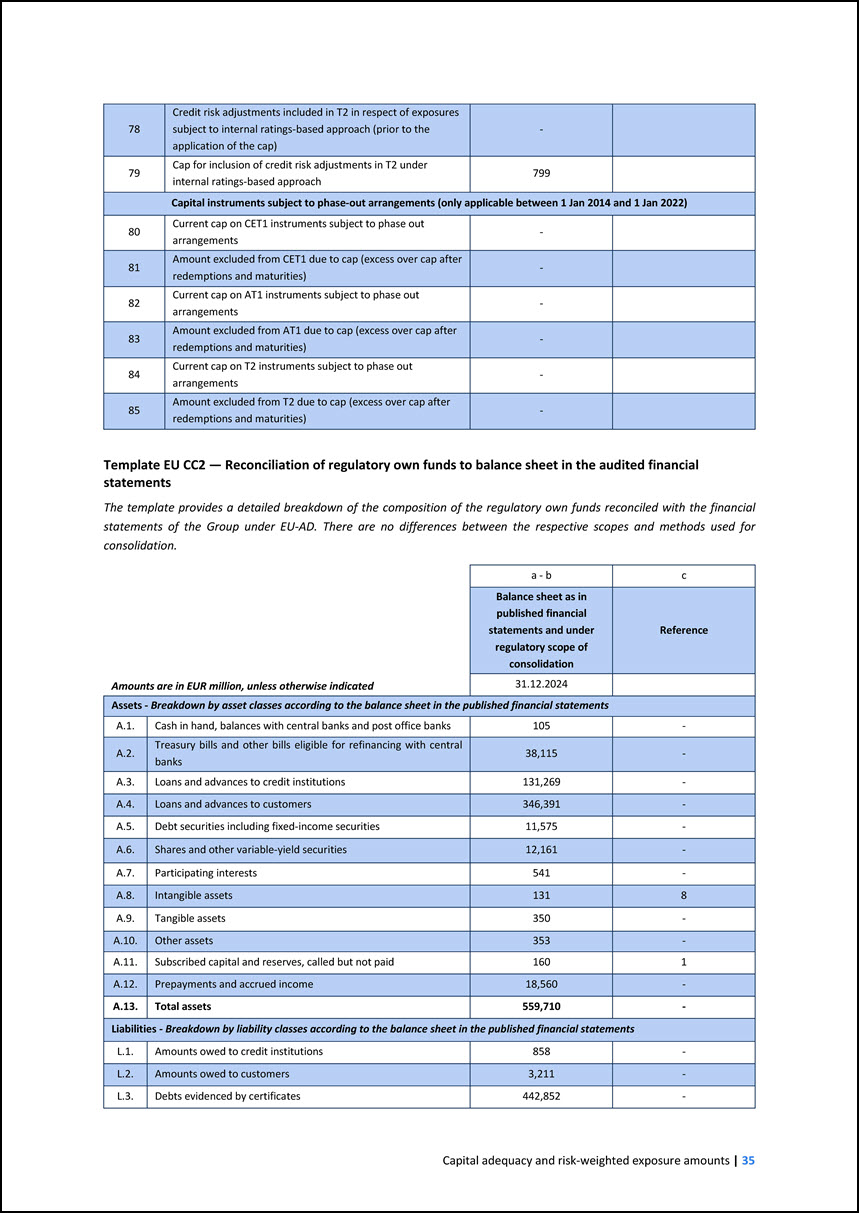
78 Credit risk adjustments included in T2 in respect of exposures subject to internal ratings-based approach (prior to the application of the cap) - 79 Cap for
inclusion of credit risk adjustments in T2 under internal ratings-based approach 799 Capital instruments subject to phase-out arrangements (only applicable between 1 Jan 2014 and 1 Jan 2022) 80 Current cap on CET1 instruments subject to phase
out arrangements - 81 Amount excluded from CET1 due to cap (excess over cap after redemptions and maturities) - 82 Current cap on AT1 instruments subject to phase out arrangements - 83 Amount excluded from AT1 due to cap (excess over cap
after redemptions and maturities) - 84 Current cap on T2 instruments subject to phase out arrangements - 85 Amount excluded from T2 due to cap (excess over cap after redemptions and maturities) - Template EU CC2 — Reconciliation of
regulatory own funds to balance sheet in the audited financial statements The template provides a detailed breakdown of the composition of the regulatory own funds reconciled with the financial statements of the Group under EU-AD. There are no
differences between the respective scopes and methods used for consolidation. Amounts are in EUR million, unless otherwise indicated a - b c Balance sheet as in published financial statements and under regulatory scope of consolidation
Reference 31.12.2024 Assets - Breakdown by asset classes according to the balance sheet in the published financial statements A.1. Cash in hand, balances with central banks and post office banks 105 - A.2. Treasury bills and other bills
eligible for refinancing with central banks 38,115 - A.3. Loans and advances to credit institutions 131,269 - A.4. Loans and advances to customers 346,391 - A.5. Debt securities including fixed-income securities 11,575 - A.6. Shares
and other variable-yield securities 12,161 - A.7. Participating interests 541 - A.8. Intangible assets 131 8 A.9. Tangible assets 350 - A.10. Other assets 353 - A.11. Subscribed capital and reserves, called but not paid 160 1
A.12. Prepayments and accrued income 18,560 - A.13. Total assets 559,710 - Liabilities - Breakdown by liability classes according to the balance sheet in the published financial statements L.1. Amounts owed to credit institutions 858 -
L.2. Amounts owed to customers 3,211 - L.3. Debts evidenced by certificates 442,852 -
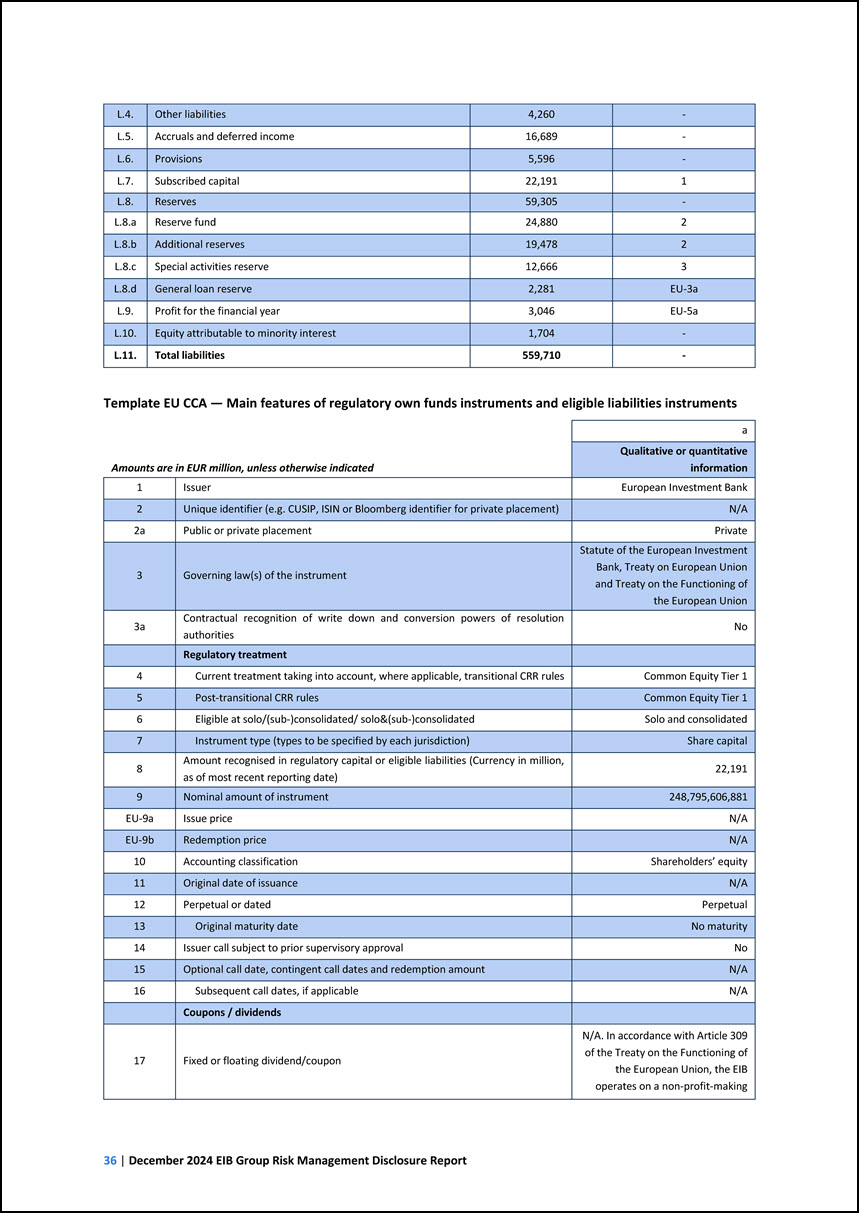
L.4. Other liabilities 4,260 - L.5. Accruals and deferred income 16,689 - L.6. Provisions 5,596 - L.7. Subscribed capital 22,191 1 L.8. Reserves
59,305 - L.8.a Reserve fund 24,880 2 L.8.b Additional reserves 19,478 2 L.8.c Special activities reserve 12,666 3 L.8.d General loan reserve 2,281 EU-3a L.9. Profit for the financial year 3,046 EU-5a L.10. Equity attributable
to minority interest 1,704 - L.11. Total liabilities 559,710 - Template EU CCA — Main features of regulatory own funds instruments and eligible liabilities instruments Amounts are in EUR million, unless otherwise indicated a Qualitative or
quantitative information 1 Issuer European Investment Bank 2 Unique identifier (e.g. CUSIP, ISIN or Bloomberg identifier for private placement) N/A 2a Public or private placement Private 3 Governing law(s) of the instrument Statute of the
European Investment Bank, Treaty on European Union and Treaty on the Functioning of the European Union 3a Contractual recognition of write down and conversion powers of resolution authorities No Regulatory treatment 4 Current treatment taking
into account, where applicable, transitional CRR rules Common Equity Tier 1 5 Post-transitional CRR rules Common Equity Tier 1 6 Eligible at solo/(sub-)consolidated/ solo&(sub-)consolidated Solo and consolidated 7 Instrument type (types
to be specified by each jurisdiction) Share capital 8 Amount recognised in regulatory capital or eligible liabilities (Currency in million, as of most recent reporting date) 22,191 9 Nominal amount of instrument 248,795,606,881 EU-9a Issue
price N/A EU-9b Redemption price N/A 10 Accounting classification Shareholders’ equity 11 Original date of issuance N/A 12 Perpetual or dated Perpetual 13 Original maturity date No maturity 14 Issuer call subject to prior
supervisory approval No 15 Optional call date, contingent call dates and redemption amount N/A 16 Subsequent call dates, if applicable N/A Coupons / dividends 17 Fixed or floating dividend/coupon N/A. In accordance with Article 309 of
the Treaty on the Functioning of the European Union, the EIB operates on a non-profit-making
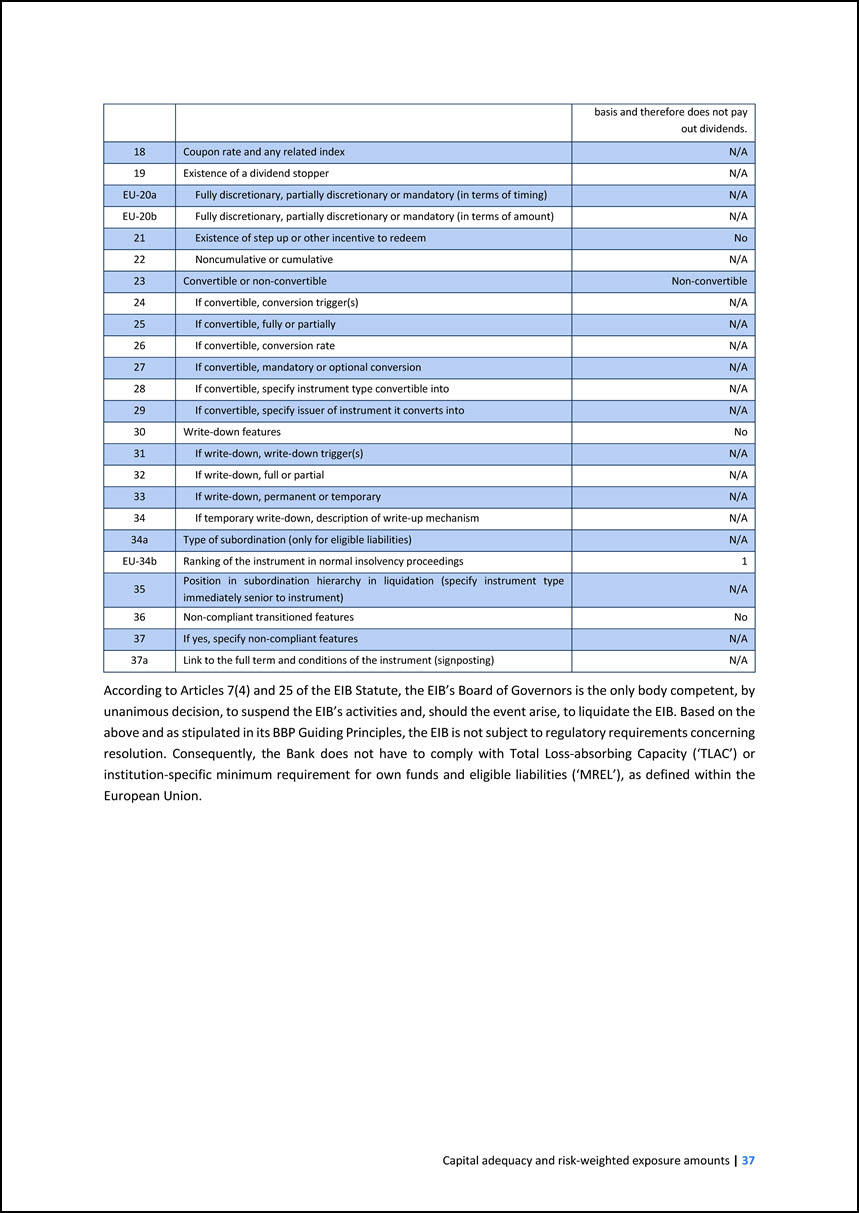
basis and therefore does not pay out dividends. 18 Coupon rate and any related index N/A 19 Existence of a dividend stopper N/A EU-20a Fully discretionary,
partially discretionary or mandatory (in terms of timing) N/A EU-20b Fully discretionary, partially discretionary or mandatory (in terms of amount) N/A 21 Existence of step up or other incentive to redeem No 22 Noncumulative or cumulative
N/A 23 Convertible or non-convertible Non-convertible 24 If convertible, conversion trigger(s) N/A 25 If convertible, fully or partially N/A 26 If convertible, conversion rate N/A 27 If convertible, mandatory or optional conversion
N/A 28 If convertible, specify instrument type convertible into N/A 29 If convertible, specify issuer of instrument it converts into N/A 30 Write-down features No 31 If write-down, write-down trigger(s) N/A 32 If write-down, full or
partial N/A 33 If write-down, permanent or temporary N/A 34 If temporary write-down, description of write-up mechanism N/A 34a Type of subordination (only for eligible liabilities) N/A EU-34b Ranking of the instrument in normal insolvency
proceedings 1 35 Position in subordination hierarchy in liquidation (specify instrument type immediately senior to instrument) N/A 36 Non-compliant transitioned features No 37 If yes, specify non-compliant features N/A 37a Link to the
full term and conditions of the instrument (signposting) N/A According to Articles 7(4) and 25 of the EIB Statute, the EIB’s Board of Governors is the only body competent, by unanimous decision, to suspend the EIB’s activities and, should the
event arise, to liquidate the EIB. Based on the above and as stipulated in its BBP Guiding Principles, the EIB is not subject to regulatory requirements concerning resolution. Consequently, the Bank does not have to comply with Total Loss-absorbing
Capacity (‘TLAC’) or institution-specific minimum requirement for own funds and eligible liabilities (‘MREL’), as defined within the European Union.
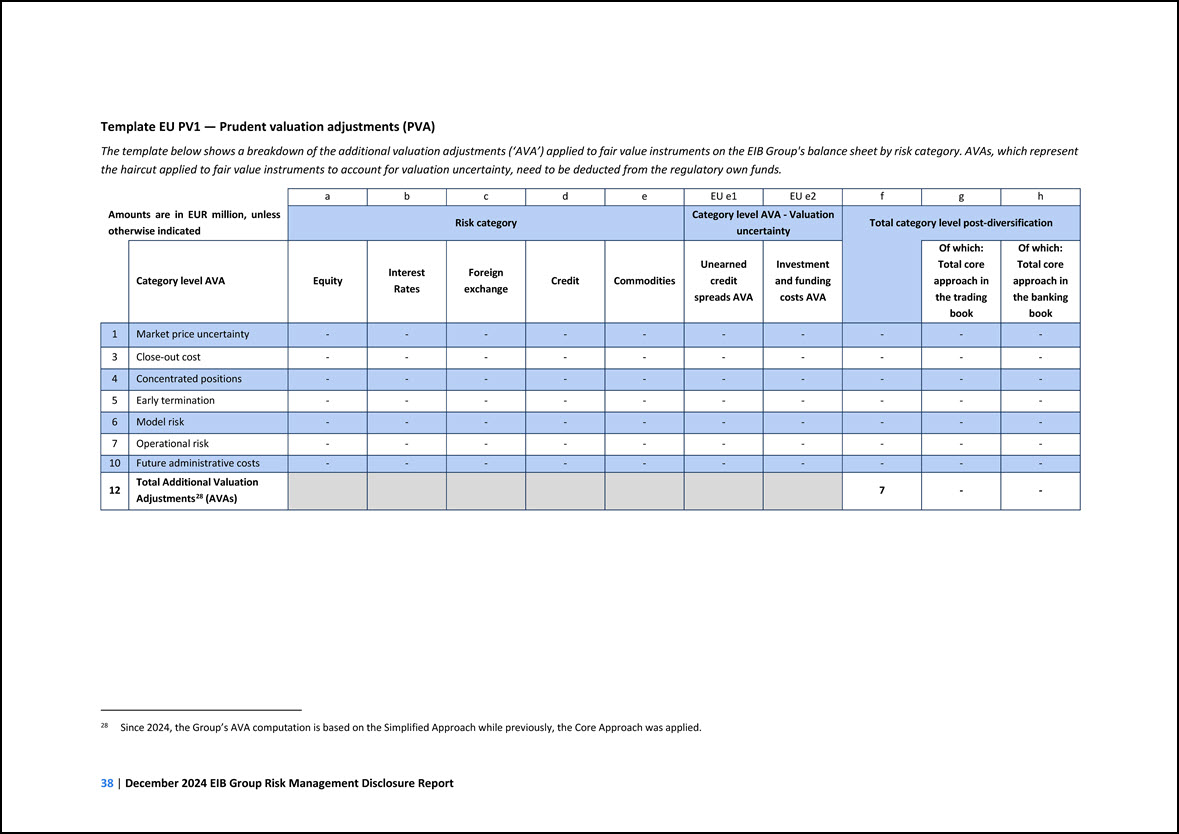
Template EU PV1 — Prudent valuation adjustments (PVA) The template below shows a breakdown of the additional valuation adjustments (‘AVA’) applied to fair value
instruments on the EIB Group's balance sheet by risk category. AVAs, which represent the haircut applied to fair value instruments to account for valuation uncertainty, need to be deducted from the regulatory own funds. Amounts are in EUR million,
unless otherwise indicated a b c d e EU e1 EU e2 f g h Risk category Category level AVA - Valuation uncertainty Total category level post-diversification Category level AVA Equity Interest Rates Foreign exchange Credit
Commodities Unearned credit spreads AVA Investment and funding costs AVA Of which: Total core approach in the trading book Of which: Total core approach in the banking book 1 Market price uncertainty - - - - - - - - - - 3 Close-out
cost - - - - - - - - - - 4 Concentrated positions - - - - - - - - - - 5 Early termination - - - - - - - - - - 6 Model risk - - - - - - - - - - 7 Operational risk - - - - - - - - - - 10
Future administrative costs - - - - - - - - - - 12 Total Additional Valuation Adjustments28 (AVAs) 7 - - 28 Since 2024, the Group’s AVA computation is based on the Simplified Approach while previously, the Core Approach was
applied.
5 CREDIT RISK 5.1 Internal framework for credit risk management Credit risk is the risk that the economic value and/or earnings of the EIBG decline due to the
uncertainty with respect to the counterparties’ ability or willingness to meet the terms of the contractual obligations. This section does not cover credit risk arising from over-the-counter (OTC) derivatives transactions and securities financing
transactions, which is defined as counterparty credit risk in this report and is covered in Chapter 6. Credit exposures on securitisation positions are included in this chapter only when indicated but are covered in more detail in Chapter 7. The
credit risk management process consists of identifying, analysing, measuring and reporting the risks incurred by the Group in its operations and making decisions to effectively manage these risks. The following sections describe the credit risk
assessment processes of the EIB and of the EIF. EIB’s credit risk responsibilities and processes As far as the lending cycle is concerned, the main credit risk responsibilities within the first and second line of defence are divided between
GR&C, the Operations Directorate (‘OPS’), the EIB Global Directorate (‘GLO‘) and the Portfolio Management and Monitoring Directorate (‘PMM’). As a second line of defence, GR&C is responsible for setting the credit risk management framework
for the origination and monitoring of lending exposures. In addition, GR&C provides an independent second line of defence opinion in relation to credit risk decision-making within the entire credit cycle, including loan proposal, credit risk
related contractual amendments, restructuring, validation of specific provisions, Early Warning Signals/Non Performing Exposures (EWS/NPE) and forbearance status, counterparty internal rating based on an established framework, LGD (Loss Given
Default) and counterparty climate risk assessment. OPS/GLO are responsible for the origination of new loans, due diligence, financial analysis of the borrowing entities and the evaluation of the structure of the operations using quantitative and
qualitative metrics with input from the Projects Directorate (‘PJ‘) and the Legal Directorate (‘JU‘). PMM monitors the credit quality of lending operations, in particular the borrowers’ and guarantors' creditworthiness, the value of securities and
collateral received, management of event resolutions, etc. together with the assessment and negotiation of restructuring operations within a dedicated restructuring team. Credit risk guidelines GR&C, in consultation with other services within
the Bank, is responsible for the credit risk guidelines setting the key principles for origination of new lending exposures (including, amongst others, minimum qualifying criteria for borrowers and guarantors in lending operations, acceptable
structure of the operations, acceptable securities, risk pricing, etc.), ongoing monitoring of credit risk at individual exposure level throughout the loan cycle and the identification and monitoring of EWS, NPE and forbearance exposures. Other
guidelines and internal policies relevant for the credit risk management of the Bank include the various internal policies referred to in sections 5.4, 5.5 and 13.3. The Bank’s MC approves changes to the credit risk guidelines.
Product-specific guidelines for complex/higher-risk products In order to ensure that the additional risk involved in complex or structured lending transactions is
adequately analysed, quantified and mitigated, specific detailed guidelines have been developed in respect of certain types of operations complementing the general credit risk guidelines, presented above. The following types of operations are covered
by specific sections of the guidelines: • Subordinated corporate lending and corporate hybrids. • Project finance transactions. • Loan substitutes • Risk-sharing operations. Lending outside the European Union As lending outside the European Union
often implies a higher risk profile than lending operations within the Union, the Bank established dedicated credit risk guidelines for such transactions to ensure that they are in line with the Bank’s risk appetite and reflect mandates that the EIB
receives. Similarly to all other transactions, the EIB estimates expected losses taking into account a counterparty’s internal rating and a transaction’s contractual features and assigns a loan grading to non-EU lending transactions. The EIB also
takes into account the credit support provided by the European Union or Member States, as applicable. Beyond capturing the credit strength of a potential counterparty, EIB risk assessment also considers local and country jurisdiction and currency
circumstances, which affect particular market environments, such as for emerging market investments. General mandate risk principles for Impact Finance Mandates Impact Finance Mandates are mandates generally with full risk coverage29 for the Bank
and whereby implementation and the risk spectrum are beyond the Bank’s rules, policies and procedures applied to operations it carries out at its own risk. As a consequence, the standard credit risk guidelines do not apply and the Bank has codified
general mandate credit risk principles and follows specific qualitative credit risk assessment procedures agreed between the Bank and the mandators. Exposures under Impact Finance Mandates are carved out from the application of BBP and are
consequently excluded from the templates on credit risk quality. 29 On an ad-hoc basis, the general mandate credit risk principles apply to specific Impact Finance sub-portfolios under the InvestEU mandate, where the EIB takes a limited senior
risk. GR&C has also established specific guidelines for the management and monitoring of existing credit exposures under Impact Finance Mandates. The lending process: contractual guidelines A legal analysis is performed to determine whether a
counterparty can comply with the contractual standards. Legal framework Guidelines set out orientation points for the legal framework under which the Bank may lend and, in particular, aspects like the governing laws and jurisdictions for the
settlement of disputes which the Bank deems acceptable in view of its specific status as a multilateral financial institution owned by the Member States of the European Union.
Risk mitigation techniques In its credit risk guidelines, the Bank details its approach to credit risk mitigation, which is based on a robust due diligence process,
adequate levels of security and guarantees as well as protective clauses included in its loan agreements. Risk mitigation clauses are the contractual clauses included in the lending documents signed by the Bank and its counterparts. These documents
are, principally, the loan agreement and any guarantee, security or collateral agreement. Risk mitigating clauses may include, amongst others, specific clauses making the disbursement of the loan conditional on certain requirements being satisfied,
undertakings (covenants) given by the counterparty to the Bank (such as financial covenants or Loss of Rating clauses vis-à-vis the borrower or guarantor) and events of default enabling the Bank to take certain steps on the occurrence of a credit
event post-signature. These clauses are designed to protect the Bank against the deterioration of a borrower’s credit risk and to enable it to act to preserve its position upon the occurrence of any such event and reflect the nature of the
counterparty and other factors affecting the credit risk profile of the relevant operation. Acceptable counterparties Whether or not a given entity is acceptable to the Bank as a counterparty in a lending operation is determined on the basis of an
assessment of the entity using, amongst others, quantitative metrics but also relying on experience and expert judgment. The following key elements are taken into account: • Satisfaction of a Minimum Internal Rating (‘MIR’) requirement set on the
basis of the Bank’s Internal Rating Methodology; • Minimum Qualifying Status (‘MQS’) in case of the existence of a rating from a recognised credit rating agency; • Counterparty limits/thresholds; The lending process: counterparty exposure limits
Counterparty and portfolio limits The EIB Group monitors and manages single name concentration risk30 from a regulatory and internal point of view. 30 Including concentration risk arising from credit mitigation activities. From an internal point
of view, in order to ensure adequate diversification of credit exposures, the Bank places counterparty-based thresholds/limits on its maximum exposure31 to financial institutions, corporates, sub- sovereign public authorities and public sector
entities (as borrowers and/or guarantors). 31 The Bank’s consolidated exposure to the same counterparty, including lending, treasury and derivative exposures. Counterparty thresholds/limits are designed to keep lending exposures within a
pre-defined proportion of the Bank’s own funds or the counterparties’ own funds/operating revenue. Thresholds/limits can be set on a nominal or risk-adjusted basis, the latter based on the nature of the counterparty and the existence of external
guarantees or collateral provided as security for the relevant exposure. The Bank also has exposure limits for certain sectors of economic activity and has established thresholds to monitor its exposure in non-EU countries.
Regulatory large exposure limits In addition to the Bank’s own limits referred to above, and in adherence to BBP applicable to the EIB, the Group applies the
regulatory large exposure limits on the maximum exposure to a single client or a group of connected clients. EIB’s loan grading system The loan grading system is used for internal credit risk assessment of the EIB’s lending operations and is an
important part of the loan appraisal and monitoring process. A loan grading reflects the present value of the estimated level of the lifetime expected loss for that loan, this being the net present value of the product of the probability of default,
the loan exposure at risk and the loss given default. The loan grading system is used for the following purposes: • performance of quantitative assessment of lending risks; • indicator of credit risk variations for the purposes of prioritising
monitoring efforts; • description of the Bank’s loan portfolio quality at a given date; • benchmark for calculating the annual additions to the GLR and SAR; • input in risk pricing decisions. The following factors are used to determine a loan
grading: • The borrower’s creditworthiness: on the basis of an internal proposal by the first line of defence, GR&C independently reviews borrowers/guarantors and assesses their creditworthiness based on internal methodologies. In line with the
Basel III Internal Ratings Based approach adopted, the Bank has developed an internal rating methodology (‘IRM’) to determine the internal ratings of borrowers and guarantors. This is based on a set of scoring sheets specific to defined counterparty
types. • The default correlation: this quantifies the chances of simultaneous financial difficulties arising for both the borrower and the guarantor. The higher the correlation between the borrower’s and the guarantor’s default, the lower the value
of the guarantee and therefore the lower (worse) the loan grading. • The value of guarantee instruments and of securities: this value is assessed on the basis of a combination of the issuer’s creditworthiness and the type of instrument used. • The
applicable recovery rate: the amount assumed to be recovered following a default by the relevant counterparty expressed as a percentage of the relevant loan exposure. • The contractual framework: a sound contractual framework will add to the loan’s
quality and enhance its loan grading. • The duration of the loan or, more generally, the cash flows of the loan: all else being equal, the longer the loan, the higher the risk of incurring difficulties in servicing of the loan. Risk pricing
methodology The Bank has a risk pricing methodology, which ensures that the risk attached to any given operation is adequately remunerated. The level of risk pricing is based on a number of factors, including the loan grading assigned to the
relevant lending operation. EIF’s credit risk and related management The EIF’s credit risk arises mainly through its activity linked to debt products, which encompasses guarantees and securitisations. Credit risk management is based on a
three-lines-of-defence model which permeates all areas of
the EIF’s business functions and processes: (i) front office, (ii) risk management and compliance functions, and (iii) internal audit. The EIF has developed a sound
risk management framework for its Guarantee and Securitisation (G&S) business in order to analyse and monitor portfolio guarantees and structured finance transactions in line with common market practices. In the context of the risk assessment
process relating to its guarantees and securitisations, the Transaction and Mandate Risk (“T&MR”) division reviews each transaction proposal and assessment provided by the Guarantees, Securitisations and Inclusive Finance (“GS&IF”) department
in accordance with the EIF’s internal rules and procedures. To limit the concentration risk in the portfolio, the EIF has internal limits based on maximum exposure both at individual transaction and originator level. Transaction limits define the
maximum possible exposure dependent on underlying rating and weighted average life. Originator limits are applied to the respective originator’s position per country and exposure rating. Definition of default, past due and UTP Pursuant to Article
178 of the CRR, the Group’s definition of default, applicable to lending operations32 for regulatory purposes, is such that a default is considered to have occurred when either one or both of the two following conditions are met: 32 For treasury and
derivative operations, slightly different NPE conditions have been defined, which are based rather on contractual events or financial market practices. • the obligor is past due more than 90 days on any material obligation above a certain threshold
towards the EIB Group; and/or • the obligor is assessed as unlikely to pay (‘UTP’) its credit obligations in full towards the EIB Group, without realisation of collateral or security, regardless of the existence of any past due amount or the number
of days past due. An obligation for both accounting and regulatory purposes is considered as being “past due” when a contractual payment has not been met. A borrower is flagged as an NPE if it is past due more than 90 consecutive calendar days on
any material credit obligation to the EIB (unless considered as a technical default). Absolute (EUR 500) and relative (1% of the borrower’s exposure) materiality thresholds are taken into consideration while flagging 90 days past due. Since 2024,
the EIB has been implementing a framework for the quantification of unlikeliness to pay, based on a risk based approach. This quantification (UTP test) is based on a forward-looking liquidity assessment and aims at identifying concerns about the
counterparty’s ability to generate stable and sufficient cashflows to service debt. The UTP test, which could be triggered by various events, is performed in the following cases: • when a counterparty’s status combines an EWS SICR classification (as
defined below) and pre-defined internal rating threshold. Going forward, the UTP test is performed in case of a further deterioration in credit quality that could reasonably lead to an internal rating deterioration; • for lower rated counterparties,
when forbearance measures are being considered or the exposure is about to end its forbearance probation period; or • in case of general systemic/political or material events.
Early Warning Signals (‘EWS’) and Non-Performing Exposures (‘NPE’) During 2024, for its lending operations, the Bank continued the review and update of the EWS and NPE
processes following the adoption of relevant NPE requirements as best banking practice applicable to the EIB and defined in the internal EWS/NPE and Forbearance Guidelines. The EWS concept is intended to allow for early detection and prevention of
deteriorating credit quality counterparties/transactions. The Bank follows a two-tier EWS framework by identifying counterparties with a Significant Increase in Credit Risk (SICR) and not SICR based on the credit risk assessment performed and
specific backstop SICR events. NPEs, which are also relevant for accounting purposes, include loans, debt securities and off-balance sheet exposures that satisfy either one or both of the criteria from Article 178 of the CRR. Non-performing
exposures33 include defaulted and impaired exposures. Total NPEs are the sum of non-performing loans (‘NPL’), non- performing debt securities and non-performing off-balance sheet items. 33 The EIB Group adheres to the NPE/NPL regulatory requirements
approved, as BBP, subject to adaptations/non-applications, in line with its BBP Guiding Principles. Through the loan lifecycle, the responsible services monitor the exposure based on a dedicated EWS/NPE framework. The EWS and NPE process is
typically targeted at assessing and recording financial issues at the level of a counterparty; that is, it does not take into consideration any specificity of the EIB loan, security/collateral arrangements and portfolio guarantees. Both concepts are
operationalised through the activation/reversal of dedicated “triggers” reflecting the occurrence of specific credit events. The EWS/NPE portfolios are updated on a continuing basis throughout the year and reported to management. Exposures for
which there is an application of specific provisions, write-off, debt forgiveness, payment under guarantee, obligation on non-accrued status, or waiver of a material part of accrued interest or fees are classified as NPE. The reversal of an NPE
trigger can be initiated typically not before an established probation period, provided that a number of conditions are fulfilled, amongst others: the NPE event has been resolved; regular payments as per schedule; existing specific provisions fully
reversed; and stable financial situation of the counterparty without additional deterioration or unlikeliness to pay being identified. In case of forbearance measures are extended to an NPE counterparty, the exposures shall be considered to have
ceased being non-performing after a 12-month cure period has elapsed, provided there is no indication of unlikeliness to pay. The EIF has implemented the EWS and NPE concept applying specific triggers to its Guarantee and Securitisation (G&S)
business. Impairment provisions For accounting purposes, an operation (meaning a loan, a commitment such as a guarantee, a commitment to extend credit or another credit product) is considered for the determination of the need for a specific
impairment provision following the occurrence of one or more pre-defined impairment triggers derived from the EWS/NPE framework. Specific impairment provisions are recorded for impaired contracts. Within the Group, the determination of such
provisions is carried out at contract level. The corresponding impairment amount is equal to the expected unrecoverable amount, that is the difference between the gross carrying amount of the exposure and the expected recoverable amount. The specific
impairment provisions are further adjusted for the guarantee/loss coverage provided by mandators under portfolio guarantees so that, in certain circumstances, defaulted exposures might not be considered impaired due to the portfolio credit
enhancement provided to the
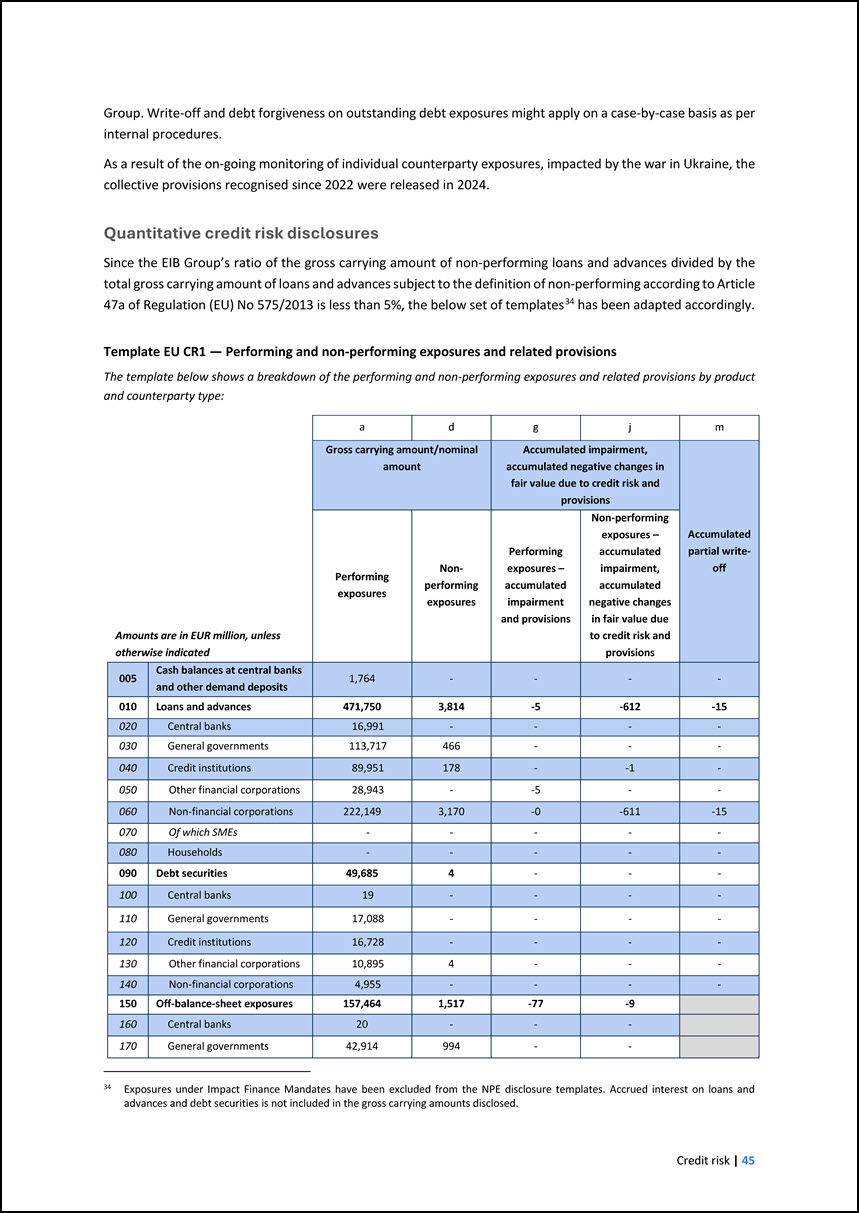
Group. Write-off and debt forgiveness on outstanding debt exposures might apply on a case-by-case basis as per internal procedures. As a result of the on-going
monitoring of individual counterparty exposures, impacted by the war in Ukraine, the collective provisions recognised since 2022 were released in 2024. Quantitative credit risk disclosures Since the EIB Group’s ratio of the gross carrying amount of
non-performing loans and advances divided by the total gross carrying amount of loans and advances subject to the definition of non-performing according to Article 47a of Regulation (EU) No 575/2013 is less than 5%, the below set of templates34 has
been adapted accordingly. 34 Exposures under Impact Finance Mandates have been excluded from the NPE disclosure templates. Accrued interest on loans and advances and debt securities is not included in the gross carrying amounts disclosed. Template
EU CR1 — Performing and non-performing exposures and related provisions The template below shows a breakdown of the performing and non-performing exposures and related provisions by product and counterparty type: Amounts are in EUR million, unless
otherwise indicated a d g j m Gross carrying amount/nominal amount Accumulated impairment, accumulated negative changes in fair value due to credit risk and provisions Accumulated partial write- off Performing exposures Non- performing
exposures Performing exposures – accumulated impairment and provisions Non-performing exposures – accumulated impairment, accumulated negative changes in fair value due to credit risk and provisions 005 Cash balances at central banks and other
demand deposits 1,764 - - - - 010 Loans and advances 471,750 3,814 -5 -612 -15 020 Central banks 16,991 - - - - 030 General governments 113,717 466 - - - 040 Credit institutions 89,951 178 - -1 - 050 Other financial
corporations 28,943 - -5 - - 060 Non-financial corporations 222,149 3,170 -0 -611 -15 070 Of which SMEs - - - - - 080 Households - - - - - 090 Debt securities 49,685 4 - - - 100 Central banks 19 - - - - 110
General governments 17,088 - - - - 120 Credit institutions 16,728 - - - - 130 Other financial corporations 10,895 4 - - - 140 Non-financial corporations 4,955 - - - - 150 Off-balance-sheet exposures 157,464 1,517 -77
-9 160 Central banks 20 - - - 170 General governments 42,914 994 - -
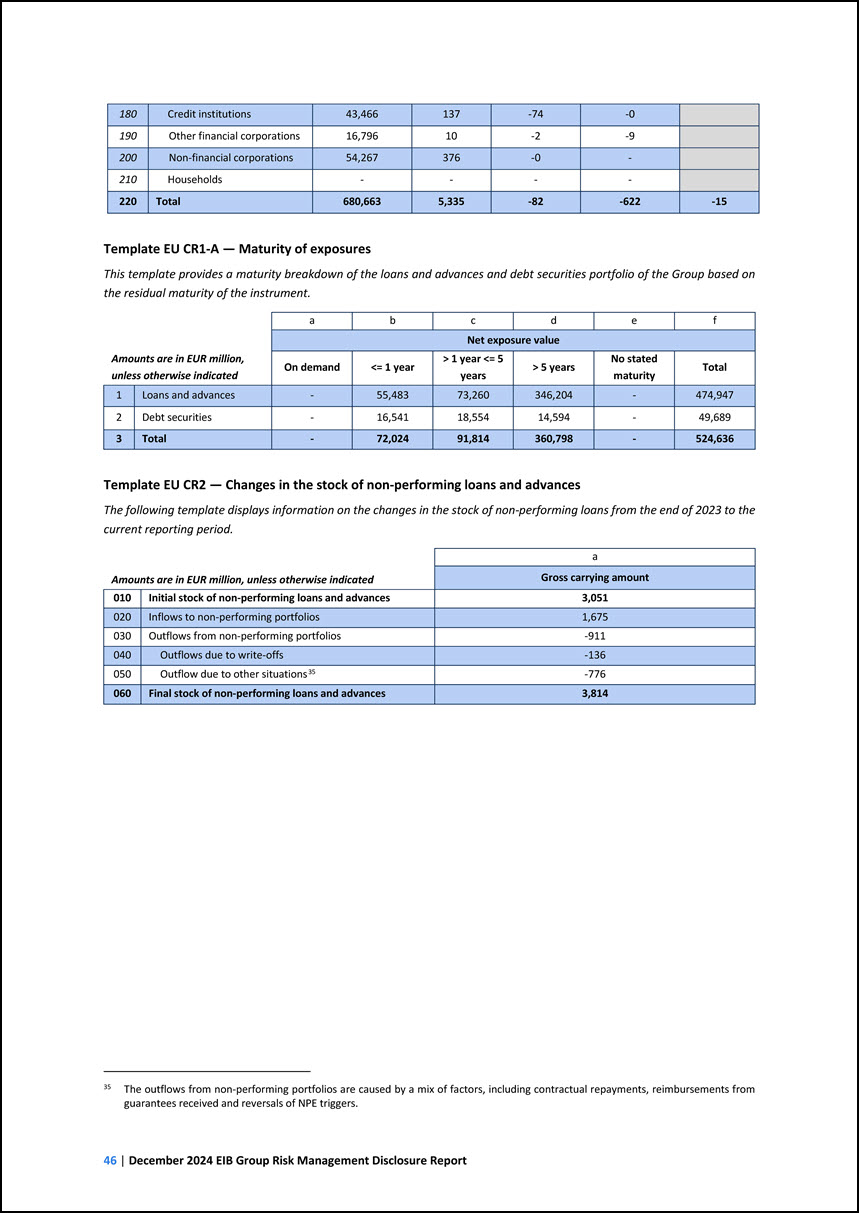
180 Credit institutions 43,466 137 -74 -0 190 Other financial corporations 16,796 10 -2 -9 200 Non-financial corporations 54,267 376 -0 - 210
Households - - - - 220 Total 680,663 5,335 -82 -622 -15 Template EU CR1-A — Maturity of exposures This template provides a maturity breakdown of the loans and advances and debt securities portfolio of the Group based on the residual
maturity of the instrument. Amounts are in EUR million, unless otherwise indicated a b c d e f Net exposure value On demand <= 1 year > 1 year <= 5 years > 5 years No stated maturity Total 1 Loans and advances - 55,483
73,260 346,204 - 474,947 2 Debt securities - 16,541 18,554 14,594 - 49,689 3 Total - 72,024 91,814 360,798 - 524,636 Template EU CR2 — Changes in the stock of non-performing loans and advances The following template displays
information on the changes in the stock of non-performing loans from the end of 2023 to the current reporting period. Amounts are in EUR million, unless otherwise indicated a Gross carrying amount 010 Initial stock of non-performing loans and
advances 3,051 020 Inflows to non-performing portfolios 1,675 030 Outflows from non-performing portfolios -911 040 Outflows due to write-offs -136 050 Outflow due to other situations35 -776 060 Final stock of non-performing loans and
advances 3,814 35 The outflows from non-performing portfolios are caused by a mix of factors, including contractual repayments, reimbursements from guarantees received and reversals of NPE triggers.
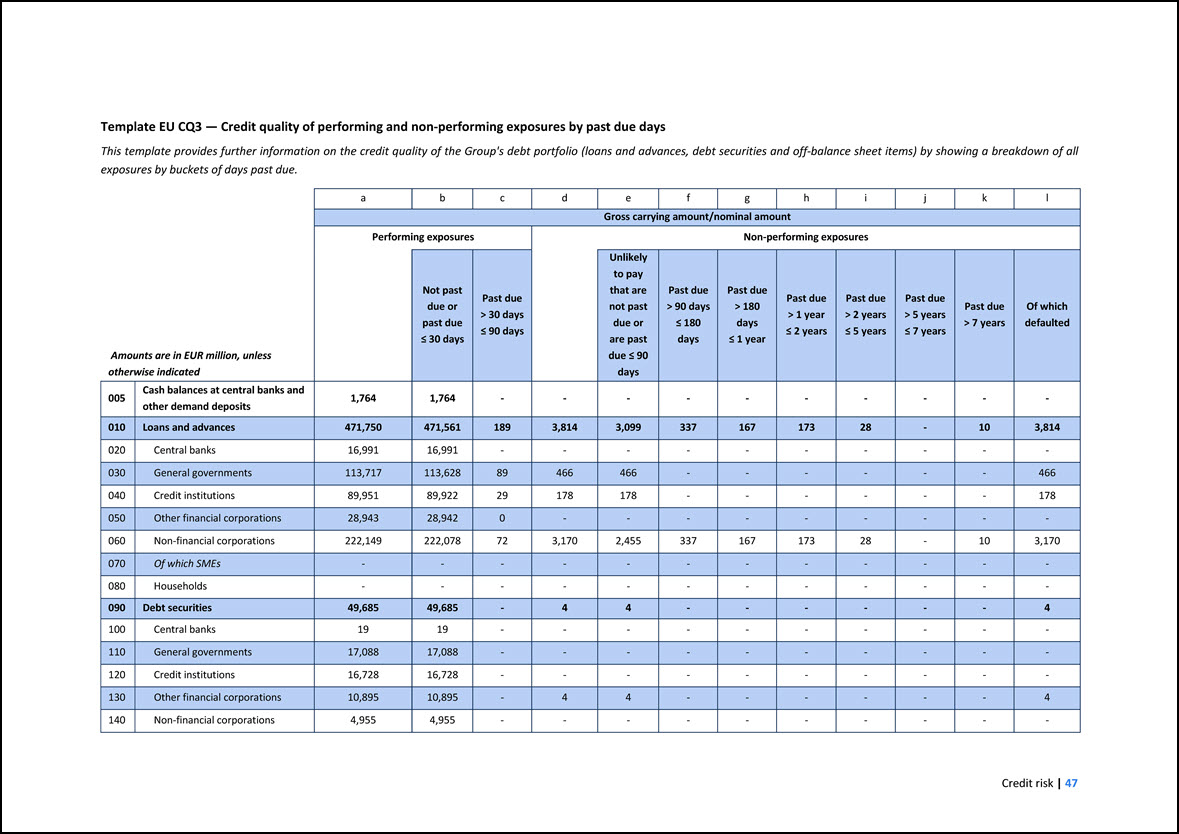
Template EU CQ3 — Credit quality of performing and non-performing exposures by past due days This template provides further information on the credit quality of the
Group's debt portfolio (loans and advances, debt securities and off-balance sheet items) by showing a breakdown of all exposures by buckets of days past due. Amounts are in EUR million, unless otherwise indicated a b c d e f g h i j k l
Gross carrying amount/nominal amount Performing exposures Non-performing exposures Not past due or past due = 30 days Past due > 30 days = 90 days Unlikely to pay that are not past due or are past due = 90 days Past due > 90 days = 180
days Past due > 180 days = 1 year Past due > 1 year = 2 years Past due > 2 years = 5 years Past due > 5 years = 7 years Past due > 7 years Of which defaulted 005 Cash balances at central banks and other demand deposits 1,764
1,764 - - - - - - - - - - 010 Loans and advances 471,750 471,561 189 3,814 3,099 337 167 173 28 - 10 3,814 020 Central banks 16,991 16,991 - - - - - - - - - - 030 General governments 113,717 113,628 89 466
466 - - - - - - 466 040 Credit institutions 89,951 89,922 29 178 178 - - - - - - 178 050 Other financial corporations 28,943 28,942 0 - - - - - - - - - 060 Non-financial corporations 222,149 222,078 72 3,170
2,455 337 167 173 28 - 10 3,170 070 Of which SMEs - - - - - - - - - - - - 080 Households - - - - - - - - - - - - 090 Debt securities 49,685 49,685 - 4 4 - - - - - - 4 100 Central banks 19 19 - -
- - - - - - - - 110 General governments 17,088 17,088 - - - - - - - - - - 120 Credit institutions 16,728 16,728 - - - - - - - - - - 130 Other financial corporations 10,895 10,895 - 4 4 - - - - - - 4
140 Non-financial corporations 4,955 4,955 - - - - - - - - - -
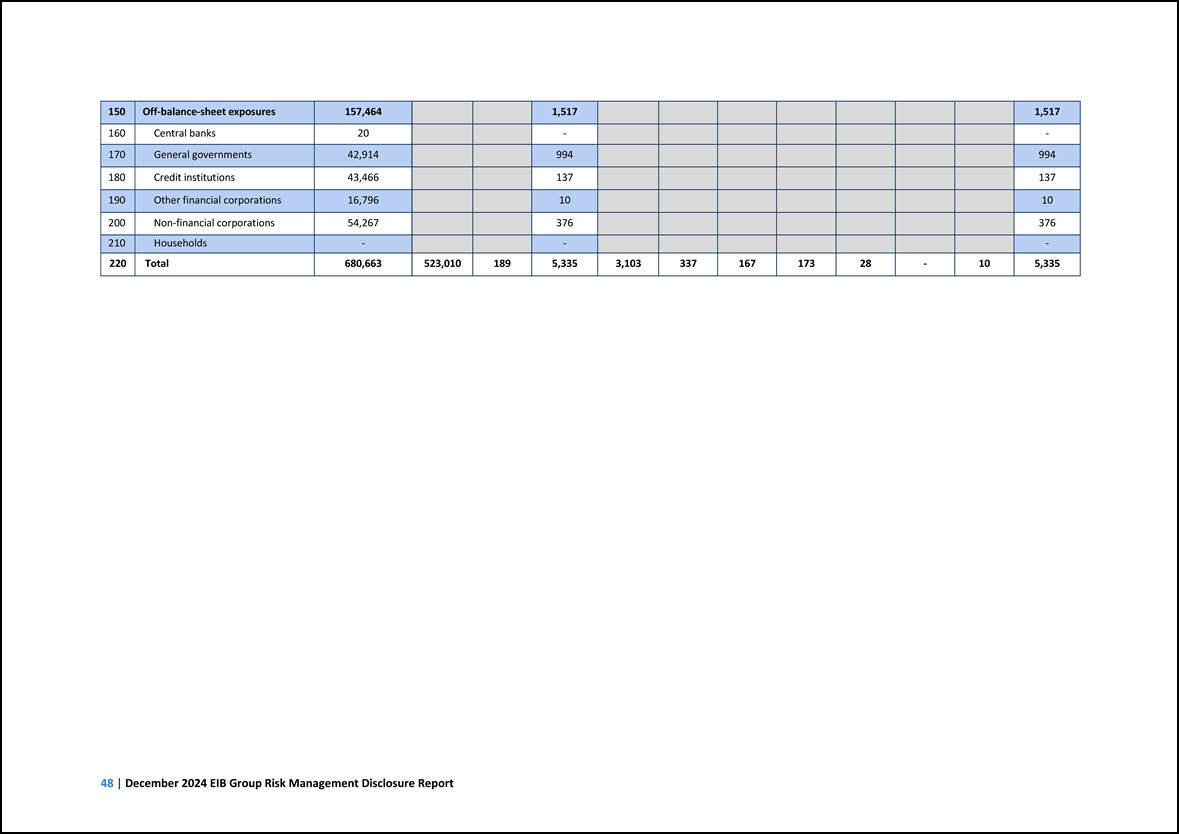
150 Off-balance-sheet exposures 157,464 1,517 1,517 160 Central banks 20 - - 170 General governments 42,914 994
994 180 Credit institutions 43,466 137 137 190 Other financial corporations 16,796 10 10 200 Non-financial corporations 54,267 376 376 210 Households - - - 220 Total 680,663
523,010 189 5,335 3,103 337 167 173 28 - 10 5,335
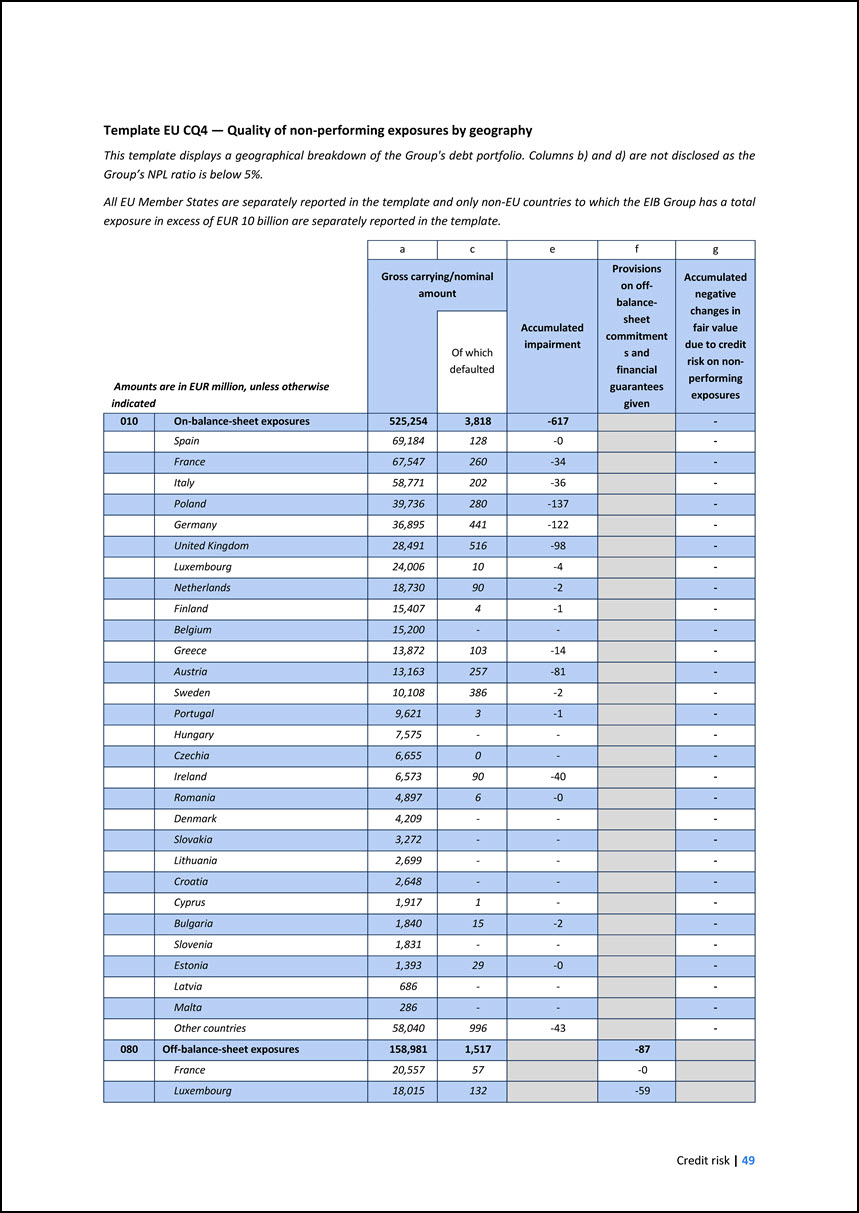
Template EU CQ4 — Quality of non-performing exposures by geography This template displays a geographical breakdown of the Group's debt portfolio. Columns b) and d)
are not disclosed as the Group’s NPL ratio is below 5%. All EU Member States are separately reported in the template and only non-EU countries to which the EIB Group has a total exposure in excess of EUR 10 billion are separately reported in the
template. Amounts are in EUR million, unless otherwise indicated a c e f g Gross carrying/nominal amount Accumulated impairment Provisions on off- balance- sheet commitments and financial guarantees given Accumulated negative changes in
fair value due to credit risk on non- performing exposures Of which defaulted 010 On-balance-sheet exposures 525,254 3,818 -617 - Spain 69,184 128 -0 - France 67,547 260 -34 - Italy 58,771 202 -36 - Poland 39,736
280 -137 - Germany 36,895 441 -122 - United Kingdom 28,491 516 -98 - Luxembourg 24,006 10 -4 - Netherlands 18,730 90 -2 - Finland 15,407 4 -1 - Belgium 15,200 - - - Greece 13,872 103 -14 -
Austria 13,163 257 -81 - Sweden 10,108 386 -2 - Portugal 9,621 3 -1 - Hungary 7,575 - - - Czechia 6,655 0 - - Ireland 6,573 90 -40 - Romania 4,897 6 -0 - Denmark 4,209 - - - Slovakia 3,272 -
- - Lithuania 2,699 - - - Croatia 2,648 - - - Cyprus 1,917 1 - - Bulgaria 1,840 15 -2 - Slovenia 1,831 - - - Estonia 1,393 29 -0 - Latvia 686 - - - Malta 286 - - - Other countries 58,040
996 -43 - 080 Off-balance-sheet exposures 158,981 1,517 -87 France 20,557 57 -0 Luxembourg 18,015 132 -59
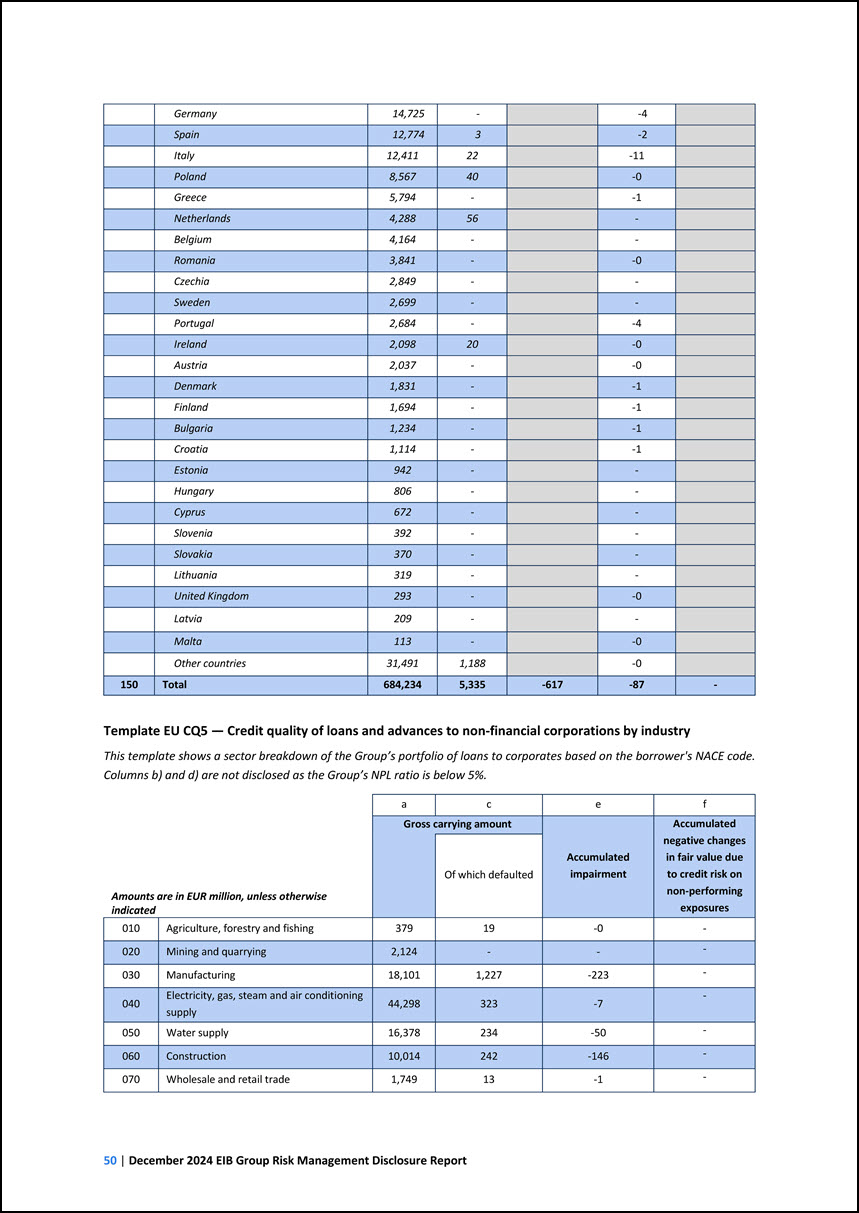
Germany 14,725 - -4 Spain 12,774 3 -2 Italy 12,411 22 -11 Poland 8,567 40 -0 Greece 5,794 - -1 Netherlands 4,288 56 -
Belgium 4,164 - - Romania 3,841 - -0 Czechia 2,849 - - Sweden 2,699 - - Portugal 2,684 - -4 Ireland 2,098 20 -0 Austria 2,037 - -0 Denmark 1,831 - -1 Finland 1,694 - -1 Bulgaria
1,234 - -1 Croatia 1,114 - -1 Estonia 942 - - Hungary 806 - - Cyprus 672 - - Slovenia 392 - - Slovakia 370 - - Lithuania 319 - - United Kingdom 293 - -0 Latvia 209 - -
Malta 113 - -0 Other countries 31,491 1,188 -0 150 Total 684,234 5,335 -617 -87 - Template EU CQ5 — Credit quality of loans and advances to non-financial corporations by industry This template shows a sector breakdown of the
Group’s portfolio of loans to corporates based on the borrower's NACE code. Columns b) and d) are not disclosed as the Group’s NPL ratio is below 5%. Amounts are in EUR million, unless otherwise indicated a c e f Gross carrying amount
Accumulated impairment Accumulated negative changes in fair value due to credit risk on non-performing exposures Of which defaulted 010 Agriculture, forestry and fishing 379 19 -0 - 020 Mining and quarrying 2,124 - - - 030
Manufacturing 18,101 1,227 -223 - 040 Electricity, gas, steam and air conditioning supply 44,298 323 -7 - 050 Water supply 16,378 234 -50 - 060 Construction 10,014 242 -146 - 070 Wholesale and retail trade 1,749 13 -1 -
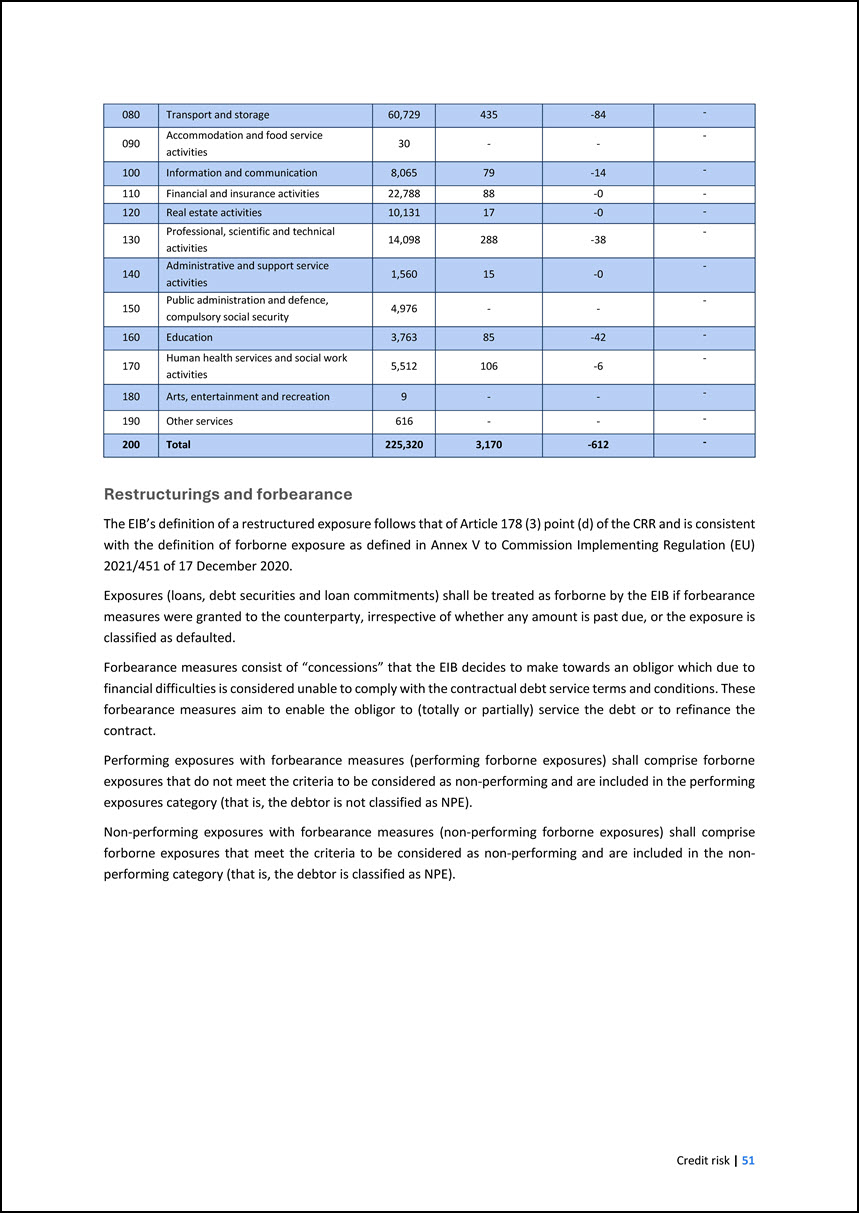
080 Transport and storage 60,729 435 -84 - 090 Accommodation and food service activities 30 - - - 100 Information and communication 8,065 79 -14 -
110 Financial and insurance activities 22,788 88 -0 - 120 Real estate activities 10,131 17 -0 - 130 Professional, scientific and technical activities 14,098 288 -38 - 140 Administrative and support service activities 1,560 15
-0 - 150 Public administration and defence, compulsory social security 4,976 - - - 160 Education 3,763 85 -42 - 170 Human health services and social work activities 5,512 106 -6 - 180 Arts, entertainment and recreation 9 - -
- 190 Other services 616 - - - 200 Total 225,320 3,170 -612 - Restructurings and forbearance The EIB’s definition of a restructured exposure follows that of Article 178 (3) point (d) of the CRR and is consistent with the definition of
forborne exposure as defined in Annex V to Commission Implementing Regulation (EU) 2021/451 of 17 December 2020. Exposures (loans, debt securities and loan commitments) shall be treated as forborne by the EIB if forbearance measures were granted to
the counterparty, irrespective of whether any amount is past due, or the exposure is classified as defaulted. Forbearance measures consist of “concessions” that the EIB decides to make towards an obligor which due to financial difficulties is
considered unable to comply with the contractual debt service terms and conditions. These forbearance measures aim to enable the obligor to (totally or partially) service the debt or to refinance the contract. Performing exposures with forbearance
measures (performing forborne exposures) shall comprise forborne exposures that do not meet the criteria to be considered as non-performing and are included in the performing exposures category (that is, the debtor is not classified as NPE).
Non-performing exposures with forbearance measures (non-performing forborne exposures) shall comprise forborne exposures that meet the criteria to be considered as non-performing and are included in the non- performing category (that is, the debtor
is classified as NPE).
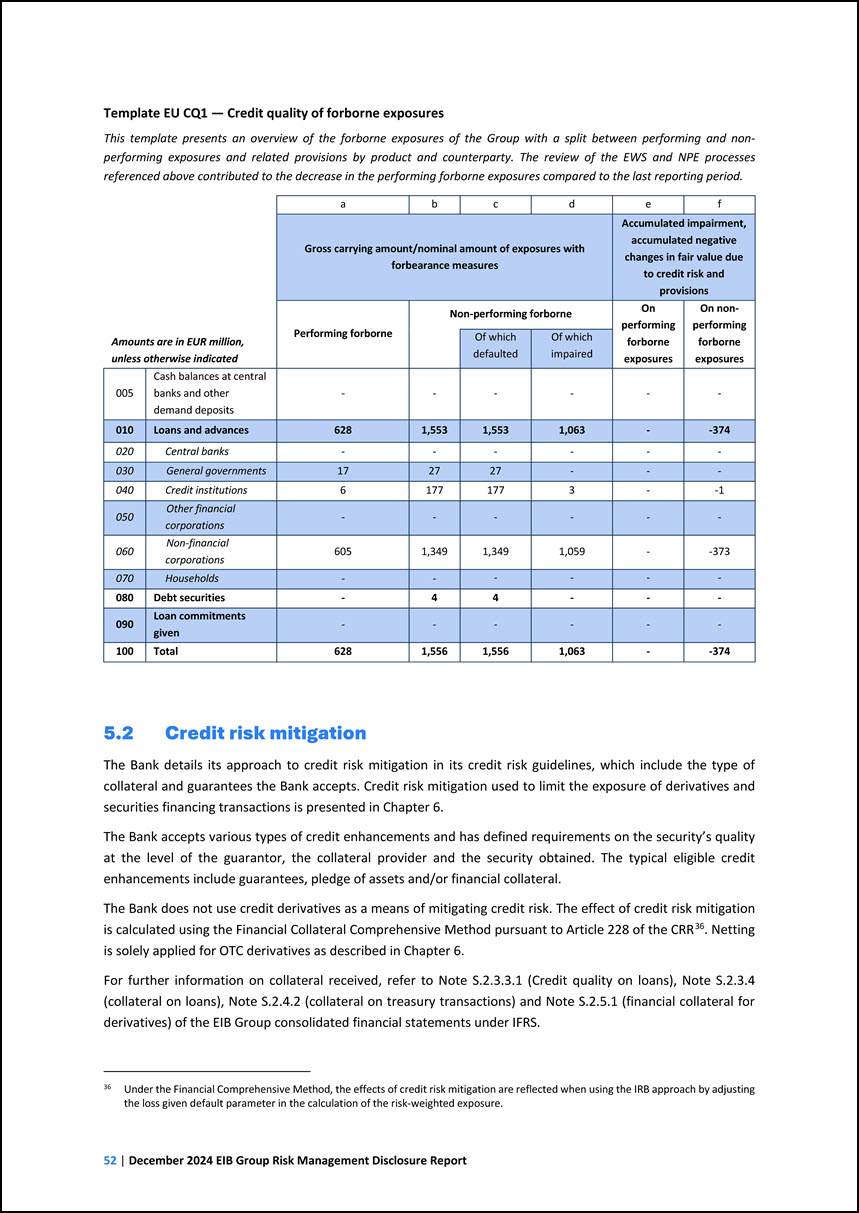
Template EU CQ1 — Credit quality of forborne exposures This template presents an overview of the forborne exposures of the Group with a split between performing and
non- performing exposures and related provisions by product and counterparty. The review of the EWS and NPE processes referenced above contributed to the decrease in the performing forborne exposures compared to the last reporting period. Amounts
are in EUR million, unless otherwise indicated a b c d e f Gross carrying amount/nominal amount of exposures with forbearance measures Accumulated impairment, accumulated negative changes in fair value due to credit risk and provisions
Performing forborne Non-performing forborne On performing forborne exposures On non- performing forborne exposures Of which defaulted Of which impaired 005 Cash balances at central banks and other demand deposits - - - - - - 010 Loans
and advances 628 1,553 1,553 1,063 - -374 020 Central banks - - - - - - 030 General governments 17 27 27 - - - 040 Credit institutions 6 177 177 3 - -1 050 Other financial corporations - - - - - - 060
Non-financial corporations 605 1,349 1,349 1,059 - -373 070 Households - - - - - - 080 Debt securities - 4 4 - - - 090 Loan commitments given - - - - - - 100 Total 628 1,556 1,556 1,063 - -374 5.2 Credit risk
mitigation The Bank details its approach to credit risk mitigation in its credit risk guidelines, which include the type of collateral and guarantees the Bank accepts. Credit risk mitigation used to limit the exposure of derivatives and securities
financing transactions is presented in Chapter 6. The Bank accepts various types of credit enhancements and has defined requirements on the security’s quality at the level of the guarantor, the collateral provider and the security obtained. The
typical eligible credit enhancements include guarantees, pledge of assets and/or financial collateral. The Bank does not use credit derivatives as a means of mitigating credit risk. The effect of credit risk mitigation is calculated using the
Financial Collateral Comprehensive Method pursuant to Article 228 of the CRRis solely applied for OTC derivatives as described in Chapter 6. 36. Netting 36 Under the Financial Comprehensive Method, the effects of credit risk mitigation are reflected
when using the IRB approach by adjusting the loss given default parameter in the calculation of the risk-weighted exposure. For further information on collateral received, refer to Note S.2.3.3.1 (Credit quality on loans), Note S.2.3.4 (collateral
on loans), Note S.2.4.2 (collateral on treasury transactions) and Note S.2.5.1 (financial collateral for derivatives) of the EIB Group consolidated financial statements under IFRS.
Collateral and guarantee management The credit risk attached to a particular borrower may be enhanced by the provision of third-party guarantees and/or collateral. In
order to distinguish between the quality of such credit enhancements, the Bank has a granular classification system defining the essential characteristics of the different types of credit enhancement that may be offered as security. This distinction
is based not only on the credit standing of the issuer of the relevant instrument but also on the instruments’ legal enforceability and liquidity. Guarantees Guarantees represent one type of credit enhancement. Detailed rules are set out in the
credit risk guidelines in relation to, among others: • minimum rating requirements for guarantors and the Bank’s rights if the guarantor loses such rating; • monitoring of guarantors; • acceptable caps on guarantees. Pledge of assets and/or
financial collateral Alternatively, a credit enhancement can be made by a pledge on assets: • pledge of financial collateral (government and corporate bonds, cash and, on an exceptional basis, shares); • assignment of financial rights (for example,
a claim on underlying loan exposures or revenues); and • cash on bank accounts (no pledge agreement) held with an independent bank. Security eligibility and collateral management Detailed rules are set out in the credit risk guidelines in relation
to, among others: • asset eligibility; • haircuts based on security type, rating, maturity, liquidity, currency; • frequency of monitoring of collateral, exposures and coverage ratios (daily); and • rules for collateral valuation. 5.3 Use of the
standardised approach The Group makes limited use of the standardised approach. Investments in collective investment undertakings (‘CIUs’) are treated under the look-through, mandate-based or fall-back approach in accordance with Article 152of the
CRR and reported in templates CR4 and CR5 below. The EIB Group currently does not make use of external ratings from the major credit rating agencies for any of the exposures treated under the standardised approach within the IRB calculations to
determine the corresponding risk weights. Rather, investments within the affected exposure classes receive standardised risk weights according to non-rating based criteria as provided for by the CRR.
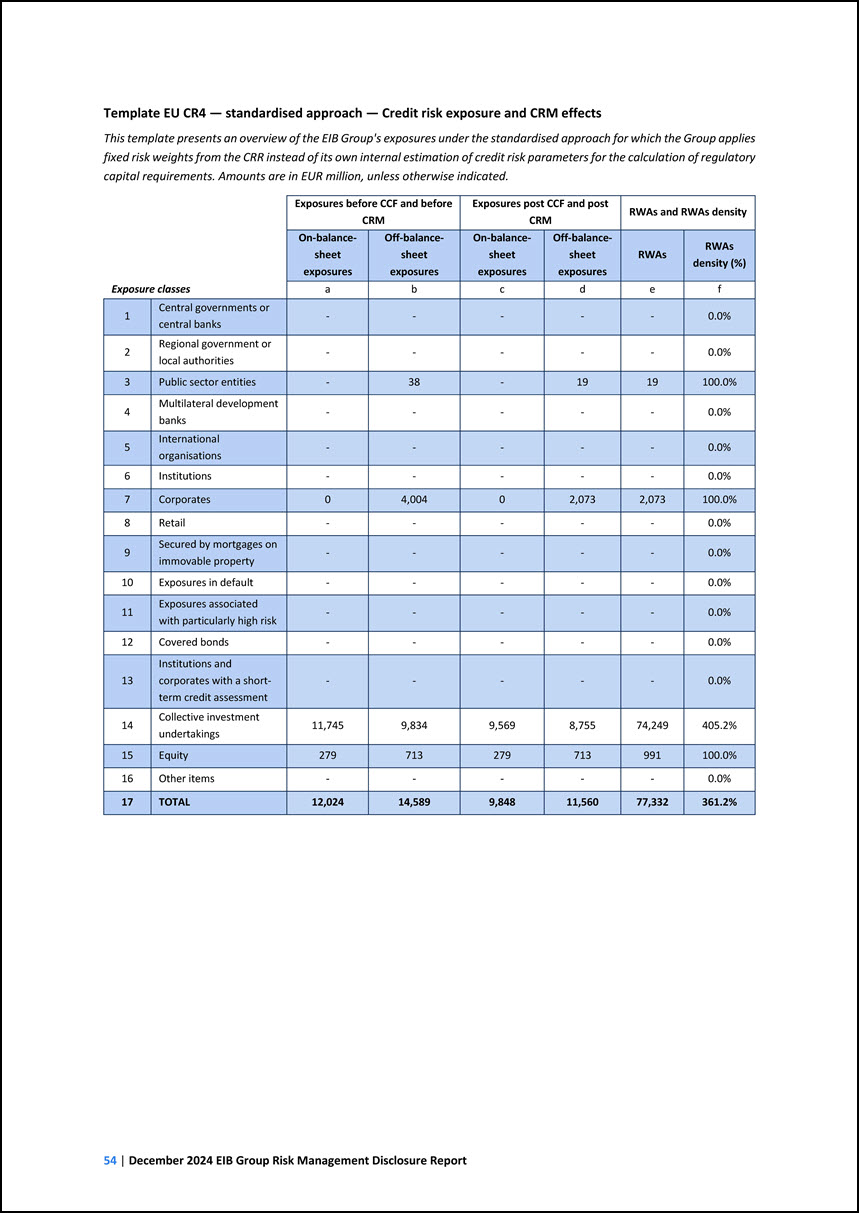
Template EU CR4 — standardised approach — Credit risk exposure and CRM effects This template presents an overview of the EIB Group's exposures under the standardised
approach for which the Group applies fixed risk weights from the CRR instead of its own internal estimation of credit risk parameters for the calculation of regulatory capital requirements. Amounts are in EUR million, unless otherwise indicated.
Exposure classes Exposures before CCF and before CRM Exposures post CCF and post CRM RWAs and RWAs density On-balance- sheet exposures Off-balance- sheet exposures On-balance- sheet exposures Off-balance- sheet exposures RWAs RWAs density
(%) a b c d e f 1 Central governments or central banks - - - - - 0.0% 2 Regional government or local authorities - - - - - 0.0% 3 Public sector entities - 38 - 19 19 100.0% 4 Multilateral development banks - - - -
- 0.0% 5 International organisations - - - - - 0.0% 6 Institutions - - - - - 0.0% 7 Corporates 0 4,004 0 2,073 2,073 100.0% 8 Retail - - - - - 0.0% 9 Secured by mortgages on immovable property - - - - - 0.0%
10 Exposures in default - - - - - 0.0% 11 Exposures associated with particularly high risk - - - - - 0.0% 12 Covered bonds - - - - - 0.0% 13 Institutions and corporates with a short- term credit assessment - - - - -
0.0% 14 Collective investment undertakings 11,745 9,834 9,569 8,755 74,249 405.2% 15 Equity 279 713 279 713 991 100.0% 16 Other items - - - - - 0.0% 17 TOTAL 12,024 14,589 9,848 11,560 77,332 361.2%
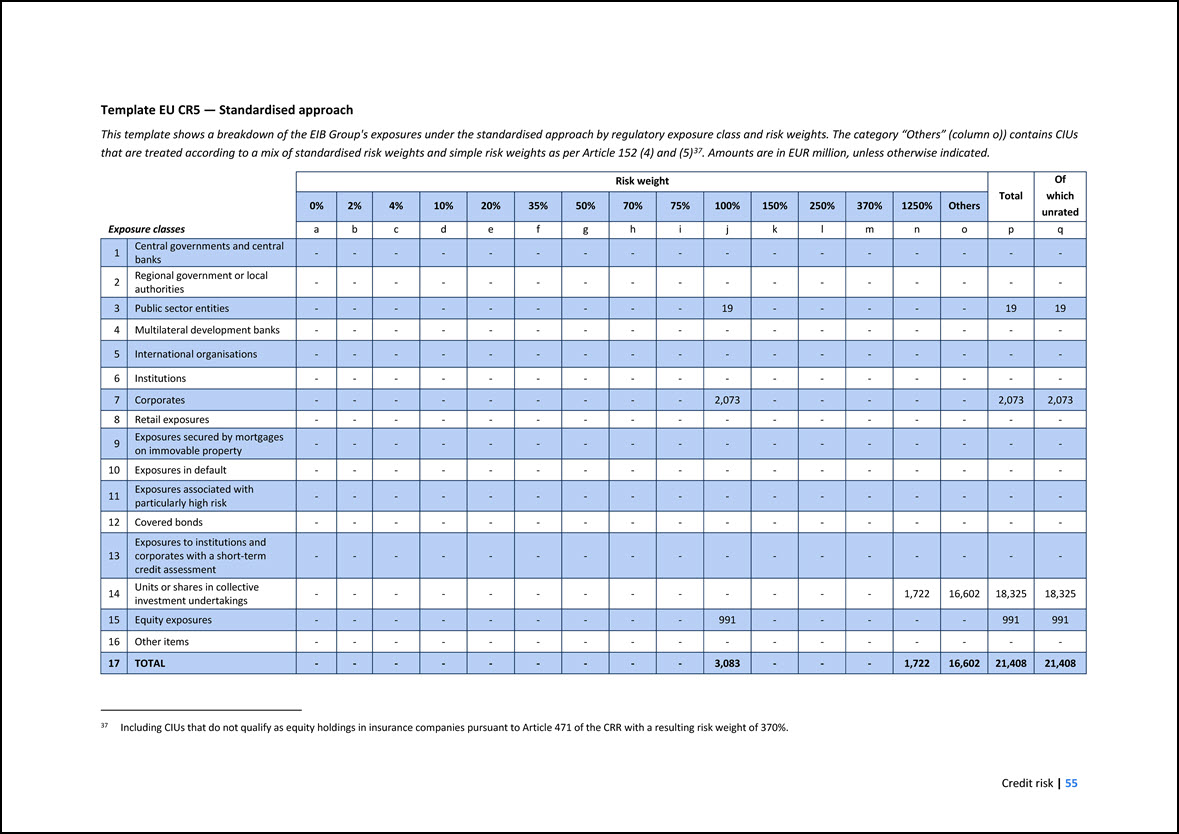
Template EU CR5 — Standardised approach This template shows a breakdown of the EIB Group's exposures under the standardised approach by regulatory exposure class and
risk weights. The category “Others” (column o)) contains CIUs that are treated according to a mix of standardised risk weights and simple risk weights as per Article 152 (4) and (5)37. Amounts are in EUR million, unless otherwise indicated. 37
Including CIUs that do not qualify as equity holdings in insurance companies pursuant to Article 471 of the CRR with a resulting risk weight of 370%. Exposure classes Risk weight Total Of which unrated 0% 2% 4% 10% 20% 35% 50% 70% 75%
100% 150% 250% 370% 1250% Others a b c d e f g h i j k l m n o p q 1 Central governments and central banks - - - - - - - - - - - - - - - - - 2 Regional government or local authorities - - - - - - -
- - - - - - - - - - 3 Public sector entities - - - - - - - - - 19 - - - - - 19 19 4 Multilateral development banks - - - - - - - - - - - - - - - - - 5 International organisations - - - - - - -
- - - - - - - - - - 6 Institutions - - - - - - - - - - - - - - - - - 7 Corporates - - - - - - - - - 2,073 - - - - - 2,073 2,073 8 Retail exposures - - - - - - - - - - - - - - - - - 9
Exposures secured by mortgages on immovable property - - - - - - - - - - - - - - - - - 10 Exposures in default - - - - - - - - - - - - - - - - - 11 Exposures associated with particularly high risk - - - - -
- - - - - - - - - - - - 12 Covered bonds - - - - - - - - - - - - - - - - - 13 Exposures to institutions and corporates with a short-term credit assessment - - - - - - - - - - - - - - - - - 14 Units
or shares in collective investment undertakings - - - - - - - - - - - - - 1,722 16,602 18,325 18,325 15 Equity exposures - - - - - - - - - 991 - - - - - 991 991 16 Other items - - - - - - - - - - - -
- - - - - 17 TOTAL - - - - - - - - - 3,083 - - - 1,722 16,602 21,408 21,408
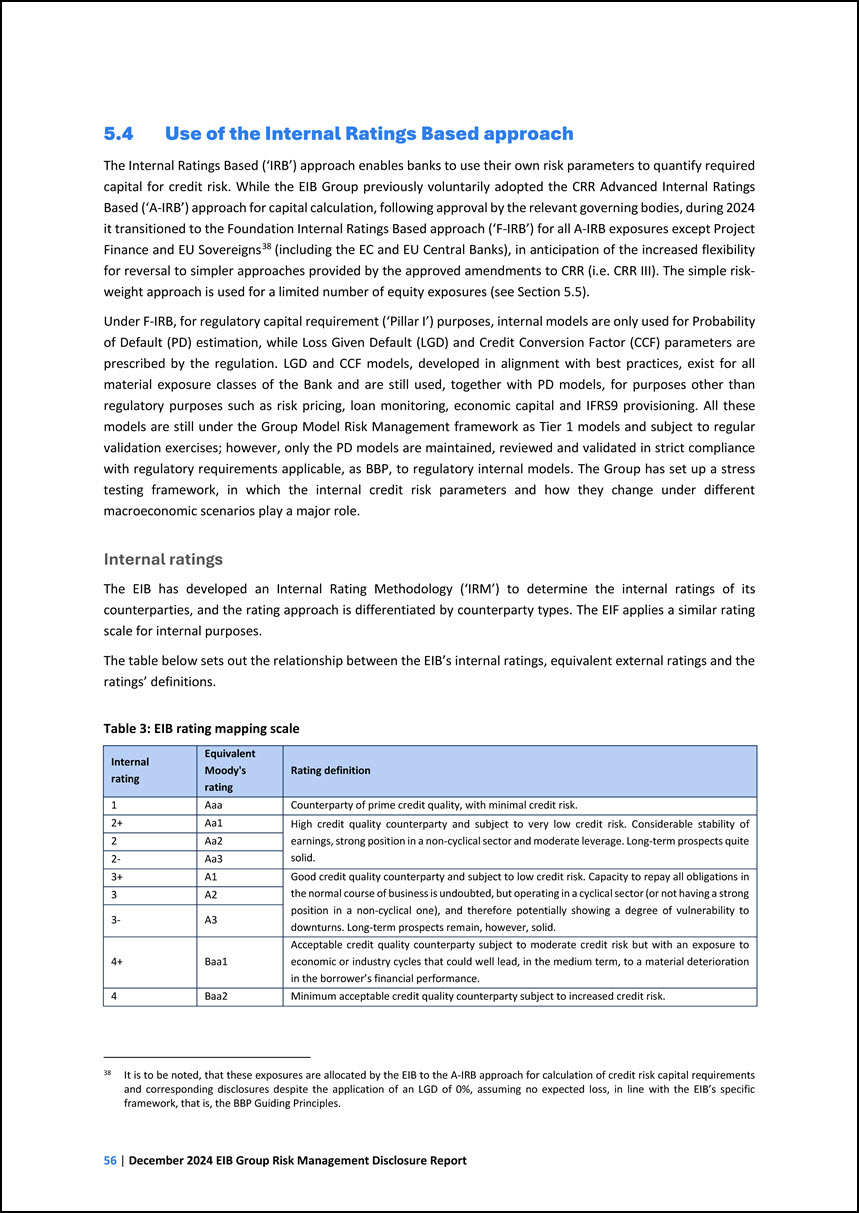
5.4 Use of the Internal Ratings Based approach The Internal Ratings Based (‘IRB’) approach enables banks to use their own risk parameters to quantify required capital
for credit risk. While the EIB Group previously voluntarily adopted the CRR Advanced Internal Ratings Based (‘A-IRB’) approach for capital calculation, following approval by the relevant governing bodies, during 2024 it transitioned to the Foundation
Internal Ratings Based approach (‘F-IRB’) for all A-IRB exposures except Project Finance and EU Sovereignsweight approach is used for a limited number of equity exposures (see Section 5.5). 38 (including the EC and EU Central Banks), in anticipation
of the increased flexibility for reversal to simpler approaches provided by the approved amendments to CRR (i.e. CRR III). The simple risk- 38 It is to be noted, that these exposures are allocated by the EIB to the A-IRB approach for calculation of
credit risk capital requirements and corresponding disclosures despite the application of an LGD of 0%, assuming no expected loss, in line with the EIB’s specific framework, that is, the BBP Guiding Principles. Under F-IRB, for regulatory capital
requirement (‘Pillar I’) purposes, internal models are only used for Probability of Default (PD) estimation, while Loss Given Default (LGD) and Credit Conversion Factor (CCF) parameters are prescribed by the regulation. LGD and CCF models, developed
in alignment with best practices, exist for all material exposure classes of the Bank and are still used, together with PD models, for purposes other than regulatory purposes such as risk pricing, loan monitoring, economic capital and IFRS9
provisioning. All these models are still under the Group Model Risk Management framework as Tier 1 models and subject to regular validation exercises; however, only the PD models are maintained, reviewed and validated in strict compliance with
regulatory requirements applicable, as BBP, to regulatory internal models. The Group has set up a stress testing framework, in which the internal credit risk parameters and how they change under different macroeconomic scenarios play a major role.
Internal ratings The EIB has developed an Internal Rating Methodology (‘IRM’) to determine the internal ratings of its counterparties, and the rating approach is differentiated by counterparty types. The EIF applies a similar rating scale for
internal purposes. The table below sets out the relationship between the EIB’s internal ratings, equivalent external ratings and the ratings’ definitions. Table 3: EIB rating mapping scale Internal rating Equivalent Moody's rating Rating
definition 1 Aaa Counterparty of prime credit quality, with minimal credit risk. 2+ Aa1 High credit quality counterparty and subject to very low credit risk. Considerable stability of earnings, strong position in a non-cyclical sector and
moderate leverage. Long-term prospects quite solid. 2 Aa2 2- Aa3 3+ A1 Good credit quality counterparty and subject to low credit risk. Capacity to repay all obligations in the normal course of business is undoubted, but operating in a
cyclical sector (or not having a strong position in a non-cyclical one), and therefore potentially showing a degree of vulnerability to downturns. Long-term prospects remain, however, solid. 3 A2 3- A3 4+ Baa1 Acceptable credit quality
counterparty subject to moderate credit risk but with an exposure to economic or industry cycles that could well lead, in the medium term, to a material deterioration in the borrower’s financial performance. 4 Baa2 Minimum acceptable credit
quality counterparty subject to increased credit risk.
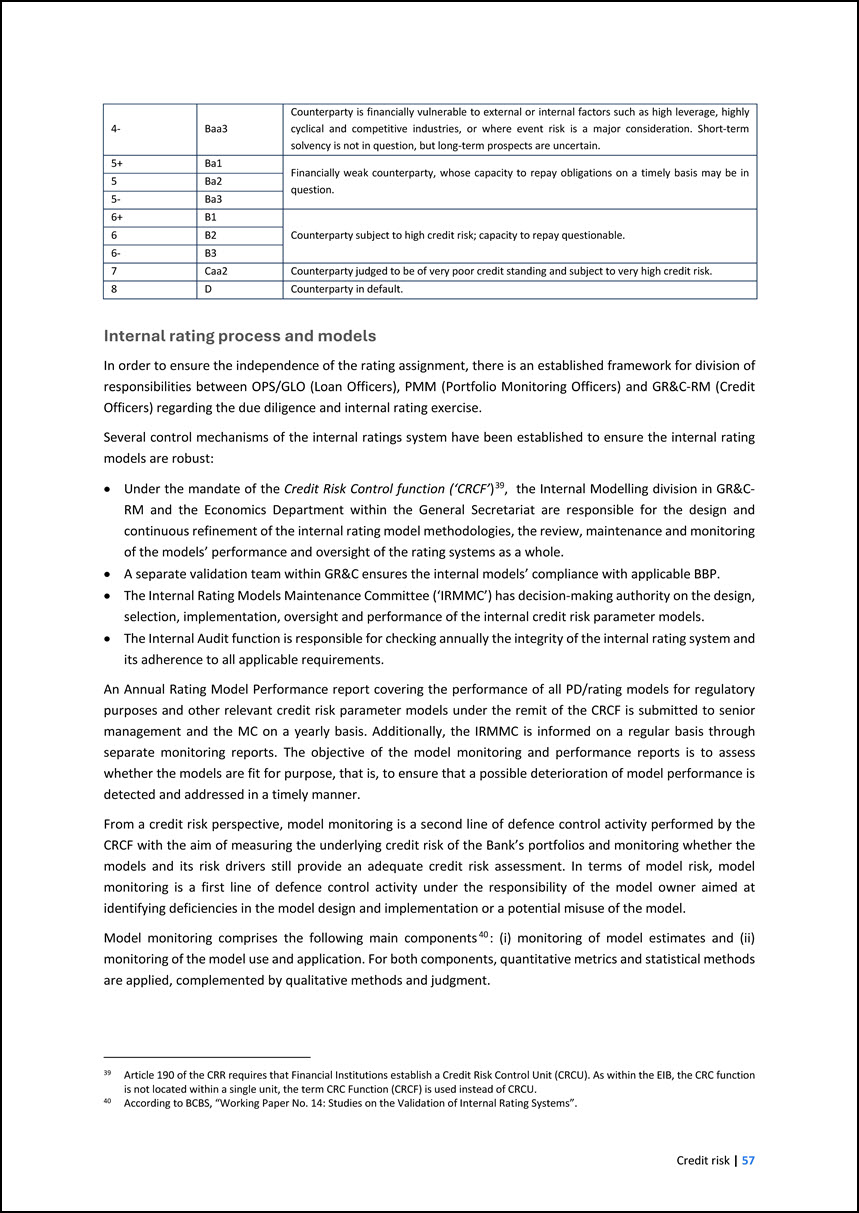
4- Baa3 Counterparty is financially vulnerable to external or internal factors such as high leverage, highly cyclical and competitive industries, or where event risk
is a major consideration. Short-term solvency is not in question, but long-term prospects are uncertain. 5+ Ba1 Financially weak counterparty, whose capacity to repay obligations on a timely basis may be in question. 5 Ba2 5- Ba3 6+ B1
Counterparty subject to high credit risk; capacity to repay questionable. 6 B2 6- B3 7 Caa2 Counterparty judged to be of very poor credit standing and subject to very high credit risk. 8 D Counterparty in default. Internal rating process
and models In order to ensure the independence of the rating assignment, there is an established framework for division of responsibilities between OPS/GLO (Loan Officers), PMM (Portfolio Monitoring Officers) and GR&C-RM (Credit Officers)
regarding the due diligence and internal rating exercise. Several control mechanisms of the internal ratings system have been established to ensure the internal rating models are robust: • Under the mandate of the Credit Risk Control function
(‘CRCF’)39, the Internal Modelling division in GR&C- RM and the Economics Department within the General Secretariat are responsible for the design and continuous refinement of the internal rating model methodologies, the review, maintenance and
monitoring of the models’ performance and oversight of the rating systems as a whole. • A separate validation team within GR&C ensures the internal models’ compliance with applicable BBP. • The Internal Rating Models Maintenance Committee
(‘IRMMC’) has decision-making authority on the design, selection, implementation, oversight and performance of the internal credit risk parameter models. • The Internal Audit function is responsible for checking annually the integrity of the internal
rating system and its adherence to all applicable requirements. 39 Article 190 of the CRR requires that Financial Institutions establish a Credit Risk Control Unit (CRCU). As within the EIB, the CRC function is not located within a single unit, the
term CRC Function (CRCF) is used instead of CRCU. An Annual Rating Model Performance report covering the performance of all PD/rating models for regulatory purposes and other relevant credit risk parameter models under the remit of the CRCF is
submitted to senior management and the MC on a yearly basis. Additionally, the IRMMC is informed on a regular basis through separate monitoring reports. The objective of the model monitoring and performance reports is to assess whether the models are
fit for purpose, that is, to ensure that a possible deterioration of model performance is detected and addressed in a timely manner. From a credit risk perspective, model monitoring is a second line of defence control activity performed by the CRCF
with the aim of measuring the underlying credit risk of the Bank’s portfolios and monitoring whether the models and its risk drivers still provide an adequate credit risk assessment. In terms of model risk, model monitoring is a first line of defence
control activity under the responsibility of the model owner aimed at identifying deficiencies in the model design and implementation or a potential misuse of the model. Model monitoring comprises the following main components40: (i) monitoring of
model estimates and (ii) monitoring of the model use and application. For both components, quantitative metrics and statistical methods are applied, complemented by qualitative methods and judgment. 40 According to BCBS, “Working Paper No. 14:
Studies on the Validation of Internal Rating Systems”.
For the monitoring of estimates of model parameters, a distinction is made between back-testing and benchmarking analyses: • Back-testing means the use of statistical
methods to compare model estimates and realised outcomes in line with CRR Art. 174(d) and Art. 185(b). • Benchmarking refers to a comparison of internal estimates across banks with external benchmarks or estimates of challenger models (such as
external ratings, pooled data, supervisory models) in line with CRR Art. 185(c). With regard to the model use and application, the content of the monitoring activities depends on the peculiarities of the model. Examples are the model use on the
appropriate portfolio, timely re-rating or the extent of overrides. The internal rating models rely on quantitative factors and an analyst’s opinion for qualitative factors, complemented by model specific adjustments such as group or sovereign
support adjustments. EU and non-EU counterparties are generally subject to the same rating approach. Moreover, two of the most material internal rating models, namely Corporate and Financial Institutions, have been redeveloped and went live in the
course of 2024. The new Rating Model for Corporates follows a modular approach to assess the credit risk of corporate entities (excluding project finance counterparties) applying both quantitative and qualitative factors in a balanced manner. An
initial anchor result is determined with an automated Industry Module, automated Quantitative Module and a comprehensively guided Qualitative Module. This anchor is enhanced with three guided adjustments, focusing on risks related to Financial
Policy, Liquidity and Management & Governance. The model rating is obtained after accounting for support or limitations of the counterparty operating in a Corporate group structure and environment (country). Finally, the overriding tools can be
applied to incorporate information that has not been considered in the model. The new internal rating model for Financial Institutions separates the stand-alone credit assessment into a quantitative rating derived from financial and macro factors,
which are automatically sourced from internal data systems, and a qualitative assessment provided by model users following detailed guidance. Explicit sovereign and group support assessment is evaluated as a combination of both willingness and
ability of the sovereign and/or group to support, using a new robust module. The model was developed using statistical methods, model parameters were empirically estimated and a specific calibration by means of a functional form was introduced. The
final rating also allows for expert judgmental overrides. In line with its BBP Guiding Principles, assuming no expected loss, exposures towards the European Union, Member States and central banks of Member States are carved out from regulatory
capital requirements. Non- EU sovereigns (including central banks) are rated by the Economics Department. The internal rating model for sub-sovereign public authority (‘SSPA’) counterparties assesses the two main areas, operating environment and
financial position/risk, to derive an initial rating from the scorecard. Subsequently, model-driven adjustments are applied including a country test (to ensure the rating is in line with the rating of the sovereign) and overriding adjustments
(expert-based). A specific internal rating model also exists for public sector entities (‘PSE’) that are neither sovereign, sub- sovereign public authorities, nor corporates and are considered within the institutions’ IRB exposure class for capital
calculation purposes. The initial scorecard rating of these entities assesses the business and financial risk of the counterparty. Potential adjustments are allowed by assessing specific criteria to reflect the degree and likelihood of extraordinary
support from the sponsoring sovereign or sub-sovereign. The internal rating model for project finance counterparties assesses project risks, including technology, construction and operation risks as well as financial, market, legal and counterparty
risks. This assessment
considers both quantitative and qualitative criteria and takes into account contract specific features as well as the political, economic and regulatory environment to
determine an initial rating. When the final rating is derived, overriding tools can be applied to incorporate information that was not captured in the scoring sheet. Requests for information addressed to the EIB Group, including those related to the
internal rating decisions concerning applicants for loans are handled by the InfoDesk in line with the Group’s Transparency Policy. As the Group does not directly lend to SMEs, these will usually be informed that loan decisions and conditions of
financing fall within the remit of the financial intermediaries and that the Group is not involved in the rating decision-making process. Credit risk parameters The following table provides an overview of the internal models per exposure class
including the models and methodologies applied to estimate the internal credit risk parameters for IRB purposes. Table 4: Overview of EIB internal models used for regulatory purposes Component Portfolio Main models Description of model and
methodology CRR category No. Description PD Corporates 2 PD Corporates Statistical based model Exposures to Corporates PD Project Finance Scoring sheet Exposures to Corporates – specialised lending Financial Institutions 1 PD Financial
Institutions Statistical based model Exposures to Institutions Sovereign/Public Sector 3 PD Sub-Sovereign Public Authorities Scoring sheet Exposures to Central governments and central banks or exposures to institutions when sub- sovereign
exposures are not treated as central governments and central banks as per the CRR criteria. PD Central governments and their central banks (non EU) Statistical based model with expert judgment PD Public Sector Entities Scoring sheet Exposures to
Institutions when public sector entities’ exposures are not treated as central governments and central banks exposures as per the CRR criteria. LGD Corporates 1 LGD Project Finance Model based on sector, nature of revenue and debt seniority
Exposures to Corporates – specialised lending Due to the shortage of statistically relevant historical default data, the Bank uses external estimates of PDs for its internal ratings. For EU Credit Risk Guidelines (CRG) counterparts, internal
rating grades are mapped to Moody’s rating grades taking into account the criteria of the internal and external ratings. The calibration method for PDs is based on Moody’s published data on default experience. For non-EU CRG counterparties, default
data history is also provided through the GEMs (Global Emerging Markets Risk) database, which allows for statistical modelling. The calibration of PDs also uses GEMs and Moody’s data. Template CR9.1 below provides information on the back-testing of
PDs estimates using respectively Moody’s and GEMs’ rating grades.
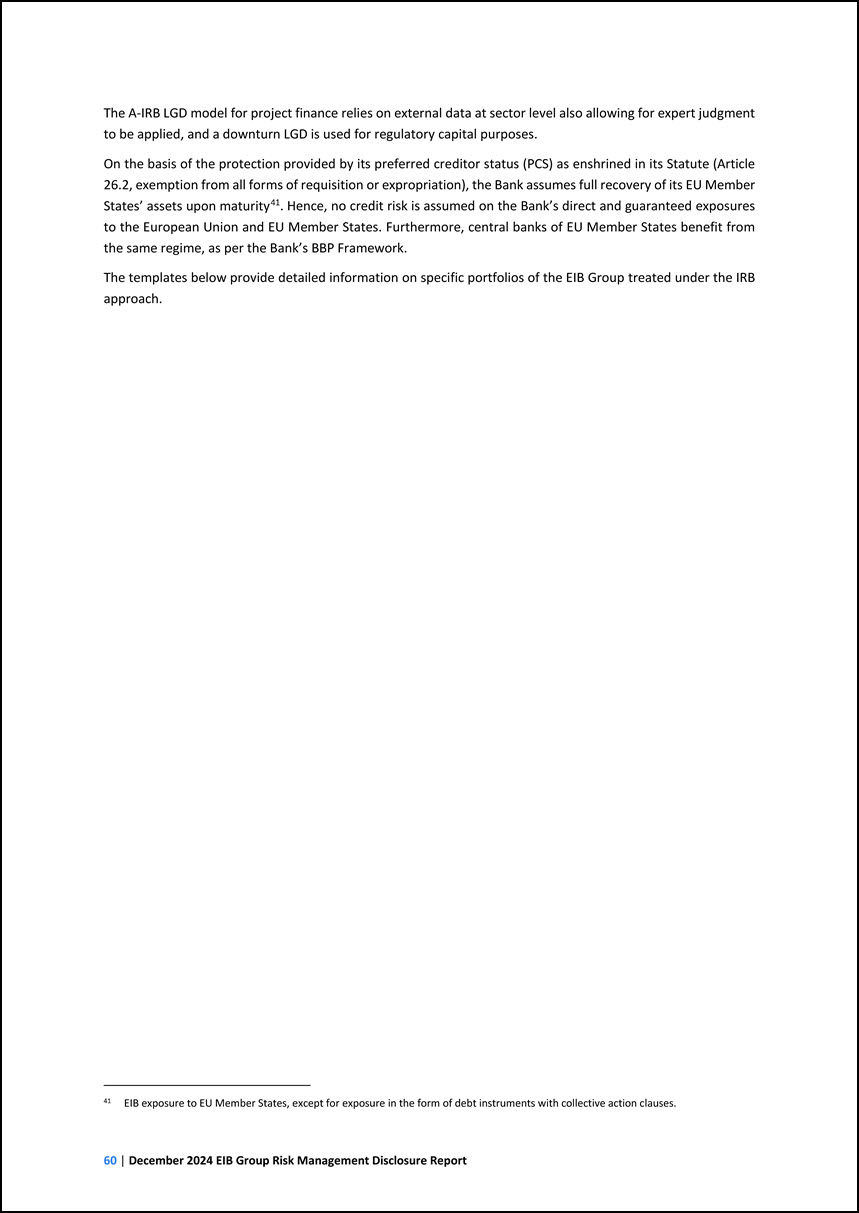
The A-IRB LGD model for project finance relies on external data at sector level also allowing for expert judgment to be applied, and a downturn LGD is used for
regulatory capital purposes. On the basis of the protection provided by its preferred creditor status (PCS) as enshrined in its Statute (Article 26.2, exemption from all forms of requisition or expropriation), the Bank assumes full recovery of its
EU Member States’ assets upon maturity41. Hence, no credit risk is assumed on the Bank’s direct and guaranteed exposures to the European Union and EU Member States. Furthermore, central banks of EU Member States benefit from the same regime, as per
the Bank’s BBP Framework. 41 EIB exposure to EU Member States, except for exposure in the form of debt instruments with collective action clauses. The templates below provide detailed information on specific portfolios of the EIB Group treated
under the IRB approach.
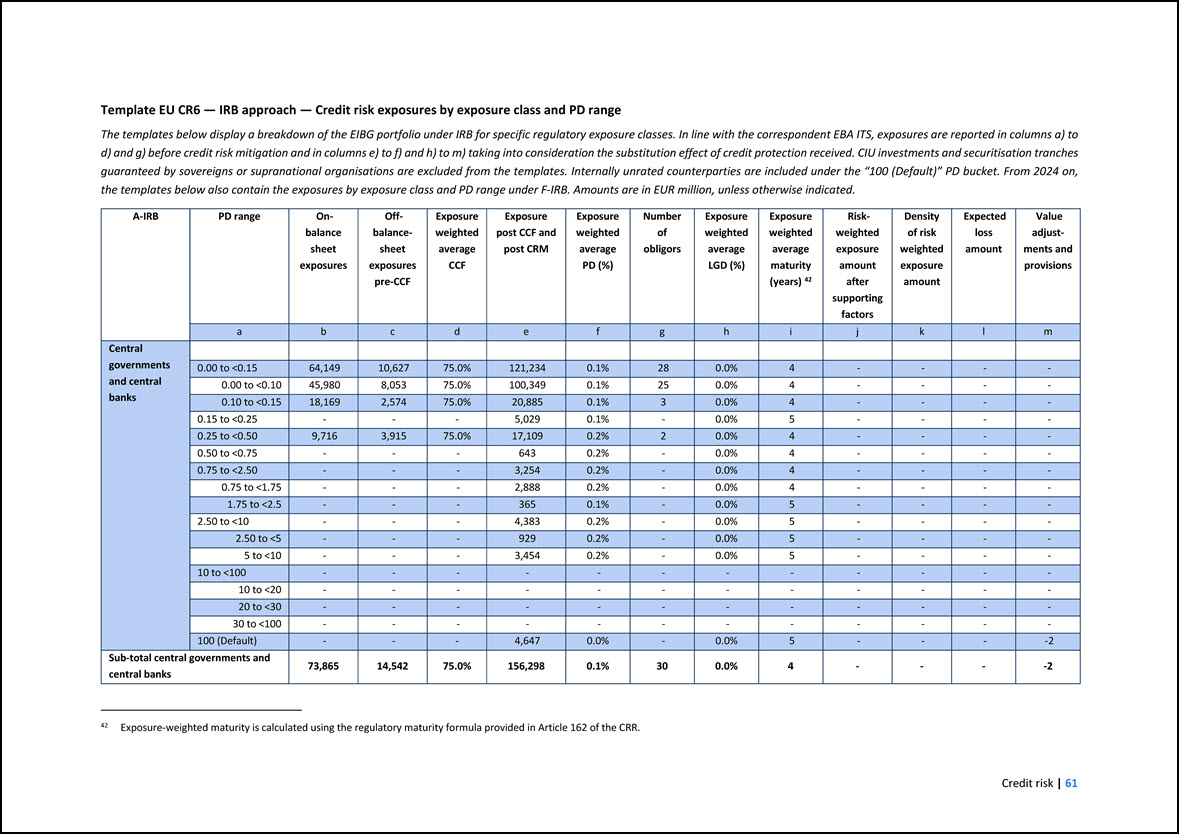
Template EU CR6 — IRB approach — Credit risk exposures by exposure class and PD range The templates below display a breakdown of the EIBG portfolio under IRB for
specific regulatory exposure classes. In line with the correspondent EBA ITS, exposures are reported in columns a) to d) and g) before credit risk mitigation and in columns e) to f) and h) to m) taking into consideration the substitution effect of
credit protection received. CIU investments and securitisation tranches guaranteed by sovereigns or supranational organisations are excluded from the templates. Internally unrated counterparties are included under the “100 (Default)” PD bucket. From
2024 on, the templates below also contain the exposures by exposure class and PD range under F-IRB. Amounts are in EUR million, unless otherwise indicated. A-IRB PD range On- balance sheet exposures Off- balance- sheet exposures pre-CCF
Exposure weighted average CCF Exposure post CCF and post CRM Exposure weighted average PD (%) Number of obligors Exposure weighted average LGD (%) Exposure weighted average maturity (years) 42 Risk- weighted exposure amount after supporting
factors Density of risk weighted exposure amount Expected loss amount Value adjust- ments and provisions a b c d e f g h i j k l m Central governments and central banks 0.00 to <0.15 64,149 10,627 75.0%
121,234 0.1% 28 0.0% 4 - - - - 0.00 to <0.10 45,980 8,053 75.0% 100,349 0.1% 25 0.0% 4 - - - - 0.10 to <0.15 18,169 2,574 75.0% 20,885 0.1% 3 0.0% 4 - - - - 0.15 to <0.25 - - - 5,029 0.1% - 0.0% 5
- - - - 0.25 to <0.50 9,716 3,915 75.0% 17,109 0.2% 2 0.0% 4 - - - - 0.50 to <0.75 - - - 643 0.2% - 0.0% 4 - - - - 0.75 to <2.50 - - - 3,254 0.2% - 0.0% 4 - - - - 0.75 to <1.75 - - - 2,888
0.2% - 0.0% 4 - - - - 1.75 to <2.5 - - - 365 0.1% - 0.0% 5 - - - - 2.50 to <10 - - - 4,383 0.2% - 0.0% 5 - - - - 2.50 to <5 - - - 929 0.2% - 0.0% 5 - - - - 5 to <10 - - - 3,454 0.2% -
0.0% 5 - - - - 10 to <100 - - - - - - - - - - - - 10 to <20 - - - - - - - - - - - - 20 to <30 - - - - - - - - - - - - 30 to <100 - - - - - - - - - - - - 100 (Default) - - -
4,647 0.0% - 0.0% 5 - - - -2 Sub-total central governments and central banks 73,865 14,542 75.0% 156,298 0.1% 30 0.0% 4 - - - -2 42 Exposure-weighted maturity is calculated using the regulatory maturity formula provided in
Article 162 of the CRR.
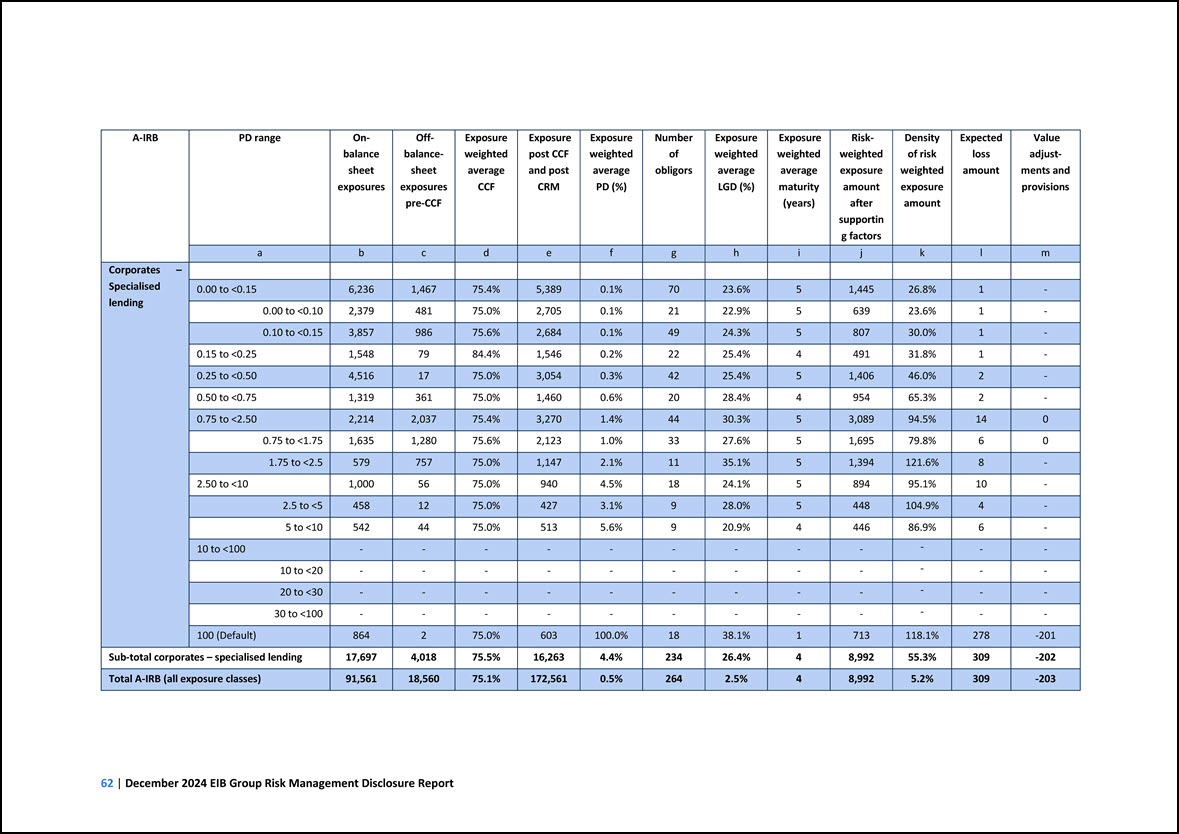
A-IRB PD range On- balance sheet exposures Off- balance- sheet exposures pre-CCF Exposure weighted average CCF Exposure post CCF and post CRM Exposure weighted
average PD (%) Number of obligors Exposure weighted average LGD (%) Exposure weighted average maturity (years) Risk- weighted exposure amount after supporting factors Density of risk weighted exposure amount Expected loss amount Value adjust-
ments and provisions a b c d e f g h i j k l m Corporates – Specialised lending 0.00 to <0.15 6,236 1,467 75.4% 5,389 0.1% 70 23.6% 5 1,445 26.8% 1 - 0.00 to <0.10 2,379 481 75.0% 2,705 0.1%
21 22.9% 5 639 23.6% 1 - 0.10 to <0.15 3,857 986 75.6% 2,684 0.1% 49 24.3% 5 807 30.0% 1 - 0.15 to <0.25 1,548 79 84.4% 1,546 0.2% 22 25.4% 4 491 31.8% 1 - 0.25 to <0.50 4,516 17 75.0% 3,054 0.3% 42
25.4% 5 1,406 46.0% 2 - 0.50 to <0.75 1,319 361 75.0% 1,460 0.6% 20 28.4% 4 954 65.3% 2 - 0.75 to <2.50 2,214 2,037 75.4% 3,270 1.4% 44 30.3% 5 3,089 94.5% 14 0 0.75 to <1.75 1,635 1,280 75.6% 2,123 1.0%
33 27.6% 5 1,695 79.8% 6 0 1.75 to <2.5 579 757 75.0% 1,147 2.1% 11 35.1% 5 1,394 121.6% 8 - 2.50 to <10 1,000 56 75.0% 940 4.5% 18 24.1% 5 894 95.1% 10 - 2.5 to <5 458 12 75.0% 427 3.1% 9 28.0% 5
448 104.9% 4 - 5 to <10 542 44 75.0% 513 5.6% 9 20.9% 4 446 86.9% 6 - 10 to <100 - - - - - - - - - - - - 10 to <20 - - - - - - - - - - - - 20 to <30 - - - - - - - - - - - - 30 to
<100 - - - - - - - - - - - - 100 (Default) 864 2 75.0% 603 100.0% 18 38.1% 1 713 118.1% 278 -201 Sub-total corporates – specialised lending 17,697 4,018 75.5% 16,263 4.4% 234 26.4% 4 8,992 55.3% 309 -202
Total A-IRB (all exposure classes) 91,561 18,560 75.1% 172,561 0.5% 264 2.5% 4 8,992 5.2% 309 -203
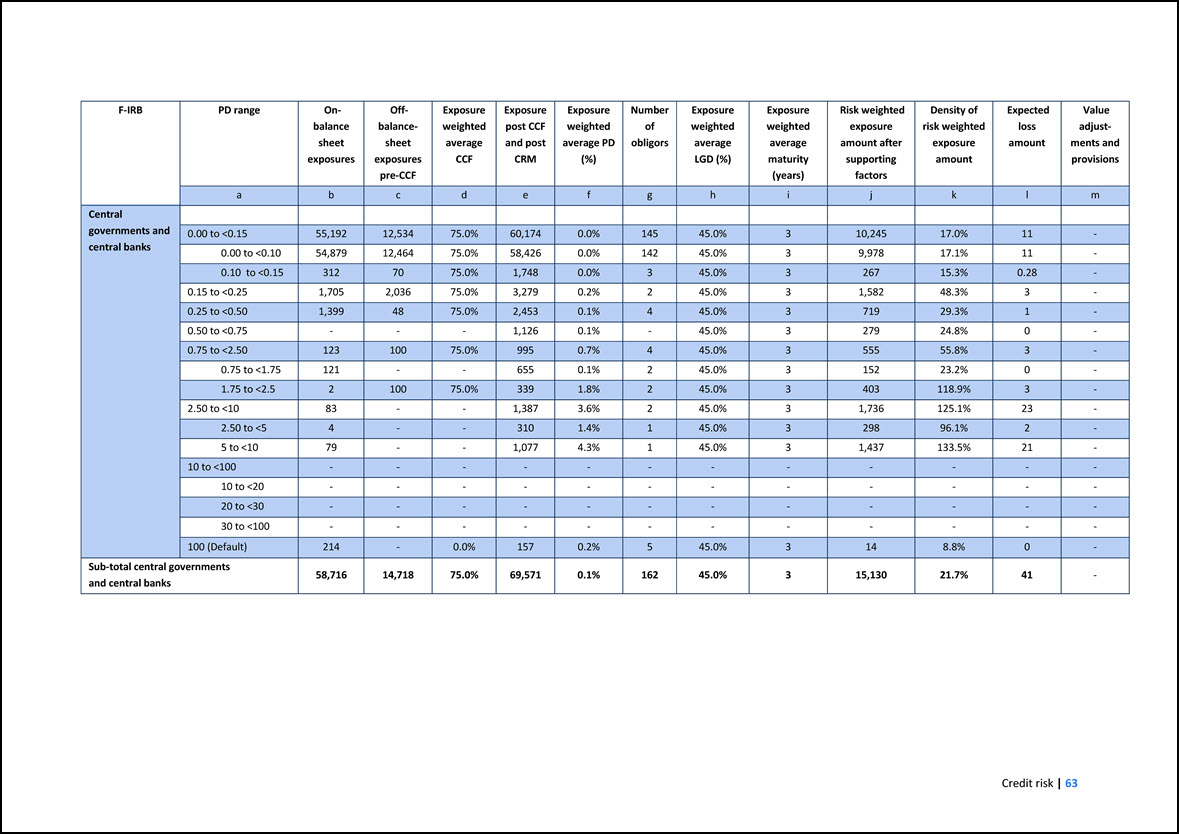
F-IRB PD range On- balance sheet exposures Off- balance- sheet exposures pre-CCF Exposure weighted average CCF Exposure post CCF and post CRM Exposure weighted
average PD (%) Number of obligors Exposure weighted average LGD (%) Exposure weighted average maturity (years) Risk weighted exposure amount after supporting factors Density of risk weighted exposure amount Expected loss amount Value adjust-
ments and provisions a b c d e f g h i j k l m Central governments and central banks 0.00 to <0.15 55,192 12,534 75.0% 60,174 0.0% 145 45.0% 3 10,245 17.0% 11 - 0.00 to <0.10 54,879 12,464
75.0% 58,426 0.0% 142 45.0% 3 9,978 17.1% 11 - 0.10 to <0.15 312 70 75.0% 1,748 0.0% 3 45.0% 3 267 15.3% 0.28 - 0.15 to <0.25 1,705 2,036 75.0% 3,279 0.2% 2 45.0% 3 1,582 48.3% 3 - 0.25 to <0.50 1,399
48 75.0% 2,453 0.1% 4 45.0% 3 719 29.3% 1 - 0.50 to <0.75 - - - 1,126 0.1% - 45.0% 3 279 24.8% 0 - 0.75 to <2.50 123 100 75.0% 995 0.7% 4 45.0% 3 555 55.8% 3 - 0.75 to <1.75 121 - - 655 0.1% 2
45.0% 3 152 23.2% 0 - 1.75 to <2.5 2 100 75.0% 339 1.8% 2 45.0% 3 403 118.9% 3 - 2.50 to <10 83 - - 1,387 3.6% 2 45.0% 3 1,736 125.1% 23 - 2.50 to <5 4 - - 310 1.4% 1 45.0% 3 298 96.1% 2 - 5 to
<10 79 - - 1,077 4.3% 1 45.0% 3 1,437 133.5% 21 - 10 to <100 - - - - - - - - - - - - 10 to <20 - - - - - - - - - - - - 20 to <30 - - - - - - - - - - - - 30 to <100 - - - - - -
- - - - - - 100 (Default) 214 - 0.0% 157 0.2% 5 45.0% 3 14 8.8% 0 - Sub-total central governments and central banks 58,716 14,718 75.0% 69,571 0.1% 162 45.0% 3 15,130 21.7% 41 -
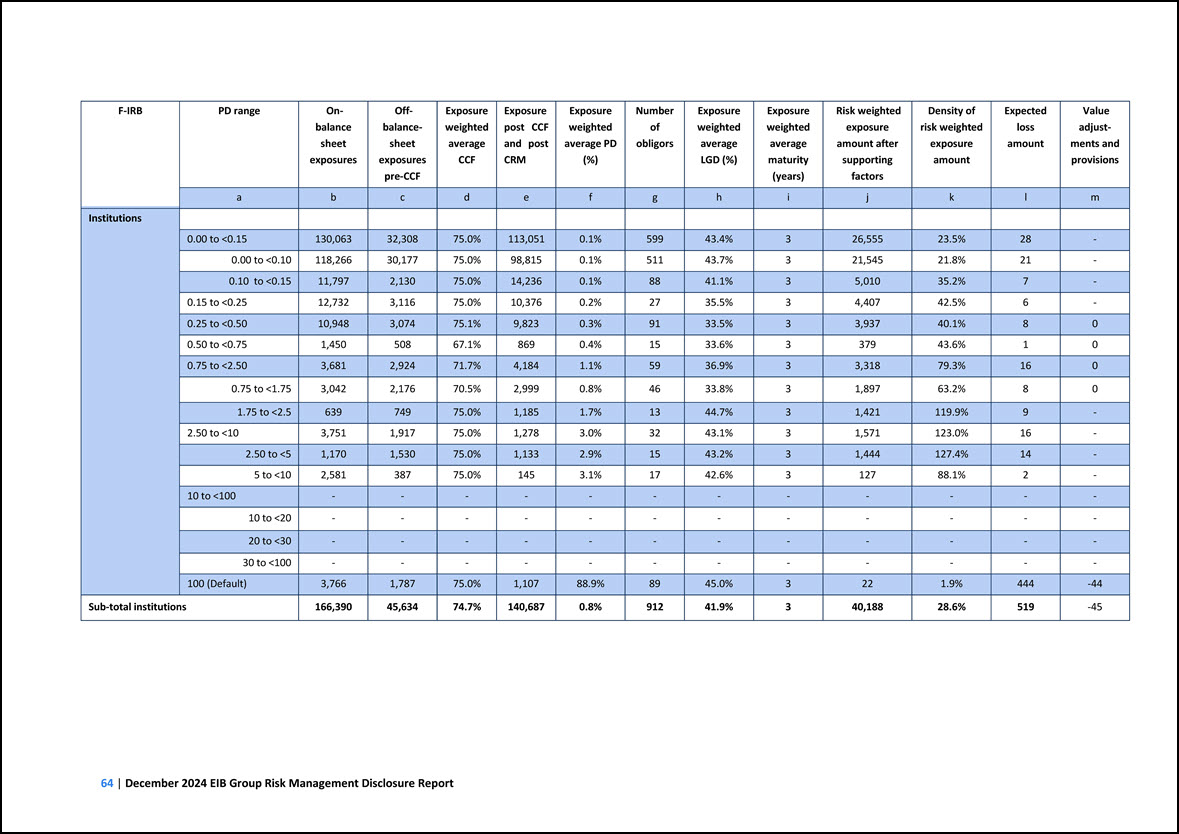
F-IRB PD range On- balance sheet exposures Off- balance- sheet exposures pre-CCF Exposure weighted average CCF Exposure post CCF and post CRM Exposure weighted
average PD (%) Number of obligors Exposure weighted average LGD (%) Exposure weighted average maturity (years) Risk weighted exposure amount after supporting factors Density of risk weighted exposure amount Expected loss amount Value adjust-
ments and provisions a b c d e f g h i j k l m Institutions 0.00 to <0.15 130,063 32,308 75.0% 113,051 0.1% 599 43.4% 3 26,555 23.5% 28 - 0.00 to <0.10 118,266 30,177 75.0% 98,815 0.1% 511
43.7% 3 21,545 21.8% 21 - 0.10 to <0.15 11,797 2,130 75.0% 14,236 0.1% 88 41.1% 3 5,010 35.2% 7 - 0.15 to <0.25 12,732 3,116 75.0% 10,376 0.2% 27 35.5% 3 4,407 42.5% 6 - 0.25 to <0.50 10,948 3,074 75.1%
9,823 0.3% 91 33.5% 3 3,937 40.1% 8 0 0.50 to <0.75 1,450 508 67.1% 869 0.4% 15 33.6% 3 379 43.6% 1 0 0.75 to <2.50 3,681 2,924 71.7% 4,184 1.1% 59 36.9% 3 3,318 79.3% 16 0 0.75 to <1.75 3,042 2,176
70.5% 2,999 0.8% 46 33.8% 3 1,897 63.2% 8 0 1.75 to <2.5 639 749 75.0% 1,185 1.7% 13 44.7% 3 1,421 119.9% 9 - 2.50 to <10 3,751 1,917 75.0% 1,278 3.0% 32 43.1% 3 1,571 123.0% 16 - 2.50 to <5 1,170 1,530
75.0% 1,133 2.9% 15 43.2% 3 1,444 127.4% 14 - 5 to <10 2,581 387 75.0% 145 3.1% 17 42.6% 3 127 88.1% 2 - 10 to <100 - - - - - - - - - - - - 10 to <20 - - - - - - - - - - - - 20 to <30 -
- - - - - - - - - - - 30 to <100 - - - - - - - - - - - - 100 (Default) 3,766 1,787 75.0% 1,107 88.9% 89 45.0% 3 22 1.9% 444 -44 Sub-total institutions 166,390 45,634 74.7% 140,687 0.8% 912 41.9% 3
40,188 28.6% 519 -45
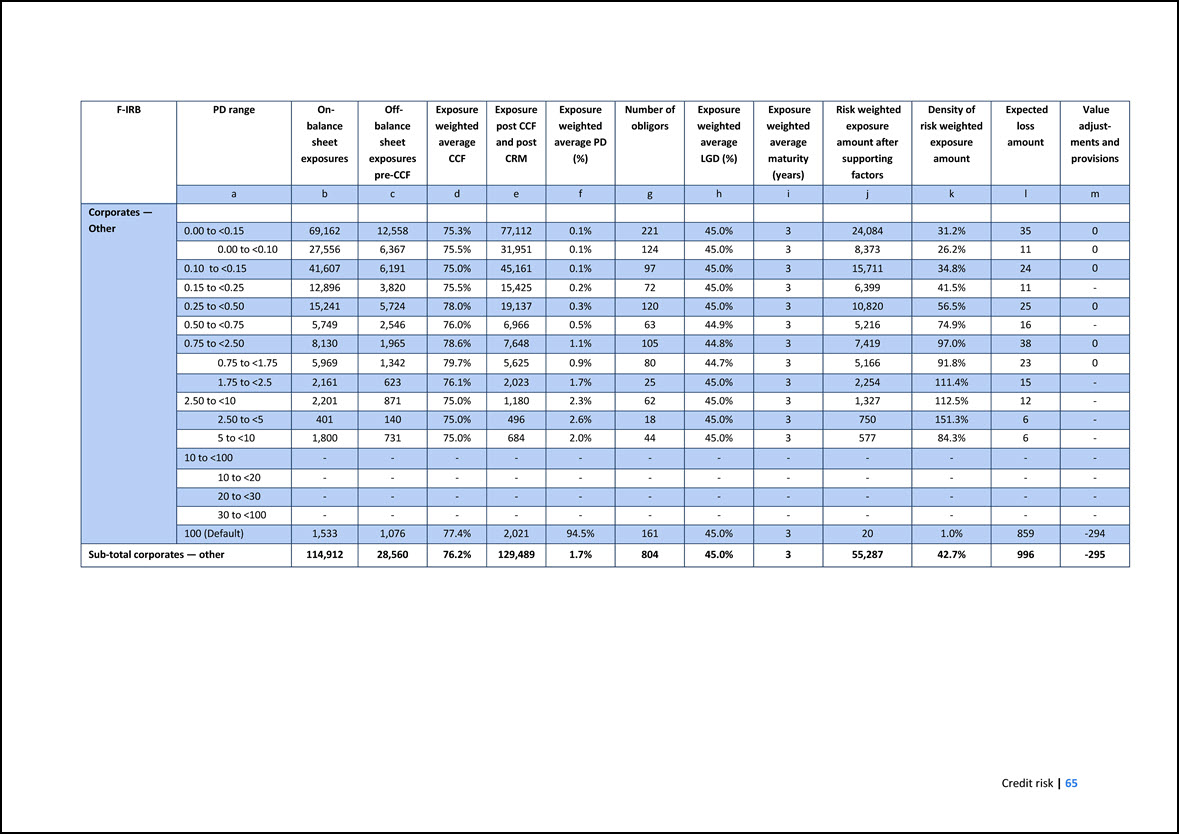
F-IRB PD range On- balance sheet exposures Off- balance sheet exposures pre-CCF Exposure weighted average CCF Exposure post CCF and post CRM Exposure weighted
average PD (%) Number of obligors Exposure weighted average LGD (%) Exposure weighted average maturity (years) Risk weighted exposure amount after supporting factors Density of risk weighted exposure amount Expected loss amount Value adjust-
ments and provisions a b c d e f g h i j k l m Corporates — Other 0.00 to <0.15 69,162 12,558 75.3% 77,112 0.1% 221 45.0% 3 24,084 31.2% 35 0 0.00 to <0.10 27,556 6,367 75.5% 31,951 0.1% 124
45.0% 3 8,373 26.2% 11 0 0.10 to <0.15 41,607 6,191 75.0% 45,161 0.1% 97 45.0% 3 15,711 34.8% 24 0 0.15 to <0.25 12,896 3,820 75.5% 15,425 0.2% 72 45.0% 3 6,399 41.5% 11 - 0.25 to <0.50 15,241 5,724 78.0%
19,137 0.3% 120 45.0% 3 10,820 56.5% 25 0 0.50 to <0.75 5,749 2,546 76.0% 6,966 0.5% 63 44.9% 3 5,216 74.9% 16 - 0.75 to <2.50 8,130 1,965 78.6% 7,648 1.1% 105 44.8% 3 7,419 97.0% 38 0 0.75 to <1.75 5,969
1,342 79.7% 5,625 0.9% 80 44.7% 3 5,166 91.8% 23 0 1.75 to <2.5 2,161 623 76.1% 2,023 1.7% 25 45.0% 3 2,254 111.4% 15 - 2.50 to <10 2,201 871 75.0% 1,180 2.3% 62 45.0% 3 1,327 112.5% 12 - 2.50 to <5 401
140 75.0% 496 2.6% 18 45.0% 3 750 151.3% 6 - 5 to <10 1,800 731 75.0% 684 2.0% 44 45.0% 3 577 84.3% 6 - 10 to <100 - - - - - - - - - - - - 10 to <20 - - - - - - - - - - - - 20 to <30 -
- - - - - - - - - - - 30 to <100 - - - - - - - - - - - - 100 (Default) 1,533 1,076 77.4% 2,021 94.5% 161 45.0% 3 20 1.0% 859 -294 Sub-total corporates — other 114,912 28,560 76.2% 129,489 1.7% 804 45.0%
3 55,287 42.7% 996 -295
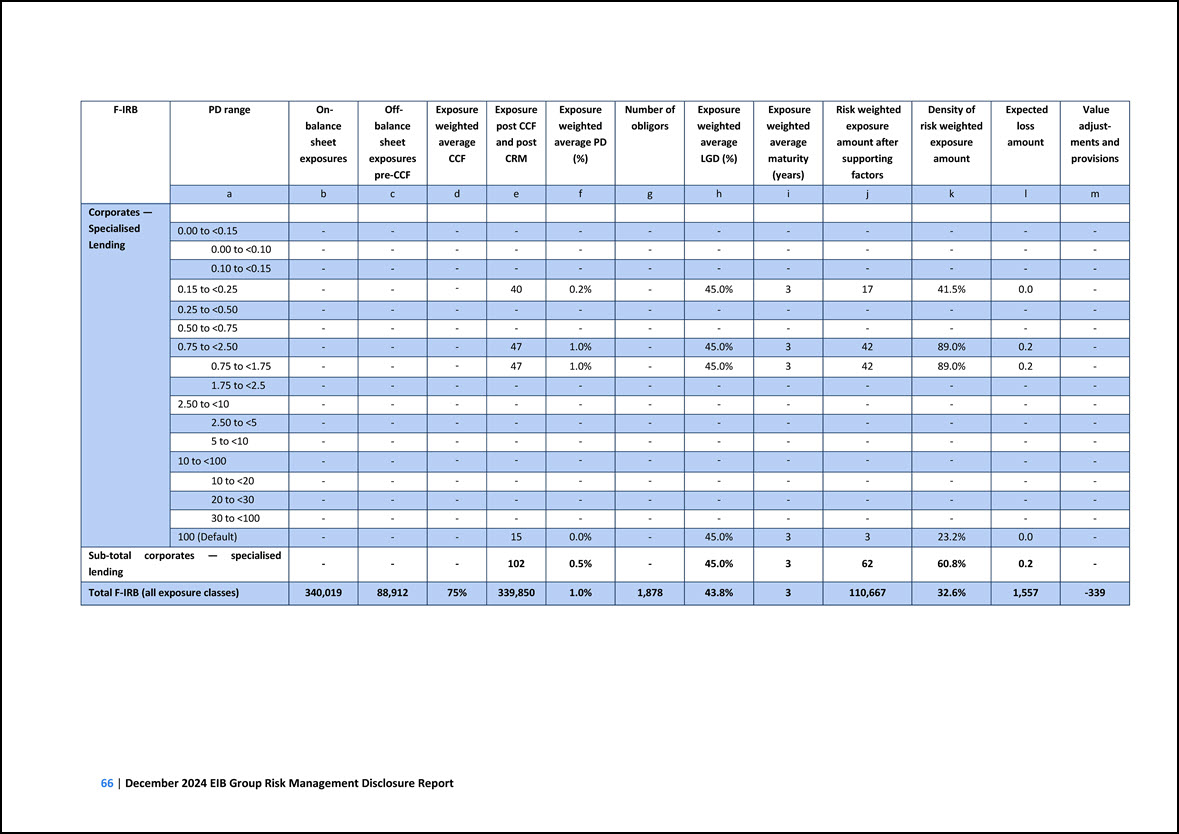
F-IRB PD range On- balance sheet exposures Off- balance sheet exposures pre-CCF Exposure weighted average CCF Exposure post CCF and post CRM Exposure weighted
average PD (%) Number of obligors Exposure weighted average LGD (%) Exposure weighted average maturity (years) Risk weighted exposure amount after supporting factors Density of risk weighted exposure amount Expected loss amount Value adjust-
ments and provisions a b c d e f g h i j k l m Corporates — Specialised Lending 0.00 to <0.15 - - - - - - - - - - - - 0.00 to <0.10 - - - - - - - - - - - - 0.10 to <0.15 - - -
- - - - - - - - - 0.15 to <0.25 - - - 40 0.2% - 45.0% 3 17 41.5% 0.0 - 0.25 to <0.50 - - - - - - - - - - - - 0.50 to <0.75 - - - - - - - - - - - - 0.75 to <2.50 - - - 47 1.0% - 45.0%
3 42 89.0% 0.2 - 0.75 to <1.75 - - - 47 1.0% - 45.0% 3 42 89.0% 0.2 - 1.75 to <2.5 - - - - - - - - - - - - 2.50 to <10 - - - - - - - - - - - - 2.50 to <5 - - - - - - - - - - - - 5
to <10 - - - - - - - - - - - - 10 to <100 - - - - - - - - - - - - 10 to <20 - - - - - - - - - - - - 20 to <30 - - - - - - - - - - - - 30 to <100 - - - - - - - - - - - -
100 (Default) - - - 15 0.0% - 45.0% 3 3 23.2% 0.0 - Sub-total corporates — specialised lending - - - 102 0.5% - 45.0% 3 62 60.8% 0.2 - Total F-IRB (all exposure classes) 340,019 88,912 75% 339,850 1.0% 1,878 43.8% 3
110,667 32.6% 1,557 -339
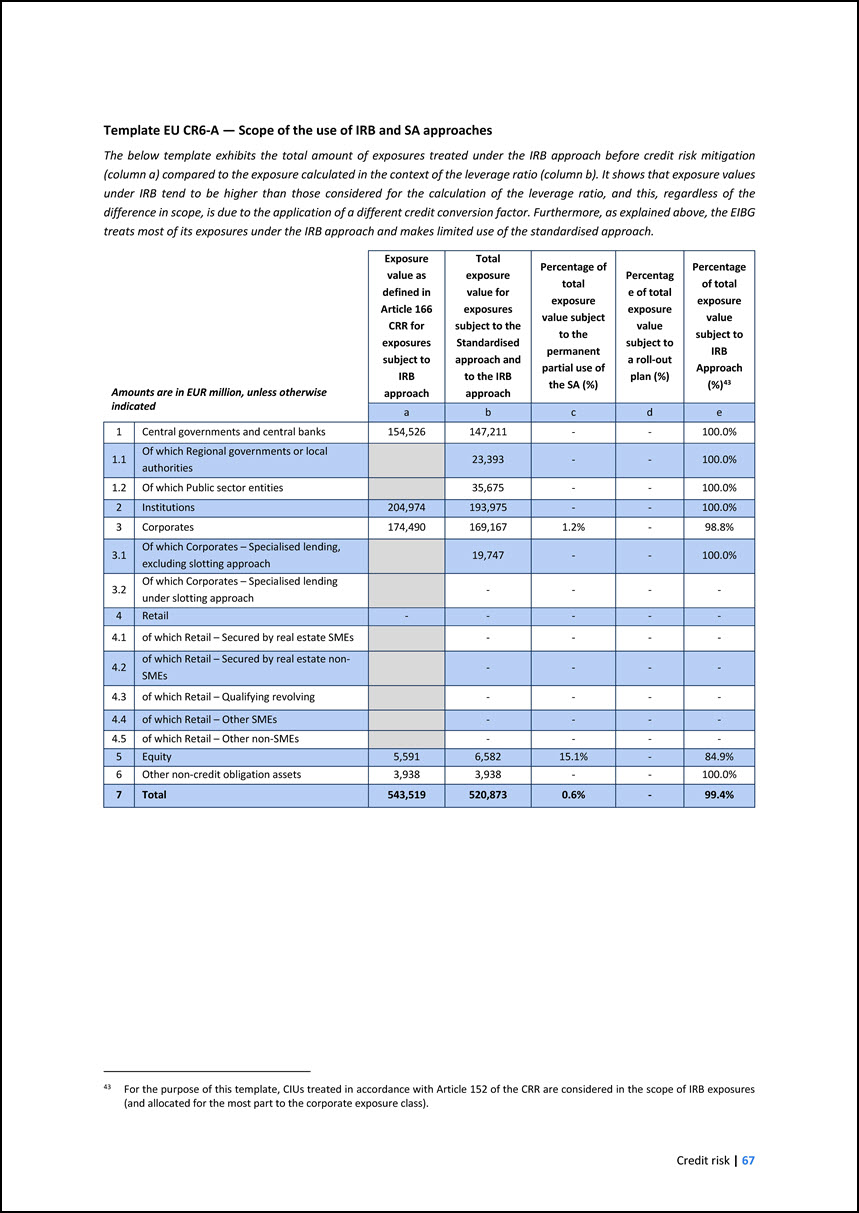
Template EU CR6-A — Scope of the use of IRB and SA approaches The below template exhibits the total amount of exposures treated under the IRB approach before credit
risk mitigation (column a) compared to the exposure calculated in the context of the leverage ratio (column b). It shows that exposure values under IRB tend to be higher than those considered for the calculation of the leverage ratio, and this,
regardless of the difference in scope, is due to the application of a different credit conversion factor. Furthermore, as explained above, the EIBG treats most of its exposures under the IRB approach and makes limited use of the standardised
approach. Amounts are in EUR million, unless otherwise indicated Exposure value as defined in Article 166 CRR for exposures subject to IRB approach Total exposure value for exposures subject to the Standardised approach and to the IRB approach
Percentage of total exposure value subject to the permanent partial use of the SA (%) Percentage of total exposure value subject to a roll-out plan (%) Percentage of total exposure value subject to IRB Approach (%)43 a b c d e 1 Central
governments and central banks 154,526 147,211 - - 100.0% 1.1 Of which Regional governments or local authorities 23,393 - - 100.0% 1.2 Of which Public sector entities 35,675 - - 100.0% 2 Institutions 204,974 193,975 - -
100.0% 3 Corporates 174,490 169,167 1.2% - 98.8% 3.1 Of which Corporates – Specialised lending, excluding slotting approach 19,747 - - 100.0% 3.2 Of which Corporates – Specialised lending under slotting approach - - - - 4
Retail - - - - - 4.1 of which Retail – Secured by real estate SMEs - - - - 4.2 of which Retail – Secured by real estate non- SMEs - - - - 4.3 of which Retail – Qualifying revolving - - - - 4.4 of which Retail – Other
SMEs - - - - 4.5 of which Retail – Other non-SMEs - - - - 5 Equity 5,591 6,582 15.1% - 84.9% 6 Other non-credit obligation assets 3,938 3,938 - - 100.0% 7 Total 543,519 520,873 0.6% - 99.4% 43 For the purpose of
this template, CIUs treated in accordance with Article 152 of the CRR are considered in the scope of IRB exposures (and allocated for the most part to the corporate exposure class).
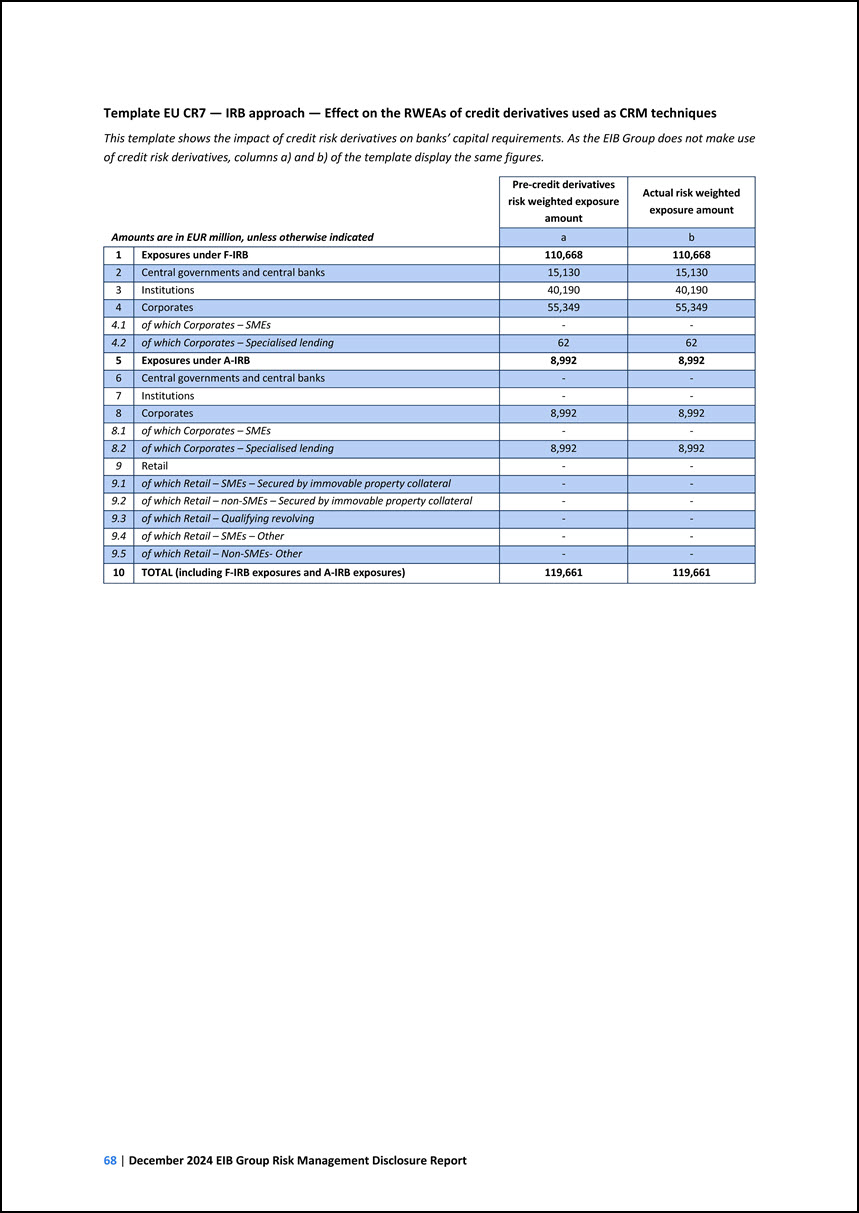
Template EU CR7 — IRB approach — Effect on the RWEAs of credit derivatives used as CRM techniques This template shows the impact of credit risk derivatives on banks’
capital requirements. As the EIB Group does not make use of credit risk derivatives, columns a) and b) of the template display the same figures. Amounts are in EUR million, unless otherwise indicated Pre-credit derivatives risk weighted exposure
amount Actual risk weighted exposure amount a b 1 Exposures under F-IRB 110,668 110,668 2 Central governments and central banks 15,130 15,130 3 Institutions 40,190 40,190 4 Corporates 55,349 55,349 4.1 of which Corporates – SMEs
- - 4.2 of which Corporates – Specialised lending 62 62 5 Exposures under A-IRB 8,992 8,992 6 Central governments and central banks - - 7 Institutions - - 8 Corporates 8,992 8,992 8.1 of which Corporates – SMEs - - 8.2 of
which Corporates – Specialised lending 8,992 8,992 9 Retail - - 9.1 of which Retail – SMEs – Secured by immovable property collateral - - 9.2 of which Retail – non-SMEs – Secured by immovable property collateral - - 9.3 of which
Retail – Qualifying revolving - - 9.4 of which Retail – SMEs – Other - - 9.5 of which Retail – Non-SMEs- Other - - 10 TOTAL (including F-IRB exposures and A-IRB exposures) 119,661 119,661
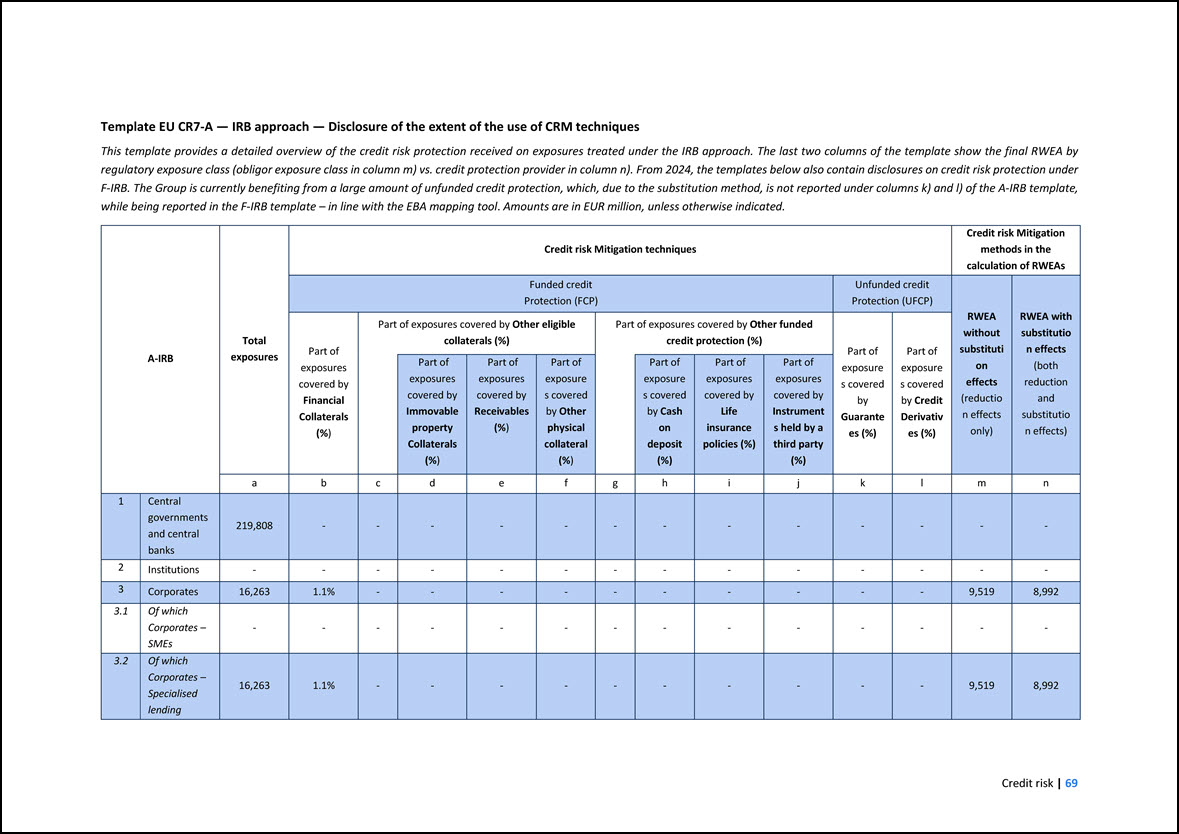
Template EU CR7-A — IRB approach — Disclosure of the extent of the use of CRM techniques This template provides a detailed overview of the credit risk protection
received on exposures treated under the IRB approach. The last two columns of the template show the final RWEA by regulatory exposure class (obligor exposure class in column m) vs. credit protection provider in column n). From 2024, the templates
below also contain disclosures on credit risk protection under F-IRB. The Group is currently benefiting from a large amount of unfunded credit protection, which, due to the substitution method, is not reported under columns k) and l) of the A-IRB
template, while being reported in the F-IRB template – in line with the EBA mapping tool. Amounts are in EUR million, unless otherwise indicated. A-IRB Total exposures Credit risk Mitigation techniques Credit risk Mitigation methods in the
calculation of RWEAs Funded credit Protection (FCP) Unfunded credit Protection (UFCP) RWEA without substitution effects (reduction effects only) RWEA with substitution effects (both reduction and substitution effects) Part of exposures covered
by Financial Collaterals (%) Part of exposures covered by Other eligible collaterals (%) Part of exposures covered by Other funded credit protection (%) Part of exposures covered by Guarantees (%) Part of exposures covered by Credit Derivatives
(%) Part of exposures covered by Immovable property Collaterals (%) Part of exposures covered by Receivables (%) Part of exposures covered by Other physical collateral (%) Part of exposures covered by Cash on deposit (%) Part of exposures
covered by Life insurance policies (%) Part of exposures covered by Instruments held by a third party (%) a b c d e f g h i j k l m n 1 Central governments and central banks 219,808 - - - - - - - - - - - - - 2
Institutions - - - - - - - - - - - - - - 3 Corporates 16,263 1.1% - - - - - - - - - - 9,519 8,992 3.1 Of which Corporates – SMEs - - - - - - - - - - - - - - 3.2 Of which Corporates – Specialised
lending 16,263 1.1% - - - - - - - - - - 9,519 8,992
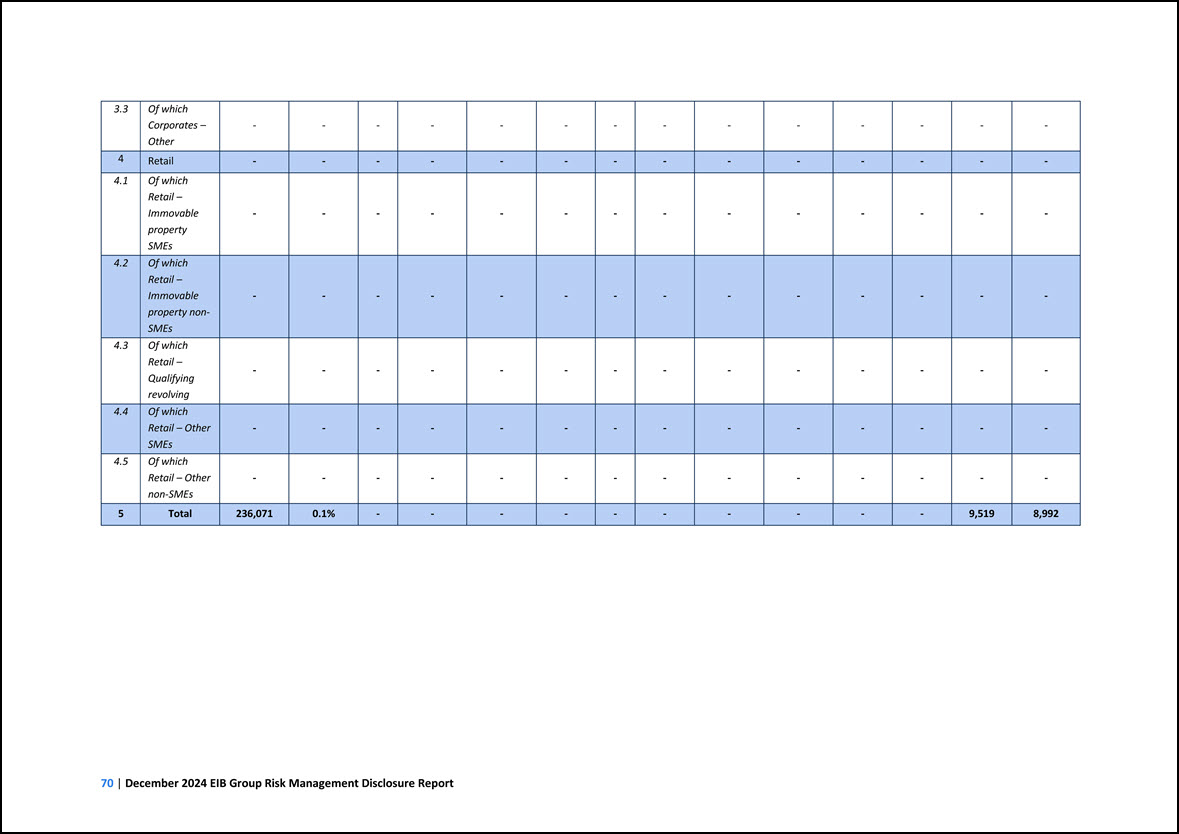
3.3 Of which Corporates – Other - - - - - - - - - - - - - - 4 Retail - - - - - - - - - - - - - - 4.1 Of which Retail – Immovable
property SMEs - - - - - - - - - - - - - - 4.2 Of which Retail – Immovable property non- SMEs - - - - - - - - - - - - - - 4.3 Of which Retail – Qualifying revolving - - - - - - - - - - - - - - 4.4 Of
which Retail – Other SMEs - - - - - - - - - - - - - - 4.5 Of which Retail – Other non-SMEs - - - - - - - - - - - - - - 5 Total 236,071 0.1% - - - - - - - - - - 9,519 8,992
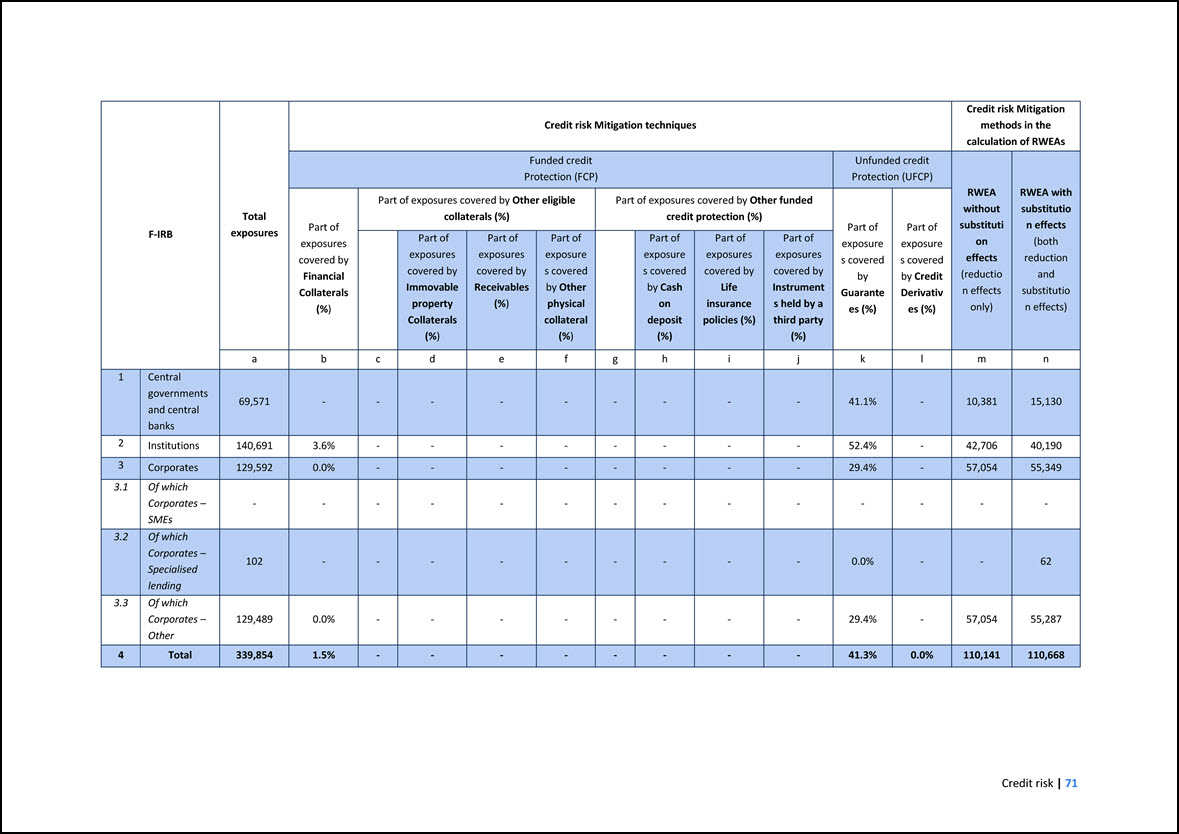
F-IRB Total exposures Credit risk Mitigation techniques Credit risk Mitigation methods in the calculation of RWEAs Funded credit Protection (FCP) Unfunded credit
Protection (UFCP) RWEA without substitution effects (reduction effects only) RWEA with substitution effects (both reduction and substitution effects) Part of exposures covered by Financial Collaterals (%) Part of exposures covered by Other
eligible collaterals (%) Part of exposures covered by Other funded credit protection (%) Part of exposures covered by Guarantees (%) Part of exposures covered by Credit Derivatives (%) Part of exposures covered by Immovable property Collaterals
(%) Part of exposures covered by Receivables (%) Part of exposures covered by Other physical collateral (%) Part of exposures covered by Cash on deposit (%) Part of exposures covered by Life insurance policies (%) Part of exposures covered by
Instruments held by a third party (%) a b c d e f g h i j k l m n 1 Central governments and central banks 69,571 - - - - - - - - - 41.1% - 10,381 15,130 2 Institutions 140,691 3.6% - - - - - - - - 52.4% -
42,706 40,190 3 Corporates 129,592 0.0% - - - - - - - - 29.4% - 57,054 55,349 3.1 Of which Corporates – SMEs - - - - - - - - - - - - - - 3.2 Of which Corporates – Specialised lending 102 - - - - - - - - -
0.0% - - 62 3.3 Of which Corporates – Other 129,489 0.0% - - - - - - - - 29.4% - 57,054 55,287 4 Total 339,854 1.5% - - - - - - - - 41.3% 0.0% 110,141 110,668
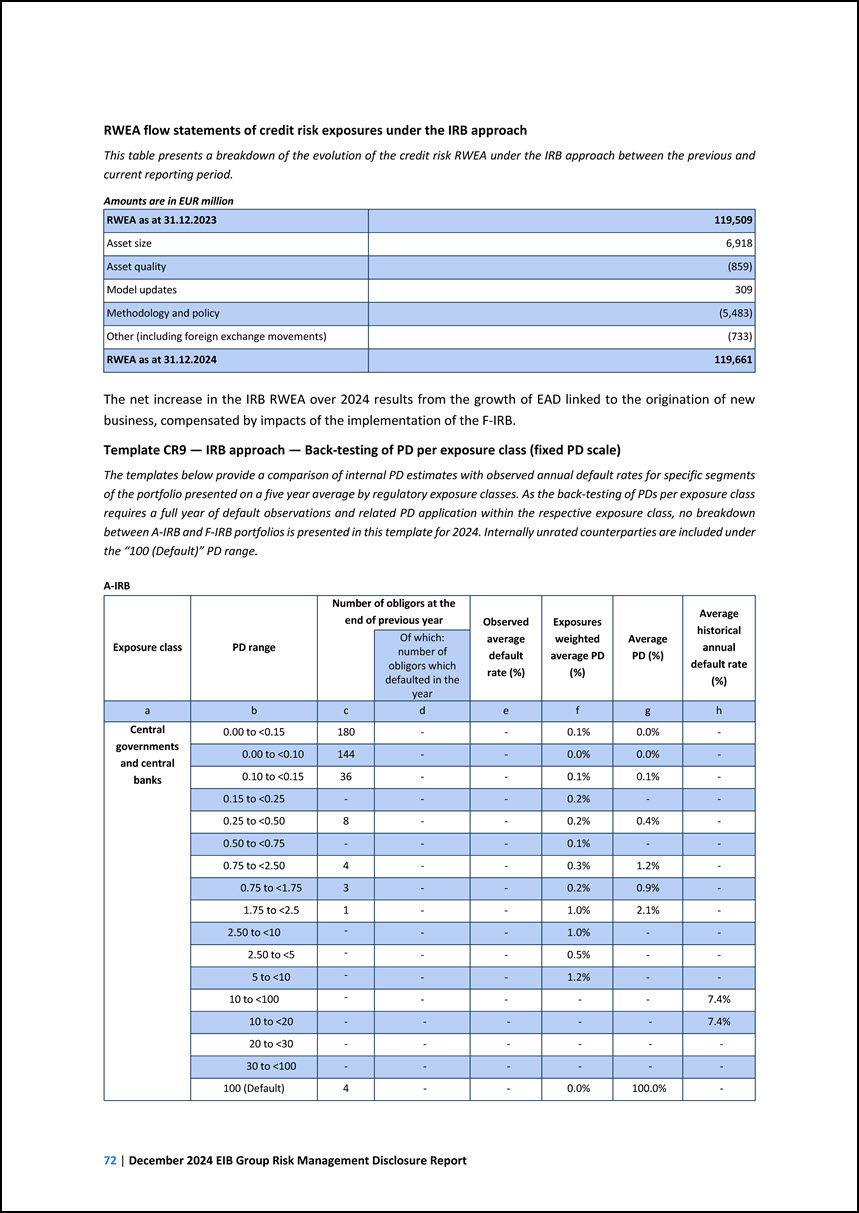
RWEA flow statements of credit risk exposures under the IRBapproach Thistablepresents a breakdown oftheevolution ofthecreditrisk RWEA under the IRB approach between
the previous andcurrent reportingperiod. Amounts are in EURmillion RWEA as at31.12.2023119,509Asset size6,918Asset quality(859) Model updates309Methodology and policy(5,483) Other (including foreign exchange movements)(733) RWEA as at
31.12.2024119,661 Thenetincreaseinthe IRBRWEAover2024 results from the growth of EAD linked tothe origination of new business, compensated by impacts of theimplementation of the F-IRB. Template CR9—IRB approach—Back-testing of PD per exposure class
(fixed PD scale) The templates below providea comparison of internal PD estimates with observed annual default rates for specific segmentsof the portfoliopresented on a fiveyear average by regulatory exposureclasses.As theback-testing ofPDsper
exposure class requires a full yearofdefault observations and related PDapplicationwithin the respective exposure class,no breakdownbetween A-IRB and F-IRB portfoliosispresentedin this template for2024.Internally unrated counterparties are included
underthe “100 (Default)” PDrange. A-IRB Exposure classPD rangeNumber ofobligors at the end of previous yearObservedaverage defaultrate (%) Exposures weightedaverage PD(%) AveragePD (%) Averagehistoricalannualdefault rate(%) Of which: number
ofobligors whichdefaulted in theyearabcdefghCentralgovernments and centralbanks0.00 to <0.15180--0.1% 0.0%- 0.00 to <0.10144--0.0% 0.0%- 0.10 to <0.1536--0.1% 0.1%- 0.15 to <0.25---0.2% -- 0.25 to <0.508--0.2% 0.4%- 0.50 to
<0.75---0.1% -- 0.75 to <2.504--0.3% 1.2%- 0.75 to <1.753--0.2% 0.9%- 1.75 to <2.51--1.0% 2.1%- 2.50 to <10---1.0% -- 2.50 to <5---0.5% -- 5 to <10---1.2% -- 10 to <100-----7.4% 10 to <20-----7.4% 20 to <30------ 30 to
<100------ 100 (Default)4--0.0% 100.0% - 72|December 2024 EIB Group Risk Management DisclosureReport
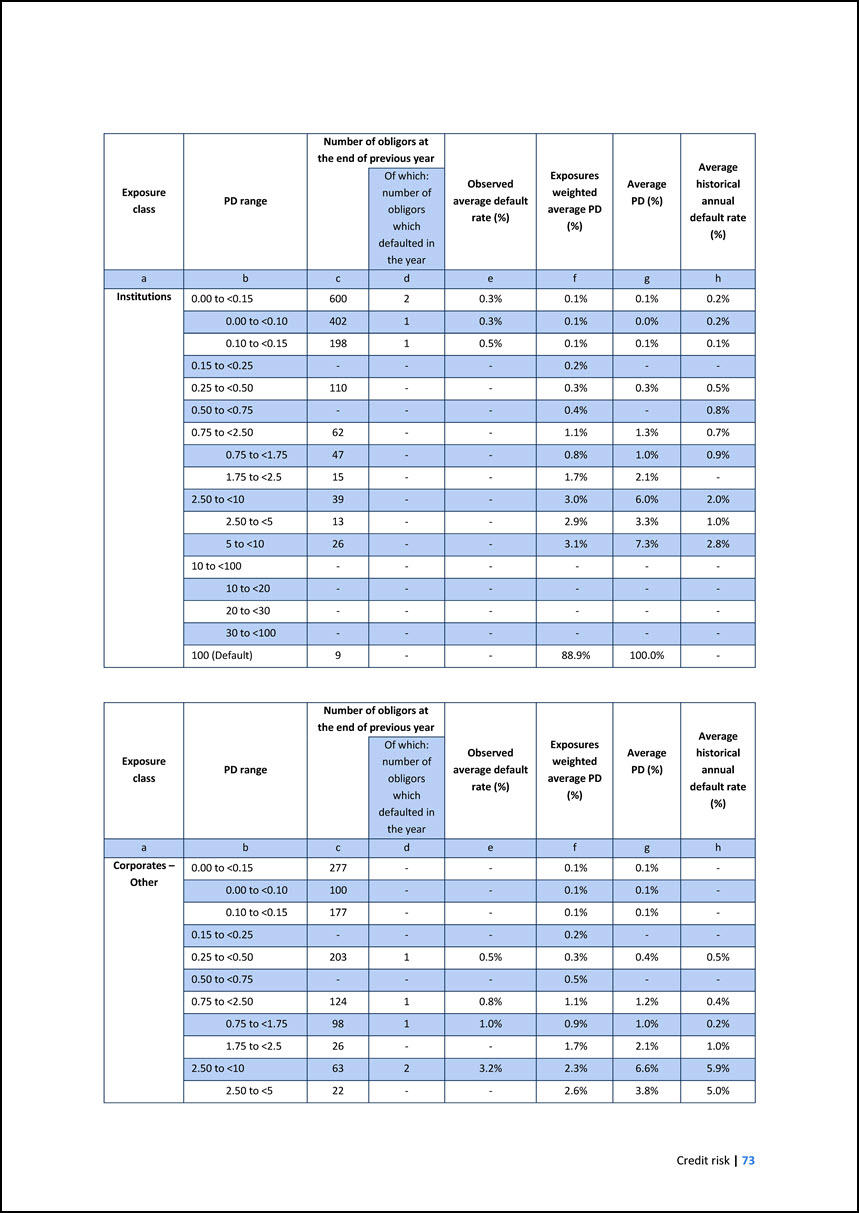
ExposureclassPD rangeNumber of obligors atthe end of previous yearObservedaverage defaultrate (%) Exposures weightedaverage PD(%) AveragePD (%)
Averagehistoricalannualdefault rate(%) Of which: number ofobligorswhich defaulted in the yearabcdefghInstitutions0.00 to <0.1560020.3%0.1% 0.1%0.2% 0.00 to <0.1040210.3%0.1% 0.0%0.2% 0.10 to <0.1519810.5%0.1% 0.1%0.1% 0.15 to <0.25---0.2%
-- 0.25 to <0.50110--0.3% 0.3%0.5% 0.50 to <0.75---0.4% -0.8% 0.75 to <2.5062--1.1% 1.3%0.7% 0.75 to <1.7547--0.8% 1.0%0.9% 1.75 to <2.515--1.7% 2.1%- 2.50 to <1039--3.0% 6.0%2.0% 2.50 to <513--2.9% 3.3%1.0% 5 to <1026--3.1%
7.3%2.8% 10 to <100------ 10 to <20------ 20 to <30------ 30 to <100------ 100 (Default)9--88.9% 100.0%- ExposureclassPD rangeNumber of obligors atthe end of previous yearObservedaverage defaultrate (%) Exposures weightedaverage PD(%)
AveragePD (%) Averagehistoricalannualdefault rate(%) Of which: number ofobligorswhich defaulted in the yearabcdefghCorporates– Other0.00 to <0.15277--0.1% 0.1%- 0.00 to <0.10100--0.1% 0.1%- 0.10 to <0.15177--0.1% 0.1%- 0.15 to
<0.25---0.2% -- 0.25 to<0.5020310.5%0.3% 0.4%0.5% 0.50 to <0.75---0.5% -- 0.75 to <2.5012410.8%1.1% 1.2%0.4% 0.75 to <1.759811.0%0.9% 1.0%0.2% 1.75 to <2.526--1.7% 2.1%1.0% 2.50 to <106323.2%2.3% 6.6%5.9% 2.50 to <522--2.6%
3.8%5.0% Credit risk| 73
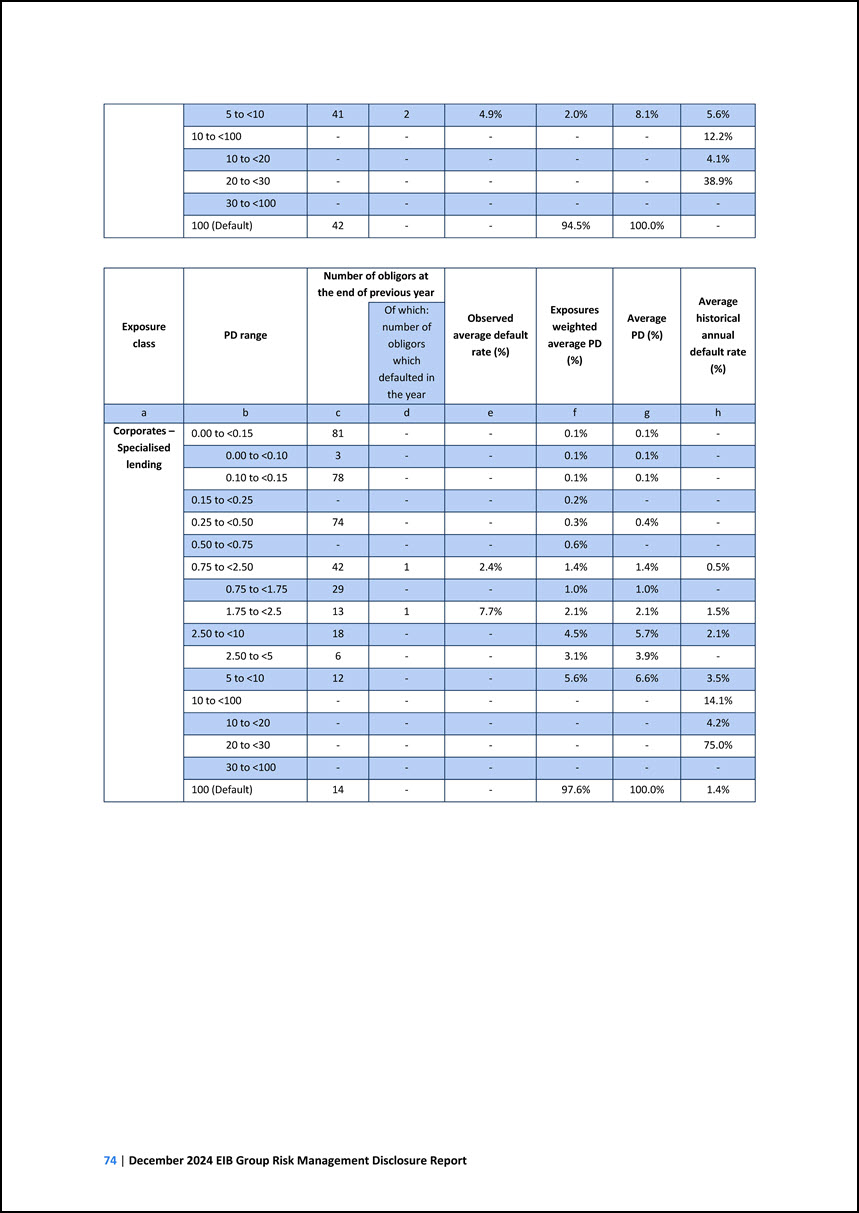
5 to <104124.9%2.0% 8.1%5.6% 10 to <100-----12.2% 10 to <20-----4.1% 20 to <30-----38.9% 30 to <100------ 100 (Default)42--94.5% 100.0%- ExposureclassPD
rangeNumber ofobligors atthe end of previous yearObservedaverage defaultrate (%) Exposures weightedaverage PD(%) AveragePD (%) Averagehistoricalannualdefault rate(%) Of which: number ofobligorswhich defaulted in the yearabcdefghCorporates–
Specialisedlending0.00 to <0.1581--0.1% 0.1%- 0.00 to <0.103--0.1% 0.1%- 0.10 to <0.1578--0.1% 0.1%- 0.15 to <0.25---0.2% -- 0.25 to <0.5074--0.3% 0.4%- 0.50 to <0.75---0.6% -- 0.75 to<2.504212.4%1.4% 1.4%0.5% 0.75 to
<1.7529--1.0% 1.0%- 1.75 to <2.51317.7%2.1% 2.1%1.5% 2.50 to <1018--4.5% 5.7%2.1% 2.50 to <56--3.1% 3.9%- 5 to <1012--5.6% 6.6%3.5% 10 to <100-----14.1% 10to <20-----4.2% 20 to <30-----75.0% 30 to <100------ 100
(Default)14--97.6% 100.0%1.4% 74|December 2024 EIB Group Risk Management DisclosureReport
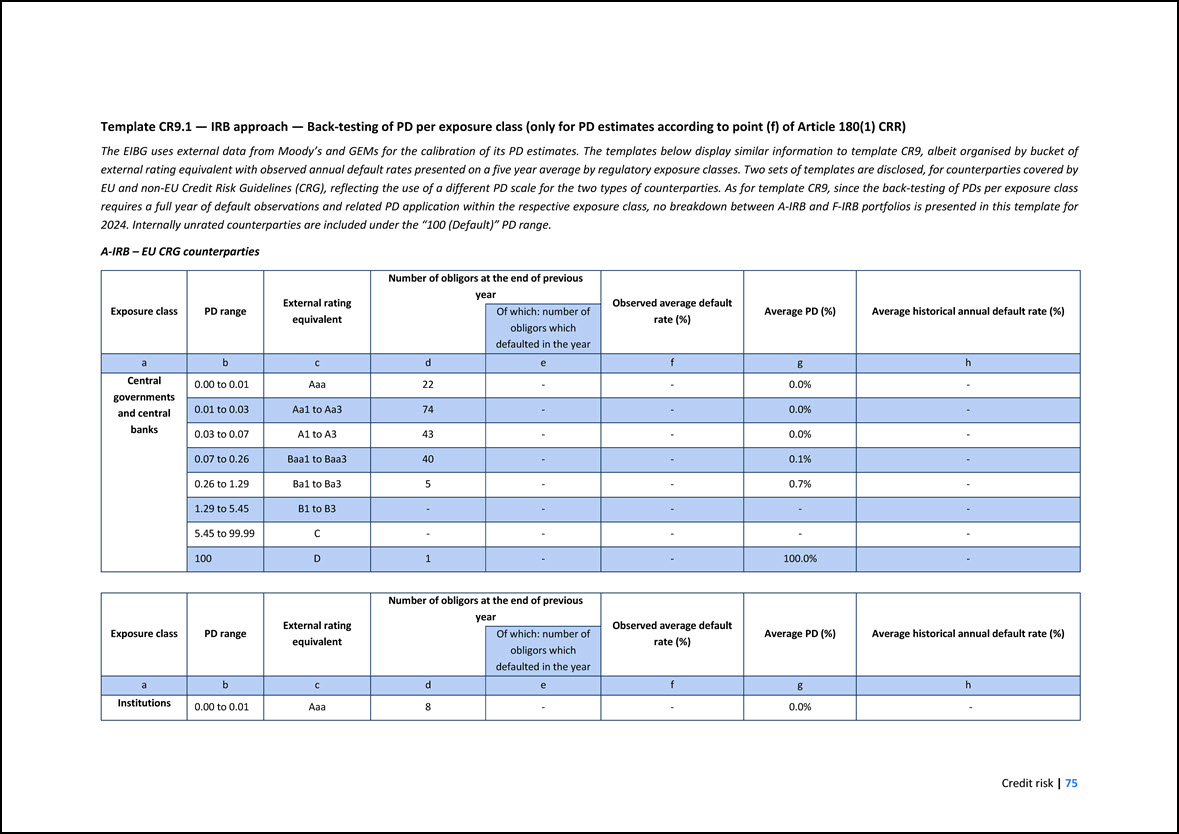
Template CR9.1 — IRB approach — Back-testing of PD per exposure class (only for PD estimates according to point (f) of Article 180(1) CRR) The EIBG uses external data
from Moody’s and GEMs for the calibration of its PD estimates. The templates below display similar information to template CR9, albeit organised by bucket of external rating equivalent with observed annual default rates presented on a five year
average by regulatory exposure classes. Two sets of templates are disclosed, for counterparties covered by EU and non-EU Credit Risk Guidelines (CRG), reflecting the use of a different PD scale for the two types of counterparties. As for template
CR9, since the back-testing of PDs per exposure class requires a full year of default observations and related PD application within the respective exposure class, no breakdown between A-IRB and F-IRB portfolios is presented in this template for
2024. Internally unrated counterparties are included under the “100 (Default)” PD range. A-IRB – EU CRG counterparties Exposure class PD range External rating equivalent Number of obligors at the end of previous year Observed average default
rate (%) Average PD (%) Average historical annual default rate (%) Of which: number of obligors which defaulted in the year a b c d e f g h Central governments and central banks 0.00 to 0.01 Aaa 22 - - 0.0% - 0.01 to 0.03 Aa1 to
Aa3 74 - - 0.0% - 0.03 to 0.07 A1 to A3 43 - - 0.0% - 0.07 to 0.26 Baa1 to Baa3 40 - - 0.1% - 0.26 to 1.29 Ba1 to Ba3 5 - - 0.7% - 1.29 to 5.45 B1 to B3 - - - - - 5.45 to 99.99 C - - - - - 100 D 1 - -
100.0% - Exposure class PD range External rating equivalent Number of obligors at the end of previous year Observed average default rate (%) Average PD (%) Average historical annual default rate (%) Of which: number of obligors which
defaulted in the year a b c d e f g h Institutions 0.00 to 0.01 Aaa 8 - - 0.0% -
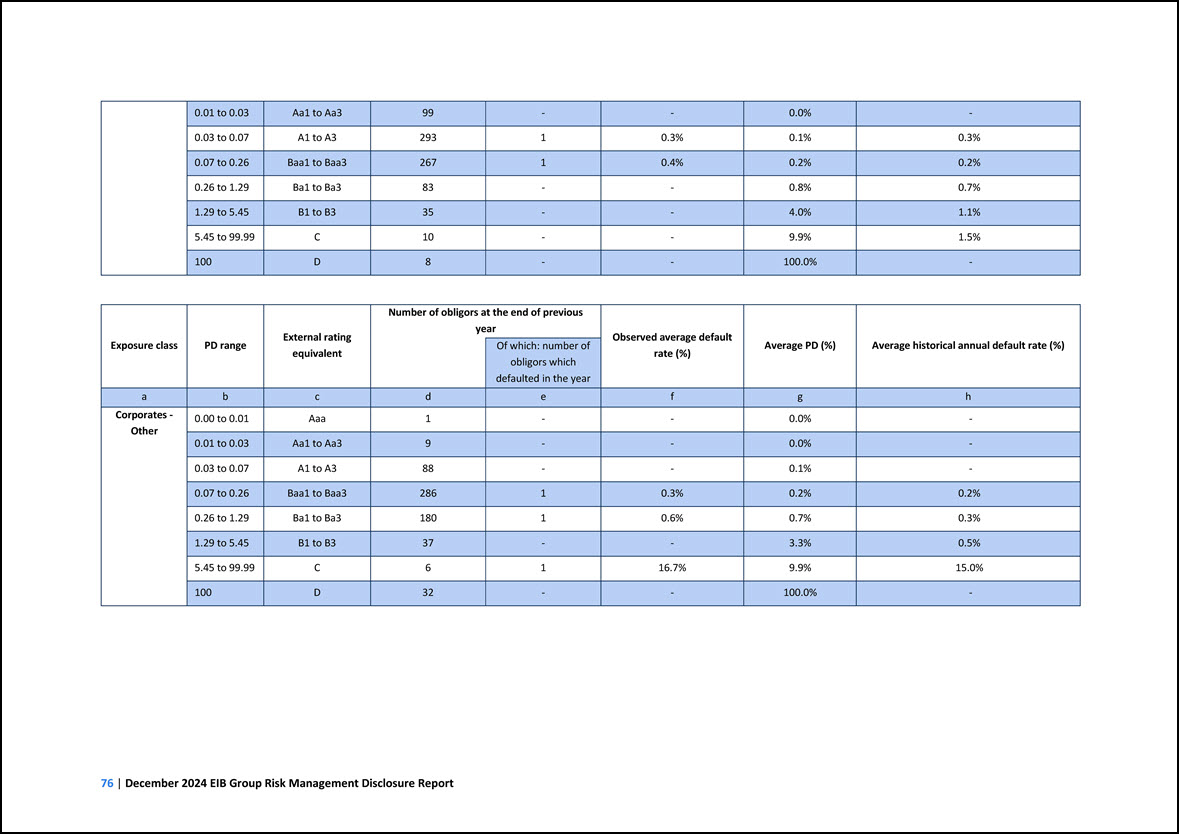
0.01 to 0.03 Aa1 to Aa3 99 - - 0.0% - 0.03 to 0.07 A1 to A3 293 1 0.3% 0.1% 0.3% 0.07 to 0.26 Baa1 to Baa3 267 1 0.4% 0.2% 0.2% 0.26 to 1.29 Ba1
to Ba3 83 - - 0.8% 0.7% 1.29 to 5.45 B1 to B3 35 - - 4.0% 1.1% 5.45 to 99.99 C 10 - - 9.9% 1.5% 100 D 8 - - 100.0% - Exposure class PD range External rating equivalent Number of obligors at the end of previous year
Observed average default rate (%) Average PD (%) Average historical annual default rate (%) Of which: number of obligors which defaulted in the year a b c d e f g h Corporates - Other 0.00 to 0.01 Aaa 1 - - 0.0% - 0.01 to 0.03
Aa1 to Aa3 9 - - 0.0% - 0.03 to 0.07 A1 to A3 88 - - 0.1% - 0.07 to 0.26 Baa1 to Baa3 286 1 0.3% 0.2% 0.2% 0.26 to 1.29 Ba1 to Ba3 180 1 0.6% 0.7% 0.3% 1.29 to 5.45 B1 to B3 37 - - 3.3% 0.5% 5.45 to 99.99 C 6 1
16.7% 9.9% 15.0% 100 D 32 - - 100.0% -
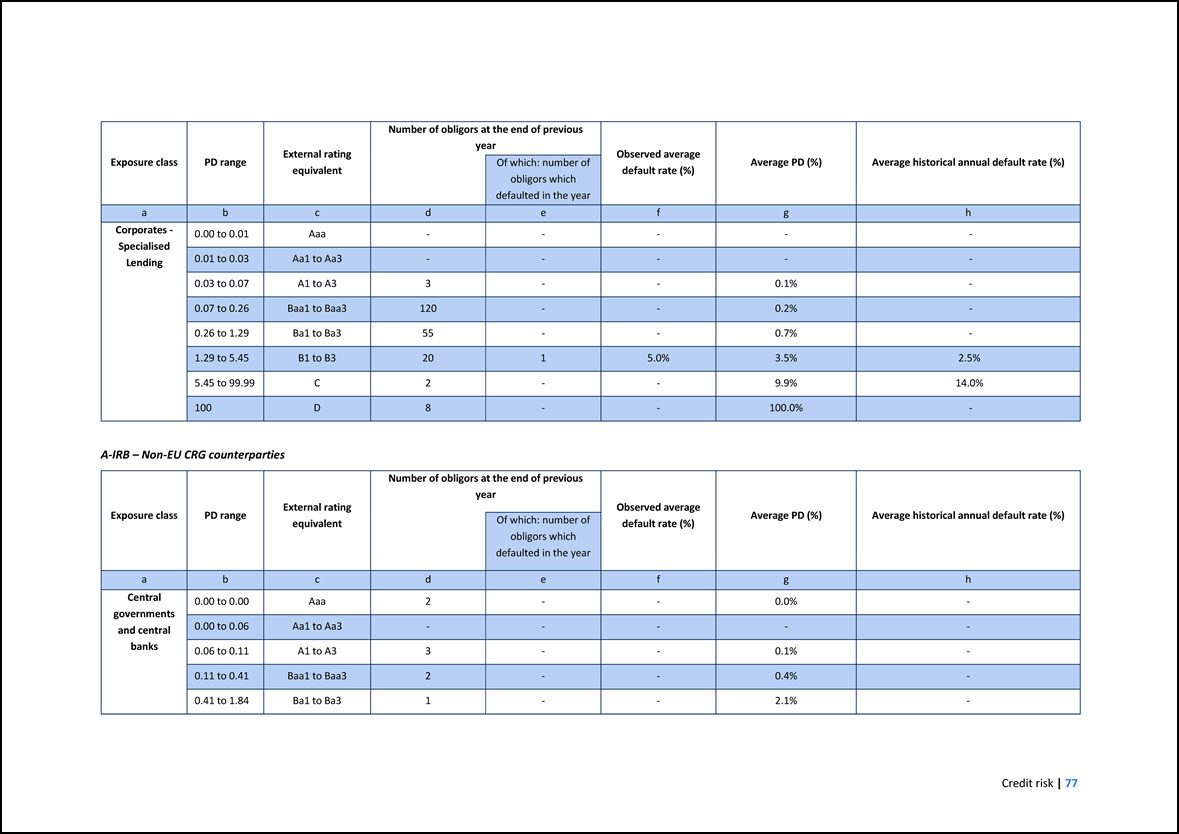
Exposure class PD range External rating equivalent Number of obligors at the end of previous year Observed average default rate (%) Average PD (%) Average
historical annual default rate (%) Of which: number of obligors which defaulted in the year a b c d e f g h Corporates - Specialised Lending 0.00 to 0.01 Aaa - - - - - 0.01 to 0.03 Aa1 to Aa3 - - - - - 0.03 to 0.07 A1 to
A3 3 - - 0.1% - 0.07 to 0.26 Baa1 to Baa3 120 - - 0.2% - 0.26 to 1.29 Ba1 to Ba3 55 - - 0.7% - 1.29 to 5.45 B1 to B3 20 1 5.0% 3.5% 2.5% 5.45 to 99.99 C 2 - - 9.9% 14.0% 100 D 8 - - 100.0% - A-IRB – Non-EU
CRG counterparties Exposure class PD range External rating equivalent Number of obligors at the end of previous year Observed average default rate (%) Average PD (%) Average historical annual default rate (%) Of which: number of obligors
which defaulted in the year a b c d e f g h Central governments and central banks 0.00 to 0.00 Aaa 2 - - 0.0% - 0.00 to 0.06 Aa1 to Aa3 - - - - - 0.06 to 0.11 A1 to A3 3 - - 0.1% - 0.11 to 0.41 Baa1 to Baa3 2 - -
0.4% - 0.41 to 1.84 Ba1 to Ba3 1 - - 2.1% -
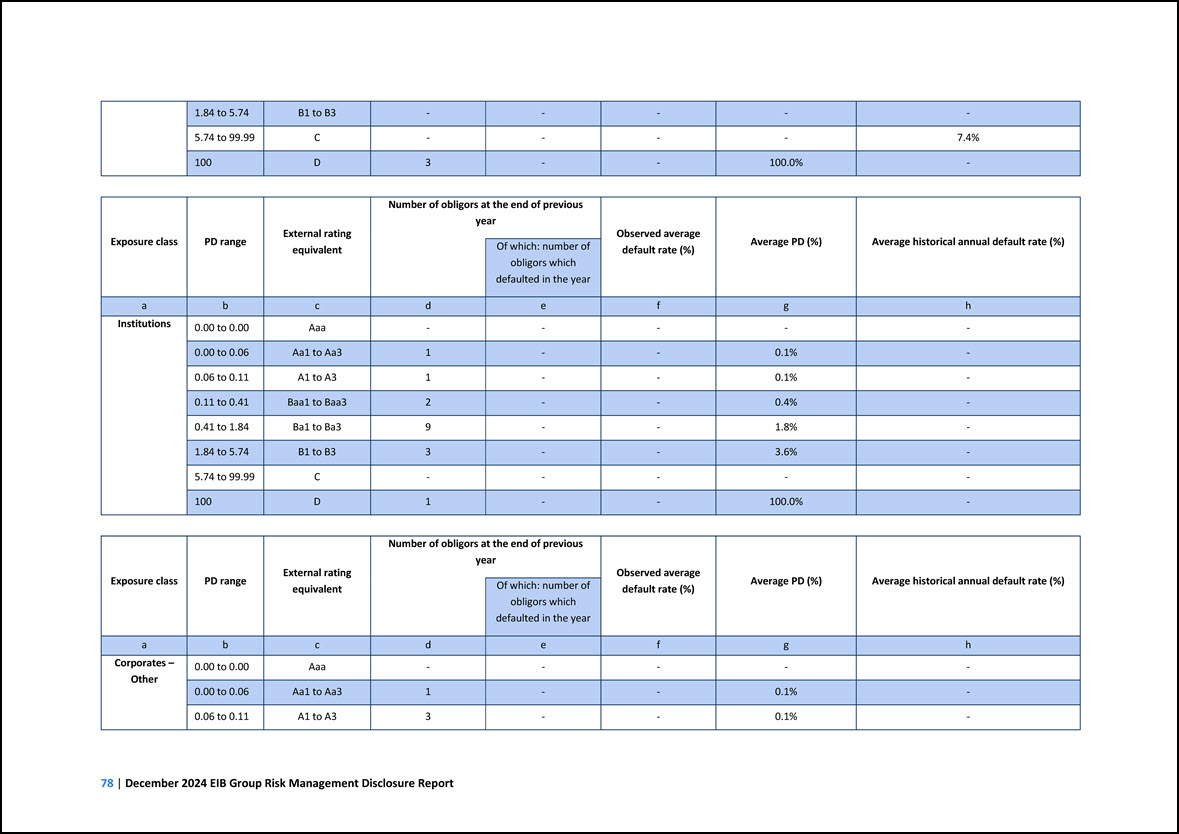
1.84 to 5.74 B1 to B3 - - - - - 5.74 to 99.99 C - - - - 7.4% 100 D 3 - - 100.0% - Exposure class PD range External rating equivalent Number
of obligors at the end of previous year Observed average default rate (%) Average PD (%) Average historical annual default rate (%) Of which: number of obligors which defaulted in the year a b c d e f g h Institutions 0.00 to 0.00
Aaa - - - - - 0.00 to 0.06 Aa1 to Aa3 1 - - 0.1% - 0.06 to 0.11 A1 to A3 1 - - 0.1% - 0.11 to 0.41 Baa1 to Baa3 2 - - 0.4% - 0.41 to 1.84 Ba1 to Ba3 9 - - 1.8% - 1.84 to 5.74 B1 to B3 3 - - 3.6% - 5.74 to
99.99 C - - - - - 100 D 1 - - 100.0% - Exposure class PD range External rating equivalent Number of obligors at the end of previous year Observed average default rate (%) Average PD (%) Average historical annual default rate
(%) Of which: number of obligors which defaulted in the year a b c d e f g h Corporates – Other 0.00 to 0.00 Aaa - - - - - 0.00 to 0.06 Aa1 to Aa3 1 - - 0.1% - 0.06 to 0.11 A1 to A3 3 - - 0.1% -
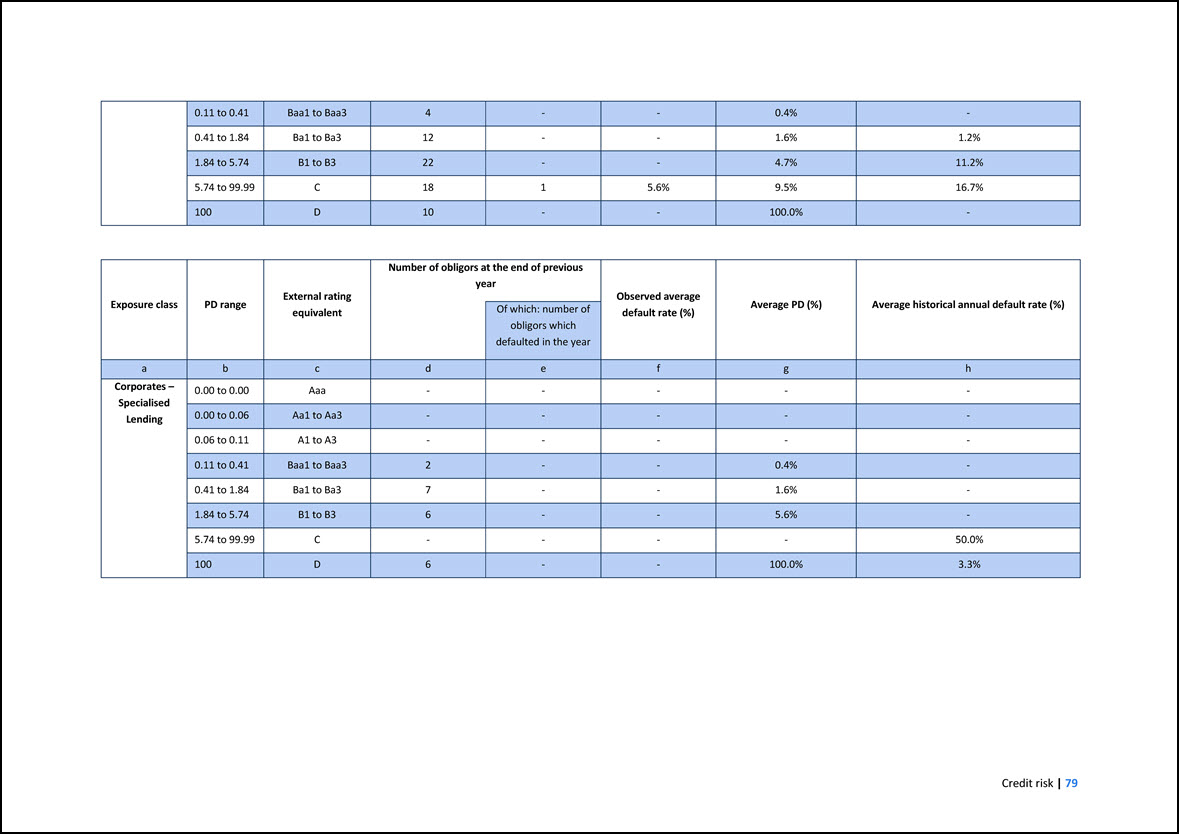
0.11 to 0.41 Baa1 to Baa3 4 - - 0.4% - 0.41 to 1.84 Ba1 to Ba3 12 - - 1.6% 1.2% 1.84 to 5.74 B1 to B3 22 - - 4.7% 11.2% 5.74 to 99.99 C 18 1
5.6% 9.5% 16.7% 100 D 10 - - 100.0% - Exposure class PD range External rating equivalent Number of obligors at the end of previous year Observed average default rate (%) Average PD (%) Average historical annual default rate (%) Of
which: number of obligors which defaulted in the year a b c d e f g h Corporates – Specialised Lending 0.00 to 0.00 Aaa - - - - - 0.00 to 0.06 Aa1 to Aa3 - - - - - 0.06 to 0.11 A1 to A3 - - - - - 0.11 to 0.41 Baa1 to
Baa3 2 - - 0.4% - 0.41 to 1.84 Ba1 to Ba3 7 - - 1.6% - 1.84 to 5.74 B1 to B3 6 - - 5.6% - 5.74 to 99.99 C - - - - 50.0% 100 D 6 - - 100.0% 3.3%
5.5 Equity risk Equity-type risks result from the Group’s investments that expose the Group to the risk of the performance of the investee’s business. The Group is
exposed to equity risk stemming from the following sources: Strategic investments: • The EIB’s strategic participation in the European Bank for Reconstruction and Development (‘EBRD’); Equity investments: • Equity-type investments including
investments in infrastructure and climate funds as well as private equity funds, predominantly focusing on geographies outside the European Union. • Equity-type investments originated by the EIF on behalf of the EIB in the form of investments in
infrastructure and climate funds, venture capital/private equity funds, private debt funds and related structures (for example, co-investment vehicles) and similar structures under ad-hoc facilities under mandate. • Quasi-equity operations which are
financing legally structured as loans but are usually remunerated with an equity kicker44 and are considered as equity-type operations from a risk perspective. They are typically originated under risk-sharing mandates45 such as
InnovFin/EFSI/InvestEU. • Shares that have been obtained in the context of financial restructuring of a publicly quoted or privately held company to which the EIB has lent (“accidental equity”). 44 From an accounting point of view, quasi-equity
loans are considered as debt and consequently reported in the EBA templates under “Loans and advances”, as applicable. 45 Arrangements whereby the Bank shares the risk on underlying credit risk exposures with the mandator. EIF own-resources
indirect equity investments • Indirect equity exposures via Private Equity, Venture Capital and Private Debt funds; • Indirect equity exposures via Funds of Funds; • Secondary indirect equity investments through the purchase of a secondary stake in
a fund (for the EIF Equity Discretionary portfolio only); • Direct equity exposures via co-investments (in companies or portfolio companies) to a limited extent. Management, monitoring and reporting The EIB’s Equity Risk Guidelines (“ERG”) address
risk issues and related risk mitigating measures associated with indirect equity originated by the EIB and quasi-equity investments irrespective of their geographical focus and origin of funds. Together with the Equity Monitoring Procedures (“EMP”),
they set out the monitoring procedures, including the periodic scoring of equity-type investments prepared by PMM and reviewed by GR&C. The equity-type investments are fair valued periodically and set against their carrying value to calculate
performance. The EIF’s Equity Risk Policy Guidelines (“ERPG”) cover the equity risk investment and monitoring process under EIF own resources and under mandate. The core of the EIF’s equity-specific risk management practices consists of a
structured and regular fund manager review process, in which the financial performance of each fund manager and fund in the portfolio is assessed,
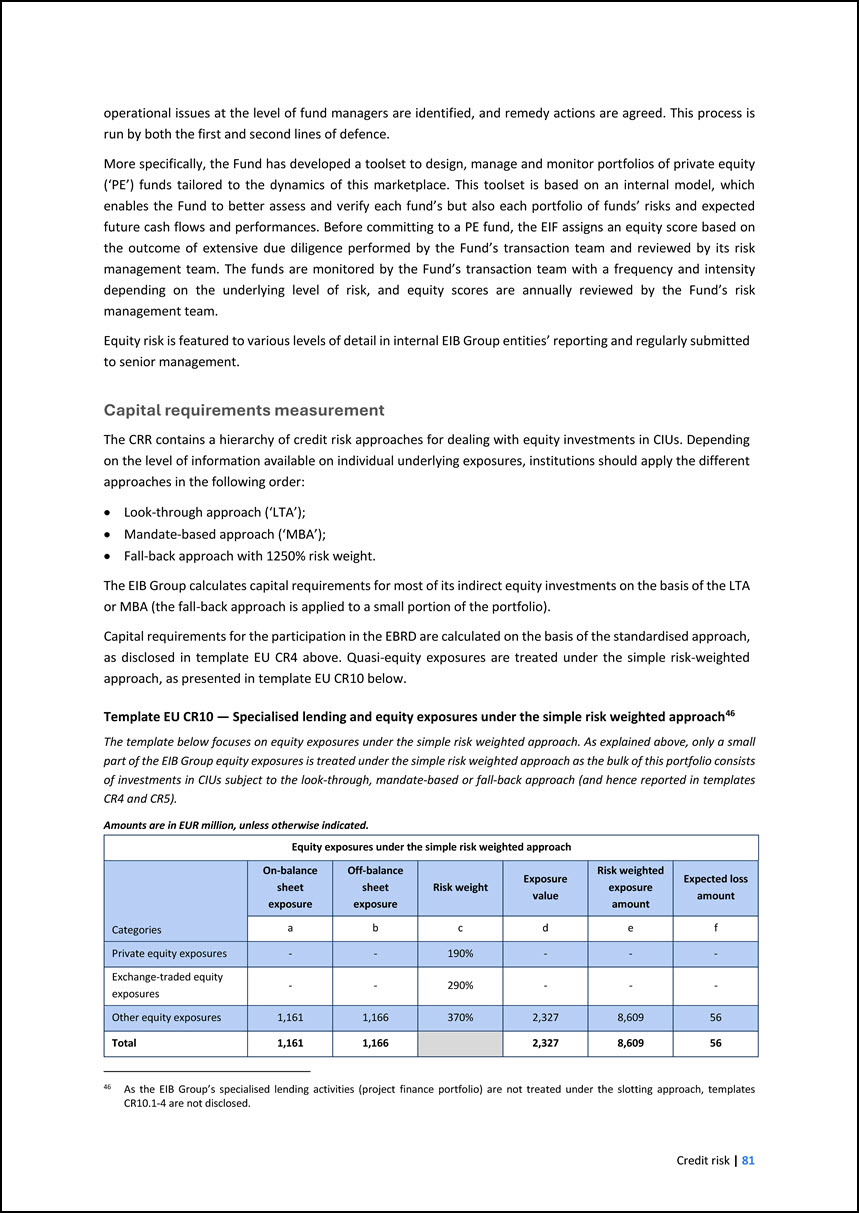
operational issues at the level of fund managers are identified, and remedy actions are agreed. This process is run by both the first and second lines of defence.
More specifically, the Fund has developed a toolset to design, manage and monitor portfolios of private equity (‘PE’) funds tailored to the dynamics of this marketplace. This toolset is based on an internal model, which enables the Fund to better
assess and verify each fund’s but also each portfolio of funds’ risks and expected future cash flows and performances. Before committing to a PE fund, the EIF assigns an equity score based on the outcome of extensive due diligence performed by the
Fund’s transaction team and reviewed by its risk management team. The funds are monitored by the Fund’s transaction team with a frequency and intensity depending on the underlying level of risk, and equity scores are annually reviewed by the Fund’s
risk management team. Equity risk is featured to various levels of detail in internal EIB Group entities’ reporting and regularly submitted to senior management. Capital requirements measurement The CRR contains a hierarchy of credit risk
approaches for dealing with equity investments in CIUs. Depending on the level of information available on individual underlying exposures, institutions should apply the different approaches in the following order: • Look-through approach (‘LTA’); •
Mandate-based approach (‘MBA’); • Fall-back approach with 1250% risk weight. The EIB Group calculates capital requirements for most of its indirect equity investments on the basis of the LTA or MBA (the fall-back approach is applied to a small
portion of the portfolio). Capital requirements for the participation in the EBRD are calculated on the basis of the standardised approach, as disclosed in template EU CR4 above. Quasi-equity exposures are treated under the simple risk-weighted
approach, as presented in template EU CR10 below. Template EU CR10 — Specialised lending and equity exposures under the simple risk weighted approach46 46 As the EIB Group’s specialised lending activities (project finance portfolio) are not treated
under the slotting approach, templates CR10.1-4 are not disclosed. The template below focuses on equity exposures under the simple risk weighted approach. As explained above, only a small part of the EIB Group equity exposures is treated under the
simple risk weighted approach as the bulk of this portfolio consists of investments in CIUs subject to the look-through, mandate-based or fall-back approach (and hence reported in templates CR4 and CR5). Amounts are in EUR million, unless otherwise
indicated. Equity exposures under the simple risk weighted approach Categories On-balance sheet exposure Off-balance sheet exposure Risk weight Exposure value Risk weighted exposure amount Expected loss amount a b c d e f Private
equity exposures - - 190% - - - Exchange-traded equity exposures - - 290% - - - Other equity exposures 1,161 1,166 370% 2,327 8,609 56 Total 1,161 1,166 2,327 8,609 56
6 COUNTERPARTY CREDIT RISK Counterparty credit risk is defined as the risk that the counterparty of an OTC derivatives transaction or securities financing transaction
(‘SFT’) defaults before the final settlement of the transaction’s cash flows, meaning that the counterparty will not be able to fulfil present and future payment obligations. The exposure at risk changes over time as market parameters change and it
is of a bilateral nature. The EIB uses derivatives, mainly cross-currency swaps and interest rate swaps (‘IRS’), but also structured swaps, futures, forward rate agreements and currency forwards, as part of its Asset and Liability Management (‘ALM’)
activities to manage exposures to interest rate and foreign currency risk and as part of its treasury operations. The EIF does not hold derivatives. The EIB enters into SFTs, mostly in the form of reverse repos with banking counterparties. Such
transactions are used as part of its treasury management activities to place liquidity not immediately needed for disbursement of loans. The EIF does not engage in SFTs with external counterparties. Mitigation, monitoring and reporting The EIB’s
counterparty credit risk is governed by its FRGs. The Derivatives division within GR&C is responsible for monitoring and measuring counterparty credit risk on derivatives and the Treasury & Liquidity division for monitoring and measuring
counterparty credit risk on SFTs. Changes to models and methodology in relation to counterparty credit risk for derivatives are discussed by the Derivatives Strategy and Models Committee (DSMC), which meets quarterly and has the mission to analyse
and discuss possible improvements in policies, procedures, models, methods and tools that constitute the operational framework for derivatives transactions at the EIB. Methodology used to assign internal capital and credit limits for counterparty
credit exposures, including the methods to assign those limits to exposures to central counterparties The EIB uses internal credit limits for derivatives and SFTs, which are set by GR&C-RM/GFIN based on internal policy guidelines approved by the
MC and monitored on a daily basis. Corrective actions are taken in the event of limit breaches and dedicated daily reporting about limit usage is in place. For internal purposes, the Group measures the credit risk exposure related to derivative
transactions using the Current Unsecured Exposure47 and the Potential Future Exposure for reporting and limit monitoring. The Potential Future Exposure is computed in a simulation engine on multiple time points and under various rating scenarios48.
47 The Current Unsecured Exposure is the larger of zero and the market value of the portfolio of transactions within the netting set with a counterparty less the value of collateral received. It is the amount that would be lost upon the default of
the counterparty, using the received collateral and assuming no recovery on the value of those transactions as well as immediate replacement of the swap counterparty for all the transactions. 48 Potential Future Exposure is computed taking into
account the possible increase in the netting set’s exposure over the margin period of risk of 20 business days. The EIB computes the Potential Future Exposure at 90% confidence level using stressed market parameters to arrive at conservative
estimates. This is in line with the recommendations issued by regulators in order to take into consideration the conditions that will prevail in the event of default of an important market participant. With regard to SFTs, the Group follows a
similar approach for calculating the exposure, that is, the total exposure with each counterparty is the sum of the Current Exposure (“CE”) and the Potential Future Exposure (“PFE”) of the net position of bilateral repo and reverse repo transactions
outstanding with such counterparty at master netting agreement level. Exposures related to multiple GMRAs with one counterparty are summed up to obtain the exposure for this counterparty.
To compute the credit limit usage of SFTs, exposures are risk-weighted by percentage factors depending on the SFT type. Exposures and limits for derivatives and SFTs
are consolidated with general credit risk exposures in the global limit system to manage these within the overall credit processes. As regards the methodologies used to assign economic capital for counterparty credit risk exposures, the Group uses
its aforementioned internal PFE model. For information on the methodology applied to SFTs, see details under “Capital requirements measurement” below. Policies related to guarantees and other credit risk mitigants, such as netting and the policies
for securing collateral and establishing credit reserves As referred to under Section 5.2, a number of credit risk mitigants are used to limit the EIB’s counterparty credit risk. To be able to trade OTC derivatives with the EIB, the internal
guidelines require commercial banks to enter into an ISDA Master Agreement and an ISDA Credit Support Annex (‘CSA’), as applicable, that have independent amounts linked to the counterparty rating, and the counterparty also needs to satisfy a minimum
rating requirement. Currently, existing multilateral development bank and central bank counterparties are not required to enter into CSAs in line with the internal EIB risk guidelines. In order to trade repos and reverse repos with the EIB,
commercial banks need to enter into a Global Master Repurchase Agreement (GMRA) which contains the close-out netting provisions. The GMRAs currently in place do not have rating-dependent parameters. Such legally enforceable master netting
arrangements are generally accepted and practiced contract types and create a right of set-off of recognised amounts that is enforceable only after termination of outstanding transactions following an event of default, including insolvency or
bankruptcy, of either party. More specifically, under such bilateral netting agreements, the amounts payable by each party on any day in respect of the same transaction and in the same currency may be aggregated into a single net amount being
payable by one party to the other. In certain circumstances, for example when an event of default occurs, all outstanding transactions under the agreement are terminated, the termination value is assessed and only a single net amount is payable in
settlement of all transactions. Minimum conditions for new agreements are specified in the internal EIB risk guidelines. Eligibility criteria for derivatives and repo counterparties as well as risk limits are set in internal policy guidelines
approved by the MC. All derivative exposures are priced on a daily basis and, if applicable, collateralised by cash or bonds under a CSA which allows for daily margin calls in nearly all cases. The EIB does not post collateral under any CSA.
Collateral received is monitored and valued regularly and an internal haircut that is at least as conservative as the regulatory haircut is applied for internal and external exposure measurement purposes. Margining for SFTs such as tri-party repos is
outsourced to tri-party agents that calculate exposure and administer margin calls on an intra-day basis. Margining for SFTs such as bilateral repos is performed by the EIB on a daily basis. The exposure is fully collateralised at transaction level,
with a subsequent call in accordance with the underlying agreement. Under the terms of a CSA, securities received as collateral can be re-used. The terms of an ISDA Master Agreement also give the Group the right to terminate the related transactions
upon the counterparty’s failure to post collateral after an applicable grace period following notice. The Group receives a material amount of collateral for derivatives covered by a CSA and for reverse repurchase transactions covered by a GMRA. A
comprehensive overview of the composition of collateral received for
derivatives under an ISDA Master Agreement can be found in Note S.2.5.1, while a summary of collateral received in SFTs is given in Note S.2.4.2 of the EIB Group
consolidated financial statements under IFRS. As of 31.12.2024, the collateral received for derivatives is mainly concentrated in EUR and to a lesser extent in USD, CAD and GBP while collateral received under SFTs is denominated in a wider range of
currencies accepted by the Group. Under its contractual arrangements, the EIB Group is not required to post collateral in the event of a downgrade in its credit rating. A reserve for derivatives counterparty credit risk is established. It is
computed as a function of expected positive exposures and of internally estimated PDs and LGDs. Policies with respect to Wrong-Way Risk as defined in Article 291 of the CRR Wrong-way risk arises when there is significant increasing exposure to a
counterparty combined with a simultaneous increase in the probability of the counterparty’s default. Wrong-way risk is commonly categorised into two types: Specific Wrong-Way Risk (SWWR) and General Wrong-Way Risk (GWWR). SWWR occurs when future
exposure to a specific counterparty is highly (positively) correlated with the counterparty’s credit quality due to the nature of the transactions with that counterparty. It also arises when the counterparty’s credit quality is highly (positively)
correlated with the collateral credit quality. GWWR occurs when there is high (positive) correlation between the probability of default of a counterparty and general market risk factors affecting the exposure to that counterparty. The EIB has
procedures in place to actively identify, monitor and control SWWR at trade inception and continuing throughout its term. Since 2023, the SWWR component has been taken into account in credit limit usage computation for treasury transactions, and
mitigation measures are applied as per internal policies against counterparties exhibiting materially high SWWR levels. Furthermore, identified SWWR in derivatives is considered through additional stress applied to exposures. Additionally, for
derivative transactions, the EIB manages GWWR within the derivatives limit framework by applying conservative assumptions on market risk factor volatilities producing a strong positive correlation between the counterparty default and the Bank’s
potential future exposure to that counterparty. Capital requirements measurement SFTs’ regulatory capital requirements are calculated under the Financial Collateral Comprehensive Method, as per Articles 223 and 285 of the CRR. The Group treats its
derivative exposures using the Standardised approach for Counterparty Credit Risk (‘SA- CCR’). The regulatory capital requirements for credit valuation adjustment (CVA) risk are calculated in accordance with the standardised method and include both
OTC derivatives and SFTs. The disclosure templates below provide an overview of the exposures, RWEA and capital requirements the Group assumes with regard to counterparty credit risk. The Group has neither exposure on derivatives to a central
counterparty clearing house (CCP), nor does it have any credit derivatives transactions. In terms of SFTs, it transacts cleared reverse repos and repos with two qualifying CCPs, the rest being dealt with through banking counterparties. The templates
EU CCR3 - Standardised approach - CCR exposures by regulatory exposure class and risk weights and EU CCR8 - Exposures to CCPs are not disclosed in the December 2024 GRMDR as the exposure values and

RWEAs from trades centrally cleared through central counterparty clearing houses are nil as of 31.12.2024 due to the full collateralisation of these trades.
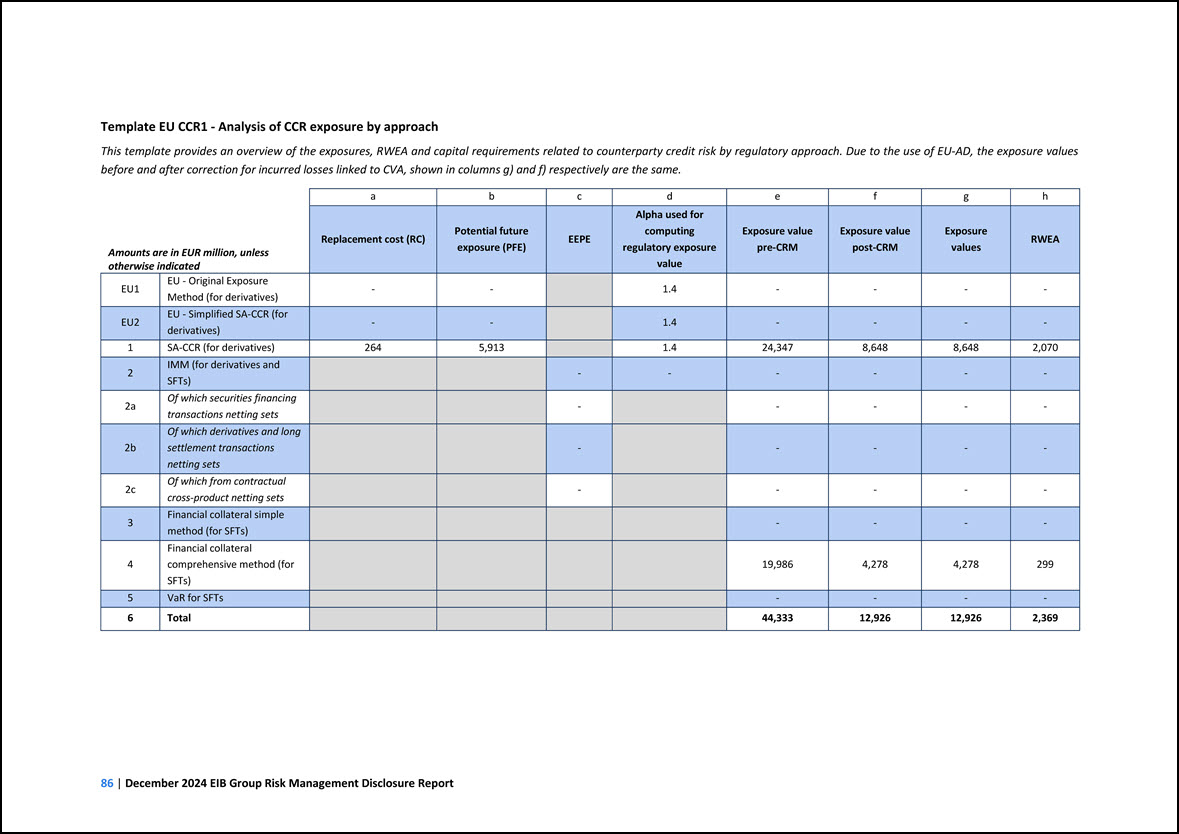
Template EU CCR1 - Analysis of CCR exposure by approach This template provides an overview of the exposures, RWEA and capital requirements related to counterparty
credit risk by regulatory approach. Due to the use of EU-AD, the exposure values before and after correction for incurred losses linked to CVA, shown in columns g) and f) respectively are the same. Amounts are in EUR million, unless otherwise
indicated a b c d e f g h Replacement cost (RC) Potential future exposure (PFE) EEPE Alpha used for computing regulatory exposure value Exposure value pre-CRM Exposure value post-CRM Exposure values RWEA EU1 EU - Original Exposure
Method (for derivatives) - - 1.4 - - - - EU2 EU - Simplified SA-CCR (for derivatives) - - 1.4 - - - - 1 SA-CCR (for derivatives) 264 5,913 1.4 24,347 8,648 8,648 2,070 2 IMM (for derivatives and SFTs) - - - - -
- 2a Of which securities financing transactions netting sets - - - - - 2b Of which derivatives and long settlement transactions netting sets - - - - - 2c Of which from contractual cross-product netting sets - - - - -
3 Financial collateral simple method (for SFTs) - - - - 4 Financial collateral comprehensive method (for SFTs) 19,986 4,278 4,278 299 5 VaR for SFTs - - - - 6 Total 44,333 12,926 12,926 2,369
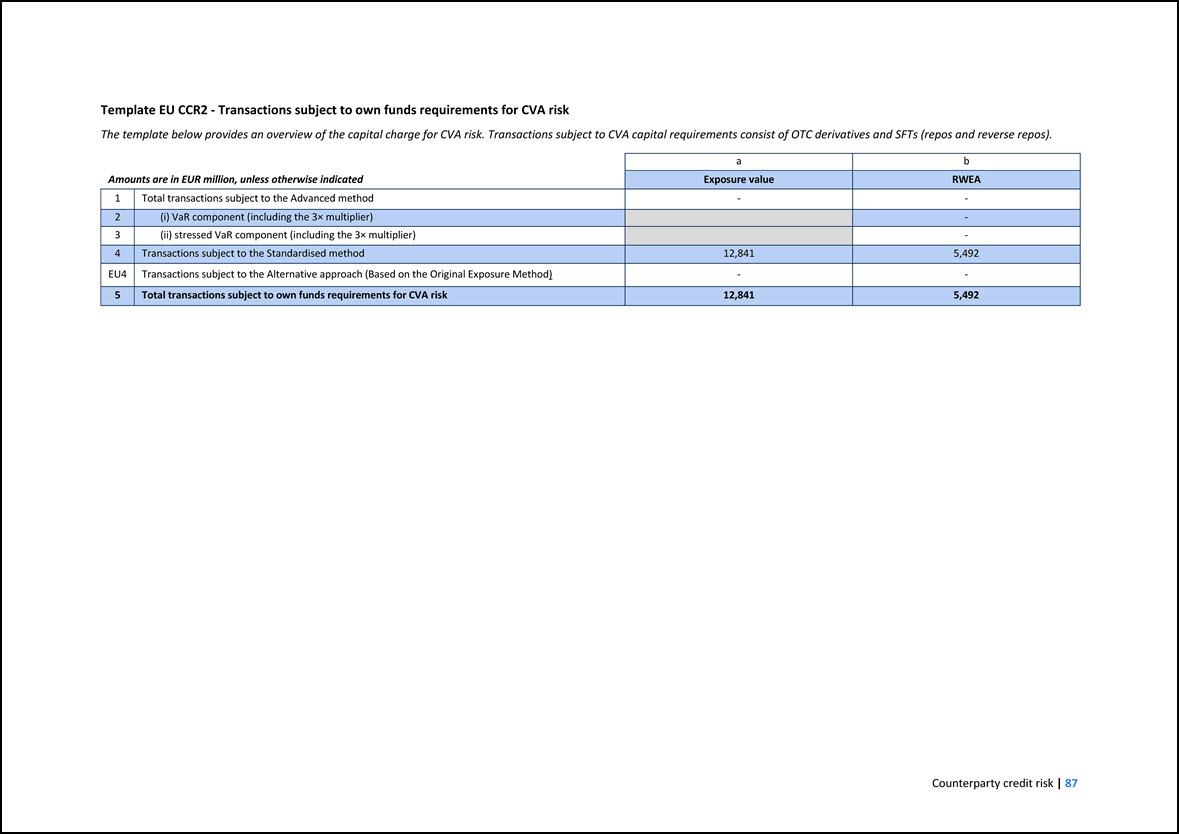
Template EU CCR2 - Transactions subject to own funds requirements for CVA risk The template below provides an overview of the capital charge for CVA risk.
Transactions subject to CVA capital requirements consist of OTC derivatives and SFTs (repos and reverse repos). Amounts are in EUR million, unless otherwise indicated a b Exposure value RWEA 1 Total transactions subject to the Advanced method
- - 2 (i) VaR component (including the 3× multiplier) - 3 (ii) stressed VaR component (including the 3× multiplier) - 4 Transactions subject to the Standardised method 12,841 5,492 EU4 Transactions subject to the Alternative approach
(Based on the Original Exposure Method) - - 5 Total transactions subject to own funds requirements for CVA risk 12,841 5,492
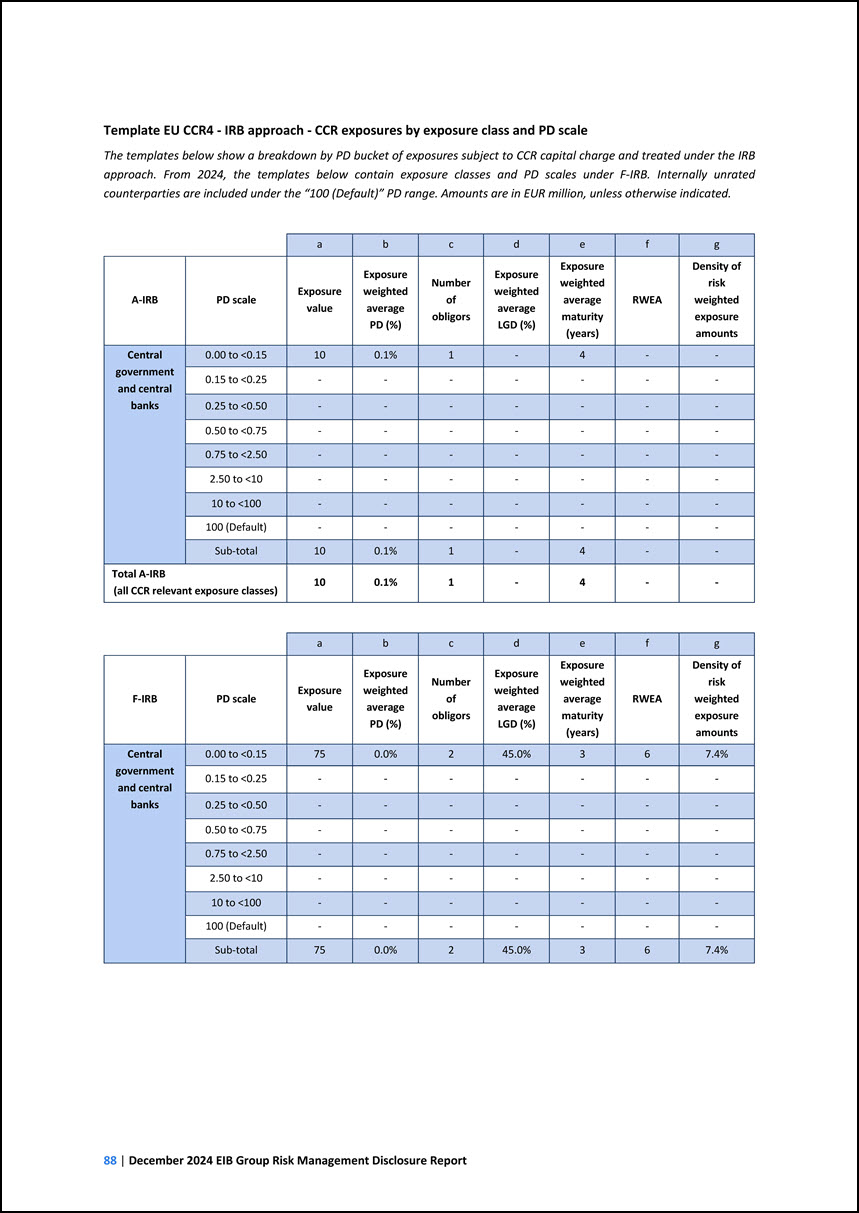
Template EU CCR4 - IRB approach - CCR exposures by exposure class and PD scale The templates below show a breakdown by PD bucket of exposures subject to CCR capital
charge and treated under the IRB approach. From 2024, the templates below contain exposure classes and PD scales under F-IRB. Internally unrated counterparties are included under the “100 (Default)” PD range. Amounts are in EUR million, unless
otherwise indicated. a b c d e f g A-IRB PD scale Exposure value Exposure weighted average PD (%) Number of obligors Exposure weighted average LGD (%) Exposure weighted average maturity (years) RWEA Density of risk weighted
exposure amounts Central government and central banks 0.00 to <0.15 10 0.1% 1 - 4 - - 0.15 to <0.25 - - - - - - - 0.25 to <0.50 - - - - - - - 0.50 to <0.75 - - - - - - - 0.75 to <2.50 - - - - -
- - 2.50 to <10 - - - - - - - 10 to <100 - - - - - - - 100 (Default) - - - - - - - Sub-total 10 0.1% 1 - 4 - - Total A-IRB (all CCR relevant exposure classes) 10 0.1% 1 - 4 - - a b c d e f
g F-IRB PD scale Exposure value Exposure weighted average PD (%) Number of obligors Exposure weighted average LGD (%) Exposure weighted average maturity (years) RWEA Density of risk weighted exposure amounts Central government and
central banks 0.00 to <0.15 75 0.0% 2 45.0% 3 6 7.4% 0.15 to <0.25 - - - - - - - 0.25 to <0.50 - - - - - - - 0.50 to <0.75 - - - - - - - 0.75 to <2.50 - - - - - - - 2.50 to <10 - - - -
- - - 10 to <100 - - - - - - - 100 (Default) - - - - - - - Sub-total 75 0.0% 2 45.0% 3 6 7.4%
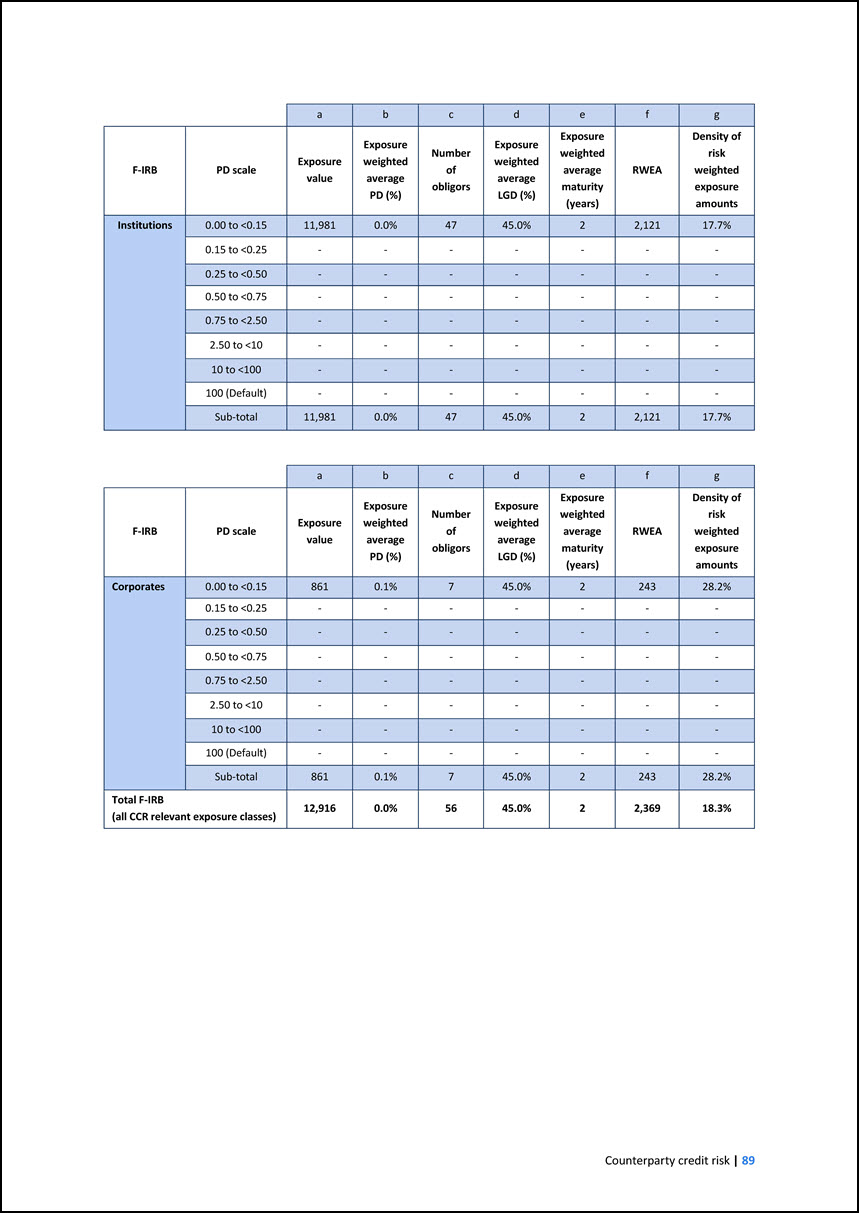
a b c d e f g F-IRB PD scale Exposure value Exposure weighted average PD (%) Number of obligors Exposure weighted average LGD (%) Exposure weighted
average maturity (years) RWEA Density of risk weighted exposure amounts Institutions 0.00 to <0.15 11,981 0.0% 47 45.0% 2 2,121 17.7% 0.15 to <0.25 - - - - - - - 0.25 to <0.50 - - - - - - - 0.50 to <0.75 - -
- - - - - 0.75 to <2.50 - - - - - - - 2.50 to <10 - - - - - - - 10 to <100 - - - - - - - 100 (Default) - - - - - - - Sub-total 11,981 0.0% 47 45.0% 2 2,121 17.7% a b c d e f g F-IRB
PD scale Exposure value Exposure weighted average PD (%) Number of obligors Exposure weighted average LGD (%) Exposure weighted average maturity (years) RWEA Density of risk weighted exposure amounts Corporates 0.00 to <0.15 861 0.1%
7 45.0% 2 243 28.2% 0.15 to <0.25 - - - - - - - 0.25 to <0.50 - - - - - - - 0.50 to <0.75 - - - - - - - 0.75 to <2.50 - - - - - - - 2.50 to <10 - - - - - - - 10 to <100 - - - - - -
- 100 (Default) - - - - - - - Sub-total 861 0.1% 7 45.0% 2 243 28.2% Total F-IRB (all CCR relevant exposure classes) 12,916 0.0% 56 45.0% 2 2,369 18.3%
7 SECURITISATION The Group applies the EU securitisation framework, with adaptations as applicable to the EIB, which comprises: • Regulation (EU) 2017/240249 (the
‘Securitisation Regulation’) laying down a general framework for securitisation and establishing a set of criteria for identifying simple, transparent and standardised (‘STS’) securitisation; and • Regulation (EU) 2017/240150 (the ‘CRR amending
Regulation’) containing targeted amendments to the CRR with regard to capital treatment of securitisations held by credit institutions, amongst other provisions (for example, significant risk transfer). 49 As amended by Regulation (EU) 2021/557. 50
As amended by Regulation (EU) 2021/558. As per the Securitisation Regulation’s definitions, securitisation refers to a transaction or scheme where the credit risk associated with an exposure or pool of exposures is tranched and has the following
characteristics: • payments in the transaction or scheme are dependent upon the performance of the exposure or of the pool of exposures; • the subordination of tranches determines the distribution of losses during the ongoing life of the transaction
or scheme; and • the transaction or scheme does not create specialised lending exposures possessing all of the characteristics listed in CRR Article 147(8). A “traditional securitisation” is one where there is an economic transfer of ownership of
the exposures being securitised from the originator institution to a securitisation special purpose entity (‘SSPE’), while in a “synthetic securitisation” the transfer of risk is achieved by the use of credit derivatives or guarantees, and the
exposures being securitised remain exposures of the originator. A “re-securitisation” means securitisation where at least one of the underlying exposures is a securitisation position. It should be noted that currently the Group’s securitisation
positions are not benefiting from the STS preferential capital treatment and all securitisations are currently treated as non-STS. The Group has exposure to both synthetic and traditional securitisations as investor and is the originator/sponsor of
synthetic securitisations and one re-securitisation structure. The re-securitisation structure’s treatment has been retained based on Article 8(1) of the Securitisation Regulation51. 51 The ban on re-securitisations provided for by Article 8 of the
Securitisation Regulation has been adapted for the EIB Group when acting as originator or sponsor in the context of mandates. In a nutshell, the Group is involved in the following transactions (see next section for further details): • The EIB
invests in loan substitutes, which are typically ABS. • The EIB is the originator/sponsor of synthetic securitisations and retains exposure to several facilities that focus on debt-based financing via loans and guarantees, where a part or the whole
of the first loss piece is taken by a third party. • Under its Guarantee and Securitisation (‘G&S’) business, the EIF provides guarantees to financial intermediaries, credit enhancement to SME securitisation transactions and can purchase tranches
of SME securitisation transactions.
Securitisation activities, related risks and the Group’s objectives From an originator/sponsor perspective, the EIB Group has exposure to several synthetic
securitisation programmes under mandate structures in which the risk transfer is done through guarantees (for example, InvestEU; its predecessor, the European Fund for Strategic Investments (EFSI); the Neighbourhood, Development and International
Cooperation Instrument (NDICI)/European Fund for Sustainable Development Plus (EFSD+); its predecessor, the External Lending Mandate (‘ELM’); the Connecting Europe Facility (‘CEF’); InnovFin). Details on the exact objectives of these programmes can
be found in Note Z of the EIB Group consolidated financial statements under EU-AD. In its role as originator, the EIBG synthetically securitises its own originated loans/guarantees with credit enhancement provided by the EU/EU MS, resulting in
capital relief for the EIBG. The EIB Group has an exposure to re-securitisations through the InvestEU D2 portfolio where it acts as originator in the context of mandates. As a sponsor, the EIBG retains positions in synthetic mandate structures whose
underlying assets are non- tranched debt and loans granted exclusively by a financial intermediary and provides capital relief to its clients. The nature of its activities as originator/sponsor of synthetic securitisations exposes the Group not only
to credit risk, but also to concentration risk, liquidity risk arising from the need to cover potential guarantee calls, foreign exchange risk if guarantees are not in EUR, and potentially prepayment risk. When acting as investor, the EIBG provides
and/or facilitates funding and/or capital relief to its clients. The EIBG uses loan substitutes as alternative financing structures to reach new clients, enhance value added and improve the Group’s risk profile. By utilising capital market
instruments, such as ABS as a substitute for loans, the Group significantly increases its ability to diversify the nature of its lending activity. In the field of SME securitisations, the EIB and the EIF cooperate closely to ensure a consistent risk
assessment approach within the Group. Through its Guarantee and Securitisation (‘G&S’) business, the EIF is a major provider of guarantees on SME financing and its aim is to catalyse bank lending to support SMEs and small mid-caps. The EIF
cooperates with financial intermediaries to provide guarantees on specific tranches of securitisation of SME loan/lease portfolios. These activities are split into own risk and third-party mandate resources: • The EIF provides unfunded guarantees to
specific securitisation tranches with the aim to transfer risk from the financial institution that is the originator of the portfolio of loans or leases which represent the underlying assets of the securitisation. This activity enables capacity in
the beneficiary’s capital for additional financing to new SMEs by the financial institution that is benefiting from the risk transfer. • The EIF guarantees and, in some instances, directly purchases notes issued by a funded securitisation with the
aim of providing funding to the underlying originator of the portfolio of loans or leases. This activity also enables additional financing capacity to new SMEs by the originator. • For third-party mandates, the EIF manages resources mainly on behalf
of the EIB, the European Commission or Member States and regional authorities in mandate activities that facilitate the granting of loans and leases to SMEs, where the EIF acts as guarantor or counter-guarantor. The different programmes are
described further in the annual report of the EIF. In its role as investor in traditional securitisations, the Group assumes in addition to credit risk various risks generally inherent in bonds - mainly prepayment risk, liquidity risk and foreign
exchange risk.
Management, monitoring and reporting Securitised loans under the InvestEU D1 and D2 debt portfolios, for which the EIB Group acts as originator, including former EFSI
IIW (Infrastructure and Innovation Window) operations or similar structures are subject to the same approval, management, monitoring and reporting procedures as conventional lending transactions: namely, the information provided in Chapter 5 applies.
The residual risk of these loans is significantly reduced by the EU guarantee. In addition, for operations under InvestEU, projects are submitted to the InvestEU Investment Committee for inclusion in the corresponding InvestEU debt portfolio
partially guaranteed by the EU budget. In relation to loan substitute transactions, the EIB Group attempts to minimise financial losses. This requires: • an appropriate financial structure, allocation and mitigation of risks, including an
appropriate limit system also addressing EIB Group exposures; • the application of the four-eyes principle; • appropriate and enforceable documentation; • monitoring of the transaction after purchase; • timely and active management of transactions in
distress. Credit risk of loan substitutes is managed through an individual analysis of all inherent risks of a transaction, detailed analysis of new transactions and monitoring of the loan substitute portfolio, mainly relying on external ratings.
Due to its importance, there is no cap on the overall volume of loan substitutes, unless they do not fulfil minimum acceptable criteria. EIB Group services monitor loan substitutes on a continuous basis and actions are taken with respect to any
deterioration of credit quality. Due to the complex structure of securitisations, the credit performance during times of stress can only be approximated. Therefore, the EIB’s credit review is prompted to identify the ability of the originator to
cover high-quality assets in order to understand the nature and potential of the risks that arise in respect of the underlying asset pool. The Group manages the credit risk arising from guarantee and securitisation transactions of the EIF that are
financed by own resources under risk management policies (covered by the Statutes) and the EIF’s internal risk operational guidelines. Each new transaction is reviewed in detail to analyse the risks, the methodologies that should be applied, and an
internal rating assessment is performed. The performance of each transaction is reviewed regularly, at least on a quarterly basis but more frequently for transactions not performing in line with the EIF’s expectations and discussed at regular
Portfolio IRC (Investment and Risk Committee) meetings. Semi-annual risk reports are also submitted to the EIF Board of Directors and quarterly surveillance reports are submitted to the Portfolio IRC. Further information with respect to the EIF’s
guarantee activities and its management, monitoring and reporting can be found in both the Group consolidated financial statements and the EIF’s Annual Report. Summary of EIB Group accounting policies for the securitisation activity All securitised
exposures composed of loans or, in some cases, loan substitutes are retained on the balance sheet and those composed of guarantees are retained off-balance sheet. A summary of the applicable Group accounting policies under EU-AD is presented
hereafter. The detailed accounting policies thereon are available in Note A.2.6. “Treasury bills and other bills eligible for refinancing with central banks and debt securities including fixed-income securities”, Note A.2.7. “Loans and advances to
credit institutions and customers” and Note A.2.14. “Financial guarantees” of the EIB Group consolidated financial statements under EU-AD.
Loans and advances are included in the assets of the Group at their net disbursed amounts. Individual value adjustments have been recorded for loans outstanding at the
end of the period and presenting risks of non- recovery of all or part of their amounts. Collective value adjustments have been recorded to capture loans in the portfolio which are impaired but have not yet been identified as such or for losses which
have been incurred but not yet reported. Such value adjustments are held in the same currency as the assets to which they relate. Value adjustments are accounted for in the profit and loss account and are deducted from the appropriate asset items on
the balance sheet. Undisbursed parts of loans and advances are recorded off-balance sheet at their nominal value. The Loan substitutes portfolio and the ABS portfolio for which the EIB Group acts as an investor mainly consist of obligations in the
form of bonds, notes or certificates issued by special purpose vehicles (‘SPVs’), trust vehicles or financial institutions. These securities are initially recorded at purchase price and subsequently valued at amortised cost. The difference between
purchase price and redemption value is accounted for pro rata temporis over the life of the securities as “Interest receivable and similar income”. Individual value adjustments are accounted for if these are other than temporary. Collective value
adjustments are recorded to capture contracts which are impaired but have not yet been identified as such respectively for losses incurred but not yet reported. Individual and collective value adjustments are recorded in the profit and loss account
and are deducted from the appropriate asset items on the balance sheet. Undisbursed parts of loan substitutes are recorded as off-balance sheet at their nominal value. Financial guarantee contracts require the issuer to make specified payments to
reimburse the holder for a loss it incurs if a particular debtor fails to make payment when due under the original or modified terms of a debt instrument. Net liabilities from financial guarantees are presented on the balance sheet as a provision
intended to cover risks inherent in the Group’s activity of issuing guarantees in favour of financial intermediaries or issued in respect of loans granted by third parties. Financial guarantees are initially recognised at fair value corresponding to
the net present value (‘NPV’) of expected premium inflows or the initial expected loss. Subsequent to initial recognition, financial guarantees are measured as the deficit of the net present value of expected future premium inflows over the higher
of: • the amount of the expected credit loss; and • the fair value initially recognised less any cumulative amount of income/amortisation recognised. Unrealised gains representing the excess of the net present value of expected future premium
inflows over the amount of the expected payment obligations remain unrecognised. Any increase or decrease in the net liability relating to financial guarantees is recognised in the profit and loss account. Signed financial guarantees are generally
accounted for and disclosed as off-balance sheet items. Capital requirements measurement Following the EU securitisation framework, the Group applies the following hierarchy of approaches:
• For securitisation activities in which the EIB is the originator, such as the InvestEU D1 portfolio (including operations under the former EFSI Standard debt
portfolio) and other mentioned facilities, and which are internally rated, the SEC-IRBA is used to calculate capital requirements. • The SEC-SA is mandatorily used for re-securitisations (InvestEU D2 portfolio), as well as positions for which the
SEC-IRBA could not be applied (for example, structures sponsored by the EIF such as the SME Initiative mandates). The SEC-SA relies on a formula using as an input the underlying portfolio delinquency rates and respective asset classes. • When the
first two approaches above cannot be followed, the Group applies the SEC-ERBA52 in the event that an external rating is available for the tranche. 52 According to CRR Article 254 (2)(b), the SEC-ERBA shall be used when the application of the SEC-SA
would result in a risk weight higher than 25% or the application of the SEC-ERBA would result in a risk weight higher than 75% for positions not qualifying as STS. The EIB Group applies the aforementioned hierarchy of approaches in line with the
securitisation provisions of the CRR (which entered into force on 1 January 2019, following the enactment of Regulation (EU) 2017/2401)53. 53 As amended by Regulation (EU) 2021/558. External ratings from the major credit rating agencies (Moody’s,
S&P and Fitch) are taken into consideration when applying the SEC-ERBA to determine the RWEA of securitisation exposures. Securitisations positions that attract a 1250% risk weighting are deducted from Common Equity Tier 1 capital in accordance
with point (k) of Article 36 of the CRR.
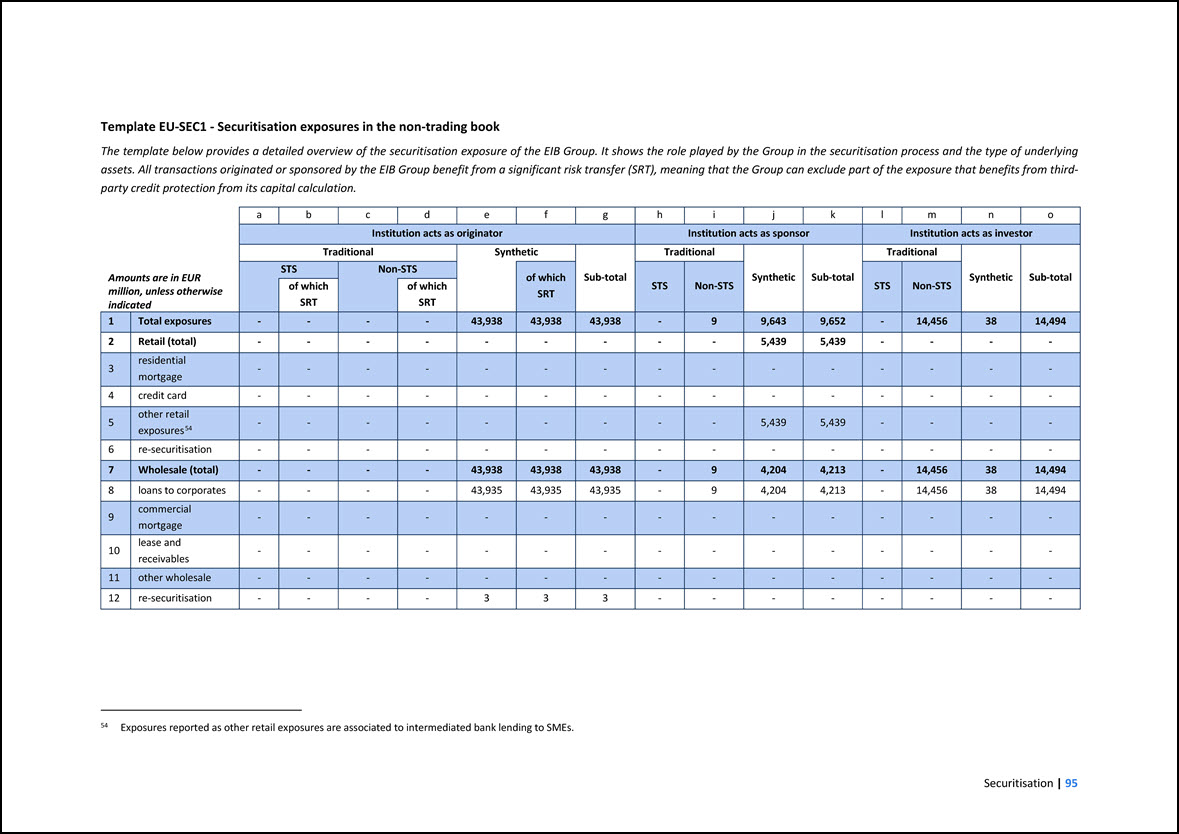
Template EU-SEC1 - Securitisation exposures in the non-trading book The template below provides a detailed overview of the securitisation exposure of the EIB Group.
It shows the role played by the Group in the securitisation process and the type of underlying assets. All transactions originated or sponsored by the EIB Group benefit from a significant risk transfer (SRT), meaning that the Group can exclude part
of the exposure that benefits from third- party credit protection from its capital calculation. Amounts are in EUR million, unless otherwise indicated a b c d e f g h i j k l m n o Institution acts as originator Institution acts as
sponsor Institution acts as investor Traditional Synthetic Sub-total Traditional Synthetic Sub-total Traditional Synthetic Sub-total STS Non-STS of which SRT STS Non-STS STS Non-STS of which SRT of which SRT 1 Total exposures
- - - - 43,938 43,938 43,938 - 9 9,643 9,652 - 14,456 38 14,494 2 Retail (total) - - - - - - - - - 5,439 5,439 - - - - 3 residential mortgage - - - - - - - - - - - - - - - 4 credit card - - - -
- - - - - - - - - - - 5 other retail exposures54 - - - - - - - - - 5,439 5,439 - - - - 6 re-securitisation - - - - - - - - - - - - - - - 7 Wholesale (total) - - - - 43,938 43,938 43,938 - 9
4,204 4,213 - 14,456 38 14,494 8 loans to corporates - - - - 43,935 43,935 43,935 - 9 4,204 4,213 - 14,456 38 14,494 9 commercial mortgage - - - - - - - - - - - - - - - 10 lease and receivables - - - - -
- - - - - - - - - - 11 other wholesale - - - - - - - - - - - - - - - 12 re-securitisation - - - - 3 3 3 - - - - - - - - 54 Exposures reported as other retail exposures are associated to intermediated bank
lending to SMEs.
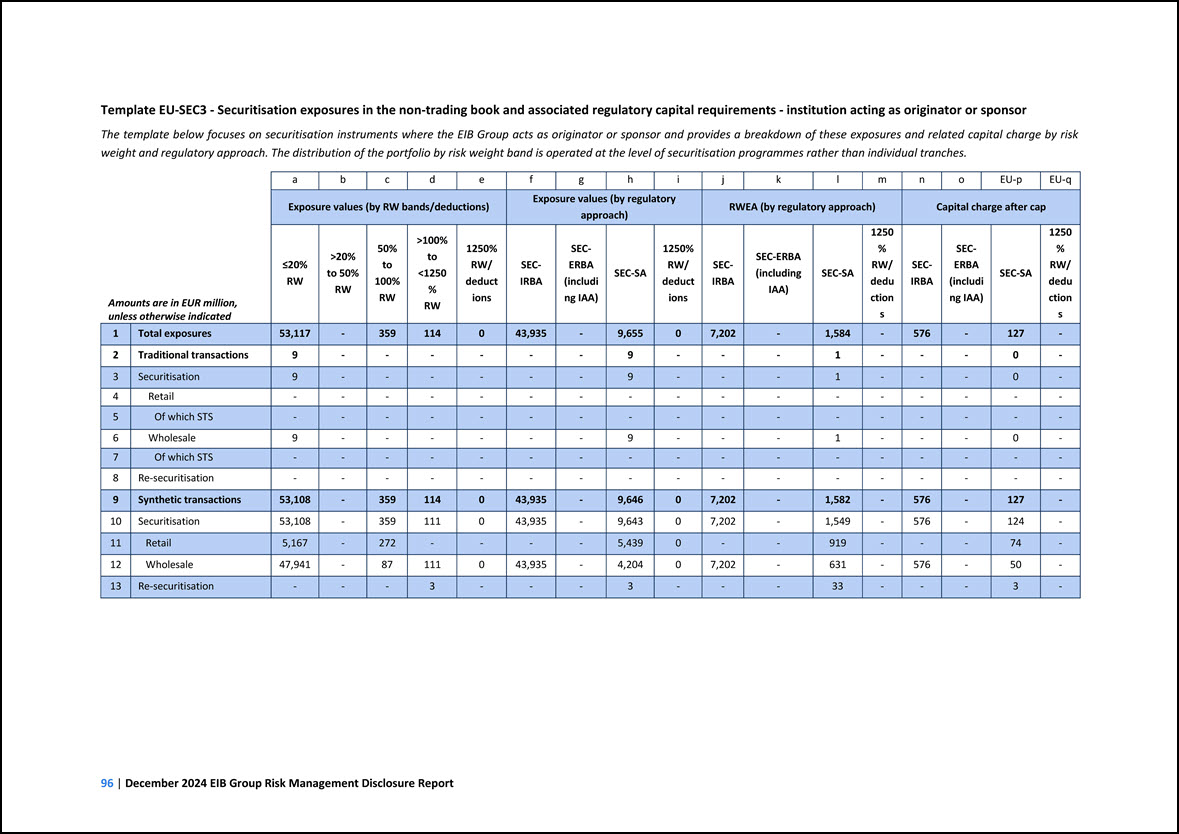
Template EU-SEC3 - Securitisation exposures in the non-trading book and associated regulatory capital requirements - institution acting as originator or sponsor The
template below focuses on securitisation instruments where the EIB Group acts as originator or sponsor and provides a breakdown of these exposures and related capital charge by risk weight and regulatory approach. The distribution of the portfolio by
risk weight band is operated at the level of securitisation programmes rather than individual tranches. Amounts are in EUR million, unless otherwise indicated a b c d e f g h i j k l m n o EU-p EU-q Exposure values (by RW
bands/deductions) Exposure values (by regulatory approach) RWEA (by regulatory approach) Capital charge after cap =20% RW >20% to 50% RW 50% to 100% RW >100% to <1250% RW 1250% RW/ deductions SEC- IRBA SEC- ERBA (including IAA)
SEC-SA 1250% RW/ deductions SEC- IRBA SEC-ERBA (including IAA) SEC-SA 1250% RW/ deductions SEC- IRBA SEC- ERBA (including IAA) SEC-SA 1250% RW/ deductions 1 Total exposures 53,117 - 359 114 0 43,935 - 9,655 0 7,202 - 1,584 -
576 - 127 - 2 Traditional transactions 9 - - - - - - 9 - - - 1 - - - 0 - 3 Securitisation 9 - - - - - - 9 - - - 1 - - - 0 - 4 Retail - - - - - - - - - - - - - - - - - 5 Of which STS - -
- - - - - - - - - - - - - - - 6 Wholesale 9 - - - - - - 9 - - - 1 - - - 0 - 7 Of which STS - - - - - - - - - - - - - - - - - 8 Re-securitisation - - - - - - - - - - - - - - - - -
9 Synthetic transactions 53,108 - 359 114 0 43,935 - 9,646 0 7,202 - 1,582 - 576 - 127 - 10 Securitisation 53,108 - 359 111 0 43,935 - 9,643 0 7,202 - 1,549 - 576 - 124 - 11 Retail 5,167 - 272 - - - -
5,439 0 - - 919 - - - 74 - 12 Wholesale 47,941 - 87 111 0 43,935 - 4,204 0 7,202 - 631 - 576 - 50 - 13 Re-securitisation - - - 3 - - - 3 - - - 33 - - - 3 -
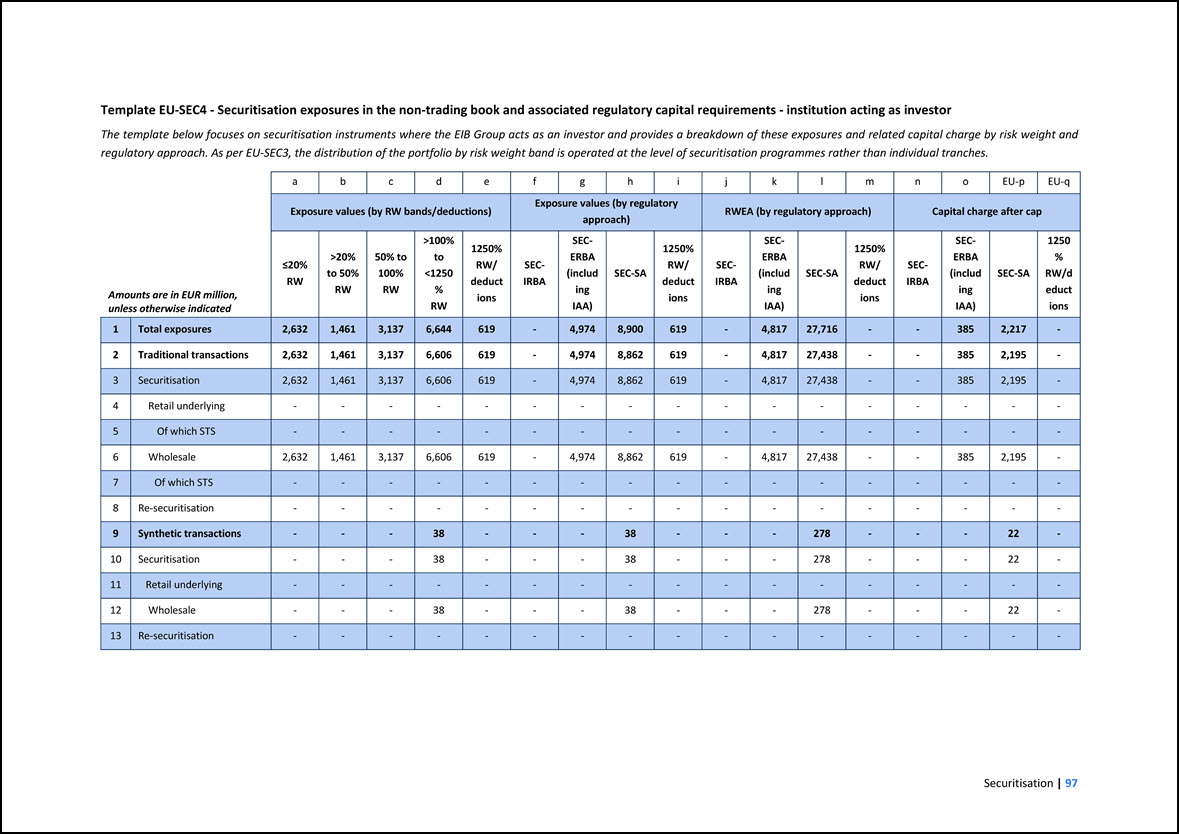
Template EU-SEC4 - Securitisation exposures in the non-trading book and associated regulatory capital requirements - institution acting as investor The template below
focuses on securitisation instruments where the EIB Group acts as an investor and provides a breakdown of these exposures and related capital charge by risk weight and regulatory approach. As per EU-SEC3, the distribution of the portfolio by risk
weight band is operated at the level of securitisation programmes rather than individual tranches. Amounts are in EUR million, unless otherwise indicated a b c d e f g h i j k l m n o EU-p EU-q Exposure values (by RW
bands/deductions) Exposure values (by regulatory approach) RWEA (by regulatory approach) Capital charge after cap =20% RW >20% to 50% RW 50% to 100% RW >100% to <1250% RW 1250% RW/ deductions SEC- IRBA SEC- ERBA (including IAA)
SEC-SA 1250% RW/ deductions SEC- IRBA SEC- ERBA (including IAA) SEC-SA 1250% RW/ deductions SEC- IRBA SEC- ERBA (including IAA) SEC-SA 1250% RW/deductions 1 Total exposures 2,632 1,461 3,137 6,644 619 - 4,974 8,900 619 - 4,817
27,716 - - 385 2,217 - 2 Traditional transactions 2,632 1,461 3,137 6,606 619 - 4,974 8,862 619 - 4,817 27,438 - - 385 2,195 - 3 Securitisation 2,632 1,461 3,137 6,606 619 - 4,974 8,862 619 - 4,817 27,438 - -
385 2,195 - 4 Retail underlying - - - - - - - - - - - - - - - - - 5 Of which STS - - - - - - - - - - - - - - - - - 6 Wholesale 2,632 1,461 3,137 6,606 619 - 4,974 8,862 619 - 4,817 27,438 - -
385 2,195 - 7 Of which STS - - - - - - - - - - - - - - - - - 8 Re-securitisation - - - - - - - - - - - - - - - - - 9 Synthetic transactions - - - 38 - - - 38 - - - 278 - - - 22 - 10
Securitisation - - - 38 - - - 38 - - - 278 - - - 22 - 11 Retail underlying - - - - - - - - - - - - - - - - - 12 Wholesale - - - 38 - - - 38 - - - 278 - - - 22 - 13 Re-securitisation - - -
- - - - - - - - - - - - - -
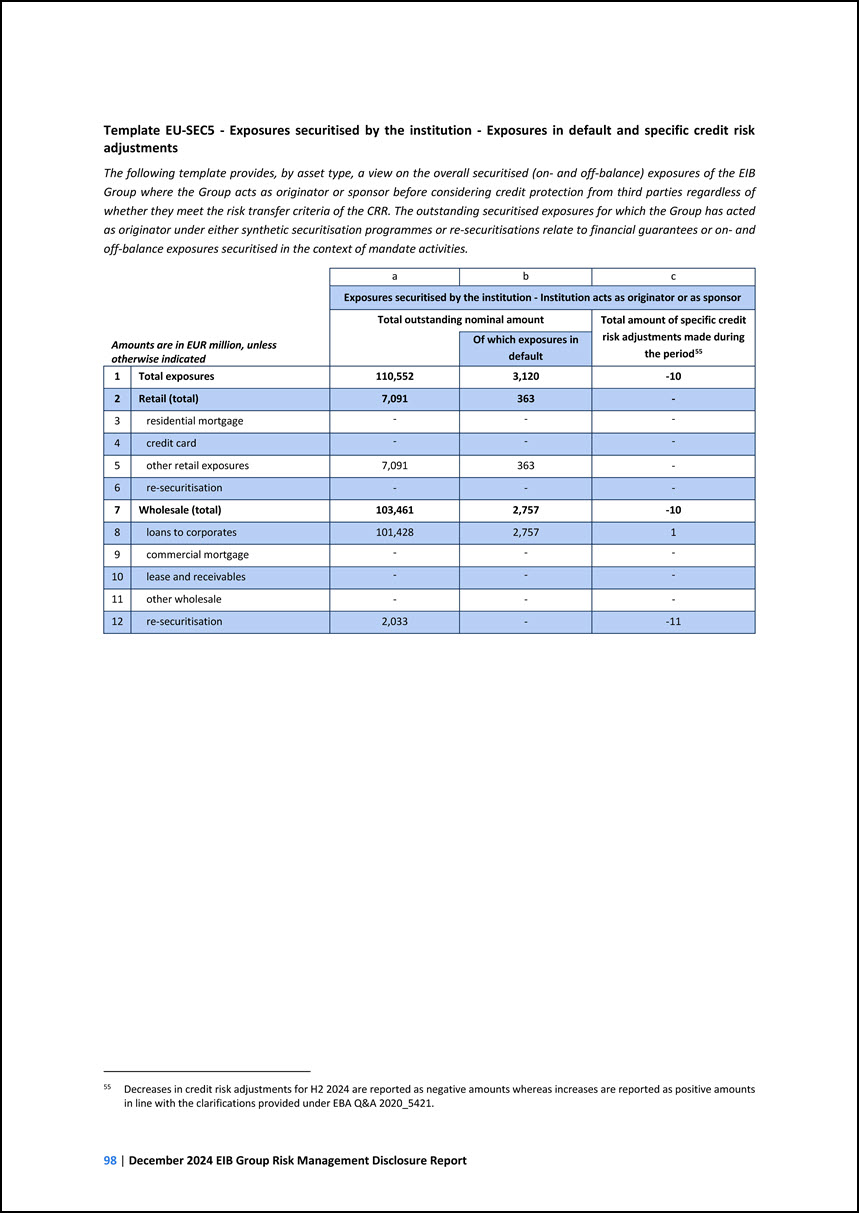
Template EU-SEC5 - Exposures securitised by the institution - Exposures in default and specific credit risk adjustments The following template provides, by asset
type, a view on the overall securitised (on- and off-balance) exposures of the EIB Group where the Group acts as originator or sponsor before considering credit protection from third parties regardless of whether they meet the risk transfer criteria
of the CRR. The outstanding securitised exposures for which the Group has acted as originator under either synthetic securitisation programmes or re-securitisations relate to financial guarantees or on- and off-balance exposures securitised in the
context of mandate activities. Amounts are in EUR million, unless otherwise indicated a b c Exposures securitised by the institution - Institution acts as originator or as sponsor Total outstanding nominal amount Total amount of specific
credit risk adjustments made during the period55 Of which exposures in default 1 Total exposures 110,552 3,120 -10 2 Retail (total) 7,091 363 - 3 residential mortgage - - - 4 credit card - - - 5 other retail exposures 7,091
363 - 6 re-securitisation - - - 7 Wholesale (total) 103,461 2,757 -10 8 loans to corporates 101,428 2,757 1 9 commercial mortgage - - - 10 lease and receivables - - - 11 other wholesale - - - 12 re-securitisation
2,033 - -11 55 Decreases in credit risk adjustments for H2 2024 are reported as negative amounts whereas increases are reported as positive amounts in line with the clarifications provided under EBA Q&A 2020_5421.
8 LEVERAGE RATIO Internal leverage measures The Group uses the gearing ratio to limit the excess of leverage. This statutory ratio is defined as “the aggregate
amount outstanding at any time of loans and guarantees granted by the Bank, which shall not exceed 250% of its subscribed capital, reserves, non-allocated provisions and profit and loss account surplus. The latter aggregate amount shall be reduced by
an amount equal to the amount subscribed (whether or not paid in) for any equity participation of the Bank” (Article 16.5 of the Bank’s Statute). The ratio is calculated on an individual and consolidated basis. In June 2024, the EIB Board of
Governors unanimously decided to increase the Gearing Ratio of the Bank from 250% to 290%. This decision was subsequently approved by the Council of the European Union in March 2025 to enable the Bank to deliver on the priorities and goals set out in
the Strategic Roadmap. The new Gearing Ratio limit will enter into force in March 2025. Additionally, the Bank measures leverage via an internal liability leverage ratio, defined as the ratio between outstanding debt and own funds. The indicator is
monitored on an ongoing basis at Bank level. Both ratios are regularly reported to senior management. As part of the Group OP/Group Capital Plan, the ratios are projected under different scenarios in order to ensure that the relevant limits are
respected going forward. CRR leverage ratio The CRR leverage ratio serves as a non-risk-based “backstop” measure, to supplement risk-based capital requirements. It aims to constrain the build-up of excess leverage in the banking sector and provide
a safeguard against the risks associated with risk models (model risk and measurement errors). The leverage ratio is currently calculated based on Article 429 of the CRR which introduced a minimum leverage ratio within the European Union of 3%,
determined as the ratio of Tier 1 capital [Common Equity Tier 1 plus Additional Tier 1 Capital (‘AT1’)] divided by the regulatory leverage exposure measure (balance sheet and off- balance sheet exposures). The binding leverage ratio of 3% became
applicable on 28 June 2021 and failure to comply with the leverage ratio buffer requirement will result in a distribution restriction and the calculation of maximum distributable amount (L-MDA). Since 1 January 2023, an additional leverage ratio
buffer requirement for global systemically important institutions (G-SIIs) equal to 50% of the applicable G-SII buffer rate applies56. 56 Pursuant to Regulation (EU) 2020/873 of the European Parliament and of the Council. The CRR leverage ratio
applied by the EIB as BBP, is regularly reported to the Group’s senior management. The Group has put in place procedures and resources to assess and manage the risk of excessive leverage. The leverage ratio is part of the annual capital planning
process and internal limits are defined, which, if breached, trigger an escalation process defined in the EIB Group RP. Maturity mismatches and asset encumbrance are managed within the liquidity risk metrics described in Section 9.
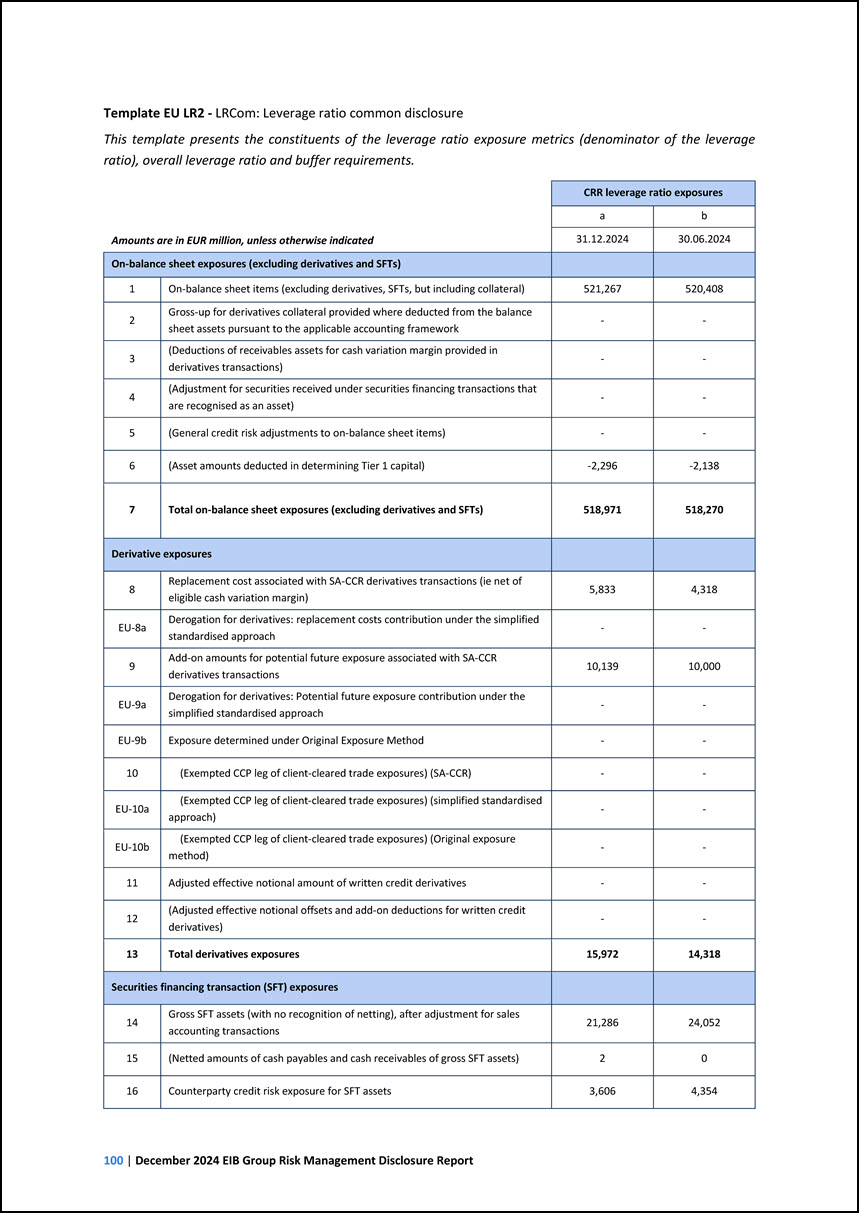
Template EU LR2 - LRCom: Leverage ratio common disclosure This template presents the constituents of the leverage ratio exposure metrics (denominator of the leverage
ratio), overall leverage ratio and buffer requirements. Amounts are in EUR million, unless otherwise indicated CRR leverage ratio exposures a b 31.12.2024 30.06.2024 On-balance sheet exposures (excluding derivatives and SFTs) 1 On-balance
sheet items (excluding derivatives, SFTs, but including collateral) 521,267 520,408 2 Gross-up for derivatives collateral provided where deducted from the balance sheet assets pursuant to the applicable accounting framework - - 3 (Deductions
of receivables assets for cash variation margin provided in derivatives transactions) - - 4 (Adjustment for securities received under securities financing transactions that are recognised as an asset) - - 5 (General credit risk adjustments to
on-balance sheet items) - - 6 (Asset amounts deducted in determining Tier 1 capital) -2,296 -2,138 7 Total on-balance sheet exposures (excluding derivatives and SFTs) 518,971 518,270 Derivative exposures 8 Replacement cost
associated with SA-CCR derivatives transactions (ie net of eligible cash variation margin) 5,833 4,318 EU-8a Derogation for derivatives: replacement costs contribution under the simplified standardised approach - - 9 Add-on amounts for
potential future exposure associated with SA-CCR derivatives transactions 10,139 10,000 EU-9a Derogation for derivatives: Potential future exposure contribution under the simplified standardised approach - - EU-9b Exposure determined under
Original Exposure Method - - 10 (Exempted CCP leg of client-cleared trade exposures) (SA-CCR) - - EU-10a (Exempted CCP leg of client-cleared trade exposures) (simplified standardised approach) - - EU-10b (Exempted CCP leg of
client-cleared trade exposures) (Original exposure method) - - 11 Adjusted effective notional amount of written credit derivatives - - 12 (Adjusted effective notional offsets and add-on deductions for written credit derivatives) - - 13
Total derivatives exposures 15,972 14,318 Securities financing transaction (SFT) exposures 14 Gross SFT assets (with no recognition of netting), after adjustment for sales accounting transactions 21,286 24,052 15 (Netted amounts of cash
payables and cash receivables of gross SFT assets) 2 0 16 Counterparty credit risk exposure for SFT assets 3,606 4,354
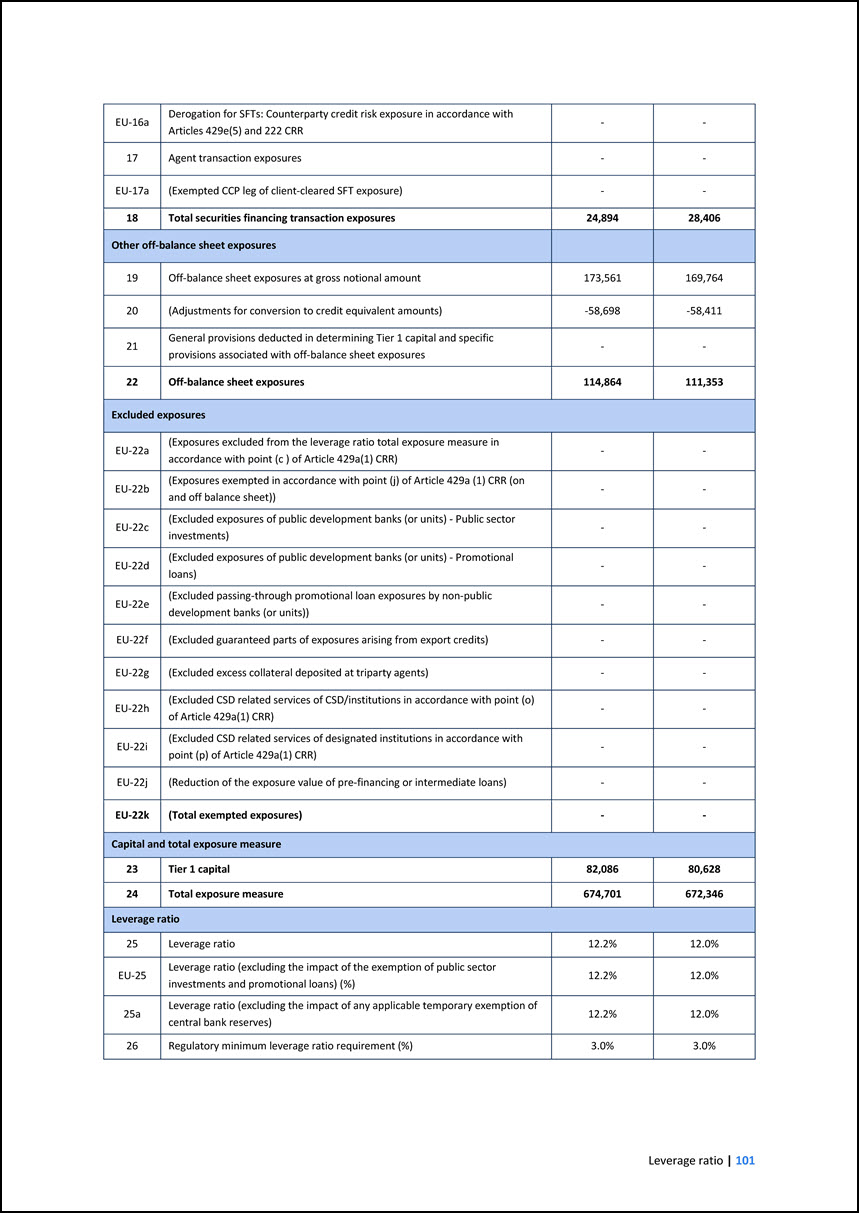
EU-16a Derogation for SFTs: Counterparty credit risk exposure in accordance with Articles 429e(5) and 222 CRR - - 17 Agent transaction exposures - - EU-17a
(Exempted CCP leg of client-cleared SFT exposure) - - 18 Total securities financing transaction exposures 24,894 28,406 Other off-balance sheet exposures 19 Off-balance sheet exposures at gross notional amount 173,561 169,764 20
(Adjustments for conversion to credit equivalent amounts) -58,698 -58,411 21 General provisions deducted in determining Tier 1 capital and specific provisions associated with off-balance sheet exposures - - 22 Off-balance sheet exposures
114,864 111,353 Excluded exposures EU-22a (Exposures excluded from the leverage ratio total exposure measure in accordance with point (c ) of Article 429a(1) CRR) - - EU-22b (Exposures exempted in accordance with point (j) of Article 429a (1)
CRR (on and off balance sheet)) - - EU-22c (Excluded exposures of public development banks (or units) - Public sector investments) - - EU-22d (Excluded exposures of public development banks (or units) - Promotional loans) - - EU-22e
(Excluded passing-through promotional loan exposures by non-public development banks (or units)) - - EU-22f (Excluded guaranteed parts of exposures arising from export credits) - - EU-22g (Excluded excess collateral deposited at triparty
agents) - - EU-22h (Excluded CSD related services of CSD/institutions in accordance with point (o) of Article 429a(1) CRR) - - EU-22i (Excluded CSD related services of designated institutions in accordance with point (p) of Article 429a(1)
CRR) - - EU-22j (Reduction of the exposure value of pre-financing or intermediate loans) - - EU-22k (Total exempted exposures) - - Capital and total exposure measure 23 Tier 1 capital 82,086 80,628 24 Total exposure measure 674,701
672,346 Leverage ratio 25 Leverage ratio 12.2% 12.0% EU-25 Leverage ratio (excluding the impact of the exemption of public sector investments and promotional loans) (%) 12.2% 12.0% 25a Leverage ratio (excluding the impact of any applicable
temporary exemption of central bank reserves) 12.2% 12.0% 26 Regulatory minimum leverage ratio requirement (%) 3.0% 3.0%
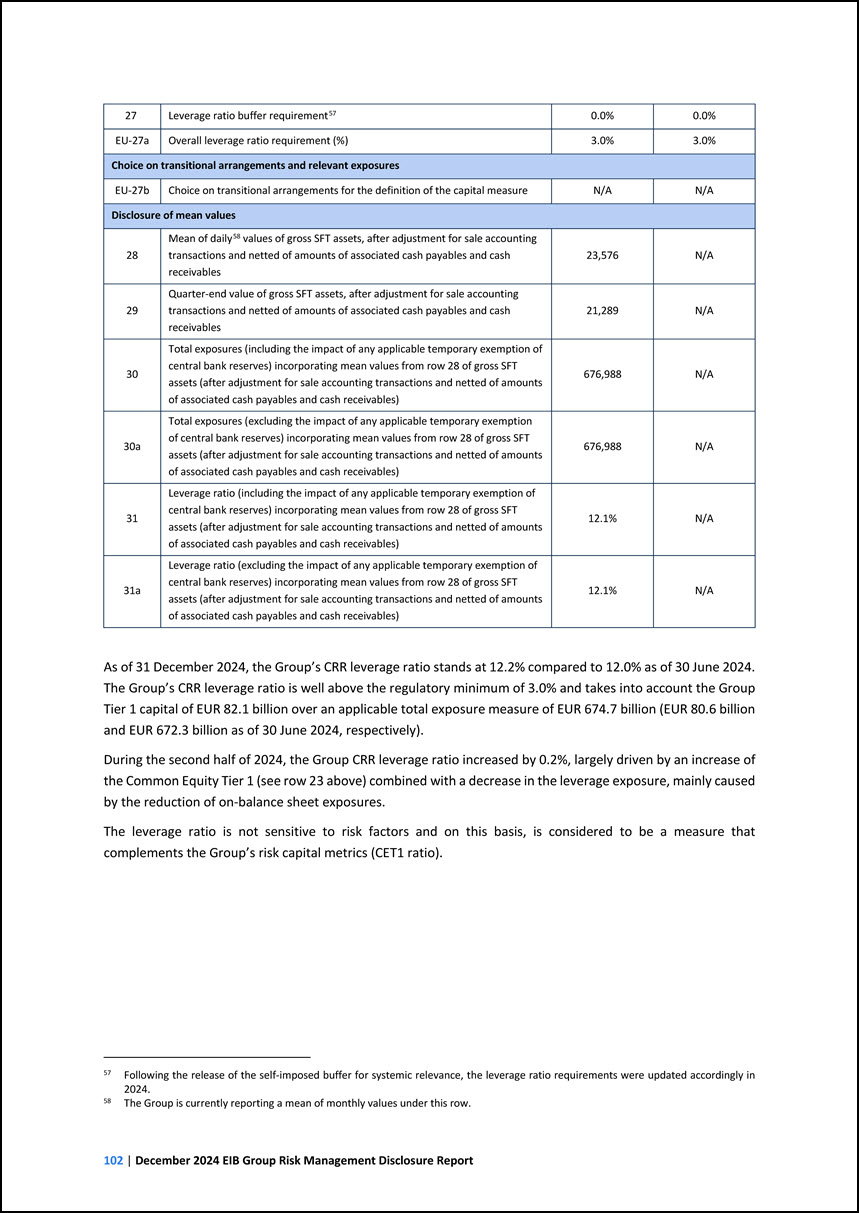
27 Leverage ratio buffer requirement57 0.0% 0.0% EU-27a Overall leverage ratio requirement (%) 3.0% 3.0% Choice on transitional arrangements and relevant
exposures EU-27b Choice on transitional arrangements for the definition of the capital measure N/A N/A Disclosure of mean values 28 Mean of daily58 values of gross SFT assets, after adjustment for sale accounting transactions and netted of
amounts of associated cash payables and cash receivables 23,576 N/A 29 Quarter-end value of gross SFT assets, after adjustment for sale accounting transactions and netted of amounts of associated cash payables and cash receivables 21,289 N/A
30 Total exposures (including the impact of any applicable temporary exemption of central bank reserves) incorporating mean values from row 28 of gross SFT assets (after adjustment for sale accounting transactions and netted of amounts of associated
cash payables and cash receivables) 676,988 N/A 30a Total exposures (excluding the impact of any applicable temporary exemption of central bank reserves) incorporating mean values from row 28 of gross SFT assets (after adjustment for sale
accounting transactions and netted of amounts of associated cash payables and cash receivables) 676,988 N/A 31 Leverage ratio (including the impact of any applicable temporary exemption of central bank reserves) incorporating mean values from row
28 of gross SFT assets (after adjustment for sale accounting transactions and netted of amounts of associated cash payables and cash receivables) 12.1% N/A 31a Leverage ratio (excluding the impact of any applicable temporary exemption of central
bank reserves) incorporating mean values from row 28 of gross SFT assets (after adjustment for sale accounting transactions and netted of amounts of associated cash payables and cash receivables) 12.1% N/A 57 Following the release of the
self-imposed buffer for systemic relevance, the leverage ratio requirements were updated accordingly in 2024. 58 The Group is currently reporting a mean of monthly values under this row. As of 31 December 2024, the Group’s CRR leverage ratio
stands at 12.2% compared to 12.0% as of 30 June 2024. The Group’s CRR leverage ratio is well above the regulatory minimum of 3.0% and takes into account the Group Tier 1 capital of EUR 82.1 billion over an applicable total exposure measure of EUR
674.7 billion (EUR 80.6 billion and EUR 672.3 billion as of 30 June 2024, respectively). During the second half of 2024, the Group CRR leverage ratio increased by 0.2%, largely driven by an increase of the Common Equity Tier 1 (see row 23 above)
combined with a decrease in the leverage exposure, mainly caused by the reduction of on-balance sheet exposures. The leverage ratio is not sensitive to risk factors and on this basis, is considered to be a measure that complements the Group’s risk
capital metrics (CET1 ratio).
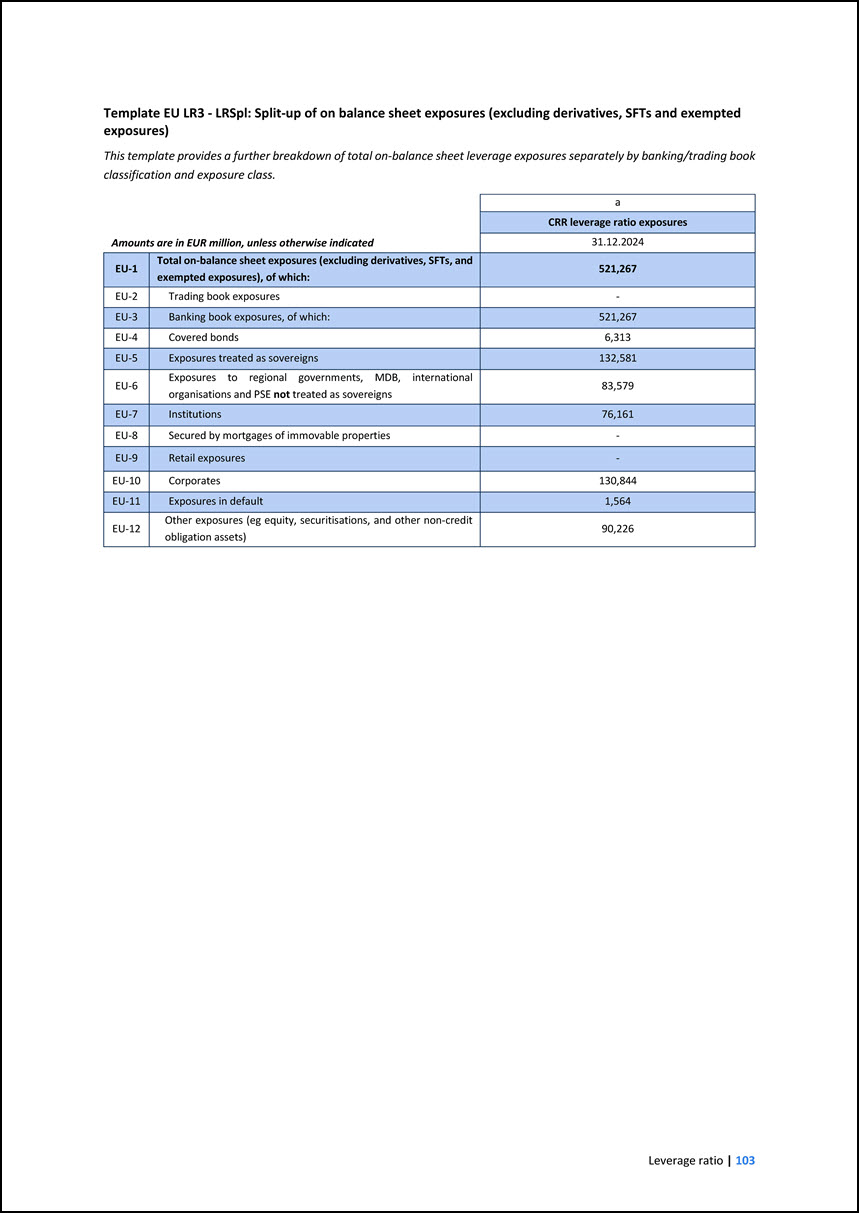
Template EU LR3 - LRSpl: Split-up of on balance sheet exposures (excluding derivatives, SFTs and exempted exposures) This template provides a further breakdown of
total on-balance sheet leverage exposures separately by banking/trading book classification and exposure class. Amounts are in EUR million, unless otherwise indicated a CRR leverage ratio exposures 31.12.2024 EU-1 Total on-balance sheet
exposures (excluding derivatives, SFTs, and exempted exposures), of which: 521,267 EU-2 Trading book exposures - EU-3 Banking book exposures, of which: 521,267 EU-4 Covered bonds 6,313 EU-5 Exposures treated as sovereigns 132,581 EU-6
Exposures to regional governments, MDB, international organisations and PSE not treated as sovereigns 83,579 EU-7 Institutions 76,161 EU-8 Secured by mortgages of immovable properties - EU-9 Retail exposures - EU-10 Corporates 130,844
EU-11 Exposures in default 1,564 EU-12 Other exposures (eg equity, securitisations, and other non-credit obligation assets) 90,226
9 LIQUIDITY RISK 9.1 Internal framework for liquidity risk management Liquidity risk is defined as the risk of the Group’s ability to fund increases in assets and
meet obligations as they come due, without incurring unacceptable losses. It can be further split into funding liquidity risk and market liquidity risk. Funding liquidity risk is the risk of being unable to refinance the asset side of its balance
sheet and to meet payment obligations punctually and in full out of readily available liquid resources. Market liquidity risk is the volatility in the economic value of the assets or in the income, due to the potential inability to execute a
transaction to offset, eliminate or reduce outstanding positions at reasonable market prices. The EIB is an eligible counterparty in Eurosystem monetary policy operations. As such, the EIB has access to the ECB (European Central Bank)’s refinancing
operations. Within the context of the EIB’s access to the ECB’s liquidity facilities, the BCL, on behalf of the ECB, performs liquidity assessments on the EIB periodically, aimed at monitoring its liquidity position and liquidity risk management
activities. For liquidity management and liquidity risk management, the Group follows a decentralised model where both the EIB and the EIF have a separate liquidity framework in place tailored to the entity business model with the objective of
ensuring that each entity can always meet its payment obligations punctually and in full. Both entities, the EIB and the EIF, have in place an independent Risk Management function monitoring and controlling the liquidity risk of each respective
entity. For the EIB, the liquidity risk management framework follows the same organisational structure as described in Section 3.3 of the GRMDR. More specifically, there are different specialised EIB committees involved in liquidity risk-related
matters such as the RPC at Board level or, for example, the Asset & Liability Management Committee (ALCO) at service level. The EIF’s Asset and Liquidity Committee (ALC) is involved in oversight and management of EIF liquidity risks. Given the
Bank’s business model, wholesale long-term funding primarily through bond issuance is the prevailing source of resources for its lending activities. The funding strategy of the EIB relies on the issuance of large and liquid benchmark transactions in
the main currencies (EUR and USD). These benchmark transactions are complemented by targeted issuance offerings, prudent diversification of investors, currencies and markets. A growing issuance share comes in the form of Climate and Sustainability
Awareness Bonds, whose proceeds are allocated to disbursements of projects contributing substantially to climate and sustainability objectives, respectively, in line with evolving EU legislation. A breakdown of debt securities issued by the EIB is
provided in Note K of the EIB statutory financial statements and EIB Group consolidated financial statements under EU-AD59. 59 Further information on the funding strategy of the Bank can be found in Section 3. Funding activities of the Overview of
the EIB Group Financial Report and in the Investor Relations tab of the EIB website. In defining its funding programme, the Bank considers all relevant future cash flows in a prudent manner and pays due regard to the control of the structural
maturity mismatch between its lending and borrowing activities. The Bank has a specific policy in place on the transfer of costs to the client. In order to manage its liquid assets, the Bank holds a liquidity buffer composed of several treasury
portfolios with short, medium and long-term investment horizons, each of them managed according to risk guidelines approved by the MC. In addition, the liquidity buffer is also composed of unencumbered and reusable collateral received. Further to
this, the Bank can participate in the monetary refinancing operations of the Eurosystem, through its access to the BCL60. 60 Further information on the treasury portfolios of the EIBG can be found in Notes A 2.6 and B.2 of the EIB Group Financial
Statements under EU-AD.
By contrast, the EIF does not fund itself on the capital markets. Liquid assets are managed by the EIF ensure an appropriate level of liquidity for meeting foreseeable
disbursements and business objectives as well as covering operating costs and earning a reasonable return on assets invested with due regard to the authorised level of risk. The Fund has the vast majority of its available cash invested in the
long-term treasury portfolio composed of highly liquid bond portfolio holdings as a reserve. 61 in such a way as to 61 Management of the EIF long-term treasury bond portfolio is delegated to the EIB whilst the EIF sets the related risk appetite via
its Financial Risk Guidelines and decides if a position outside this risk appetite is sold or kept. The Bank uses derivative instruments as part of its Asset and Liability Management activities, to manage interest rate, maturity mismatch,
cross-currency basis and foreign currency risks and reduce the exposures to such risks62. 62 Further information on the use of derivatives can be found in Note V and section A.2.3 of the EIB Group Financial Statements under EU- AD. The Bank’s
exposure to derivative counterparts is mitigated through CSAs to the ISDA Master Agreements, which provide for daily collateralisation of exposures as explained in Chapter 6. The CSAs signed by the Bank are unilateral (or one-way), meaning that the
EIB is not obliged to post collateral – neither in the form of cash, nor securities – as it would be under an ordinary CSA. Within the unilateral CSA framework, the Bank is also executing cross-currency swaps with quarterly resets of their nominal to
match the changes in the relevant FX rate over the period. These resets are settled in cash on a quarterly basis. The Bank’s internal policies related to liquidity risk identification, measurement, monitoring, including limit setting, compliance and
reporting, as well as the broad organisational framework to implement such rules are documented in the FRG. For the EIF, the liquidity risk principles are documented in the EIF’s Financial Risk Guidelines and further defined in additional
procedures. Management, monitoring and reporting The Group has in place sound internal processes for identifying, measuring, monitoring and controlling liquidity risk. The management, monitoring and reporting are implemented within the Group taking
into consideration proportionality and the business model specificities of each entity. On a daily basis, information about EIB daily cash flows in all the operating currencies is available for the purposes of short-term liquidity planning and
investment. On a daily and end-of-month basis, all cash flows arising from assets, liabilities and off-balance sheet items are simulated over several time horizons, under both “base-case” and internally determined “stressed” conditions. For the EIF,
short-term liquidity planning under base-case conditions is done by the first line of defence on a weekly basis. Asset, liability and off- balance sheet cash flow simulations are performed by the second line of defence over different time horizons on
a monthly basis, under internally determined “stressed” conditions, reflecting the EIF’s business model. The EIB Group performs liquidity stress tests, at Group level and at Group entity level, as necessary. Stress tests are designed by taking into
consideration the EIBG’s business activities, the funding sources and its financial products. The cash flow projections contribute to determining the appropriate size of the Bank’s liquidity buffer, by ensuring that it is sufficient to cover the
Bank’s future net cash outflows under all conditions, “base-case” and “stressed” alike. The results of the stress tests are regularly reported to the ALCO. Liquidity adequacy at the EIF is monitored through internal liquidity risk indicators
calculated under stress assumptions regarding both cash flows and liquidity buffer. The stress test scenarios are designed to ensure that the Fund has put in place adequate liquidity buffers against prospective net cash outflows over different time
horizons. The results are reported to the ALC on a quarterly basis.
Tolerance levels and limits for the internal liquidity risk indicators are specified in the Group RAF with the aim of ensuring that the Bank and the Fund hold an
adequate liquidity buffer to cover their future net cash outflows. Such indicators are calculated by the EIB on a daily, weekly and monthly basis, and by the EIF on a monthly basis. The Group RAF indicators are approved by the Board of Directors
through the respective RAFs and are subject to regular updates to ensure their ongoing adherence to the business model of the two entities. The Risk Management functions of both the EIB and the EIF report the level of the liquidity risk indicators
to senior management on a monthly basis. During 2024, all liquidity risk indicators were well in line with the approved risk tolerance. In line with the BBP, the EIB Group has a Group Contingency Funding Plan (GCFP) that defines the escalation
procedures and course of actions in the event of a liquidity crisis. The contingency plan may be activated as a result of extraordinary market conditions and/or as a result of the internal liquidity risk indicators reaching pre- defined crisis
levels. The GCFP is updated and tested on an annual basis. Furthermore, the EIF has its own CFP on a standalone basis which is also subject to update and test on an annual basis. Further information on the Group’s liquidity risk management is
provided in the EIB Group consolidated financial statements under IFRS, Note S.3. These also provide the maturity profile for derivative and non-derivative financial liabilities. 9.2 Internal Liquidity Adequacy Assessment Process (ILAAP) As an
integral part of its risk management framework, the EIB Group has in place an Internal Liquidity Adequacy Assessment Process. In addition to this, a standalone ILAAP is prepared by the Fund, which is tailored to its specific business model. Both
entities in the Group have established robust liquidity risk management frameworks, and liquidity risk is managed prudently in order to ensure the regular functioning of the core activities under both normal and stressed conditions. Relevant policies
and practices are in place and in line with the identified liquidity risk tolerance levels and are communicated to senior management through internal reporting tools in order to facilitate the robust measurement, monitoring and control of liquidity
risk. Stress tests aiming to test the Group’s overall capacity to withstand hypothetical adverse liquidity conditions are performed in the context of the ILAAP. Such scenarios are performed coherently across the Group and consist of: (i) an
idiosyncratic scenario; (ii) a market-wide scenario; (iii) a scenario combining market and idiosyncratic elements; and (iv) a scenario related to operational risk. On top of the aforementioned scenarios performed at consolidated level, the EIF
performs a standalone stress test scenario combining market and idiosyncratic elements with respect to the EIF exposures to address the potential standalone consequences of severe liquidity outflows at the EIF. Lastly, in order to complement the
aforementioned “traditional” stress tests, a reverse stress test is performed by both entities of the Group, with the objective of assessing a hypothetical extreme scenario that would lead to a predefined severe impact in the liquidity risk
indicators. Within the annual approval of the EIB Group ILAAP, the Board of Directors of the EIB, as the Board of the Group parent company, approved the Liquidity Adequacy Statement (“LAS”) for the EIB Group, having acknowledged all assumptions,
arguments and facts, underlying the conclusions of the EIB Group ILAAP. The BoD took note that liquidity RAF metrics defined on an EIB consolidated and standalone basis, as well as on an EIF standalone basis, were within their respective limits and
were assessed by means of liquidity stress tests considered for the Group ILAAP. The BoD concluded that the liquidity assessment framework of the EIB Group is adequate and proportionate to its business model, both from a point-in-time as well as from
a forward-looking perspective.
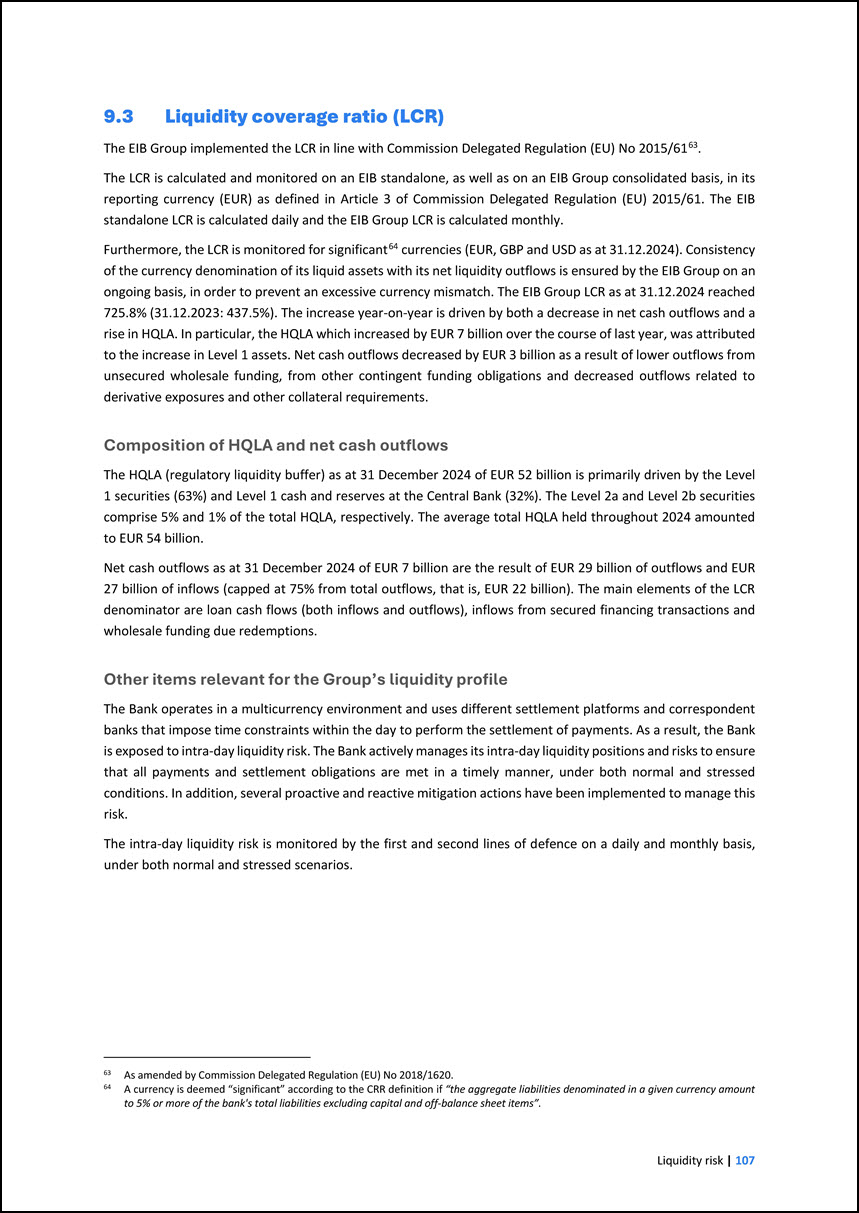
9.3 Liquidity coverage ratio (LCR) The EIB Group implemented the LCR in line with Commission Delegated Regulation (EU) No 2015/6163. 63 As amended by Commission
Delegated Regulation (EU) No 2018/1620. The LCR is calculated and monitored on an EIB standalone, as well as on an EIB Group consolidated basis, in its reporting currency (EUR) as defined in Article 3 of Commission Delegated Regulation (EU) 2015/61.
The EIB standalone LCR is calculated daily and the EIB Group LCR is calculated monthly. Furthermore, the LCR is monitored for significantof the currency denomination of its liquid assets with its net liquidity outflows is ensured by the EIB Group on
an ongoing basis, in order to prevent an excessive currency mismatch. The EIB Group LCR as at 31.12.2024 reached 725.8% (31.12.2023: 437.5%). The increase year-on-year is driven by both a decrease in net cash outflows and a rise in HQLA. In
particular, the HQLA which increased by EUR 7 billion over the course of last year, was attributed to the increase in Level 1 assets. Net cash outflows decreased by EUR 3 billion as a result of lower outflows from unsecured wholesale funding, from
other contingent funding obligations and decreased outflows related to derivative exposures and other collateral requirements. 64 currencies (EUR, GBP and USD as at 31.12.2024). Consistency 64 A currency is deemed “significant” according to the CRR
definition if “the aggregate liabilities denominated in a given currency amount to 5% or more of the bank's total liabilities excluding capital and off-balance sheet items”. Composition of HQLA and net cash outflows The HQLA (regulatory liquidity
buffer) as at 31 December 2024 of EUR 52 billion is primarily driven by the Level 1 securities (63%) and Level 1 cash and reserves at the Central Bank (32%). The Level 2a and Level 2b securities comprise 5% and 1% of the total HQLA, respectively. The
average total HQLA held throughout 2024 amounted to EUR 54 billion. Net cash outflows as at 31 December 2024 of EUR 7 billion are the result of EUR 29 billion of outflows and EUR 27 billion of inflows (capped at 75% from total outflows, that is, EUR
22 billion). The main elements of the LCR denominator are loan cash flows (both inflows and outflows), inflows from secured financing transactions and wholesale funding due redemptions. Other items relevant for the Group’s liquidity profile The
Bank operates in a multicurrency environment and uses different settlement platforms and correspondent banks that impose time constraints within the day to perform the settlement of payments. As a result, the Bank is exposed to intra-day liquidity
risk. The Bank actively manages its intra-day liquidity positions and risks to ensure that all payments and settlement obligations are met in a timely manner, under both normal and stressed conditions. In addition, several proactive and reactive
mitigation actions have been implemented to manage this risk. The intra-day liquidity risk is monitored by the first and second lines of defence on a daily and monthly basis, under both normal and stressed scenarios.
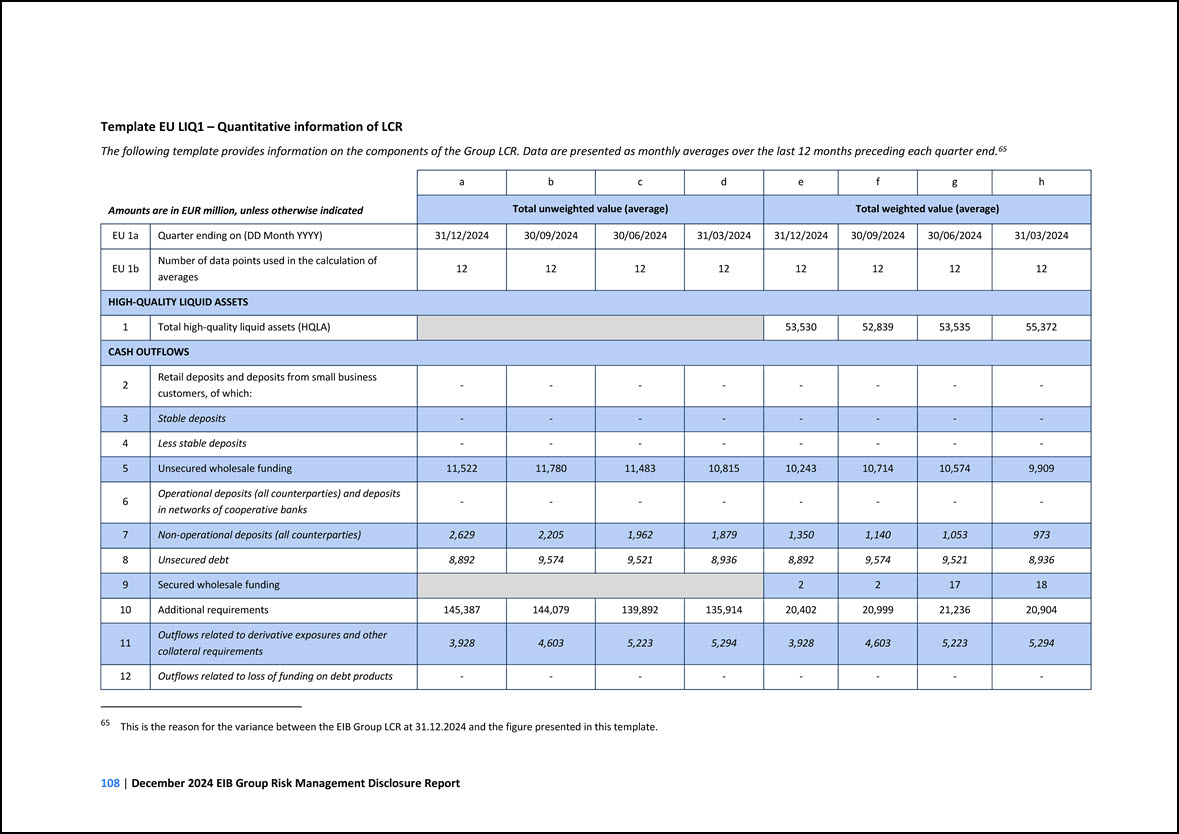
Template EU LIQ1 – Quantitative information of LCR The following template provides information on the components of the Group LCR. Data are presented as monthly
averages over the last 12 months preceding each quarter end.65 65 This is the reason for the variance between the EIB Group LCR at 31.12.2024 and the figure presented in this template. Amounts are in EUR million, unless otherwise indicated a b
c d e f g h Total unweighted value (average) Total weighted value (average) EU 1a Quarter ending on (DD Month YYYY) 31/12/2024 30/09/2024 30/06/2024 31/03/2024 31/12/2024 30/09/2024 30/06/2024 31/03/2024 EU 1b Number of data points
used in the calculation of averages 12 12 12 12 12 12 12 12 HIGH-QUALITY LIQUID ASSETS 1 Total high-quality liquid assets (HQLA) 53,530 52,839 53,535 55,372 CASH OUTFLOWS 2 Retail deposits and deposits from small business
customers, of which: - - - - - - - - 3 Stable deposits - - - - - - - - 4 Less stable deposits - - - - - - - - 5 Unsecured wholesale funding 11,522 11,780 11,483 10,815 10,243 10,714 10,574 9,909 6 Operational
deposits (all counterparties) and deposits in networks of cooperative banks - - - - - - - - 7 Non-operational deposits (all counterparties) 2,629 2,205 1,962 1,879 1,350 1,140 1,053 973 8 Unsecured debt 8,892 9,574 9,521
8,936 8,892 9,574 9,521 8,936 9 Secured wholesale funding 2 2 17 18 10 Additional requirements 145,387 144,079 139,892 135,914 20,402 20,999 21,236 20,904 11 Outflows related to derivative exposures and other collateral
requirements 3,928 4,603 5,223 5,294 3,928 4,603 5,223 5,294 12 Outflows related to loss of funding on debt products - - - - - - - -
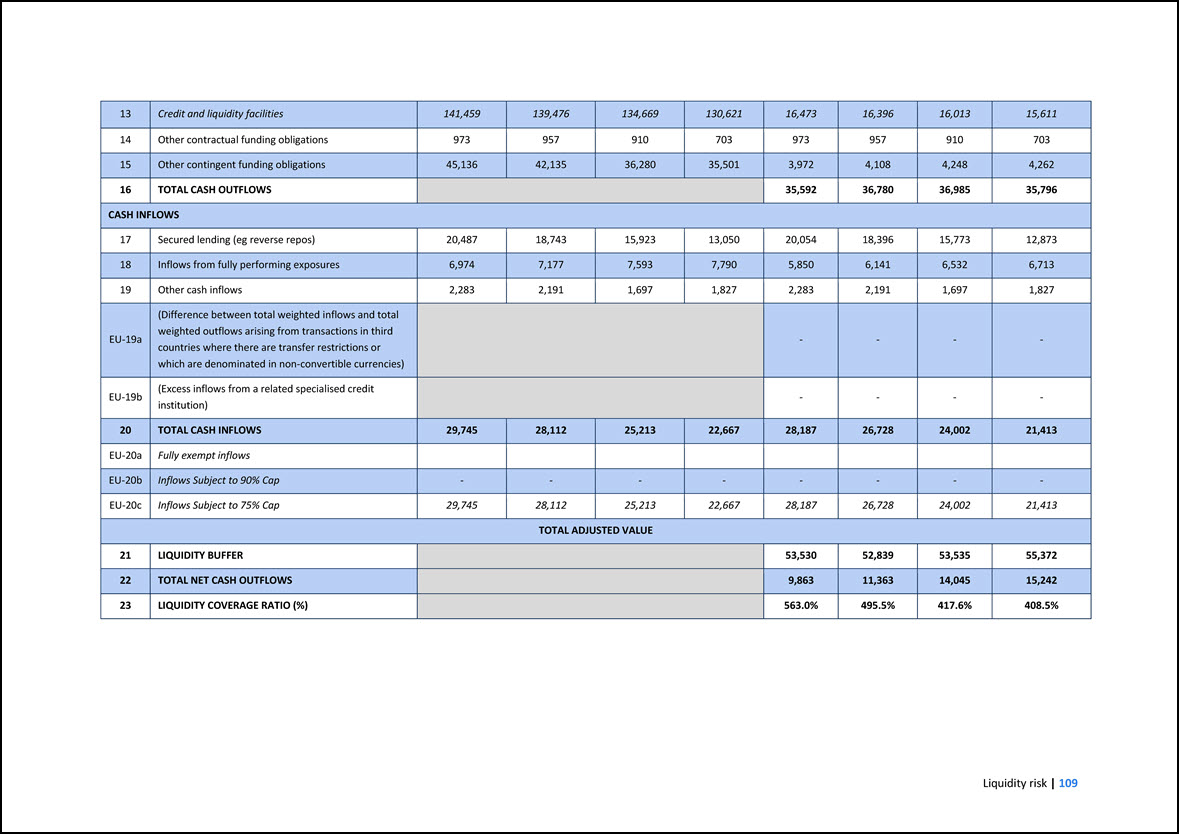
13 Credit and liquidity facilities 141,459 139,476 134,669 130,621 16,473 16,396 16,013 15,611 14 Other contractual funding obligations 973 957 910 703
973 957 910 703 15 Other contingent funding obligations 45,136 42,135 36,280 35,501 3,972 4,108 4,248 4,262 16 TOTAL CASH OUTFLOWS 35,592 36,780 36,985 35,796 CASH INFLOWS 17 Secured lending (eg reverse repos) 20,487 18,743
15,923 13,050 20,054 18,396 15,773 12,873 18 Inflows from fully performing exposures 6,974 7,177 7,593 7,790 5,850 6,141 6,532 6,713 19 Other cash inflows 2,283 2,191 1,697 1,827 2,283 2,191 1,697 1,827 EU-19a (Difference
between total weighted inflows and total weighted outflows arising from transactions in third countries where there are transfer restrictions or which are denominated in non-convertible currencies) - - - - EU-19b (Excess inflows from a related
specialised credit institution) - - - - 20 TOTAL CASH INFLOWS 29,745 28,112 25,213 22,667 28,187 26,728 24,002 21,413 EU-20a Fully exempt inflows EU-20b Inflows Subject to 90% Cap - - - - - - - - EU-20c
Inflows Subject to 75% Cap 29,745 28,112 25,213 22,667 28,187 26,728 24,002 21,413 TOTAL ADJUSTED VALUE 21 LIQUIDITY BUFFER 53,530 52,839 53,535 55,372 22 TOTAL NET CASH OUTFLOWS 9,863 11,363 14,045 15,242 23 LIQUIDITY
COVERAGE RATIO (%) 563.0% 495.5% 417.6% 408.5%
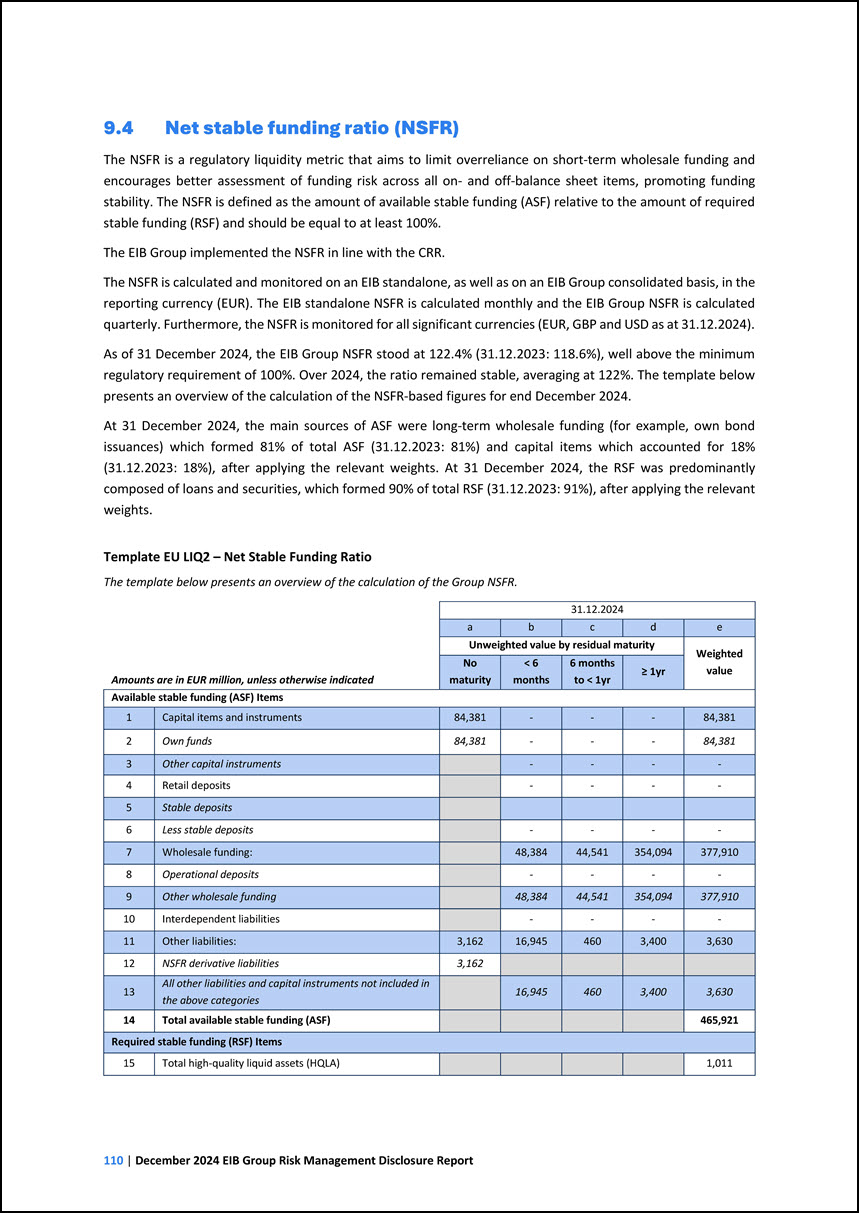
9.4 Net stable funding ratio (NSFR) The NSFR is a regulatory liquidity metric that aims to limit overreliance on short-term wholesale funding and encourages better
assessment of funding risk across all on- and off-balance sheet items, promoting funding stability. The NSFR is defined as the amount of available stable funding (ASF) relative to the amount of required stable funding (RSF) and should be equal to at
least 100%. The EIB Group implemented the NSFR in line with the CRR. The NSFR is calculated and monitored on an EIB standalone, as well as on an EIB Group consolidated basis, in the reporting currency (EUR). The EIB standalone NSFR is calculated
monthly and the EIB Group NSFR is calculated quarterly. Furthermore, the NSFR is monitored for all significant currencies (EUR, GBP and USD as at 31.12.2024). As of 31 December 2024, the EIB Group NSFR stood at 122.4% (31.12.2023: 118.6%), well
above the minimum regulatory requirement of 100%. Over 2024, the ratio remained stable, averaging at 122%. The template below presents an overview of the calculation of the NSFR-based figures for end December 2024. At 31 December 2024, the main
sources of ASF were long-term wholesale funding (for example, own bond issuances) which formed 81% of total ASF (31.12.2023: 81%) and capital items which accounted for 18% (31.12.2023: 18%), after applying the relevant weights. At 31 December 2024,
the RSF was predominantly composed of loans and securities, which formed 90% of total RSF (31.12.2023: 91%), after applying the relevant weights. Template EU LIQ2 – Net Stable Funding Ratio The template below presents an overview of the calculation
of the Group NSFR. 31.12.2024 Amounts are in EUR million, unless otherwise indicated a b c d e Unweighted value by residual maturity Weighted value No maturity < 6 months 6 months to < 1yr = 1yr Available stable funding (ASF)
Items 1 Capital items and instruments 84,381 - - - 84,381 2 Own funds 84,381 - - - 84,381 3 Other capital instruments - - - - 4 Retail deposits - - - - 5 Stable deposits 6 Less stable deposits - - - - 7
Wholesale funding: 48,384 44,541 354,094 377,910 8 Operational deposits - - - - 9 Other wholesale funding 48,384 44,541 354,094 377,910 10 Interdependent liabilities - - - - 11 Other liabilities: 3,162 16,945 460
3,400 3,630 12 NSFR derivative liabilities 3,162 13 All other liabilities and capital instruments not included in the above categories 16,945 460 3,400 3,630 14 Total available stable funding (ASF) 465,921 Required stable
funding (RSF) Items 15 Total high-quality liquid assets (HQLA) 1,011
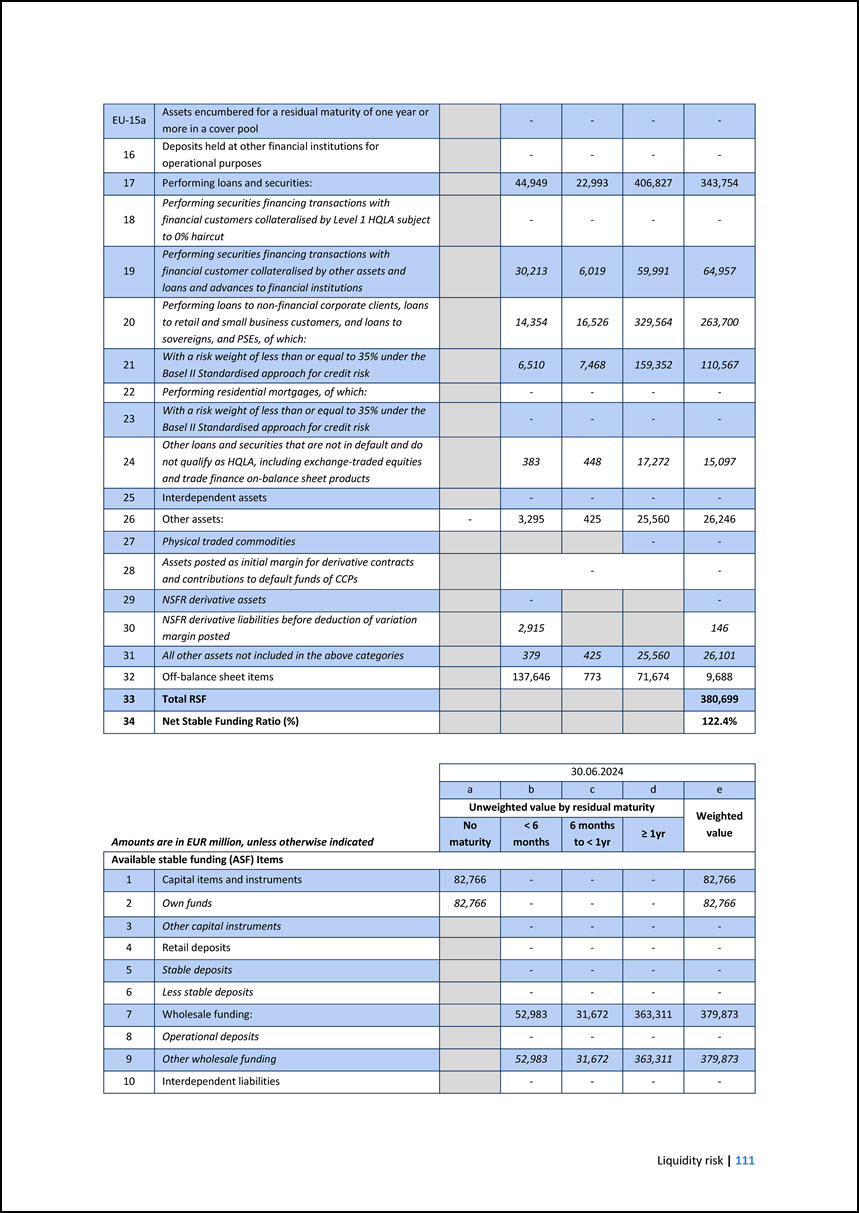
EU-15a Assets encumbered for a residual maturity of one year or more in a cover pool - - - - 16 Deposits held at other financial institutions for operational
purposes - - - - 17 Performing loans and securities: 44,949 22,993 406,827 343,754 18 Performing securities financing transactions with financial customers collateralised by Level 1 HQLA subject to 0% haircut - - - - 19
Performing securities financing transactions with financial customer collateralised by other assets and loans and advances to financial institutions 30,213 6,019 59,991 64,957 20 Performing loans to non-financial corporate clients, loans to
retail and small business customers, and loans to sovereigns, and PSEs, of which: 14,354 16,526 329,564 263,700 21 With a risk weight of less than or equal to 35% under the Basel II Standardised approach for credit risk 6,510 7,468
159,352 110,567 22 Performing residential mortgages, of which: - - - - 23 With a risk weight of less than or equal to 35% under the Basel II Standardised approach for credit risk - - - - 24 Other loans and securities that are not in
default and do not qualify as HQLA, including exchange-traded equities and trade finance on-balance sheet products 383 448 17,272 15,097 25 Interdependent assets - - - - 26 Other assets: - 3,295 425 25,560 26,246 27 Physical
traded commodities - - 28 Assets posted as initial margin for derivative contracts and contributions to default funds of CCPs - - 29 NSFR derivative assets - - 30 NSFR derivative liabilities before deduction of variation margin
posted 2,915 146 31 All other assets not included in the above categories 379 425 25,560 26,101 32 Off-balance sheet items 137,646 773 71,674 9,688 33 Total RSF 380,699 34 Net Stable Funding Ratio (%) 122.4%
30.06.2024 Amounts are in EUR million, unless otherwise indicated a b c d e Unweighted value by residual maturity Weighted value No maturity < 6 months 6 months to < 1yr = 1yr Available stable funding (ASF) Items 1 Capital items
and instruments 82,766 - - - 82,766 2 Own funds 82,766 - - - 82,766 3 Other capital instruments - - - - 4 Retail deposits - - - - 5 Stable deposits - - - - 6 Less stable deposits - - - - 7 Wholesale
funding: 52,983 31,672 363,311 379,873 8 Operational deposits - - - - 9 Other wholesale funding 52,983 31,672 363,311 379,873 10 Interdependent liabilities - - - -
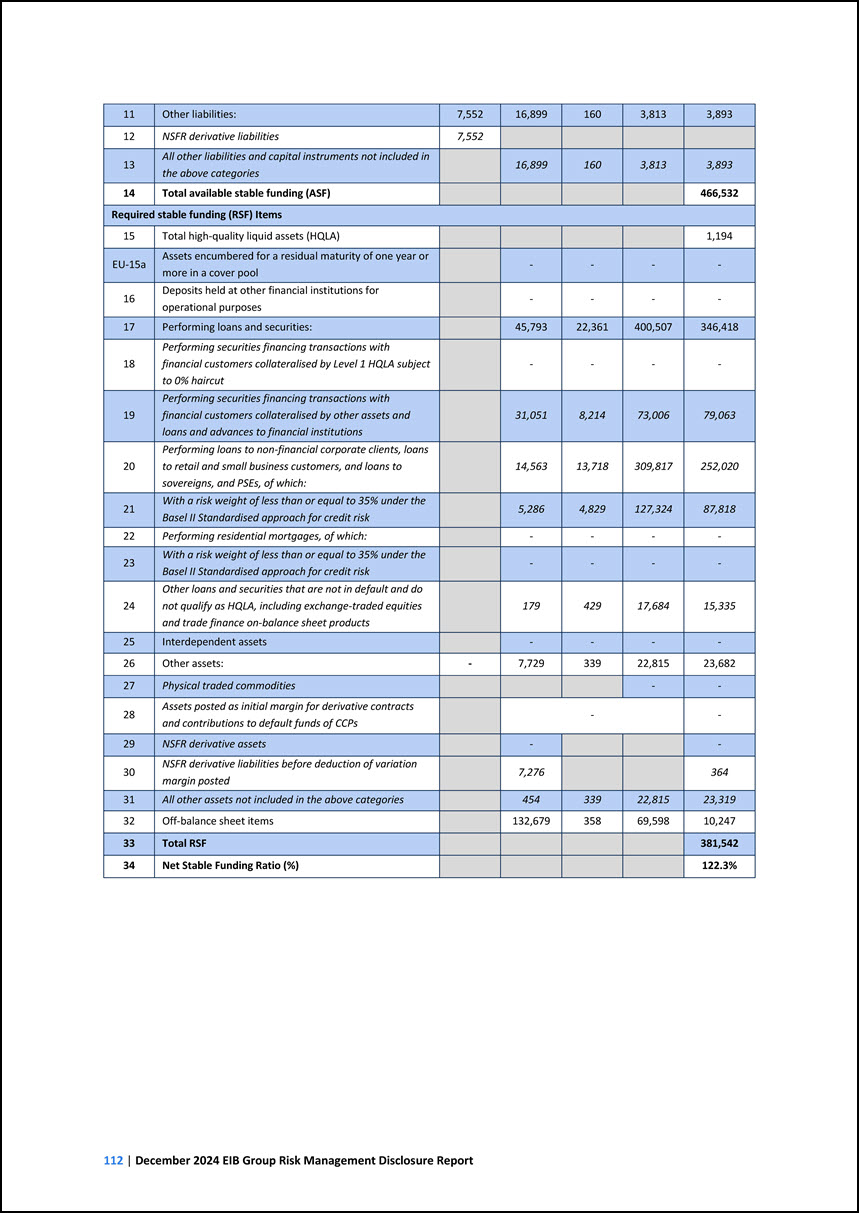
11 Other liabilities: 7,552 16,899 160 3,813 3,893 12 NSFR derivative liabilities 7,552 13 All other liabilities and capital instruments not included
in the above categories 16,899 160 3,813 3,893 14 Total available stable funding (ASF) 466,532 Required stable funding (RSF) Items 15 Total high-quality liquid assets (HQLA) 1,194 EU-15a Assets encumbered for a residual
maturity of one year or more in a cover pool - - - - 16 Deposits held at other financial institutions for operational purposes - - - - 17 Performing loans and securities: 45,793 22,361 400,507 346,418 18 Performing securities
financing transactions with financial customers collateralised by Level 1 HQLA subject to 0% haircut - - - - 19 Performing securities financing transactions with financial customers collateralised by other assets and loans and advances to
financial institutions 31,051 8,214 73,006 79,063 20 Performing loans to non-financial corporate clients, loans to retail and small business customers, and loans to sovereigns, and PSEs, of which: 14,563 13,718 309,817 252,020 21 With a
risk weight of less than or equal to 35% under the Basel II Standardised approach for credit risk 5,286 4,829 127,324 87,818 22 Performing residential mortgages, of which: - - - - 23 With a risk weight of less than or equal to 35% under
the Basel II Standardised approach for credit risk - - - - 24 Other loans and securities that are not in default and do not qualify as HQLA, including exchange-traded equities and trade finance on-balance sheet products 179 429 17,684
15,335 25 Interdependent assets - - - - 26 Other assets: - 7,729 339 22,815 23,682 27 Physical traded commodities - - 28 Assets posted as initial margin for derivative contracts and contributions to default funds of CCPs -
- 29 NSFR derivative assets - - 30 NSFR derivative liabilities before deduction of variation margin posted 7,276 364 31 All other assets not included in the above categories 454 339 22,815 23,319 32 Off-balance sheet items
132,679 358 69,598 10,247 33 Total RSF 381,542 34 Net Stable Funding Ratio (%) 122.3%
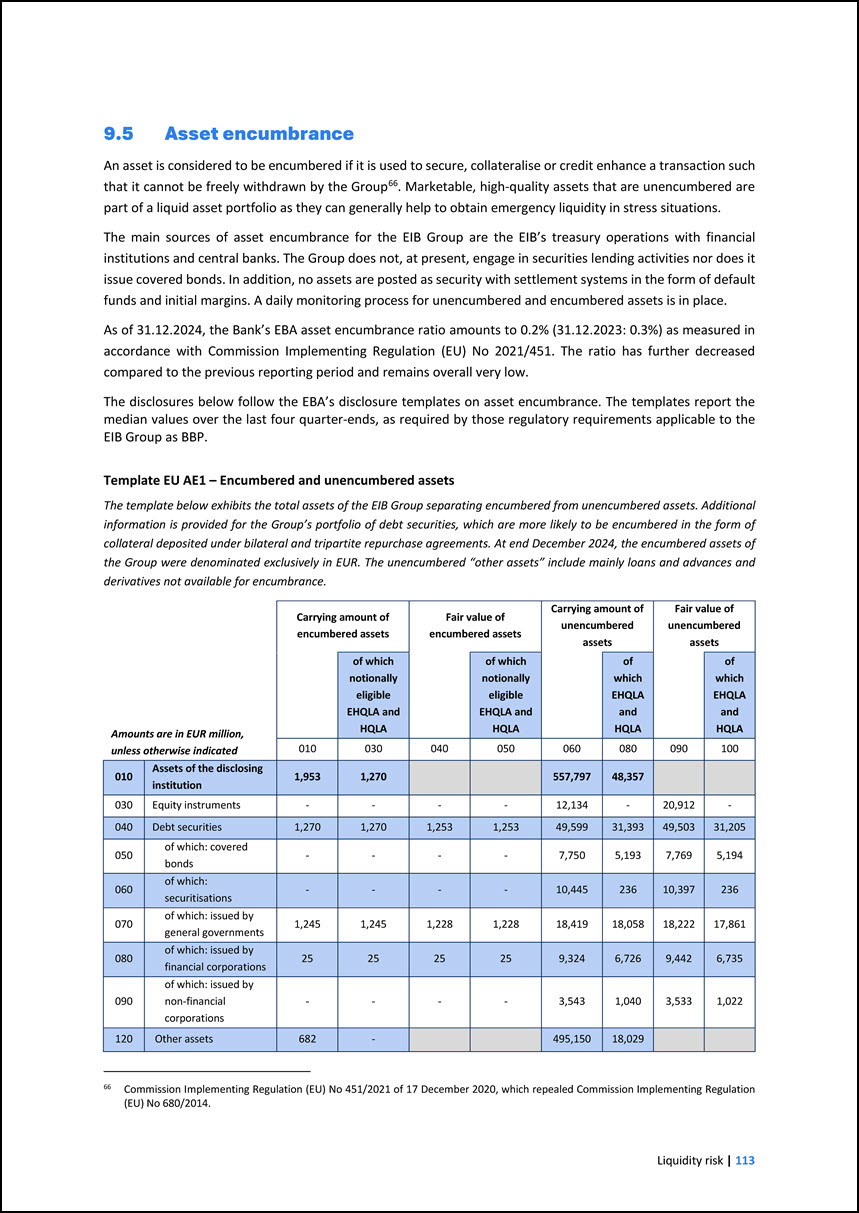
9.5 Asset encumbrance An asset is considered to be encumbered if it is used to secure, collateralise or credit enhance a transaction such that it cannot be freely
withdrawn by the Group66. Marketable, high-quality assets that are unencumbered are part of a liquid asset portfolio as they can generally help to obtain emergency liquidity in stress situations. 66 Commission Implementing Regulation (EU) No
451/2021 of 17 December 2020, which repealed Commission Implementing Regulation (EU) No 680/2014. The main sources of asset encumbrance for the EIB Group are the EIB’s treasury operations with financial institutions and central banks. The Group does
not, at present, engage in securities lending activities nor does it issue covered bonds. In addition, no assets are posted as security with settlement systems in the form of default funds and initial margins. A daily monitoring process for
unencumbered and encumbered assets is in place. As of 31.12.2024, the Bank’s EBA asset encumbrance ratio amounts to 0.2% (31.12.2023: 0.3%) as measured in accordance with Commission Implementing Regulation (EU) No 2021/451. The ratio has further
decreased compared to the previous reporting period and remains overall very low. The disclosures below follow the EBA’s disclosure templates on asset encumbrance. The templates report the median values over the last four quarter-ends, as required
by those regulatory requirements applicable to the EIB Group as BBP. Template EU AE1 – Encumbered and unencumbered assets The template below exhibits the total assets of the EIB Group separating encumbered from unencumbered assets. Additional
information is provided for the Group’s portfolio of debt securities, which are more likely to be encumbered in the form of collateral deposited under bilateral and tripartite repurchase agreements. At end December 2024, the encumbered assets of the
Group were denominated exclusively in EUR. The unencumbered “other assets” include mainly loans and advances and derivatives not available for encumbrance. Amounts are in EUR million, unless otherwise indicated Carrying amount of encumbered assets
Fair value of encumbered assets Carrying amount of unencumbered assets Fair value of unencumbered assets of which notionally eligible EHQLA and HQLA of which notionally eligible EHQLA and HQLA of which EHQLA and HQLA of which EHQLA and
HQLA 010 030 040 050 060 080 090 100 010 Assets of the disclosing institution 1,953 1,270 557,797 48,357 030 Equity instruments - - - - 12,134 - 20,912 - 040 Debt securities 1,270 1,270 1,253 1,253 49,599 31,393
49,503 31,205 050 of which: covered bonds - - - - 7,750 5,193 7,769 5,194 060 of which: securitisations - - - - 10,445 236 10,397 236 070 of which: issued by general governments 1,245 1,245 1,228 1,228 18,419 18,058
18,222 17,861 080 of which: issued by financial corporations 25 25 25 25 9,324 6,726 9,442 6,735 090 of which: issued by non-financial corporations - - - - 3,543 1,040 3,533 1,022 120 Other assets 682 - 495,150 18,029
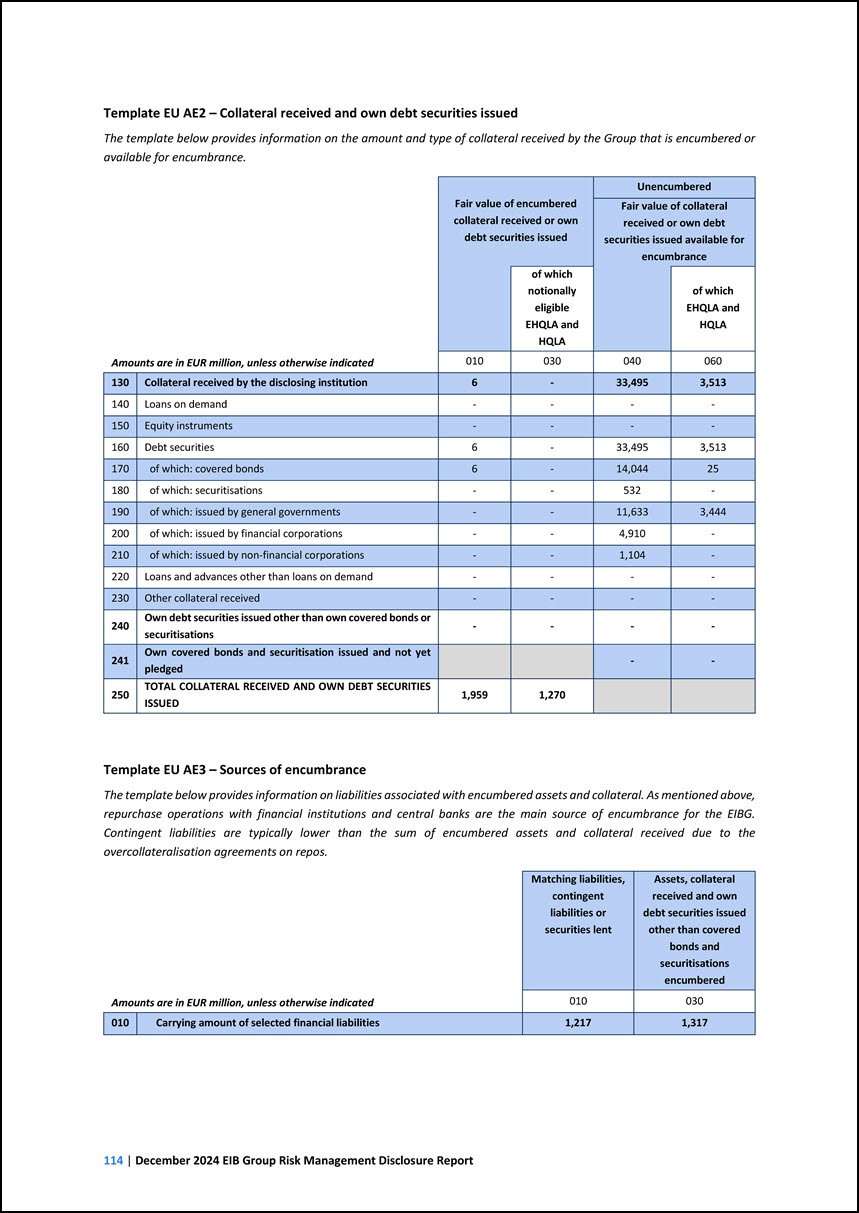
Template EU AE2 – Collateral received and own debt securities issued The template below provides information on the amount and type of collateral received by the
Group that is encumbered or available for encumbrance. Amounts are in EUR million, unless otherwise indicated Fair value of encumbered collateral received or own debt securities issued Unencumbered Fair value of collateral received or own debt
securities issued available for encumbrance of which notionally eligible EHQLA and HQLA of which EHQLA and HQLA 010 030 040 060 130 Collateral received by the disclosing institution 6 - 33,495 3,513 140 Loans on demand - - - -
150 Equity instruments - - - - 160 Debt securities 6 - 33,495 3,513 170 of which: covered bonds 6 - 14,044 25 180 of which: securitisations - - 532 - 190 of which: issued by general governments - - 11,633 3,444 200 of
which: issued by financial corporations - - 4,910 - 210 of which: issued by non-financial corporations - - 1,104 - 220 Loans and advances other than loans on demand - - - - 230 Other collateral received - - - - 240 Own debt
securities issued other than own covered bonds or securitisations - - - - 241 Own covered bonds and securitisation issued and not yet pledged - - 250 TOTAL COLLATERAL RECEIVED AND OWN DEBT SECURITIES ISSUED 1,959 1,270 Template
EU AE3 – Sources of encumbrance The template below provides information on liabilities associated with encumbered assets and collateral. As mentioned above, repurchase operations with financial institutions and central banks are the main source of
encumbrance for the EIBG. Contingent liabilities are typically lower than the sum of encumbered assets and collateral received due to the overcollateralisation agreements on repos. Amounts are in EUR million, unless otherwise indicated Matching
liabilities, contingent liabilities or securities lent Assets, collateral received and own debt securities issued other than covered bonds and securitisations encumbered 010 030 010 Carrying amount of selected financial liabilities 1,217 1,317
10 MARKET RISK 10.1 Foreign exchange risk The Group does not have regulatory own funds requirements for market risk in the trading book. Non-trading book positions
are, however, subject to foreign exchange risk. According to Article 351 of the CRR, should the net foreign exchange position exceed 2% of the Group’s total own funds, the Group shall calculate an own funds regulatory capital requirement for foreign
exchange risk. The management of foreign exchange risk at the Group is described in the following section. Foreign exchange (FX) risk is the risk to the economic value or to the income derived from the Group’s positions due to adverse movements of
foreign exchange rates. The entities of the Group have different business models and separate governing frameworks (the principles of which are laid down in their respective Statutes and Rules and Procedures) and thus follow different day-to-day
management approaches with respect to FX risk. The Group is exposed to FX risk whenever there is a currency mismatch between its assets, liabilities and hedge instruments. FX risk also comprises the effect of unfavourable changes in the value of the
Group’s future P&L caused by currency movements. More specifically, at the EIB, FX risk arises from specific transactions that involve FX conversions and P&L generation by non-EUR assets and liabilities. At the EIF, FX risk stems primarily
from guarantees and equity operations. More details on the management of FX risk at the EIB and the EIF are presented hereafter. Management of FX risk at the EIB The main objective of the EIB’s FX risk management is to minimise to the extent
possible the effect of variation of FX rates on the Bank’s P&L statement. The key bodies involved in the management of FX risk in the Bank are the MC and the ALCO. The EIB’s “Operational Open FX position” (hereafter the “FX position”) for risk
management is defined, for each non-reporting currency, as the balance between the accounting value of assets and liabilities under EU-AD and measured in EUR equivalent. It is in line with the “Net FX position” defined in the CRR for regulatory
capital calculation purposes, except for the CIUs, which are considered in the respective fund’s currency (that is, the LTA is not applied for the management of the Operational Open FX position). The FX position for each non-reporting currency is
monitored daily. It is impacted by transactions that create a mismatch between assets and liabilities. On a monthly basis, the P&L impact is taken into account and hedged. The Bank hedges its FX risk by keeping the FX position for each
non-reporting currency within pre-approved limits. In the event of a hedging requirement, the position is reduced by FX spot deals within the same day. Risk Management, as a second line of defence, is in charge of independently monitoring the daily
FX position. The Finance Directorate/Operational Support and Monitoring division, as a first line of defence, is in charge of calculating and reporting on a daily basis the FX position to the Finance Directorate/Treasury that manages the position.
Management of the FX risk at the EIF At the EIF, FX risk is monitored and managed at business line and product level: • The EIF monitors securitisation guarantees on a continuous basis via the ABS cash flow model which takes into account the FX
risk of the underlying assets, if any. Following a deviation from the expected performance or an ad-hoc event, surveillance triggers might be breached. In such cases, a model rerun may be required,
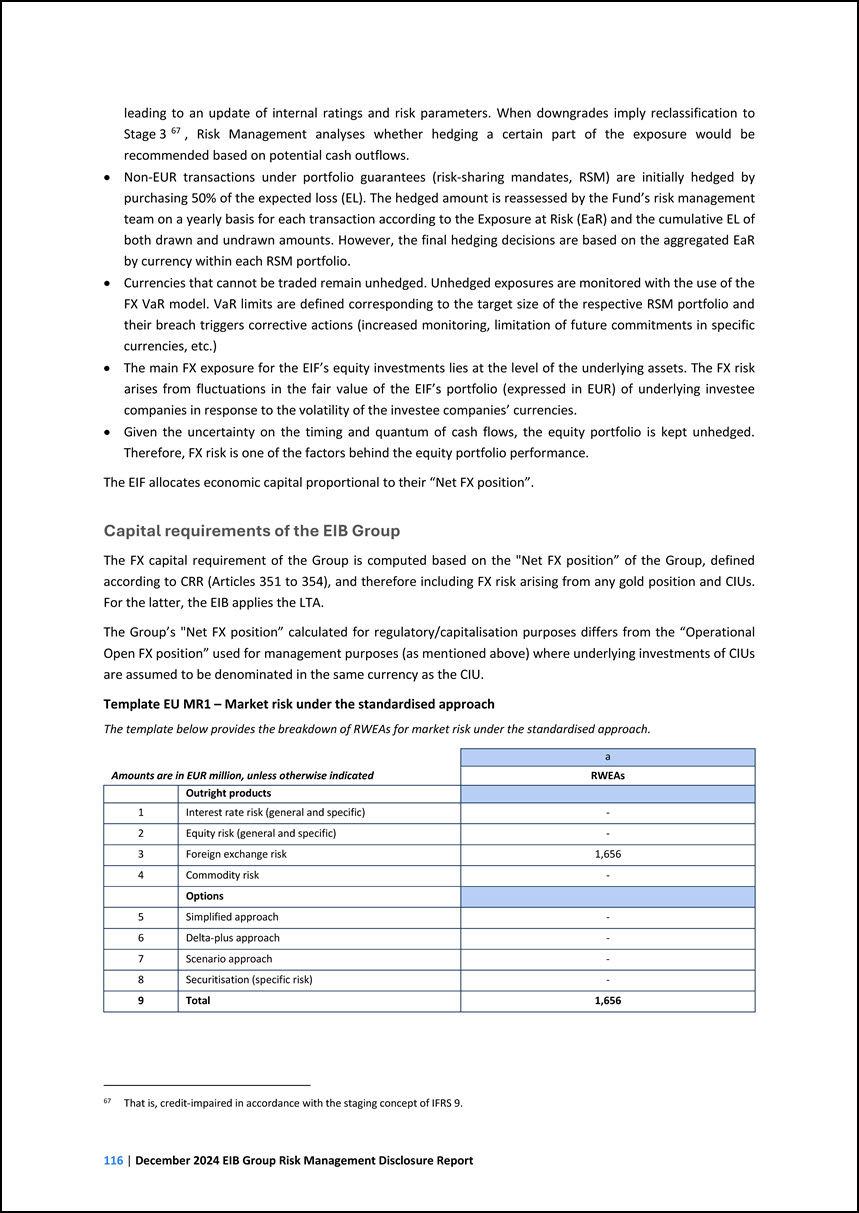
leadingtoanupdateofinternalratingsandriskparameters.WhendowngradesimplyreclassificationtoStage367,RiskManagementanalyseswhetherhedgingacertainpartoftheexposurewouldberecommendedbasedonpotentialcashoutflows.
•Non-EURtransactionsunderportfolioguarantees(risk-sharingmandates,RSM)areinitiallyhedgedbypurchasing50%oftheexpectedloss(EL).ThehedgedamountisreassessedbytheFund’sriskmanagementteamonayearlybasisforeachtransactionaccordingtotheExposureatRisk(EaR)andthecumulativeELofbothdrawnandundrawnamounts.However,thefinalhedgingdecisionsarebasedontheaggregatedEaRbycurrencywithineachRSMportfolio.
•Currenciesthatcannotbetradedremainunhedged.UnhedgedexposuresaremonitoredwiththeuseoftheFXVaRmodel.VaRlimitsaredefinedcorrespondingtothetargetsizeoftherespectiveRSMportfolioandtheirbreachtriggerscorrectiveactions(increasedmonitoring,limitationoffuturecommitmentsinspecificcurrencies,etc.)
•ThemainFXexposurefortheEIF’sequityinvestmentsliesattheleveloftheunderlyingassets.TheFXriskarisesfromfluctuationsinthefairvalueoftheEIF’sportfolio(expressedinEUR)ofunderlyinginvesteecompaniesinresponsetothevolatilityoftheinvesteecompanies’currencies.
•Giventheuncertaintyonthetimingandquantumofcashflows,theequityportfolioiskeptunhedged. Therefore,FXriskisoneofthefactorsbehindtheequityportfolioperformance. TheEIFallocateseconomiccapitalproportionaltotheir“NetFXposition”.
CapitalrequirementsoftheEIBGroup TheFXcapitalrequirementoftheGroupiscomputedbasedonthe"NetFXposition”oftheGroup,definedaccordingtoCRR (Articles 351 to 354), and therefore including FX risk arising from anygold positionandCIUs. For the latter,the EIB
applies the LTA. The Group’s"NetFX position”calculated for regulatory/capitalisation purposes differs from the “OperationalOpen FX position”used formanagement purposes (as mentionedabove) where underlying investments ofCIUsare assumed to be
denominated in the same currency as the CIU. Template EU MR1–Marketrisk under the standardised approach The template below provides thebreakdown of RWEAs for marketriskunder the standardised approach. Amounts are in EURmillion, unlessotherwise
indicatedaRWEAsOutright products1 Interest rate risk (general and specific)- 2Equity risk(general and specific)- 3 Foreign exchange risk1,6564 Commodity risk- Options5 Simplified approach- 6Delta-plus approach- 7 Scenario approach- 8Securitisation
(specific risk)- 9 Total1,656 67That is,credit-impaired in accordance with the staging conceptof IFRS 9. 116|December 2024 EIB Group Risk Management DisclosureReport
11 INTEREST RATE AND CREDIT SPREAD RISK IN THE BANKING BOOK 11.1 Interest rate risk in the banking book (IRRBB) From a Group perspective, interest rate risk is
defined as the risk to the economic value of equity/own funds (EVE) or to the net interest income (NII) arising from adverse movements in interest rates that affect interest rate-sensitive instruments, including gap risk, basis risk and option risk.
Scope The scope of interest rate-sensitive instruments are all assets, liabilities and off-balance sheet items in the non- trading book, excluding assets deducted from CET1 capital. Exposure to interest rate risk occurs when there are differences in
repricing and maturity characteristics of the different asset, liability and hedging instruments. Governance The BoD sets the Bank’s risk appetite for interest rate risk in the banking book from both an earnings and economic value perspective. The
EIF’s risk appetite does not currently include specific limits for IRRBB, but the EIF instead allocates economic capital to cover its interest rate risk exposures. It is the responsibility of the MC to approve the interest rate strategy of the EIB,
while ensuring that it remains within the risk appetite limits. The MC is assisted by the ALCO in the monitoring and management of IRRBB. The ALCO itself is supported by a permanent working group on interest rate risk monitoring. Reporting directly
to the ALCO, this working group reviews and analyses the interest rate risk exposures, discusses possible hedging actions based on recommendations from the Treasury (first line of defence (LoD)), and reports to the ALCO on the operational actions
taken by the first LoD. The decision on, and execution of, hedging actions remains under the responsibility of the first LoD. Key IRRBB risk metrics and their evolution are reported monthly to the governing bodies. Risk management and mitigation
The EIB follows relevant key principles of the EBA68 and the BCBS69 in its management and monitoring of interest rate risk. As prescribed by those principles, the EIB manages the IRRBB from both NII and EVE perspectives, seeking to maintain a
balanced and sustainable revenue profile as well as limiting the volatility of its economic value. 68 EBA Guidelines on the management of interest rate risk and credit spread risk arising from non-trading book activities – EBA/GL/2022/14. 69 BCBS
368: Standards for Interest Rate Risk in the Banking Book (IRRBB) (April 2016). For managing and mitigating interest rate exposures, a preference is given to natural hedges. Natural hedges occur in the course of normal business activity when assets
(loans) and liabilities (borrowings) net out their interest rate exposures. When natural hedges are not sufficient for managing the interest rate exposures, the Bank makes use of derivative instruments. The most common types of derivatives used by
the Bank are interest rate swaps (IRS) and cross-currency swaps70. 70 Contracts that involve the exchange of notional in two different currencies at the beginning and at the end of the swap, and the exchange of floating rates during the contract
term.
The Bank uses both micro and macro hedging approaches. A hedge is defined as micro when it matches back-to- back the interest rate structure of a specific loan or
borrowing. A macro-hedge rather serves the purpose of rebalancing the interest rate exposure at portfolio level. To reduce the volatility of IFRS accounting P&L, the Bank applies, when possible, both fair value and cash flow hedge accounting
methods: • Fair value hedges recognise the derivative’s hedging of changes in the fair value of a recognised fixed-rate loan or bond. • Cash flow hedges recognise the derivative’s hedging of changes in the future cash flows of floating-rate
instruments. The EIF is primarily exposed to gap risk, it has a limited exposure to basis risk and option risk (through the callable treasury bonds and the interest rate floor on ABS cash investments). The EIF does not hedge its interest rate
exposures but instead allocates economic capital to cover its interest rate risk exposure (as also mentioned above). 11.1.1 Gap risk Gap risk71 is the risk resulting from differences in the term structure of interest rate-sensitive instruments. It
is measured as the impact on the term structure arising from parallel or non-parallel moves across the yield curve. 71 The EBA defines gap risk as the “risk resulting from the term structure of interest rate sensitive instruments that arises from
differences in the timing of their rate changes, covering changes to the term structure of interest rates occurring consistently across the yield curve (parallel risk) or differentially by period (non-parallel risk)” (EBA/GL/2022/14). For the Bank,
gap risk stems from its interest rate risk strategy currently targeting a duration for the investment of its own funds between 4.5 and 5.5 years. For the EIF, the major interest rate-sensitive exposures are its pension DBO72 liability and
fixed-income treasury portfolio. 72 Defined-benefit obligations (DBO) represent the present value of the pension benefits earned by the employees. Management, monitoring and reporting The EIB measures and reports gap risk in terms of sensitivity,
duration of own funds and stress scenarios (stress tests are also performed at EIB Group level): • Basis Point Value (BPV) sensitivity: shows the change in the net present value (NPV) of interest rate- sensitive instruments/portfolios due to a 1
basis point increase in the interest rate curves. The EIB’s operational interest rate risk exposure in terms of BPV sensitivity by maturity ranges and currency is monitored and managed on a daily basis, within pre-approved limits, by the Treasury
(first LoD), and reported to the ALM division in GR&C-RM (second LoD). The ALM division in GR&C-RM monitors the limits’ compliance in the context of the operational ALM activities and also validates the reported interest rate risk exposure on
a regular basis. • Duration of own funds (expressed in years): measures the sensitivity of the EVE to changes in interest rates. This metric is used to set the IRR strategy of the Bank in terms of target duration of own funds. The target duration,
which is periodically reassessed by the ALCO must lie within a target range of 3.5 to 6.5 years73. Changes in the target duration are submitted for approval to the MC. • Stress scenarios: stress tests are performed on a regular basis, whereby the
impacts of severe scenarios on both the EVE and the NII are assessed. The stress tests include: (i) the EBA standardised interest rate shocks74; 73 For operational purposes, +/-0.5 years deviations from the target duration are allowed. 74
EBA/RTS/2022/10.
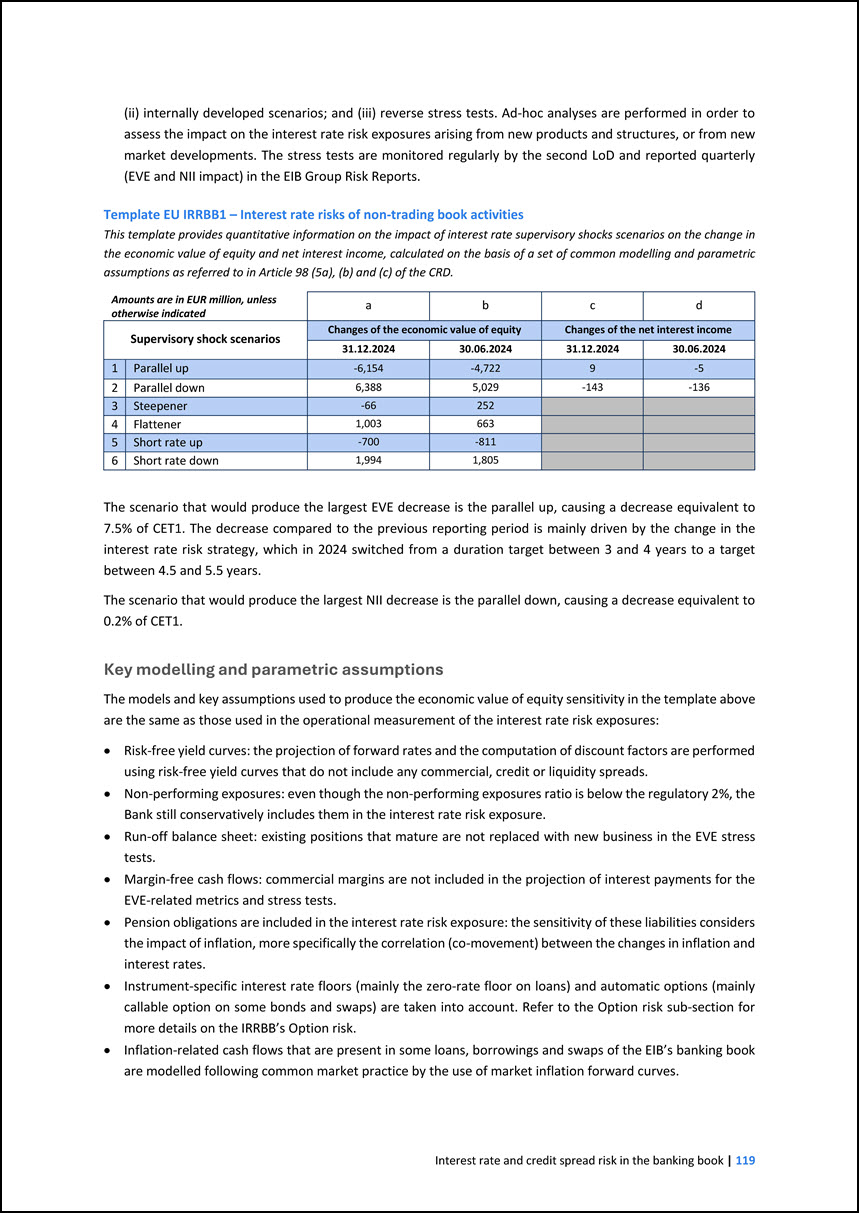
(ii) internally developed scenarios; and (iii) reverse stress tests. Ad-hoc analyses are performed in order to assess the impact on the interest rate risk exposures
arising from new products and structures, or from new market developments. The stress tests are monitored regularly by the second LoD and reported quarterly (EVE and NII impact) in the EIB Group Risk Reports. Template EU IRRBB1 – Interest rate risks
of non-trading book activities This template provides quantitative information on the impact of interest rate supervisory shocks scenarios on the change in the economic value of equity and net interest income, calculated on the basis of a set of
common modelling and parametric assumptions as referred to in Article 98 (5a), (b) and (c) of the CRD. Amounts are in EUR million, unless otherwise indicated a b c d Supervisory shock scenarios Changes of the economic value of equity Changes
of the net interest income 31.12.2024 30.06.2024 31.12.2024 30.06.2024 1 Parallel up -6,154 -4,722 9 -5 2 Parallel down 6,388 5,029 -143 -136 3 Steepener -66 252 4 Flattener 1,003 663 5 Short rate up -700 -811 6
Short rate down 1,994 1,805 The scenario that would produce the largest EVE decrease is the parallel up, causing a decrease equivalent to 7.5% of CET1. The decrease compared to the previous reporting period is mainly driven by the change in
the interest rate risk strategy, which in 2024 switched from a duration target between 3 and 4 years to a target between 4.5 and 5.5 years. The scenario that would produce the largest NII decrease is the parallel down, causing a decrease equivalent
to 0.2% of CET1. Key modelling and parametric assumptions The models and key assumptions used to produce the economic value of equity sensitivity in the template above are the same as those used in the operational measurement of the interest rate
risk exposures: • Risk-free yield curves: the projection of forward rates and the computation of discount factors are performed using risk-free yield curves that do not include any commercial, credit or liquidity spreads. • Non-performing exposures:
even though the non-performing exposures ratio is below the regulatory 2%, the Bank still conservatively includes them in the interest rate risk exposure. • Run-off balance sheet: existing positions that mature are not replaced with new business in
the EVE stress tests. • Margin-free cash flows: commercial margins are not included in the projection of interest payments for the EVE-related metrics and stress tests. • Pension obligations are included in the interest rate risk exposure: the
sensitivity of these liabilities considers the impact of inflation, more specifically the correlation (co-movement) between the changes in inflation and interest rates. • Instrument-specific interest rate floors (mainly the zero-rate floor on loans)
and automatic options (mainly callable option on some bonds and swaps) are taken into account. Refer to the Option risk sub-section for more details on the IRRBB’s Option risk. • Inflation-related cash flows that are present in some loans, borrowings
and swaps of the EIB’s banking book are modelled following common market practice by the use of market inflation forward curves.
•CurrenciesotherthanthereportingcurrencyareconvertedtothereportingcurrencyattheECBspotFXrateonthereferencedate.Positivechangesareweightedbyafactorof50%orafactorof80%inthecaseofExchangeRateMechanism–ERMII.
Thekeyassumptionswithregardtonetinterestincomesensitivityare: •One-yeartimehorizon:thesensitivityismeasuredovera12-monthhorizonperiod.
•Constantbalancesheet:thetotalbalancesheetsizeandcomposition,includingon-andoff-balancesheetitems,aremaintainedbyreplacingmaturingcashflowswithnewinstrumentsthathavecomparablefeatureswithregardtothecurrency,amountandrepricingperiodoftheoriginalinstruments.
•Commercialmarginsareincludedintheprojectionofnetinterestincomeandmaturingtransactionsarerolledwithmarginsreflectingcurrentmarketconditions. •Whereapplicable,instrument-specificfloors(mostspecifically,thezero-rateflooronloans)aretakenintoaccount.
•CurrenciesotherthanthereportingcurrencyareconvertedtothereportingcurrencyattheECBspotFXrateonthereferencedate.Positivechangesareweightedbyafactorof50%orafactorof80%inthecaseofExchangeRateMechanism–ERMII. 11.1.2Basisrisk Basis risk is the risk
arising from the impact of relative changesin interest rates on interest rate-sensitiveinstruments that have similar tenors but are priced using different interest rate indices. Basis risk arises from the imperfect correlation in the adjustment of
the rates earned andpaid on different interest rate-sensitive instruments with otherwise similar rate change characteristics. The Bank has identified three main types of basis risks to which it is exposed: 1) Cross-currency basis risk(CCBR); 2)Tenor
basis risk(TBR)and 3) Funding spread risk(FSR). Cross-currencybasisrisk(CCBR) Cross-currency basis risk is the risk due to currency mismatches (in terms of volume and/or maturity) between the Bank’s funding and lending activities. The cross-currency
basis indicates the amount by which the interestpaid to borrow one currency by swapping it against another differs from thecost of directly borrowing thiscurrency in the cash market. Management,monitoringandreportingofCCBR The Bank measures, manages
and reports CCBR for its major currencies75in terms of BPV sensitivity andstress scenarios: •CCBR BPV sensitivity: measures the change in the NPV of interest rate-sensitiveinstruments/portfolios dueto a 1 basis point increase in the CCY/EUR basis
spread. The EIB’s operational CCBR exposure by maturityranges and currency is monitored and managed on a daily basis, within pre-approved limits, by the Treasury (firstLoD) and reported to the ALMdivision in GR&C-RM (secondLoD).TheALM division
inGR&C-RMmonitorsthat theexposurestayswithin the pre-approved limits in thecontextofthe operational ALMactivities andvalidatesthe CCBR exposure on aregularbasis.The Bank applies a portfolio-based managementapproach for CCBR.Hedging of the CCBR is
usually doneby means of entering into cross-currency swaps, 75The remaining currencies are systematicallyswapped into EURor USDona back-to-back basis. Moreover,those lending operations are normally in a “synthetic format”,that is,denominated in local
currency, but settled in hard currency (usually EUR or USD). However, and outsidethe CCBR framework, that exposure is monitored regularly to ensure it remains immaterial froman IRRBB perspective. 120|December 2024 EIB GroupRisk Management
DisclosureReport
which are financial products that swap principal and interest payments in two different currencies, allowing for the transformation of the exposure on one currency
into the swapped one. • Stress scenarios: the Bank performs CCBR stress tests to understand their impact on the EVE. It considers the following internally developed stress scenarios for each currency in scope: o parallel monthly and annual shifts; o
monthly and annual per tenor shifts; o historical extremes with shocks being determined dynamically at tenor level. The Bank also performs CCBR stress tests on the net interest income. The scenario used is the same as for the EVE: “historical
extremes with shocks being determined dynamically at tenor level”. CCBR stress tests are monitored on a monthly basis by the second LoD and reported quarterly (EVE and NII impact) in the EIB Group Risk Reports. Ad-hoc analyses are performed in
order to assess the impact on the CCBR exposures arising from new products and structures, or from new market developments. Tenor Basis Risk (TBR) The Bank’s exposure to TBR arises from floating-rate instruments priced with different interest rate
indices. This exposure is originated from all main asset and liability classes present in the Bank’s balance sheet: lending (assets), funding (liabilities), hedging (derivatives) and treasury (securities). The activity on both sides of the balance
sheet might be asymmetrical in terms of underlying interest rate indices, leading to mismatches and therefore exposing the Bank to the volatility of the spread between different indices. Management, monitoring and reporting of TBR The EIB measures,
manages and reports TBR in terms of BPV sensitivity and stress scenarios: • TBR BPV sensitivity: the change in the NPV of interest rate-sensitive instruments/portfolios due to a 1 basis point increase in the tenor basis spread, measured as the
spread between the different local indices swap curves (for example, Euribor 3-month swap curve vs. Euribor 6-month swap curve). The EIB’s operational TBR exposure by maturity ranges and currency is monitored and managed on a daily basis, within
pre-approved limits, by the Treasury (first LoD) and reported to the ALM division in GR&C-RM (second LoD). The ALM division in GR&C-RM monitors that the exposure stays within the pre-approved limits in the context of the operational ALM
activities and validates the TBR exposure on a regular basis. The EIB applies a portfolio-based management approach for TBR. Hedging of TBR is usually done by means of entering into tenor basis swaps, which are financial products that exchange one
floating index for another. • Stress scenarios: the Bank performs TBR stress tests to assess the impact on its EVE. It considers the following internally developed stress scenarios: o parallel monthly and annual shifts; o monthly and annual per tenor
shifts; o historical extremes with shocks being determined dynamically at tenor level. The Bank also performs TBR stress tests on the net interest income. The scenario used is the same as for the EVE: “historical extremes with shocks being
determined dynamically at tenor level”. TBR stress tests are monitored on a monthly basis by the second LoD and reported quarterly (EVE and NII impact) in the EIB Group Risk Reports.
Ad-hoc analyses are performed in order to assess the impact on the interest rate risk exposures arising from new products and structures, or from new market
developments. Funding Spread Risk (FSR) Funding spread risk refers to the risk to the economic value or to the net interest income arising from movements in the funding spread of the Bank. Funding spread risk may arise due to the divergence
between the funding rate of the EIB (the market reference rate plus the funding margin/spread) and the market reference rate itself76. This relationship may not be stable over time, that is, the funding margin might increase or decrease. The EIB’s
exposure to funding spread risk originates from its core activities (lending and funding) and primarily stems from financing maturity mismatches between its assets and liabilities. 76 See BCBS 368. Management, monitoring and reporting of FSR The
Bank’s current interest rate risk and funding strategies do not incorporate any formal requirement or limit with regard to the management of the funding spread risk. As it derives from the evolution of the Bank’s own credit quality, the risk cannot
be directly hedged with third parties. The funding spread risk is mitigated by setting on a semi-annual basis a target funding maturity profile that keeps the maturity transformation between new lending and funding (and the future refinancing risk)
under control. Another mitigant comes from the loan rate setting policy which ensures the transfer of the Bank’s funding spreads to its borrowers. The Bank performs a Funding Spread Risk stress test, assuming an adverse scenario of an increase in
its funding spread, due to a rating downgrade of three notches. The stress test is performed by the second LoD and reported in the quarterly EIB Group Risk Reports. 11.1.3 Option risk Option risk is defined as the risk arising from options
(embedded and explicit), where the institution or its customer can alter the level and timing of their cash flows, namely the risk arising from interest rate-sensitive instruments where the holders will almost certainly exercise the option if it is
in their financial interest to do so (embedded or explicit automatic options) and the risk arising from flexibility embedded implicitly or within the terms of interest rate-sensitive instruments, such that changes in interest rates may affect a
change in the behaviour of the client (embedded behavioural option risk). Option risk can be broken down into two distinct sub-types: • Automatic option risk: it arises from standalone instruments, such as option contracts (caps, floors, etc.), or
is explicitly embedded within the contractual terms of a financial instrument (a capped or floored rate loan). • Behavioural option risk: it arises from the flexibility embedded implicitly or within the terms of financial contracts. For instance,
changes in interest rates may affect a change in the behaviour of the client (such as the right to prepay a loan or to withdraw a deposit77). 77 Unlike many commercial institutions, the Bank does not have exposure to non-maturing deposits. The Bank
performs Option risk stress tests to assess its impact on the EVE and NII as a consequence of shocks on the interest rate curves and interest rate volatilities. The Option risk stress tests are monitored on a regular basis by the second LoD and
reported quarterly in the EIB Group Risk Reports.
11.2 Credit spread risk in the banking book (CSRBB) From a Group perspective, credit spread risk is defined as the risk to the Economic Value of Equity/Own Funds
(EVE) or to the Net Interest Income (NII) arising from adverse movements in market price for credit risk, for liquidity and for potentially other characteristics of credit-risky instruments, which is not captured by another existing prudential
framework such as IRRBB or by expected credit/(jump-to-) default risk. Scope At the Group, the scope of credit spread-sensitive instruments includes all assets, liabilities and off-balance sheet items in the non-trading book, excluding assets
deducted from CET1 capital. The Treasury bonds portfolios78, asset backed securities (ABS) and pension liabilities fall within the CSRBB scope. Treasury bonds portfolios contain a variety of corporate and sovereign bonds that span a large spectrum of
different ratings. The ABS portfolio contains a variety of asset-backed securities as well as covered bonds. Similarly to the Treasury bonds portfolio, they are characterised by a large spectrum of different credit ratings. The pension liability
(DBO) is included, since in accordance with actuarial and accounting standards, the projected cash flows are discounted with a rate referencing market yields on “high-quality corporate bonds”, more specifically the yield on a EUR AA- rated corporate
index. 78 Money market instruments are deemed to be insensitive to moves in the market price of credit. Governance: Risk management, monitoring and reporting at the EIB Group Rating-based limits already exist for credit risk management in the
Treasury and ABS portfolios, thus providing a natural risk mitigating factor. The Group performs internally calibrated CSRBB stress tests to assess the impact on the EVE and NII. The CSRBB stress tests are monitored on a monthly basis by the second
LoD and reported quarterly (EVE and NII impact) in the EIB Group Risk Reports. There are no dedicated CSRBB limits in place. However, this risk is internally capitalised.
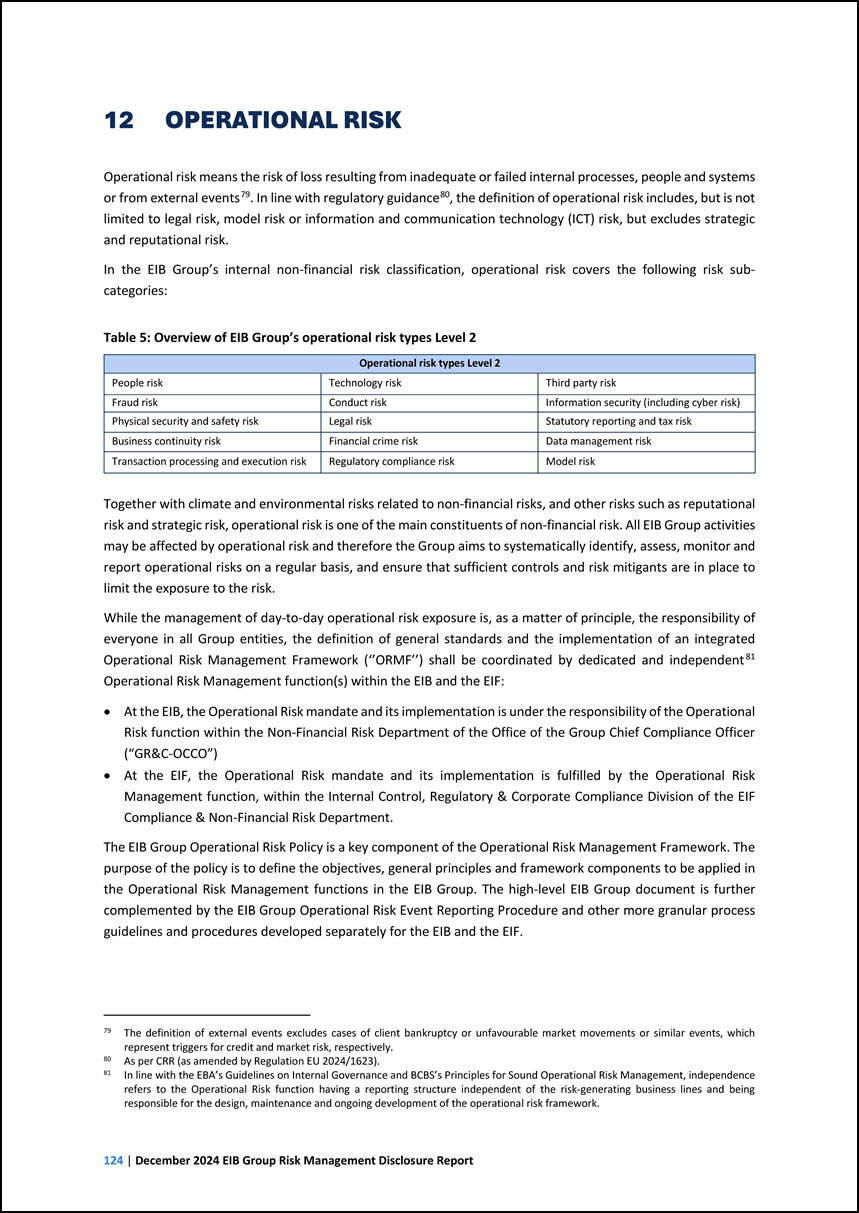
12 OPERATIONAL RISK Operational risk means the risk of loss resulting from inadequate or failed internal processes, people and systems or from external events79. In
line with regulatory guidance80, the definition of operational risk includes, but is not limited to legal risk, model risk or information and communication technology (ICT) risk, but excludes strategic and reputational risk. 79 The definition of
external events excludes cases of client bankruptcy or unfavourable market movements or similar events, which represent triggers for credit and market risk, respectively. 80 As per CRR (as amended by Regulation EU 2024/1623). In the EIB Group’s
internal non-financial risk classification, operational risk covers the following risk sub- categories: Table 5: Overview of EIB Group’s operational risk types Level 2 Operational risk types Level 2 People risk Technology risk Third party risk
Fraud risk Conduct risk Information security (including cyber risk) Physical security and safety risk Legal risk Statutory reporting and tax risk Business continuity risk Financial crime risk Data management risk Transaction processing and
execution risk Regulatory compliance risk Model risk Together with climate and environmental risks related to non-financial risks, and other risks such as reputational risk and strategic risk, operational risk is one of the main constituents of
non-financial risk. All EIB Group activities may be affected by operational risk and therefore the Group aims to systematically identify, assess, monitor and report operational risks on a regular basis, and ensure that sufficient controls and risk
mitigants are in place to limit the exposure to the risk. While the management of day-to-day operational risk exposure is, as a matter of principle, the responsibility of everyone in all Group entities, the definition of general standards and the
implementation of an integrated Operational Risk Management Framework (‘’ORMF’’) shall be coordinated by dedicated and independentOperational Risk Management function(s) within the EIB and the EIF: 81 81 In line with the EBA’s Guidelines on Internal
Governance and BCBS’s Principles for Sound Operational Risk Management, independence refers to the Operational Risk function having a reporting structure independent of the risk-generating business lines and being responsible for the design,
maintenance and ongoing development of the operational risk framework. • At the EIB, the Operational Risk mandate and its implementation is under the responsibility of the Operational Risk function within the Non-Financial Risk Department of the
Office of the Group Chief Compliance Officer (“GR&C-OCCO”) • At the EIF, the Operational Risk mandate and its implementation is fulfilled by the Operational Risk Management function, within the Internal Control, Regulatory & Corporate
Compliance Division of the EIF Compliance & Non-Financial Risk Department. The EIB Group Operational Risk Policy is a key component of the Operational Risk Management Framework. The purpose of the policy is to define the objectives, general
principles and framework components to be applied in the Operational Risk Management functions in the EIB Group. The high-level EIB Group document is further complemented by the EIB Group Operational Risk Event Reporting Procedure and other more
granular process guidelines and procedures developed separately for the EIB and the EIF.
EIB Group’s Operational Risk Management Framework The EIB Group Operational Risk Management Framework, described in the EIB Group Operational Risk Policy, covers four
main components: Governance, Operational Risk Appetite, Risk Management Process and Capital Management. Governance In line with BBP Guiding Principles, the management of operational risks operates within the three lines of defence model. The
business lines as the first LoD take risks and are responsible for the day-to-day management of such risks directly and on a permanent basis. The EIB and EIF Operational Risk functions as the second LoD are responsible for the implementation of the
sound ORMF. The independent Internal Audit as the third LoD provides assurance to the relevant governing bodies of the appropriateness and efficient implementation of the ORMF. Its responsibilities include independently verifying that the ORMF has
been adequately designed and implemented by both the first and second lines of defence. Operational risk appetite The EIB Group strives to minimise the risk of losses related to operational failure through the establishment and development of a
strong ORMF to provide a systematic and integrated approach to the management of operational risk. However, recognising that expected and unexpected losses can occur, the Group defines a certain level of risk appetite and a set of monitoring tools
and processes, which together define the Risk Appetite Framework for operational risk. In addition, both the EIB and the EIF put policies, procedures and systems in place in order to minimise operational risk losses and remain within the operational
risk appetite levels. The EIB Group’s risk appetite for operational risk is articulated in the Group Risk Appetite Statement document, which communicates to management, the governing bodies of all Group entities, employees and other key stakeholders
the risk profile the Group is willing to assume in the pursuit of its activities. Risk management process The ORMF and its implementation are supported by a set of processes and tools, namely: Risk identification Risk identification is the
process whereby operational risks are recognised and classified in line with the EIB Group’s risk classification and where the risk sources in all business activities and risk drivers (employees, process failure, external, systems) are linked to
operational risk events and to their consequences. All identified risks have an agreed risk owner at the business level who is responsible for assessing, monitoring and managing the risk. All identified risks are categorised in line with the Group’s
risk classification and documented accordingly. The risk identification process for non-financial risks is part of the overall EIB Group Risk Identification process coordinated by the Regulatory and Group Risk Department and is backed by a set of
activities, among which the most prominent being: • Risk and control identification and assessment, as part of the Internal Control Framework82; 82 Process owned and managed by the Internal Controls and Assertion division within the Chief Financial
Controller Directorate in the EIB, and the Compliance and Non-financial Risk function within the EIF’s Risk Office.
• Group Compliance Risk Assessment83; • Root cause analysis and back-testing of operational risk events; • External events analysis; • Forward-looking scenario
analysis; • Analysis of new products carried out by the New Product Committee (“NPC”); 83 Process owned and managed by GR&C-OCCO. Risk assessment Risk assessment is used to assess and quantify the EIB Group’s operational risks and to ensure
that the appropriate means and resources can be identified and allocated to the management of these risks. Risk assessment also serves to determine the appropriate capital requirements for operational risk. The objectives of the risk assessment
process in the EIB Group can be summarised as follows: • To provide detailed and updated information on operational risk in relation to the key business processes of the Group; • To provide senior management with an overall picture of the Group's
operational risk exposure and risk/control framework; • To align the Group’s operational risk profile to its operational risk appetite; • To align the Group’s operational risk management to BBP and best market practices. A key component of the
operational risk assessment within the Group is the risk and control assessmentprocess managed by the Internal Controls and Assertion division within the Chief Financial Controller Directorate together with other relevant second lines within the EIB,
and the Internal Control function at the EIF governed by the EIB Group Internal Control Framework Policy. 84, the 84 Other risk assessments with focus on specific operational risk types (Compliance, Fraud, Information Security and others) are
conducted across the Group by dedicated functions which manage these risk types. The EIB Internal Control Framework (‘ICF’) materialises the regular actions implemented by the Bank’s management to (i) identify risks generated by activities under
their responsibility (inherent and residual risks), (ii) design adequate controls to cover these, and (iii) be in a position to report thereon. The ICF covers all processes implemented in the Bank. On that basis, the Bank’s senior management issues
yearly internal control assurance declarations to the EIB President and the AC. The ICF’s definition, review and maintenance are administered in line with the EIB Group ICF Policy approved by the Board of Directors. ICF policy oversight actions are
implemented by the ICF Control function (‘ICFC’), which is the second line of defence function. Similarly to the EIB, the EIF has implemented several processes to manage and monitor operational risks, including the EIF Risk and Control Matrix. The
Risk Control Matrix identifies the main risks for the EIF inherent to each process or activity, including: a rating of the inherent risk (gross risk), the existing key controls mitigating that risk, and a rating of the residual risk (net risk). For
each identified risk, the rating of the inherent risk is based on: • its potential financial and reputational impact; and • its estimated likelihood, based on the frequency of the underlying process and the intrinsic complexity/instability of the
assessed process. Another important component of the risk assessment process is the qualitative and quantitative assessment of forward-looking operational risk scenarios.
Risk mitigation Risk mitigation activities are designed and implemented in the EIB Group to address and control risks. Risks that cannot be controlled adequately by
the Group are addressed to senior management/governing bodies in order to establish whether to accept or to withdraw from the activities generating these risks. Risk mitigation activities are an integral part of the regular activities of the Group
and involve all organisational and hierarchical levels in order to be effective. Effective mitigation includes processes on the basis of the following: • The EIB Group rules, codes and policies, such as, but not limited to Codes of Conduct,
Anti-Fraud Policy, the Whistleblowing Policy, Market Abuse Policy, Staff Conflicts of Interest Policy; • Segregation of duties between the three lines of defence; • New product approval process and related committee; • Sound Internal Control
Framework; • Risk identification and assessment processes such as the Compliance Risk Assessment; • Risk and controls assessment and monitoring processes such as the Risk Appetite Framework (RAF) and the Compliance Monitoring Programme (CMP); •
Independent risk management and compliance functions; • Accounting, record-keeping, valuation, safeguarding and information systems controls; • Independent internal and external audit functions; • Insurance policies. The Group has policies,
guidelines and procedures to control and mitigate operational risk. The Group assesses the costs and benefits of alternative risk limitation and control strategies and adjusts its operational risk exposure accordingly and in line with its risk
appetite. As part of the risk mitigation process, the Operational Risk Management function ensures the close monitoring of mitigation actions stemming from operational risk events. Risk monitoring and reporting Operational risk monitoring involves
all services of the EIB Group: • Services undertake a regular review of their risk profile in line with a defined level of risk and a related risk review schedule. • (Key) Risk Indicators, as defined by the Services in collaboration with the
Operational Risk Management function, are used to monitor on a regular basis the operational risk exposures against their related risk appetite, with appropriate actions taken when risk levels are breached. • Operational Risk Events are reported by
the Services and collected, reviewed and analysed on a regular basis by the Operational Risk Management function in order to identify the actual exposure to operational risk, to complete the risk profile assessment, identify potential trends and
emerging risks and support risk assessments by second LoD services. This should ensure that root causes are understood, and that any lessons learned from Operational Risk Events are used to improve the controls. All issues and actions relating to
Operational Risk Events and out-of-appetite operational risks are tracked and monitored by the Operational Risk Management function on a regular basis to ensure timely remediation. • The EIB’s Operational Risk function has established a comprehensive
Group operational risk reporting framework. Critical Operational Risk Events, Key Risk Indicators, and operational risk capital are reported in the EIB Group Risk Reports. The EIB Group also produces a quarterly Operational Risk Report, which
includes statistics on Operational Risk Events, root causes trends, mitigating actions and End User Computing tools compliance. On the EIF side, the Operational Risk Function provides a monthly report on Operational Risks to the EIF Committee on
Controls Oversight (CoCO) and on a quarterly basis the EIF Operational Risk report to the EIF Non-Financial Risk Committee (NFRC) and the EIF Audit Board (AB). In addition, the EIF Operational
Risk Function coordinates with the relevant EIF services the quarterly exercise of the NFR (K)RIs which are included in the quarterly EIF RAF Dashboard. • The EIB’s
risk control self-assessment and control testing results are reported to the senior management and the AC by the ICF Control function. • The EIF's Compliance function produces the ICF report and coordinates the ISAE-3402 report (assessment of key
controls related to mandate activities), as well as specific contributions to broader reports, as relevant. The following sections provide further details on some categories of operational risk at the EIBG. Information and communication technology
or ICT risk (including cyber) ICT risk is the risk of loss associated with any reasonably identifiable circumstances related to the use of network and information systems that, if materialised, could compromise the security (confidentiality,
integrity, authenticity, availability) of the network and information systems, of any technology-dependent tool, process, operations or the provision of services, by causing adverse effects in the digital or physical environment. ICT risk and data
security are considered to be among the top operational risks in the industry. In response to the increasing complexity and intensity of external threats, and in view of the reliance of the Group’s operations on information technology, the Group is
constantly reinforcing both its technical defences (IT Security) and procedural and people capabilities (Information Security) and will continue to do so in line with best banking practice. On the Information Security side, the Group is focused on
increasing user awareness of ICT threats and is addressing this need through various events, communication campaigns, risk assessments and training programmes. The EIB’s IT Security function as a first line of defence is responsible for deploying
technical and operating measures to protect the security of computer systems, networks and other technology assets hosted on the EIB Group premises. Information Security acts as a second line of defence and provides oversight of activities performed
by the first line of defence, cyber security awareness training and various critical compliance tasks (SWIFT Customer Security Programme and TARGET2). To protect information consistently, an information classification scheme is in place, and users
are informed of associated best practices with regard to data leakage, prevention of malware and general sound information management. This scheme enables the Group to embed good information handling/processing processes in all that it does so that
it is clear to everyone with access to know how best to protect it from unauthorised disclosure, alteration or destruction, dissemination or loss. These security efforts are intended to protect against attacks by unauthorised parties trying to
obtain access to confidential information, destroy data, disrupt service, sabotage systems or cause other damage. The Group continues to enhance its cyberdefence capabilities and strengthen its partnerships with the appropriate agencies, such as
CERT-EU, in order to address the full spectrum of ICT security risks in its operating environment, enhance defences and improve resiliency against these threats. Third parties with which the Group does business or that facilitate the Group’s business
activities could also be sources of ICT risk to the Group. Third-party ICT risk incidents such as system breakdowns or failures, misconduct by the employees of such parties, or attacks could affect their ability to deliver a product or service to the
Bank or result in lost or compromised information. To protect the confidentiality, integrity and availability of the Group’s infrastructure, resources and information, the Group ensures that risks are identified and managed. Regulation (EU)
2018/1725 (repealing Regulation (EC) No 45/2001 and Decision No 1247/2002/EC) of the European Parliament and of the Council of 23 October 2018 on the protection of natural persons with regard to the processing of personal data by the European Union’s
institutions, bodies, offices and agencies, and on the free movement of such data, has now been in force since autumn 2018. The designated Data Protection Officers (‘DPO’) at both the EIB and the EIF ensure that the responsible controllers and
processors of personal data are
informed about their responsibilities and duties and provide advice to the organisation and to staff members on all matters related to the implementation of the
Regulation. The DPOs also act as the contact point of the EIB and the EIF with the European Data Protection Supervisor (‘EDPS’). Model risk Model risk means the risk of loss resulting from decisions that are principally based on the output of
internal models, due to errors in the design, development, parameter estimation, implementation, use or monitoring of such models, including the following: • the improper design of a selected internal model and its characteristics; • the inadequate
verification of a selected internal model’s suitability for the financial instrument to be evaluated or for the product to be priced, or of the selected internal model’s suitability for the applicable market conditions; • errors in the implementation
of a selected internal model; • incorrect mark-to-market valuations and risk measurement as a result of an error when booking a trade into the trading system; • the use of a selected internal model or of its outputs for a purpose for which that model
was not intended or designed, including manipulation of the modelling parameters; • the untimely or ineffective monitoring or validation of model performance or of the predictive ability to assess whether the selected internal model remains fit for
purpose. The relevant responsibilities, the process and the guiding principles to be followed as well as the documentation to be produced in order to minimise the model risk are currently governed by the EIB Group Model Risk Management Policy, the
EIB’s model validation policy and the EIF’s Model Management Governance Framework, respectively. The Group Model Risk Management Policy delegates oversight on model risk management across the EIB Group to a Model Risk Committee (MRC), chaired by the
GCRO. The policy establishes a Model Risk Management (MRM) function, responsible for the roll-out, maintenance and ongoing day-to-day activities of the model risk management framework. Models are part of an Inventory of Models, maintained by the
Model Validation function exercised by the EIB Group Model Validation division within GR&C. Model validation refers to the set of processes and activities intended to minimise model risk by verifying that the models are performing as expected, in
line with their objectives and business uses. As in other areas of risk, the Group follows the three lines of defence approach in model risk management. Accordingly, the first line of defence responsibility is assigned to the model owner. The model
owner is defined as the unit(s) responsible for development, operation and maintenance of the model/estimate under consideration. The owner(s) of each model is/(are) identified in the Inventory of Models. The second line of defence role is fulfilled
by the GR&C Model Validation function, which acts as a control and advisory function via independent assessment of the models, estimates and related processes developed by other units within the EIB Group. To achieve its goals, GR&C Model
Validation follows the appropriate validation methodologies and the validation process. It is also responsible for producing detailed methodological guidelines for the validation of individual models. The EIF Risk Office Model Validation function
performs a corresponding function for Tier 2 and 3 models owned within the EIF following group policies. Lastly, Internal Audit intervenes as the third line of defence in model risk management and bears the responsibility for assessing whether the
first and second lines of defence can fulfil their roles adequately.
Credit risk models, and other models in the areas of liquidity, interest rate risk, ALM and derivatives together with their processes, data and IT implementation, are
subject to regular validation in line with the model validation policy. Validation activities of models are overseen by specific committees (IRMMC, ALCO and DSMC respectively) or the MRC. The Bank has implemented a tiering methodology for the
allocation of models to different tiers based on their use and materiality. While the Tier 1 models (and model changes) are approved by a corresponding committee, the other models (Tier 2 and Tier 3) need to be approved by the Director(s) of the
directorates that were identified as model stakeholders or the EIF MRC for EIF models. Regulatory compliance, financial crime and conduct risks Compliance risk is managed by independent functions under the responsibility of the EIB Group Chief
Compliance Officer (GCCO) and the EIF Heads of Compliance. While the GCRO oversees compliance at the EIB Group level, both functions have direct access to their respective relevant governing bodies. The GCCO has responsibility for all non-financial
risks within the remit of the GCRO, overseeing non-financial risks at Group level in consultation with the EIF and under the oversight of the GCRO. The independent Compliance functions are responsible for the ongoing monitoring and oversight of: •
Regulatory compliance risk: the risk of failing to comply with Best Banking Practices, risks related to Internal Control Framework or risks related to significant gaps identified by Internal Audit; • Conduct risk: the risk arising from a current or
prospective financial loss, or loss to reputation to the EIB Group arising from cases of misconduct or inadequate rules on Ethics and Integrity other than Prohibited Conduct. • Financial crime risk: the risk arising from money laundering and
terrorism financing, sanctions violation, sanctions circumvention, breach of NCJ (non-cooperative jurisdictions) policy. In order to identify, assess, monitor, control, mitigate and report these non-financial risks, a number of policies, procedures
and/or initiatives are in place at Group level, including: • Group Compliance Risk Assessment (annual exercise) and for the EIB the Compliance Monitoring Programme (CMP) with an annual CMP review plan; • Integrity Policy and Compliance Charter; •
EIB Group Staff Code of Conduct; • EIB Group Whistleblowing Policy; • EIB Group Data Protection Policy; • EIB Group Anti-Fraud Policy; • EIB Group Dignity at Work Policy; • EIB Group Staff Conflicts of Interest Policy; • EIB Management Committee and
EIF CE/DCE Code of Conduct; • Code of Conduct for the members of the Board of Directors of the EIB/EIF; • Code of Conduct for the members of the Audit Committee of the EIB/Audit Board of the EIF; • Staff Regulations; • Staff Rules; • EIB Group
AML-CFT Policy; • EIB Group policy towards weakly regulated, non-transparent and non-cooperative jurisdictions and tax good governance; • EIB Group Market Abuse Policy; • EIB Group Sanctions Compliance Policy;
• Internal procedures of the Compliance function that are leverage ratio-related. Anti-money laundering and combating the financing of terrorism risks are reported on
a regular basis to the MC, the AC and the EIB Board Working Group on tax and compliance. Cases of suspected money laundering and financing of terrorism are reported by each of the EIB and the EIF to the Luxembourg financial intelligence unit. The
EIB Group Compliance Activity Report provides further details on the topics above and is available on the Bank’s website. Fraud risk Fraud risk is the risk arising from a current or prospective risk of losses to the EIBG arising from cases of
fraud, and corruption or other prohibited conduct (as defined in the EIBG Anti-Fraud Policy). Senior Management of the EIBG’s entities are responsible for promoting high ethical and integrity standards, as well as a strong internal control culture
within the organisation. Banking governance standards and regulations recognise that all members/levels of an organisation are responsible for risk mitigation and internal control. Senior Management is responsible for establishing policies,
procedures and controls to mitigate risks related to their business activities within an agreed risk appetite. This is reflected through the implementation of strategies, policies, procedures and controls which support the necessary steps to
identify, measure, monitor and control risks. The EIB Group Anti-Fraud Policy (AFP) sets forth the policy in preventing and deterring fraud and other prohibited conduct in the Group’s activities and applies to all members of governing bodies and
staff. The AFP assigns a key role in addressing fraud and other forms of prohibited conduct to the Inspectorate General, Investigations division (IG/IN), which not only has the sole mandate to investigate, but also a significant role in the
prevention and detection of fraud, including the assessment of fraud risk and its deterrence. As per the EIB Group Operational Risk Policy, fraud risk assessments are conducted across the Group by IG, which manages this operational risk type on an
autonomous basis. All Group staff have the duty to report any suspicion of fraud promptly to IG/IN for assessment. Allegations concerning money laundering and financing of terrorism are investigated by IG/IN in close cooperation with EIB OCCO/EIF
Compliance. Fraud investigations conducted by IG/IN are reported on a quarterly basis to the MC, the EIF Chief Executive, the AC and the Audit Board of, respectively, the EIB and the EIF, the European Public Prosecutor’s Office (EPPO) and the
European Anti-Fraud Office (OLAF). The Group issues an annual report on its anti-fraud activities, which is available on its website. Operational risk capital requirements measurement Based on the latest regulatory development85, all existing
methodologies for calculating own funds requirements for operational risk will be replaced by a single, non-model-based approach to be used by all institutions. Therefore, the use of models to determine own funds requirements for operational risk,
such as those developed under the Advanced Measurement Approach, will no longer be possible once CRRIII/CRD VI enters into force in 2025. Since 2019, the EIB Group has proactively adopted the standardised approach (‘SA’), in anticipation of the
referred latest regulatory developments, which following the final Basel III standards discontinued the Advanced 85 CRR as amended by Regulation (EU) 2024/1623.
Measurement Approachfor the computation of the operational risk regulatory capital charge. Operational risk RWEAs are calculated annually, as per market practice,
based on the EIBG’s audited consolidated financial statements. 86 86 Following the publication of the “Basel III: Finalising post crisis reforms” in December 2017, the standardised approach replaced all approaches used to calculate operational risk
RWEA existing in the Basel II framework as from January 2023. The standardised approach to operational risk is intended to be implemented in the European Union from January 2025 with the entry into force of new amendments to the CRR. The SA includes
two main components further detailed in templates OR2 and OR3 below: • the Business Indicator (BI) which is a financial statements-based proxy for operational risk and comprises three components: the interest, leases and dividend component (ILDC);
the services component (SC), and the financial component (FC); • the Business Indicator Component (BIC), which is calculated by multiplying the BI by a set of regulatory determined marginal coefficients.
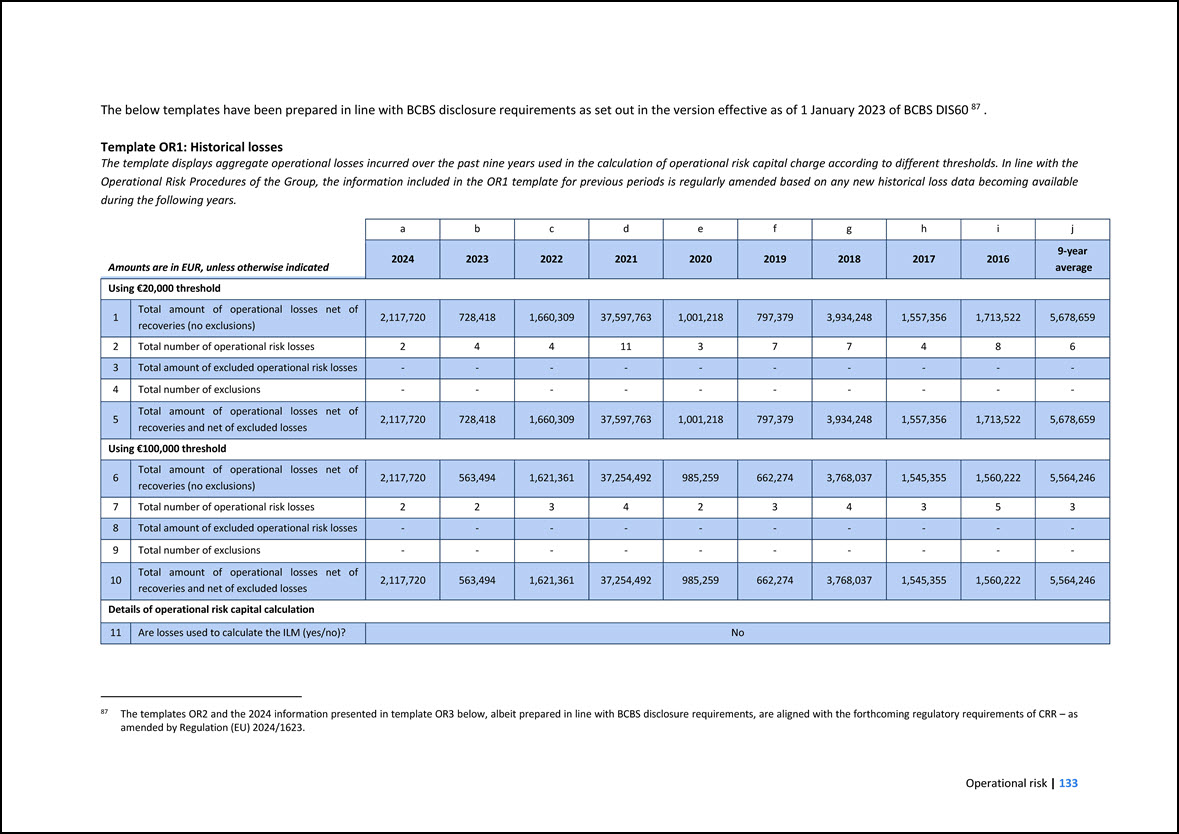
The below templates have been prepared in line with BCBS disclosure requirements as set out in the version effective as of 1 January 2023 of BCBS DIS60 87 . 87 The
templates OR2 and the 2024 information presented in template OR3 below, albeit prepared in line with BCBS disclosure requirements, are aligned with the forthcoming regulatory requirements of CRR – as amended by Regulation (EU) 2024/1623. Template
OR1: Historical losses The template displays aggregate operational losses incurred over the past nine years used in the calculation of operational risk capital charge according to different thresholds. In line with the Operational Risk Procedures of
the Group, the information included in the OR1 template for previous periods is regularly amended based on any new historical loss data becoming available during the following years. Amounts are in EUR, unless otherwise indicated a b c d e f
g h i j 2024 2023 2022 2021 2020 2019 2018 2017 2016 9-year average Using €20,000 threshold 1 Total amount of operational losses net of recoveries (no exclusions) 2,117,720 728,418 1,660,309 37,597,763 1,001,218 797,379
3,934,248 1,557,356 1,713,522 5,678,659 2 Total number of operational risk losses 2 4 4 11 3 7 7 4 8 6 3 Total amount of excluded operational risk losses - - - - - - - - - - 4 Total number of exclusions - - - - - -
- - - - 5 Total amount of operational losses net of recoveries and net of excluded losses 2,117,720 728,418 1,660,309 37,597,763 1,001,218 797,379 3,934,248 1,557,356 1,713,522 5,678,659 Using €100,000 threshold 6 Total amount of
operational losses net of recoveries (no exclusions) 2,117,720 563,494 1,621,361 37,254,492 985,259 662,274 3,768,037 1,545,355 1,560,222 5,564,246 7 Total number of operational risk losses 2 2 3 4 2 3 4 3 5 3 8 Total amount
of excluded operational risk losses - - - - - - - - - - 9 Total number of exclusions - - - - - - - - - - 10 Total amount of operational losses net of recoveries and net of excluded losses 2,117,720 563,494 1,621,361
37,254,492 985,259 662,274 3,768,037 1,545,355 1,560,222 5,564,246 Details of operational risk capital calculation 11 Are losses used to calculate the ILM (yes/no)? No
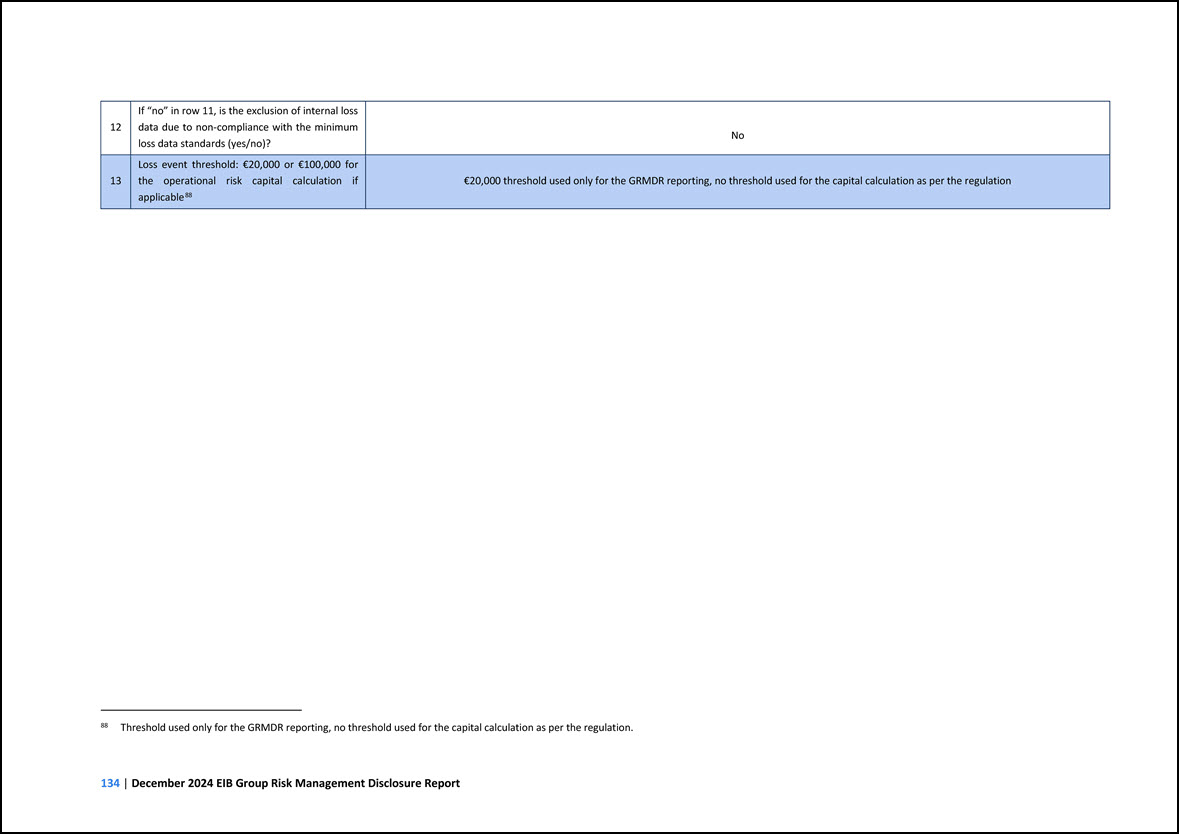
12 If “no” in row 11, is the exclusion of internal loss data due to non-compliance with the minimum loss data standards (yes/no)? No 13 Loss event threshold:
€20,000 or €100,000 for the operational risk capital calculation if applicable88 €20,000 threshold used only for the GRMDR reporting, no threshold used for the capital calculation as per the regulation 88 Threshold used only for the GRMDR
reporting, no threshold used for the capital calculation as per the regulation.
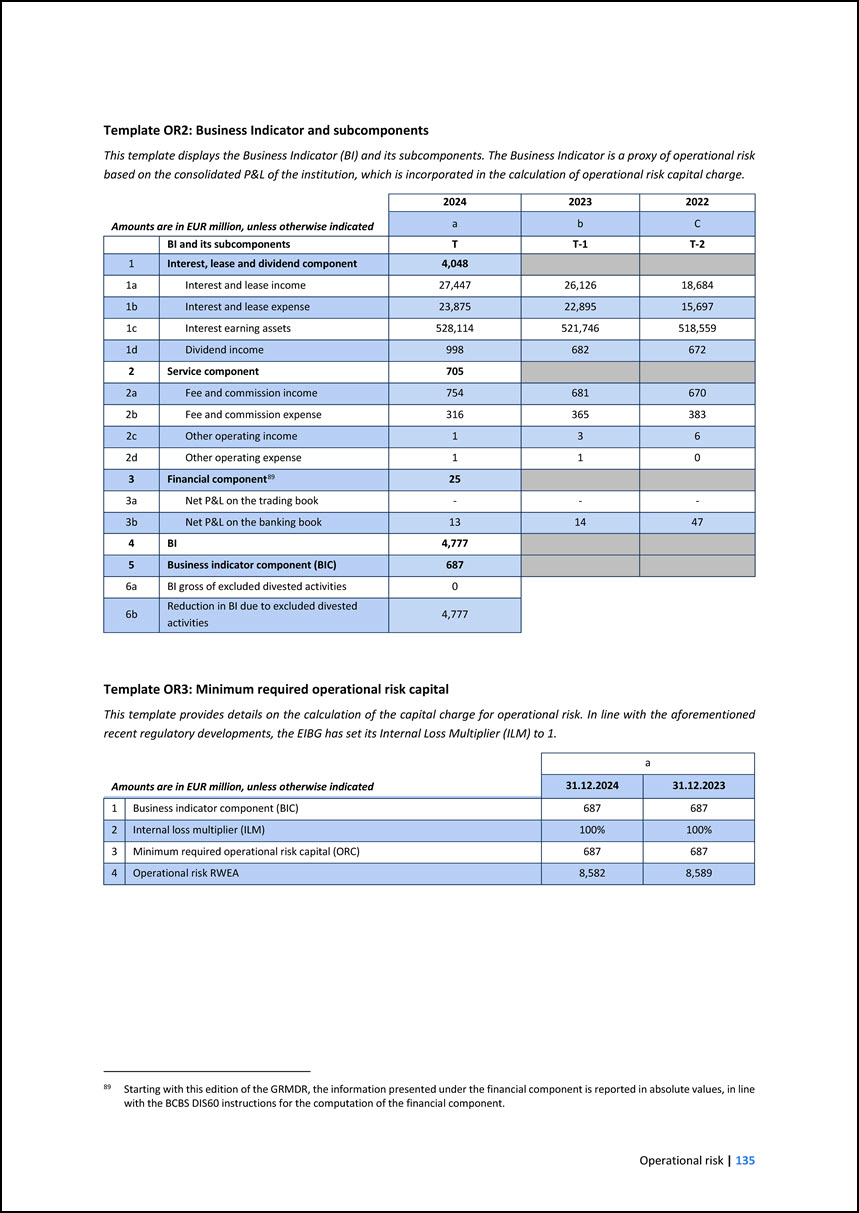
Amounts are in EUR million, unless otherwise indicated Template OR2: Business Indicator and subcomponents This template displays the Business Indicator (BI) and its
subcomponents. The Business Indicator is a proxy of operational risk based on the consolidated P&L of the institution, which is incorporated in the calculation of operational risk capital charge. 2024 2023 2022 a b C BI and its
subcomponents T T-1 T-2 1 Interest, lease and dividend component 4,048 1a Interest and lease income 27,447 26,126 18,684 1b Interest and lease expense 23,875 22,895 15,697 1c Interest earning assets 528,114 521,746 518,559
1d Dividend income 998 682 672 2 Service component 705 2a Fee and commission income 754 681 670 2b Fee and commission expense 316 365 383 2c Other operating income 1 3 6 2d Other operating expense 1 1 0 3 Financial
component89 25 3a Net P&L on the trading book - - - 3b Net P&L on the banking book 13 14 47 4 BI 4,777 5 Business indicator component (BIC) 687 6a BI gross of excluded divested activities 0 6b Reduction in BI
due to excluded divested activities 4,777 89 Starting with this edition of the GRMDR, the information presented under the financial component is reported in absolute values, in line with the BCBS DIS60 instructions for the computation of the
financial component. Template OR3: Minimum required operational risk capital This template provides details on the calculation of the capital charge for operational risk. In line with the aforementioned recent regulatory developments, the EIBG has
set its Internal Loss Multiplier (ILM) to 1. Amounts are in EUR million, unless otherwise indicated a 31.12.2024 31.12.2023 1 Business indicator component (BIC) 687 687 2 Internal loss multiplier (ILM) 100% 100% 3 Minimum required
operational risk capital (ORC) 687 687 4 Operational risk RWEA 8,582 8,589
13 OTHER RISKS 13.1 Pension and health insurance risks Pension and health insurance risks are defined as the risks of losses due to the volatility of the Group’s
pension and health insurance Defined Benefits Obligations (DBO). The EIB and EIF pension schemes are defined benefit schemes financed by contributions from staff and the EIB/EIF. Their characteristics are presented in Notes A 2.11 and L of the EIB
Group consolidated financial statements under EU-AD. The Group does not have segregated pension assets, it is therefore not exposed to pension fund investment risk and does not have to deduct any (net) pension assets from its own funds as provided
for by Article 41 of the CRR. Pension and health insurance risks stem primarily from a potential increase of the Group’s DBO under adverse conditions. Management, monitoring and reporting At the EIB’s level, pensions are managed according to the
EIB’s Pension Scheme Regulations while the Health Insurance Scheme is managed according to the EIB’s Staff Rules. Corresponding procedures exist as well at EIF level. Both the EIB and the EIF have Pension Boards, which provide oversight of the
pension schemes and are responsible for implementing the provisions governing the schemes. The Pension Boards also ensure consistent and systematic adherence to actuarial principles. The Pension Boards issue an annual report setting out the main
developments in the EIB’s and the EIF’s pension schemes, along with a summary of the work carried out by the Boards and an update of key financial and actuarial data. The EIB and EIF Pensions Boards receive an annual report from the external actuary
on the status of the pension scheme which includes a sensitivity analysis of the main factors impacting pensions, namely discount rate changes, increases in salary, inflation and life expectancy. The results of the risk sensitivity analysis performed
by the external actuary are provided in Note J of the consolidated financial statements under IFRS. The EIB’s and the EIF’s Health Insurance Schemes are administered with a view to balancing benefits and contributions. The Health Insurance Scheme
Committee examines the financial situation of the Health Insurance Scheme each year and draws up a report that is submitted to the MC. An actuarial valuation of the Health Insurance Scheme obligations is performed once a year. The EIB’s and the
EIF’s exposure to actuarial risks is appraised in line with the respective accounting standards, which value the accrued benefits, by reference to their projected amount at the date of payment. Contribution levels of the pension schemes are reviewed
periodically to reflect the evolution of actuarial parameters (interest rate, inflation, longevity, salary increase, etc.) and minimise the risk of future deficits. The interest rate risk arising from the EIB’s pension and health insurance
obligations is managed within the EIB’s overall interest rate exposure as those long-term obligations form an integral part of the liabilities of the EIB’s balance sheet. The EIF does not actively manage the interest rate exposure arising from its
pension and health insurance obligations. The EIB Group internally capitalises the interest rate risk related to pension and health insurance liabilities for the EIB and the EIF at an individual as well as at a consolidated level. Although other
actuarial risks (such as salary increase, longevity and healthcare cost) and inflation risk are not hedged for both the EIB and the EIF, those risks are also internally capitalised by both the EIB and the EIF at an individual as well as at a
consolidated level.
13.2 Reputational and strategic risks Reputational risk is the risk that arises from negative perception on the part of customers, counterparties, shareholders,
investors, debt holders, market analysts, other relevant parties or regulators that can adversely affect an institution’s ability to maintain existing or establish new business relationships and continued access to sources of funding. The risk is
monitored as part of the non-financial risk indicators under the Group’s Risk Appetite Framework. Strategic risk is the risk that a sub-optimal contribution to achieve the EIB Group’s policy mission supporting EU policy objectives could, through
decreasing shareholder or stakeholder support, indirectly affect the long-term financial sustainability of the EIB or the EIF. Strategic risk could be affected by inadequate strategic decisions, a failure to execute strategy or a lack of effective
response to changes in the economic, political and business environment. Despite being policy-driven institutions (EU policy and policy goals), both the EIB and the EIF are exposed to strategic risk. The EIB’s strategy implementation is manifested
through its EIB Group Operational Plan, whose elaboration process is based on close interaction between the Group Strategy Department and all relevant services. 13.3 Environmental, social and governance risks 13.3.1 Qualitative information on
environmental risk Out of the different environmental areas, the Group is currently covering primarily climate risk. Moreover, environmental risk is addressed transversally, where relevant. With regard to the risks associated to other environmental
areas, the Group has started to work to integrate biodiversity risk into its policies and procedures. 13.3.1.1 Business strategy and processes Business strategy (including business environment, business model and financial planning) The EIB Group
contributes to the commitment made by the European Union to support the European Green Deal and be a global partner and a frontrunner in promoting and implementing the UN’s 2030 Agenda for Sustainable Development and the achievement of its
Sustainable Development Goals (SDGs), and multilateral environmental instruments such as the Paris Agreement on Climate Change and the Convention on Biological Diversity. As requested by the European Council and EU Member States, the EIB Group is
supporting the design and implementation of the European Green Deal and helping to accelerate the European Union's transition to a ‘net- zero’ greenhouse gas emissions and climate-resilient EU economy by 2050. For many years, the EIB Group has been
an integral part of the European Union’s global response to climate and environmental challenges, with extensive experience over the last decade in many areas of climate finance. In 2020, the EIB Group completed the review of its Climate Strategy
and developed the EIB Group Climate Bank Roadmap (CBR) 2021-2025 to put its new climate, environmental and social goals into action. The EIB Group aims to build on its past successes and solidify its role as the climate bank, in alignment with the
EIB Group 2024-2027 Strategic Roadmap which sets a clear focus for the Group’s priorities up to 2027. It aims to support the European Union's climate goals and the transition to a sustainable, low-carbon economy through increasing climate finance and
integrating sustainability considerations across the EIB Group's standards, methods and processes, while at the same time supporting a just transition for all.
The revised EIB Climate Strategy sets a guide for the Bank’s medium to long-term climate actions, focusing on three strategic areas: • Reinforcing the impact of EIB
climate financing • Building resilience to climate change • Further integrating climate change considerations across all the Bank’s standards, methods and processes. The EIB Group’s CBR builds on the EIB Group’s revised Climate Strategy and outlines
the Group’s response to the worsening climate situation. It details the Group’s approach to accelerating the transition to a low-carbon, climate-resilient and environmentally sustainable economy, while at the same time supporting a just transition
for all. It further outlines in more detail how the EIB Group plans to deliver on its ambition to support a just transition. Being part of the community of Multilateral Development Banks (MDBs), the EIB Group has worked closely with other MDBs to
develop a common framework to aligning their activities with the goals of the Paris Agreement. This holistic framework is based on six building blocks around which specific strategies for alignment can be developed and goes beyond new financing
commitments to address all new MDBs’ financing operations, mindful of their role in setting norms and good practices. The CBR is firmly built on the framework, covering all six building blocks, and provides a first, comprehensive example of its
application. The CBR identifies 12 focus areas that will benefit from the EIB Group’s financing of climate action and environmental sustainability 90. 90 For more details on the different focus areas, please refer to the EIB Group Climate Roadmap
2021-2025 available on the EIB website. The Climate Bank Roadmap is structured around four key workstreams: • Accelerate the transition to a low-carbon, climate-resilient and environmentally sustainable economy by investing and mobilising
significant volumes of green finance in support of the goals of the Paris Agreement to support the achievement of the following targets: o Gradually increase the share of the EIB’s annual financing for climate action and environmental sustainability
to at least 50% by 2025 and beyond. o Support EUR 1 trillion of investment in climate action and environmental sustainability between 2021 and 2030 at the Group level. • Ensure a just transition for all, so that no people or places are left behind in
the transition. • Align all new Group operations with the principles and goals of the Paris Agreement from 2021. • Build strategic coherence and accountability ensuring a coherent EIB Group approach across its policy framework; its transparency,
accountability and quality assurance processes; and related institutional support. Objectives, targets, limits and performance assessment against those In terms of climate and environmental related objectives the EIB Group continues in both its
financing activities as well as its internal operations to focus on: • contributing to the achievement of the UN SDGs; • increasing its climate action and environmental sustainability financing; • reducing the internal carbon footprint of the Group;
• aligning all new operations with the principles and goals of the Paris Agreement.
Contribution to the SDGs The 17 SDGs provide a framework for measuring international efforts to end world poverty, protect the planet and ensure that everyone can
enjoy peace and prosperity. The EIB Group has been tracking and reporting how its projects contribute to the SDGs since 2016. As the operations carried out by EIB and the EIF are very different in nature, each entity has developed its own approach
to measuring their contributions to the SDGs91, reflecting the specific characteristics of their respective business. 91 For further details on how EIB and EIF operations and the respective financial contributions are mapped to the SDGs in 2023,
please refer to the publication The European Investment Bank Group’s contribution to the Sustainable Development Goals 2023 available on the EIB website. The development impact of the Bank’s activities is calculated not only for each investment
project, but also at the sectoral, national and international levels. Our activities have a particular impact on the SDGs related to climate and the environment. The EIB’s methodology maps all project indicators to up to two of the appropriate SDGs
independently of project context, using a range of data elements, including the project’s location, sector, anticipated results, eligibility, mandate or initiative, and the type of financing product used. The EIF’s activities cover all SDGs except
for SDG 16, which due to its nature cannot be addressed by the type of operations performed by the EIF. Climate action and environmental sustainability targets The environmental targets and 2024 actuals related to the Group public policy goals
(“PPGs”) and to climate action and environmental sustainability are included in the Group Operational Plan 2025-202792 and are in line with the respective commitments taken in 2019 and formalised in the CBR. 92 For the latest orientations and
targets and their breakdown between the EIB and the EIF, please refer to the EIB Group Operational Plan 2025-2027 available on the EIB website. Financing in support of climate action and environmental sustainability is the first of the EIB Group’s
eight strategic priorities contained in the Strategic Roadmap endorsed by the 27 EU Member States, covering all focus areas of the EU Green Deal and more specifically the six environmental objectives covered by the EU Taxonomy, including greenhouse
gas emission reductions, protecting against climate change impacts, and restoring and developing natural capital.
Reducing the internal carbon footprint of the Group The CBR also set reduction targets for greenhouse gas emissions to align the EIB Group’s internal operations with
a 1.5° C temperature goal. A target was set of -12.4% in Group greenhouse gas emissions by 2025, compared to a 2018 baseline. This includes activities defined in the Carbon Footprint Report 2018, covering scope 1, 2 and, partially, scope 3
emissions. Supporting Paris-aligned operations The Paris alignment framework is applied at both the investment project and counterparty level. At the investment project level, the Group has implemented its low-carbon framework (LCF) and climate
risk assessment (CRA) system for relevant new operations while at the counterparty level, the EIB Group applies its Paris alignment for counterparties (PATH) framework. These frameworks Policies and procedures relating to engagement with new or
existing counterparties or operations”. 93 are described more in detail in the section “ 93 For more details, please refer to the EIB Group Paris Alignment Framework – Low carbon Version 1.1 and the EIB Group PATH Framework Version 1.2 both available
on the EIB website. Current investment activities and (future) investment targets Current and future investment activities and commitments of the EIB Group towards environmental objectives are broken down in the CBR workstreams described above.
The EIB Group has in place a well-established tracking system for climate action finance targets, the Climate Action and Environmental Sustainability (CA&ES) tracking system . 94 , whose approach and underlying definitions are based on the joint
MDB climate finance methodology. The Group has taken steps to gradually integrate the EU Taxonomy into its tracking methodology for climate action and environmental sustainability finance95 94 Both the related European Investment Bank Climate Action
and Environmental Sustainability List of eligible sectors and eligibility criteria and the EIF’s criteria for Climate Action and Environmental Sustainability operations are available on the EIB and EIF websites. 95 For more details, please refer to
the 2023 mid-term review of the CBR available on the EIB website. In terms of issuance activities, EIB has been pioneering the green bond market since 2007 as the largest MDB issuer of green and sustainability bonds with dedicated use of proceeds.
Policies and procedures relating to new or existing counterparties or operations The EIBG has several policies and procedures in place to support its sustainability objectives and mitigate associated risks96 at project or operation level: 96 Other
relevant policies include the EIB Environmental Framework and the EIB Climate Strategy. • The Environmental and Social Sustainability Framework (ESSF) – which comprises the EIBG Environmental and Social Policy97, the EIB Environmental and Social
Standards9899– governs the assessment and management of climate, environmental and social impacts and risks throughout financed operations. and the EIF’s ESG Principles • The LCF defines in broad terms the activities that the EIB can or cannot
support in view of the Group’s interpretation of alignment to the mitigation goals of the Paris Agreement. The LCF was reviewed in 2023 to incorporate, among other things and where appropriate, the technical screening criteria for ‘do no significant
harm to climate change mitigation’ in the EU Taxonomy Climate Delegated Act. The LCF ensures that the Group only supports projects that are aligned with a pathway to low-carbon development. New projects with high transition risks are thus generally
excluded by the Group’s LCF. 97 The policy sets out the Group’s vision towards achieving sustainable development by defining the main areas of contribution and the operational framework for the Group. 98 The Standards outline the responsibilities
of counterparties with regard to the assessment of potential environmental, climate and social risk associated with projects financed by the EIB. 99 These Principles summarise the additional policies and procedures applied by the EIF which are
specifically tailored to the nature of its activities.
• The EIB sector-specific policies which also address social, economic and development issues further define priorities for EIB support in the most relevant sectors
which need significant investments to contribute positively to the transition towards a low-carbon and climate-resilient economy. The most relevant sectors due to their share in EIB financing and the underlying project typology, are Energy and
Transport, which are both covered by publicly consulted and published policies100, the EIB’s Energy Lending Policy (ELP)101 and the EIB Transport Lending Policy, that apply both within and outside the European Union. 100 Both the EIB’s Energy
Lending Policy and the EIB Transport Lending Policy are available on the EIB website. 101 As part of the mid-term review of the ELP in 2023, the EIB revised the related technical annexes of this policy. These technical changes reflect the adoption
of the EU Taxonomy and provide further clarification of the EIB’s lending criteria after two years of implementation. At counterparty level, the EIB Group Paris Alignment of Counterparties (PATH) framework, updated in 2023 in the context of the
mid-term review of the CBR, supports EIBG’s counterparties to transition towards a low-carbon and climate-resilient future. The framework requires screened-in corporate counterparties to develop and publish decarbonisation plans and/or resilience
plans and screened-in financial intermediaries to publish TCFD- aligned102 disclosures. 102 Developments in EU regulation of sustainability-related disclosures by corporates and financial undertakings are relevant to the PATH framework. In January
2023, the EU Corporate Sustainability Reporting Directive (CSRD) entered into force, requiring entities within its scope to disclose certain elements under the European Sustainability Reporting Standards (ESRS), which were adopted by the European
Commission in June 2023. The TCFD framework was phased out in 2024 and has been integrated into ISSB Standards S1 and S2. At the EIF, ESG due diligence is essentially conducted through a dedicated questionnaire and an adverse media screening of
counterparties to identify companies potentially associated with an ESG incident. The ESG assessment includes the evaluation of the financial intermediaries’ policies, processes and systems to ensure that they adequately factor in sustainability
impacts and risks in their investment decisions. The aim is to evaluate the ESG risk profile of the financial intermediaries, including their reputational risk exposure to ESG issues, at the time of the commitments and during the lifetime of the
investments. Other elements of the EIF policy framework also indirectly contribute to identification, assessment and, where required, mitigation of ESG-related risks. 13.3.1.2 Governance Responsibilities of the management body on risk framework,
objectives, strategy and policies In line with the objectives put forward by the EIB Climate Strategy and EIBG Climate Bank Roadmap, climate action and environmental sustainability objectives are increasingly integrated throughout the Group’s
governance framework. The Board of Directors is responsible for approving the Group Operational Plan (OP), financial transactions (including operations supporting climate action and environmental sustainability objectives), and climate-related
policies and strategic documents. Likewise, the EIF’s Board of Directors approves the EIF’s annual corporate operational plan (COP) and the thematic policy objectives’ key performance indicator and targets, including those pertaining to climate
action and environmental sustainability. In 2021, the EIBG created the EIB Group Climate and Environment Advisory Council (CEAC) to provide independent advice and expertise on the activities that the Group is carrying out to reach its climate action
and environmental sustainability ambitions. The role of the CEAC is to bring external high-level expertise and strategic insight to the implementation of the CBR and the EIB Group’s climate and environmental policy framework, in general, on a
consultative basis. The CEAC is composed of ten members. It forms a balanced group of high-level experts and recognised leaders from European and international institutions, civil society organisations, academia and research, think tanks and the
private sector. They provide a broad spectrum of skills and expertise to the EIB Group. The CEAC meetings are convened by the Chair and the EIB’s Vice-President overseeing climate action and environmental sustainability.
The oversight of the implementation of the Climate Bank Roadmap is performed by the Climate and Environmental Steering Committee (C&E Steering Committee), which
meets every quarter and is composed of the Bank’s Directors General and the EIF’s Chief Executive and Deputy Chief Executive and chaired by a member of the MC. In addition, a Climate and Environment Coordination Committee brings together all
relevant EIB Group Services to ensure the coordination of various climate and environment-related work streams and to promote knowledge sharing. The committee meets regularly to discuss key topics. Management body's organisational structure and
integration of risks To deliver on its ambitions, the Group has embedded the identification and management of climate-related risks and opportunities into its governance and organisational structure via three layers. • The “Business governing”
layer oversees the Group’s vision and strategy in relation to climate, sets priorities among other large-scale initiatives and ensures that the necessary resources to deliver are in place and includes the various governing bodies of the EIB and EIF
including the CEAC. • The “Steering” layer provides general direction and guidance, ensuring that the Group’s Climate Bank Roadmap remains focused on its objectives and is represented by the C&E Steering Committee and the Climate and Environment
Coordination Committee. • The “Performing” layer is responsible for organising and executing the Climate Bank Roadmap’s implementation and includes representatives from all relevant EIB Group services responsible for the delivery of the activities
related to the roadmap. Risk management governance and practices including roles, tasks allocation and feedback system Further to the Group Committees referred to above, the RPC provides non-binding opinions and/or recommendations to the Board of
Directors on whether the policies related to the identification, assessment and management of risks, including climate risk, are appropriate to the Group’s risk appetite. Any climate risk-related matters are included in the high-level risk policy
documents on which the RPC advises the Board of Directors. In line with the Group’s general approach to managing risks based on the three lines of defence framework, the same principles are applied for climate risks, with different roles for each
directorate, as shown below.
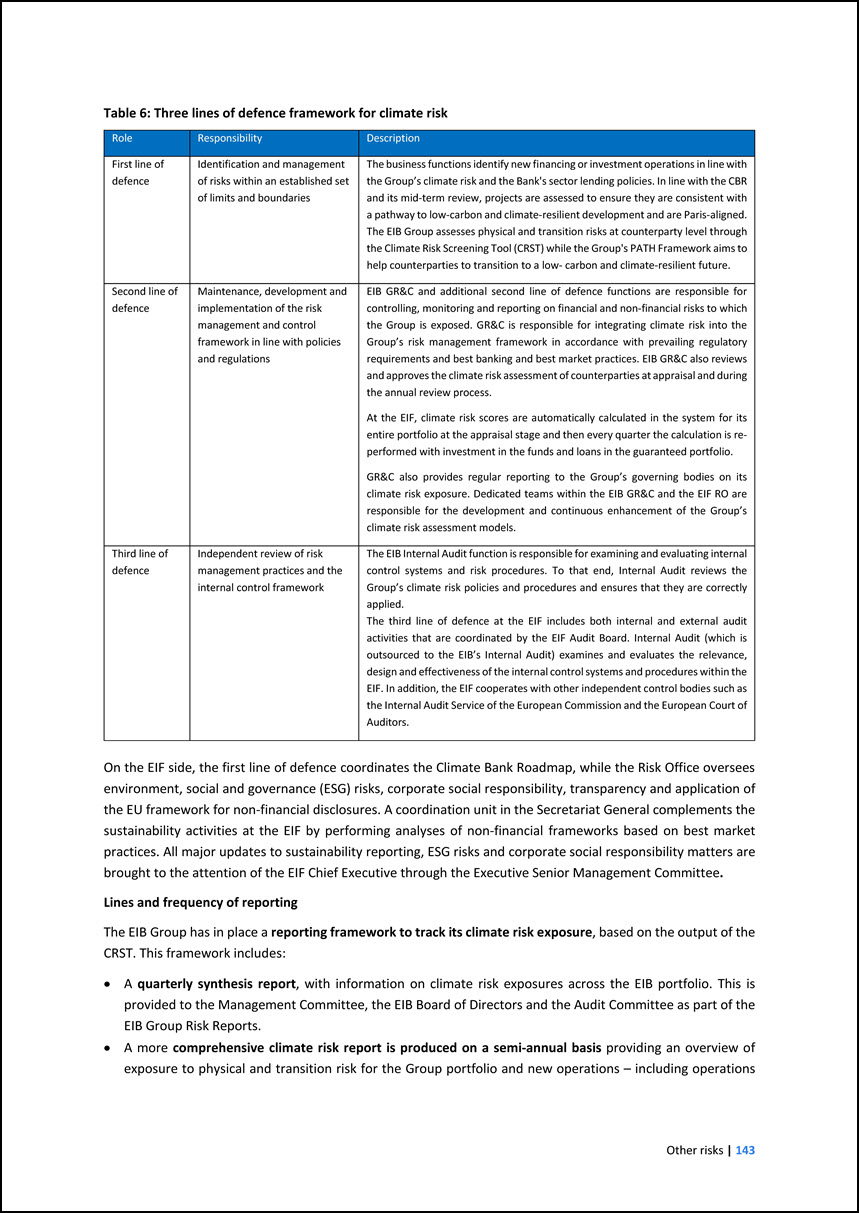
Table 6: Three lines of defence framework for climate risk Role Responsibility Description First line of defence Identification and management of risks within an
established set of limits and boundaries The business functions identify new financing or investment operations in line with the Group’s climate risk and the Bank's sector lending policies. In line with the CBR and its mid-term review, projects are
assessed to ensure they are consistent with a pathway to low-carbon and climate-resilient development and are Paris-aligned. The EIB Group assesses physical and transition risks at counterparty level through the Climate Risk Screening Tool (CRST)
while the Group's PATH Framework aims to help counterparties to transition to a low- carbon and climate-resilient future. Second line of defence Maintenance, development and implementation of the risk management and control framework in line with
policies and regulations EIB GR&C and additional second line of defence functions are responsible for controlling, monitoring and reporting on financial and non-financial risks to which the Group is exposed. GR&C is responsible for
integrating climate risk into the Group’s risk management framework in accordance with prevailing regulatory requirements and best banking and best market practices. EIB GR&C also reviews and approves the climate risk assessment of counterparties
at appraisal and during the annual review process. At the EIF, climate risk scores are automatically calculated in the system for its entire portfolio at the appraisal stage and then every quarter the calculation is re- performed with investment in
the funds and loans in the guaranteed portfolio. GR&C also provides regular reporting to the Group’s governing bodies on its climate risk exposure. Dedicated teams within the EIB GR&C and the EIF RO are responsible for the development and
continuous enhancement of the Group’s climate risk assessment models. Third line of defence Independent review of risk management practices and the internal control framework The EIB Internal Audit function is responsible for examining and
evaluating internal control systems and risk procedures. To that end, Internal Audit reviews the Group’s climate risk policies and procedures and ensures that they are correctly applied. The third line of defence at the EIF includes both internal
and external audit activities that are coordinated by the EIF Audit Board. Internal Audit (which is outsourced to the EIB’s Internal Audit) examines and evaluates the relevance, design and effectiveness of the internal control systems and procedures
within the EIF. In addition, the EIF cooperates with other independent control bodies such as the Internal Audit Service of the European Commission and the European Court of Auditors. On the EIF side, the first line of defence coordinates the
Climate Bank Roadmap, while the Risk Office oversees environment, social and governance (ESG) risks, corporate social responsibility, transparency and application of the EU framework for non-financial disclosures. A coordination unit in the
Secretariat General complements the sustainability activities at the EIF by performing analyses of non-financial frameworks based on best market practices. All major updates to sustainability reporting, ESG risks and corporate social responsibility
matters are brought to the attention of the EIF Chief Executive through the Executive Senior Management Committee. Lines and frequency of reporting The EIB Group has in place a reporting framework to track its climate risk exposure, based on the
output of the CRST. This framework includes: • A quarterly synthesis report, with information on climate risk exposures across the EIB portfolio. This is provided to the Management Committee, the EIB Board of Directors and the Audit Committee as
part of the EIB Group Risk Reports. • A more comprehensive climate risk report is produced on a semi-annual basis providing an overview of exposure to physical and transition risk for the Group portfolio and new operations – including operations
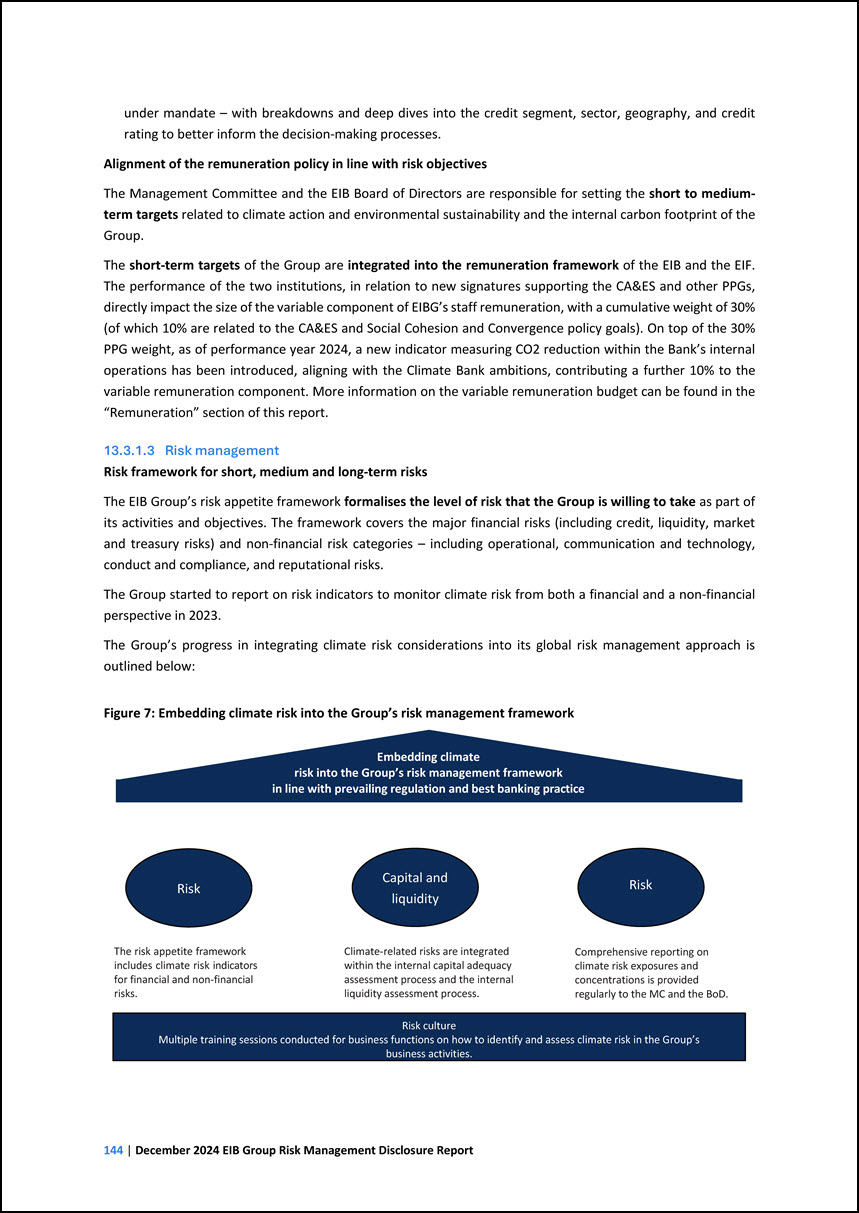
under mandate–with breakdowns and deep dives into the credit segment, sector, geography, and creditrating to better inform the decision-making processes. Alignment of
the remuneration policy in line with risk objectives The Management Committee and theEIB Board of Directors are responsible forsettingthe short to medium- term targetsrelated toclimate actionand environmentalsustainabilityand the internalcarbon
footprint of theGroup. Theshort-term targetsof the Group are integrated intothe remuneration frameworkof the EIB and the EIF. The performance of the two institutions, in relation to new signaturessupporting theCA&ES and other PPGs, directly
impact the size of the variable component of EIBG’sstaff remuneration, with a cumulative weight of 30% (of which 10% are related to the CA&ES and Social Cohesion and Convergence policy goals). On top of the 30% PPG weight, as of performance year
2024, a new indicator measuring CO2 reduction within the Bank’s internaloperations has been introduced, aligning with the Climate Bank ambitions, contributinga further 10% to thevariable remuneration component. More information on the variable
remuneration budget can be found in the“Remuneration” section of this report. 13.3.1.3Riskmanagement Risk framework for short, mediumand long-term risks The EIBGroup’s risk appetite frameworkformalises the level of risk that the Group is willing to
takeas part ofits activities and objectives. The framework covers the major financial risks(including credit, liquidity, marketand treasury risks) and non-financial risk categories–including operational, communication and technology, conduct and
compliance, and reputational risks. The Group started to report on riskindicators to monitor climate risk from both a financial and a non-financialperspective in 2023. TheGroup’s progress in integrating climate risk considerations into its globalrisk
management approach isoutlined below: Figure7: Embedding climate risk into the Group’s risk management framework Embedding climaterisk into the Group’s risk management frameworkinlinewithprevailingregulationandbestbankingpractice RiskRiskCapital
andliquidity Theriskappetiteframeworkincludesclimateriskindicatorsfor financial and non-financialrisks. Climate-related risks are integratedwithin theinternal capital adequacyassessment process and the internalliquidity assessment process.
Comprehensive reporting onclimate risk exposures andconcentrationsis providedregularly to the MC and theBoD. Risk cultureMultiple training sessions conducted for business functions on how to identify and assess climate riskin the Group’s business
activities. 144|December 2024 EIB GroupRisk Management DisclosureReport
Methodologies and international standards on which the risk management framework is based Internal policies and frameworks of the Group used for identification and
management of climate and other environmental risks draw amongst other on standards such as the EU Taxonomy or the MDB Paris alignment framework. In terms of disclosure frameworkspublishing annual sustainability disclosure reports in accordance with
the international sustainability reporting standards such as the Global Reporting Initiative (GRI) standards, the Sustainability Accounting Standards Board (SASB) framework, as well as with the recommendations of the Task Force on Climate-related
Financial Disclosures (TCFD). 103, for many years, the EIB Group has been 103 For financial year 2024, the EIB Group will consolidate the disclosures included in these various reports in an enhanced Sustainability Report. With regard to the
management of the environmental impact of its internal business activities, the EIB Group has implemented an environmental management system in accordance with the European Eco-Management and Audit Scheme (EMAS), an internal voluntary environmental
management standard developed by the European Commission for organisations to evaluate, report and improve their environmental performance. Processes for the identification, monitoring and measurement of sensitive activities and exposures The EIB
has established procedures and screening tools to assess, manage and monitor climate change-related physical and transition risks at the level of its portfolio, counterparties and individual projects financed. Direct lending operations are subject
to the Climate Risk Assessment (CRA), a system designed to identify and assess the physical climate risk of the project. The goal is a bespoke business process fully integrated within the EIB’s technical due diligence of direct operations to ensure
the resilience of EIB-financed operations to climate hazard and identify appropriate adaptation measures. Moreover, counterparty climate risk is monitored for most of the activities of the Group on the basis of the Climate Risk Screening Tool
(CRST). The CRST was developed to assess consistently the exposure of EIBG’s counterparties104 to both physical and transition climate risk over the medium to longer term (five to ten years) as well as their mitigation/adaptation capacity. 104 When
appropriate, the CRST assesses counterparties of the Bank that are either “Head of Group” or standalone subsidiaries (that is, analysed on a stand-alone basis), in line with the current internal rating approach. Overall, the Group’s exposure to
physical risk is relatively low. In fact, in the short to medium term, physical risk is expected to have a low material impact on the Group’s risk profile. However, this risk is significant in the long term. Most of the Group’s high physical risk
exposure is concentrated in the public administration sector. This reflects the physical risk of countries outside the European Union, which tends to be higher than within the European Union. In the short to medium term, the Group’s portfolio will
be more sensitive to transition risk. The distribution of high transition risk exposure by sector shows that most of it is concentrated in oil and gas, regulated networks and air and maritime infrastructure and operations. Amongst the high transition
risk exposure sectors, the Group’s exposure to the oil and gas sector is now predominant, as the Group’s lending portfolio also covers operations predating the CBR and Paris Agreement, while the Group is supporting many counterparties in their
low-carbon transition by supporting Paris-aligned projects. The medium risk exposure is concentrated in the public administration and financial services sectors. Mitigation activities, commitments and exposures Climate and environmental risks are
taken into consideration throughout the assessment and monitoring of all projects. The Bank calculates and reports on the carbon footprint, in absolute and relative terms, for all directly

financed projects that have emissions above a defined threshold. In addition, an economic cost of carbon is incorporated into the accounting of environmental
externalities. Moreover, as already introduced in the section Policies and procedures relating to engagement with new or existing counterparties or operations, the Group has several project- or counterparty- related policies and procedures in place
to support its sustainability objectives and further mitigate associated environmental risk. In addition, the Group has exclusions in place for certain activities or sectors that are incompatible with the ethical, environmental and social principles
of its public policy goals105. From the credit risk perspective, the EIB Group has analysed its portfolio’s credit exposure to transition and physical risks based on the output of the internally developed CRST. 105 For an overview of the activities
that cannot benefit from the financing of the Group (“excluded activities”), including those unacceptable in climate and environmental terms, please refer to the EIB eligibility, excluded activities and excluded sectors list and the EIF Policy on
Exclusions and Restrictions available on the EIB and EIF website, respectively. As per the table below, climate change may affect, to different degrees, the various traditional banking risk categories that the Group is exposed to, with credit risk
considered to be one of the risk categories most affected by it.
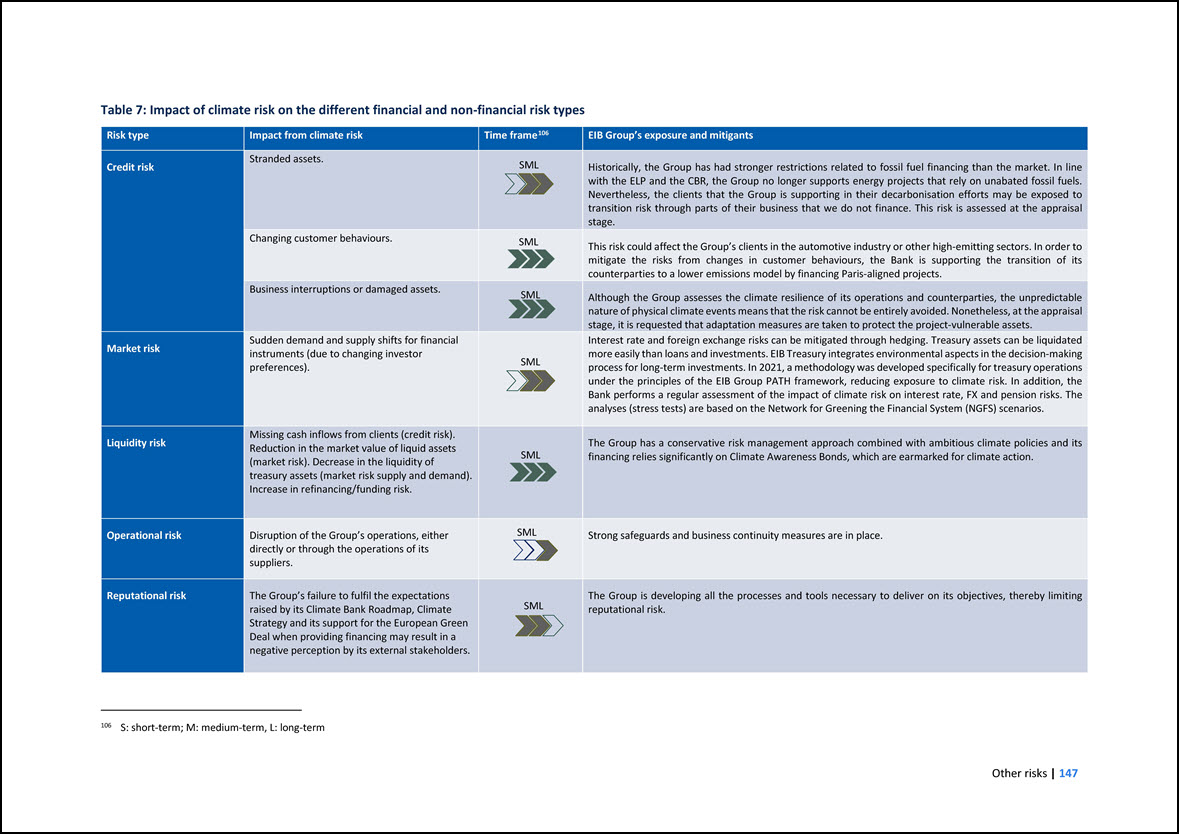
Table7: Impact of climate risk on thedifferent financial and non-financial risk types Risk type Impact from climate risk Time frame106 EIB Groupsexposureand mitigants
Credit risk Stranded assets. SML This risk could affect theGroup’sclients inthe automotiveindustry or other high-emitting sectors.In order tomitigate the risks from changes in customer behaviours, the Bank is supporting the transition of
itscounterpartiesto a lower emissionsmodel by financing Paris-aligned projects. SML Historically, the Group has had strongerrestrictionsrelatedto fossil fuel financing than themarket.In linewith theELP and the CBR,the Groupnolonger supportsenergy
projects that rely on unabated fossilfuels. Nevertheless, the clients thattheGroupissupporting in their decarbonisation efforts may be exposed totransition risk through parts of theirbusiness that we do not finance. This risk is assessed atthe
appraisalstage. Changing customer behaviours. Business interruptions or damaged assets. SML Although the Group assesses the climate resilience of its operations and counterparties, the unpredictablenature of physical climate events means that the
riskcannot be entirely avoided. Nonetheless, attheappraisalstage, it is requested that adaptationmeasures are takento protectthe project-vulnerable assets. Market risk Sudden demand and supply shifts forfinancialinstruments (dueto changing
investorpreferences). SML Interestrate and foreign exchange risks can be mitigated through hedging. Treasury assets can beliquidatedmore easily than loans andinvestments. EIB Treasury integrates environmental aspects inthe decision-making process for
long-term investments. In 2021, amethodology was developedspecifically for treasury operationsunder the principlesof the EIB Group PATH framework, reducing exposure to climate risk. In addition, theBank performs a regular assessment of the impact of
climate risk on interest rate, FX and pension risks. Theanalyses (stress tests) are based onthe Networkfor Greening the Financial System (NGFS)scenarios. Liquidity risk Operational risk Missing cash inflows from clients (credit risk). SML The Group
has a conservative risk managementapproach combined with ambitious climate policies and its Reduction in the market valueof liquid assets financing relies significantly on Climate Awareness Bonds, which are earmarked for climate action. (market
risk). Decrease in the liquidity oftreasury assets (market risk supply and demand). Increase in refinancing/funding risk. Disruption ofthe Group’s operations, either SML Strong safeguards and business continuity measures arein place. directly
orthrough the operations ofitssuppliers. Reputational risk The Group’s failureto fulfilthe expectations SML The Group is developing all the processes and tools necessary to deliveron its objectives, thereby limitingraised by its Climate Bank Roadmap,
Climate reputational risk. Strategy andits support forthe European GreenDeal when providing financing may result in anegativeperception by its external stakeholders. 106S: short-term; M: medium-term, L: long-term Other risks| 147
Risk management tools for identification, measurement and management of environmental risk The EIB Group has several standards, tools and processes that enable it to
identify climate risk, in both the lending and financing origination phase, as well as in the monitoring phase. The Group applies these climate risk assessment tools and processes at multiple levels: the financed operation (project/transaction level)
and the financed entity (counterparty level). Through the CBR, the Group has committed to further developing these tools and processes and to embedding the climate risk-related procedures and appetite in its overall risk management framework.
Assessment of climate risk at counterparty and portfolio level For assessing and managing climate-related risks at portfolio and counterparty level, the CRST is currently used for monitoring as well as internal and external reporting and
disclosures. It provides transparency on the EIB Group’s exposure to climate risk and enables informed decisions to be taken. The CRST was developed to assess consistently the exposure of EIBG’s counterparties (for the main credit segments of the
Group including the EIF’s intermediated equity and guarantee portfolios) to both physical and transition climate risk over the medium to longer term (five to ten years) as well as their mitigation/adaptation capacity. Starting from 2021, all
counterparties are scored using the screening tools at the appraisal stage. The output of the screening tools enables the EIBG to map (by credit segment, geography, credit rating and economic sector) and benchmark its counterparties107 according to
their climate risk exposure. The tool is used furthermore as a basis for climate risk reporting and sensitivity analyses. 107 Currently, the CRST covers approximately 90% of all EIB Group counterparties by volume of exposure. The CRST covering both
physical climate risks and transition risks has been developed for each of the EIB’s main credit segments to assess the climate risk for its counterparties rather than projects, as well as for the EIF’s indirect equity portfolio, guarantees and
securitisations. The methodology captures the physical risk, transition risk and the mitigation/adaptation capacity of each counterparty. It is based on internally developed country scores and industry scores (for both physical and transition risk)
as well as counterparty specific information. While the underlying assessment logic is consistent across all non-sovereign credit segments, tailored assessments are applied to corporates, financial institutions, public sector entities, sub-sovereign
public authorities, project finance and indirect equity to cover all counterparty types across the Group’s portfolios. Alongside the CRST, in 2020 the Group developed an in-house model for climate risk regional scores. The model aims to assess the
exposure of over 180 countries to physical risk and transition risk and the model is the result of in-depth research by EIB economists and builds on the most recent literature, combining various publicly available data sources. The scores are
adjusted by country experts (overrides) if necessary. The resulting climate risk country scores are then used for sovereign counterparties as the final risk scores, and for other counterparties as the country anchor scores for the screening tool. To
assess physical risk, indicators have been developed to capture the impact of acute risks and chronic risks. The model brings these indicators to a common scale (normalisation), allowing for them to be partially compensated against each other, and
selects the appropriate weights of the various climate risk dimensions based on the literature and econometric analysis.
Similarly, the Group has developed a methodology to derive climate risk scores for industries in order to appraise their exposure to transition and physical risk. This
methodology uses the Bank’s new risk sector classification, which includes 30 risk sectors and 65 sub-sectors. Within these sub-sectors, industry experts identified more granular industry segments that are exposed to the same transition risks. The
methodology is based on a mix of publicly available data and expert judgment. In view of the rapid developments in regulation, technology and market risk, the assessment is reviewed on a yearly basis. Both country and industry scores are combined
into an anchor score. Subsequently, adjusted for counterparty- specific risks, an inherent score is derived which once updated for the adaptation and mitigation capacity of the relevant counterparty results in the final CRST score. For the
assessment of the environmental risk, the Group considers the impact climate change will have on its financing activities across different time periods. Up to five years is considered to be short-term, from five to ten years is considered
medium-term, and more than ten years (until 2050) is considered long-term. Across these time horizons, climate change may affect, to different degrees, the various traditional banking risk categories to which the Group is exposed. In line with the
EIB Group Stress Testing Framework, the Group integrates external stress tests including the replication of ECB climate stress tests regularly into its Stress Testing Programme. This exercise enables the Group to test its capability and capacity to
perform supervisory climate stress tests and shows if the Group’s climate risk framework development is broadly in line with commercial banks. In 2024, the Group further developed capabilities to integrate climate risk stress testing as part of the
Group’s regular stress testing activities. Assessment of climate risk at project and exposure level At project/exposure level climate-related risks are assessed and managed through a due diligence process applied to all projects directly financed
by the Bank. This due diligence process is materialised through five sub- processes: • The application of the CRA to relevant projects helps to understand if and how the physical impact of climate change could affect a project’s performance over its
lifetime and whether appropriate adaptation measures have been taken into account. If the initial screening suggests a higher risk, the Bank performs a second screening using climate service tools based on climate projections and Geographic
Information System data to identify vulnerabilities at the location of a project. After the screening, if the project is associated with potential material physical climate risk, the EIB will engage with the client to obtain further information and
may decide to ask its client to conduct a climate risk and vulnerability assessment and develop adaptation solutions, where appropriate. At the end of the climate risk assessment process, the Bank estimates the residual physical climate risk level
for each project. The CRA also enables the EIB to monitor the portfolio of projects, improve the understanding of sector and geography-specific physical climate risks in its operations, and support its clients in managing physical climate risks,
where necessary. • Application of shadow cost of carbon: For greenhouse gas emissions, the EIB applies a shadow cost of carbon to assess the cost of saving or emitting a ton of carbon equivalent. • Economic appraisal: The markets do not fully
integrate environmental and social costs into product prices or investment decisions. This leaves it to the society to absorb the long-term external costs, such as carbon emissions or local air pollution. The aim of the EIB’s economic appraisal is to
assess whether the investment costs of the project are outweighed by the net benefits to society over its operating period. The inclusion of these externalities is an essential element in making that assessment. Based on the outcome of this
assessment, only projects that contribute positively to society are considered for EIB financing. • Implementation of environmental and social standards through the different components of the ESSF.
•Exclusion of incompatible activities or sectors108. Estimated impact on capital and liquidity risk profile With reference toimpactson capital, climate risk ispart of
the EIBGroup ICAAP process (see section 3.2)and duly considered in theinternalmateriality assessment process. Where relevant, outcomesfrom climate scenarioanalysesand stress tests arereflected in the documentation and considered for the conclusionsof
the annualICAAP process. Similarly, with reference to impact on the liquidityprofile of the institution,climate change and environmentalimpactsare reflected–where necessary–in theEIB Group ILAAP (see section 9.1). Sensitivity analyses are usedwhen
assessing climate risk materiality from a liquidity risk perspective. Data availability, quality and accuracy, and efforts to improve these aspects Processes anddata quality controls related to theGroup’sCA&ESassessmentand the CRAare
fullyintegratedintothe Group’s front office applications.Data lineage documentation, data quality control and business glossarydocumentation are incorporated throughout the data valuechain, from entry to extraction and reporting.Inthe
future,CA&ES and CRA data capturewillbe furtherenhanced to better align with CA&ES sub-objectives reporting requirements, and tosimplify CRA processes. The CRST processand related controlsare aligned withthe annual counterparty review
processof the Bank in terms of update of the scoresand division of responsibilities betweenthe first and second linesof defence andfullyintegrated into theEIB Group’scounterpartyIT applications. In2024,the Group contracted an external data
providertoenable the Group to collect additional external datato broaden thespectrum ofavailable metrics, functionalto bothexternaldisclosuresand internalprocessessubject to suitability tothe EIBG business model.The roll-out of these ESG metrics is
planned progressively overthe next years. In parallel, the Group isalsoworking to further increase the availability, granularity and quality of the ESG datanecessary for management of ESG risks and the development of a dedicated climate risk stress
testingframework. Over the medium term,the Group aims to establish a comprehensive ESG data strategy, seeking to integrate internal and external data sources as they become available.The EIBGroup is committed to robust sustainabilitydisclosures,
providing transparent reporting on ESG factors, in line with Pillar 3 requirements. With regard to the applicableEUsustainability disclosure framework, the Group has in place an ongoing initiativeto cover with BCBS 239 compliance all ESG data
enclosed in this report. The EIB Group is committed to robust sustainability disclosures, providing transparent reporting on ESG factors, in line with Pillar 3 requirements.Pending the availability of comprehensive ESG risk disclosures, use of
proxiesand estimations are used and disclosed transparently. Risk limits in place triggeringescalation and/or exclusion Further to the sectoral policy limits described previously, the EIBG has integrated climateand environmental riskconsiderations
into its Risk Appetite Framework through various non-financial risk (key) risk and monitoringindicators. Within the area of strategic risk as one of the most relevantnon-financialrisk(NFR)categories, the Group hasdefineda keyriskindicatorinrelation
to CA&ESwhich is tracked against corresponding limits. 108As per theEIB Eligibility, Excluded Activities and Excluded sectors list,the EIF Policy on Exclusions and Restrictions and theactivities not supported bythe EIB Groupas per the LCF.
Moreover, the EIB appliesthe aforementioned sector-specific policies. 150|December 2024 EIB GroupRisk Management DisclosureReport
In addition, for climate change and environmental risk concerning the non-financial risk indicators and monitoring indicators109 related to physical and transition
risk as well as natural disasters have been defined. 109 Monitoring indicators have neither limits nor triggers. 13.3.2 Qualitative information on social risk 13.3.2.1 Business strategy and processes Business strategy (including business
environment, business model and financial planning) The EIB Group’s Environmental and Social Policy (the “E&S Policy”) lays out the Group’s overarching vision that sustainable and inclusive development lies at the core of the Group’s values and
underpins all of its policies and activities. The CBR forms a key component of the EIB Group’s vision of how to achieve greater policy impact and notes the strategic importance of the EIB Group’s contributions to gender equality and women’s economic
empowerment, economic resilience, social cohesion, peace and stability and poverty reduction through various investments across regions and sectors. The Group recognises the interdependence of the different elements of the environment and their
interaction with human life and activities and acknowledges that pressures on the environment and social inequalities may jeopardise the viability of human activities. It therefore places a balanced integration of the environmental, social and
economic dimensions of sustainable and inclusive development at the heart of its activities. The EIBG also acknowledges the importance of a just and fair transition to an environmentally and socially sustainable future and aims to support economic
growth that fosters quality employment, promotes inclusion and human dignity, safeguards health and well-being, and provides decent living standards. The Group strives to support the transition to sustainable economies and communities that are
climate and disaster-resilient, low-carbon and more resource-efficient. The Group does so by financing operations that respect human rights, do not cause significant harm to the environment and are consistent with internationally agreed targets to
fight against climate change and biodiversity loss. In addition to ensuring that the projects it finances respect human rights, one of the ten key areas for action in which the Group contributes to the social components of sustainable and inclusive
development is the reduction of discrimination and the fostering of social inclusion. The Group’s 2024-2027 Strategic Roadmap sets out the intended results of its financing including for affected communities. These include reinforcing Europe’s
social infrastructure to deliver on education, skills development and training, health and energy-efficient housing, and improving the climate resilience of agricultural supply chains, to the benefit of workers and communities. Outside the European
Union, the Bank also works in support of multiple SDGs through high-impact investments, including in conflict-affected and fragile contexts to support Europe’s role in strengthening North-South dialogue and contributing to stability, peace, security
and prosperity throughout the world. A further strategic area for action is gender equality and women’s economic empowerment, for which the EIBG has a specific strategy and a Gender Action Plan in place. The Bank's Financing for Gender Equality
(F4GE) approach is used to identify opportunities to strengthen the contribution of EIB investments to women's economic empowerment and gender equality. Furthermore, the Bank works with clients to qualify relevant private sector transactions under
the 2X Challenge using the 2X criteria, the global standard for gender-lens investing. In 2024, the EIF launched its Gender Smart Equity Investment Programme to promote gender diversity
in the venture capital and private equity ecosystems by empowering women in leadership positions The programme also intends to raise awareness of the gender gap and
facilitate the exchange of knowledge, experience and best practices between Member States. 110. 110 Under the programme, a financial intermediary is considered to adhere to the gender criteria if it satisfies at least one of the following: (i) female
partners make up at least one-third of its management team, (ii) women represent at least 40% of its senior investment team, or (iii) women represent at least 40% of its investment committee. Moreover, the EIB Group Operational Plan describes
different social priority areas for EIB cohesion lending such as physical and digital connectivity, energy efficiency and renewable energy deployment, especially in high- potential less developed and transition regions, education and training to
develop necessary skills for EU industries, and investment in affordable and sustainable housing. The mid-term review of the EIB Group Cohesion Orientation concluded that the framework remains fit for purpose and that the Group is on track to meet
its increased ambition to support cohesion in the European Union, including an increasing share of financing in ‘Less Developed Regions’. The review showed that cohesion regions lead in terms of the share of climate action and environmental
sustainability. It also highlighted the importance of continuing to support innovation in cohesion regions, with increased support for small businesses and mid-caps. The Bank offers dedicated internal training sessions to raise awareness about
social risks in EIB financed projects (for example, on gender-based violence and harassment (GBVH) risks, on human rights or on enhancing stakeholder engagement in EIB operations). Additionally, all staff within the Group have access to multiple
training sessions aiming to raise awareness on social issues affecting EIB Group staff (such as on tackling unconscious bias or harassment). Objectives, targets and limits and performance assessment against those With regard to social
considerations, the Group’s sustainable finance operating model is articulated around the following objectives: • Mainstreaming social considerations into its decision-making processes, among others by supporting a wide range of public policy goals
while incorporating social risks into the Group’s Risk Management Framework, as appropriate. • when feasible and needed, to support counterparties in planning, designing and implementing socially sustainable operations, including for the application
of the Group’s social requirements. • Financing and seeking to mobilise additional resources for operations that contribute to social sustainability objectives. The Group has a special focus on meeting key EU policy priorities, addressing market
failures and sub-optimal investment situations, and tackling gaps in social equity. The Group will continue to direct its financing towards EU policy objectives, such as innovation and sustainable infrastructure. Orientations and targets111 for the
Group’s public policy goals (“PPGs”) and for EU economic, social and territorial cohesion are included in the Group Operational Plan. 111 For the latest orientations and targets together with their breakdown between the EIB and the EIF, please refer
to the EIB Group Operational Plan 2025-2027 available on the EIB website. The Group’s EU economic, social and territorial cohesion (sub)targets have been derived from the EIB Cohesion Orientation Policy approved in 2021 aiming to reach 45% of total
EU-27 lending and 23% of total EU-27 lending to less developed regions by 2025. In terms of social limits, to be eligible for EIB financing, an operation must (i) meet one of its primary public policy goals and (ii) not constitute an activity
excluded from the overall strategic direction of the Bank. Therefore, all of the projects the EIB finances contribute to one or more of the above public policy goals which seek to ensure that projects contribute to the EIB’s statutory mission to
pursue EU priorities and objectives.
Activities not consistent with one of the Bank’s primary public policy goals do not qualify as eligible for EIB investment. Moreover, projects that result in limiting
people’s individual rights and freedom, or violation of human rights, cannot benefit from EIBG financing112. 112 For more details on the activities excluded from EIB financing due to their social impacts, please refer to the EIB eligibility,
excluded activities and excluded sectors list available on the EIB website. With regard to the linkages of the social objectives, targets and limits to the SDG objectives, please refer to the contribution to the SDGs described in section 13.3.1.1.
Policies and procedures relating to new operations The EIBG does not have a standalone human rights policy. Rather, as explained in the published Approach to Human Rightsseveral policies and procedures to support its social objectives, embed human
rights commitments and mitigate associated risks at project or operation level. 113, it integrates a human rights approach across 113 A more detailed information note on the EIB’s approach to human rights is available on the EIB website. As
mentioned in Section 13.3.1.1, the ESSF governs the assessment and management of social impacts and risks throughout financed operations. More specifically and in line with its E&S Policy, the Group shall not, to the best of its knowledge,
finance directly or indirectly projects where EIB Group financing is used for activities included on its exclusion list or that (i) do not comply with the relevant national social legal requirements and country obligations under relevant
international treaties; or (ii) are not in line with the requirements of the policy. Furthermore, the EIB shall not, to the best of its knowledge, finance projects that have the effect of limiting people’s individual and collective rights and
freedoms or violating their human rights. The Bank’s E&S Standards, which explicitly refer to EU and international human rights law, apply to all EIB operations and promote an integrated approach to impact assessment and risk management by
ensuring that amongst others, social and human rights considerations are addressed and considered in the decision-making processes. The Standards seek alignment with the policy objectives enshrined in several key reference documents issued and/or
endorsed by the European Union, whereby respect for human rights is regarded as central to the EIB’s understanding of the social sphere and its social due diligence obligations. Among the E&S Standards, standard 8 concerns labour rights114, and
standard 9 concerns health, safety and security. 114 The standard ensures that the projects comply with the principles of the International Labour Organization (ILO). The Bank has zero tolerance for forced and child labour. In order to strengthen
its social sustainability, each EIB-financed project is subject to social due diligence and monitoring. The actual scope of the due diligence and monitoring is proportionate to the nature and scale of the project and the likely significance of its
impacts and risks. Such impacts and risks are screened and assessed against its E&S Standards, which in turn are grounded in human rights principles. The process is guided by considerations of likelihood, frequency and severity of human rights
impacts, thereby ordering the prioritisation of mitigation measures. One of the factors that is considered in determining the scope of the social due diligence is the capacity and commitment of the promoter to implement the project in accordance with
the Group’s E&S Policy. The Standards define more in detail the requirements that the EIB’s counterparties must meet when assessing and managing, among others, social impacts and risks throughout EIB-financed projects. More specifically, the Bank
requires promoters to meet their human rights responsibilities by considering human rights as part of their social due diligence. To this end, promoters must comply with the relevant provisions of the E&S Standards, which provide a framework for
promoters for the identification, assessment, prevention, mitigation
and, where necessary, remediation, of adverse human rights impacts. Through the application of the standards, the EIB requires its promoters to include any significant
impacts on human rights in the ESIA. The procedures relating to new operations are outlined in the section Processes for the identification, monitoring and measurement of sensitive activities and exposures below. 13.3.2.2 Governance
Responsibilities of the management body At project/operation level: As for the environmental objects, the Board of Directors is responsible for approving the Group Operational Plan (OP), financial transactions (including operations supporting
social cohesion objectives), social-related policies and strategic documents with relevance for social risk. Moreover, the EIB’s Lending Delegation Framework, approved in 2023, determines the level of approval of a project (that is whether it must
be approved by the Board of Directors or whether it can be delegated to the Management Committee), based inter alia on an assessment of a project’s risks, including social risks. To support an informed decision-making process, the outcomes of the
EIB’s risk-based social appraisal as well as the appropriate monitoring requirements, where applicable, are included in the documentation that is further submitted to the EIB’s Governing Bodies for approval. Likewise, the EIF’s Board of Directors
approves the EIF’s annual corporate operational plan and the thematic policy objectives, key performance indicator and targets, including those pertaining to social matters. At internal operation level Internally, the management bodies are
responsible for the EIB’s own employee relationship and labour standards together with the approval of related policies. The EIBG management bodies place a strong emphasis on promoting a fair, inclusive, and supportive work environment and maintain a
strong focus on diversity, equity, and inclusion, ensuring that its workforce reflects a wide range of backgrounds and perspectives. It encourages initiatives that enhance employee engagement, such as comprehensive well-being programmes and ongoing
professional development opportunities. The EIBG’s recruitment and promotion processes are built on merit-based principles, ensuring fairness, equal opportunities, and adherence to the highest standards of integrity. The Group promotes diversity at
all levels and offers comprehensive training and development programmes to support continuous professional growth and developing skills that are critical for the EIBG’s strategy, key jobs and learning culture. These initiatives include targeted
efforts to improve gender balance and increase representation of underrepresented groups in leadership roles. By investing in employee development and fostering an inclusive culture, the EIBG aligns its human resources policies with its broader ESG
commitments, contributing to a resilient, responsible and forward-looking workforce. Risk management governance and practices, including roles, tasks allocation and feedback system Members of the Management Committee, the permanent collegiate
executive body of the Bank, consisting of a President and eight Vice-Presidents, are allocated different areas of oversight including economic, environmental and social topics. Screening of counterparties at the onboarding stage and as part of
continuous monitoring is the responsibility of, respectively, the Operations Directorate, the EIB Global Directorate and the Portfolio Management and Monitoring Directorate. The main responsibility for assessing, managing and monitoring the social
aspects of projects lies with the Bank’s Projects Directorate, which is composed of engineers and economists as well as
social specialists. Within the Projects directorate, the Environment, Climate and Social Office (“ECSO”) is the division responsible for (among others) policy
development in the area of social issues within the Bank. ECSO — in coordination with relevant services across the Bank and broader stakeholders — led the 2021-2022 review of the ESSF which included the process for drafting the EIB Group E&S
Policy, as well as the update of the EIB E&S Standards. At an operational level, individual EIB project teams are responsible for ensuring that projects to be financed are structured to comply with the ESSF. Where required, they can draw upon
the support of a social specialist. Lines and frequency of reporting The Environmental and Social Data Sheet (ESDS) is prepared for every operation assessed by the Project Directorate and aims to summarise amongst other the social risks and
mitigants for an operation. Any ESDS is reported to the Board of Directors and published on the EIB website and in case of infrastructure funds on the EIF website. Any member of the public can address complaints to the EIB Group Complaints Mechanism
alleging maladministration by the EIB Group. Outside the European Union, the EIB requires promoters to inform key stakeholders in the projects it finances, including local communities affected, about the existence and mandate of project-level
grievance mechanisms and about the Complaints Mechanism. The Complaints Mechanism may support the resolution of complaints through dispute resolution between the promoter and the complainant. It can also perform a compliance review of alleged
breaches of E&S standards to determine whether there was maladministration by the EIB Group. In such a case, the Complaints Mechanism can make recommendations to the Group to remedy the situation. The Complaints Mechanism publishes the EIB Group
Complaints Mechanism Annual Report. Every year, the Management Committee approves the Sustainability Report which contains a dedicated chapter on social information and the EIB Board of Directors is provided with the report for information. Within
the EIB, under the General Secretariat, the Sustainability Division is responsible for sustainability disclosures (including those related to social matters) and is one of the three divisions of the Regulation, Governance and Corporate
Responsibilities Department. Alignment of the remuneration policy in line with risk objectives The short-term targets of the Group are integrated into the remuneration framework of the EIB and the EIF. The performance of the two institutions, in
relation to new signatures supporting the Economic and Social Cohesion and Convergence policy goals and other PPGs, directly impact the size of the variable component of EIBG’s staff remuneration, with a cumulative weight of 30% (of which 10% are
related to each of the Economic and Social Cohesion and Convergence policy goals). More information on the variable remuneration budget can be found in the “Remuneration” section of this report. 13.3.2.3 Risk management Methodologies and
international standards of the risk framework The EIB Group is the only development finance institution bound by the Charter of Fundamental Rights of the European Union. It is also guided by international human rights principles and standards115 and
complies with other EU legislation, such as the EU Global Human Rights Sanctions Regime. 115 For more details on the main international human rights laws, principles and standards standards followed by the EIB Group, please refer to the EIBs
approach to human rights.
The E&S Standards that the EIB has adopted are based on the EU legal framework, that outline the promoter’s responsibilities in developing and implementing
projects. Central to the Standards is the use of an impact assessment as a forward-looking instrument to analyse in an integrated manner amongst others the social impacts and risks and to apply the mitigation hierarchy and international good
practice. They seek alignment with the policy objectives enshrined in several key reference documents issued and/or endorsed by the European Union, whereby respect for human rights is regarded as central to the EIB’s understanding of the social
sphere and its social due diligence obligations. As specified in EIB Group E&S Policy, the EIB expects its promoters to meet their respective human rights duties and responsibilities, in line with the United Nations Guiding Principles on Business
and Human Rights. The Standards define the requirements that the EIB’s project promoters must meet when assessing and managing, amongst other, social impacts and risks throughout EIB-financed projects. More specifically, the Bank requires promoters
to meet their human rights responsibilities by considering human rights as part of their social due diligence. To this end, promoters must comply with the relevant provisions of the E&S Standards, which provide a framework for promoters for the
identification, assessment, prevention, mitigation and, where necessary, remediation, of adverse human rights impacts. The aforementioned internal policy and standards require that all projects located in the European Union and EFTA (European Free
Trade Association), Candidate and potential Candidate countries shall comply with the applicable national and EU legislation. Those projects, which are likely to have significant effects on the environment, human health and well-being, shall be
subject to an assessment according to the Environmental Impact Assessment (EIA) Directive. While assessing and managing the environmental impacts at project level, any relevant information obtained or conclusions arrived at pursuant to the
application of the Strategic Environmental Assessment (SEA) Directive, whenever relevant, should also be taken into account in the assessment process. This assessment may be coordinated with and/or complemented by any applicable requirements and/or
one or more of the following assessments: • Arising simultaneously from applicable EU legislation: the Appropriate Assessment under the Habitats and Birds Directives, assessments under the Water Framework Directive and the Marine Strategy Framework
Directive and/or, • Pertaining to specific topics that may require particular attention: biodiversity and ecosystem services, climate change, cultural heritage, social impacts, as relevant and if deemed necessary by the EIB. All projects located in
the rest of the world shall comply with the applicable national legislation and with the core principles and essential procedural elements laid down by the EU legislation that the EIB considers relevant to the assessment and management of
environmental, climate and/or social impacts and risks, particularly those contained in the EIA Directive. The EIF's ESG Questionnaire for financial intermediaries includes a question about whether the financial intermediary uses any internationally
recognised ESG-related framework or standard, including the UN Guiding Principles on Business and Human Rights. Processes for the identification, monitoring and measurement of sensitive activities and exposures In order to strengthen its social
sustainability, each EIB-financed project and all regions in which the EIB operates are subject to social due diligence and monitoring. In that respect, the application of the EIB’s E&S Standards is determined based on a risk-based approach.
Projects likely to have a significant effect on the environment, human health and well-being, or human rights must go through an environmental and social impact assessment (ESIA). The ESIA encompasses public
consultation and stakeholder engagement, including local communities, in line with the EIB Standard on Stakeholder Engagement. The assessment of any social aspects is
fully embedded in this process and should include considerations of potential human rights risks. The actual scope of the ESIA is proportionate to the nature and scale of the project and the likely significance of its impacts and risks. Such impacts
and risks are screened and assessed against its E&S Standards, which in turn are grounded in human rights principles. The process is guided by considerations of likelihood, frequency and severity of human rights impacts, thereby ordering the
prioritisation of mitigation measures. One of the factors that is considered in determining the scope of the social due diligence is the capacity and commitment of the promoter to implement the project in accordance with the Group’s E&S Policy.
Mitigation activities, commitments and exposures The EIB Group has embedded effective access to a remedy in its ESSF. It requires project promoters to identify impacts, address them and provide a remedy when harm occurs. If deemed necessary by the
EIB, based on the nature of the project, the country context, and the significance of the risks and impacts, the promoter might be required to carry out a standalone Human Rights Impact Assessment (HRIA) and/or other supplementary assessments (like
health or gender impact assessments, labour audits, or Indigenous Peoples Development Plans). This integrated approach is aligned with the United Nations Guiding Principles on Business and Human Rights (UNGPs) expectation to undertake a human
rights-responsive due diligence process. For intermediate financing, the social risk measure applied by EIB is that the Financial Intermediary (“FI”) shall have in place a process for identifying, assessing, managing and monitoring social impacts
and risks. This process may include relevant policies and procedures that shall be commensurate to i) the FI’s size and nature of business and ii) to the sub-projects’ size, nature, socioeconomic context, location and sector sensitivity to social
impacts and risks. Such a process can either be distinct from or integrated in any existing systems operating within the FI, such as the FI’s regular credit/investment processes. To this end, the EIB expects its promoters to meet their respective
human rights duties and responsibilities in line with the United Nations Guiding Principles on Business and Human Rights. The assessment of any social aspects is fully embedded in this process and requires the promoters to include any significant
impacts of potential human rights risks. In case of direct lending where the sub-projects/underlying investments of a project are not known at the time of the EIB’s decision to invest, the mitigant to social risk is that (i) the EIB needs to assess
the project based on the impacts and risks inherent to the particular sector and the context of the business activity; and (ii) assesses the promoter’s capacity and commitment to manage the impacts and risks in accordance with this Policy. These
assessments may lead to specific conditions in the legal documentation signed with the EIB to ensure compliance with the E&S Standards. Risk management tools The EIB project team carries out environmental, social and climate due diligence,
including, where applicable, due diligence on the promoter’s capacity to implement a project in line with the Bank’s Standards. The Bank’s E&S Standards require promoters to ensure that rights-holders and project-affected communities have had
access to meaningful stakeholder engagement and have access to effective means to raise grievances and/or concerns on social matters in connection with the project being supported by the EIB. The Bank is moreover using a country risk scoring
methodology, made up of different indicators that factor in human rights concerns and that calculates the country risk during the due diligence process. In addition, adverse
information, including in relation to human rights concerns, may be incorporated in an assessment as and when it is identified. Risk limits in place triggering
escalation and/or exclusion In particular, in relation to EIB-financed projects, the Bank shall not tolerate any: i) forced evictions; ii) gender- based violence and harassment; and, iii) action that amounts to retaliation and harassment. It takes
instances of intimidation or reprisals seriously and takes follow-up actions as and where appropriate. In addition to the excluded activities which significantly harm social objectives in line with the Group’s business strategy, the EIB is prevented
from engaging with entities and individuals that have participated in prohibited conduct. Accordingly, the EIB can suspend on a temporary or permanent basis counterparties from participating in EIB projects, including being awarded a contract under
any project, being on-lent the proceeds of any loan made by the Bank, or entering into any relationship with the Bank. Similarly, projects which result in limiting human rights, such as prisons and detention centres of any form (such as correctional
institutions or police stations with detention facilities) or any activities which are known directly or indirectly to result in harmful or exploitative forms of forced labour or harmful child labour, cannot benefit from the support of the EIF under
an EIF operation116. 116 For the EIB, specific exclusion measures are foreseen and described more in detail in the European Investment Bank Exclusion Policy available on the EIB website while for the EIF the details of the excluded and restricted
activities can be found in the EIF Policy on Exclusions and Restrictions available on the EIF website. 13.3.3 Qualitative information on governance risk Governance EIBG assesses the management practices and the corporate governance of its
prospective and existing corporate, financial institution and public sector clients as a qualitative variable of its internal credit rating models. The Governance and Management module of these models assesses, in particular, the existence of
transparent and strong corporate governance with sufficient independence and good oversight and the regular publication of reports audited by reputable firms. This assessment feeds into the internal credit rating of the counterparty. The assessment
is based on standardised questions and guidance focusing on the following aspects: quality of management, quality of the strategy for corporates and financial institutions, quality of corporate governance, quality of financial reporting and
information disclosure. For financial institutions, the internal credit rating module on Governance and Management has a section on the risk management framework. As part of the scoring of prospective and existing equity-type investments, EIBG
assesses the counterparty’s business strategy, its governance arrangements, its management’s professional experience, capabilities and integrity, and the adequacy and transparency of its financial reporting. For indirect equity investments, the
assessment covers the fund management and encompasses the experience of the management team, its competencies, its integrity and reputation, as well as the governance arrangements of the fund management, including the presence of conflicts of
interest and the decision-making processes. As part of the customer due diligence process and in the context of periodic compliance reviews, EIBG monitors and manages the presence of other reputational and integrity risk factors associated to each
client, that may

stem from environmental, social and governance issues, among others, including those that may be related to the governance performance of the counterparts. Any
detected issue is assessed and addressed according to a standard process. This enables EIBG to put in place specific (contractual) safeguards or monitoring actions if and when needed.
13.3.4 Quantitative disclosures The below set of templates has been prepared pursuant to Article 449a of the CRR and the related European Commission Implementing
Regulation. Many of the quantifications provided in this section present uncertainty and high dependence on the assumptions, data source and tools used for deriving the assessment or their proxies. The methodology used to identify – and thus report –
climate-related data are expected to evolve in the coming years with the availability of additional data and evolution of assessment methodologies. EU ESG 1: Banking book – Climate change transition risk: Credit quality of exposures by sector,
emissions and residual maturity This template presents a breakdown of the EIB Group’s non-financial corporation portfolio outstanding at end-2024 presenting details for sectors that highly contribute to climate change by counterparty NACE sector.
The identification in column b) of exposures towards companies excluded from benchmarks aligned with the Paris Agreement is based on the criteria set out in the applicable regulationdata available from third party service provider with sectorial
information (NACE classifications). The “Do no Significant Harm” criteria are currently not assessed by the Group for the purpose of this template. 117 and leveraging 117 Accordingly, all companies shall be excluded based on the criteria specified
in sections d) through g) of Article 12.1 or in Article 12.2 of Commission Delegated Regulation (EU) 2020/1818, that is, if • 1% or more of their revenues derive from exploration, mining, extraction, distribution or refining of hard coal and
lignite. • 10% or more of their revenues derive from the exploration, extraction, distribution or refining of oil fuels. • 50% or more of their revenues derive from the exploration, extraction, manufacturing or distribution of gaseous fuels. • At
least 50% of its revenue comes from electricity generation with a greenhouse gas emission intensity of more than 100g CO2 equivalent/kWh or if their activities are violating the “Do no Significant Harm” principle. Columns i) to k) present the
internal assessment of financed GHG emissions. For loans and loan substitutes, this assessment is based on a project-based assessment guided by the Greenhouse Gas Protocol Corporate Value Chain (Scope 3) standard and the Global GHG Accounting and
Reporting Standard for the financial industry developed by the Partnership for Carbon Accounting Financials (PCAF). The assessed portfolio covers the majority of EIB financing to non-financial corporations and is either based on direct project carbon
footprint assessments (physical activity-based) or via modelled estimations based on the economic activities of projects. The assessment covers a limited share of a project’s scope 3 emissions. For the bonds’ portfolio, the GHG financed emissions
have been derived using counterparty data from a third party service provider. Amounts are in EUR million unless otherwise indicated.
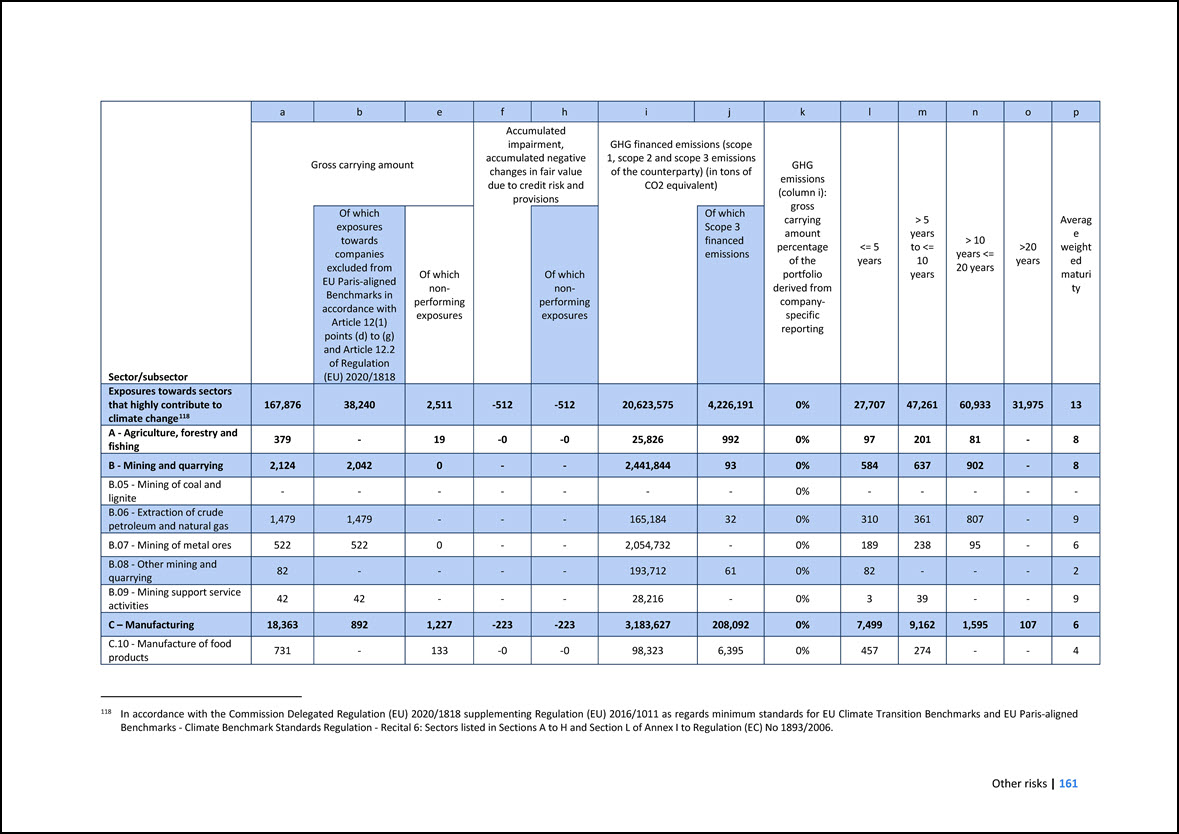
Sector/subsector a b e f h i j k l m n o p Gross carrying amount Accumulated impairment, accumulated negative changes in fair value due to credit risk
and provisions GHG financed emissions (scope 1, scope 2 and scope 3 emissions of the counterparty) (in tons of CO2 equivalent) GHG emissions (column i): gross carrying amount percentage of the portfolio derived from company- specific reporting
<= 5 years > 5 years to <= 10 years > 10 years <= 20 years >20 years Average weighted maturity Of which exposures towards companies excluded from EU Paris-aligned Benchmarks in accordance with Article 12(1) points (d) to (g)
and Article 12.2 of Regulation (EU) 2020/1818 Of which non- performing exposures Of which non- performing exposures Of which Scope 3 financed emissions Exposures towards sectors that highly contribute to climate change118 167,876 38,240
2,511 -512 -512 20,623,575 4,226,191 0% 27,707 47,261 60,933 31,975 13 A - Agriculture, forestry and fishing 379 - 19 -0 -0 25,826 992 0% 97 201 81 - 8 B - Mining and quarrying 2,124 2,042 0 - - 2,441,844 93 0% 584
637 902 - 8 B.05 - Mining of coal and lignite - - - - - - - 0% - - - - - B.06 - Extraction of crude petroleum and natural gas 1,479 1,479 - - - 165,184 32 0% 310 361 807 - 9 B.07 - Mining of metal ores 522 522 0 -
- 2,054,732 - 0% 189 238 95 - 6 B.08 - Other mining and quarrying 82 - - - - 193,712 61 0% 82 - - - 2 B.09 - Mining support service activities 42 42 - - - 28,216 - 0% 3 39 - - 9 C – Manufacturing 18,363 892
1,227 -223 -223 3,183,627 208,092 0% 7,499 9,162 1,595 107 6 C.10 - Manufacture of food products 731 - 133 -0 -0 98,323 6,395 0% 457 274 - - 4 118 In accordance with the Commission Delegated Regulation (EU) 2020/1818
supplementing Regulation (EU) 2016/1011 as regards minimum standards for EU Climate Transition Benchmarks and EU Paris-aligned Benchmarks - Climate Benchmark Standards Regulation - Recital 6: Sectors listed in Sections A to H and Section L of Annex I
to Regulation (EC) No 1893/2006.
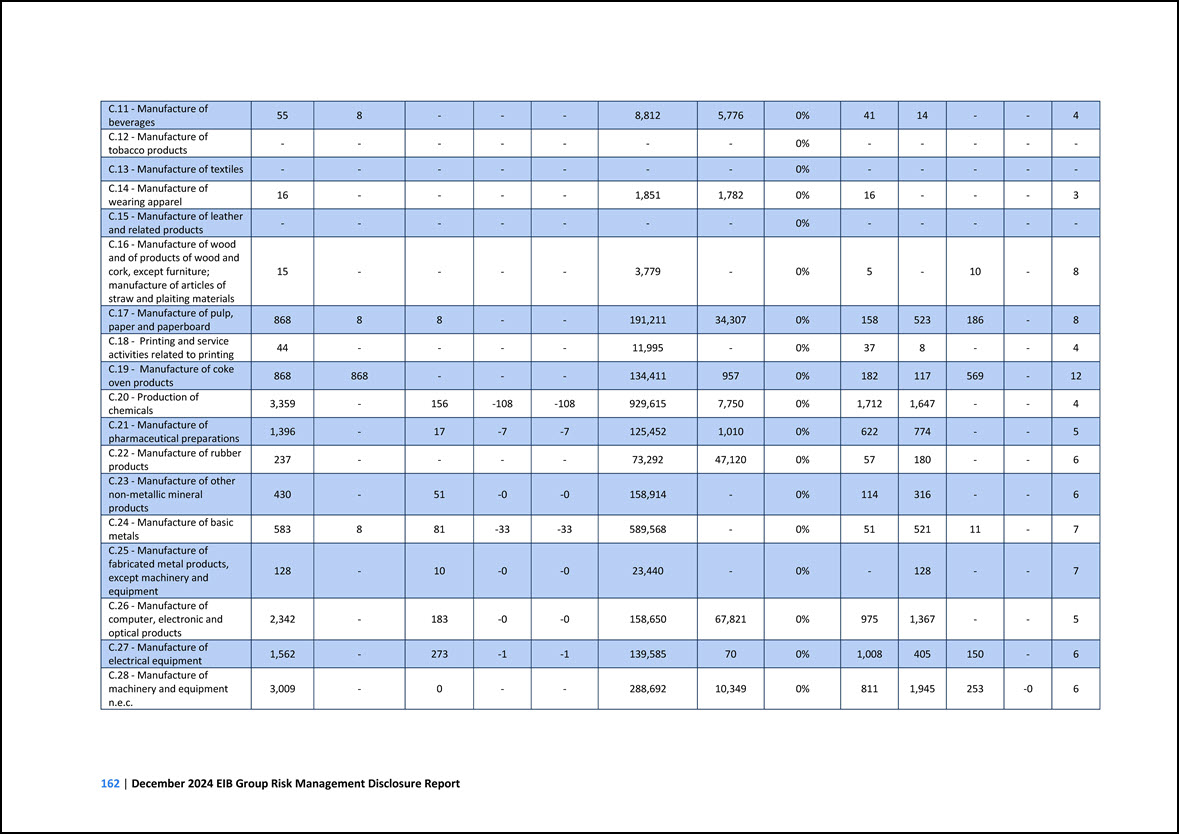
C.11 - Manufacture of beverages 55 8 - - - 8,812 5,776 0% 41 14 - - 4 C.12 - Manufacture of tobacco products - - - - - - - 0% - - - - -
C.13 - Manufacture of textiles - - - - - - - 0% - - - - - C.14 - Manufacture of wearing apparel 16 - - - - 1,851 1,782 0% 16 - - - 3 C.15 - Manufacture of leather and related products - - - - - - - 0% - - - -
- C.16 - Manufacture of wood and of products of wood and cork, except furniture; manufacture of articles of straw and plaiting materials 15 - - - - 3,779 - 0% 5 - 10 - 8 C.17 - Manufacture of pulp, paper and paperboard 868 8 8 -
- 191,211 34,307 0% 158 523 186 - 8 C.18 - Printing and service activities related to printing 44 - - - - 11,995 - 0% 37 8 - - 4 C.19 - Manufacture of coke oven products 868 868 - - - 134,411 957 0% 182 117 569 -
12 C.20 - Production of chemicals 3,359 - 156 -108 -108 929,615 7,750 0% 1,712 1,647 - - 4 C.21 - Manufacture of pharmaceutical preparations 1,396 - 17 -7 -7 125,452 1,010 0% 622 774 - - 5 C.22 - Manufacture of rubber
products 237 - - - - 73,292 47,120 0% 57 180 - - 6 C.23 - Manufacture of other non-metallic mineral products 430 - 51 -0 -0 158,914 - 0% 114 316 - - 6 C.24 - Manufacture of basic metals 583 8 81 -33 -33 589,568 -
0% 51 521 11 - 7 C.25 - Manufacture of fabricated metal products, except machinery and equipment 128 - 10 -0 -0 23,440 - 0% - 128 - - 7 C.26 - Manufacture of computer, electronic and optical products 2,342 - 183 -0 -0
158,650 67,821 0% 975 1,367 - - 5 C.27 - Manufacture of electrical equipment 1,562 - 273 -1 -1 139,585 70 0% 1,008 405 150 - 6 C.28 - Manufacture of machinery and equipment n.e.c. 3,009 - 0 - - 288,692 10,349 0% 811
1,945 253 -0 6
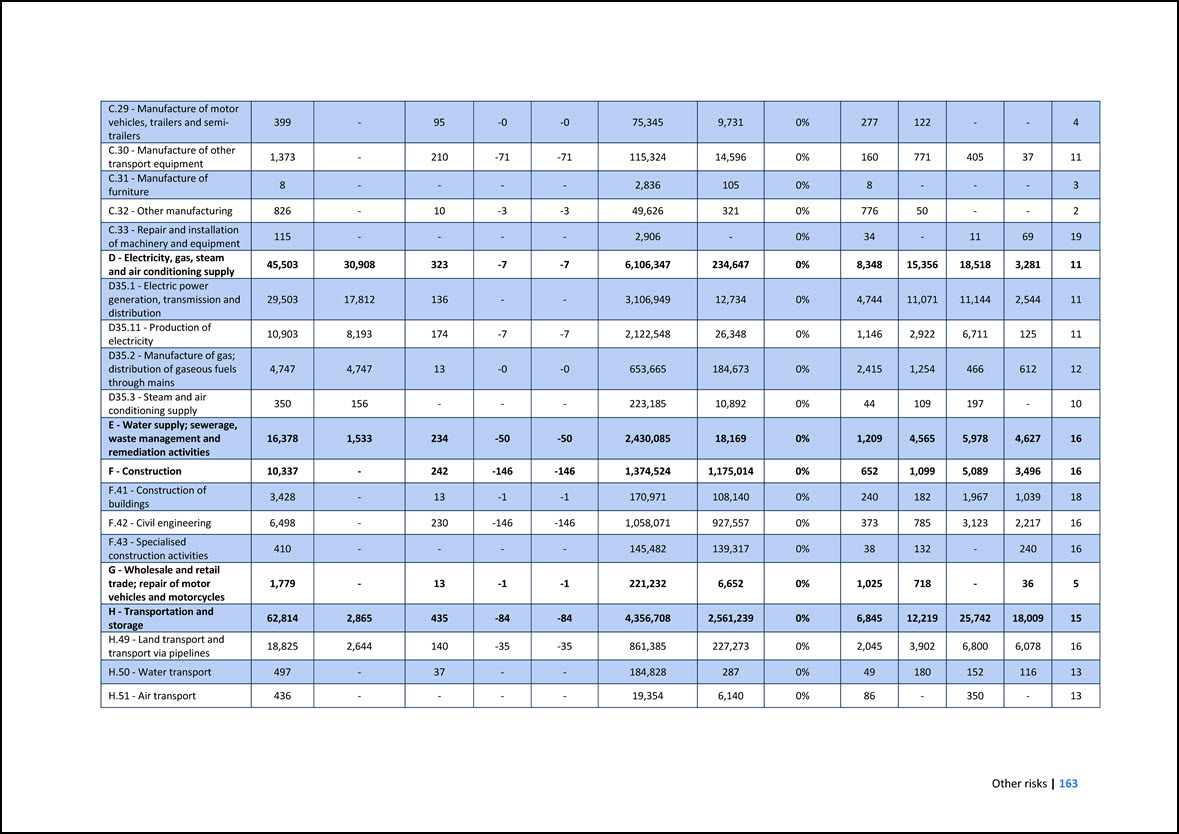
C.29 - Manufacture of motor vehicles, trailers and semi- trailers 399 - 95 -0 -0 75,345 9,731 0% 277 122 - - 4 C.30 - Manufacture of other transport
equipment 1,373 - 210 -71 -71 115,324 14,596 0% 160 771 405 37 11 C.31 - Manufacture of furniture 8 - - - - 2,836 105 0% 8 - - - 3 C.32 - Other manufacturing 826 - 10 -3 -3 49,626 321 0% 776 50 - - 2 C.33 -
Repair and installation of machinery and equipment 115 - - - - 2,906 - 0% 34 - 11 69 19 D - Electricity, gas, steam and air conditioning supply 45,503 30,908 323 -7 -7 6,106,347 234,647 0% 8,348 15,356 18,518 3,281 11
D35.1 - Electric power generation, transmission and distribution 29,503 17,812 136 - - 3,106,949 12,734 0% 4,744 11,071 11,144 2,544 11 D35.11 - Production of electricity 10,903 8,193 174 -7 -7 2,122,548 26,348 0% 1,146 2,922
6,711 125 11 D35.2 - Manufacture of gas; distribution of gaseous fuels through mains 4,747 4,747 13 -0 -0 653,665 184,673 0% 2,415 1,254 466 612 12 D35.3 - Steam and air conditioning supply 350 156 - - - 223,185 10,892 0%
44 109 197 - 10 E - Water supply; sewerage, waste management and remediation activities 16,378 1,533 234 -50 -50 2,430,085 18,169 0% 1,209 4,565 5,978 4,627 16 F - Construction 10,337 - 242 -146 -146 1,374,524 1,175,014 0%
652 1,099 5,089 3,496 16 F.41 - Construction of buildings 3,428 - 13 -1 -1 170,971 108,140 0% 240 182 1,967 1,039 18 F.42 - Civil engineering 6,498 - 230 -146 -146 1,058,071 927,557 0% 373 785 3,123 2,217 16 F.43 -
Specialised construction activities 410 - - - - 145,482 139,317 0% 38 132 - 240 16 G - Wholesale and retail trade; repair of motor vehicles and motorcycles 1,779 - 13 -1 -1 221,232 6,652 0% 1,025 718 - 36 5 H -
Transportation and storage 62,814 2,865 435 -84 -84 4,356,708 2,561,239 0% 6,845 12,219 25,742 18,009 15 H.49 - Land transport and transport via pipelines 18,825 2,644 140 -35 -35 861,385 227,273 0% 2,045 3,902 6,800 6,078
16 H.50 - Water transport 497 - 37 - - 184,828 287 0% 49 180 152 116 13 H.51 - Air transport 436 - - - - 19,354 6,140 0% 86 - 350 - 13
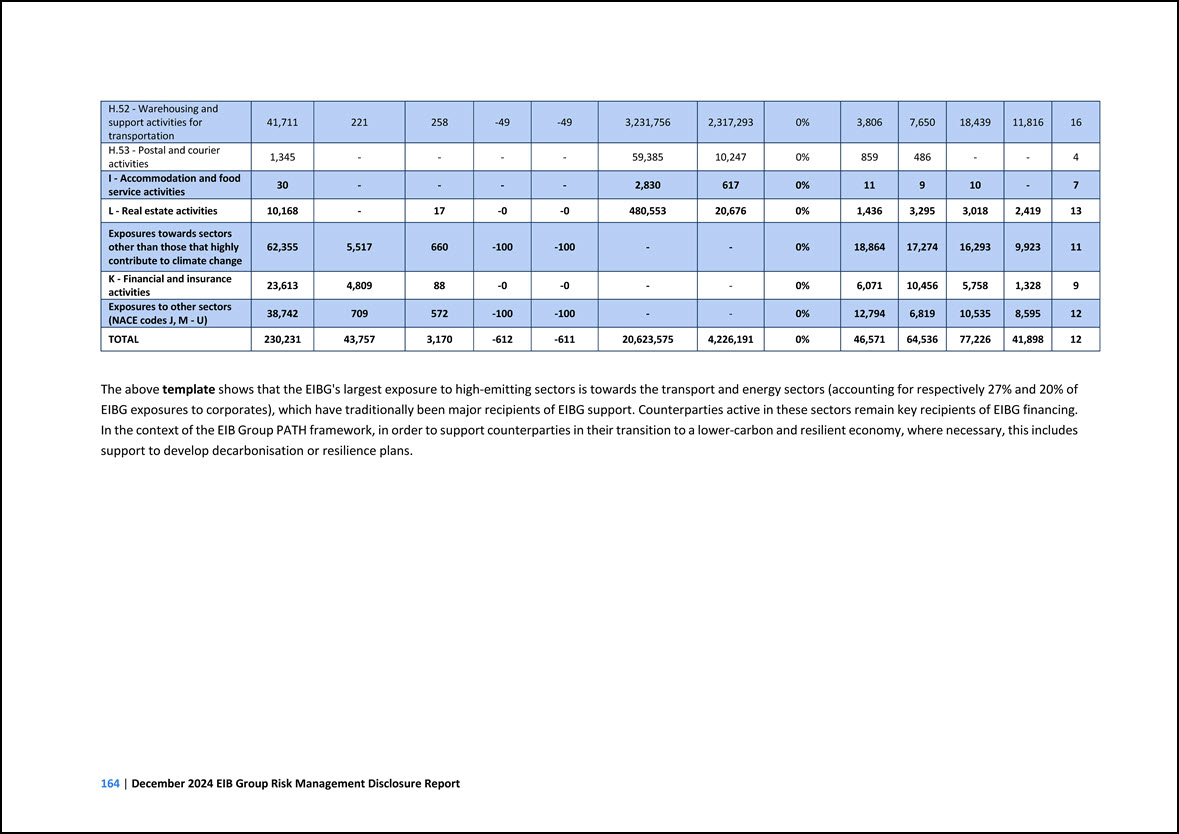
H.52 - Warehousing and support activities for transportation 41,711 221 258 -49 -49 3,231,756 2,317,293 0% 3,806 7,650 18,439 11,816 16 H.53 - Postal and
courier activities 1,345 - - - - 59,385 10,247 0% 859 486 - - 4 I - Accommodation and food service activities 30 - - - - 2,830 617 0% 11 9 10 - 7 L - Real estate activities 10,168 - 17 -0 -0 480,553 20,676 0%
1,436 3,295 3,018 2,419 13 Exposures towards sectors other than those that highly contribute to climate change 62,355 5,517 660 -100 -100 - - 0% 18,864 17,274 16,293 9,923 11 K - Financial and insurance activities 23,613 4,809
88 -0 -0 - - 0% 6,071 10,456 5,758 1,328 9 Exposures to other sectors (NACE codes J, M - U) 38,742 709 572 -100 -100 - - 0% 12,794 6,819 10,535 8,595 12 TOTAL 230,231 43,757 3,170 -612 -611 20,623,575 4,226,191 0%
46,571 64,536 77,226 41,898 12 The above template shows that the EIBG's largest exposure to high-emitting sectors is towards the transport and energy sectors (accounting for respectively 27% and 20% of EIBG exposures to corporates), which have
traditionally been major recipients of EIBG support. Counterparties active in these sectors remain key recipients of EIBG financing. In the context of the EIB Group PATH framework, in order to support counterparties in their transition to a
lower-carbon and resilient economy, where necessary, this includes support to develop decarbonisation or resilience plans.
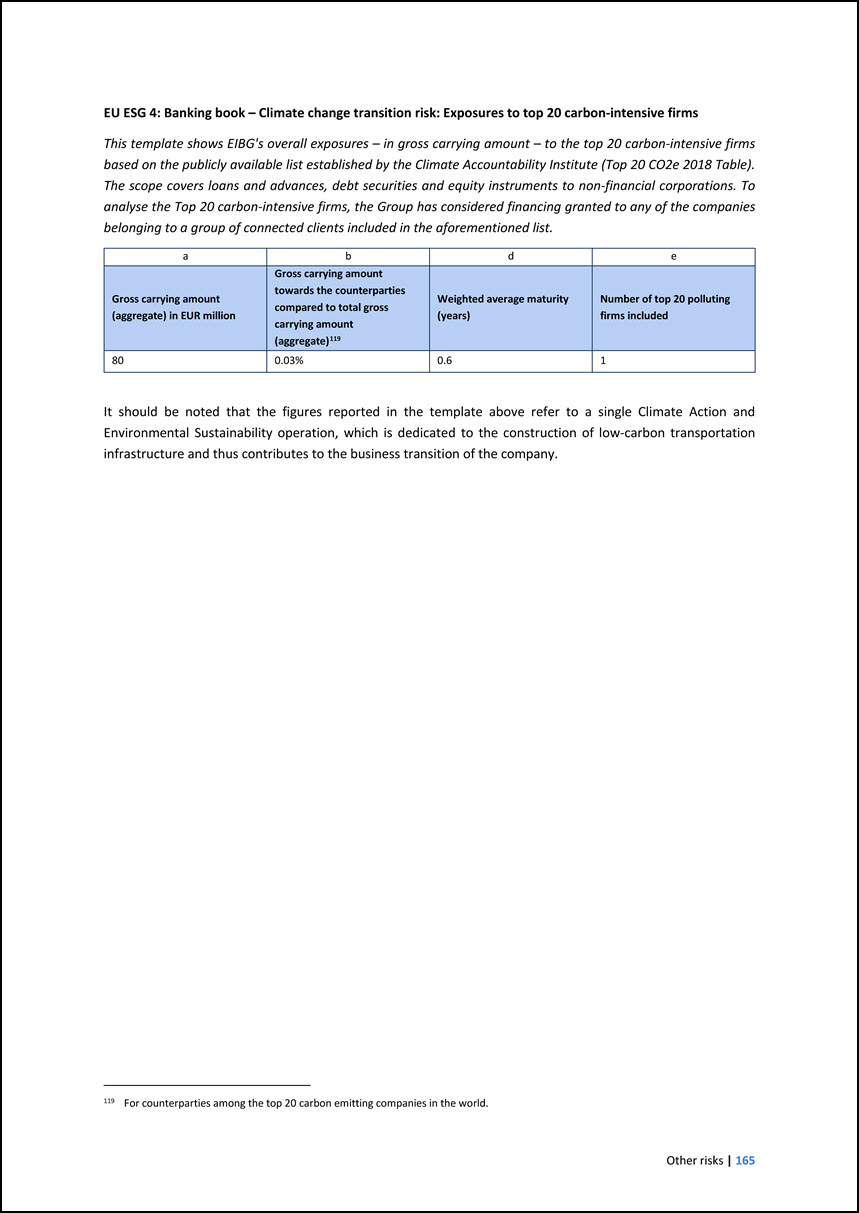
EU ESG 4: Banking book – Climate change transition risk: Exposures to top 20 carbon-intensive firms This template shows EIBG's overall exposures – in gross carrying
amount – to the top 20 carbon-intensive firms based on the publicly available list established by the Climate Accountability Institute (Top 20 CO2e 2018 Table). The scope covers loans and advances, debt securities and equity instruments to
non-financial corporations. To analyse the Top 20 carbon-intensive firms, the Group has considered financing granted to any of the companies belonging to a group of connected clients included in the aforementioned list. a b d e Gross carrying
amount (aggregate) in EUR million Gross carrying amount towards the counterparties compared to total gross carrying amount (aggregate)119 Weighted average maturity (years) Number of top 20 polluting firms included 80 0.03% 0.6 1 119 For
counterparties among the top 20 carbon emitting companies in the world. It should be noted that the figures reported in the template above refer to a single Climate Action and Environmental Sustainability operation, which is dedicated to the
construction of low-carbon transportation infrastructure and thus contributes to the business transition of the company.
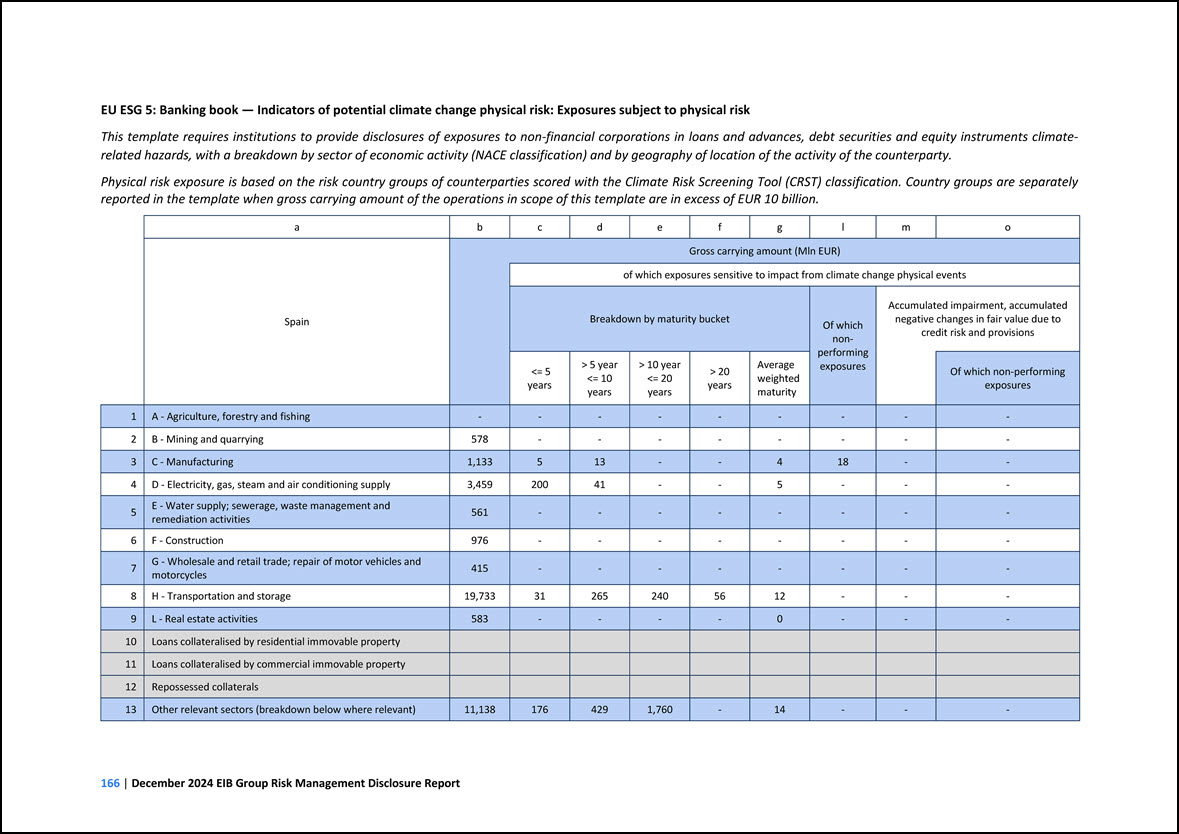
EU ESG 5: Banking book — Indicators of potential climate change physical risk: Exposures subject to physical risk This template requires institutions to provide
disclosures of exposures to non-financial corporations in loans and advances, debt securities and equity instruments climate- related hazards, with a breakdown by sector of economic activity (NACE classification) and by geography of location of the
activity of the counterparty. Physical risk exposure is based on the risk country groups of counterparties scored with the Climate Risk Screening Tool (CRST) classification. Country groups are separately reported in the template when gross carrying
amount of the operations in scope of this template are in excess of EUR 10 billion. a b c d e f g l m o Spain Gross carrying amount (Mln EUR) of which exposures sensitive to impact from climate change physical events Breakdown
by maturity bucket Of which non- performing exposures Accumulated impairment, accumulated negative changes in fair value due to credit risk and provisions <= 5 years > 5 year <= 10 years > 10 year <= 20 years > 20 years
Average weighted maturity Of which non-performing exposures 1 A - Agriculture, forestry and fishing - - - - - - - - - 2 B - Mining and quarrying 578 - - - - - - - - 3 C - Manufacturing 1,133 5 13 - - 4 18 - - 4 D
- Electricity, gas, steam and air conditioning supply 3,459 200 41 - - 5 - - - 5 E - Water supply; sewerage, waste management and remediation activities 561 - - - - - - - - 6 F - Construction 976 - - - - - - - - 7 G -
Wholesale and retail trade; repair of motor vehicles and motorcycles 415 - - - - - - - - 8 H - Transportation and storage 19,733 31 265 240 56 12 - - - 9 L - Real estate activities 583 - - - - 0 - - - 10 Loans
collateralised by residential immovable property 11 Loans collateralised by commercial immovable property 12 Repossessed collaterals 13 Other relevant sectors (breakdown below where relevant) 11,138 176
429 1,760 - 14 - - -
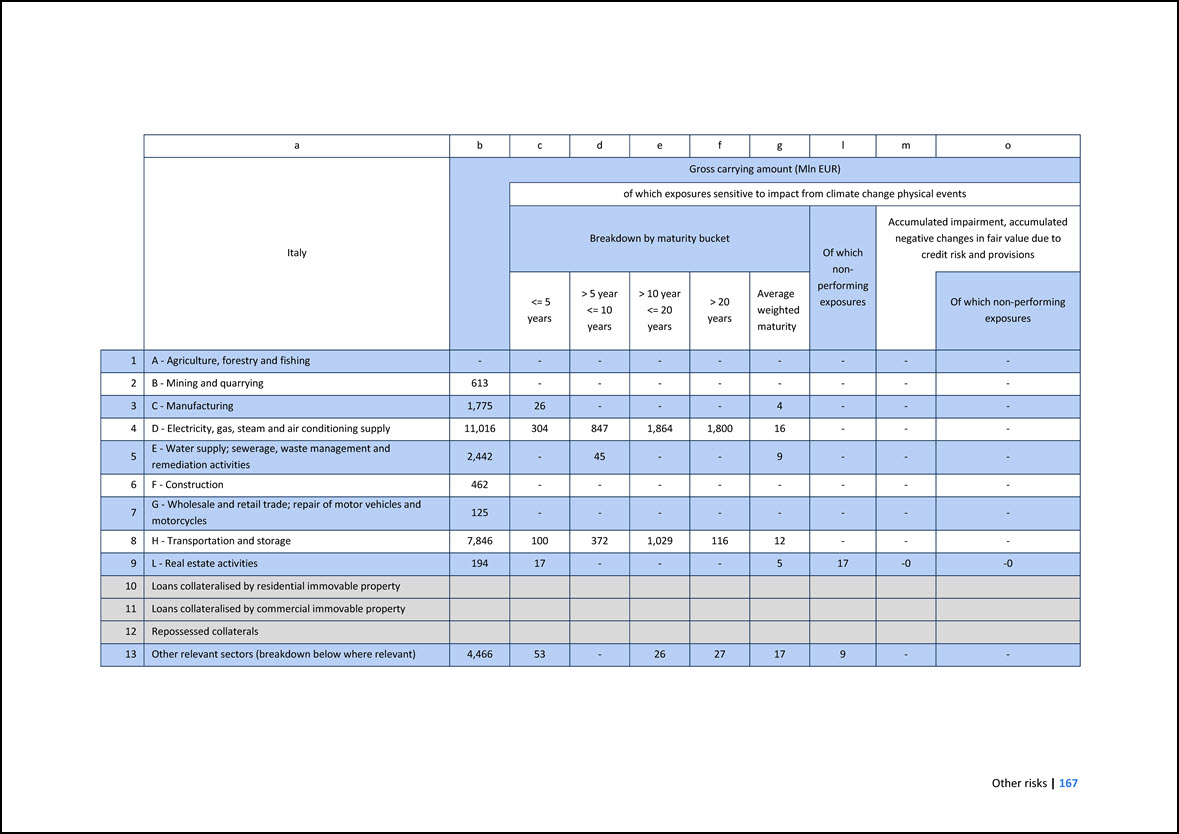
a b c d e f g l m o Italy Gross carrying amount (Mln EUR) of which exposures sensitive to impact from climate change physical events Breakdown
by maturity bucket Of which non- performing exposures Accumulated impairment, accumulated negative changes in fair value due to credit risk and provisions <= 5 years > 5 year <= 10 years > 10 year <= 20 years > 20 years
Average weighted maturity Of which non-performing exposures 1 A - Agriculture, forestry and fishing - - - - - - - - - 2 B - Mining and quarrying 613 - - - - - - - - 3 C - Manufacturing 1,775 26 - - - 4 - - - 4 D -
Electricity, gas, steam and air conditioning supply 11,016 304 847 1,864 1,800 16 - - - 5 E - Water supply; sewerage, waste management and remediation activities 2,442 - 45 - - 9 - - - 6 F - Construction 462 - - - - - -
- - 7 G - Wholesale and retail trade; repair of motor vehicles and motorcycles 125 - - - - - - - - 8 H - Transportation and storage 7,846 100 372 1,029 116 12 - - - 9 L - Real estate activities 194 17 - - - 5 17 -0
-0 10 Loans collateralised by residential immovable property 11 Loans collateralised by commercial immovable property 12 Repossessed collaterals 13 Other relevant sectors (breakdown below where
relevant) 4,466 53 - 26 27 17 9 - -
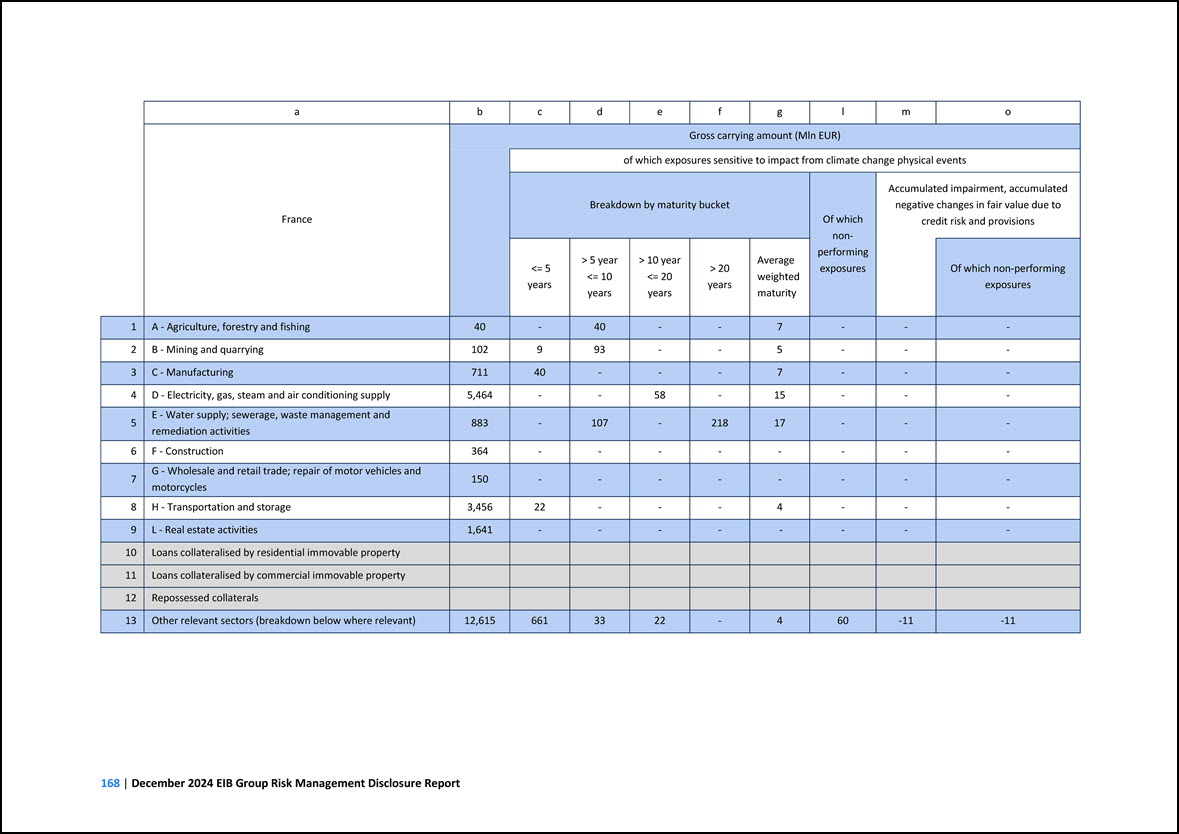
a b c d e f g l m o France Gross carrying amount (Mln EUR) of which exposures sensitive to impact from climate change physical events Breakdown
by maturity bucket Of which non- performing exposures Accumulated impairment, accumulated negative changes in fair value due to credit risk and provisions <= 5 years > 5 year <= 10 years > 10 year <= 20 years > 20 years
Average weighted maturity Of which non-performing exposures 1 A - Agriculture, forestry and fishing 40 - 40 - - 7 - - - 2 B - Mining and quarrying 102 9 93 - - 5 - - - 3 C - Manufacturing 711 40 - - - 7 - - - 4 D
- Electricity, gas, steam and air conditioning supply 5,464 - - 58 - 15 - - - 5 E - Water supply; sewerage, waste management and remediation activities 883 - 107 - 218 17 - - - 6 F - Construction 364 - - - - - - - - 7
G - Wholesale and retail trade; repair of motor vehicles and motorcycles 150 - - - - - - - - 8 H - Transportation and storage 3,456 22 - - - 4 - - - 9 L - Real estate activities 1,641 - - - - - - - - 10 Loans
collateralised by residential immovable property 11 Loans collateralised by commercial immovable property 12 Repossessed collaterals 13 Other relevant sectors (breakdown below where relevant) 12,615 661
33 22 - 4 60 -11 -11
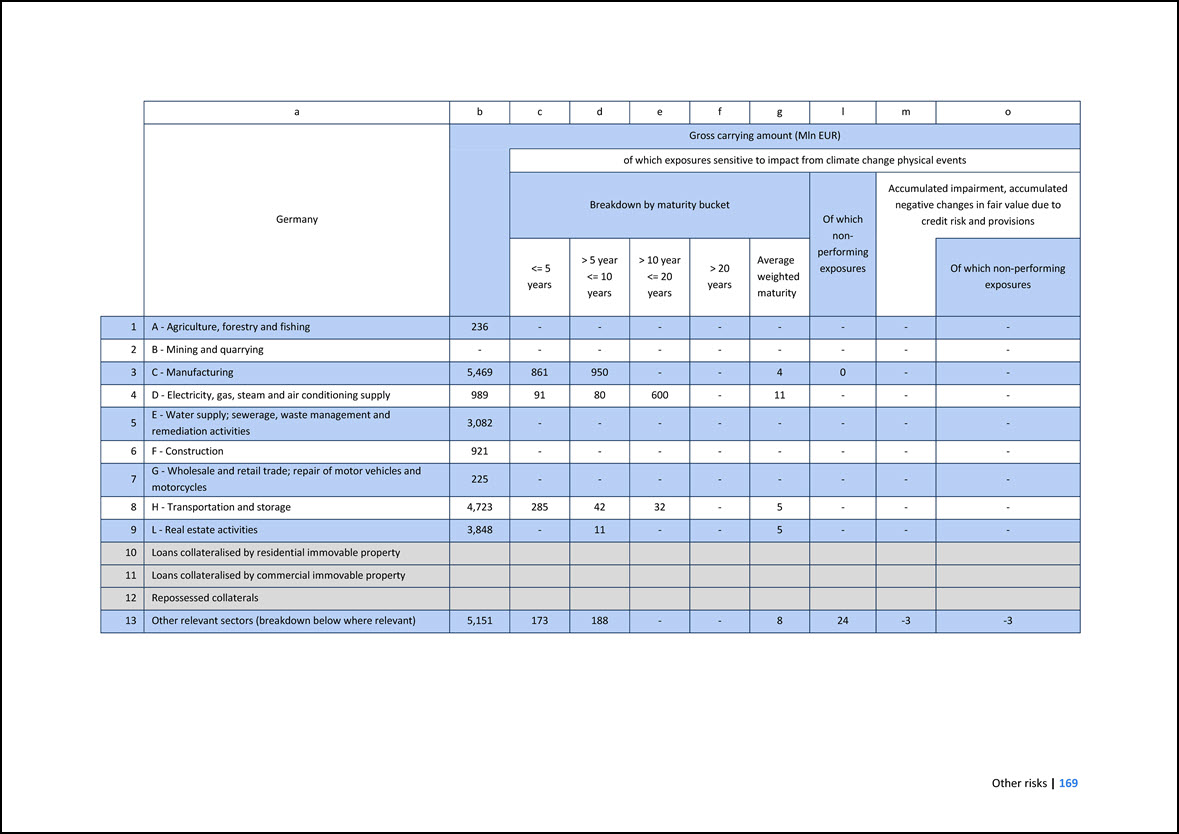
a b c d e f g l m o Germany Gross carrying amount (Mln EUR) of which exposures sensitive to impact from climate change physical events Breakdown
by maturity bucket Of which non- performing exposures Accumulated impairment, accumulated negative changes in fair value due to credit risk and provisions <= 5 years > 5 year <= 10 years > 10 year <= 20 years > 20 years
Average weighted maturity Of which non-performing exposures 1 A - Agriculture, forestry and fishing 236 - - - - - - - - 2 B - Mining and quarrying - - - - - - - - - 3 C - Manufacturing 5,469 861 950 - - 4 0 - - 4
D - Electricity, gas, steam and air conditioning supply 989 91 80 600 - 11 - - - 5 E - Water supply; sewerage, waste management and remediation activities 3,082 - - - - - - - - 6 F - Construction 921 - - - - - - - - 7
G - Wholesale and retail trade; repair of motor vehicles and motorcycles 225 - - - - - - - - 8 H - Transportation and storage 4,723 285 42 32 - 5 - - - 9 L - Real estate activities 3,848 - 11 - - 5 - - - 10 Loans
collateralised by residential immovable property 11 Loans collateralised by commercial immovable property 12 Repossessed collaterals 13 Other relevant sectors (breakdown below where relevant) 5,151 173
188 - - 8 24 -3 -3
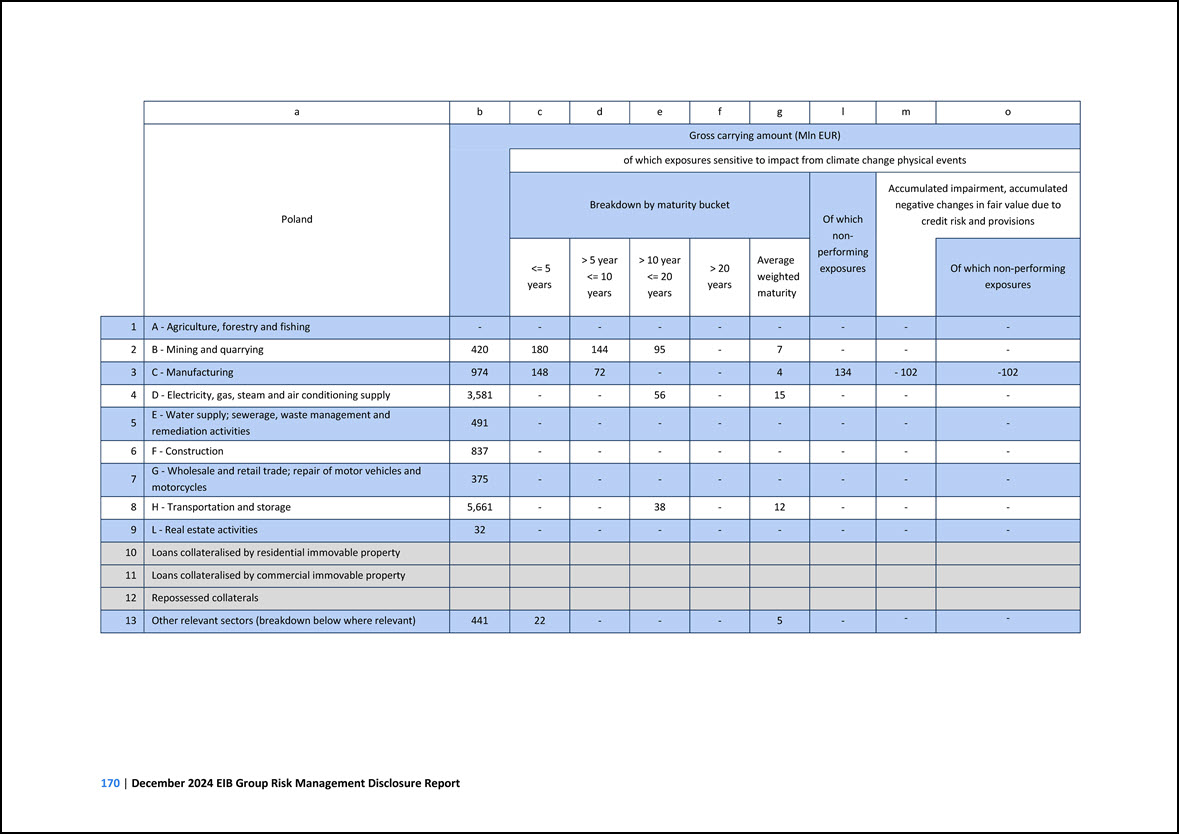
abcdefglmoPolandGross carrying amount (Mln EUR) of which exposures sensitiveto impact from climate change physical eventsBreakdown by maturity bucketOf whichnon-
performingexposuresAccumulated impairment, accumulatednegative changes in fair value due to creditrisk and provisions<= 5years> 5 year<= 10years> 10 year<= 20years>20yearsAverage weightedmaturityOf which non-performingexposures1
A-Agriculture, forestry and fishing--------- 2 B -Mining and quarrying42018014495-7--- 3 C -Manufacturing97414872--4134-102-1024 D -Electricity, gas, steam and air conditioning supply3,581--56-15--- 5 E -Water supply; sewerage, waste management
andremediation activities491-------- 6 F-Construction837-------- 7 G -Wholesale and retail trade;repairof motor vehicles andmotorcycles375-------- 8 H -Transportation and storage5,661--38-12--- 9 L -Real estate activities32-------- 10Loans
collateralised by residential immovable property11Loans collateralised by commercial immovable property12Repossessed collaterals13Other relevant sectors (breakdown below where relevant)44122---5--- 170|December 2024 EIB Group Risk Management
DisclosureReport
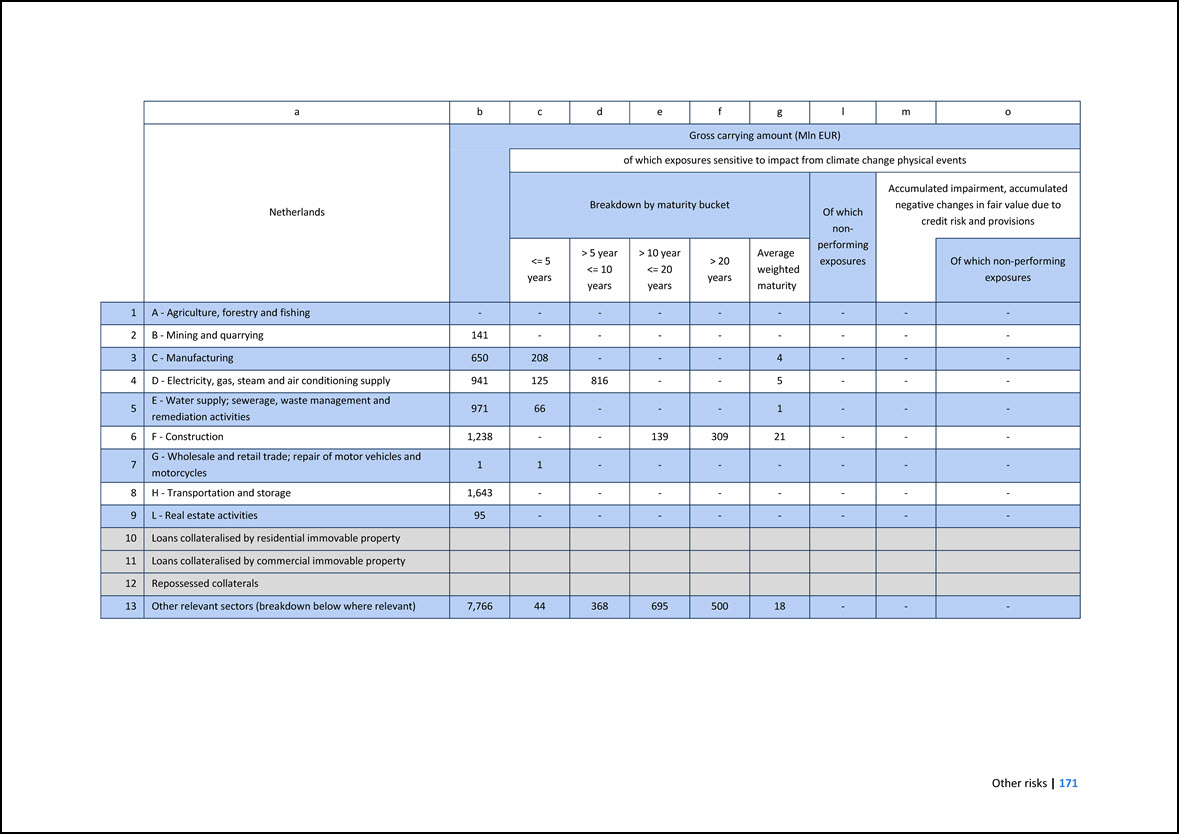
a b c d e f g l m o Netherlands Gross carrying amount (Mln EUR) of which exposures sensitive to impact from climate change physical events
Breakdown by maturity bucket Of which non- performing exposures Accumulated impairment, accumulated negative changes in fair value due to credit risk and provisions <= 5 years > 5 year <= 10 years > 10 year <= 20 years > 20
years Average weighted maturity Of which non-performing exposures 1 A - Agriculture, forestry and fishing - - - - - - - - - 2 B - Mining and quarrying 141 - - - - - - - - 3 C - Manufacturing 650 208 - - - 4 - - -
4 D - Electricity, gas, steam and air conditioning supply 941 125 816 - - 5 - - - 5 E - Water supply; sewerage, waste management and remediation activities 971 66 - - - 1 - - - 6 F - Construction 1,238 - - 139 309 21 -
- - 7 G - Wholesale and retail trade; repair of motor vehicles and motorcycles 1 1 - - - - - - - 8 H - Transportation and storage 1,643 - - - - - - - - 9 L - Real estate activities 95 - - - - - - - - 10 Loans
collateralised by residential immovable property 11 Loans collateralised by commercial immovable property 12 Repossessed collaterals 13 Other relevant sectors (breakdown below where relevant) 7,766 44
368 695 500 18 - - -
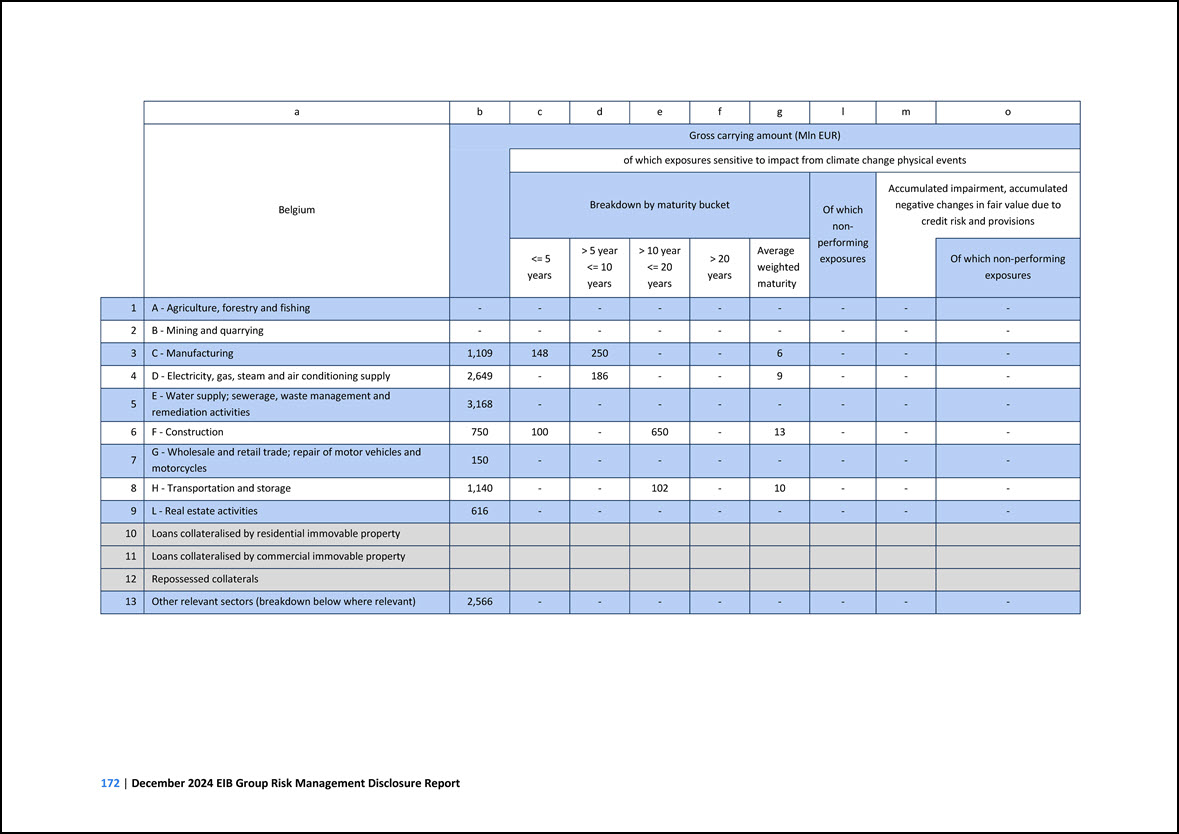
a b c d e f g l m o Belgium Gross carrying amount (Mln EUR) of which exposures sensitive to impact from climate change physical events Breakdown
by maturity bucket Of which non- performing exposures Accumulated impairment, accumulated negative changes in fair value due to credit risk and provisions <= 5 years > 5 year <= 10 years > 10 year <= 20 years > 20 years
Average weighted maturity Of which non-performing exposures 1 A - Agriculture, forestry and fishing - - - - - - - - - 2 B - Mining and quarrying - - - - - - - - - 3 C - Manufacturing 1,109 148 250 - - 6 - - - 4 D
- Electricity, gas, steam and air conditioning supply 2,649 - 186 - - 9 - - - 5 E - Water supply; sewerage, waste management and remediation activities 3,168 - - - - - - - - 6 F - Construction 750 100 - 650 - 13 - - -
7 G - Wholesale and retail trade; repair of motor vehicles and motorcycles 150 - - - - - - - - 8 H - Transportation and storage 1,140 - - 102 - 10 - - - 9 L - Real estate activities 616 - - - - - - - - 10 Loans
collateralised by residential immovable property 11 Loans collateralised by commercial immovable property 12 Repossessed collaterals 13 Other relevant sectors (breakdown below where relevant) 2,566 - -
- - - - - -
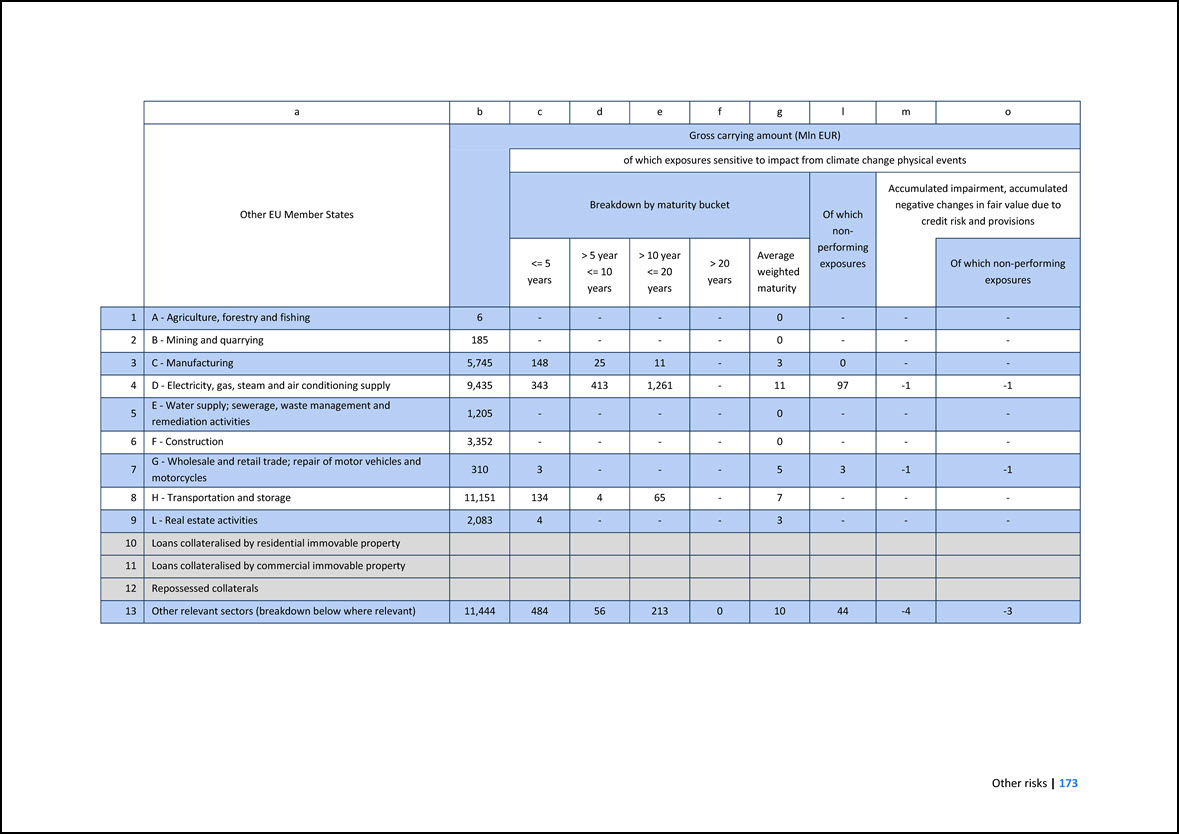
a b c d e f g l m o Other EU Member States Gross carrying amount (Mln EUR) of which exposures sensitive to impact from climate change physical
events Breakdown by maturity bucket Of which non- performing exposures Accumulated impairment, accumulated negative changes in fair value due to credit risk and provisions <= 5 years > 5 year <= 10 years > 10 year <= 20 years
> 20 years Average weighted maturity Of which non-performing exposures 1 A - Agriculture, forestry and fishing 6 - - - - 0 - - - 2 B - Mining and quarrying 185 - - - - 0 - - - 3 C - Manufacturing 5,745 148 25 11 -
3 0 - - 4 D - Electricity, gas, steam and air conditioning supply 9,435 343 413 1,261 - 11 97 -1 -1 5 E - Water supply; sewerage, waste management and remediation activities 1,205 - - - - 0 - - - 6 F - Construction 3,352
- - - - 0 - - - 7 G - Wholesale and retail trade; repair of motor vehicles and motorcycles 310 3 - - - 5 3 -1 -1 8 H - Transportation and storage 11,151 134 4 65 - 7 - - - 9 L - Real estate activities 2,083 4 - -
- 3 - - - 10 Loans collateralised by residential immovable property 11 Loans collateralised by commercial immovable property 12 Repossessed collaterals 13 Other relevant sectors (breakdown below
where relevant) 11,444 484 56 213 0 10 44 -4 -3
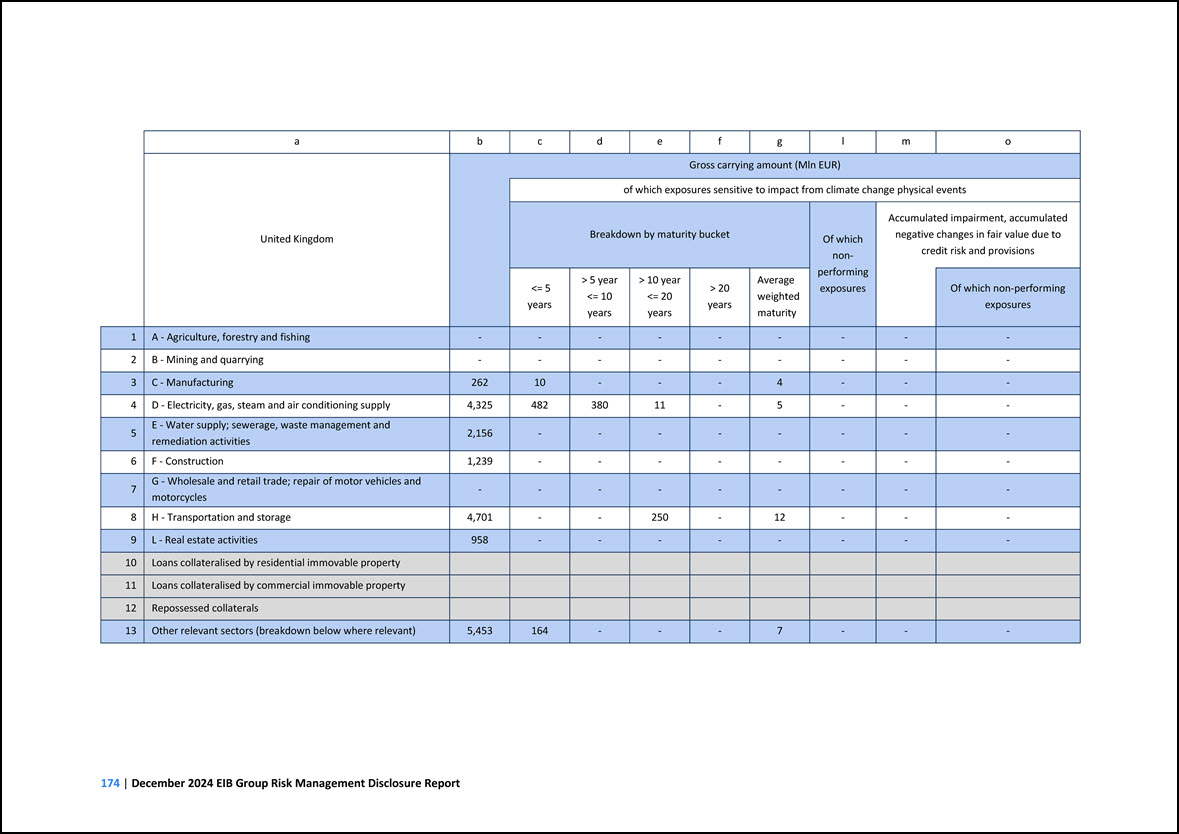
a b c d e f g l m o United Kingdom Gross carrying amount (Mln EUR) of which exposures sensitive to impact from climate change physical events
Breakdown by maturity bucket Of which non- performing exposures Accumulated impairment, accumulated negative changes in fair value due to credit risk and provisions <= 5 years > 5 year <= 10 years > 10 year <= 20 years > 20
years Average weighted maturity Of which non-performing exposures 1 A - Agriculture, forestry and fishing - - - - - - - - - 2 B - Mining and quarrying - - - - - - - - - 3 C - Manufacturing 262 10 - - - 4 - - - 4
D - Electricity, gas, steam and air conditioning supply 4,325 482 380 11 - 5 - - - 5 E - Water supply; sewerage, waste management and remediation activities 2,156 - - - - - - - - 6 F - Construction 1,239 - - - - - - -
- 7 G - Wholesale and retail trade; repair of motor vehicles and motorcycles - - - - - - - - - 8 H - Transportation and storage 4,701 - - 250 - 12 - - - 9 L - Real estate activities 958 - - - - - - - - 10 Loans
collateralised by residential immovable property 11 Loans collateralised by commercial immovable property 12 Repossessed collaterals 13 Other relevant sectors (breakdown below where relevant) 5,453 164
- - - 7 - - -
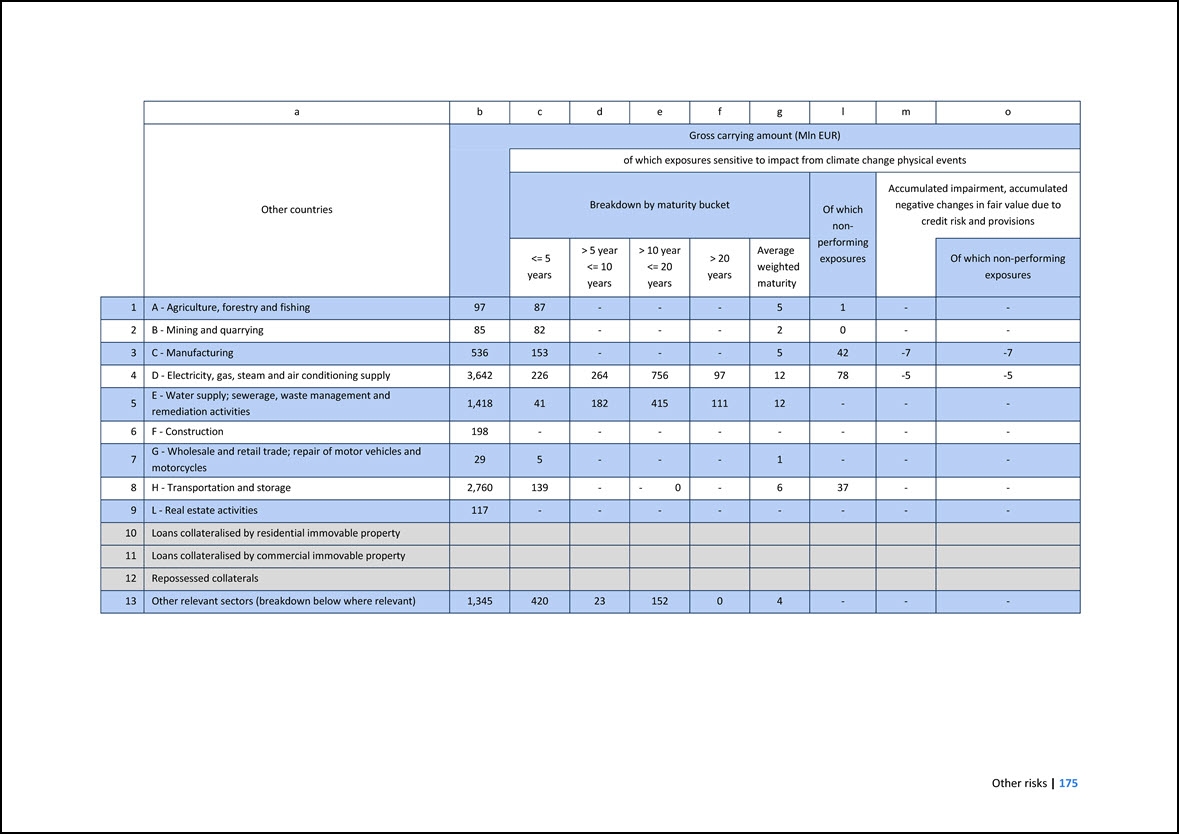
a b c d e f g l m o Other countries Gross carrying amount (Mln EUR) of which exposures sensitive to impact from climate change physical events
Breakdown by maturity bucket Of which non- performing exposures Accumulated impairment, accumulated negative changes in fair value due to credit risk and provisions <= 5 years > 5 year <= 10 years > 10 year <= 20 years > 20
years Average weighted maturity Of which non-performing exposures 1 A - Agriculture, forestry and fishing 97 87 - - - 5 1 - - 2 B - Mining and quarrying 85 82 - - - 2 0 - - 3 C - Manufacturing 536 153 - - - 5 42 -7
-7 4 D - Electricity, gas, steam and air conditioning supply 3,642 226 264 756 97 12 78 -5 -5 5 E - Water supply; sewerage, waste management and remediation activities 1,418 41 182 415 111 12 - - - 6 F - Construction 198 -
- - - - - - - 7 G - Wholesale and retail trade; repair of motor vehicles and motorcycles 29 5 - - - 1 - - - 8 H - Transportation and storage 2,760 139 - - 0 - 6 37 - - 9 L - Real estate activities 117 - - - - - -
- - 10 Loans collateralised by residential immovable property 11 Loans collateralised by commercial immovable property 12 Repossessed collaterals 13 Other relevant sectors (breakdown below where
relevant) 1,345 420 23 152 0 4 - - -
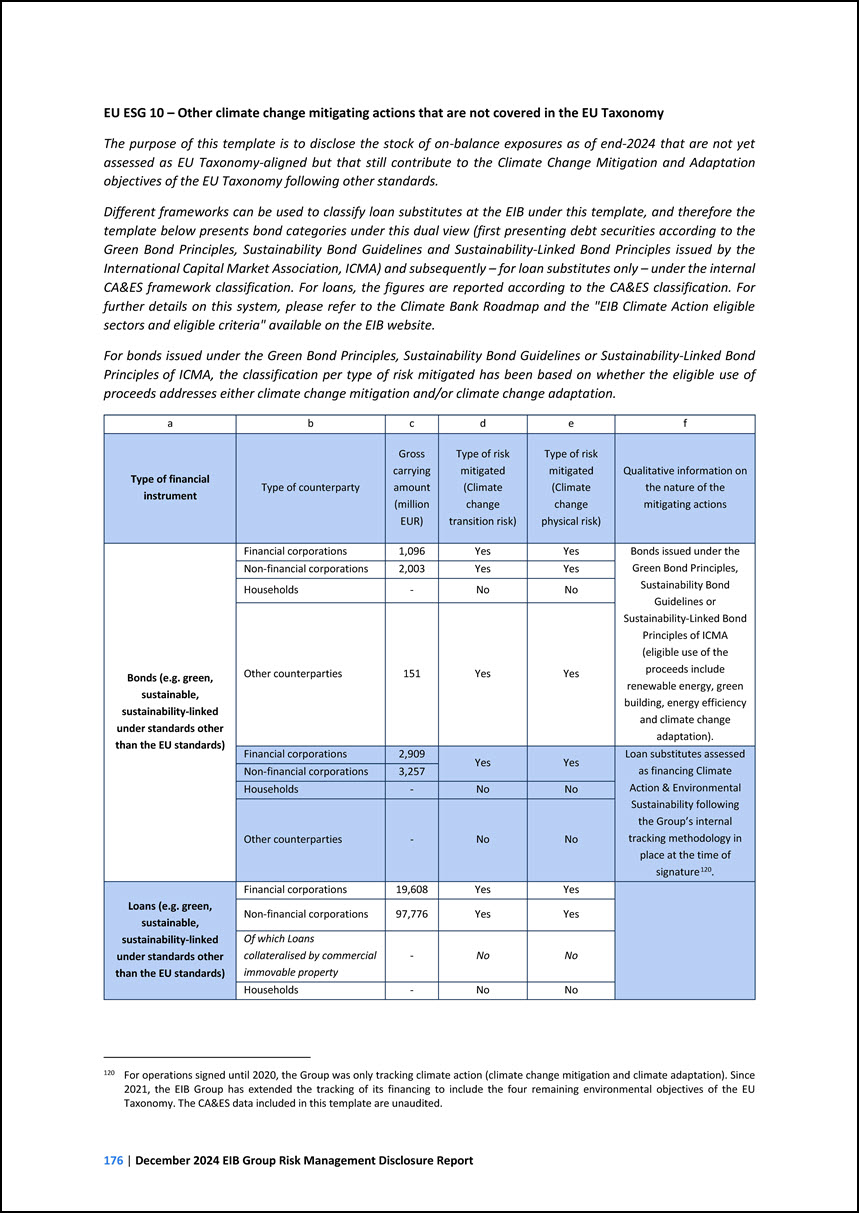
EU ESG 10 – Other climate change mitigating actions that are not covered in the EU Taxonomy The purpose of this template is to disclose the stock of on-balance
exposures as of end-2024 that are not yet assessed as EU Taxonomy-aligned but that still contribute to the Climate Change Mitigation and Adaptation objectives of the EU Taxonomy following other standards. Different frameworks can be used to classify
loan substitutes at the EIB under this template, and therefore the template below presents bond categories under this dual view (first presenting debt securities according to the Green Bond Principles, Sustainability Bond Guidelines and
Sustainability-Linked Bond Principles issued by the International Capital Market Association, ICMA) and subsequently – for loan substitutes only – under the internal CA&ES framework classification. For loans, the figures are reported according to
the CA&ES classification. For further details on this system, please refer to the Climate Bank Roadmap and the "EIB Climate Action eligible sectors and eligible criteria" available on the EIB website. For bonds issued under the Green Bond
Principles, Sustainability Bond Guidelines or Sustainability-Linked Bond Principles of ICMA, the classification per type of risk mitigated has been based on whether the eligible use of proceeds addresses either climate change mitigation and/or
climate change adaptation. a b c d e f Type of financial instrument Type of counterparty Gross carrying amount (million EUR) Type of risk mitigated (Climate change transition risk) Type of risk mitigated (Climate change physical risk)
Qualitative information on the nature of the mitigating actions Bonds (e.g. green, sustainable, sustainability-linked under standards other than the EU standards) Financial corporations 1,096 Yes Yes Bonds issued under the Green Bond
Principles, Sustainability Bond Guidelines or Sustainability-Linked Bond Principles of ICMA (eligible use of the proceeds include renewable energy, green building, energy efficiency and climate change adaptation). Non-financial corporations 2,003
Yes Yes Households - No No Other counterparties 151 Yes Yes Financial corporations 2,909 Yes Yes Loan substitutes assessed as financing Climate Action & Environmental Sustainability following the Group’s internal tracking
methodology in place at the time of signature120. Non-financial corporations 3,257 Households - No No Other counterparties - No No Loans (e.g. green, sustainable, sustainability-linked under standards other than the EU standards)
Financial corporations 19,608 Yes Yes Non-financial corporations 97,776 Yes Yes Of which Loans collateralised by commercial immovable property - No No Households - No No 120 For operations signed until 2020, the Group was only
tracking climate action (climate change mitigation and climate adaptation). Since 2021, the EIB Group has extended the tracking of its financing to include the four remaining environmental objectives of the EU Taxonomy. The CA&ES data included in
this template are unaudited.

Loans assessed as financing Climate Action & Environmental Sustainability following the Group’s internal tracking methodology in place at the time of
signature120. Of which Loans collateralised by residential immovable property - No No Of which building renovation loans - No No Other counterparties 33,779 Yes Yes In line with the objectives of the CBR, the Bank has gradually
increased the share of Climate Action and Environmental Sustainability financing in its annual volume of new signatures from 31% in 2019 to 60% in 2024.
14 REMUNERATION The Group applies the EU regulatory requirements on remuneration policies121 in the financial sector, as BBP and in line with the BBP Guiding
Principles, with approved adaptations to reflect the limits set in its Statutes, the non- profit nature and internal governance mechanism of the EIB and the EIF. 121 CRR, CRD, the EBA Guidelines on sound remuneration policies (EBA/GL/2021/04) and
Commission Delegated Regulation (EU) 2021/923 of 25 March 2021 supplementing Directive 2013/36/EU with regard to regulatory technical standards setting out the criteria to define managerial responsibility, control functions, material business units
and a significant impact on a material business. The present chapter provides detailed qualitative and quantitative information on the EIB Group’s remuneration policies and practices, as required under Article 450 of the CRR. 14.1 EIB Group annual
self-assessment Remuneration policy In the context of applying the BBP framework, the EIB has developed internally the “EIB Remuneration Framework”, a policy document that describes and summarises the key principles for a consistent and coherent
design, implementation and monitoring of remuneration practices across the organisation as required under the CRD. This document has been approved by the EIB governing bodies and was published on the EIB’s website in December 2021. The “EIB
Remuneration Framework” consolidates and summarises the existing key elements of the EIB’s policies and practices on remuneration. It sets the framework for defining and implementing compensation practices consistently across the EIB. The “EIB
Remuneration Framework” and related polices are amended as the need arises following a review and recommendation from the Remuneration Committee. The EIB’s remuneration framework supports the mission and needs of the organisation and its staff
members. It reflects the long-term interests of its shareholders and is aligned with the BBP. The key principles of this framework are applied to the entire Bank and reflected in the remuneration practices for employees in all areas of the Bank’s
activity. These key principles are: 1. Compliance with relevant regulatory requirements as BBP; 2. Clear governance on remuneration; 3. Remuneration based on sustainable performance; 4. Attraction, motivation and retention of talented staff. The
EIF Board of Directors is committed to fully align with the EIB’s remuneration framework and, therefore, the relevant policies and procedures are aligned across both institutions. The “EIF Remuneration Framework”, which was approved by the EIF
governing bodies and published on the EIF website in 2022, was designed following the approach set out in the EIB’s remuneration framework considering the specificities of the EIF, for instance its business activities, governance and organisational
structure. The EIB and EIF remuneration frameworks are consistent with and promote sound and effective risk management, and do not encourage risk-taking that exceeds the level of tolerated risk at Group level. They are in line with the business
strategy, objectives, values and long-term interests of the Group and incorporate measures to avoid conflicts of interest. Governance on remuneration As per the regulatory requirements, all significant institutions must establish risk, nomination
and remuneration committees to advise the management body in its supervisory function and to prepare the decisions to be taken
by this body. Delegating to committees does not in any way release the management body in its supervisory function from collectively fulfilling its duties and
responsibilities. In line with the BBP framework applicable to the EIB, a Committee on Staff Remuneration and Budget has been established within the Board of Directors. The Committee on Staff Remuneration and Budget discusses proposals and makes
recommendations concerning budget and staff remuneration matters in preparation for the subsequent debates and decisions in the full Board session. The Terms of Reference122 of the Board Committee on Staff Remuneration and Budget are available on the
EIB website. The Committee met three times in 2024. 122 These include detailed information on the Committee’s mandate, duties, composition and meetings. In line with the EIF Board of Directors’ decision to commit to full intra-Group alignment on
employment status, an EIF Committee on Staff Remuneration has not been established. Consequently, the EIF Chief Executive retains the responsibility for proposals to the EIF Board of Directors made based on corresponding decisions taken by the EIB
Board of Directors. Identified Staff The CRD requires institutions to determine their Identified Staff following a specific annual process, on the basis of the quantitative and qualitative criteria defined by the European Banking Authority
(“EBA”). At the EIB Group, the self-assessment for defining the Identified Staff is based on the EBA’s criteria, also taking into consideration the following elements: • The proportionality principle provided by allowing exemptions from the
application of some of the remuneration principles. • The application of waivers permitted by the relevant authorities of the Member States at the level of institution and/or at the level of Identified Staff. • Practices existing across the private
financial institutions showing the application of exemptions based on remuneration thresholds. • Factors related to the internal organisation, nature, scope and complexity of the EIB Group’s activities. Therefore, as endorsed by the EIB governing
bodies, the EIB defined its Identified Staff as the members of the MC, the Directors General123 and Directors124, considering that they have been entrusted with high responsibility for the institution, its strategy and activities and therefore have a
material impact on the institution’s risk profile. Whilst the Management Committee members are not staff members, for the purpose of the EIB Remuneration Framework, they are included in the Identified Staff population. 123 The “Director General”
title is internally associated with function SC/9. 124 The “Director” title is internally associated with function SC/8. Likewise, the EIF definition of Identified Staff includes the Chief Executive, the Deputy Chief Executive and the Senior
Management Cadre125. On an exceptional basis, one Head of Division (function C/7) has been included on the EIF list. Whilst the Chief Executive and the Deputy Chief Executive are not staff members, for the purpose of the EIF Remuneration Framework
they are included in the Identified Staff population. 125 The “Senior Management Cadre“ at the EIF is internally associated with function SC/8. Remuneration structure The EIB’s remuneration structure recognises the EIB’s dual role as a bank and as
a European public policy-driven institution by providing a total remuneration package that is aligned to private and public financial market practices.
The remuneration structure makes a clear distinction between fixed and variable remuneration and provides for a cap of variable versus fixed remuneration in line with
the CRD: • The fixed remuneration constitutes the predominant component of total remuneration; • The variable remuneration is the secondary component of total remuneration and does not contribute to excessive risk-taking as its collective part is
rather substantial and the levels of variable reward are moderate in comparison to regulatory thresholds and the private sector. Since 2010, at Group level, individual variable rewards have been limited to a maximum of 35% of an employee’s annual
salary (for the net performance award over the gross annual base salary, or the equivalent of about 60% if calculated as the gross performance award over the gross annual base salary). The variable remuneration budget is approved by the Board of
Directors on an annual basis. It amounts to a limited proportion of the overall staff budget available for the respective calendar year and thus does not limit the Bank’s ability to maintain a sound capital base. The size of the variable remuneration
is directly linked to the Bank’s overall performance, as measured against the organisation’s Key Performance Indicators126 (KPIs), which are also linked to the Group’s Risk Appetite Framework (RAF). Should the Bank’s KPIs remain below a set target,
variable pay could be either reduced or fully suspended for the respective performance year. 126 The full set of the Bank’s KPIs is provided in the EIB Group Operational Plan available on the EIB website. Furthermore, at Group level, the variable
remuneration is consistent with the performance levels assessment at year-end at individual level and can be withheld in case of low performance. Low performance is defined as failing to meet the required expectations related to objectives and/or
competencies. Moreover, the restrictions on the payment of variable remuneration in the context of capital conservation measures are applicable to the EIB under the BBP framework: “MDA” and “L-MDA” related regulatory requirements apply to the EIB,
as BBP, in respect of the payment of variable remuneration. It should be noted that current Group RAF triggers are above the MDA and L-MDA thresholds. Furthermore, other management actions and/or recovery options are to be considered even before any
hypothetical breach, in line with the Group Recovery Plan. The EIB Group promotes equal treatment of staff members through the maintenance of a single salary spine for all employees and the consistent application of rules and procedures for all
remuneration elements. The objectives of managers in control functions127 are predominantly control objectives and independent from the results of the business area they control, while the remuneration structure for all staff also applies to staff in
control functions. 127 The control functions at the EIB are defined in the “Remuneration Framework” as the Group Risk and Compliance Directorate, and the Internal Audit Department. At the EIF, the control functions comprise the Risk Management
Department, including Compliance, and the EIB Internal Audit, acting under a service level agreement and pursuant to the EIBG Internal Audit Charter. The EIB Group remuneration policies and structure are compliant with the principle of equal pay for
female and male employees for equal work or work of equal value as both institutions have had in place, for many years, mechanisms to ensure that staff decisions, including rewards, are gender neutral. Furthermore, the EIB Group calculates and
reports to the governing bodies the Key Risk Indicator (KRI) “Equal Pay”. This indicator measures the average difference between the remuneration of women and men for equal work or work of equal value. As part of the Group’s Risk Appetite Framework,
the indicator also provides an early warning in case of an unexplained increase observed by the EIB and/or the EIF. The outcome of the assessments has shown that the existing pay gap is statistically insignificant. Performance-related awards are
provided to eligible staff members in the form of a one-off annual cash payment. They consist of two components:
• the Bank Award, rewarding collective performance; and • the Individual Award, rewarding individual performance. Similarly, the EIF remuneration structure makes a
clear distinction between fixed and variable remuneration and provides a cap for variable versus fixed remuneration, in line with the regulatory requirements. Variable remuneration at the EIF includes payments depending on performance. The overall
variable remuneration pool is dependent on the EIF’s overall performance in terms of its policy objectives and the generation of an appropriate return on its resources. 100% of both policy and financial objectives will deliver the full award pool
budgeted in the EIF Corporate Operational Plan (COP)128. In line with the EIB approach, performance-related rewards at the EIF consist of a Fund Award and an Individual Award. 128 The EIF Corporate Operational Plan is available on the EIF website.
At the EIF, in line with the relevant regulatory requirements, particular attention is paid to avoid incentive elements in variable compensation that may induce behaviours not aligned with the EIF’s risk appetite. The EIF Remuneration Framework is
risk-aligned and consistent with the maintenance of a sound capital base. Following the EIB’s approach, the variable remuneration at the EIF is directly linked to the EIF’s overall performance, and measured against the organisation’s KPIs, which are
also linked to the Group Risk Appetite Framework. Neither the EIB nor the EIF grant other types of variable remuneration, such as long-term incentive plans, guaranteed variable remuneration or retention bonuses. In addition, due to the EIB’s and the
EIF’s nature, strategy and business model, several regulatory requirements (such as pay-out in instruments and shareholding requirements) are not relevant to the Group. Similarly, and due to the annual bonus structure, regulatory requirements such as
malus, clawback and deferrals are not applicable at the EIB Group. Further, the Group has no commitment to provide any type of severance payment to its Identified Staff as defined by the relevant regulatory requirements. 14.2 EIB Group remuneration
data The content of this section is based on the qualitative and quantitative remuneration disclosure requirements outlined in Article 450 of the amended CRR. Remuneration of Identified Group Staff Following the self-assessment process, the EIB
Group identified 12 members of the Management function (10 MC members at the EIB and the Chief Executive and Deputy Chief Executive at the EIF) and 96 Directors General, Directors and Senior Management Cadre as Identified Staff for the financial year
2024. The remuneration of the MC members is set by the Board of Governors and does not include any variable component. The emoluments of the members of the MC (President and Vice-Presidents of the EIB) are aligned with those of the President and
Vice-Presidents of the European Commission respectively. As such, any decisions taken in regard to the establishment of the remuneration principles have no impact on their remuneration. The remuneration structure of the EIB Directors General and
Directors, who are members of the senior management of the Bank, follows the remuneration structure applicable to all staff (fixed remuneration, allowances, benefits and variable remuneration). The fixed and variable remuneration of the EIF Chief
Executive and the Deputy Chief Executive are set by the EIF Board of Directors. The remuneration of the EIF Senior Management Cadre follows the remuneration structure applicable to all staff, following the Group approach. The remuneration of the
Identified Staff is detailed in the templates below.
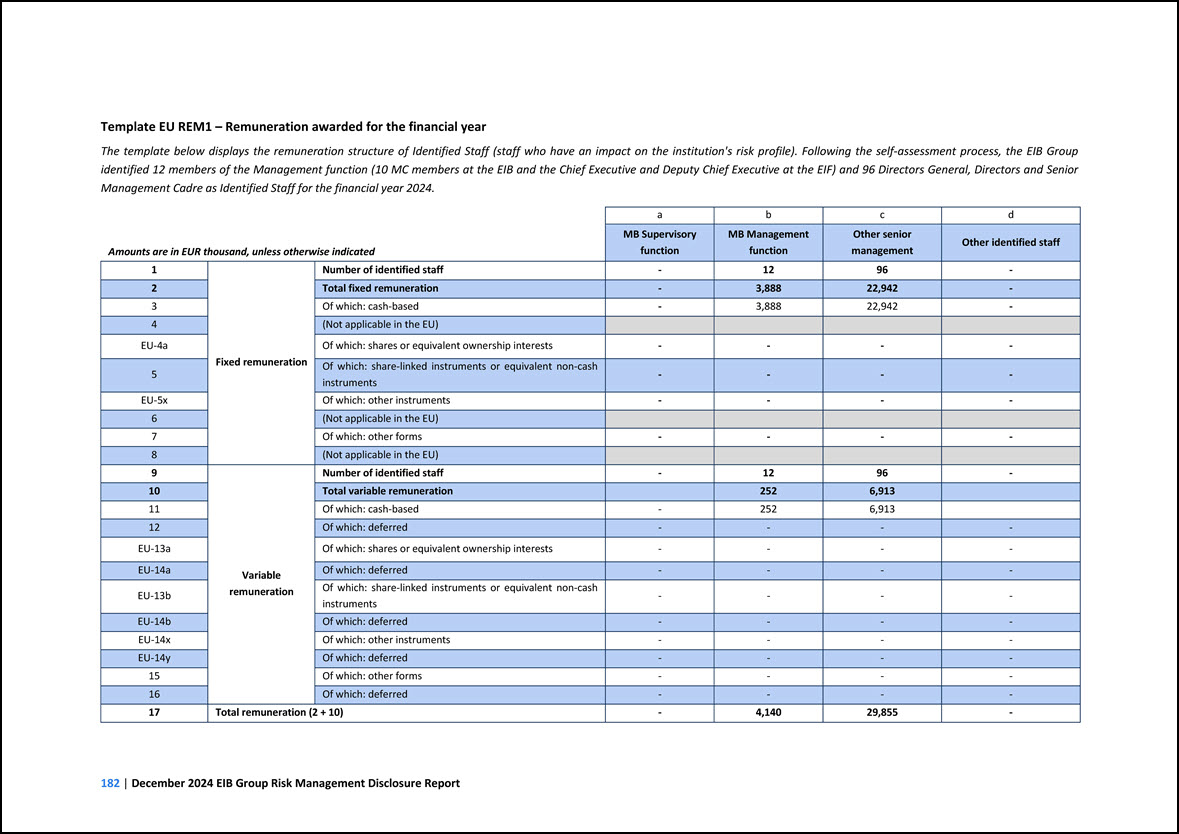
Template EU REM1 – Remuneration awarded for the financial year The template below displays the remuneration structure of Identified Staff (staff who have an impact on
the institution's risk profile). Following the self-assessment process, the EIB Group identified 12 members of the Management function (10 MC members at the EIB and the Chief Executive and Deputy Chief Executive at the EIF) and 96 Directors General,
Directors and Senior Management Cadre as Identified Staff for the financial year 2024. Amounts are in EUR thousand, unless otherwise indicated a b c d MB Supervisory function MB Management function Other senior management Other identified
staff 1 Fixed remuneration Number of identified staff - 12 96 - 2 Total fixed remuneration - 3,888 22,942 - 3 Of which: cash-based - 3,888 22,942 - 4 (Not applicable in the EU) EU-4a Of which: shares or equivalent
ownership interests - - - - 5 Of which: share-linked instruments or equivalent non-cash instruments - - - - EU-5x Of which: other instruments - - - - 6 (Not applicable in the EU) 7 Of which: other forms - - - - 8 (Not
applicable in the EU) 9 Variable remuneration Number of identified staff - 12 96 - 10 Total variable remuneration 252 6,913 11 Of which: cash-based - 252 6,913 12 Of which: deferred - - - - EU-13a Of which: shares or
equivalent ownership interests - - - - EU-14a Of which: deferred - - - - EU-13b Of which: share-linked instruments or equivalent non-cash instruments - - - - EU-14b Of which: deferred - - - - EU-14x Of which: other
instruments - - - - EU-14y Of which: deferred - - - - 15 Of which: other forms - - - - 16 Of which: deferred - - - - 17 Total remuneration (2 + 10) - 4,140 29,855 -
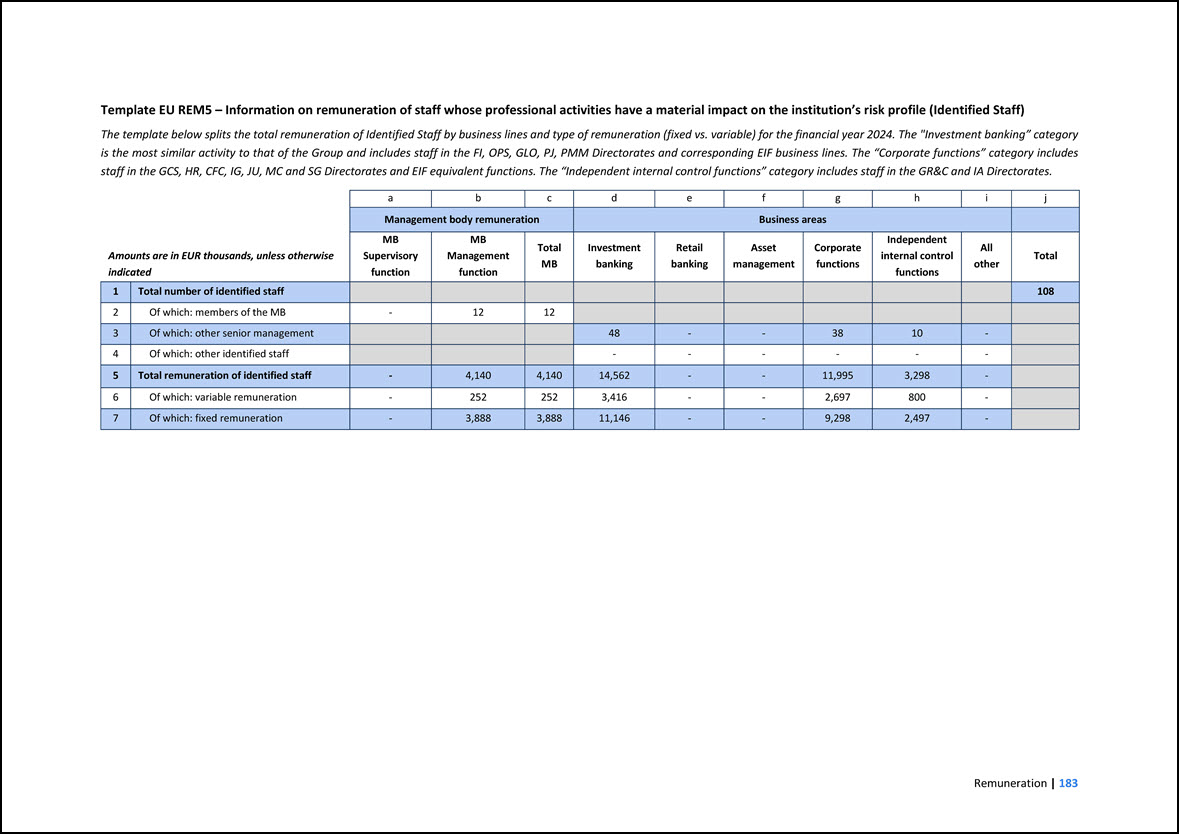
Template EU REM5 – Information on remuneration of staff whose professional activities have a material impact on the institution’s risk profile (Identified Staff) The
template below splits the total remuneration of Identified Staff by business lines and type of remuneration (fixed vs. variable) for the financial year 2024. The "Investment banking” category is the most similar activity to that of the Group and
includes staff in the FI, OPS, GLO, PJ, PMM Directorates and corresponding EIF business lines. The “Corporate functions” category includes staff in the GCS, HR, CFC, IG, JU, MC and SG Directorates and EIF equivalent functions. The “Independent
internal control functions” category includes staff in the GR&C and IA Directorates. Amounts are in EUR thousands, unless otherwise indicated a b c d e f g h i j Management body remuneration Business areas MB Supervisory function
MB Management function Total MB Investment banking Retail banking Asset management Corporate functions Independent internal control functions All other Total 1 Total number of identified staff 108 2 Of which: members of the
MB - 12 12 3 Of which: other senior management 48 - - 38 10 - 4 Of which: other identified staff - - - - - - 5 Total remuneration of identified staff - 4,140 4,140 14,562 - - 11,995 3,298 - 6 Of
which: variable remuneration - 252 252 3,416 - - 2,697 800 - 7 Of which: fixed remuneration - 3,888 3,888 11,146 - - 9,298 2,497 -
Remuneration of members of the management and supervisory functions The compensation of the EIB’s and the EIF’s governing bodies is defined by their respective
governance framework. Compensation of members of the governing bodies is composed of fixed allowances, fees or indemnities payable for their attendance at meetings and aiming to cover expenses related to such. The members of the Board of Governors
receive no remuneration from the EIB. Likewise, the EIF General Meeting is a non-remunerated governing body. The remuneration of the members of the EIB Board of Directors is composed of a fixed attendance allowance, for each meeting day in which
they participate, and a flat-rate subsistence allowance, to cover expenses if they have to stay overnight at the place of the meeting. The attendance allowance corresponds to EUR 600. The flat- rate subsistence allowance corresponds to EUR 250 for
each hotel night. The EIB also reimburses their travel expenses in respect of their attendance at meetings. The attendance allowance amount has been kept constant in nominal terms (no increase for inflation) since 2002. The remuneration of the
members of the EIF Board of Directors consists of an attendance fee of EUR 300 per meeting, a flat-rate daily allowance of EUR 220 to cover expenses, and the reimbursement of travel expenses. The EIB Audit Committee (“AC”) members do not receive
remuneration from the EIB. For each meeting of the AC that they attend, members and observers of the AC receive a daily attendance emolument of EUR 1,500 a day. The EIB pays a flat-rate subsistence allowance of EUR 250 in addition to the
reimbursement of travel expenses incurred by individual AC members. The members of the AC do not receive a bonus and are not paid for preparation times between the meetings. The remuneration of the members of the EIF Audit Board consists of an
attendance fee of EUR 1,500 per meeting, a flat-rate daily allowance of EUR 220 to cover expenses, and the reimbursement of travel expenses. The remuneration of the EIB’s MC members is disclosed under the “Identified Staff” sub-section.
15 APPENDIX 15.1 Appendix I – Overview of the EIB Group EIB The European Investment Bank was created by the Treaty of Rome in 1958 as the long-term lending
institution of the European Union (‘EU’). The EIB enjoys legal personality and financial autonomy and is endowed with its own decision-making bodies. The EIB’s Statute is drawn up as a Protocol (No 5) annexed to the Treaty on European Union (‘TEU’)
and the Treaty on the Functioning of the European Union (‘TFEU’). In accordance with Article 51 TEU, it forms an integral part of both Treaties. In accordance with its statutory framework, the mission of the Bank is to contribute towards the
integration, balanced development and economic and social cohesion of the EU Member States. To achieve this, the EIB raises substantial volumes of funds on the capital markets and lends these funds on favourable terms to projects furthering EU policy
objectives. Due to the particular nature of the EIB, its mission and its shareholder structure, there are a number of key aspects that differentiate the EIB from commercial banks: Governance Under its Statute the EIB is governed by a three-layer
structure: the BoG, the BoD and the MC. Supervision The EIB is neither subject to requirements for an authorisation nor supervised by an external supervisory banking authority and consequently is not subject to an SREP. Notwithstanding, the Bank is
committed through its Statute to conform to BBP applicable to it, which includes adherence to relevant EU banking legislation and guidelines, assessed pursuant to the criteria set out in the BBP Guiding Principles. Fully respecting its statutory
framework and duly considering its mission and mandate, the EIB determines which and how the BBP requirements apply to it, on an individual as well as on a consolidated basis. The AC, as part of its statutory duties, is required to verify, and report
to the Board of Governors that the activities of the Bank conform to best banking practice applicable to it. The EIB has adopted a framework for implementing an internal and specific review and evaluation process (the “EIB REP”) for which the Audit
Committee is responsible. This process has been framed by the EIB’s Review and Evaluation Guiding Principles, complemented by implementing rules and a methodology specific to the EIB Group. Overall, this framework is based on the EBA’s Guidelines on
the Supervisory Review and Evaluation Process, while considering the EIB’s specific nature, policy mission, specific tasks and governance structure. The EIB REP supports the Audit Committee in its role to verify that the EIB complies with applicable
BBP. Public policy-driven, operating on a non-profit-making basis The EIB differs considerably from commercial banks in that its activity is driven by public policy objectives and it operates on a non-profit-making basis, as specified in Article
309 TFEU. As such, the Bank does not have a specific statutory target for return on equity but rather aims at generating an income that shall enable it to meet its obligations, cover its expenses and risks and build up a reserve fund. Taxation The
EIB is not subject to national taxation and benefits from the provisions of the Protocol on Privileges and Immunities annexed to the EU Treaties (Protocol No 7).
Financial protection and preferred creditor status The principle of supremacy of EU primary law and the principle that the property of the EIB shall be exempt from
all forms of requisition and expropriation, as enshrined in the EIB Statute, are deemed to guarantee a full recovery of the EU sovereign exposures on maturity. This financial protection and the benefit of the preferred creditor status result in no
credit risk or impairment loss from Member States sovereign exposures are therefore not taken into account for the purposes of determining the EIB’s capital requirements. However, similarly to other creditors, the EIB is bound by the majority
decision based on collective action clauses included in debt instruments issued by EU sovereigns. Mandate business The EIB originates business on its own risk, and to a lesser extent, through a risk-sharing mechanism by which a third party – the
mandator – provides credit enhancement to the EIB or on behalf of third parties at their own risk. Shareholder structure The EIB’s shareholders comprise all EU Member States, which in addition to paid-in capital also commit to providing additional
capital to such extent as may be required for the Bank to meet its obligations, upon the request of the EIB (callable capital). Accounting standards The EIB uses the EU Accounting Directives for its standalone statutory and consolidated financial
statements. Consolidated financial statements are also prepared in accordance with the International Financial Reporting Standards as adopted by the European Union. EIF The EIF was established in 1994 by decision of the Board of Governors of the
EIB, with legal personality and financial autonomy. The EIF is a specialist provider of risk finance to small and medium-sized enterprises (‘SMEs’). It develops and implements equity and debt financial instruments which respond to the current
financing needs of European businesses. Similarly to the EIB, there are a number of important aspects that differentiate the EIF from commercial players. The following elements apply to the EIF: Governance Under its Statutes, the EIF is also
governed by a three-layer structure: the General Meeting, the Board of Directors and the Chief Executive. Supervision The EIF is not subject to prudential supervision but is committed through its Statutes to base its activities on sound banking
principles or other sound commercial principles, as applicable. The EIF Audit Board is responsible for the annual audit of the EIF and it shall confirm that EIF operations have been carried out in compliance with its Statutes and Rules of Procedure.
The remit of the Audit Board extends to monitoring and verifying compliance as concerns the application of sound banking principles or other sound commercial principles and practices, as applicable to the EIF.
Public policy-driven organisation The EIF differs from commercial players in that its task is to contribute to the objectives of the European Union. The level of
remuneration or other income sought by the EIF shall be determined in such a way as to reflect risks incurred, cover operating expenses, establish necessary reserves and generate an appropriate return on its resources. Taxation The EIF is not
subject to national taxation and benefits from the Protocol on Privileges and Immunities of the European Union annexed to the TFEU (Protocol No 7). Financial protection and preferred creditor status In line with the EIB, the EIF’s specific status
under EU law is deemed to guarantee a full recovery of the EU sovereign exposures on maturity. The EIF’s exposures to the EU Member States are deemed to benefit from the EIF’s preferred creditor status and are therefore treated as posing no risk of
loss to the EIF. However, similarly to other creditors, the EIF is bound by the majority decision based on collective action clauses included in debt instruments issued by EU sovereigns. Mandate business The EIF finances part of its operations out
of its own resources. In addition, the EIF may accept the task of administering resources entrusted to it by third parties (mandates). The majority of the EIF’s operations are currently funded under mandates governed by specific mandate agreements.
Under such mandates, the EIF deploys financial instruments in the form of cash investments, guarantees or other forms of credit enhancement. Shareholder structure The EIF’s shareholders comprise the EIB (59.7%), the European Union (29.7%), and
financial institutions (10.6%). The EIF’s shareholders have committed to provide additional capital (up to 80% of the par value of each share – callable capital) in addition to paid-in capital upon request by the EIF General Meeting and to the extent
required for the EIF to meet its liabilities towards its creditors. Accounting standards The EIF statutory financial statements are prepared in accordance with IFRS as adopted by the European Union.
15.2 Appendix II – Abbreviations ABS Asset-Backed Securities AC Audit Committee ALC EIF’s Asset and Liquidity Committee ALCO Assets & Liabilities
Management Committee ALM Asset and Liability Management ASF Available Stable Funding (ASF): amount of liabilities and own funds calculated as per Article 428i et seq. of the Capital Requirements Regulation. AT1 Additional Tier 1 (Capital): one
of the three elements composing regulatory own funds (together with the CET1 and T2). AT1 is composed of Additional Tier 1 items calculated as per Article 61 of the Capital Requirements Regulation. AVA Additional value adjustments (AVA) are
regulatory deductions from a bank's regulatory own funds due to its assets measured at fair value. BBP Best Banking Practice BPV Basis Point Value BPV sensitivity BPV sensitivity shows the change in the net present value (NPV) of interest
rate-sensitive instruments/portfolios due to a 1 basis point increase in the interest rate curves (shifting both pricing and discounting curves). BCBS Basel Committee on Banking Supervision BCL Banque Centrale du Luxembourg BIC The Business
Indicator Component (BIC) is a parameter used as part of the standardised approach for operational risk. This parameter is calculated by multiplying the business indicator (financial statement-based proxy for operational risk) by a set of regulatory
determined marginal coefficients. BoD Board of Directors BoG Board of Governors CA&ES Climate Action & Environmental Sustainability, as per the EIBG’s internal terminology CBR Climate Bank Roadmap CCBR Cross-Currency Basis Risk
CCF Credit conversion factor: ratio of the currently undrawn amount of a commitment that could be drawn as per Article 4(1)(56) of the CRR, and which is used to convert part of the unused part of credit facilities and other off-balance sheet items
into exposure at default amount. (Q)CCP (Qualifying) Central Counterparty (CCP) are financial institutions that facilitate trading of derivatives and equity products between counterparties, by becoming the buyer to every seller and the seller to
every buyer, in order to reduce the risk in the contracts traded. A qualifying CCP is a CCP as defined by Article 4(1)(88) of the CRR and by Article 2(1) of Regulation (EU) 648/2012. CCR Counterparty Credit Risk (CCR) is the risk that the
counterparty (usually of an over-the-counter derivatives transaction or securities financing transaction) defaults before the final settlement of the transaction’s cash flows, creating an economic loss for the institution. C&E Climate &
Environmental CEAC EIB Group Climate and Environment Advisory Council CEF The Connecting Europe Facility (CEF) is an EU programme to support the development of high-performing, sustainable and efficiently interconnected trans-European networks in
the fields of transport, energy and digital services. CET1 Common Equity Tier 1 (CET1) capital is one of the three elements composing regulatory own funds (together with the AT1 and T2). CET1 is composed of the CET1 items representing the highest
quality of regulatory capital, absorbing losses immediately when they occur and calculated as per Article 50 of the Capital Requirements Regulation. Group CFP Group Contingency Funding Plan CIUs Collective Investment Undertakings, as defined in
Article 4(1)(7) of the Capital Requirements Regulation. COP EIF Corporate Operational Plan, available on the EIF website. CRA Climate Risk Assessment CRCF Credit Risk Control function CRD Capital Requirements Directive or Directive 2013/36/EU
of the European Parliament and of the Council, as amended from time to time.
CRR Capital Requirements Regulation or Regulation (EU) No 575/2013 of the European Parliament and of the Council, as amended from time to time. CRGs Credit Risk
Guidelines CRM Credit Risk Mitigation (CRM) are techniques used by banks to mitigate credit risk, as defined in Article 4(1)(57) of the CRR. CRST Climate Risk Screening Tool CSA Credit Support Annex (CSA) is a legal document annexed on a
voluntary basis to an ISDA Master Agreement, which defines the terms and conditions under which collateral is posted to mitigate counterparty credit risk. CSD Central Securities Depositories (CSD) are entities operating a securities settlement
system and are responsible for the registration and safekeeping of securities as defined in Article 2(1)(1) of Regulation (EU) No 909/2014 of the European Parliament and of the Council of 23 July 2014, as amended from time to time. CSRBB Credit
spread risk from the banking book (referred to in the CRD as credit spread risk arising from non-trading book activities)129 CSRD EU Corporate Sustainability Reporting Directive CVA Credit Value Adjustment (CVA) reflects the current market value
of the credit risk of the counterparty to the institution as provided for under Article 381 of the CRR. DBO Defined-benefit obligations (DBO) represent the present value of the pension benefits earned by EIB/EIF’s employees. DPO Data Protection
Officer EAD Exposure at default (EAD) is the estimated amount owed by an obligor/borrower at the time of default. EBA European Banking Authority EBRD European Bank for Reconstruction and Development EC European Commission ECB European
Central Bank ECC Ethics and Compliance Committee ECSO Environment, Climate and Social Office EEPE Under the Internal Model Method, institutions shall calculate their exposure value to counterparty credit risk, taking into consideration their
Effective Expected Positive Exposure (EEPE), a measure of the expected increase in the exposure value of the contract over a horizon of maximum one year. EFTA European Free Trade Association EMAS European Eco-Management and Audit Scheme EFSD+
European Fund for Sustainable Development Plus EFSI The European Fund for Strategic Investments (EFSI) is the core of the Investment Plan for Europe, aimed at boosting long-term economic growth and competitiveness in the European Union. EGF The
Pan-European Guarantee Fund, set up the by EIB Group and backed by 22 Member States, is designed to help businesses weather the economic impact of COVID-19 and support innovation and transformation. The EGF is part of the EUR 540 billion EU recovery
package agreed in 2020 by EU leaders. It is the largest crisis mechanism that the EIB Group has put on the market, enabling immediate impact. EIA Directive Environmental Impact Assessment Directive EIB European Investment Bank EIBG European
Investment Bank Group EIF European Investment Fund EIG Equity Investments and Guarantees Department EL Expected Loss is the ratio of the amount expected to be lost on an exposure from a potential default of a counterparty or dilution over a
one-year period over the amount outstanding at default, as defined in Article 5 (3) of the CRR. ELM External Lending Mandate: strategic instrument, based on a guarantee from EU budget resources, through which the European Union supports investments
in partner countries. ELP EIB’s Energy Lending Policy EMP Equity Monitoring Procedures ERGs Equity Risk Guidelines ERPGs EIF Equity Risk Policy Guidelines ESDS Environmental and Social Data Sheet 129 EBA/GL/2022/14.
ESG Environmental, Social, Governance ESIA Environmental and Social Impact Assessment ESMA European Securities and Markets Authority ESRS European
Sustainability Reporting Standards ESSF The EIB Group Environmental and Social Framework EU European Union EU4U EU for Ukraine EU-AD EU Accounting Directives: Directive 2013/34/EU of the European Parliament and of the Council of 26 June 2013
on the annual financial statements, consolidated financial statements and related reports of certain types of undertakings, amending Directive 2006/43/EC of the European Parliament and of the Council and repealing Council Directives 78/660/EEC and
83/349/EEC Text with European Economic Area (EEA) relevance, as amended from time to time. EVE The Economic Value of Equity (EVE) is one of the metrics commonly used to monitor interest rate risk in the Banking Book. It is calculated as the
difference between the present value of all asset and liabilities as well as off-balance sheet items in the banking book, excluding own equity. EWS Early Warning Signals (EWS) are internal indicators intended to allow for the early detection and
prevention of deteriorating credit quality of counterparties or counterparties presenting higher risk characteristics requiring more enhanced monitoring. F4GE Financing for Gender Equality FI Financial Intermediary FRGs Financial Risk
Guidelines FSR Funding Spread Risk FX Foreign Exchange GAR Green Asset Ratio GCCO Group Chief Compliance Officer GCFP The Group Contingency Funding Plan (GCFP) defines the escalation procedures and course of actions in the event of a
liquidity crisis within the EIB Group. GCRO Group Chief Risk Officer GCSP Group Capital Sustainability Policy GCP Group Capital Plan GEMs Global Emerging Markets GHG Greenhouse gas GLO EIB Global GLR The General Loan Reserve (GLR) is
one of the Bank's two notional reserves (together with the Special Activities Reserve, or SAR), which covers expected losses resulting from the EIBG’s loan and guarantee portfolio. GMRA Global Master Repurchase Agreement (GMRA) is a model legal
agreement designed for parties transacting repos and is published by the International Capital Market Association (ICMA). This agreement allows for netting of amounts due under transactions governed by different agreements, often including one or
more GMRAs. GRMC Group Risk Management Charter GRMDR Group Risk Management Disclosure Report GRMF Group Risk Management Framework GR&C Group Risk and Compliance Directorate G-SIB / G-SII Global Systemically Important Banks (G-SIBs) or
institutions (G-SIIs) are financial institutions that can cause a significant disruption to the financial or economic system in case of default due to their size, complexity and interdependence with other institutions, as defined by Article 3 of the
CRD. GWWR General Wrong-Way Risk (GWWR) is the risk that arises from a situation in which there is a high (positive) correlation between the probability of default of a counterparty and general market risk factors affecting the exposure to that
counterparty. This includes, for example, fluctuations in interest rates which, in the context of derivative transactions (such as interest rate swaps), would lead to an increase in the value of the derivatives but also to a decrease of the
counterparty's creditworthiness (due to the increased liability). HQLA High-Quality Liquid Assets (HQLA) are assets of high liquidity and credit quality that can be easily and immediately converted into cash without significant loss of value, and
which are part of the liquidity buffer as per Article 6 of Regulation (EU) No 2015/61 of 10 October 2014, as amended from time to time. HRIA Human Rights Impact Assessment
IA Internal Audit ICAAP Internal Capital Adequacy Assessment Process: core internal risk management processes for institutions to assess and maintain on an ongoing
basis the amounts, types and distribution of internal capital that they consider adequate to cover the nature and level of the risks to which they are or might be exposed. ICT Information and Communications Technology IFRS International Financial
Reporting Standards IG Inspectorate General Directorate IIW The Infrastructure and Innovation Window (IIW) is one of the two components (together with the SME Window) of the European Fund for Strategic Investments (EFSI). ILAAP Internal
Liquidity Adequacy Assessment Process: core internal risk management processes and systems for the identification, measurement, management and monitoring of liquidity risk over an appropriate set of time horizons and management and monitoring of
funding positions, so as to ensure that institutions maintain adequate levels of liquidity buffers and adequate funding. ILM The Internal Loss Multiplier Regulatory (ILM) is a regulatory scaling factor used as part of the standardised approach for
operational risk. This factor is based on a bank’s average historical losses and the Business Indicator Component ('BIC'). IMA The Internal Model Approach (IMA) is one of the regulatory approaches available to banks to quantify the required capital
for market risk. This approach enables banks to use their own risk parameters to calculate a value at risk (VaR). IMM The Internal Model Method (IMM) is one of the regulatory approaches available to banks to quantify required capital for
counterparty credit risk. This approach enables banks to use their own risk parameters to quantify the required amount of capital for counterparty credit risk, subject to the explicit approval of their respective supervisors. IRB (A-IRB and F-IRB)
The Internal Ratings Based (IRB) approach is one of the regulatory approaches available to banks to quantify the required capital for credit risk. This approach enables banks to use their own risk parameters to quantify the required amount of capital
for credit risk, subject to the explicit approval of their respective supervisors. The difference between the Advanced and Foundation IRB (A-IRB and F-IRB) lies in the type of parameters modelled by banks, notably under the F-IRB LGDs are not
modelled. IRC Investment and Risk Committee IRM Internal Rating Methodology IRMMC Internal Rating Models Maintenance Committee IRRBB Interest Rate Risk in the Banking Book: the current and prospective risk of a negative impact on the
institution’s economic value of equity or net interest income, taking market value changes into account as appropriate, which arise from adverse movements in interest rates affecting interest rate-sensitive instruments, including gap risk, basis risk
and option risk 130. IRS Interest Rate Swaps are interest rate derivatives where a counterparty exchanges interest at a predetermined fixed rate against interest at a floating rate on a pre-determined notional. The floating rate is tied to an
interest rate market index in the leg currency and corresponding to the payment frequency (for example, 3 months Euribor), and resets at the beginning of the calculation period. The swap has two legs: one fixed leg and one floating leg. When both
legs are floating, it is referred to as a basis swap. ISDA International Swaps and Derivatives Association ISSB International Sustainability Standards Board ITS Implementing Technical Standards KPI Key Performance Indicator LCF EIB Group’s
Low Carbon Framework LCR The Liquidity Coverage Ratio (LCR) is a regulatory liquidity metric that aims to ensure that institutions maintain levels of liquidity buffers which are adequate to face any possible imbalance between liquidity inflows and
outflows under severely stressed conditions over a period of 30 days, as provided for under Article 412(1) of the CRR. LGD Loss Given Default (LGD) is the ratio of the loss on an exposure due to the default of a counterparty as defined under
Article 4(1)(55) of the CRR. LoD Line of defence LTA The look-through approach (LTA) is one of the regulatory approaches available to banks to calculate risk-weighted exposure amounts of CIUs. This approach enables banks, under certain
conditions, to look through to the individual 130 EBA GL/2022/14.
underlying exposures of a CIU to calculate the risk-weighted exposure amount of the CIU, risk weighting all underlying exposures of the CIU as if they were directly
held by those banks, as provided for under Article 132a(1) of the CRR. MBA The mandate-based approach (MBA) is one of the regulatory approaches available to banks to calculate risk-weighted exposure amounts of CIUs. This approach enables banks, if
they do not have sufficient information about the individual underlying exposures of a CIU, to calculate the risk- weighted exposure amount of those exposures in accordance with the limits set in the CIU's mandate and relevant law as per Article
132a(2) of the CRR. MC Management Committee MDA Maximum Distributable Amount (MDA) is the maximum amount that can be distributed by a bank as variable payment (such as to shareholders, holders of AT1 instruments or staff) to avoid depletion of
Common Equity Tier 1 capital below the level of the combined buffer requirements as per Article 141 of the CRD. MDB Multilateral Development Bank MIR Minimum internal rating MQS Minimum qualifying status MRC Model Risk Committee MREL The
minimum requirement for own funds and eligible liabilities (MREL) set by resolution authorities to ensure that banks maintain at all times sufficient eligible instruments to facilitate the implementation of the preferred resolution strategy, aimed at
preventing a bank’s resolution from depending on the provision of public financial support, and thereby ensuring that shareholders and creditors contribute to loss absorption and recapitalisation. NDICI Neighbourhood, Development and International
Cooperation Instrument: new instrument merging several former EU external financing instruments and aiming to support countries most in need to overcome long-term developmental challenges. NFR Non-Financial Risk NGFS Network for Greening the
Financial System NPE Non-performing Exposures (NPE) are exposures considered to be non-performing as per Article 47a of the CRR. NPL Non-performing loans are loans that qualify as non-performing exposures ('NPE'). NSFR The Net Stable Funding
Ratio (NSFR) is a regulatory liquidity metric that aims to limit overreliance on short-term wholesale funding and encourages better assessment of funding risk across all on- and off-balance sheet items, promoting funding stability. The NSFR is
calculated as per Article 428b of the CRR OCCO Office of the Chief Compliance Officer Group OP Group Operational Plan OPS Operations Directorate ORMF Operational Risk Management Framework OTC Over-the-counter (OTC) contracts are derivatives
contracts traded and negotiated directly between two parties (without going through an exchange). OTC derivatives also include transactions with central counterparties where contracts are based on novation. PATH Paris Alignment for Counterparties
PCS Preferred creditor status: for a sovereign debtor, status which creditors (clubs) grant to international financial organisations, by which they may enjoy a more favourable treatment than bilateral official creditors or commercial creditors in
the course of the rescheduling of the sovereign debt (political right). PD Probability of default (PD) of a counterparty over a one-year period as defined in Article 4(1)(54) of the CRR. PFE Potential Future Exposure PJ Projects Directorate
PPGs EIB Group’s Public Policy Goals PMM Portfolio Management and Monitoring PSE Public Sector Entity Group RAF The Group Risk Appetite Framework (RAF) is the overall framework (including policies, processes, limits, control and systems)
implemented by banks when establishing their risk appetite, including banks' policies, processes, limits, controls and systems put in place to define, communicate and monitor how much risk they are willing to take on. Group RAS The Group Risk
Appetite Statement (RAS) is the articulation in written form of the aggregate level and types of risk that a financial institution is willing to accept, or to avoid, in order to achieve its business objectives. RDI Research, Development and
Innovation
(S)REP The Bank is not subject to the Supervisory Review and Evaluation Process (SREP) but has put in place a similar internal process, the Review and Evaluation
Process (REP), to support the Audit Committee to verify EIB’s adherence with applicable Best Banking Practices. Group RP Group Recovery Plan RM Risk management RPC Board Committee on Risk Policy RSF The required amount of stable funding (RSF)
is calculated in accordance with Articles 428p et seq. of the CRR RWEA or RWA Risk-weighted exposure amounts (RWEA) or risk-weighted amounts (RWA) represent a measure of the risks that a bank is exposed to through its assets and off-balance sheet
items. SA The new standardised approach (SA) proposed by the BCBS and intended to replace the approaches currently available to banks under the CRR (expected to enter into force from January 2025 as part of CRR III), to quantify required capital
for operational risk. SA-CCR The Standardised Approach for Counterparty Credit Risk (SA-CCR) is one of the regulatory approaches available to banks to calculate their Exposure at Default (EAD) of derivatives and long-settlement transaction exposure
to counterparty credit risk based on the replacement cost and potential future exposure of the transactions. SAR The Special Activities Reserve (SAR) is one of the Bank's two notional reserves (together with the General Loan Reserve, or 'GLR'),
which covers unexpected losses of operations which are classified as Special Activities. SASB Sustainability Accounting Standards Board SDGs Sustainable Development Goals SEC-ERBA The Securitisation External Ratings Based Approach (SEC-ERBA) is
one of the regulatory approaches available to banks to quantify required capital for securitisation exposures. This approach relies on a formula using as an input the exposure's external credit rating. SEC-IAA The Securitisation Internal Assessment
Approach (SEC-IAA) is a regulatory approach available to banks to quantify required capital for certain Asset-Backed Commercial Paper transactions. This approach relies on the institutions' internal assessments of the credit quality of the
transaction. SEC-IRBA The Securitisation IRB Approach (SEC-IRBA) is one of the regulatory approaches available to banks to quantify required capital for securitisation exposures. This approach relies on a formula using as an input the Bank's own
risk parameters calculated at the level of the underlying portfolio. SEC-SA The Securitisation Standardised Approach (SEC-SA) is one of the regulatory approaches available to banks to quantify required capital for securitisation exposures. This
approach relies on a formula using as an input the exposure's underlying portfolio delinquency rates and respective asset classes. SFT Securities Financing Transactions (SFTs) are the financial operations listed in Article 4(1)(139) of the CRR such
as repurchase transactions (repos), buy-sell back/sell-buy back transactions or margin lending. SG Secretariat General SEA Directive Strategic Environmental Assessment SICR Significant increase in credit risk SMEs Small and medium-sized
enterprises, as defined by Commission Recommendation 2003/361. SRT Securitisation transactions are considered as meeting the significant risk transfer (SRT) criteria as per Title 2, Chapter 5, Section 2 of the CRR. SSPA Sub-sovereign public
authority SSPE Securitisation special purpose entities (SSPEs) are corporation trusts or entities, other than a credit institution or an investment firm, organised for carrying out securitisations. The activities of these entities, which are
structured to isolate the obligations of the originator institution, are limited to those appropriate to accomplish the objective of the securitisation issuance as per Article 4(1)(66) of the CRR. STS Simple, transparent and standardised: technical
characteristics applicable to securitisation instruments, which are allowed to use that designation as per Article 18 of Regulation (EU) 2017/2402 of the European Parliament and of the Council of 12 December 2017, as amended from time to time. SWWR
Specific Wrong-Way Risk (SWWR) is a risk arising from a situation in which future exposure to a specific counterparty is highly (positively) correlated with the counterparty’s credit quality due to the nature of the transactions with that
counterparty. This includes for example, accepting securities issued by a given counterparty (or closely related entity) as collateral to secure a transaction with that same counterparty. S&P Standard & Poor’s
T2 Tier 2 (T2) capital is one of the three elements composing regulatory own funds (together with the CET1 and AT1). T2 is made up of T2 items (including T2
instruments complying with the conditions of Article 63 and to the extent of Article 64 of the CRR) calculated as per Article 71 of the CRR. TBR Tenor Basis Risk TCFD Task Force on Climate-related Financial Disclosures TEU Treaty on European
Union TFEU Treaty on the Functioning of the European Union TLAC Total loss-absorbing capacity: regulatory requirement for G-SIBs to hold a sufficient amount of own funds and highly loss-absorbing (enabling a “bail-in”) liabilities to ensure
smooth and fast absorption of losses and recapitalisation in the event of a resolution. UNGPs United Nations Guiding Principles on Business and Human Rights UTP Unlikely To Pay (UTP) is one of the two criteria considered to determine the default
of a particular obligor as per Article 178(1) and (3) of the CRR. VaR Value at Risk (VaR) is a probabilistic method used to measure the potential loss in value of an asset over a given time period for a specified distribution of historical returns
and at a given confidence interval.
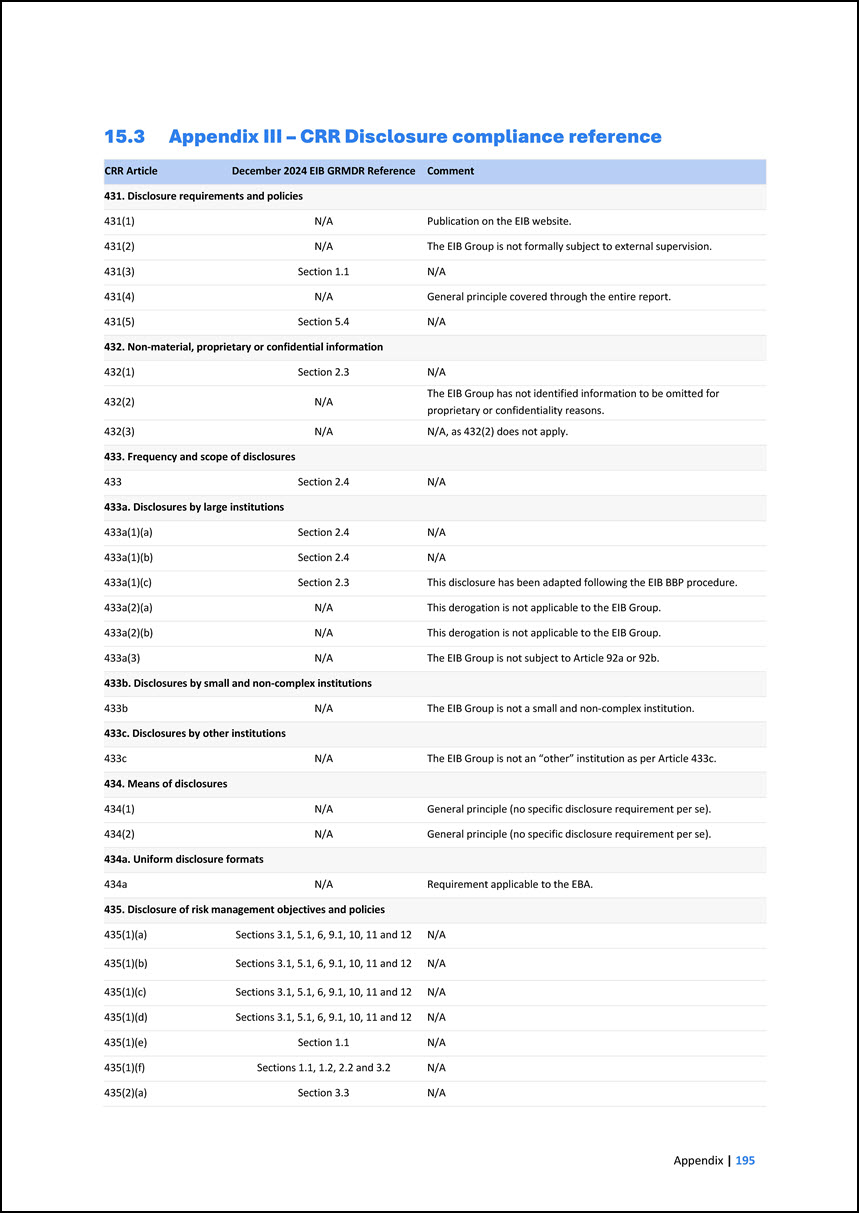
15.3 Appendix III – CRR Disclosure compliance reference CRR Article December 2024 EIB GRMDR Reference Comment 431. Disclosure requirements and policies 431(1)
N/A Publication on the EIB website. 431(2) N/A The EIB Group is not formally subject to external supervision. 431(3) Section 1.1 N/A 431(4) N/A General principle covered through the entire report. 431(5) Section 5.4 N/A 432.
Non-material, proprietary or confidential information 432(1) Section 2.3 N/A 432(2) N/A The EIB Group has not identified information to be omitted for proprietary or confidentiality reasons. 432(3) N/A N/A, as 432(2) does not apply. 433.
Frequency and scope of disclosures 433 Section 2.4 N/A 433a. Disclosures by large institutions 433a(1)(a) Section 2.4 N/A 433a(1)(b) Section 2.4 N/A 433a(1)(c) Section 2.3 This disclosure has been adapted following the EIB BBP
procedure. 433a(2)(a) N/A This derogation is not applicable to the EIB Group. 433a(2)(b) N/A This derogation is not applicable to the EIB Group. 433a(3) N/A The EIB Group is not subject to Article 92a or 92b. 433b. Disclosures by small and
non-complex institutions 433b N/A The EIB Group is not a small and non-complex institution. 433c. Disclosures by other institutions 433c N/A The EIB Group is not an “other” institution as per Article 433c. 434. Means of disclosures 434(1)
N/A General principle (no specific disclosure requirement per se). 434(2) N/A General principle (no specific disclosure requirement per se). 434a. Uniform disclosure formats 434a N/A Requirement applicable to the EBA. 435. Disclosure of risk
management objectives and policies 435(1)(a) Sections 3.1, 5.1, 6, 9.1, 10, 11 and 12 N/A 435(1)(b) Sections 3.1, 5.1, 6, 9.1, 10, 11 and 12 N/A 435(1)(c) Sections 3.1, 5.1, 6, 9.1, 10, 11 and 12 N/A 435(1)(d) Sections 3.1, 5.1, 6, 9.1,
10, 11 and 12 N/A 435(1)(e) Section 1.1 N/A 435(1)(f) Sections 1.1, 1.2, 2.2 and 3.2 N/A 435(2)(a) Section 3.3 N/A
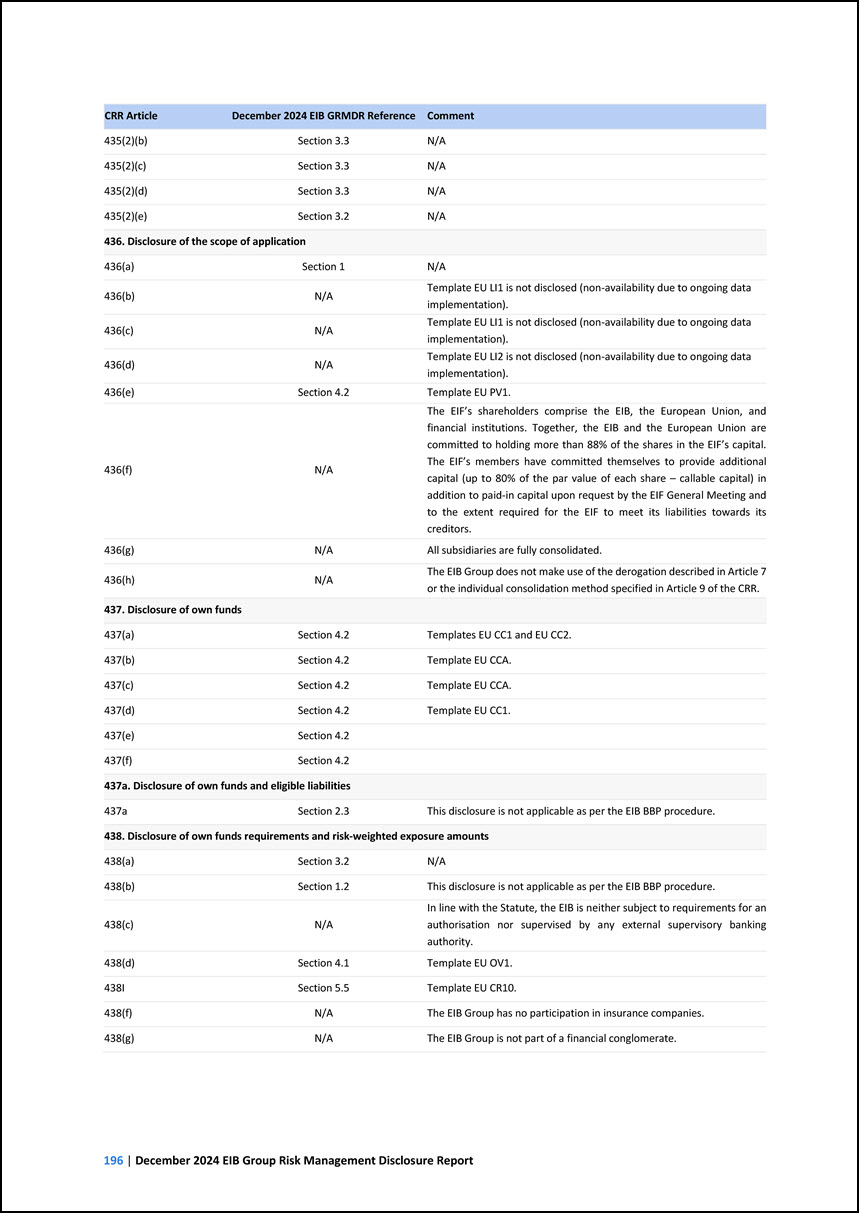
CRR Article December 2024 EIB GRMDR Reference Comment 435(2)(b) Section 3.3 N/A 435(2)(c) Section 3.3 N/A 435(2)(d) Section 3.3 N/A 435(2)(e) Section 3.2
N/A 436. Disclosure of the scope of application 436(a) Section 1 N/A 436(b) N/A Template EU LI1 is not disclosed (non-availability due to ongoing data implementation). 436(c) N/A Template EU LI1 is not disclosed (non-availability due to
ongoing data implementation). 436(d) N/A Template EU LI2 is not disclosed (non-availability due to ongoing data implementation). 436(e) Section 4.2 Template EU PV1. 436(f) N/A The EIF’s shareholders comprise the EIB, the European Union, and
financial institutions. Together, the EIB and the European Union are committed to holding more than 88% of the shares in the EIF’s capital. The EIF’s members have committed themselves to provide additional capital (up to 80% of the par value of each
share – callable capital) in addition to paid-in capital upon request by the EIF General Meeting and to the extent required for the EIF to meet its liabilities towards its creditors. 436(g) N/A All subsidiaries are fully consolidated. 436(h)
N/A The EIB Group does not make use of the derogation described in Article 7 or the individual consolidation method specified in Article 9 of the CRR. 437. Disclosure of own funds 437(a) Section 4.2 Templates EU CC1 and EU CC2. 437(b) Section
4.2 Template EU CCA. 437(c) Section 4.2 Template EU CCA. 437(d) Section 4.2 Template EU CC1. 437(e) Section 4.2 437(f) Section 4.2 437a. Disclosure of own funds and eligible liabilities 437a Section 2.3 This disclosure is not
applicable as per the EIB BBP procedure. 438. Disclosure of own funds requirements and risk-weighted exposure amounts 438(a) Section 3.2 N/A 438(b) Section 1.2 This disclosure is not applicable as per the EIB BBP procedure. 438(c) N/A In
line with the Statute, the EIB is neither subject to requirements for an authorisation nor supervised by any external supervisory banking authority. 438(d) Section 4.1 Template EU OV1. 438I Section 5.5 Template EU CR10. 438(f) N/A The EIB
Group has no participation in insurance companies. 438(g) N/A The EIB Group is not part of a financial conglomerate.
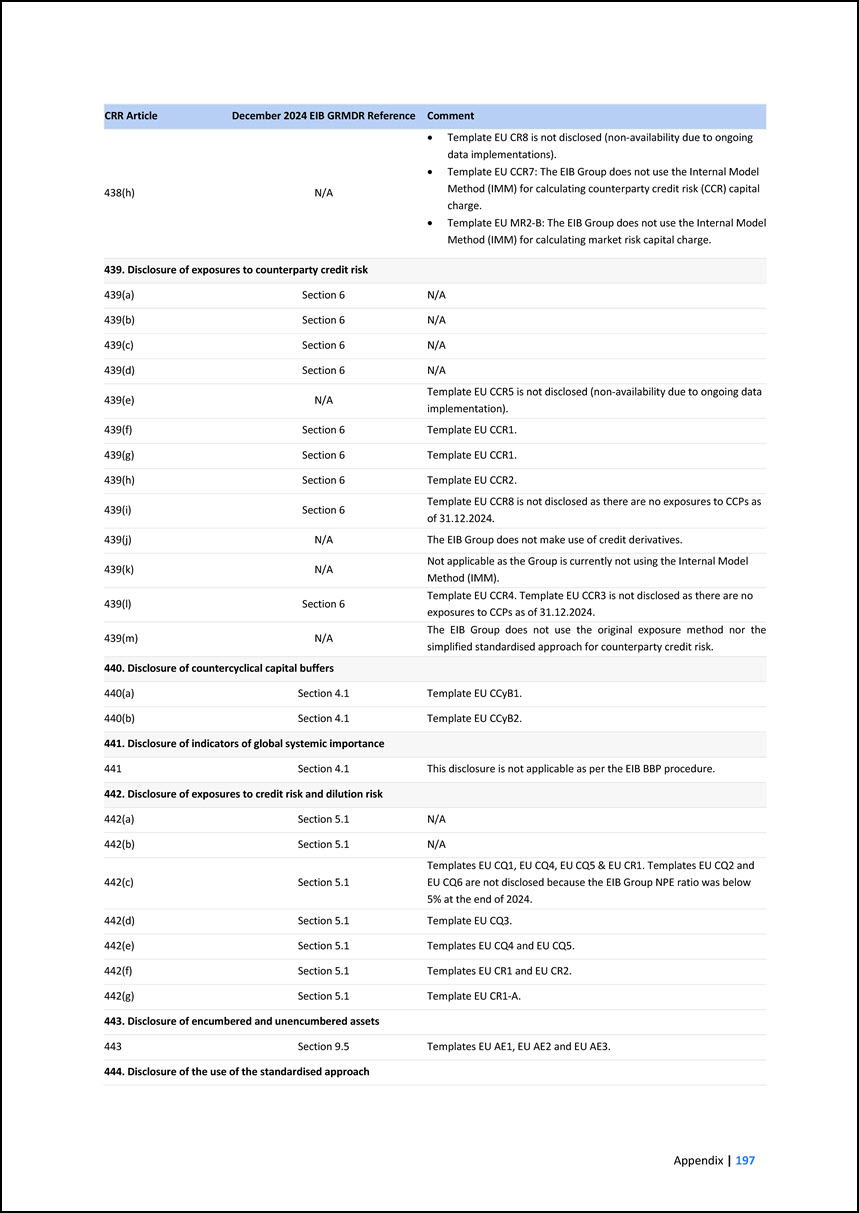
CRR Article December 2024 EIB GRMDR Reference Comment 438(h) N/A • Template EU CR8 is not disclosed (non-availability due to ongoing data implementations). •
Template EU CCR7: The EIB Group does not use the Internal Model Method (IMM) for calculating counterparty credit risk (CCR) capital charge. • Template EU MR2-B: The EIB Group does not use the Internal Model Method (IMM) for calculating market risk
capital charge. 439. Disclosure of exposures to counterparty credit risk 439(a) Section 6 N/A 439(b) Section 6 N/A 439(c) Section 6 N/A 439(d) Section 6 N/A 439(e) N/A Template EU CCR5 is not disclosed (non-availability due to ongoing
data implementation). 439(f) Section 6 Template EU CCR1. 439(g) Section 6 Template EU CCR1. 439(h) Section 6 Template EU CCR2. 439(i) Section 6 Template EU CCR8 is not disclosed as there are no exposures to CCPs as of 31.12.2024. 439(j)
N/A The EIB Group does not make use of credit derivatives. 439(k) N/A Not applicable as the Group is currently not using the Internal Model Method (IMM). 439(l) Section 6 Template EU CCR4. Template EU CCR3 is not disclosed as there are no
exposures to CCPs as of 31.12.2024. 439(m) N/A The EIB Group does not use the original exposure method nor the simplified standardised approach for counterparty credit risk. 440. Disclosure of countercyclical capital buffers 440(a) Section 4.1
Template EU CCyB1. 440(b) Section 4.1 Template EU CCyB2. 441. Disclosure of indicators of global systemic importance 441 Section 4.1 This disclosure is not applicable as per the EIB BBP procedure. 442. Disclosure of exposures to credit risk
and dilution risk 442(a) Section 5.1 N/A 442(b) Section 5.1 N/A 442(c) Section 5.1 Templates EU CQ1, EU CQ4, EU CQ5 & EU CR1. Templates EU CQ2 and EU CQ6 are not disclosed because the EIB Group NPE ratio was below 5% at the end of 2024.
442(d) Section 5.1 Template EU CQ3. 442(e) Section 5.1 Templates EU CQ4 and EU CQ5. 442(f) Section 5.1 Templates EU CR1 and EU CR2. 442(g) Section 5.1 Template EU CR1-A. 443. Disclosure of encumbered and unencumbered assets 443 Section
9.5 Templates EU AE1, EU AE2 and EU AE3. 444. Disclosure of the use of the standardised approach
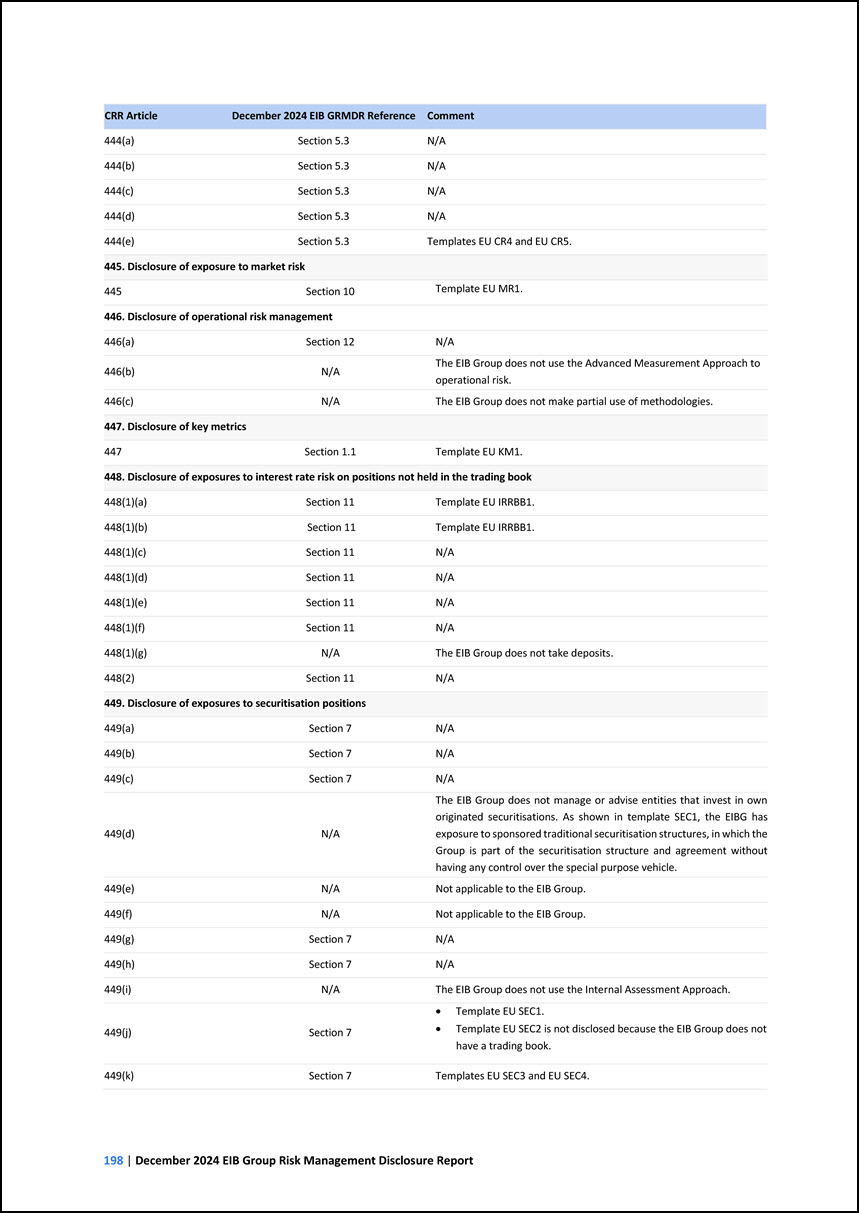
CRR Article December 2024 EIB GRMDR Reference Comment 444(a) Section 5.3 N/A 444(b) Section 5.3 N/A 444(c) Section 5.3 N/A 444(d) Section 5.3 N/A
444(e) Section 5.3 Templates EU CR4 and EU CR5. 445. Disclosure of exposure to market risk 445 Section 10 Template EU MR1. 446. Disclosure of operational risk management 446(a) Section 12 N/A 446(b) N/A The EIB Group does not use the
Advanced Measurement Approach to operational risk. 446(c) N/A The EIB Group does not make partial use of methodologies. 447. Disclosure of key metrics 447 Section 1.1 Template EU KM1. 448. Disclosure of exposures to interest rate risk on
positions not held in the trading book 448(1)(a) Section 11 Template EU IRRBB1. 448(1)(b) Section 11 Template EU IRRBB1. 448(1)(c) Section 11 N/A 448(1)(d) Section 11 N/A 448(1)(e) Section 11 N/A 448(1)(f) Section 11 N/A 448(1)(g)
N/A The EIB Group does not take deposits. 448(2) Section 11 N/A 449. Disclosure of exposures to securitisation positions 449(a) Section 7 N/A 449(b) Section 7 N/A 449(c) Section 7 N/A 449(d) N/A The EIB Group does not manage or
advise entities that invest in own originated securitisations. As shown in template SEC1, the EIBG has exposure to sponsored traditional securitisation structures, in which the Group is part of the securitisation structure and agreement without
having any control over the special purpose vehicle. 449(e) N/A Not applicable to the EIB Group. 449(f) N/A Not applicable to the EIB Group. 449(g) Section 7 N/A 449(h) Section 7 N/A 449(i) N/A The EIB Group does not use the Internal
Assessment Approach. 449(j) Section 7 • Template EU SEC1. • Template EU SEC2 is not disclosed because the EIB Group does not have a trading book. 449(k) Section 7 Templates EU SEC3 and EU SEC4.
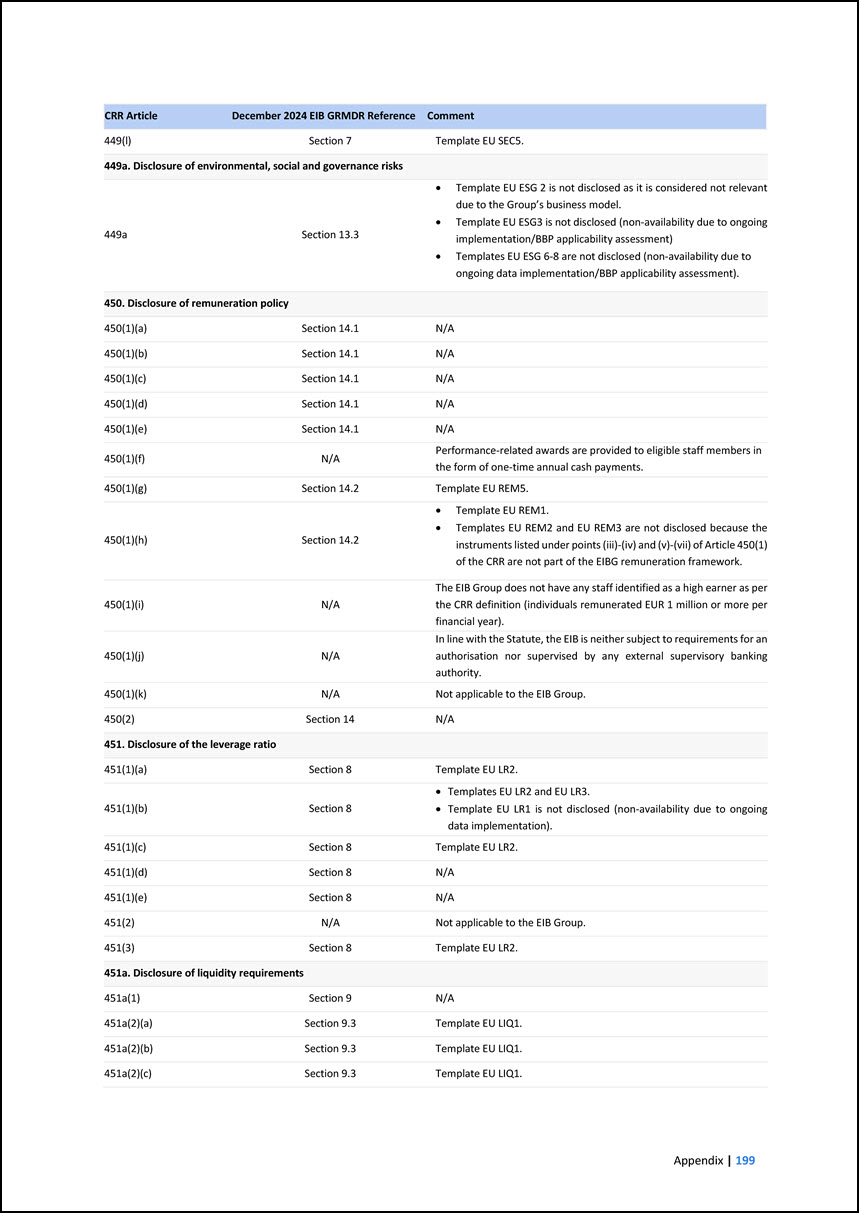
CRR Article December 2024 EIB GRMDR Reference Comment 449(l) Section 7 Template EU SEC5. 449a. Disclosure of environmental, social and governance risks 449a
Section 13.3 • Template EU ESG 2 is not disclosed as it is considered not relevant due to the Group’s business model. • Template EU ESG3 is not disclosed (non-availability due to ongoing implementation/BBP applicability assessment) • Templates EU
ESG 6-8 are not disclosed (non-availability due to ongoing data implementation/BBP applicability assessment). 450. Disclosure of remuneration policy 450(1)(a) Section 14.1 N/A 450(1)(b) Section 14.1 N/A 450(1)(c) Section 14.1 N/A
450(1)(d) Section 14.1 N/A 450(1)(e) Section 14.1 N/A 450(1)(f) N/A Performance-related awards are provided to eligible staff members in the form of one-time annual cash payments. 450(1)(g) Section 14.2 Template EU REM5. 450(1)(h)
Section 14.2 • Template EU REM1. • Templates EU REM2 and EU REM3 are not disclosed because the instruments listed under points (iii)-(iv) and (v)-(vii) of Article 450(1) of the CRR are not part of the EIBG remuneration framework. 450(1)(i) N/A
The EIB Group does not have any staff identified as a high earner as per the CRR definition (individuals remunerated EUR 1 million or more per financial year). 450(1)(j) N/A In line with the Statute, the EIB is neither subject to requirements for
an authorisation nor supervised by any external supervisory banking authority. 450(1)(k) N/A Not applicable to the EIB Group. 450(2) Section 14 N/A 451. Disclosure of the leverage ratio 451(1)(a) Section 8 Template EU LR2. 451(1)(b)
Section 8 • Templates EU LR2 and EU LR3. • Template EU LR1 is not disclosed (non-availability due to ongoing data implementation). 451(1)(c) Section 8 Template EU LR2. 451(1)(d) Section 8 N/A 451(1)(e) Section 8 N/A 451(2) N/A Not
applicable to the EIB Group. 451(3) Section 8 Template EU LR2. 451a. Disclosure of liquidity requirements 451a(1) Section 9 N/A 451a(2)(a) Section 9.3 Template EU LIQ1. 451a(2)(b) Section 9.3 Template EU LIQ1. 451a(2)(c) Section 9.3
Template EU LIQ1.
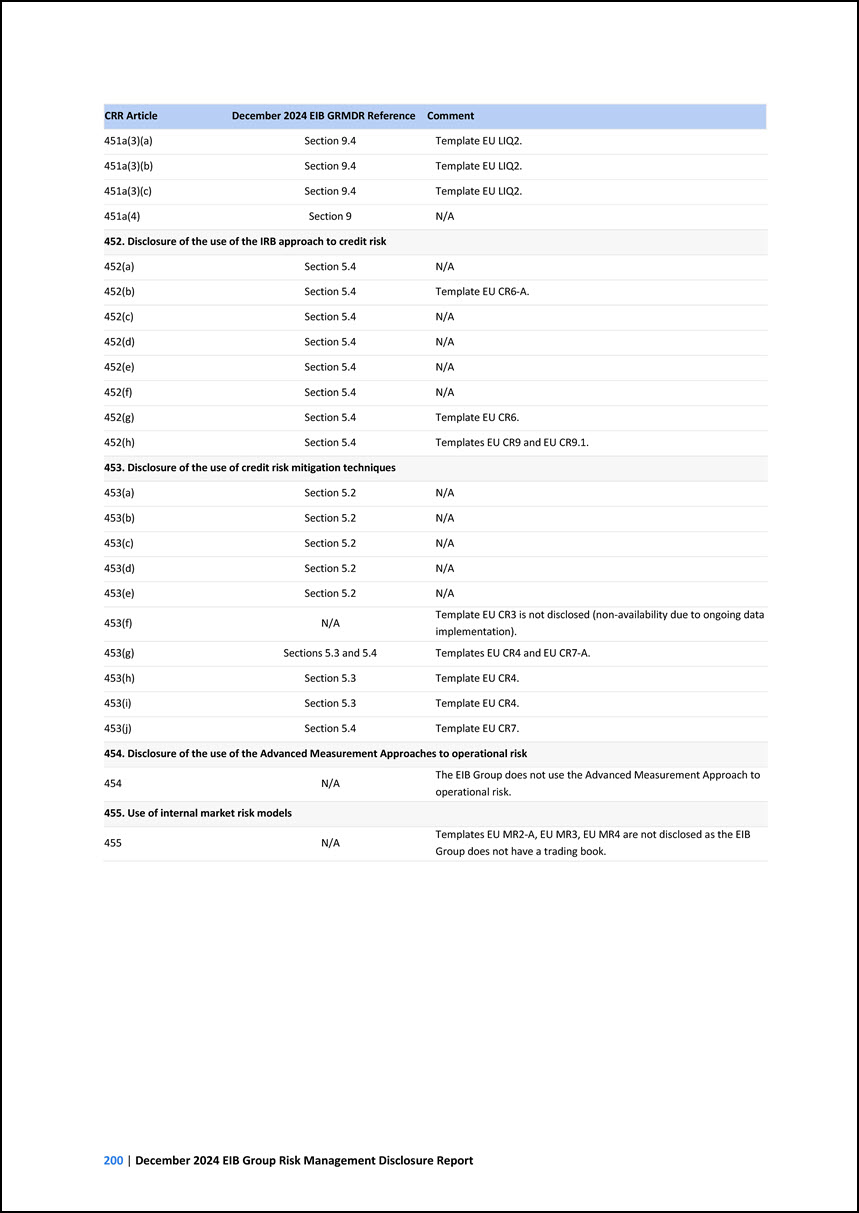
CRR Article December 2024 EIB GRMDR Reference Comment 451a(3)(a) Section 9.4 Template EU LIQ2. 451a(3)(b) Section 9.4 Template EU LIQ2. 451a(3)(c) Section
9.4 Template EU LIQ2. 451a(4) Section 9 N/A 452. Disclosure of the use of the IRB approach to credit risk 452(a) Section 5.4 N/A 452(b) Section 5.4 Template EU CR6-A. 452(c) Section 5.4 N/A 452(d) Section 5.4 N/A 452(e) Section
5.4 N/A 452(f) Section 5.4 N/A 452(g) Section 5.4 Template EU CR6. 452(h) Section 5.4 Templates EU CR9 and EU CR9.1. 453. Disclosure of the use of credit risk mitigation techniques 453(a) Section 5.2 N/A 453(b) Section 5.2 N/A
453(c) Section 5.2 N/A 453(d) Section 5.2 N/A 453(e) Section 5.2 N/A 453(f) N/A Template EU CR3 is not disclosed (non-availability due to ongoing data implementation). 453(g) Sections 5.3 and 5.4 Templates EU CR4 and EU CR7-A. 453(h)
Section 5.3 Template EU CR4. 453(i) Section 5.3 Template EU CR4. 453(j) Section 5.4 Template EU CR7. 454. Disclosure of the use of the Advanced Measurement Approaches to operational risk 454 N/A The EIB Group does not use the Advanced
Measurement Approach to operational risk. 455. Use of internal market risk models 455 N/A Templates EU MR2-A, EU MR3, EU MR4 are not disclosed as the EIB Group does not have a trading book.
DECEMBER 2024 EUROPEAN INVESTMENT BANK GROUP RISK MANAGEMENT DISCLOSURE REPORT ©
European Investment Bank, 06/2025 EN 2025-0031