What were the Fund costs for the past year?
(based on a hypothetical $10,000 investment)
Class Name | Costs of a $10,000 investment | Costs paid as a percentage of a $10,000 investment |
|---|---|---|
AGOX | $125 | 1.19% |
How did the Fund perform last year and what affected its performance?
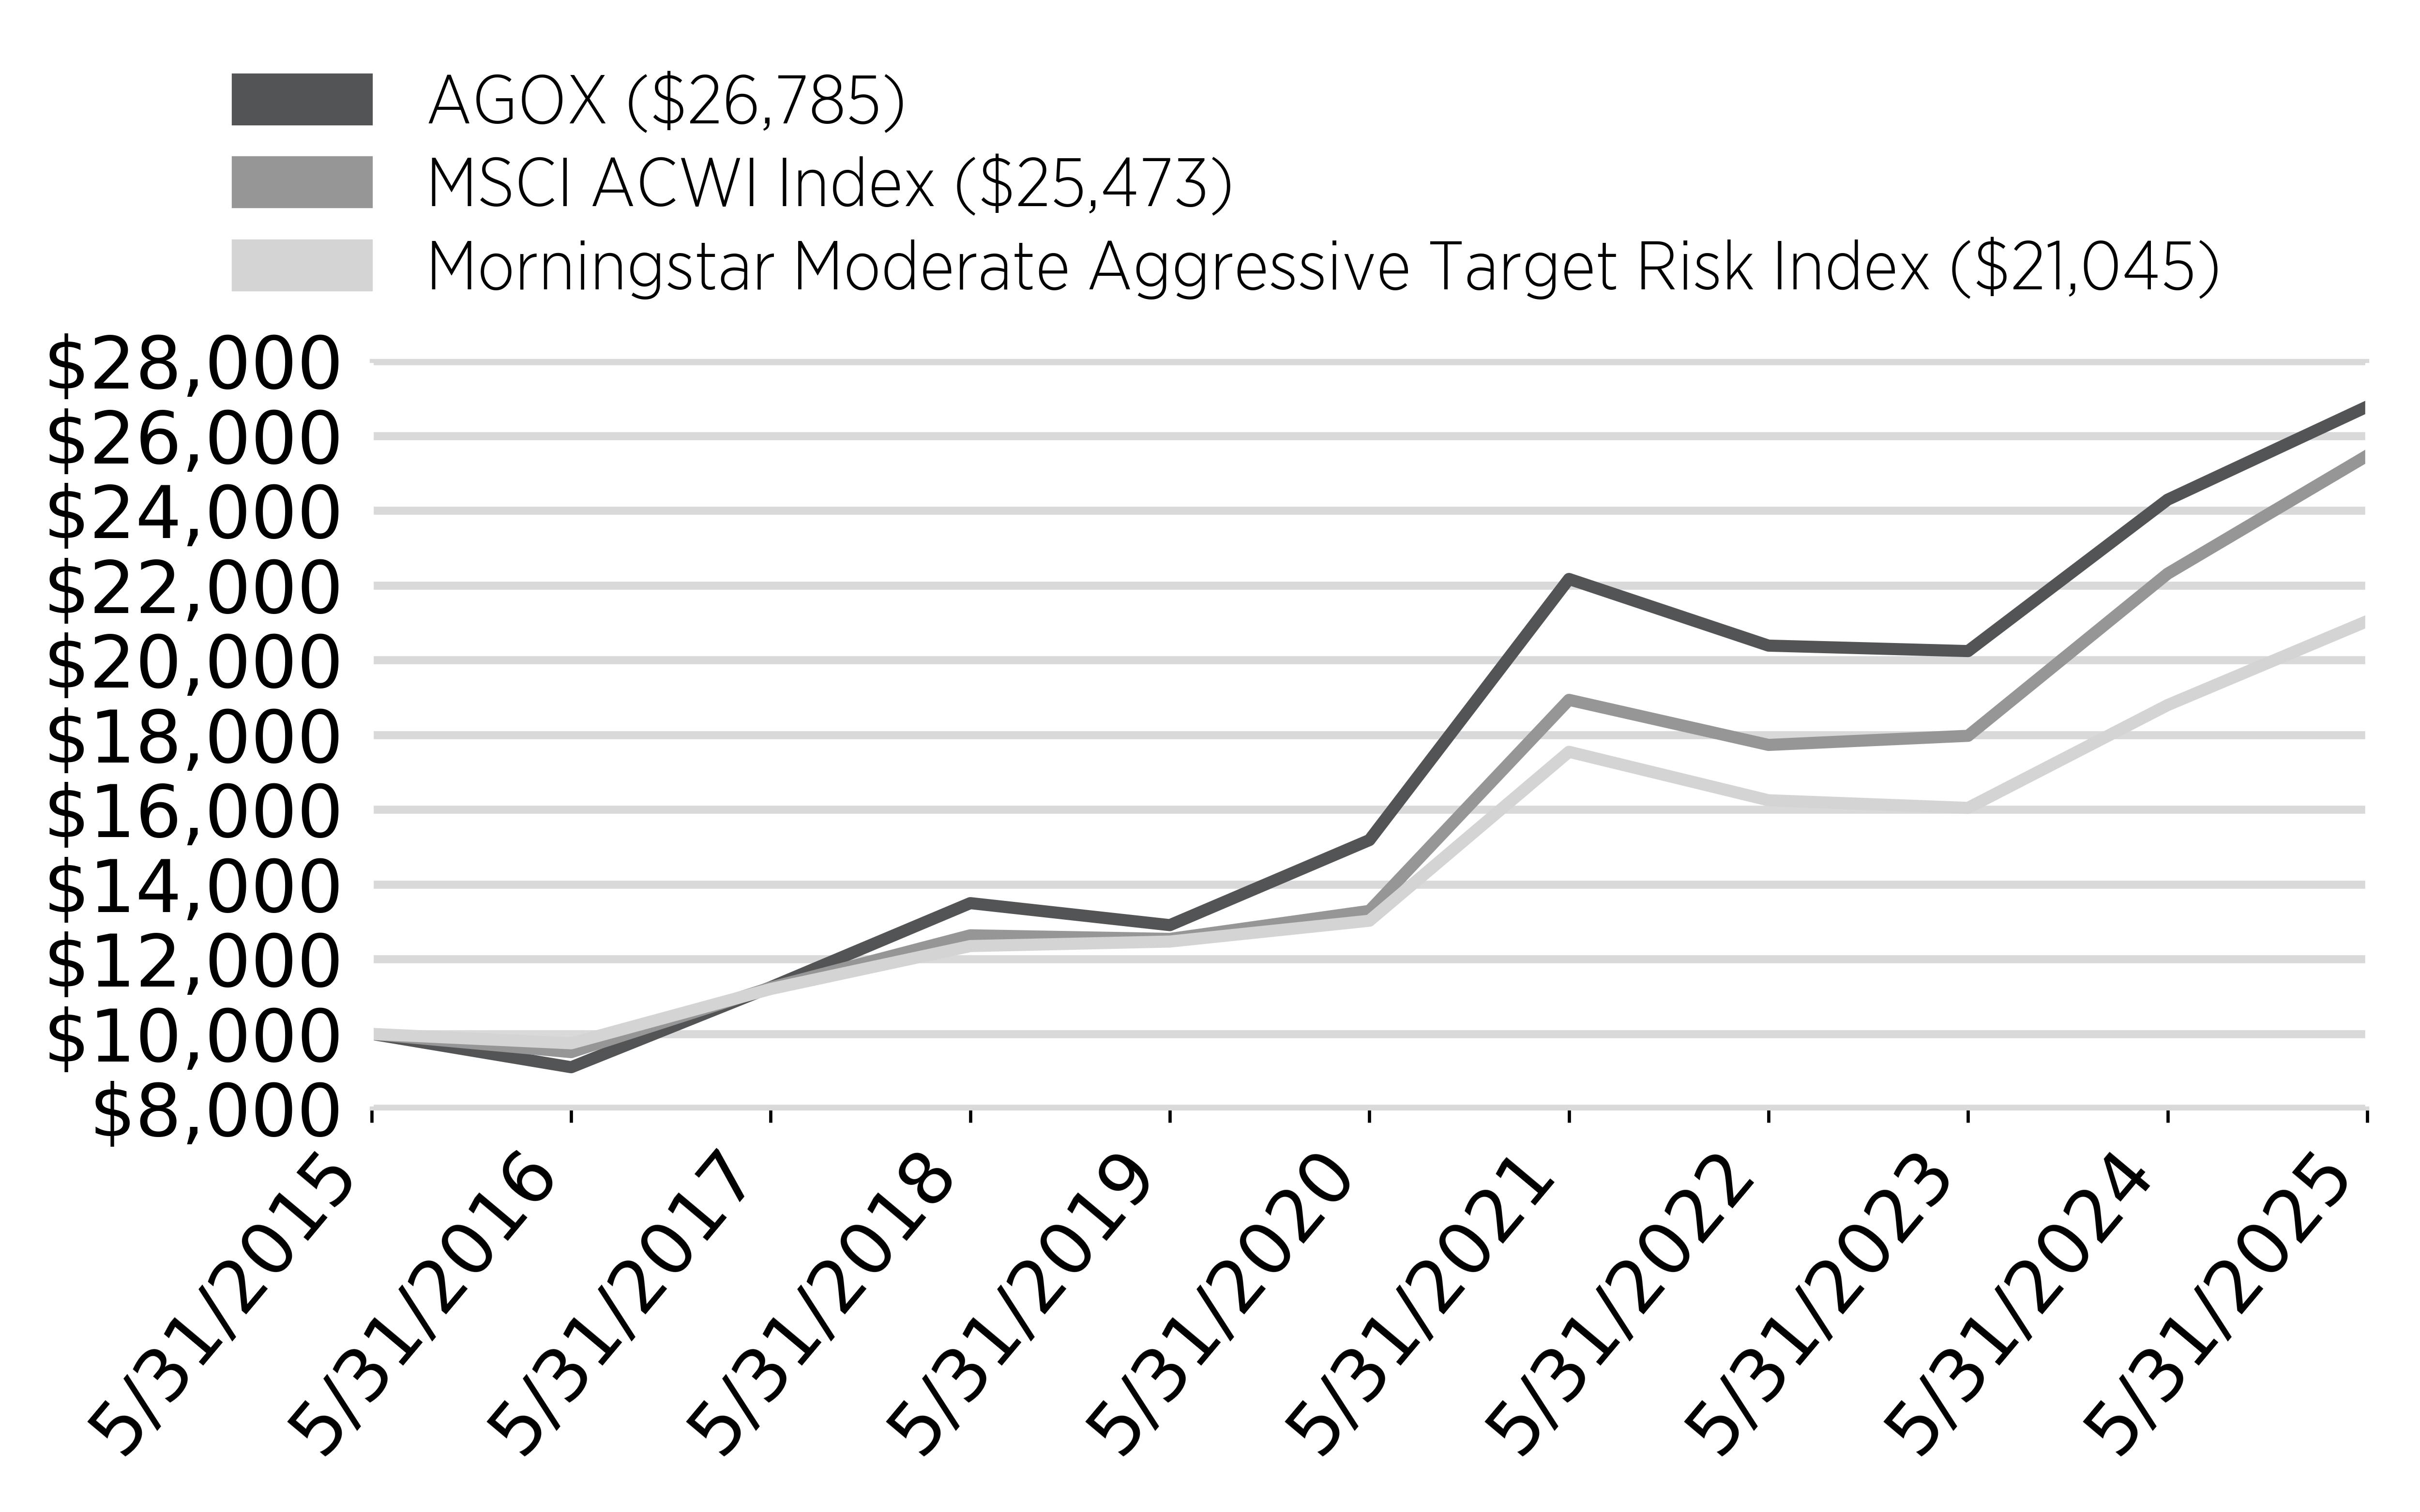
For the fiscal year ended May 31, 2025, the Fund returned 10.13%.The Fund underperformed the MSCI ACWI Index and the Morningstar Moderate Aggressive Target Risk Index, which returned 14.16% and 11.96%, respectively, for the same period.
Adaptive Alpha Opportunities ETF (AGOX) remains largely diversified across countries and sectors. There are periods where AGOX uses its “Global-go-anywhere” classification to take advantage of a focused approach to a sector or group of sectors.During the one year period ended 5/31/2025, AGOX held modest allocations towards tech and semiconductor related positions. The VanEck Semiconductor ETF (SMH), Technology Select Sector SPDR ETF (XLK), and Invesco QQQ Trust (QQQ) all had drawdowns during the period that exceeded that of the benchmark resulting in a negative impact on relative performance. This impact was greatest during the semiconductor related sell offs in August 2024 and January 2025. US equity markets have generally trended positively over past year, which has benefitted the Fund's US growth-oriented portfolio.
The main detractors from performance included:
• Super Micro Computer Inc (SMCI)
• Meta Platform Inc Class A (META)
• Novo Nordisk AS ADR (NVO)
The main contributors to performance included:
• Howmet Aerospace Inc (HWM)
• NVIDIA Corp (NVDA)
• Carpenter Technology Corp (CRS)
Cumulative Performance
From June 1, 2024 through May 31, 2025
Initial Investment of $10,000
Average Annual Total Returns
Key Fund Statistics
(as of May 31, 2025)
Fund Size | $316,695,429 |
Number of Holdings | 200 |
Net Advisory Fee | $3,079,699 |
Portfolio Turnover Rate | 508.72% |
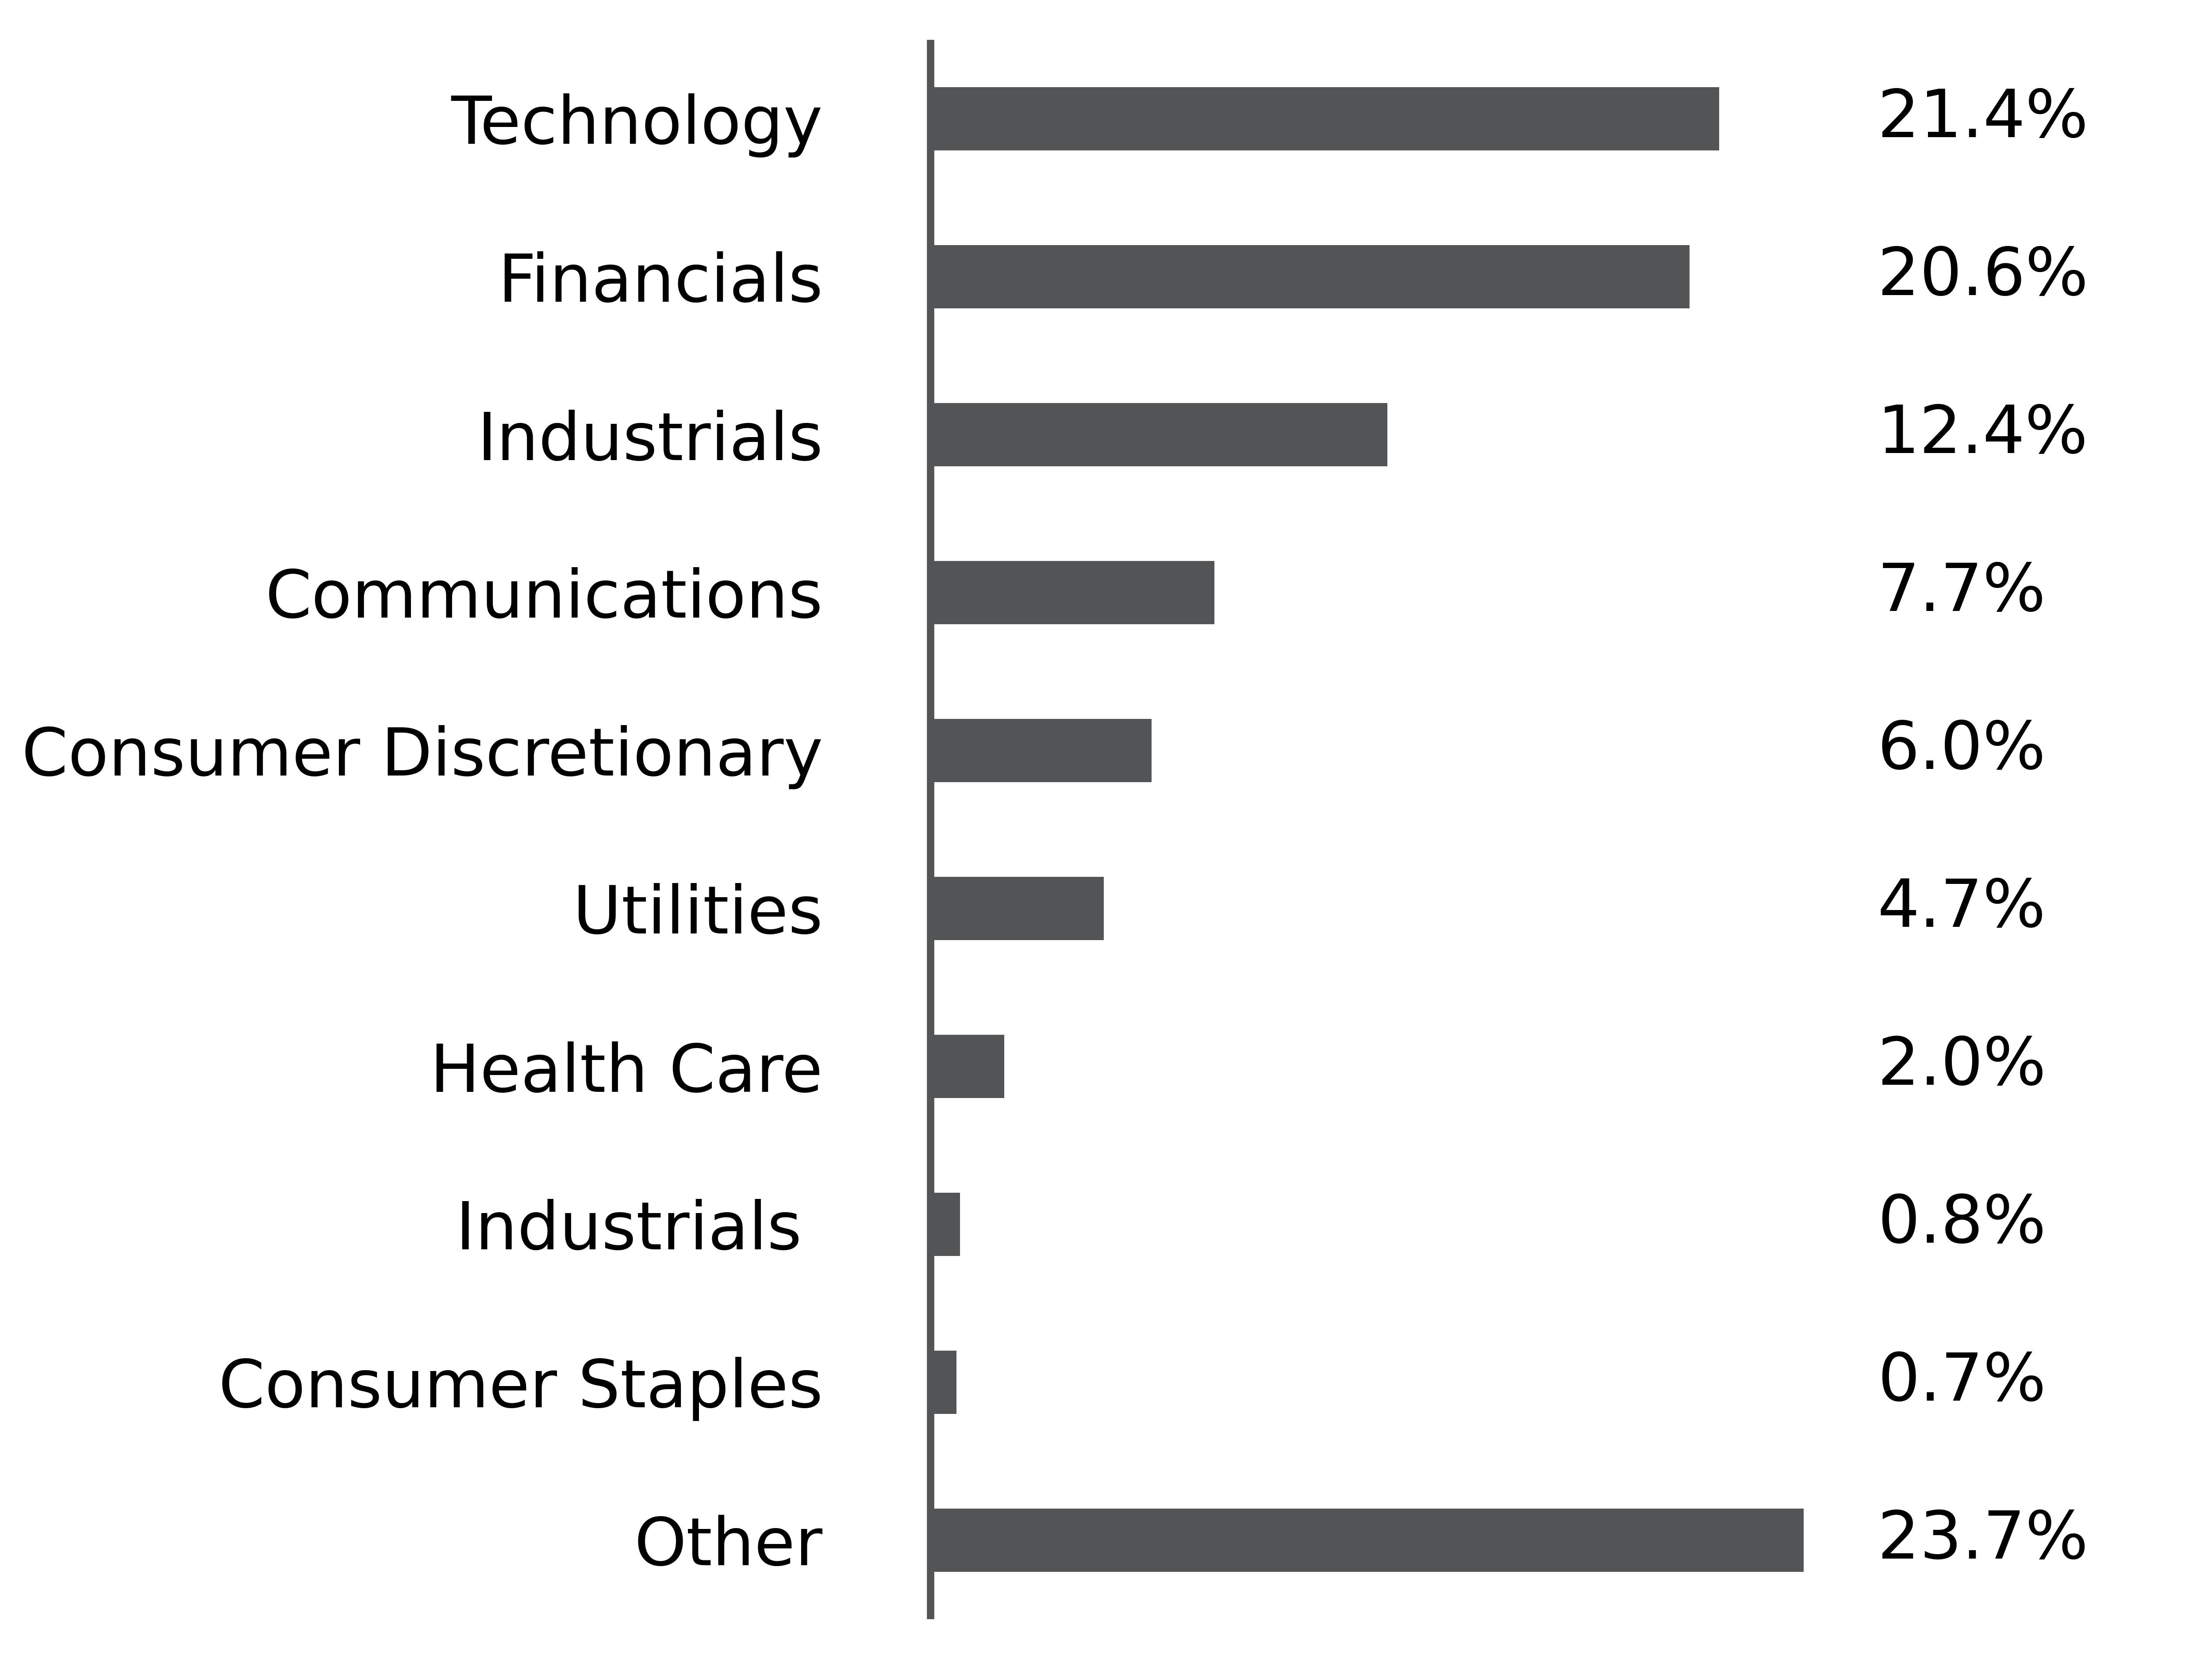
What did the Fund invest in?
(as of May 31, 2025)
Sector Breakdown (% of net assets)
Top Ten Holdings | (% of Total Net Assets) |
|---|---|
Dreyfus Treasury Securities Cash Management | |
Howmet Aerospace Inc | |
Meta Platforms Inc | |
Financial Select Sector SPDR Fund | |
Microsoft Corp | |
Amazon.com Inc | |
Palantir Technologies Inc | |
Broadcom Inc | |
iShares Russell 2000 ETF | |
Constellation Energy Corp |
What were the Fund costs for the past year?
(based on a hypothetical $10,000 investment)
Class Name | Costs of a $10,000 investment | Costs paid as a percentage of a $10,000 investment |
|---|---|---|
AMAX | $105 | 1.02% |
How did the Fund perform last year and what affected its performance?
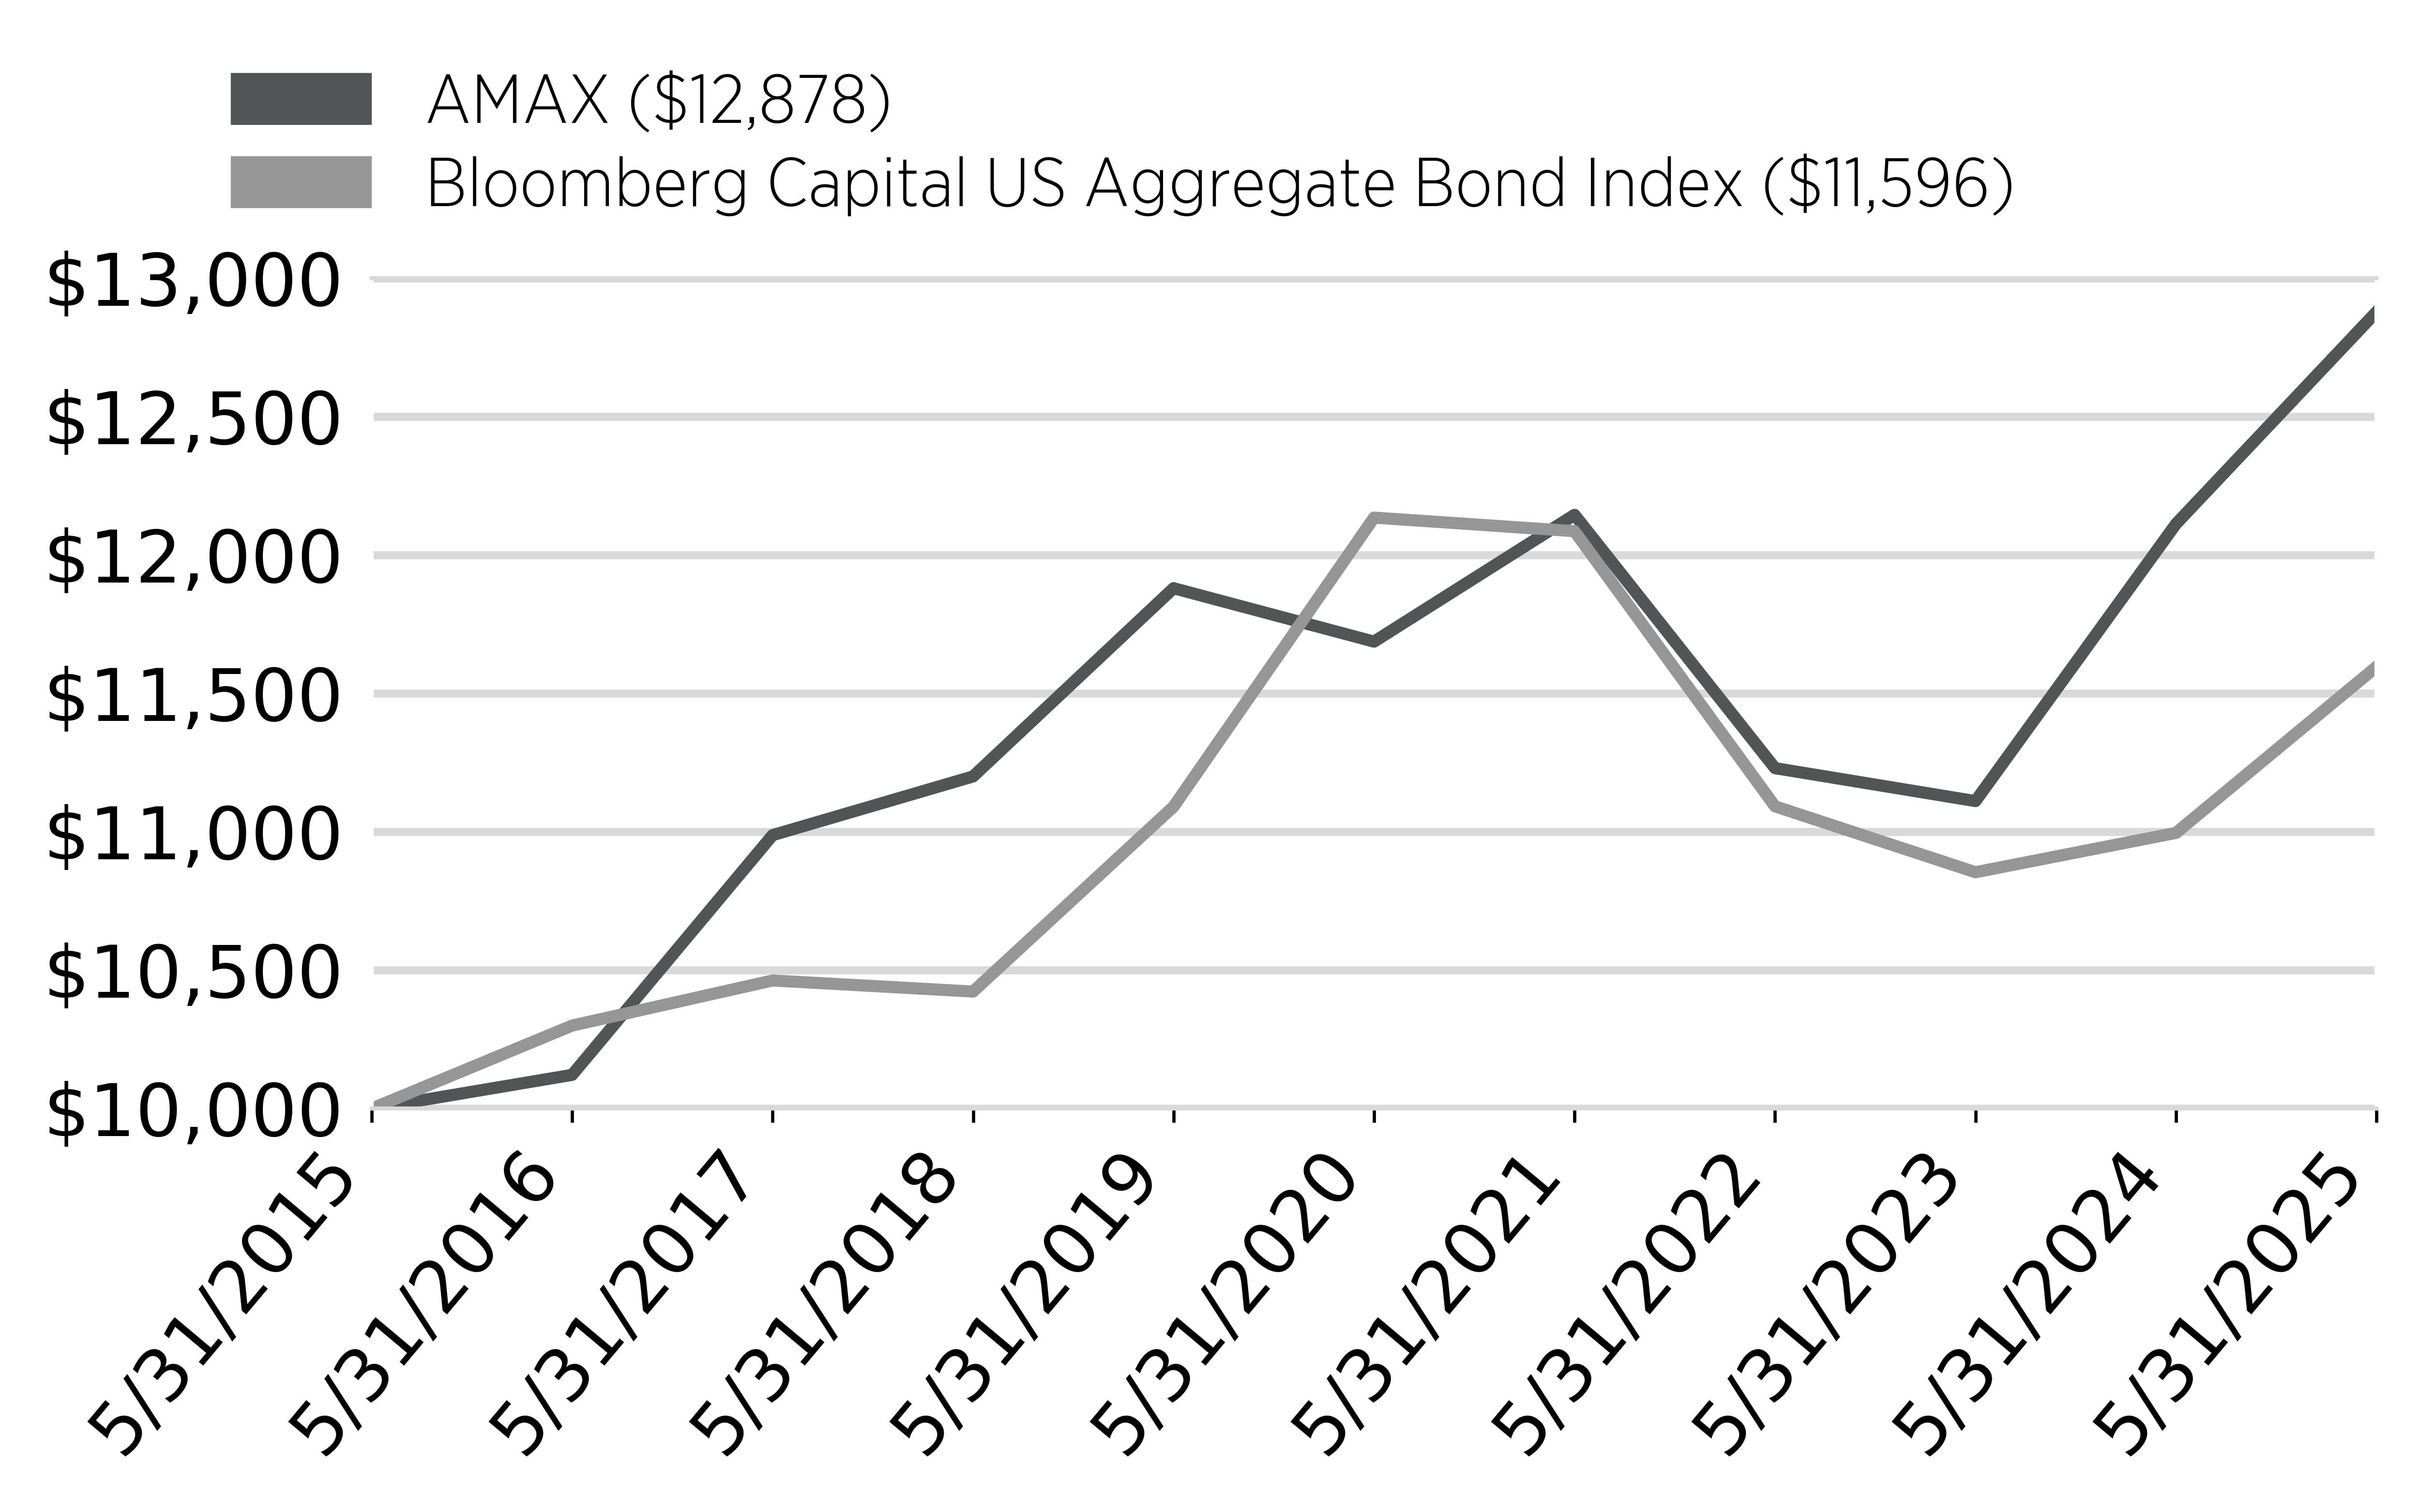
For the fiscal year ended May 31, 2025, the Fund returned 6.32%.The Fund outperformed the Bloomberg Capital US Aggregate Bond Index, which returned 5.46% for the same period.
For the majority of the year, Adaptive Hedged Multi Asset Income ETF (AMAX) maintained its three part portfolio in equities, treasuries and gold. The Fund's aggregate performance was favorably influenced by upward trends in the equity and gold markets, and the recurring income derived from the implementation of covered call options.
The main detractors from performance included:
• YieldMax NVDA Option Income Strategy ETF (NVDY)
• YieldMax AAPL Option Income Strategy ETF (APLY)
• YieldMax GOOGL Option Income Strategy ETF (GOOY)
The main contributors to performance included:
• SPDR S&P 500 ETF (SPY)
• Invesco QQQ Trust (QQQ)
• Strategy Class A (MSTR)
Cumulative Performance
From June 1, 2024 through May 31, 2025
Initial Investment of $10,000
Average Annual Total Returns
Key Fund Statistics
(as of May 31, 2025)
Fund Size | $22,029,024 |
Number of Holdings | 23 |
Net Advisory Fee | $838 |
Portfolio Turnover Rate | 720.72% |
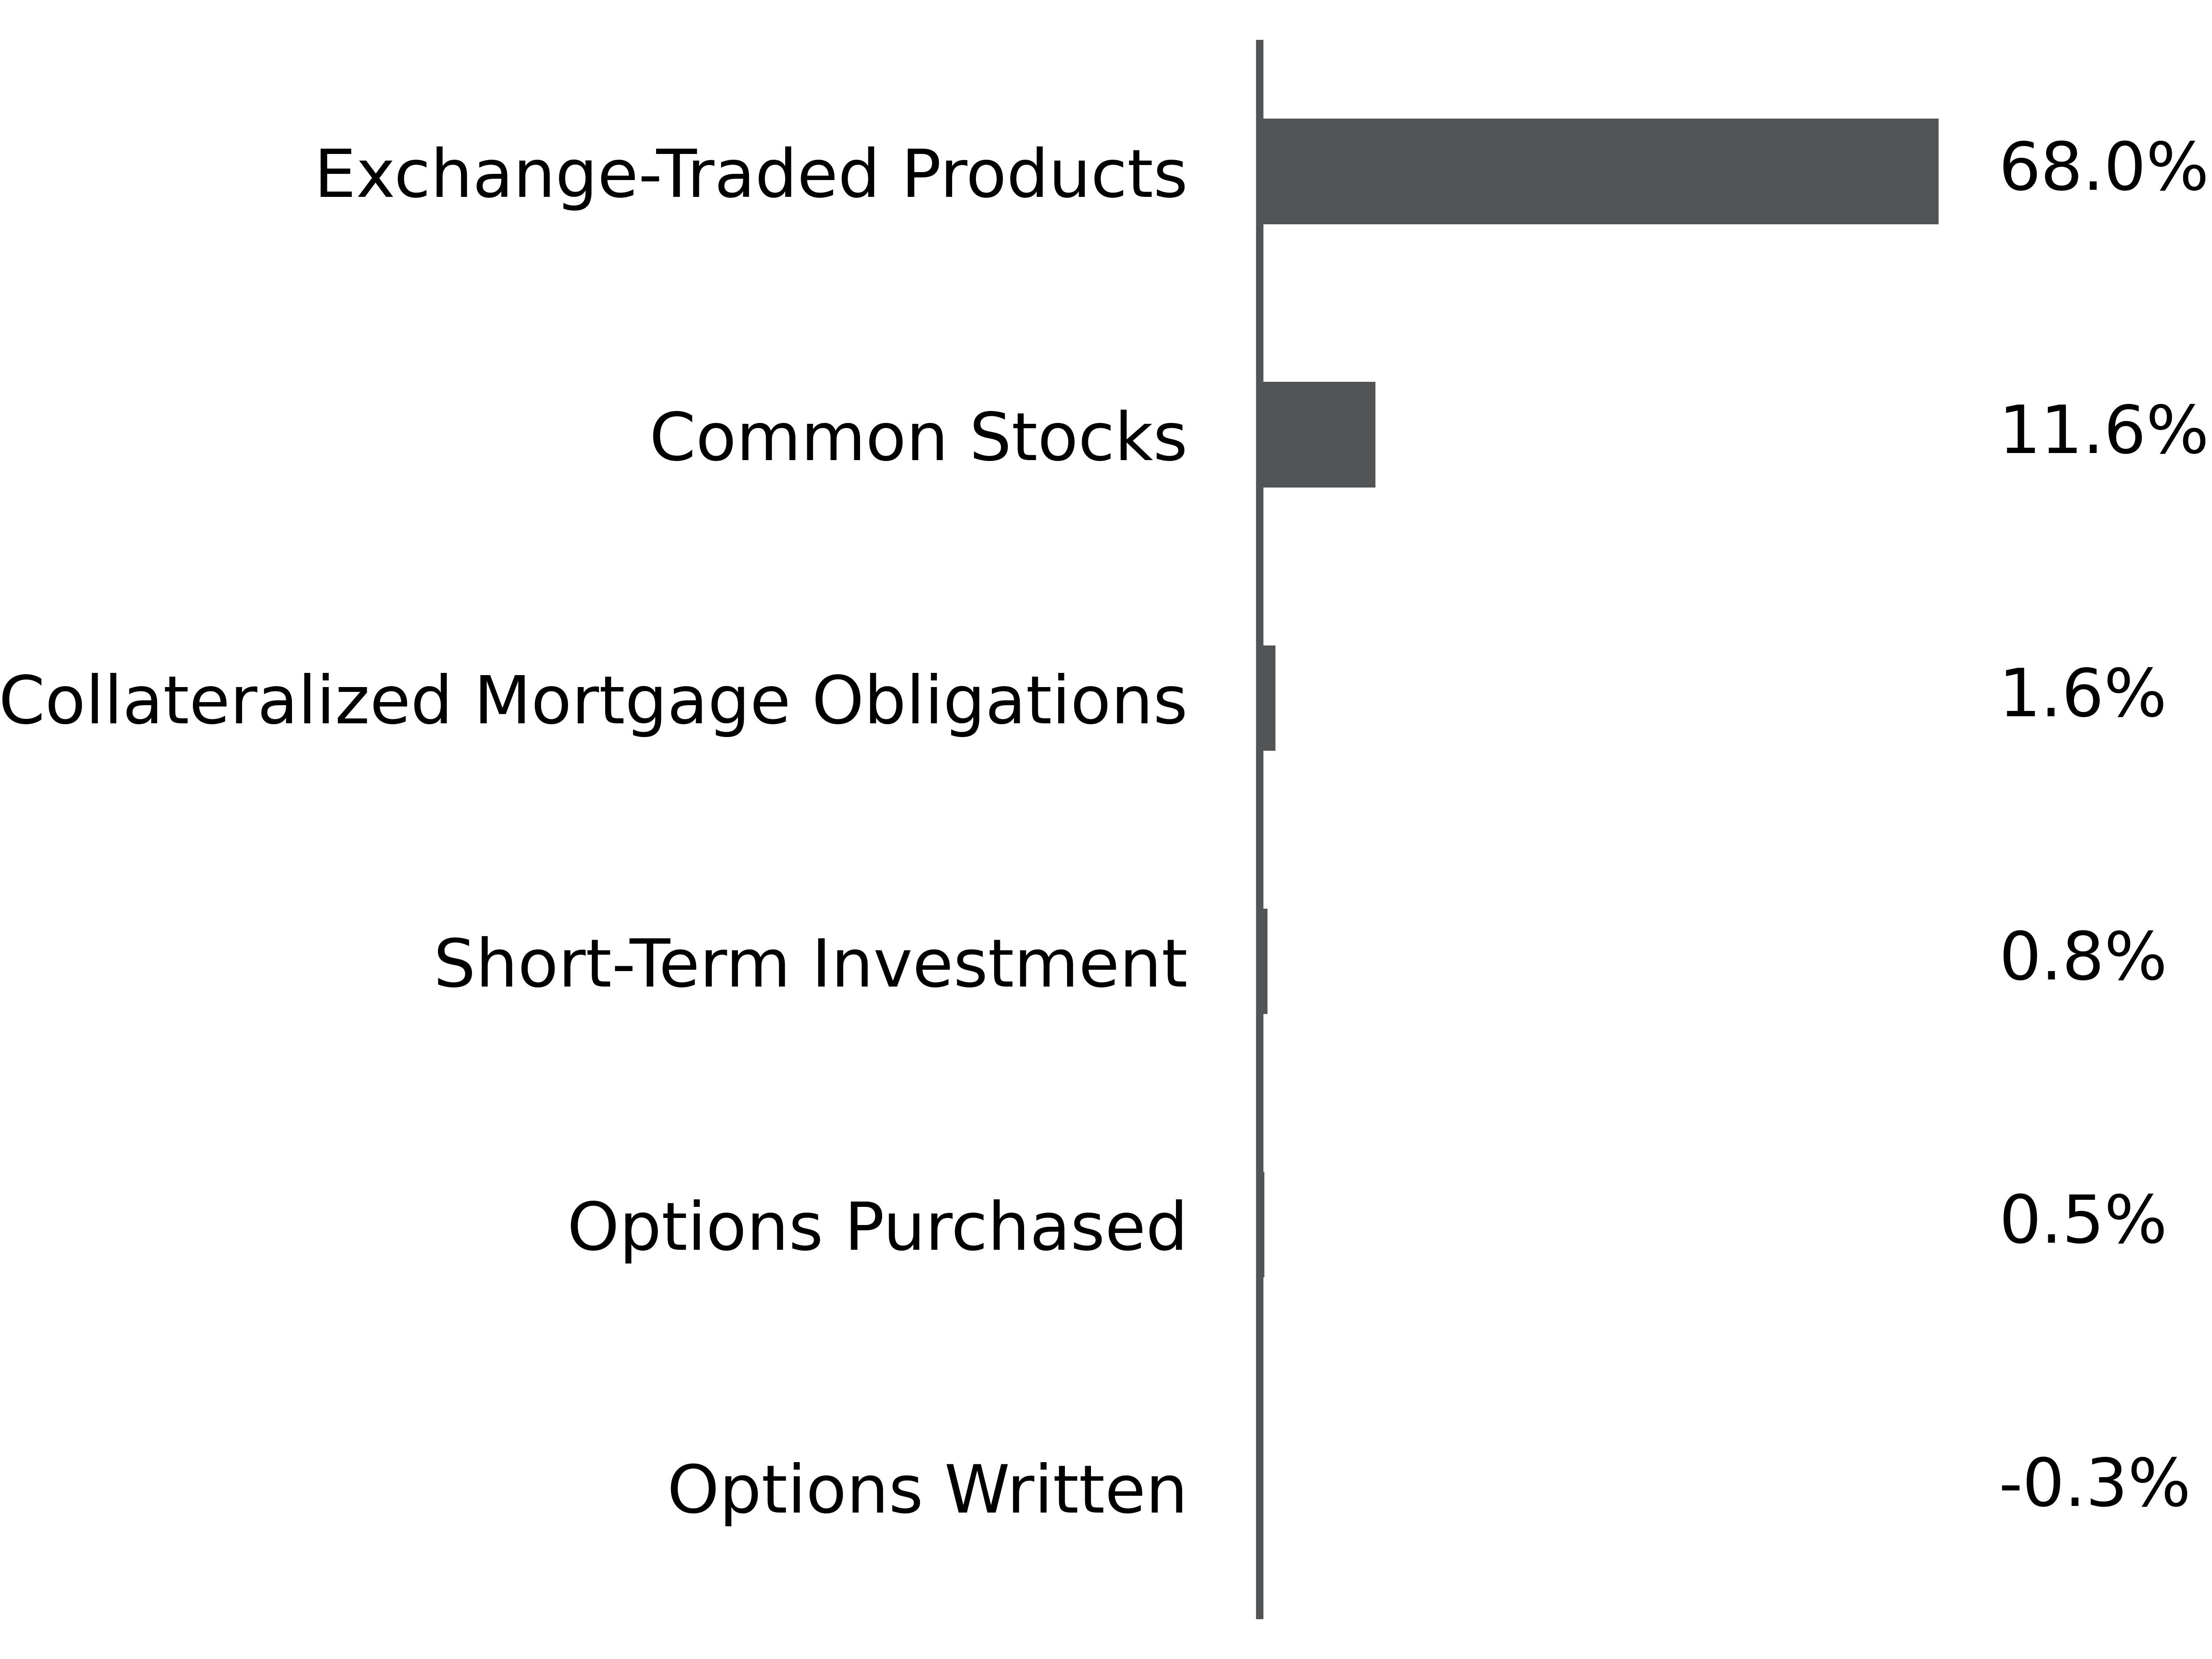
What did the Fund invest in?
(as of May 31, 2025)
Security Type Breakdown (% of net assets)
Top Ten Holdings | (% of Total Net Assets) |
|---|---|
SPDR S&P 500 ETF Trust | |
FT Vest Gold Strategy Target Income ETF
| |
MicroStrategy Inc | |
Invesco QQQ Trust Series 1 | |
iShares Bitcoin Trust ETF | |
iShares 20+ Year Treasury Bond ETF | |
VanEck Gold Miners ETF | |
YieldMax GOOGL Option Income Strategy ETF | |
Yieldmax Amzn Option Income ETF | |
YieldMax MSFT Option Income Strategy ETF |
What were the Fund costs for the past year?
(based on a hypothetical $10,000 investment)
Class Name | Costs of a $10,000 investment | Costs paid as a percentage of a $10,000 investment |
|---|---|---|
RHTX | $129 | 1.25% |
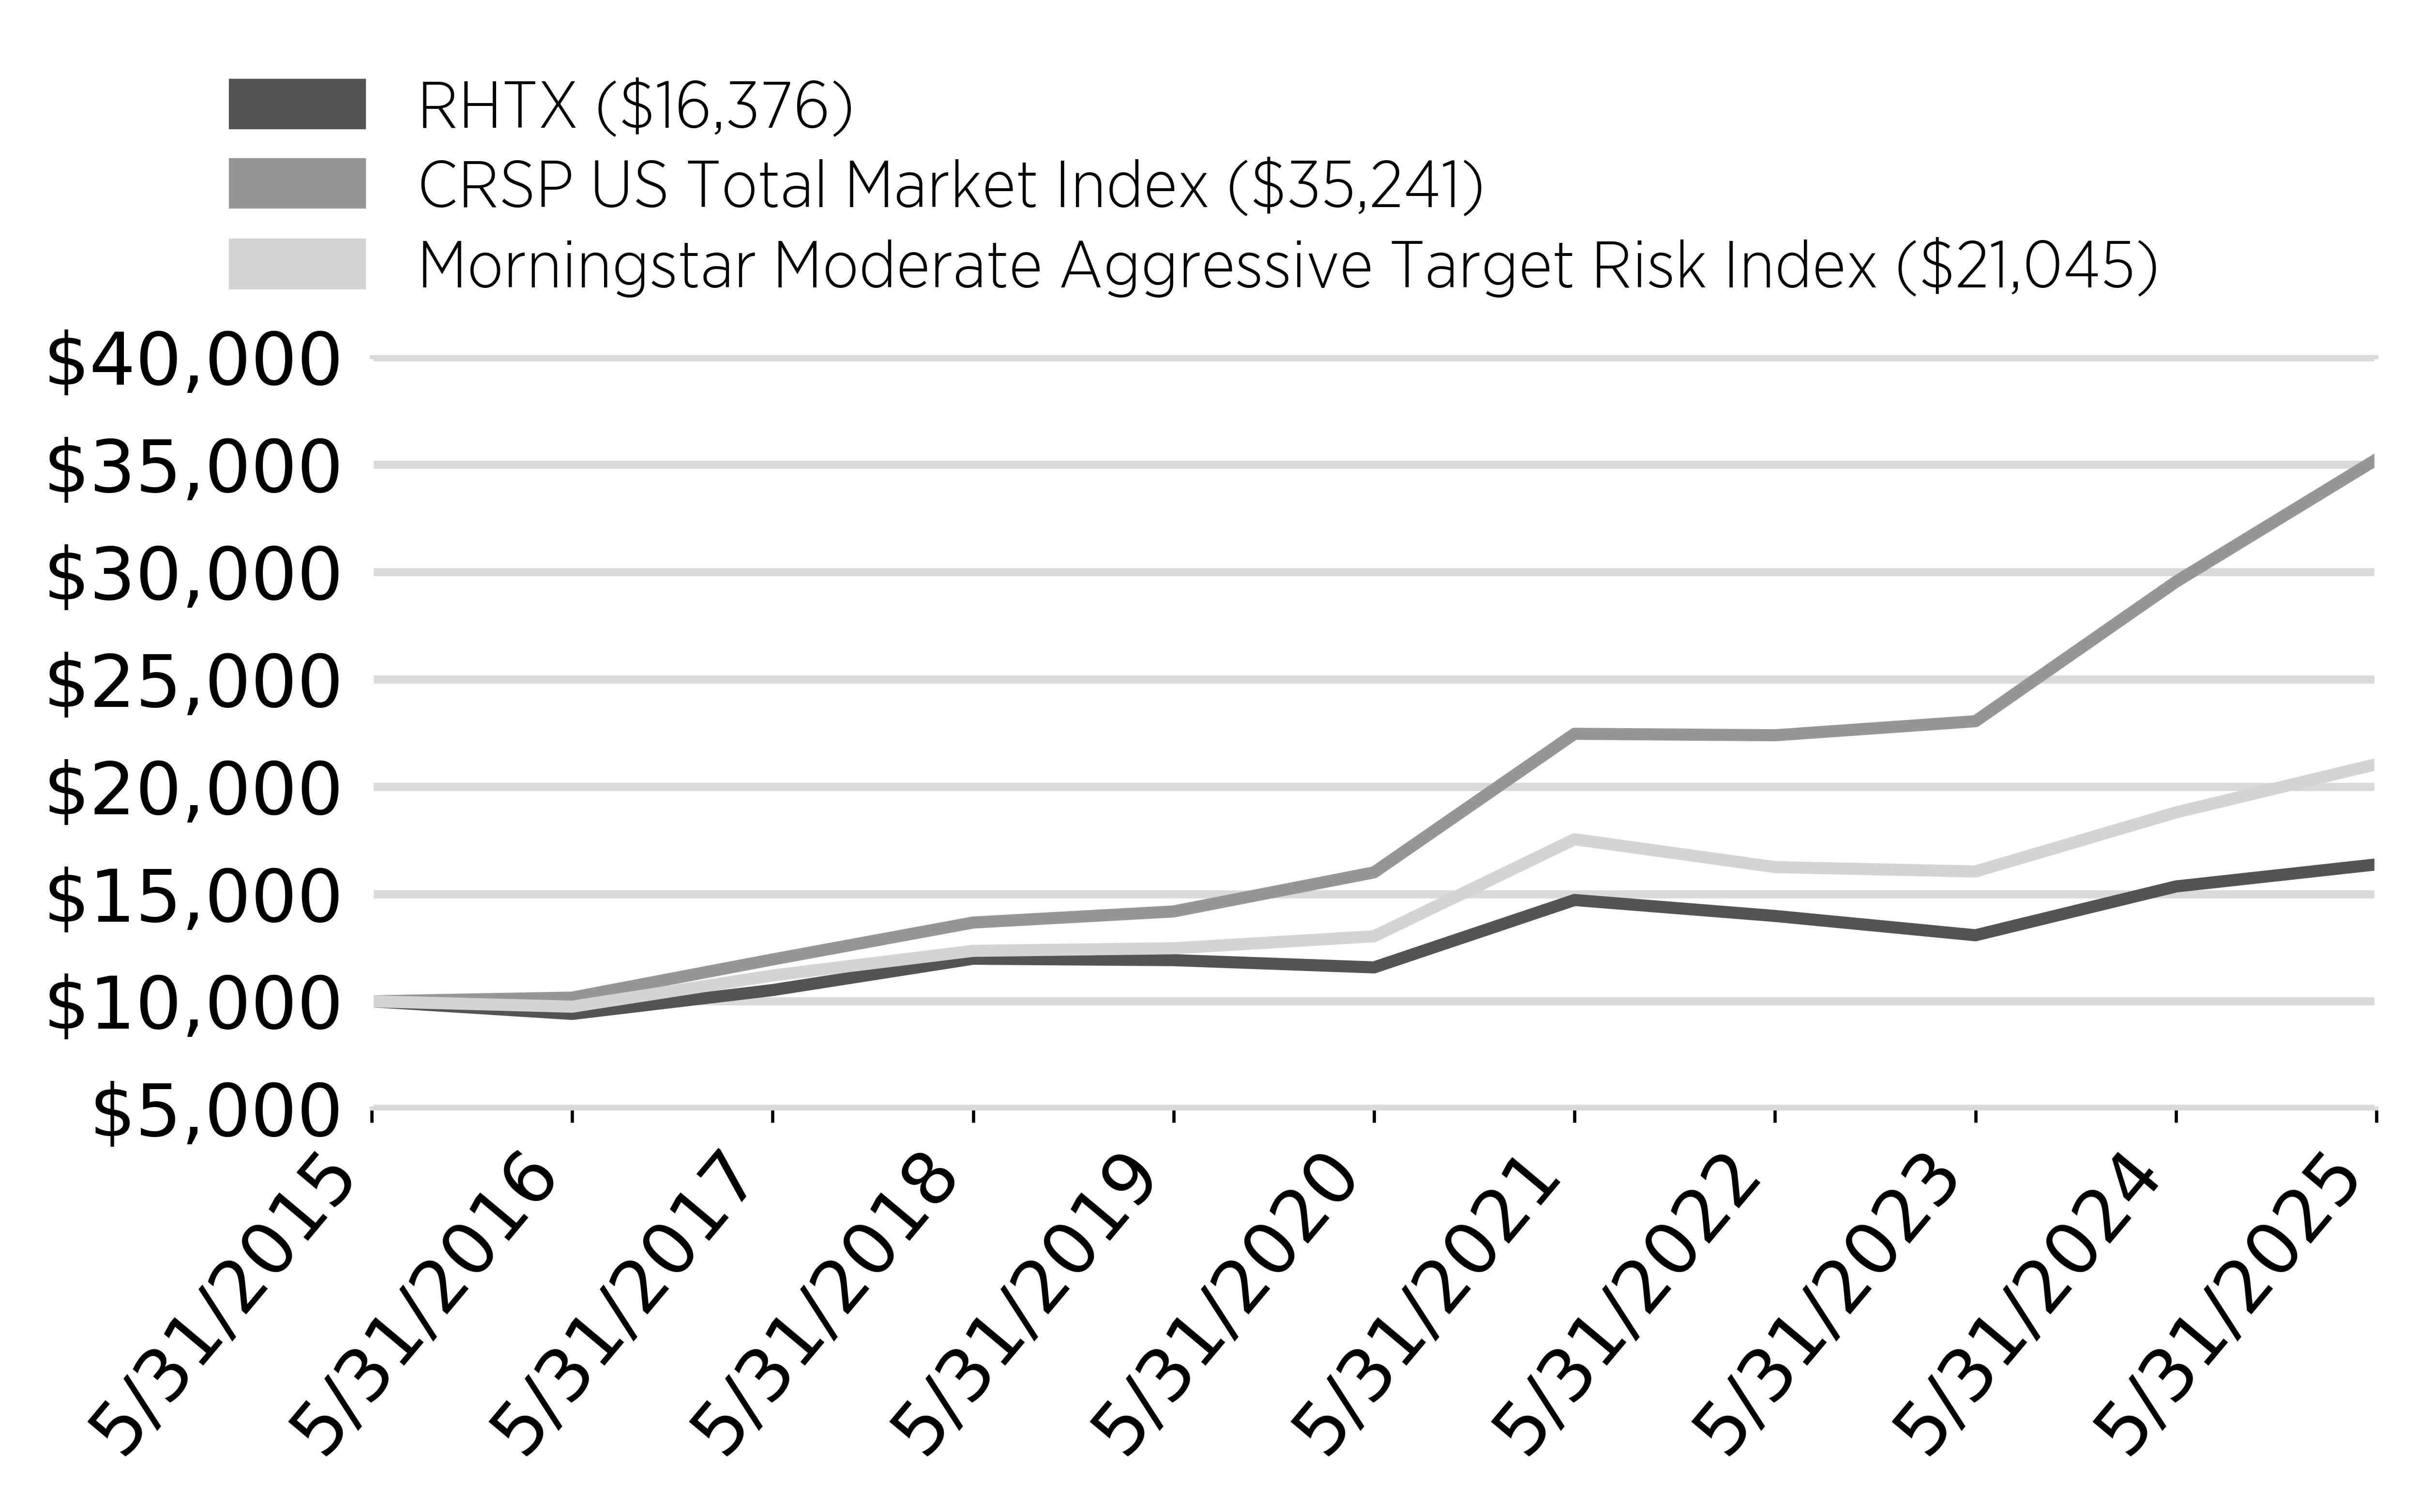
How did the Fund perform last year and what affected its performance?
For the fiscal year ended May 31, 2025, the Fund returned 6.69%.The Fund underperformed the CRSP US Total Market Index and the Morningstar Moderate Aggressive Target Risk Index, which returned 13.00% and 11.96%, respectively, for the same period.
RH Tactical Outlook ETF (RHTX) maintained its multi-cap equity and precious metal exposure for the majority of the year. Although the precious metals that RHTX holds (GLD, SLV) provide some diversification benefit, the large equity bias included US mid caps and US small caps which underperformed large caps during the period.RHTX also used bitcoin related ETFs and equities to generate covered call income and to fund the purchase of long protective puts. The Fund's aggregate performance was favorably influenced by upward trends in equity and gold markets.While the Fund benefitted from its US large-cap exposure, the underperformance of its US small and mid-cap equity positions led to the Fund lagging its benchmark.
The main detractors from performance included:
• iShares Russell 2000 ETF (IWM)
• SPDR Portfolio S&P 400 Mid Cap ETF (SPMD)
The main contributors to performance included:
• SPDR S&P 500 ETF (SPY)
• SPDR Gold Shares (GLD)
Cumulative Performance
From June 1, 2024 through May 31, 2025
Initial Investment of $10,000
Average Annual Total Returns
* The index was created after the since inception date of the Fund.
Key Fund Statistics
(as of May 31, 2025)
Fund Size | $8,090,432 |
Number of Holdings | 9 |
Net Advisory Fee | $0 |
Portfolio Turnover Rate | 44.37% |
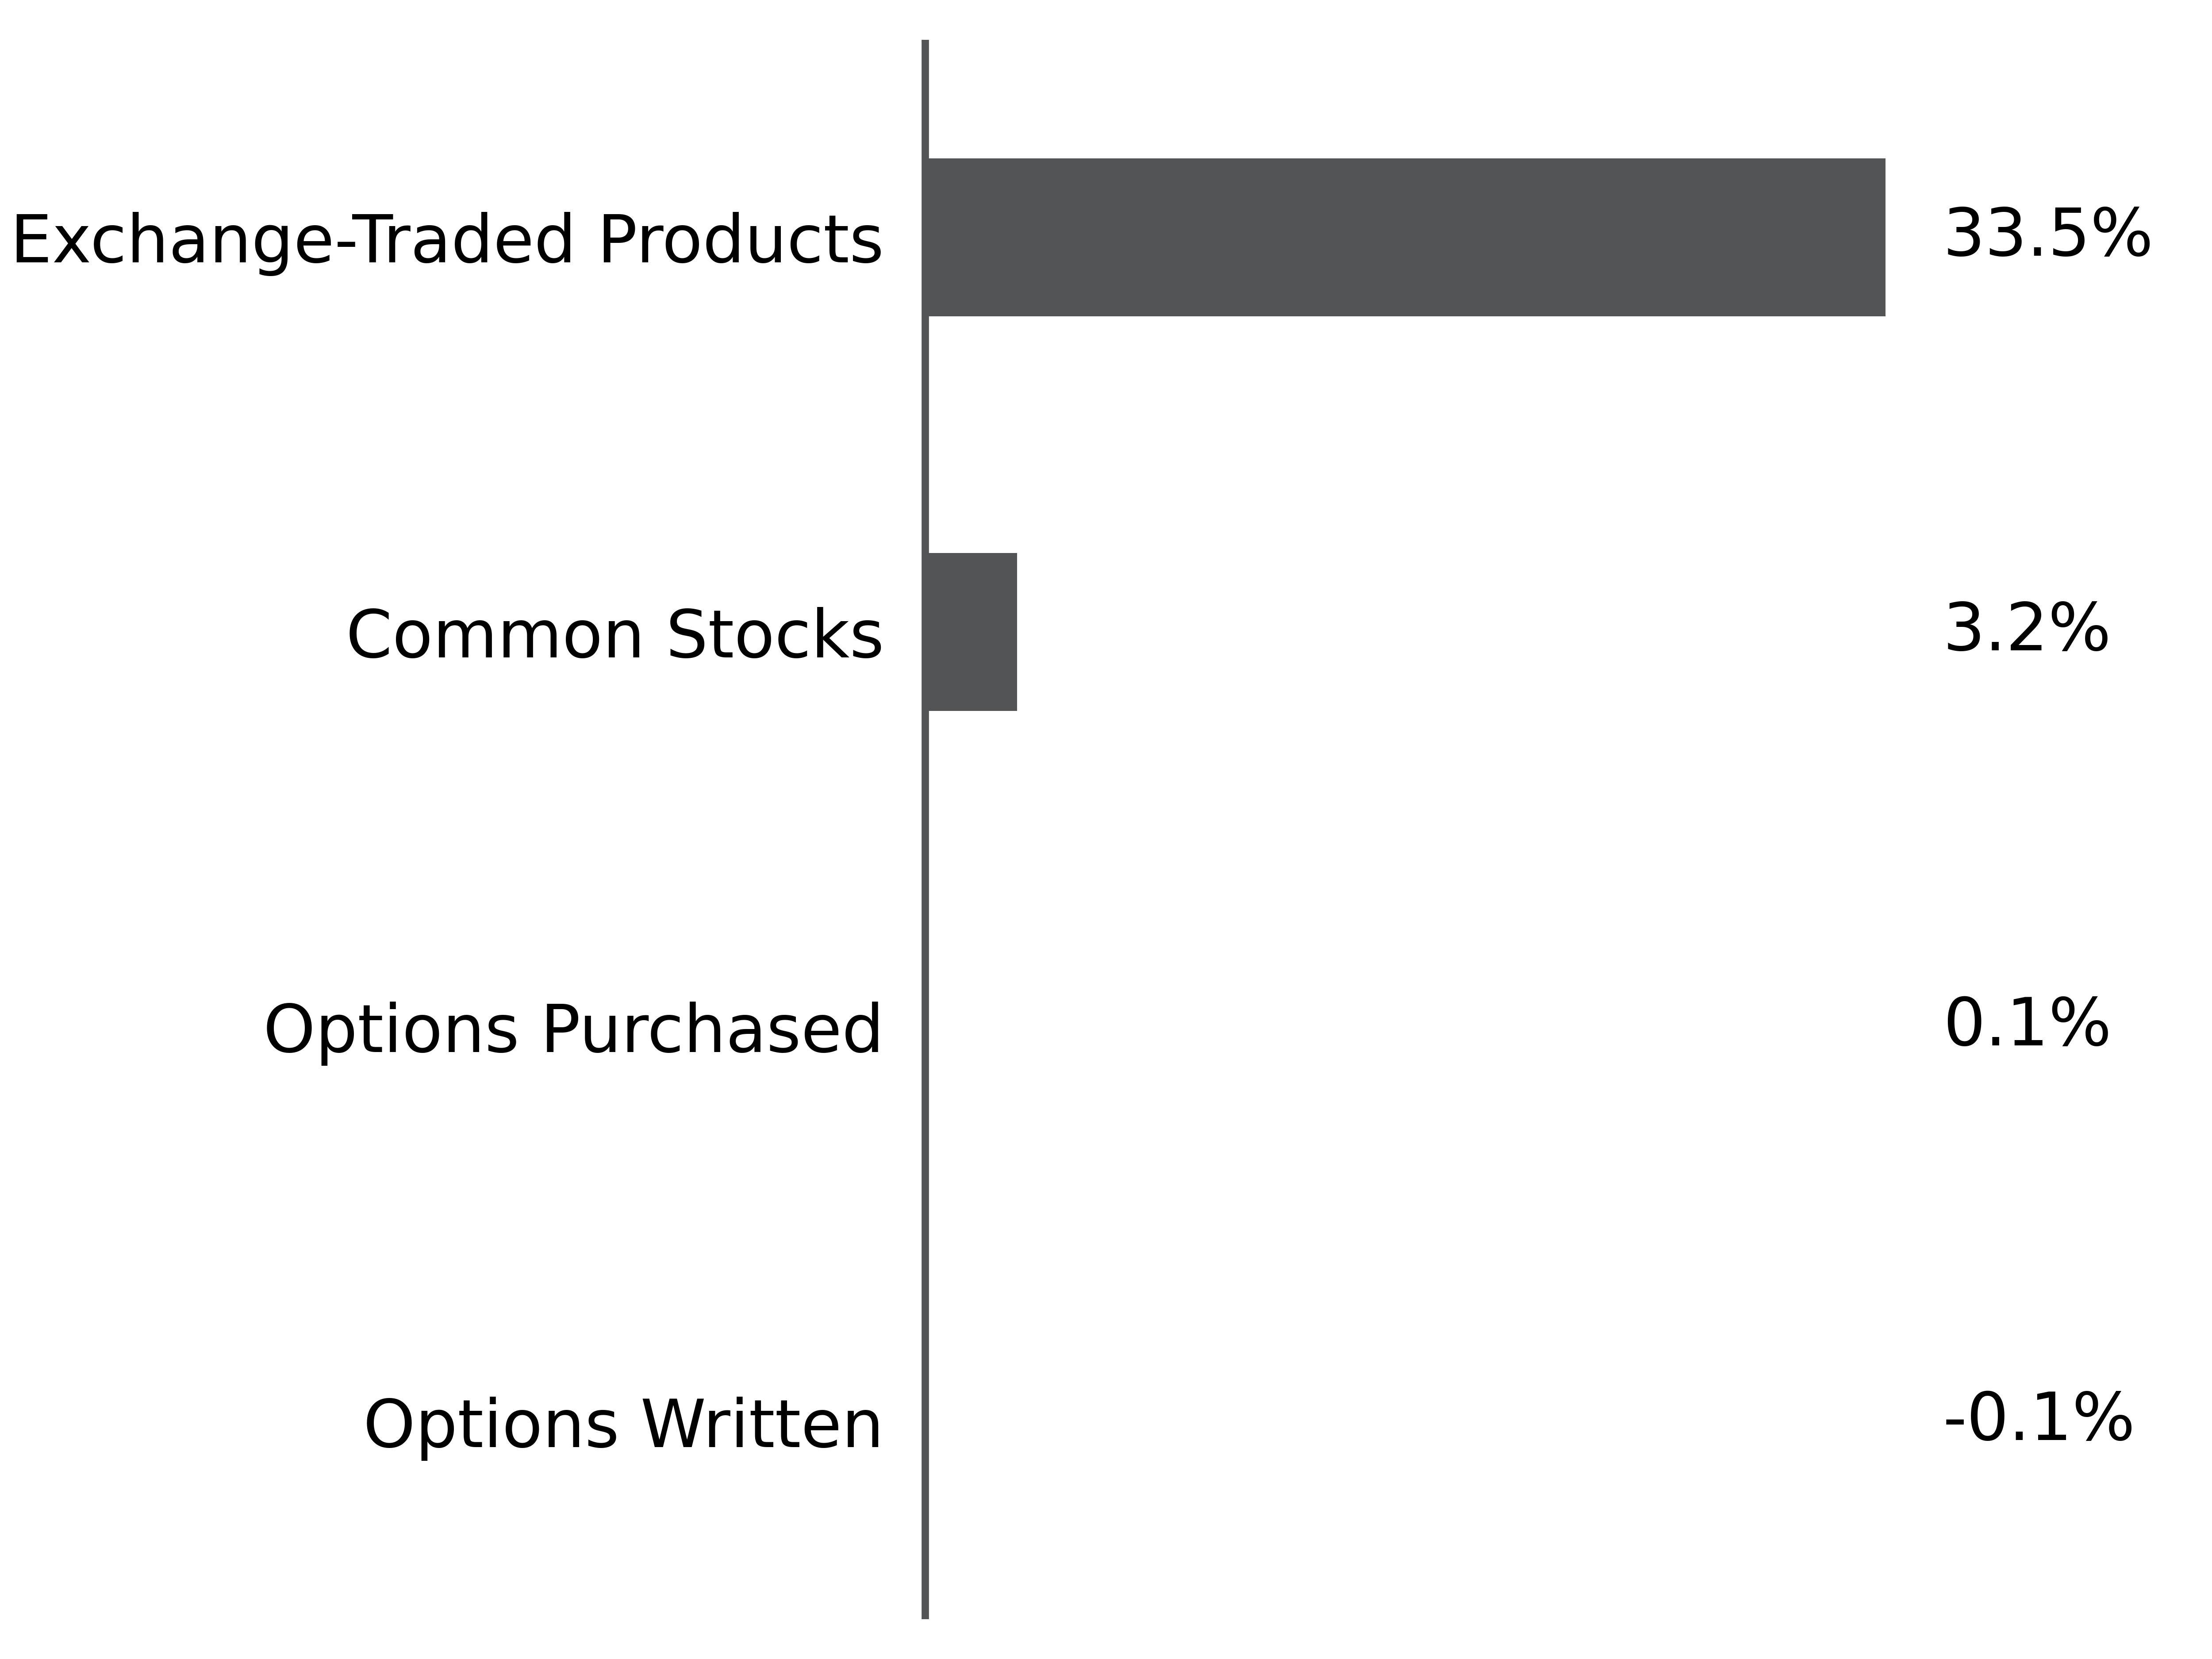
What did the Fund invest in?
(as of May 31, 2025)
Security Type Breakdown (% of net assets)
Top Holdings | (% of Total Net Assets) |
|---|---|
SPDR S&P 500 ETF Trust | |
SPDR Portfolio S&P 400 Mid Cap ETF | |
MicroStrategy Inc | |
iShares Russell 2000 ETF | |
SPDR Gold Shares | |
iShares Silver Trust | |
MicroStrategy Inc |
What were the Fund costs for the past year?
(based on a hypothetical $10,000 investment)
Class Name | Costs of a $10,000 investment | Costs paid as a percentage of a $10,000 investment |
|---|---|---|
RHRX | $129 | 1.25% |
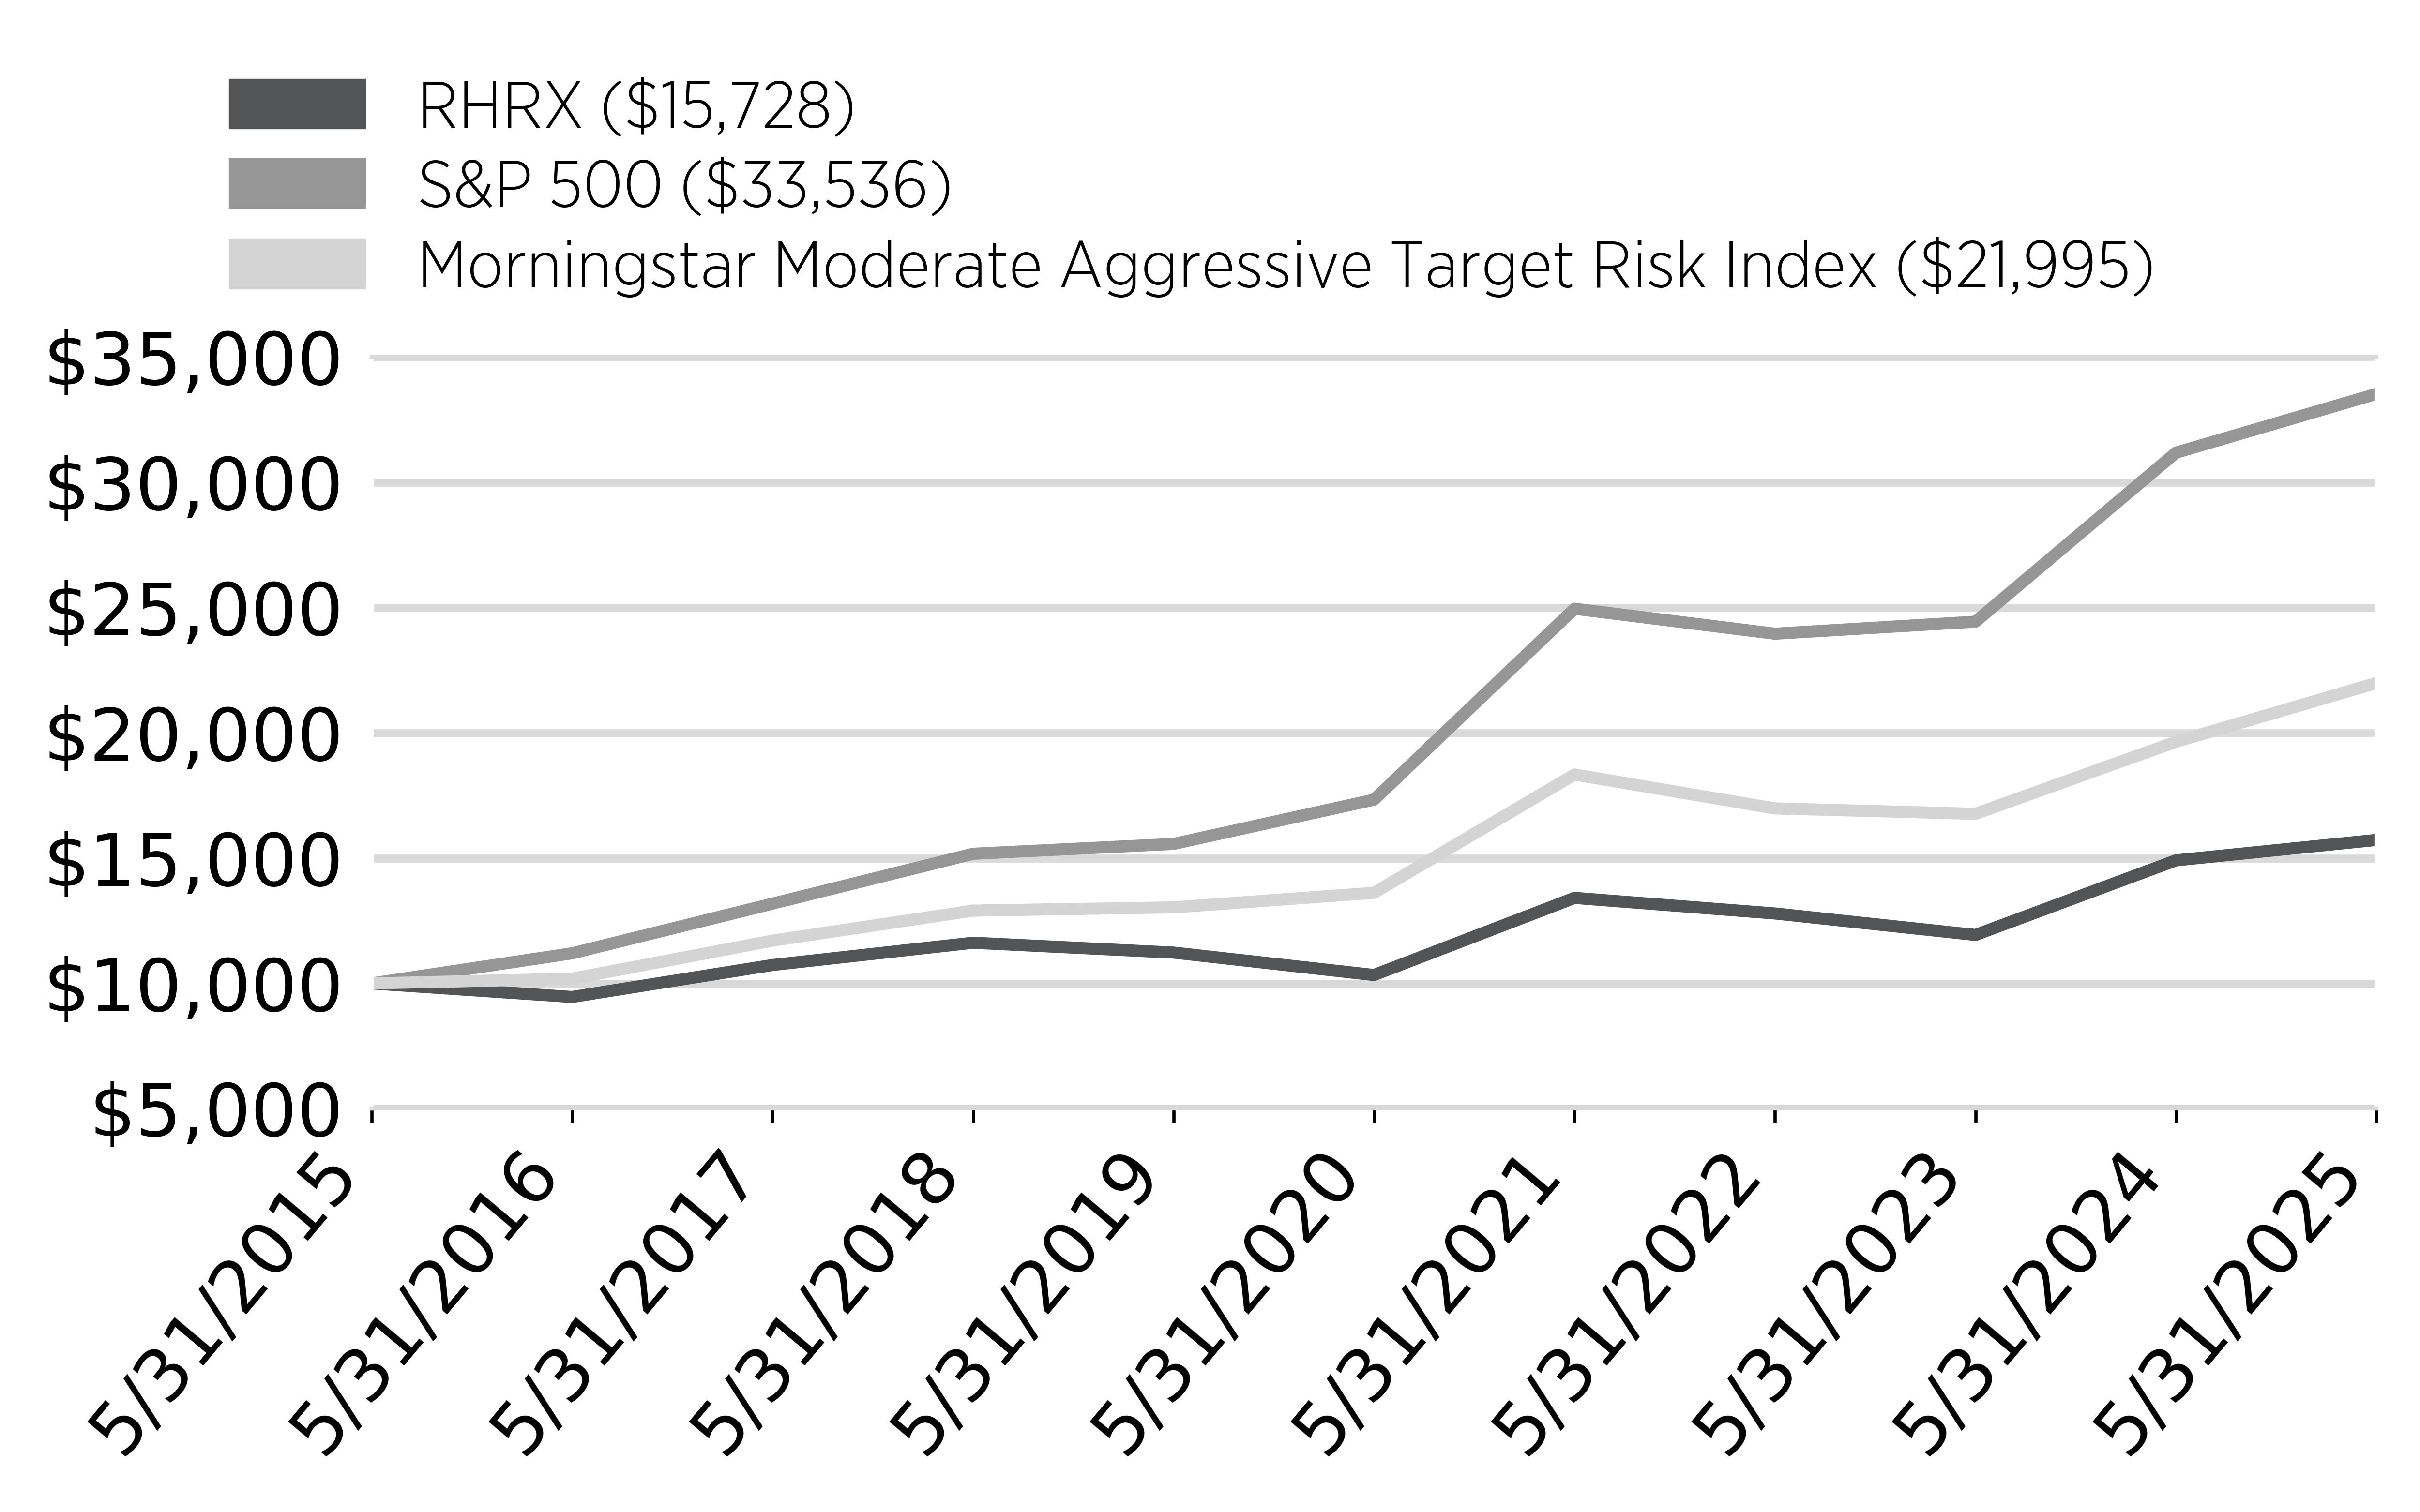
How did the Fund perform last year and what affected its performance?
For the fiscal year ended May 31, 2025, the Fund returned 5.46%.The Fund underperformed the S&P 500 and the Morningstar Moderate Aggressive Target Risk Index, which returned 13.52% and 11.96%, respectively, for the same period.
RH Tactical Rotation ETF (RHRX) maintained its half broad equities and half “tri-sector” approach utilizing research to choose in-favor sectors to hold at any given time.Although the sector concentration can enhance returns, focused sell-off scenarios (such as the sell off of the AI company DeepSeek in January 2025) can reduce alpha. RHRX also used Adaptive’s Growth or Value (GVI) model to determine when to allocate the broad equities portion of the portfolio between growth and value focus. Favorable market conditions for US large-cap growth companies had a positive impact on the segment of the Fund's portfolio allocated to these investments.
The main detractors from performance included:
• VanEck Semiconductor ETF (SMH)
• The Consumer Discret Sel Sect SPDR ETF (XLY)
• The Technology Select Sector SPDR ETF (XLK)
The main contributors to performance included:
• SPDR S&P 500 ETF (SPY)
• Comm Svcs Sel Sect SPDR ETF (XLC)
• SPDR NYSE Technology ETF (XNTK)
Cumulative Performance
From June 1, 2024 through May 31, 2025
Initial Investment of $10,000
Average Annual Total Returns
Key Fund Statistics
(as of May 31, 2025)
Fund Size | $14,838,587 |
Number of Holdings | 5 |
Net Advisory Fee | $0 |
Portfolio Turnover Rate | 249.34% |
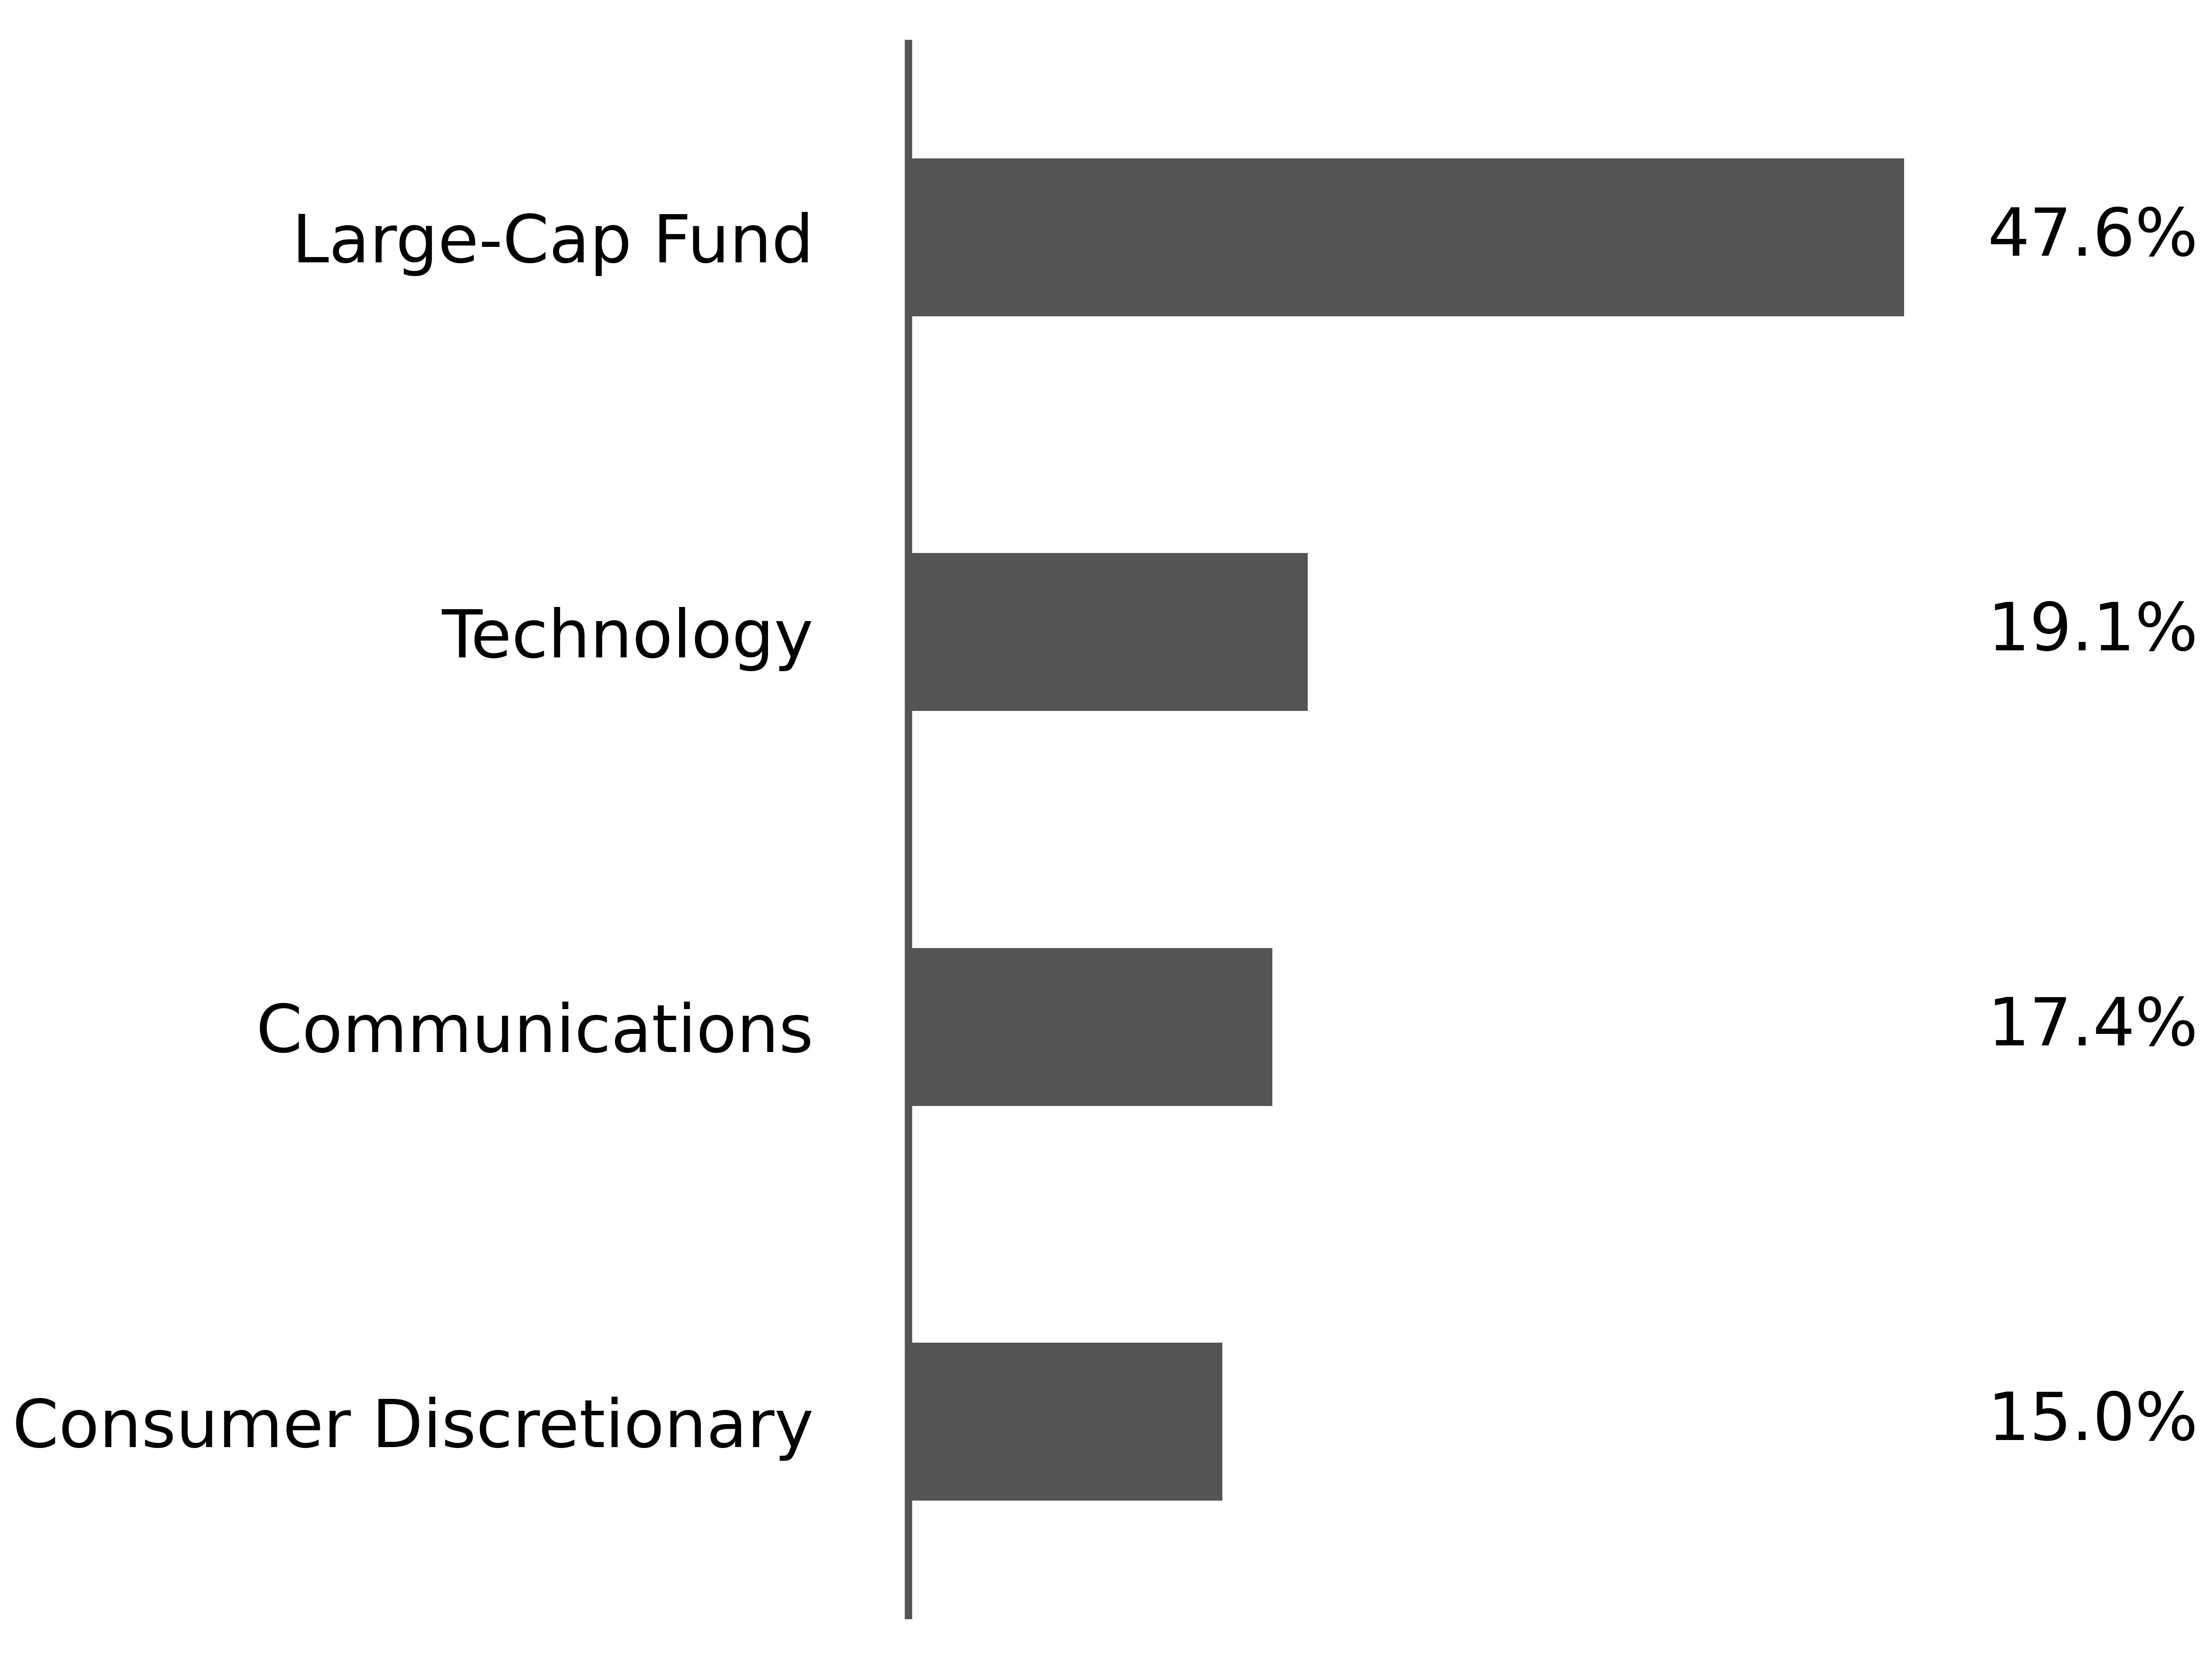
What did the Fund invest in?
(as of May 31, 2025)
Sector Breakdown (% of net assets)
Top Holdings | (% of Total Net Assets) |
|---|---|
SPDR Portfolio S&P 500 Growth ETF | |
SPDR S&P 500 ETF Trust | |
SPDR NYSE Technology ETF | |
Communication Services Select Sector SPDR Fund | |
Consumer Discretionary Select Sector SPDR Fund |