Exhibit 99.3
☐ | REGISTRATION STATEMENT PURSUANT TO SECTION 12(b) OR (g) OF THE SECURITIES EXCHANGE ACT OF 1934 |
☒ | ANNUAL REPORT PURSUANT TO SECTION 13 OR 15(d) OF THE SECURITIES EXCHANGE ACT OF 1934 FOR THE FISCAL YEAR ENDED December 31, 2024 |
☐ | TRANSITION REPORT PURSUANT TO SECTION 13 OR 15(d) OF THE SECURITIES EXCHANGE ACT OF 1934 |
☐ | SHELL COMPANY REPORT PURSUANT TO SECTION 13 OR 15(d) OF THE SECURITIES EXCHANGE ACT OF 1934 |
Title of Each Class | Trading Symbol(s) | Name of Each Exchange on Which Registered | ||||
Common Stock, $0.0001 par value per share | CMRE | New York Stock Exchange | ||||
Preferred stock purchase rights | New York Stock Exchange | |||||
Series B Preferred Shares, $0.0001 par value per share | CMRE.PRB | New York Stock Exchange | ||||
Series C Preferred Shares, $0.0001 par value per share | CMRE.PRC | New York Stock Exchange | ||||
Series D Preferred Shares, $0.0001 par value per share | CMRE.PRD | New York Stock Exchange | ||||
Large accelerated filer ☒ | Accelerated filer ☐ | Non-accelerated filer ☐ | ||||
Emerging growth company ☐ | ||||||
• | “Costamare”, the “Company”, “we”, “our”, “us” or similar terms are used for convenience to refer to Costamare Inc., or any one or more of its subsidiaries or their predecessors, or to such entities collectively, except that when such terms are used in this annual report in reference to the common stock, the 7.625% Series B Cumulative Redeemable Perpetual Preferred Stock (the “Series B Preferred Stock”), the 8.50% Series C Cumulative Redeemable Perpetual Preferred Stock (the “Series C Preferred Stock”), the 8.75% Series D Cumulative Redeemable Perpetual Preferred Stock (the “Series D Preferred Stock”), the 8.875% Series E Cumulative Redeemable Perpetual Preferred Stock (the “Series E Preferred Stock” and, together with the Series B Preferred Stock, the Series C Preferred Stock and the Series D Preferred Stock, the “Preferred Stock”) or the context otherwise indicates, they refer specifically to Costamare Inc.; |
• | currency amounts in this annual report are in U.S. dollars; and |
• | all data regarding our fleet and the terms of our charters is as of February 12, 2025. |
• | general market conditions and shipping industry trends, including charter rates, vessel values and the future supply of, and demand for, ocean-going containership and dry bulk shipping services; |
• | our continued ability to enter into time charters with existing and new customers, and to re-charter on favorable terms our vessels upon the expiry of existing charters; |
• | our future financial condition and liquidity, including our ability to make required payments under our credit facilities, and comply with our loan covenants; |
• | our ability to finance our capital expenditures, acquisitions and other corporate activities; |
• | risks related to our dry bulk operating platform, including uncertainty related to the introduction of a new line of business for the Company, the fact that the chartering-in and chartering-out of dry bulk vessels is inherently more volatile than traditional vessel ownership and risks associated with derivative instruments such as forward freight agreements and bunker hedging; |
• | risks related to our leasing business, including uncertainty related to the introduction of a new line of business for the Company, as well as exposure to new financial, counterparty and legal risks; |
• | the effects of a possible worldwide economic slowdown; |
• | disruption of world trade due to rising protectionism or the breakdown of multilateral trade agreements; |
• | environmental and regulatory conditions, including changes in laws and regulations or actions taken by regulatory authorities; |
• | business disruptions and economic uncertainty resulting from epidemics or pandemics; |
• | business disruptions due to natural disasters or other disasters outside our control; |
• | fluctuations in interest rates and currencies, including the value of the U.S. dollar relative to other currencies; |
• | technological advancements in the design, construction and operations of containerships and dry bulk vessels and opportunities for the profitable operations of our vessels; |
• | the financial health of our customers, our lenders and other counterparties, and their ability to perform their obligations; |
• | potential disruption of shipping routes due to accidents, political events, sanctions, piracy or acts by terrorists and armed conflicts; |
• | future, pending or recent acquisitions of vessels or other assets, the recent commencement of operations of our dry bulk platform, our business strategy, areas of possible expansion and expected capital spending or operating expenses, including the recent investment in a leasing business; |
• | expectations relating to dividend payments and our ability to make such payments; |
• | the availability of existing secondhand vessels or newbuild vessels to purchase, the time that it may take to construct and take delivery of new vessels or the useful lives of our vessels; |
• | the availability of key employees and crew, the length and number of off-hire days, dry-docking requirements, fuel and insurance costs; |
• | our anticipated general and administrative expenses, including our fees and expenses payable under our management and services agreements, as may be amended from time to time; |
• | our ability to leverage to our advantage our managers’ relationships and reputation within the international shipping industry; |
• | our ability to maintain long-term relationships with major liner companies; |
• | expected cost of, and our ability to comply with, governmental regulations and maritime self-regulatory organization standards, as well as requirements imposed by classification societies and standards demanded by our charterers; |
• | any malfunction or disruption of information technology systems and networks that our operations rely on or any impact of a possible cybersecurity breach; |
• | risks inherent in vessel operation, including perils of the sea, terrorism, piracy and discharge of pollutants; |
• | potential liability from current or future litigation; |
• | our business strategy and other plans and objectives for future operations; and |
• | other factors discussed in “Item 3. Key Information—D. Risk Factors” of this annual report. |
IDENTITY OF DIRECTORS, SENIOR MANAGEMENT AND ADVISERS |
OFFER STATISTICS AND EXPECTED TIMETABLE |
KEY INFORMATION |
A. | Reserved. |
B. | Capitalization and Indebtedness |
C. | Reasons for the Offer and Use of Proceeds |
D. | Risk Factors |
• | Our profitability will be dependent on the level of charter and freight rates in the international shipping industry which are based on macroeconomic factors outside of our control; |
• | The market value of our vessels can fluctuate substantially over time, and if these values are low at a time when we are attempting to dispose of a vessel, we could incur a loss; |
• | The international dry bulk industry is highly competitive, and we may be unable to compete successfully for charters on favorable terms with established companies or new entrants that may have greater resources and access to capital; |
• | The operation of dry bulk vessels entails certain unique operational risks, which could affect our business, financial condition, results of operations and ability to pay dividends; |
• | Disruptions in global markets from terrorist attacks, regional armed conflicts, general political unrest and the resulting governmental action could have a material adverse impact on our results of operations, financial condition and cash flows; and |
• | An increase in trade protectionism, the unravelling of multilateral trade agreements and a decrease in the level of China’s export of goods and import of raw materials could have a material adverse impact on our charterers’ business and, in turn, could cause a material adverse impact on our results of operations, financial condition and cash flows. |
• | Delay in the delivery or cancelation of any secondhand vessels we may agree to acquire, or any future newbuild vessel orders, could adversely affect our results of operations, financial condition and earnings; |
• | We are dependent on our charterers and other counterparties fulfilling their obligations under agreements with us; |
• | We may have difficulty properly managing our growth through acquisitions of new or secondhand vessels and we may not realize expected benefits from these acquisitions; |
• | The increased volatility of our dry bulk operating platform may have a material adverse effect on our earnings and cash flow; |
• | Declines in the value of our derivative instruments, such as forward freight agreements, could have an adverse effect on our future performance, results of operations, cash flows and financial position; |
• | Our investment in the leasing business exposes us to financial and counterparty risks, which could adversely affect our business, financial position, results of operations and cash flow; |
• | Our managers may be unable to attract and retain qualified, skilled crews on our behalf necessary to operate our business or may pay rising crew wages and other vessel operating costs; |
• | Fuel, or bunker, price fluctuations may have an adverse effect on our cash flows, liquidity and our ability to pay dividends to our stockholders; |
• | We must make substantial capital expenditures to maintain the operating capacity of our fleet, which may reduce or eliminate the amount of cash available for distribution to our stockholders; |
• | The derivative contracts we have entered into to hedge our exposure to fluctuations in interest rates, foreign currencies, bunker prices and freight rates can result in reductions in our stockholders’ equity as well as reductions in our income; |
• | We are subject to regulation and liability under environmental and operational safety laws that could require significant expenditures and affect our cash flows and net income; |
• | Our business depends upon certain members of our senior management who may not necessarily continue to work for us; |
• | Our chairman and chief executive officer has affiliations with our managers and others that could create conflicts of interest between us and our managers or other entities in which he has an interest; |
• | Our managers are privately held companies and there is little or no publicly available information about them; and |
• | Being active in multiple lines of business, including managing multiple fleets, requires management to allocate significant attention and resources, and failure to successfully or efficiently manage each line of business may harm our business and operating results. |
• | The price of our securities may be volatile and future sales of our equity securities could cause the market price of our securities to decline; |
• | Investors may view our having multiple lines of business, including ownership of multiple fleets, negatively, which may decrease the trading price of our securities; |
• | Holders of Preferred Stock have extremely limited voting rights; and |
• | Members of the Konstantakopoulos family are our principal existing stockholders and will effectively be able to control the outcome of matters on which our stockholders are entitled to vote; their interests may be different from yours. |
• | supply of and demand for energy resources, commodities, semi-finished and finished consumer and industrial products; |
• | changes in the exploration or production of energy resources, commodities, semi-finished and finished consumer and industrial products; |
• | the location of regional and global exploration, production and manufacturing facilities; |
• | the location of consuming regions for energy resources, commodities, semi-finished and finished consumer and industrial products; |
• | the globalization of production and manufacturing; |
• | global and regional economic and political conditions, including armed conflicts, terrorist activities, sanctions, embargoes, strikes, tariffs and “trade wars”; |
• | economic slowdowns caused by public health events such as the coronavirus (“COVID-19”) pandemic or another epidemic; |
• | natural disasters, developments and other disruptions in international trade; |
• | changes in seaborne and other transportation patterns, including the distance cargo products are transported by sea, competition with other modes of cargo transportation and trade patterns; |
• | environmental and other regulatory developments; |
• | currency exchange rates; and |
• | weather. |
• | the availability of financing; |
• | the price of steel and other raw materials; |
• | the number of newbuilding orders and deliveries, including slippage in deliveries; |
• | the cost of newbuildings and the time it takes to construct a newbuild; |
• | the number of shipyards and ability of shipyards to deliver vessels; |
• | port and canal congestion; |
• | scrap prices and the time it takes to scrap a vessel; |
• | speed of vessel operation; |
• | costs of bunkers and other operating costs; |
• | vessel casualties; |
• | the efficiency and age profile of the existing containership and dry bulk fleet in the market; |
• | the number of vessels that are out of service, namely those that are laid-up, dry-docked, awaiting repairs or otherwise not available for hire; |
• | the economics of slow steaming; |
• | government and industry regulation of maritime transportation practices, particularly environmental protection laws and regulations; and |
• | sanctions (in particular, sanctions on Iran, Russia and Venezuela, amongst others). |
• | marine disaster; |
• | piracy or terrorist attacks including the Houthi seizures and attacks on commercial vessels in the Red Sea, the Gulf of Aden, the Persian Gulf and the Arabian Sea; |
• | environmental accidents; |
• | grounding, fire, explosions and collisions; |
• | cargo and property loss or damage; |
• | business interruptions caused by mechanical failure, human error, war, terrorism, disease and quarantine, political action in various countries or adverse weather conditions; and |
• | work stoppages or other labor problems with crew members serving on our vessels, some of whom are unionized and covered by collective bargaining agreements. |
• | prevailing economic conditions in the markets in which our vessels operate; |
• | reduced demand for containerships or dry bulk vessels, including as a result of a substantial or extended decline in world trade; |
• | increases in the supply of vessel capacity; |
• | changes in prevailing charter hire rates; |
• | the physical condition, size, age and technical specification of the ships; |
• | the costs of building new vessels; |
• | changes in technology which can render older vessels obsolete; |
• | the relative environmental efficiency of the vessel, as compared to others in the markets in which our vessels operate; |
• | whether the vessel is equipped with an exhaust gas scrubber or not; and |
• | the cost of retrofitting or modifying existing ships to respond to technological advances in vessel design or equipment, changes in applicable environmental or other regulations or standards, customer requirements or otherwise. |
• | quality or engineering problems; |
• | breach of contract by, or disputes with, our counterparties; |
• | changes in governmental regulations or maritime self-regulatory organization standards; |
• | work stoppages or other labor disturbances at the shipyard; |
• | bankruptcy of or other financial crisis involving the shipyard or other seller; |
• | a backlog of orders at the shipyard; |
• | sanctions imposed on the seller, the shipyard, or the vessel; political, social or economic disturbances; |
• | weather interference or a catastrophic event, such as a major earthquake or fire, or other accident; |
• | disruptions due to an epidemic or pandemic; |
• | requests for changes to the original vessel specifications; |
• | shortages of or delays in the receipt of necessary construction materials, such as steel; |
• | an inability to obtain requisite permits or approvals; |
• | financial instability of the lenders under our committed credit facilities, resulting in potential delay or inability to draw down on such facilities; and |
• | financial instability of the charterers under our agreed time charters for the newbuild vessels, resulting in potential delay or inability to charter the newbuild vessels. |
• | the operations of the shipyards that build any newbuild vessels we may order; |
• | the availability of employment for our vessels; |
• | locating and identifying suitable secondhand vessels; |
• | obtaining newbuild or secondhand contracts at acceptable prices; |
• | obtaining required financing on acceptable terms; |
• | consummating vessel acquisitions; |
• | enlarging our customer base; |
• | hiring additional shore-based employees and seafarers; |
• | continuing to meet technical and safety performance standards; and |
• | managing joint ventures or significant acquisitions and integrating the new ships into our fleet. |
• | fail to realize anticipated benefits, such as new customer relationships, cost-savings or cash flow enhancements; |
• | be unable (through our managers) to hire, train or retain qualified shore-based and seafaring personnel to manage and operate our growing business and fleet; |
• | decrease our liquidity by using a significant portion of available cash or borrowing capacity to finance acquisitions; |
• | significantly increase our interest expense or financial leverage if we incur additional debt to finance acquisitions; |
• | incur or assume unanticipated liabilities, losses or costs associated with any vessels or businesses acquired; or |
• | incur other significant charges, such as impairment of goodwill or other intangible assets, asset devaluation or restructuring charges. |
• | global and regional economic and political conditions; |
• | supply and demand for energy resources, commodities, semi-finished and finished consumer and industrial products; |
• | developments in international trade; |
• | changes in seaborne and other transportation patterns, including changes in the distances that cargoes are transported; |
• | environmental concerns and regulations; |
• | weather; |
• | the number of newbuilding deliveries; |
• | the improved fuel efficiency of newer vessels; and |
• | the recycling rate of older vessels. |
• | pay dividends if an event of default has occurred and is continuing or would occur as a result of the payment of such dividends; |
• | purchase or otherwise acquire for value any shares of our subsidiaries’ capital; |
• | make or repay loans or advances, other than repayment of the credit facilities; |
• | make investments in or provide guarantees to other persons; |
• | sell or transfer significant assets, including any vessel or vessels mortgaged under the credit facilities, to any person, including Costamare Inc. and our subsidiaries; |
• | create liens on assets; or |
• | allow the Konstantakopoulos family’s direct or indirect holding in Costamare Inc. to fall below 30% of the total issued and outstanding share capital. |
• | the ratio of our total liabilities (after deducting all cash and cash equivalents) to market value adjusted total assets (after deducting all cash and cash equivalents) may not exceed 0.75:1; |
• | the ratio of EBITDA over net interest expense must be equal to or higher than 2.5:1, however such covenant should not be considered breached unless the Company’s liquidity is less than 5% of the total debt; |
• | the aggregate amount of all cash and cash equivalents may not be less than the greater of (i) $30 million or (ii) 3% of the total debt; and |
• | the market value adjusted net worth must at all times exceed $500 million. |
• | our ability to obtain additional financing, if necessary, for working capital, capital expenditures, acquisitions or other purposes may be impaired or such financing may not be available on favorable terms; |
• | we may need to use a substantial portion of our cash from operations to make principal and interest payments on our debt, thereby reducing the funds that would otherwise be available for operations, future business opportunities and dividends to our stockholders; |
• | our debt level could make us more vulnerable than our competitors with less debt to competitive pressures or a downturn in our business or the economy generally; and |
• | our debt level may limit our flexibility in responding to changing business and economic conditions. |
• | renew existing charters upon their expiration; |
• | obtain new charters; |
• | successfully enter into sale and purchase transactions and interact with shipyards; |
• | obtain financing and other contractual arrangements with third parties on commercially acceptable terms (therefore potentially increasing operating expenditure for the fleet); |
• | maintain satisfactory relationships with our charterers and suppliers; |
• | operate our fleet efficiently; or |
• | successfully execute our business strategies. |
• | actual or anticipated fluctuations in quarterly and annual results; |
• | fluctuations in the seaborne transportation industry, including fluctuations in the containership and dry bulk markets; |
• | our payment of dividends; |
• | mergers and strategic alliances in the shipping industry; |
• | changes in governmental regulations or maritime self-regulatory organization standards; |
• | shortfalls in our operating results from levels forecasted by securities analysts; |
• | announcements concerning us or our competitors; |
• | general economic conditions; |
• | terrorist acts; |
• | future sales of our stock or other securities; |
• | investors’ perceptions of us and the international shipping industry; |
• | the general state of the securities markets; and |
• | other developments affecting us, our industry or our competitors. |
• | our existing stockholders’ proportionate ownership interest in us will decrease; |
• | the dividend amount payable per share on our securities may be lower; |
• | the relative voting strength of each previously outstanding share may be diminished; and |
• | the market price of our securities may decline. |
• | the charter hire payments we obtain from our charters as well as our ability to charter or re-charter our vessels and the charter rates obtained; |
• | the due performance by our charterers and other counterparties of their obligations; |
• | our fleet expansion strategy and associated uses of our cash and our financing requirements; |
• | delays in the delivery of newbuild vessels and the beginning of payments under charters relating to those vessels; |
• | the level of our operating costs, such as the costs of crews, vessel maintenance, lubricants and insurance; |
• | the number of unscheduled off-hire days for our fleet and the timing of, and number of days required for, scheduled dry-docking of our vessels; |
• | disruptions related to an epidemic or pandemic; |
• | prevailing global and regional economic and political conditions, including the conflict between Russia and Ukraine, the conflict between Israel and Hamas and related conflicts in the Middle East and the Red Sea crisis; |
• | changes in interest rates; |
• | currency exchange rate fluctuations; |
• | dry bulk freight rates and bunker prices; |
• | the effect of governmental regulations and maritime self-regulatory organization standards on the conduct of our business; |
• | the requirements imposed by classification societies; |
• | the level of capital expenditures we make, including for maintaining or replacing vessels and complying with regulations; |
• | the level of capital requirements of our dry bulk operating platform and our leasing business; |
• | our debt service requirements, including fluctuations in interest rates, and restrictions on distributions contained in our debt instruments; |
• | fluctuations in our working capital needs; |
• | our ability to make, and the level of, working capital borrowings; |
• | changes in the basis of taxation of our activities in various jurisdictions; |
• | modification or revocation of our dividend policy by our board of directors; |
• | the ability of our subsidiaries to pay dividends and make distributions to us; and |
• | the amount of any cash reserves established by our board of directors. |
• | authorize our board of directors to issue “blank check” preferred stock without stockholder approval; |
• | provide for a classified board of directors with staggered, three-year terms; |
• | prohibit cumulative voting in the election of directors; |
• | authorize the removal of directors only for cause and only upon the affirmative vote of the holders of a majority of the outstanding stock entitled to vote for those directors; |
• | prohibit stockholder action by written consent unless the written consent is signed by all stockholders entitled to vote on the action; and |
• | establish advance notice requirements for nominations for election to our board of directors or for proposing matters that can be acted on by stockholders at stockholder meetings. |
INFORMATION ON THE COMPANY |
A. | History and Development of the Company |
B. | Business Overview |
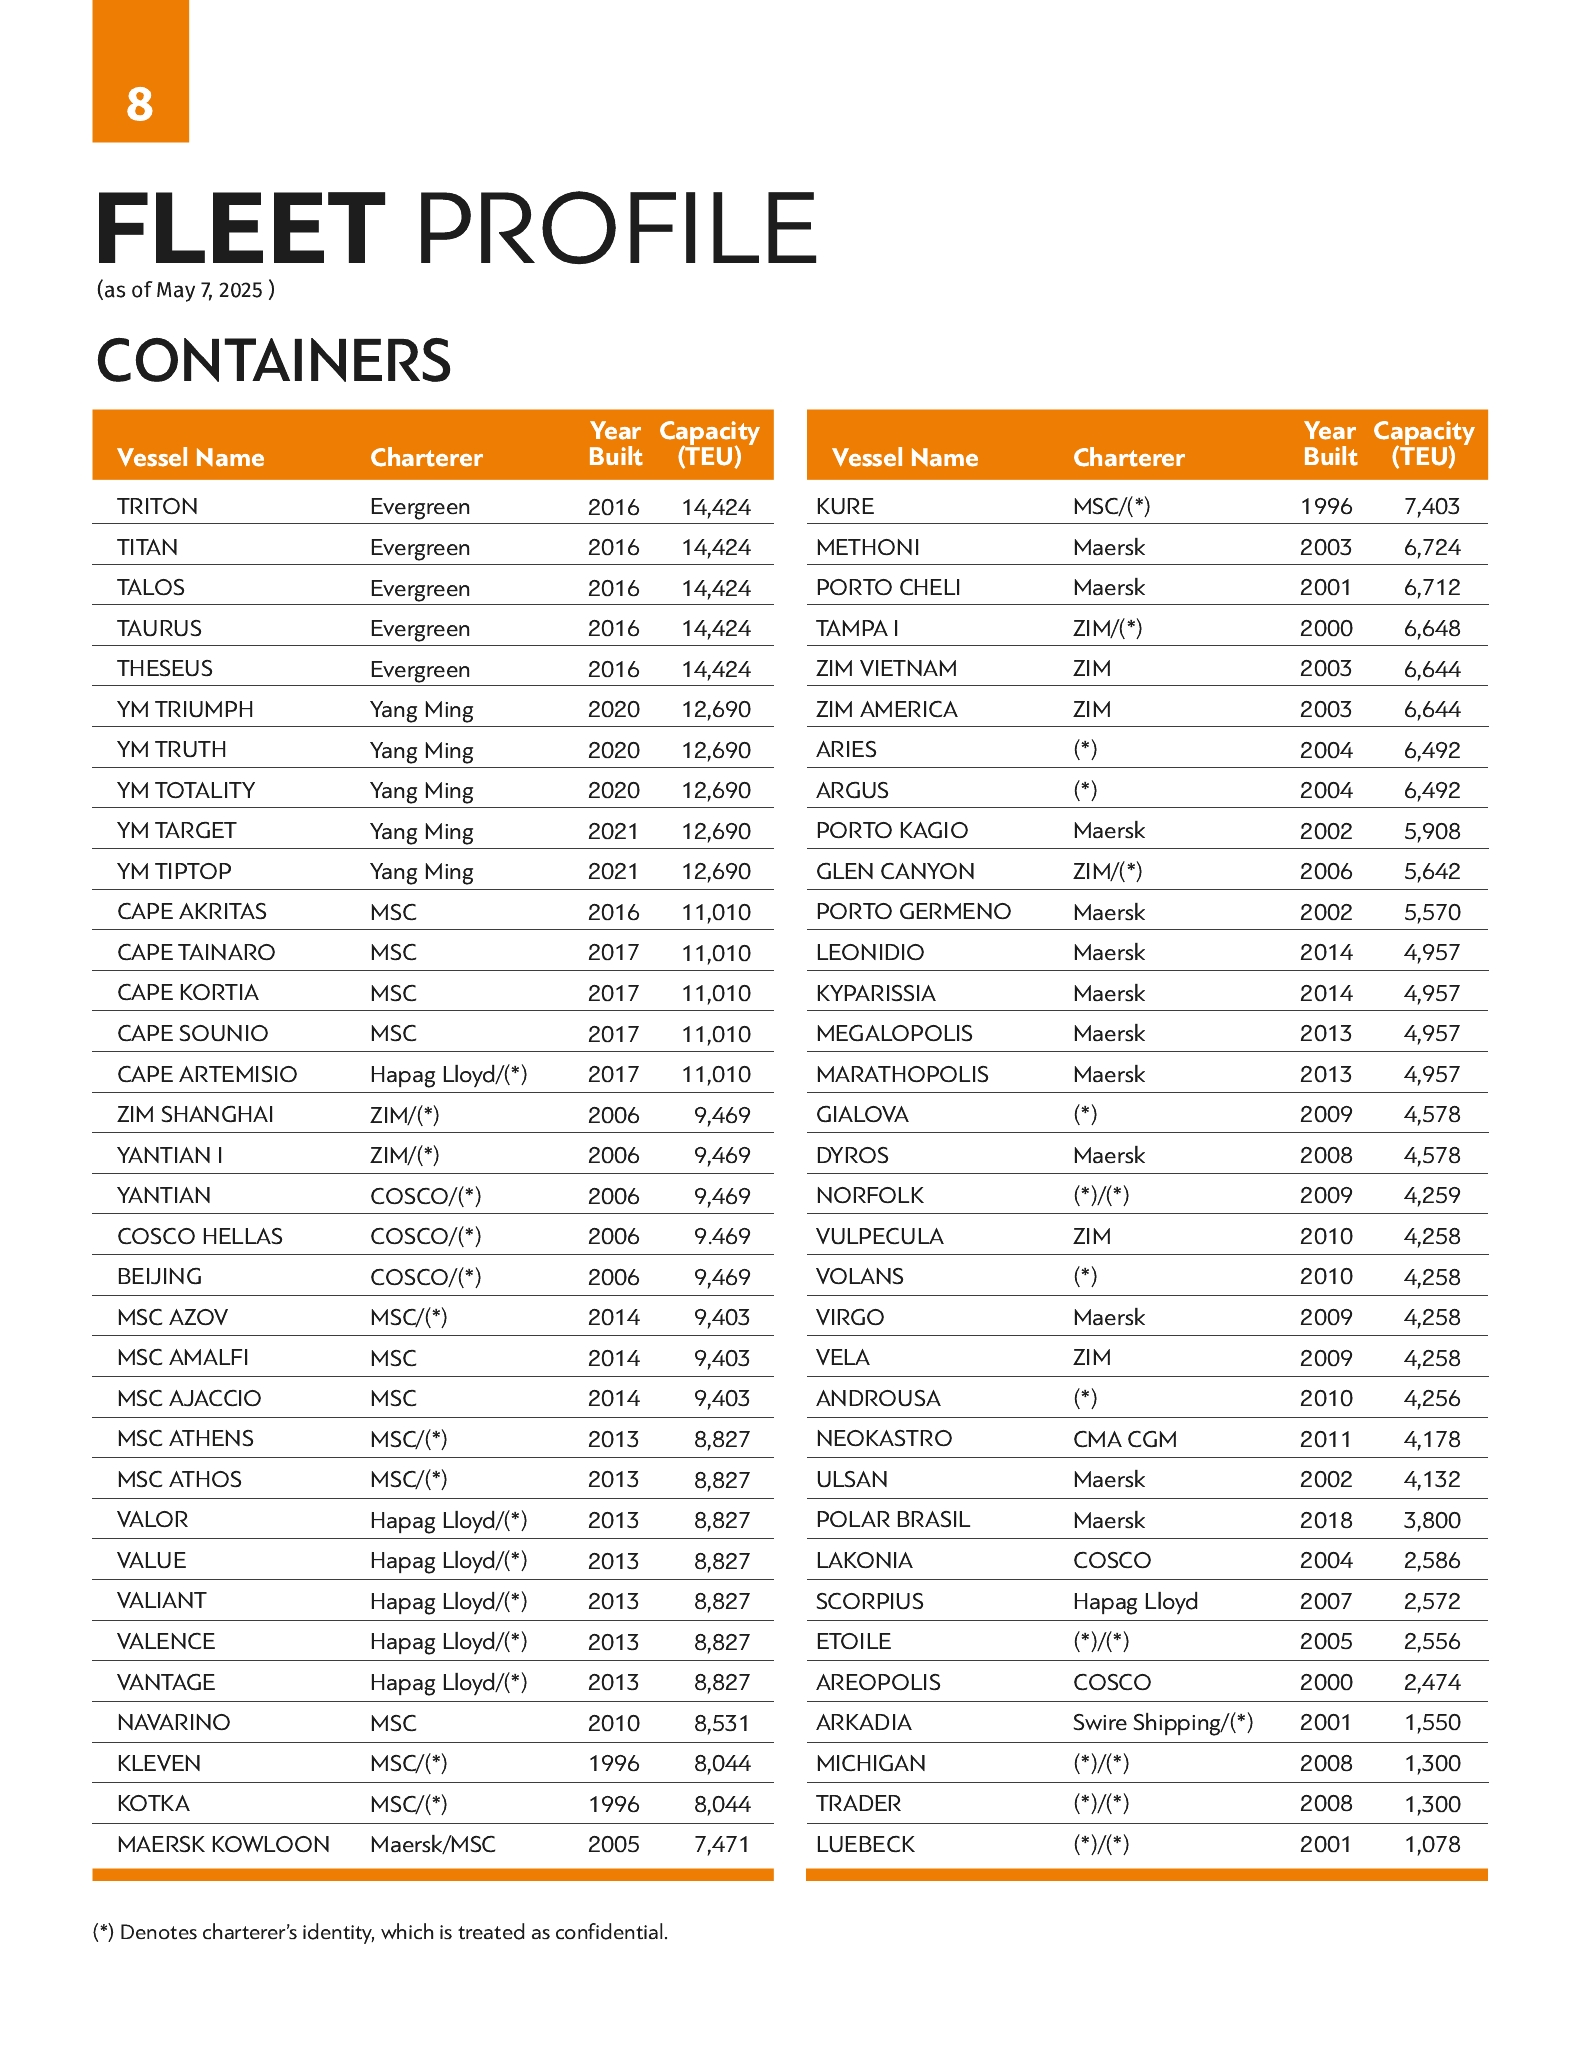
Vessel Name | Charterer | Year Built | Capacity (TEU) | Current Daily Charter Rate(1) (U.S. dollars) | Expiration of Charter(2) | |||||||||||||
1 | TRITON | Evergreen | 2016 | 14,424 | (*) | March 2026 | ||||||||||||
2 | TITAN(i) | Evergreen | 2016 | 14,424 | (*) | April 2026 | ||||||||||||
3 | TALOS(i) | Evergreen | 2016 | 14,424 | (*) | July 2026 | ||||||||||||
4 | TAURUS(i) | Evergreen | 2016 | 14,424 | (*) | August 2026 | ||||||||||||
5 | THESEUS(i) | Evergreen | 2016 | 14,424 | (*) | August 2026 | ||||||||||||
6 | YM TRIUMPH(i) | Yang Ming | 2020 | 12,690 | (*) | May 2030 | ||||||||||||
7 | YM TRUTH(i) | Yang Ming | 2020 | 12,690 | (*) | May 2030 | ||||||||||||
8 | YM TOTALITY(i) | Yang Ming | 2020 | 12,690 | (*) | July 2030 | ||||||||||||
9 | YM TARGET(i) | Yang Ming | 2021 | 12,690 | (*) | November 2030 | ||||||||||||
10 | YM TIPTOP(i) | Yang Ming | 2021 | 12,690 | (*) | March 2031 | ||||||||||||
11 | CAPE AKRITAS | MSC | 2016 | 11,010 | 33,000 | August 2031 | ||||||||||||
12 | CAPE TAINARO | MSC | 2017 | 11,010 | 33,000 | April 2031 | ||||||||||||
13 | CAPE KORTIA | MSC | 2017 | 11,010 | 33,000 | August 2031 | ||||||||||||
14 | CAPE SOUNIO | MSC | 2017 | 11,010 | 33,000 | April 2031 | ||||||||||||
15 | CAPE ARTEMISIO | Hapag Lloyd/(*) | 2017 | 11,010 | 36,650/(*) | March 2030(3) | ||||||||||||
16 | ZIM SHANGHAI | ZIM/(*) | 2006 | 9,469 | 72,700/(*) | May 2028(4) | ||||||||||||
17 | YANTIAN I (ex. ZIM YANTIAN) | ZIM/(*) | 2006 | 9,469 | 72,700/(*) | April 2028(5) | ||||||||||||
18 | YANTIAN | COSCO/(*) | 2006 | 9,469 | (*)/(*) | May 2028(6) | ||||||||||||
19 | COSCO HELLAS | COSCO/(*) | 2006 | 9,469 | (*)/(*) | August 2028(7) | ||||||||||||
20 | BEIJING | COSCO/(*) | 2006 | 9,469 | (*)/(*) | July 2028(8) | ||||||||||||
21 | MSC AZOV | MSC/(*) | 2014 | 9,403 | 35,300/(*) | December 2029(9) | ||||||||||||
22 | MSC AMALFI | MSC | 2014 | 9,403 | 35,300 | March 2027 | ||||||||||||
23 | MSC AJACCIO | MSC | 2014 | 9,403 | 35,300 | February 2027 | ||||||||||||
24 | MSC ATHENS | MSC/(*) | 2013 | 8,827 | 35,300/(*) | January 2029(10) | ||||||||||||
25 | MSC ATHOS | MSC/(*) | 2013 | 8,827 | 35,300/(*) | February 2029(11) | ||||||||||||
26 | VALOR | Hapag Lloyd/(*) | 2013 | 8,827 | 32,400/(*) | April 2030(12) | ||||||||||||
27 | VALUE | Hapag Lloyd/(*) | 2013 | 8,827 | 32,400/(*) | April 2030(13) | ||||||||||||
28 | VALIANT | Hapag Lloyd/(*) | 2013 | 8,827 | 32,400/(*) | June 2030(14) | ||||||||||||
Vessel Name | Charterer | Year Built | Capacity (TEU) | Current Daily Charter Rate(1) (U.S. dollars) | Expiration of Charter(2) | |||||||||||||
29 | VALENCE | Hapag Lloyd/(*) | 2013 | 8,827 | 32,400/(*) | July 2030(15) | ||||||||||||
30 | VANTAGE | Hapag Lloyd/(*) | 2013 | 8,827 | 32,400/(*) | September 2030(16) | ||||||||||||
31 | NAVARINO | MSC/(*) | 2010 | 8,531 | 31,000/(*) | March 2029(17) | ||||||||||||
32 | KLEVEN | MSC/(*) | 1996 | 8,044 | 41,500/(*) | April 2028(18) | ||||||||||||
33 | KOTKA | MSC/(*) | 1996 | 8,044 | 41,500/(*) | September 2028(19) | ||||||||||||
34 | MAERSK KOWLOON | Maersk | 2005 | 7,471 | 18,500 | October 2025 | ||||||||||||
35 | KURE | MSC/(*) | 1996 | 7,403 | 41,500/(*) | August 2028(20) | ||||||||||||
36 | METHONI | Maersk | 2003 | 6,724 | 47,453 | August 2026 | ||||||||||||
37 | PORTO CHELI | Maersk | 2001 | 6,712 | 30,075 | June 2026 | ||||||||||||
38 | TAMPA I | ZIM/(*) | 2000 | 6,648 | 45,000/(*) | July 2025 / June 2028(21) | ||||||||||||
39 | ZIM VIETNAM | ZIM | 2003 | 6,644 | 38,500 | December 2028(22) | ||||||||||||
40 | ZIM AMERICA | ZIM | 2003 | 6,644 | 38,500 | December 2028 (23) | ||||||||||||
41 | ARIES | (*) | 2004 | 6,492 | 58,500 | March 2026 | ||||||||||||
42 | ARGUS | (*) | 2004 | 6,492 | 58,500 | April 2026 | ||||||||||||
43 | PORTO KAGIO | Maersk | 2002 | 5,908 | 28,822 | June 2026 | ||||||||||||
44 | GLEN CANYON | ZIM/(*) | 2006 | 5,642 | 62,500/(*) | June 2025/ April 2028(24) | ||||||||||||
45 | PORTO GERMENO | Maersk | 2002 | 5,570 | 28,822 | June 2026 | ||||||||||||
46 | LEONIDIO | Maersk | 2014 | 4,957 | 18,018 | October 2026 | ||||||||||||
47 | KYPARISSIA | Maersk | 2014 | 4,957 | 18,118 | October 2026 | ||||||||||||
48 | MEGALOPOLIS | Maersk | 2013 | 4,957 | 14,043 | July 2025(25) | ||||||||||||
49 | MARATHOPOLIS | Maersk | 2013 | 4,957 | 14,044 | July 2025(25) | ||||||||||||
50 | GIALOVA | (*) | 2009 | 4,578 | (*) | March 2026 | ||||||||||||
51 | DYROS | Maersk | 2008 | 4,578 | 35,500 | April 2027(26) | ||||||||||||
52 | NORFOLK | (*)/(*) | 2009 | 4,259 | (*)/(*) | March 2028(27) | ||||||||||||
53 | VULPECULA | ZIM | 2010 | 4,258 | Please refer to note 28 | May 2028(28) | ||||||||||||
54 | VOLANS | (*) | 2010 | 4,258 | (*) | July 2027 | ||||||||||||
55 | VIRGO | Maersk | 2009 | 4,258 | 35,500 | April 2027(29) | ||||||||||||
56 | VELA | ZIM | 2009 | 4,258 | Please refer to note 30 | April 2028(30) | ||||||||||||
57 | ANDROUSA | (*) | 2010 | 4,256 | (*) | March 2026 | ||||||||||||
58 | NEOKASTRO | CMA CGM | 2011 | 4,178 | 39,000 | February 2027 | ||||||||||||
59 | ULSAN | Maersk | 2002 | 4,132 | 34,730 | January 2026 | ||||||||||||
60 | POLAR BRASIL(i) | Maersk | 2018 | 3,800 | 21,000 | March 2026(31) | ||||||||||||
61 | LAKONIA | COSCO | 2004 | 2,586 | 23,500 | February 2027(32) | ||||||||||||
62 | SCORPIUS | Hapag Lloyd | 2007 | 2,572 | 16,500 | February 2026 | ||||||||||||
63 | ETOILE | (*)/(*) | 2005 | 2,556 | (*)/(*) | July 2028(33) | ||||||||||||
64 | AREOPOLIS | COSCO | 2000 | 2,474 | 23,500 | March 2027(34) | ||||||||||||
65 | ARKADIA | Swire Shipping | 2001 | 1,550 | 13,000 | March 2025 | ||||||||||||
66 | MICHIGAN | (*)/(*) | 2008 | 1,300 | (*)/(*) | October 2027(35) | ||||||||||||
67 | TRADER | (*)/(*) | 2008 | 1,300 | (*)/(*) | October 2028(36) | ||||||||||||
68 | LUEBECK | (*)/(*) | 2001 | 1,078 | (*)/(*) | April 2028(37) | ||||||||||||
(1) | Daily charter rates are gross, unless stated otherwise. Amounts set out for current daily charter rate are the amounts contained in the charter contracts. |
(2) | Charter terms and expiration dates are based on the earliest date charters (unless otherwise noted) could expire. |
(3) | Cape Artemisio is currently chartered to Hapag Lloyd at a daily rate of $36,650 until March 12, 2025, at the earliest. Upon redelivery of the vessel from Hapag Lloyd, the vessel will commence a new charter with a leading liner company for a period of 60 to 64 months at an undisclosed rate. |
(4) | Zim Shanghai is currently chartered to ZIM at a daily rate of $72,700 until July 1, 2025, at the earliest. Upon redelivery of the vessel from ZIM, the vessel will commence a new charter with a leading liner company for a period of 34 to 36 months at an undisclosed rate. |
(5) | Yantian I (ex. Zim Yantian) is currently chartered to ZIM at a daily rate of $72,700 until June 27, 2025, at the earliest. Upon redelivery of the vessel from ZIM, the vessel will commence a new charter with a leading liner company for a period of 34 to 36 months at an undisclosed rate. |
(6) | Yantian is currently chartered to COSCO at an undisclosed rate until May 1, 2026, at the earliest. Following the aforementioned date, the vessel will be employed with a leading liner company for a period of 24 to 26 months at an undisclosed rate. |
(7) | Cosco Hellas is currently chartered to COSCO at an undisclosed rate until August 1, 2026, at the earliest. Following the aforementioned date, the vessel will be employed with a leading liner company for a period of 24 to 26 months at an undisclosed rate. |
(8) | Beijing is currently chartered to COSCO at an undisclosed rate until July 1, 2026, at the earliest. Following the aforementioned date, the vessel will be employed with a leading liner company for a period of 24 to 26 months at an undisclosed rate. |
(9) | MSC Azov is currently chartered to MSC at a daily rate of $35,300 until December 2026 (earliest redelivery) - January 2027 (latest redelivery). Upon redelivery of the vessel from its current charterer, the vessel will commence a new charter with a leading liner company until December 2029 (earliest redelivery) - February 2030 (latest redelivery) at an undisclosed rate. |
(10) | MSC Athens is currently chartered to MSC at a daily rate of $35,300 until January 2026 (earliest redelivery) - March 2026 (latest redelivery). Upon redelivery of the vessel from its current charterer, the vessel will commence a new charter with a leading liner company until January 2029 (earliest redelivery) - March 2029 (latest redelivery) at an undisclosed rate. |
(11) | MSC Athos is currently chartered to MSC at a daily rate of $35,300 until February 2026 (earliest redelivery) - April 2026 (latest redelivery). Upon redelivery of the vessel from its current charterer, the vessel will commence a new charter with a leading liner company until February 2029 (earliest redelivery) - April 2029 (latest redelivery) at an undisclosed rate. |
(12) | Valor is currently chartered to Hapag Lloyd at a daily rate of $32,400 until April 3, 2025, at the earliest. Upon redelivery of the vessel from Hapag Lloyd, the vessel will commence a new charter with a leading liner company for a period of 60 to 64 months at an undisclosed rate. |
(13) | Value is currently chartered to Hapag Lloyd at a daily rate of $32,400 until April 25, 2025, at the earliest. Upon redelivery of the vessel from Hapag Lloyd, the vessel will commence a new charter with a leading liner company for a period of 60 to 64 months at an undisclosed rate. |
(14) | Valiant is currently chartered to Hapag Lloyd at a daily rate of $32,400 until June 5, 2025, at the earliest. Upon redelivery of the vessel from Hapag Lloyd, the vessel will commence a new charter with a leading liner company for a period of 60 to 64 months at an undisclosed rate. |
(15) | Valence is currently chartered to Hapag Lloyd at a daily rate of $32,400 until July 3, 2025, at the earliest. Upon redelivery of the vessel from Hapag Lloyd, the vessel will commence a new charter with a leading liner company for a period of 60 to 64 months at an undisclosed rate. |
(16) | Vantage is currently chartered to Hapag Lloyd at a daily rate of $32,400 until September 8, 2025, at the earliest. Upon redelivery of the vessel from Hapag Lloyd, the vessel will commence a new charter with a leading liner company for a period of 60 to 64 months at an undisclosed rate. |
(17) | Navarino is currently chartered to MSC at a daily rate of $31,000 until March 1, 2025, at the earliest. Upon redelivery of the vessel from MSC, the vessel will commence a new charter with a leading liner company for a period of 48 to 52 months at an undisclosed rate. |
(18) | Kleven is currently chartered to MSC at a daily rate of $41,500 until November 2026 (earliest redelivery) - January 2027 (latest redelivery). Upon redelivery of the vessel from its current charterer, the vessel will commence a new charter with a leading liner company until April 2028 (earliest redelivery) - June 2028 (latest redelivery) at an undisclosed rate. |
(19) | Kotka is currently chartered to MSC at a daily rate of $41,500 until December 2026 (earliest redelivery) - February 2027 (latest redelivery). Upon redelivery of the vessel from its current charterer, the vessel will commence a new charter with a leading liner company until September 2028 (earliest redelivery) - November 2028 (latest redelivery) at an undisclosed rate. |
(20) | Kure is currently chartered to MSC at a daily rate of $41,500 until July 2026 (earliest redelivery) - September 2026 (latest redelivery). Upon redelivery of the vessel from its current charterer, the vessel will commence a new charter with a leading liner company until August 2028 (earliest redelivery) - October 2028 (latest redelivery) at an undisclosed rate. |
(21) | Tampa I is currently chartered to ZIM at a daily rate of $45,000 until July 2025 (earliest redelivery) - August 2025 (latest redelivery). Upon redelivery of the vessel from ZIM, the vessel will commence a new charter with a leading liner company for a period of 34 to 36 months at an undisclosed rate. |
(22) | ZIM Vietnam is currently chartered at a daily rate of $53,000 until October 17, 2025. From such date and until the expiration of the charter the new daily rate will be $38,500. |
(23) | ZIM America is currently chartered at a daily rate of $53,000 until October 3, 2025. From such date and until the expiration of the charter the new daily rate will be $38,500. |
(24) | Glen Canyon is currently chartered to ZIM at a daily rate of $62,500 until June 2025 (earliest redelivery) - September 2025 (latest redelivery). Upon redelivery of the vessel from ZIM, the vessel will commence a new charter with a leading liner company for a period of 34 to 36 months at an undisclosed rate. |
(25) | Charterer has the option to extend the current time charter for an additional period of approximately 24 months at a daily rate of $14,500. |
(26) | Dyros is currently chartered to Maersk at a daily rate of $17,500 until April 15, 2025. Following the aforementioned date, the new daily rate will be $35,500 for a period of 24 to 26 months. |
(27) | Norfolk is currently chartered until March 2025 (earliest redelivery) - May 2025 (latest redelivery). Upon redelivery of the vessel from its current charterer, the vessel will commence a new charter with a leading liner company until March 2028 (earliest redelivery) - May 2028 (latest redelivery) at an undisclosed rate. |
(28) | Vulpecula is currently chartered to ZIM under a charterparty agreement which commenced in May 2023. The tenor of the charter is for a period of 60 to 64 months. For this charter, the daily rate is $99,000 for the first 12 month period, $91,250 for the second 12 month period, $10,000 for the third 12 month period and $8,000 for the remaining duration of the charter. |
(29) | Virgo is currently chartered to Maersk at a daily rate of $21,500 until April 15, 2025. Following the aforementioned date, the new daily rate will be $35,500 for a period of 24 to 26 months. |
(30) | Vela is currently chartered to ZIM under a charterparty agreement which commenced in April 2023. The tenor of the charter is for a period of 60 to 64 months. For this charter, the daily rate is $99,000 for the first 12 month period, $91,250 for the second 12 month period, $10,000 for the third 12 month period and $8,000 for the remaining duration of the charter. |
(31) | Polar Brasil is currently chartered at a daily rate of $19,700 until April 27, 2025. From such date and until the expiration of the charter, the new daily rate will be $21,000. The charterer has the option to extend the current time charter for two additional one-year periods at a daily rate of $21,000. |
(32) | Lakonia is currently chartered to COSCO at a daily rate of $26,500 until March 24, 2025. Following the aforementioned date, the new daily rate will be $23,500 for a period of 23 to 25 months. |
(33) | Etoile is currently chartered until June 2026 (earliest redelivery) - September 2026 (latest redelivery). Upon redelivery of the vessel from its current charterer, the vessel will commence a new charter with a leading liner company until July 2028 (earliest redelivery) - August 2028 (latest redelivery) at an undisclosed rate. |
(34) | Areopolis is currently chartered to COSCO at a daily rate of $26,500 until April 3, 2025. Following the aforementioned date, the new daily rate will be $23,500 for a period of 23 to 25 months. |
(35) | Michigan is currently chartered until October 2025 (earliest redelivery) - December 2025 (latest redelivery). Upon redelivery of the vessel from its current charterer, the vessel will commence a new charter with a leading liner company until October 2027 (earliest redelivery) - December 2027 (latest redelivery) at an undisclosed rate. |
(36) | Trader is currently chartered until October 2026 (earliest redelivery) - December 2026 (latest redelivery). Upon redelivery of the vessel from its current charterer, the vessel will commence a new charter with a leading liner company until October 2028 (earliest redelivery) - December 2028 at an undisclosed rate. |
(37) | Luebeck is currently chartered until April 2026 (earliest redelivery) - June 2026 (latest redelivery). Upon redelivery of the vessel from its current charterer, the vessel will commence a new charter with a leading liner company until April 2028 (earliest redelivery) - June 2028 (latest redelivery) at an undisclosed rate. |
(i) | Denotes vessels subject to a sale and leaseback transaction. |
(*) | Denotes charterer’s identity and/or current daily charter rates and/or charter expiration dates, which are treated as confidential. |
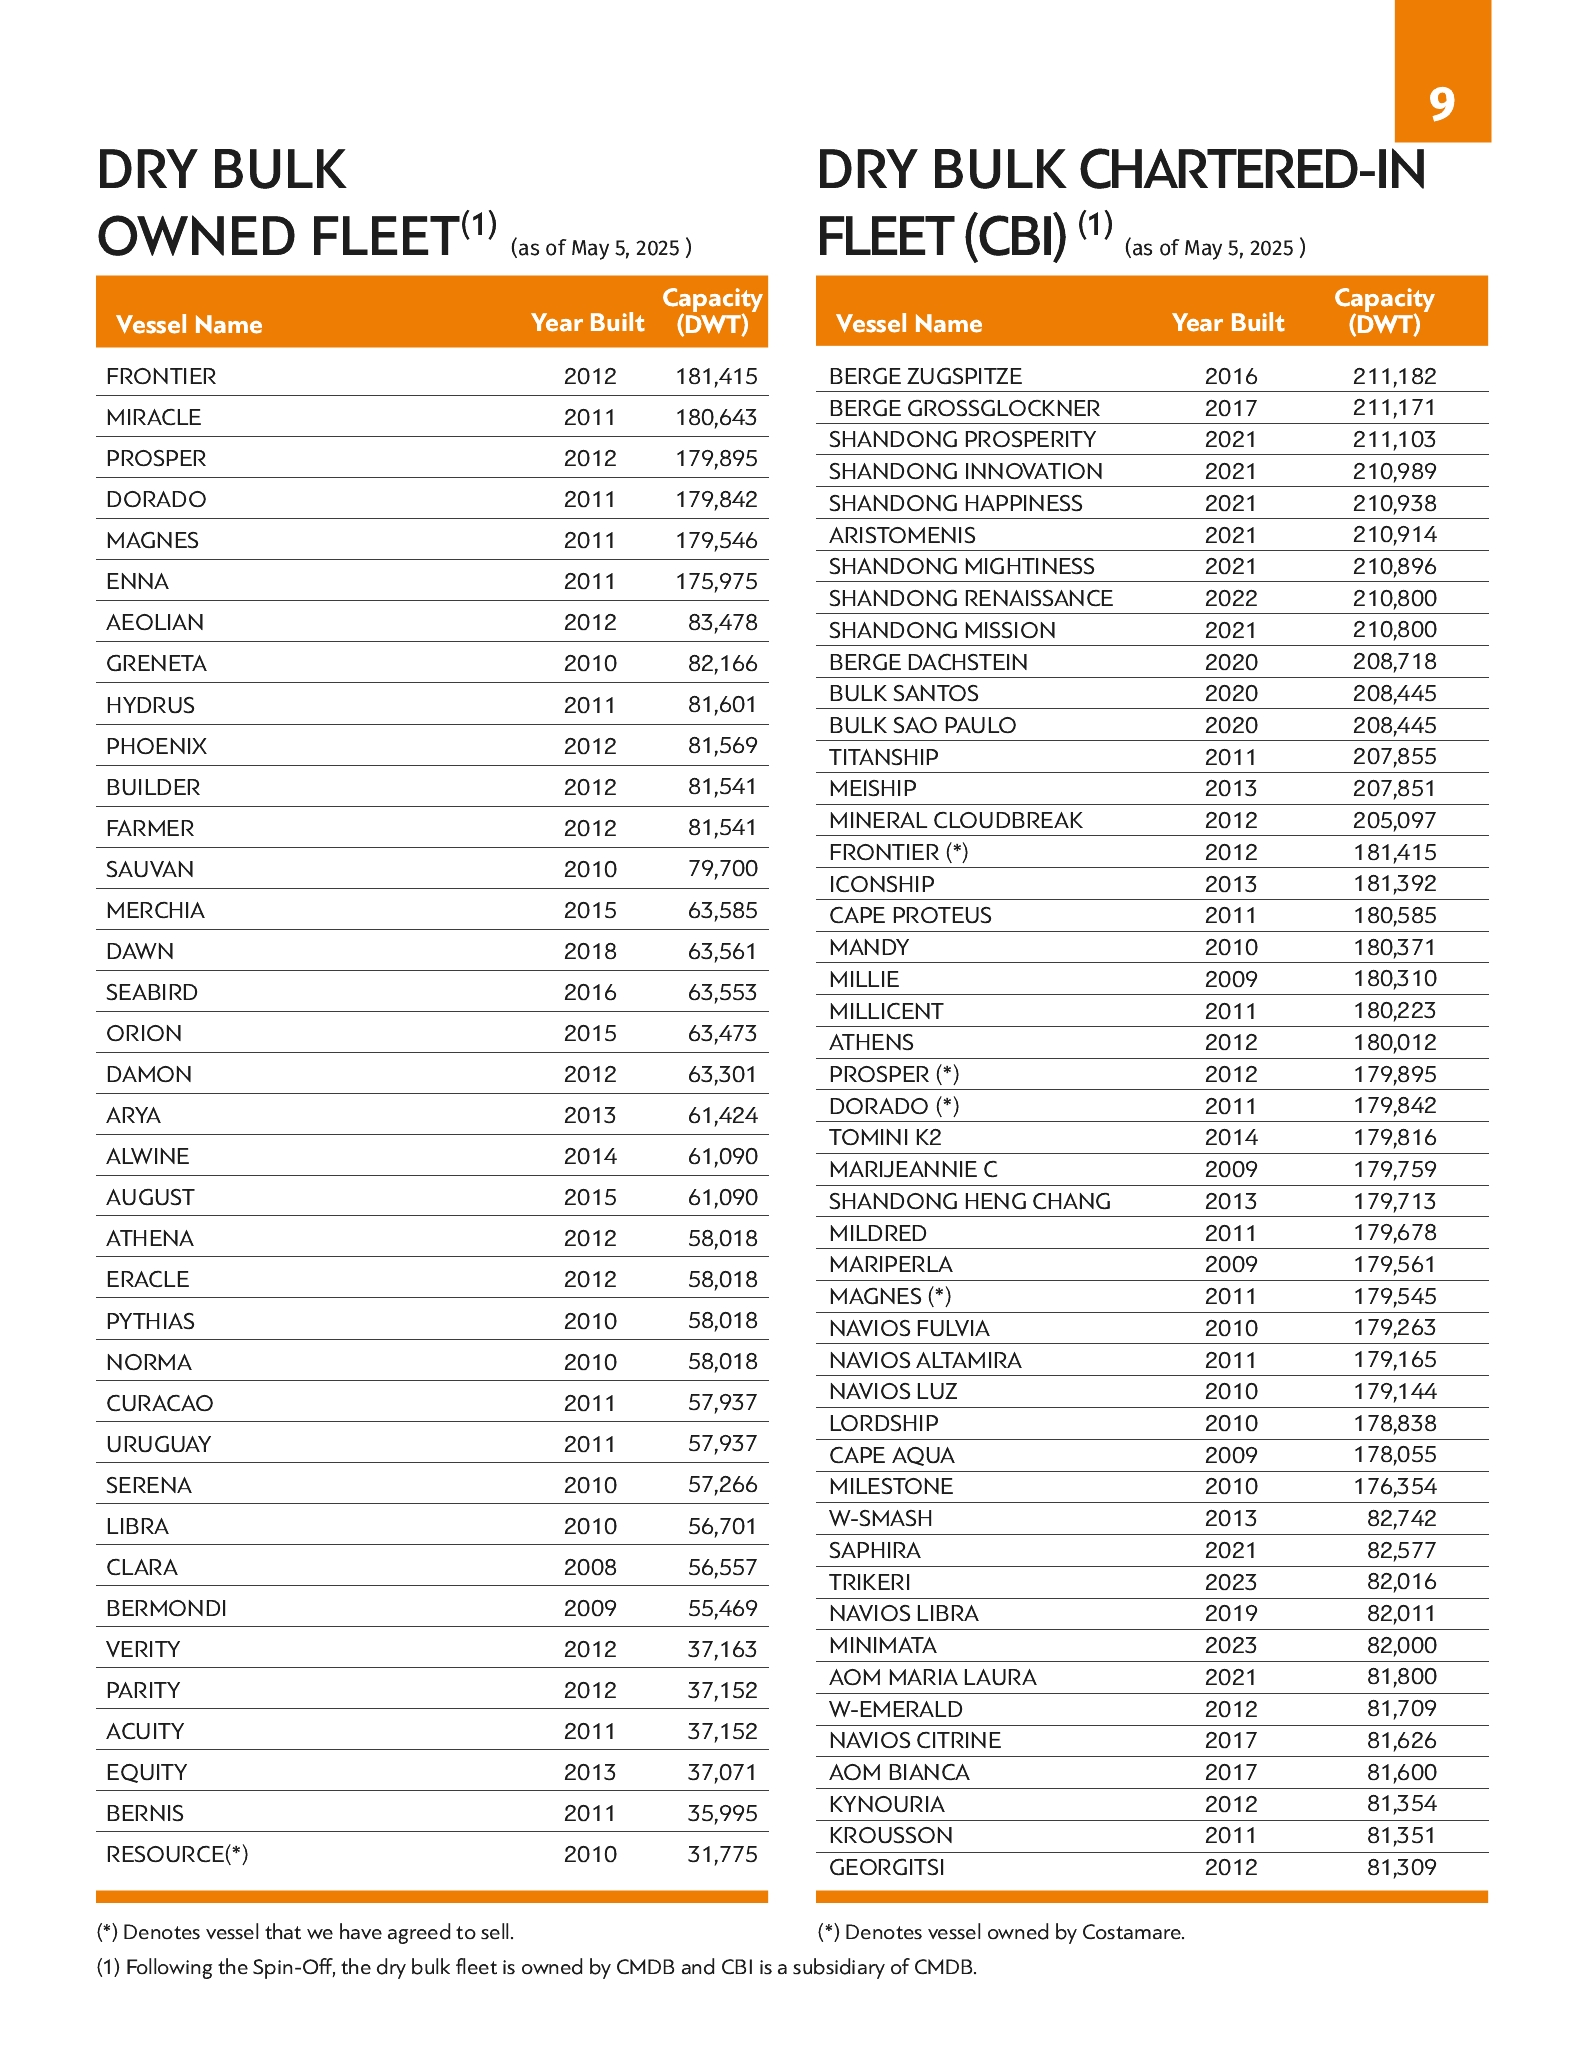
Vessel Name | Year Built | Capacity (DWT) | |||||||
1 | FRONTIER | 2012 | 181,415 | ||||||
2 | MIRACLE | 2011 | 180,643 | ||||||
3 | PROSPER | 2012 | 179,895 | ||||||
4 | DORADO | 2011 | 179,842 | ||||||
5 | MAGNES | 2011 | 179,546 | ||||||
6 | ENNA | 2011 | 175,975 | ||||||
7 | AEOLIAN | 2012 | 83,478 | ||||||
8 | GRENETA | 2010 | 82,166 | ||||||
9 | HYDRUS | 2011 | 81,601 | ||||||
10 | PHOENIX | 2012 | 81,569 | ||||||
11 | BUILDER | 2012 | 81,541 | ||||||
12 | FARMER | 2012 | 81,541 | ||||||
13 | SAUVAN | 2010 | 79,700 | ||||||
14 | ROSE(i) | 2008 | 76,619 | ||||||
15 | MERCHIA | 2015 | 63,585 | ||||||
16 | DAWN | 2018 | 63,561 | ||||||
17 | SEABIRD | 2016 | 63,553 | ||||||
18 | ORION | 2015 | 63,473 | ||||||
19 | DAMON | 2012 | 63,301 | ||||||
20 | ARYA | 2013 | 61,424 | ||||||
21 | ALWINE | 2014 | 61,090 | ||||||
22 | AUGUST | 2015 | 61,090 | ||||||
23 | ATHENA | 2012 | 58,018 | ||||||
Vessel Name | Year Built | Capacity (DWT) | |||||||
24 | ERACLE | 2012 | 58,018 | ||||||
25 | PYTHIAS | 2010 | 58,018 | ||||||
26 | NORMA | 2010 | 58,018 | ||||||
27 | CURACAO | 2011 | 57,937 | ||||||
28 | URUGUAY | 2011 | 57,937 | ||||||
29 | SERENA | 2010 | 57,266 | ||||||
30 | LIBRA | 2010 | 56,701 | ||||||
31 | CLARA | 2008 | 56,557 | ||||||
32 | BERMONDI | 2009 | 55,469 | ||||||
33 | VERITY | 2012 | 37,163 | ||||||
34 | PARITY | 2012 | 37,152 | ||||||
35 | ACUITY | 2011 | 37,152 | ||||||
36 | EQUITY | 2013 | 37,071 | ||||||
37 | BERNIS | 2011 | 35,995 | ||||||
38 | RESOURCE | 2010 | 31,775 | ||||||
(i) | Denotes vessel we have agreed to sell. |
• | Costamare Shipping provided commercial and insurance services to all of our containerships and dry bulk vessels, as well as technical, crewing, provisioning, bunkering, sale and purchase and accounting services to 25 of our containerships; |
• | V.Ships Greece provided technical, crewing, provisioning, bunkering, sale and purchase and accounting services to 17 of our containerships and 11 of our dry bulk vessels; |
• | Vinnen provided technical, crewing, provisioning, bunkering, sale and purchase and accounting services to five of our containerships; |
• | HanseContor provided technical, crewing, provisioning, bunkering, sale and purchase and accounting services to six of our containerships; |
• | FML provided technical, crewing, provisioning, bunkering, sale and purchase and accounting services to 13 of our dry bulk vessels; |
• | Navilands provided technical, crewing, provisioning, bunkering, sale and purchase and accounting services to six of our dry bulk vessels and to five containerships; and |
• | Navilands (Shanghai) provided technical, crewing, provisioning, bunkering, sale and purchase and accounting services to eight of our dry bulk vessels and to 10 containerships. |
2025 | 2026 | 2027 | 2028 | 2029 | |||||||||||
Number of Containerships | 15 | 18 | 8 | 15 | 9 | ||||||||||
Number of Dry Bulk Vessels | 11 | 9 | 11 | 12 | 11 | ||||||||||
(1) | Excludes one dry bulk vessel that we have agreed to sell. |
• | natural resource damages and the costs of assessment thereof; |
• | real and personal property damage; |
• | net loss of taxes, royalties, rents, fees and other lost revenues; |
• | lost profits or impairment of earning capacity due to property or natural resource damages; and |
• | net cost of public services necessitated by a spill response, such as protection from fire, safety or health hazards, and loss of subsistence use of natural resources. |
• | on-board installation of automatic information systems to enhance vessel-to-vessel and vessel-to-shore communications; |
• | on-board installation of ship security alert systems; |
• | the development of ship security plans; and |
• | compliance with flag state security certification requirements. |
C. | Organizational Structure |
D. | Property, Plant and Equipment |
UNRESOLVED STAFF COMMENTS |
OPERATING AND FINANCIAL REVIEW AND PROSPECTS |
2025 | 2026 | 2027 | 2028 | 2029 | 2030 | 2031 - 2034 | |||||||||||||||
No. of Vessels whose Charters Expire(1)(2) | 36 | 24 | 9 | 18 | 4 | 10 | 5 | ||||||||||||||
No. of Containerships whose Charters Expire | 4 | 18 | 9 | 18 | 4 | 10 | 5 | ||||||||||||||
No. of Dry Bulk Vessels whose Charters Expire(1)(2) | 32 | 6 | — | — | — | — | — | ||||||||||||||
TEU of Expiring Containership Charters | 18,935 | 139,270 | 42,438 | 114,105 | 35,588 | 105,905 | 56,730 | ||||||||||||||
DWT of Expiring Dry Bulk Vessel Charters | 2,151,027 | 865,828 | — | — | — | — | — | ||||||||||||||
Contracted Days | 28,649 | 21,178 | 14,493 | 10,134 | 5,949 | 3,511 | 745 | ||||||||||||||
Available Days | 10,041 | 17,512 | 24,197 | 28,166 | 31,646 | 33,869 | 136,616 | ||||||||||||||
Contracted/Total Days | 74.0% | 54.7% | 37.5% | 26.5% | 15.8% | 9.4% | 0.5% | ||||||||||||||
2025 | 2026 | 2027 | 2028 | 2029 | 2030 | 2031 - 2034 | |||||||||||||||
Containership Contracted/Total Containership Days (TEU -adjusted)(3) | 98.6% | 80.4% | 62.9% | 50.5% | 35.7% | 21.9% | 1.3% | ||||||||||||||
Dry Bulk Vessel Contracted/Total Dry Bulk Vessel Days (dwt-adjusted)(4) | 48.9% | 26.9% | — | — | — | — | — | ||||||||||||||
(1) | Includes one dry bulk vessel with no employment as at December 31, 2024. |
(2) | Total days are calculated on the assumption that the vessels will continue trading until the age of 30 years old for containerships and 25 years for dry bulk vessels, unless the containership will exceed 30 years of age or the dry bulk vessel will exceed 25 years of age at the expiry of its current time charter, in which case we assume that the vessel continues trading until that expiry date. |
(3) | Contracted Days coverage for containerships adjusted by TEU capacity. |
(4) | Contracted Days coverage for dry bulk vessels adjusted by dwt capacity. |
A. | Operating Results |
• | Number of Vessels in Our Fleet. The number of vessels in our fleet is a key factor in determining the level of our revenues. Aggregate expenses also increase as the size of our fleet increases. Vessel acquisitions and dispositions give rise to gains and losses and other one-time items. Average number of vessels is the number of vessels that constituted our fleet for the relevant period, as measured by the sum of the ownership days each vessel was part of our fleet during the period divided by the number of calendar days in that period. As of February 12, 2025, our containership fleet amounted to a total of 68 vessels and our dry bulk fleet amount to a total of 38. |
• | Charter Rates. The charter rates we obtain for our vessels also drive our revenues. Charter rates are based primarily on demand and supply of vessel capacity at the time we enter into the charters for our vessels. Demand and supply can fluctuate significantly over time as a result of changing economic conditions affecting trade flow between ports and the industries which use our shipping services. Vessels operated under long-term charters are less susceptible to cyclical containership charter rates than vessels operated on shorter-term charters, such as spot charters. We are exposed to varying charter rate environments when our chartering arrangements expire and we seek to deploy our vessels under new charters. As illustrated in the table above under “—Overview”, we aim to reduce our exposure to any one particular rate environment and point in the shipping cycle on the containership sector by staggering the maturities of our vessels’ charters, while in the dry bulk sector we operate our vessels primarily on short term time charters, index-linked time charters, or voyage charters. See “—Voyage Revenue”. |
• | Utilization of Our Fleet. We calculate utilization of our fleet by dividing the number of days during which our vessels are employed less the aggregate number of days that our vessels are off-hire due to any reason other than due to scheduled repairs or repairs under guarantee, vessel upgrades or special surveys by the number of days during which our vessels are employed. We use fleet utilization to measure our vessels’ condition and efficiency in servicing our clients whilst employed. Historically, our fleet has had a limited number of unscheduled off-hire days during the period of employment. In 2022, 2023 and 2024 our fleet utilization for each year was 98.4%, 98.9% and 99.5%, respectively. More specifically, in 2024 our containerships fleet utilization rate was 99.8% and our dry bulk fleet utilization rate was 98.9%. If the utilization pattern of our fleet changes, our financial results would be affected. |
• | Expenses and Other Costs. Our ability to control our fixed and variable expenses is critical to our ability to maintain acceptable profit margins. These expenses include commission expenses, crew wages and related costs, the cost of insurance and vessel registry, expenses for repairs and maintenance, the cost of spares and consumable stores, lubricating oil costs, tonnage taxes, regulatory fees, vessel scrubbers and Ballast Water Treatment System (“BWTS”) maintenance expenses and other miscellaneous expenses. Furthermore, such expenses include the cost of chartering-in vessels by CBI along with the associated voyage expenses for such vessels which are subsequently employed under voyage charters. In addition, factors beyond our control, such as developments relating to market premiums for insurance and the value of the U.S. dollar compared to currencies in which certain of our expenses, primarily crew wages, are paid, can cause our vessel operating expenses to increase. We proactively manage our foreign currency exposure by entering into Euro/dollar forward contracts in an effort to minimize volatility in Euro denominated expenses. |
• | Financing Expenses. We rely on external financing mainly from banks and other financing institutions, which we primarily use for the acquisition of vessels and refinancing of maturing financing facilities. We proactively seek to hedge the associated interest rate exposure, subject to market conditions, in an effort to minimize the embedded volatility in interest rate expenses. |
Year Ended December 31, | |||||||||||||||
2020 | 2021 | 2022 | 2023 | 2024 | |||||||||||
(Expressed in thousands of U.S. dollars, except for share and per share data) | |||||||||||||||
STATEMENT OF INCOME | |||||||||||||||
Revenues: | |||||||||||||||
Voyage revenue | $460,319 | $793,639 | $1,113,859 | $1,502,491 | $1,849,860 | ||||||||||
Voyage revenue-related parties | — | — | — | — | 210,087 | ||||||||||
Total voyage revenue | 460,319 | 793,639 | 1,113,859 | 1,502,491 | 2,059,947 | ||||||||||
Income from investments in leaseback vessels | — | — | — | 8,915 | 23,947 | ||||||||||
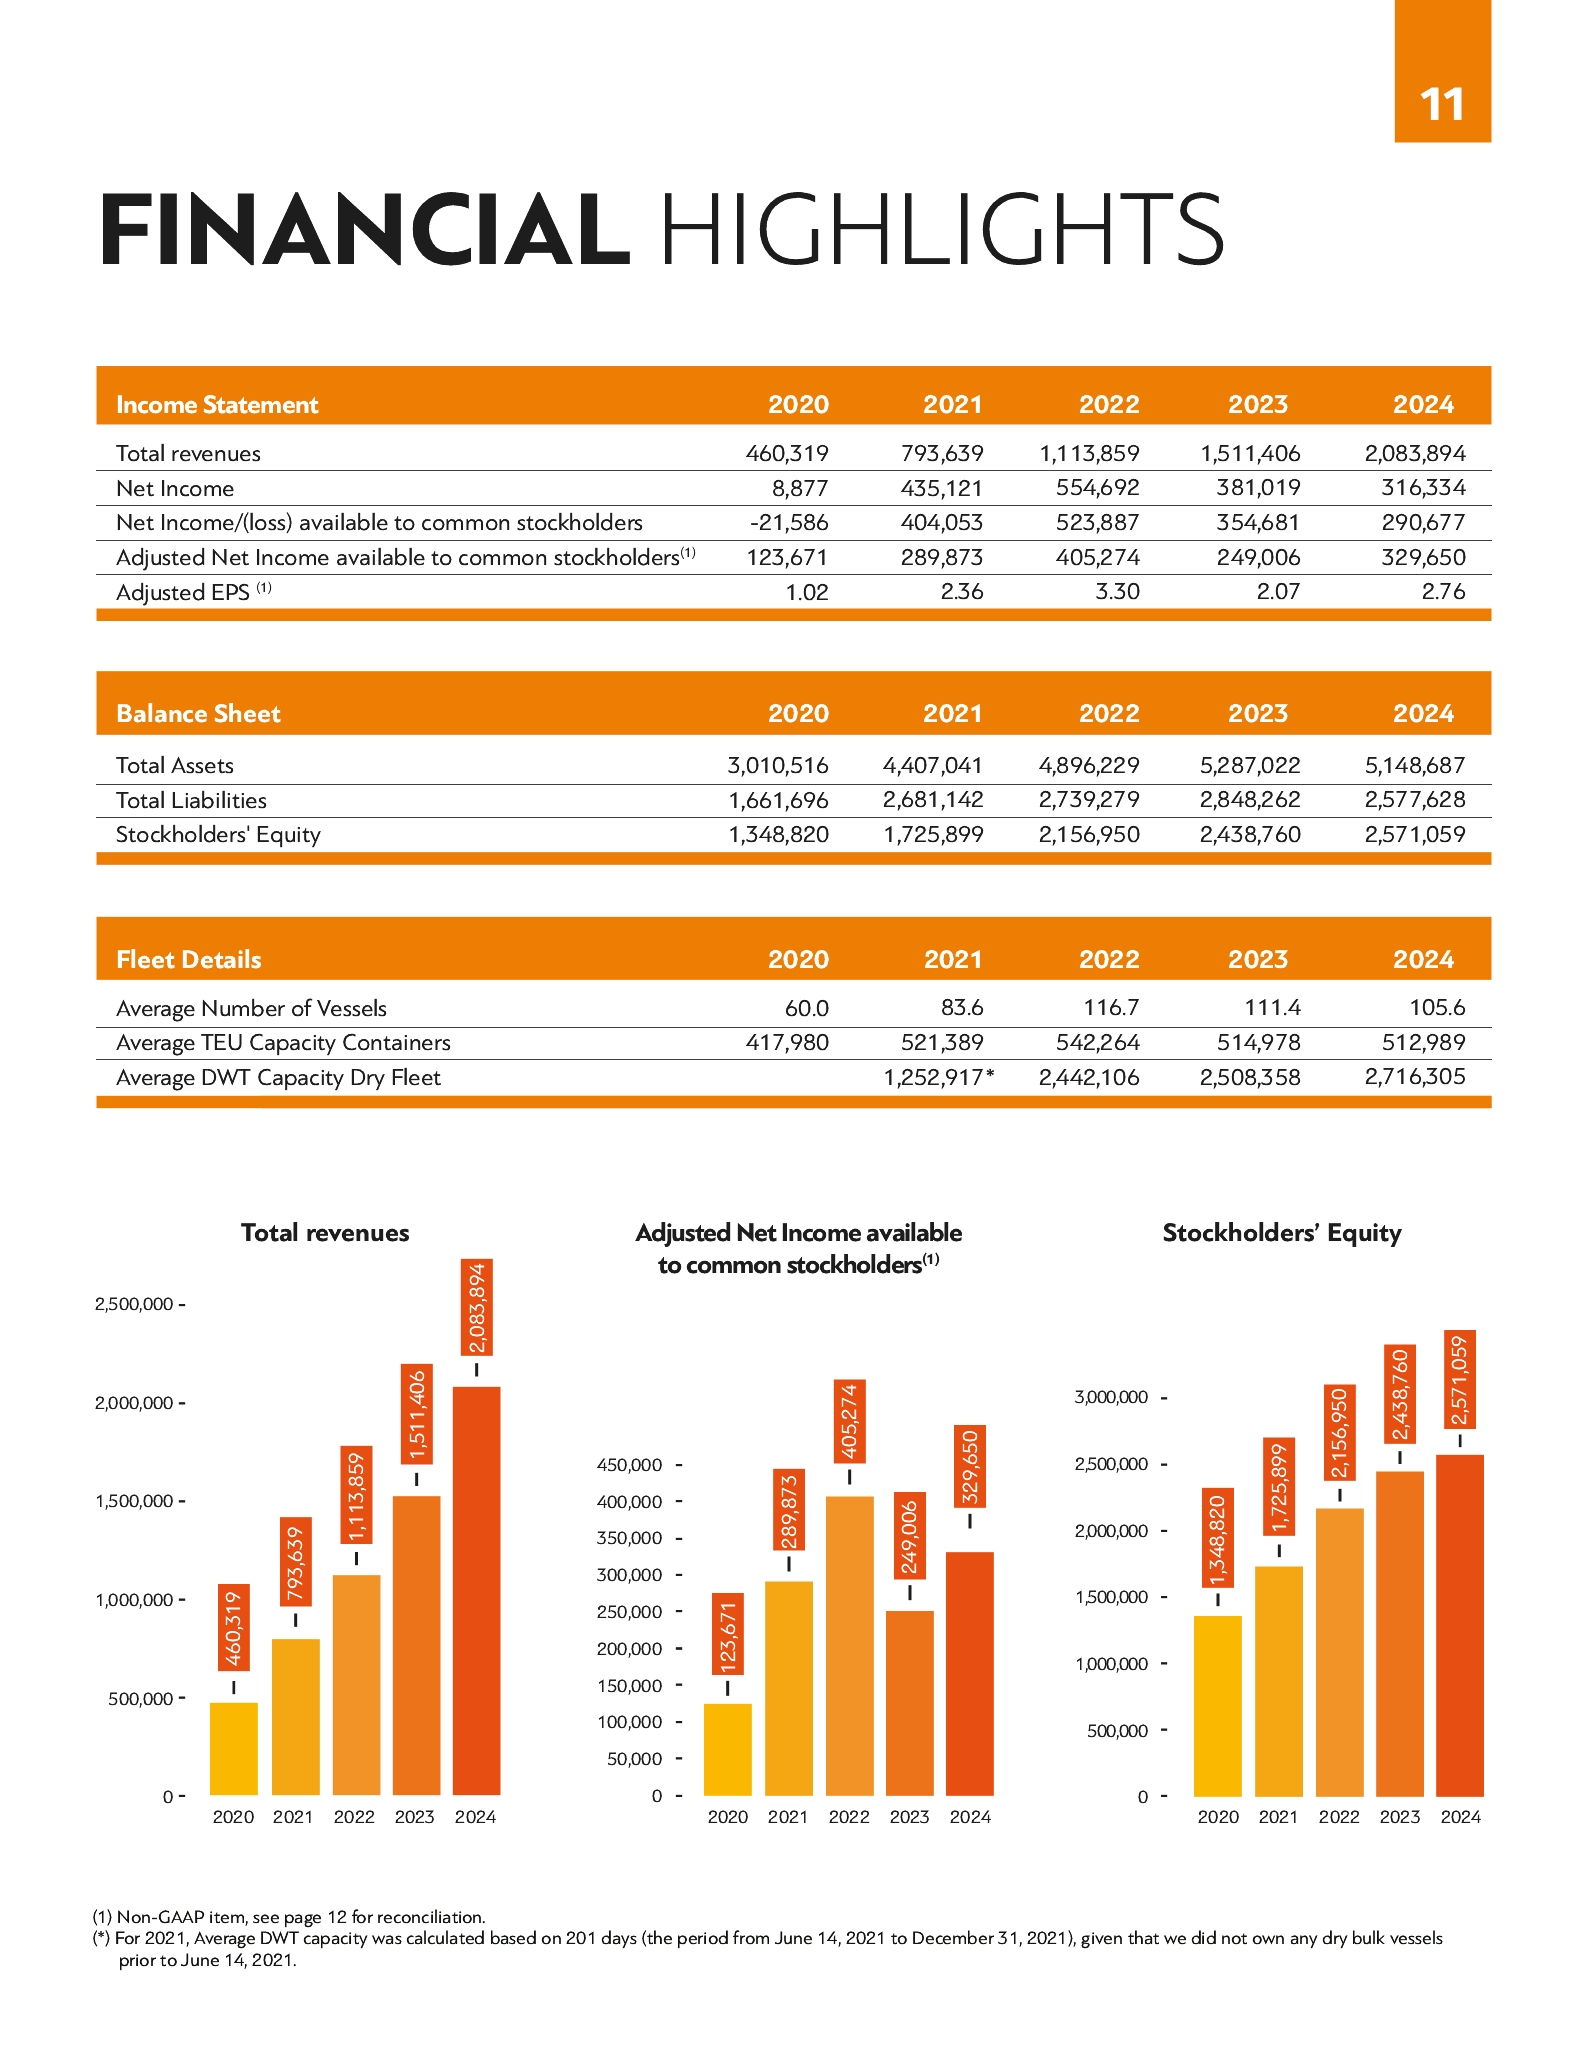
Total revenues | 460,319 | 793,639 | 1,113,859 | 1,511,406 | 2,083,894 | ||||||||||
Voyage expenses | 7,372 | 13,311 | 49,069 | 275,856 | 371,058 | ||||||||||
Charter-in hire expenses | — | — | — | 340,926 | 706,569 | ||||||||||
Voyage expenses-related parties | 6,516 | 11,089 | 15,418 | 13,993 | 21,566 | ||||||||||
Vessels’ operating expenses | 117,054 | 179,981 | 269,231 | 258,088 | 240,207 | ||||||||||
General and administrative expenses | 7,360 | 9,405 | 12,440 | 18,366 | 25,040 | ||||||||||
General and administrative expenses-non-cash component | 3,655 | 7,414 | 7,089 | 5,850 | 8,427 | ||||||||||
Management and agency fees-related parties | 21,616 | 29,621 | 46,735 | 56,254 | 59,281 | ||||||||||
Amortization of dry-docking and special survey costs | 9,056 | 10,433 | 13,486 | 19,782 | 23,627 | ||||||||||
Depreciation | 108,700 | 136,958 | 165,998 | 166,340 | 164,206 | ||||||||||
(Gain) / loss on sale of vessels, net | 79,120 | (45,894) | (126,336) | (112,220) | (3,788) | ||||||||||
Loss on vessel held for sale | 7,665 | — | — | 2,305 | — | ||||||||||
Vessels’ impairment loss | 31,577 | — | 1,691 | 434 | — | ||||||||||
Foreign exchange (gains) / losses, net | 300 | (29) | (3,208) | (2,576) | 5,440 | ||||||||||
Operating income | $60,328 | $441,350 | $662,246 | $468,008 | $462,261 | ||||||||||
Year Ended December 31, | |||||||||||||||
2020 | 2021 | 2022 | 2023 | 2024 | |||||||||||
(Expressed in thousands of U.S. dollars, except for share and per share data) | |||||||||||||||
Interest income | $1,827 | $1,587 | $5,956 | $32,447 | $33,185 | ||||||||||
Interest and finance costs | (68,702) | (86,047) | (122,233) | (144,429) | (133,123) | ||||||||||
Swaps breakage cost | (6) | — | — | — | — | ||||||||||
Equity gain on investments | 16,195 | 12,859 | 2,296 | 764 | 12 | ||||||||||
Gain on sale of equity securities | — | 60,161 | — | — | — | ||||||||||
Dividend income from investment in equity securities | — | 1,833 | — | — | — | ||||||||||
Other, net | 1,181 | 4,624 | 3,729 | 6,941 | 2,873 | ||||||||||
Gain / (loss) on derivative instruments, net | (1,946) | (1,246) | 2,698 | 17,288 | (48,874) | ||||||||||
Total other expenses, net | $(51,451) | $(6,229) | $(107,554) | $(86,989) | $(145,927) | ||||||||||
Net Income | $8,877 | $435,121 | $554,692 | $381,019 | $316,334 | ||||||||||
Earnings allocated to Preferred Stock | $(31,082) | $(31,068) | $(31,068) | $(31,068) | $(23,796) | ||||||||||
Deemed dividend in redemption of Series E Preferred Stock | — | — | — | — | (5,446) | ||||||||||
Gain on retirement of Preferred Stock | 619 | — | — | — | — | ||||||||||
Net loss attributable to the non-controlling interest | — | — | 263 | 4,730 | 3,585 | ||||||||||
Net income / (loss) available to Common Stockholders | $(21,586) | $404,053 | $523,887 | $354,681 | $290,677 | ||||||||||
Earnings / (loss) per common share, basic and diluted | $(0.18) | $3.28 | $4.26 | $2.95 | $2.44 | ||||||||||
Weighted average number of shares, basic and diluted | 120,696,130 | 123,070,730 | 122,964,358 | 120,299,172 | 119,299,405 | ||||||||||
OTHER FINANCIAL DATA | |||||||||||||||
Net cash provided by operating activities | $274,284 | $466,494 | $581,593 | $331,368 | $537,716 | ||||||||||
Net cash provided by / (used in) investing activities | (36,397) | (787,456) | 42,488 | 79,093 | (79,507) | ||||||||||
Net cash provided by / (used in) financing activities | (241,862) | 482,594 | (166,051) | (396,815) | (505,477) | ||||||||||
Net increase / (decrease) in cash, cash equivalents and restricted cash | (3,975) | 161,632 | 458,030 | 13,646 | (47,268) | ||||||||||
Dividends paid | (65,470) | (71,263) | (119,548) | (71,867) | (74,147) | ||||||||||
BALANCE SHEET DATA (at year end) | |||||||||||||||
Total current assets | $192,050 | $426,124 | $1,014,622 | $1,117,661 | $1,040,216 | ||||||||||
Total assets | 3,010,516 | 4,407,041 | 4,896,229 | 5,287,022 | 5,148,687 | ||||||||||
Total current liabilities | 206,974 | 370,027 | 423,090 | 662,770 | 745,560 | ||||||||||
Total long-term debt and finance lease liability, including current portion | 1,465,619 | 2,467,321 | 2,607,534 | 2,391,644 | 2,072,364 | ||||||||||
Temporary equity – Redeemable non-controlling interest in subsidiary | — | — | 3,487 | 629 | (2,453) | ||||||||||
Common stock | 12 | 12 | 12 | 13 | 13 | ||||||||||
Total stockholders’ equity/net assets | 1,348,820 | 1,725,899 | 2,156,950 | 2,438,760 | 2,571,059 | ||||||||||
FLEET DATA | |||||||||||||||
Number of vessels | 60.0 | 83.6 | 116.7 | 111.4 | 105.6 | ||||||||||
TEU capacity (of our containerships) | 417,980 | 521,389 | 542,264 | 514,978 | 512,989 | ||||||||||
DWT capacity (of our dry bulk vessels)* | — | 1,252,917 | 2,442,106 | 2,508,358 | 2,716,305 | ||||||||||
* | Average dwt capacity for the year ended December 31, 2021 was calculated based on 201 days (the period from June 14, 2021 to December 31, 2021), given that we did not own any dry bulk vessels prior to June 14, 2021. |
Year ended December 31, | Change | Percentage Change | ||||||||||
(Expressed in millions of U.S. dollars, except percentages) | 2023 | 2024 | ||||||||||
Voyage revenue | $1,502.5 | $1,849.9 | $347.4 | 23.1% | ||||||||
Voyage revenue – related parties | — | 210.1 | 210.1 | n.m. | ||||||||
Total voyage revenue | 1,502.5 | 2,060.0 | 557.5 | 37.1% | ||||||||
Income from investments in leaseback vessels | 8.9 | 23.9 | 15.0 | 168.5% | ||||||||
Voyage expenses | (275.9) | (371.1) | 95.2 | 34.5% | ||||||||
Charter-in hire expenses | (340.9) | (706.6) | 365.7 | 107.3% | ||||||||
Voyage expenses – related parties | (14.0) | (21.6) | 7.6 | 54.3% | ||||||||
Vessels’ operating expenses | (258.1) | (240.2) | (17.9) | (6.9%) | ||||||||
General and administrative expenses | (18.4) | (25.0) | 6.6 | 35.9% | ||||||||
Management and agency fees – related parties | (56.3) | (59.3) | 3.0 | 5.3% | ||||||||
General and administrative expenses – non-cash component | (5.8) | (8.4) | 2.6 | 44.8% | ||||||||
Amortization of dry-docking and special survey costs | (19.8) | (23.6) | 3.8 | 19.2% | ||||||||
Depreciation | (166.3) | (164.2) | (2.1) | (1.3%) | ||||||||
Gain on sale of vessels, net | 112.2 | 3.8 | (108.4) | (96.6%) | ||||||||
Loss on vessels held for sale | (2.3) | — | (2.3) | n.m. | ||||||||
Vessels’ impairment loss | (0.4) | — | (0.4) | n.m. | ||||||||
Foreign exchange gains / (losses) | 2.6 | (5.4) | (8.0) | n.m. | ||||||||
Interest income | 32.4 | 33.2 | 0.8 | 2.5% | ||||||||
Interest and finance costs | (144.4) | (133.1) | (11.3) | (7.8%) | ||||||||
Income from equity method investments | 0.8 | — | (0.8) | n.m. | ||||||||
Other | 6.9 | 2.8 | (4.1) | (59.4%) | ||||||||
Gain / (Loss) on derivative instruments, net | 17.3 | (48.9) | (66.2) | n.m. | ||||||||
Net Income | $381.0 | $316.3 | ||||||||||
Vessels’ operational data | Year ended December 31, | Change | Percentage Change | |||||||||
2023 | 2024 | |||||||||||
Average number of vessels | 111.4 | 105.6 | (5.8) | (5.2%) | ||||||||
Ownership days | 40,652 | 38,661 | (1,991) | (4.9%) | ||||||||
Number of vessels under dry-docking and special survey | 25 | 12 | (13) | |||||||||
For the year ended December 31, 2024 | ||||||||||||
(Expressed in millions of U.S. dollars) | Container vessels segment | Dry bulk vessels segment | CBI | NML | ||||||||
Voyage revenue | $864.6 | $175.6 | $809.7 | $— | ||||||||
Intersegment voyage revenue | — | 22.1 | — | — | ||||||||
Voyage revenue – related parties | — | — | 210.1 | — | ||||||||
Income from investment in leaseback vessels | — | — | — | 23.9 | ||||||||
Total revenues | $864.6 | $197.7 | $1,019.8 | $23.9 | ||||||||
Less(1): | ||||||||||||
Voyage expenses | (25.8) | (21.0) | (325.3) | — | ||||||||
Charter – in hire expenses | — | — | (727.6) | — | ||||||||
Voyage expenses – related parties | (12.2) | (2.4) | (7.0) | — | ||||||||
Vessels’ operating expenses | (158.2) | (82.0) | — | — | ||||||||
Realized losses on FFAs and bunker swaps, net | — | — | (15.6) | — | ||||||||
Interest and finance costs | (99.5) | (22.7) | (1.9) | (10.1) | ||||||||
Other segment items(2) | (144.1) | (43.7) | — | — | ||||||||
Segment profit / (loss) | $424.8 | $25.9 | $(57.6) | $13.8 | ||||||||
(1) | The significant expense categories and amounts align with the segment-level information that is regularly provided to the CODM. Intersegment expenses are included within the amounts shown. |
(2) | Other segment items for each reportable segment include: (i) Container vessels segment—depreciation expense of the vessels and amortization of dry-docking and special survey costs and (ii) Dry bulk vessels segment—depreciation expense of the vessels and amortization of dry-docking and special survey costs. |
For the year ended December 31, 2023 | ||||||||||||
(Expressed in millions of U.S. dollars) | Container vessels segment | Dry bulk vessels segment | CBI | NML | ||||||||
Voyage revenue | $839.4 | $155.9 | $507.2 | $— | ||||||||
Intersegment voyage revenue | — | 11.9 | — | — | ||||||||
Income from investment in leaseback vessels | — | — | — | 8.9 | ||||||||
Total revenues | $839.4 | $167.8 | $507.2 | $8.9 | ||||||||
For the year ended December 31, 2023 | ||||||||||||
(Expressed in millions of U.S. dollars) | Container vessels segment | Dry bulk vessels segment | CBI | NML | ||||||||
Less (1): | ||||||||||||
Voyage expenses | (12.5) | (32.2) | (231.6) | — | ||||||||
Charter-in hire expenses | — | — | (352.4) | — | ||||||||
Voyage expenses-related parties | (11.9) | (2.1) | — | — | ||||||||
Vessels’ operating expenses | (161.2) | (96.9) | — | — | ||||||||
Realized losses on FFAs and bunker swaps, net | — | — | (4.7) | — | ||||||||
Interest and finance costs | (117.0) | (23.9) | (1.2) | (2.2) | ||||||||
Other segment items(2) | (142.1) | (44.1) | — | — | ||||||||
Segment profit/ (loss) | $394.7 | $(31.4) | $(82.7) | $6.7 | ||||||||
(1) | The significant expense categories and amounts align with the segment-level information that is regularly provided to the CODM. Intersegment expenses are included within the amounts shown. |
(2) | Other segment items for each reportable segment include: (i) Container vessels segment—depreciation expense of the vessels and amortization of dry-docking and special survey costs and (ii) Dry bulk vessels segment—depreciation expense of the vessels and amortization of dry-docking and special survey costs. |
Year ended December 31, | Change | Percentage Change | ||||||||||
(Expressed in millions of U.S. dollars, except percentages) | 2023 | 2024 | ||||||||||
Total voyage revenue | $1,502.5 | $2,060.0 | $557.5 | 37.1% | ||||||||
Accrued charter revenue(1) | 3.3 | (6.8) | (10.1) | n.m. | ||||||||
Amortization of time-charter assumed | (0.2) | (0.6) | (0.4) | n.m. | ||||||||
Total voyage revenue adjusted on a cash basis(2) | $1,505.6 | $2,052.6 | $547.0 | 36.3% | ||||||||
(1) | Total voyage revenue adjusted on a cash basis represents Total voyage revenue after adjusting for non-cash “Accrued charter revenue” recorded under charters with escalating charter rates. |
(2) | Total voyage revenue adjusted on a cash basis is not a recognized measurement under U.S. GAAP. We believe that the presentation of Total voyage revenue adjusted on a cash basis is useful to investors because it presents the charter revenue for the relevant period based on the then-current daily charter rates. The increases or decreases in daily charter rates under our charter party agreements are described in the notes to the table in “Item 4. Information On the Company—Business Overview—Our Fleet, Acquisitions and Vessels Under Construction”. |
Year ended December 31, | ||||||
2023 | 2024 | |||||
(Expressed in millions of U.S. dollars) | ||||||
Condensed cash flows | ||||||
Net Cash Provided by Operating Activities | $331.4 | $537.7 | ||||
Net Cash Provided by / (Used in) Investing Activities | $79.1 | $(79.5) | ||||
Net Cash Used in Financing Activities | $(396.8) | $(505.5) | ||||
Borrowers under Our Credit Facilities, Finance Leases and Other Financing Arrangements | Outstanding Principal Amount | Interest Rate(1) | Maturity | Repayment profile | ||||||||
(Expressed in thousands of U.S. dollars) | ||||||||||||
Bank Debt | ||||||||||||
Quentin Shipping Co. and Sander Shipping Co. | 64,250 | SOFR + Margin(2) | 2030 | Straight-line amortization with balloon | ||||||||
Reddick Shipping Co. and Verandi Shipping Co. | 21,000 | SOFR + Margin(2) | 2027 | Straight-line amortization | ||||||||
Ainsley Maritime Co. and Ambrose Maritime Co. | 109,821 | SOFR + Margin(2) | 2031 | Straight-line amortization with balloon | ||||||||
Hyde Maritime Co. and Skerrett Maritime Co. | 104,596 | Fixed Rate / SOFR + Margin(2) | 2029 | Straight-line amortization with balloon | ||||||||
Kemp Maritime Co. | 52,825 | SOFR + Margin(2) | 2029 | Straight-line amortization with balloon | ||||||||
Achilleas Maritime Corp. et al. | 33,492 | SOFR + Margin(2) | 2026-2027 | Variable amortization with balloon | ||||||||
Costamare Inc. | 27,750 | SOFR + Margin(2) | 2026 | Straight-line amortization with balloon | ||||||||
Bastian et al. | 199,390 | SOFR + Margin(2) | 2029 | Variable amortization with balloon | ||||||||
Benedict et al. | 294,762 | SOFR + Margin(2) | 2027 | Straight-line amortization with balloon | ||||||||
Kalamata Shipping Corporation et al. | 54,000 | SOFR + Margin(2) | 2029 | Straight-line amortization with balloon | ||||||||
Capetanissa Maritime Corp. et al. | 18,917 | SOFR + Margin(2) | 2028 | Straight-line amortization with balloon | ||||||||
Adstone Marine Corp. et al. | 147,709 | SOFR + Margin(2) | 2029 | Straight-line amortization with balloon | ||||||||
Archet Marine Corp. et al. | 72,000 | SOFR + Margin(2) | 2030 | Variable amortization with balloon | ||||||||
Andati Marine Corp. et al. | 84,931 | SOFR + Margin(2) | 2029 | Straight-line amortization with balloon | ||||||||
Silkstone Marine Corp. et al. | 34,611 | SOFR + Margin(2) | 2029 | Straight-line amortization with balloon | ||||||||
NML Loan 2 | 23,250 | SOFR + Margin(2) | 2028 | Straight-line amortization with balloon | ||||||||
NML Loan 3 | 8,190 | SOFR + Margin(2) | 2028 | Straight-line amortization with balloon | ||||||||
NML Loan 4 | 11,628 | SOFR + Margin(2) | 2028 | Straight-line amortization with balloon | ||||||||
NML Loan 5 | 4,942 | SOFR + Margin(2) | 2028 | Straight-line amortization with balloon | ||||||||
NML Loan 6 | 5,510 | SOFR + Margin(2) | 2028 | Straight-line amortization with balloon | ||||||||
NML Loan 7 | 9,581 | SOFR + Margin(2) | 2029 | Variable amortization with balloon | ||||||||
NML Loan 8 | 11,196 | SOFR + Margin(2) | 2028 | Straight-line amortization with balloon | ||||||||
NML Loan 9 | 10,900 | SOFR + Margin(2) | 2028 | Variable amortization with balloon | ||||||||
Borrowers under Our Credit Facilities, Finance Leases and Other Financing Arrangements | Outstanding Principal Amount | Interest Rate(1) | Maturity | Repayment profile | ||||||||
(Expressed in thousands of U.S. dollars) | ||||||||||||
NML Loan 10 | 21,392 | SOFR + Margin(2) | 2028 | Variable amortization with balloon | ||||||||
NML Loan 11 | 16,485 | SOFR + Margin(2) | 2028 | Variable amortization with balloon | ||||||||
NML Loan 12 | 5,910 | SOFR + Margin(2) | 2029 | Straight-line amortization with balloon | ||||||||
NML Loan 13 | 5,302 | SOFR + Margin(2) | 2028 | Straight-line amortization with balloon | ||||||||
NML Loan 14 | 4,385 | SOFR + Margin(2) | 2028 | Straight-line amortization with balloon | ||||||||
NML Loan 15 | 5,130 | SOFR + Margin(2) | 2029 | Straight-line amortization with balloon | ||||||||
Other Financing Arrangements | ||||||||||||
Barkley et al. Financing arrangements | 339,396 | Fixed Rate | 2030-2031 | Bareboat structure-fixed daily charter with balloon | ||||||||
Bertrand et al. Financing arrangements | 245,236 | Fixed Rate | 2028 | Variable amortization with balloon | ||||||||
Finance Leases | ||||||||||||
Sykes Maritime Co. Finance Lease | 23,955 | Fixed Rate | 2025 | Bareboat structure-fixed daily charter with balloon | ||||||||
(1) | The interest rates of long-term bank debt at December 31, 2024 ranged from 2.99% to 6.63%, and the weighted average interest rate as at December 31, 2024 was 4.9%. Such calculations have accounted for fixed rate long-term bank debt and interest rate swaps/caps. |
(2) | The interest rate margin of long-term bank debt at December 31, 2024 ranged from 1.45% to 3.90%, and the weighted average interest rate margin as at December 31, 2024 was 2.2%. |
• | pay dividends if an event of default has occurred and is continuing or would occur as a result of the payment of such dividends; |
• | purchase or otherwise acquire for value any shares of the subsidiaries’ capital; |
• | make loans or assume financial obligations which are not subordinated to the respective credit facilities; |
• | make investments in other persons; |
• | sell or transfer significant assets, including any vessel or vessels mortgaged under the credit facilities, to any person other than as per the provisions of the respective credit facilities; |
• | create liens on assets; or |
• | allow the Konstantakopoulos family’s direct or indirect holding in Costamare Inc. to fall below 30% of the total issued share capital. |
• | the ratio of our total liabilities (after deducting all cash and cash equivalents) to market value adjusted total assets (after deducting all cash and cash equivalents) may not exceed 0.75:1; |
• | the ratio of EBITDA over net interest expense must be equal to or higher than 2.5:1, however such covenant should not be considered breached unless the Company’s liquidity is less than 5% of the total debt; |
• | the aggregate amount of all cash and cash equivalents may not be less than the greater of (i) $30 million or (ii) 3% of the total debt; and |
• | the market value adjusted net worth must at all times exceed $500 million. |
C. | Research and Development, Patents and Licenses, etc. |
D. | Trend Information |
E. | Critical Accounting Estimates |
December 31, 2023 | December 31, 2024 | |||||||||||
No. of Container Vessels(*) | Amount ($ US Million)(**) | No. of Container Vessels(*) | Amount ($ US Million)(**) | |||||||||
5-year historical average rate | — | — | — | — | ||||||||
3-year historical average rate | — | — | — | — | ||||||||
1-year historical average rate | — | — | — | — | ||||||||
(*) | Number of container vessels the carrying value of which would not have been recovered. |
(**) | Aggregate carrying value that would not have been recovered. |
December 31, 2023 | December 31, 2024 | |||||||||||
No. of Dry bulk Vessels(*) | Amount ($ US Million)(**) | No. of Container Vessels(*) | Amount ($ US Million)(**) | |||||||||
5-year historical average rate | — | — | — | — | ||||||||
3-year historical average rate | — | — | — | — | ||||||||
1-year historical average rate | 2 | 0.8 | — | — | ||||||||
(*) | Number of dry bulk vessels the carrying value of which would not have been recovered. |
(**) | Aggregate carrying value that would not have been recovered. |
Vessel | Capacity (TEU) | Built | Acquisition Date | Carrying Value December 31, 2023 ($ US Million)(1) | Carrying Value December 31, 2024 ($ US Million)(1) | |||||||||||||
1 | Triton | 14,424 | 2016 | November 2018 | 100.7 | 96.6 | ||||||||||||
2 | Titan | 14,424 | 2016 | November 2018 | 101.3 | 97.2 | ||||||||||||
3 | Talos | 14,424 | 2016 | November 2018 | 101.6 | 97.5 | ||||||||||||
4 | Taurus | 14,424 | 2016 | November 2018 | 101.9 | 97.7 | ||||||||||||
5 | Theseus | 14,424 | 2016 | November 2018 | 102.3 | 98.1 | ||||||||||||
6 | YM Triumph | 12,690 | 2020 | July 2020 | 84.9 | 82.1 | ||||||||||||
7 | YM Truth | 12,690 | 2020 | August 2020 | 84.9 | 82.1 | ||||||||||||
8 | YM Totality | 12,690 | 2020 | September 2020 | 85.5 | 82.7 | ||||||||||||
9 | YM Target | 12,690 | 2021 | February 2021 | 86.4 | 83.6 | ||||||||||||
10 | YM Tiptop | 12,690 | 2021 | May 2021 | 87.6 | 84.9 | ||||||||||||
11 | Cape Akritas | 11,010 | 2016 | March 2021 | 73.7 | 70.7 | ||||||||||||
12 | Cape Tainaro | 11,010 | 2017 | March 2021 | 75.3 | 72.0 | ||||||||||||
13 | Cape Kortia | 11,010 | 2017 | March 2021 | 75.6 | 72.1 | ||||||||||||
14 | Cape Sounio | 11,010 | 2017 | March 2021 | 74.6 | 71.5 | ||||||||||||
15 | Cape Artemisio | 11,010 | 2017 | March 2021 | 73.5 | 70.4 | ||||||||||||
16 | Cosco Hellas | 9,469 | 2006 | July 2006 | 48.2 | 45.0 | ||||||||||||
17 | Zim Shanghai (ex. Cosco Guangzhou) | 9,469 | 2006 | February 2006 | 46.8 | 43.6 | ||||||||||||
18 | Beijing | 9,469 | 2006 | June 2006 | 47.6 | 44.5 | ||||||||||||
19 | Yantian | 9,469 | 2006 | April 2006 | 47.4 | 44.3 | ||||||||||||
20 | Yantian I (ex. Zim Yantian) | 9,469 | 2006 | March 2006 | 46.9 | 43.8 | ||||||||||||
21 | MSC Azov** | 9,403 | 2014 | January 2014 | 77.2 | 73.6 | ||||||||||||
22 | MSC Ajaccio** | 9,403 | 2014 | March 2014 | 74.8 | 74.5 | ||||||||||||
23 | MSC Amalfi | 9,403 | 2014 | April 2014 | 75.3 | 75.4 | ||||||||||||
24 | MSC Athens** | 8,827 | 2013 | March 2013 | 74.8 | 70.9 | ||||||||||||
25 | MSC Athos** | 8,827 | 2013 | April 2013 | 74.2 | 70.3 | ||||||||||||
26 | Valor | 8,827 | 2013 | June 2013 | 68.4 | 65.2 | ||||||||||||
27 | Value | 8,827 | 2013 | June 2013 | 68.5 | 65.3 | ||||||||||||
28 | Valiant | 8,827 | 2013 | August 2013 | 69.2 | 65.9 | ||||||||||||
29 | Valence | 8,827 | 2013 | September 2013 | 69.7 | 66.4 | ||||||||||||
30 | Vantage | 8,827 | 2013 | November 2013 | 69.7 | 66.5 | ||||||||||||
31 | Navarino*,** | 8,531 | 2010 | May 2010 | 72.7 | 68.8 | ||||||||||||
32 | Maersk Kleven | 8,044 | 1996 | September 2018 | 14.4 | 13.4 | ||||||||||||
33 | Maersk Kotka | 8,044 | 1996 | September 2018 | 13.8 | 12.9 | ||||||||||||
34 | Maersk Kowloon | 7,471 | 2005 | May 2017 | 13.6 | 12.9 | ||||||||||||
35 | Kure | 7,403 | 1996 | December 2007 | 13.4 | 12.7 | ||||||||||||
36 | Methoni | 6,724 | 2003 | October 2011 | 31.5 | 31.4 | ||||||||||||
37 | Porto Cheli | 6,712 | 2001 | June 2021 | 30.8 | 27.9 | ||||||||||||
38 | Tampa I (ex. Zim Tampa) | 6,648 | 2000 | June 2000 | 19.8 | 17.8 | ||||||||||||
39 | Zim America (ex. Maersk Kingston) | 6,644 | 2003 | April 2003 | 27.6 | 25.8 | ||||||||||||
40 | Zim Vietnam (ex. Maersk Kolkata) | 6,644 | 2003 | January 2003 | 28.0 | 25.1 | ||||||||||||
41 | Aries | 6,492 | 2004 | February 2021 | 11.8 | 11.2 | ||||||||||||
42 | Argus | 6,492 | 2004 | March 2021 | 11.5 | 11.0 | ||||||||||||
43 | Porto Germeno** | 5,908 | 2002 | June 2021 | 30.2 | 27.0 | ||||||||||||
Vessel | Capacity (TEU) | Built | Acquisition Date | Carrying Value December 31, 2023 ($ US Million)(1) | Carrying Value December 31, 2024 ($ US Million)(1) | |||||||||||||
44 | Glen Canyon | 5,642 | 2006 | March 2021 | 11.8 | 11.5 | ||||||||||||
45 | Porto Kagio** | 5,570 | 2002 | June 2021 | 30.7 | 27.5 | ||||||||||||
46 | Leonidio | 4,957 | 2014 | May 2017 | 16.7 | 18.7 | ||||||||||||
47 | Kyparissia | 4,957 | 2014 | May 2017 | 16.7 | 18.4 | ||||||||||||
48 | Megalopolis | 4,957 | 2013 | July 2018 | 21.8 | 21.0 | ||||||||||||
49 | Marathopolis | 4,957 | 2013 | July 2018 | 22.5 | 21.7 | ||||||||||||
50 | Gialova** | 4,578 | 2009 | August 2021 | 18.4 | 18.8 | ||||||||||||
51 | Dyros** | 4,578 | 2008 | January 2022 | 18.3 | 17.5 | ||||||||||||
52 | Norfolk ** | 4,259 | 2009 | May 2021 | 24.4 | 24.6 | ||||||||||||
53 | Vulpecula | 4,258 | 2010 | December 2019 | 21.7 | 10.7 | ||||||||||||
54 | Volans | 4,258 | 2010 | December 2019 | 10.1 | 9.9 | ||||||||||||
55 | Virgo | 4,258 | 2009 | January 2020 | 9.7 | 13.1 | ||||||||||||
56 | Vela | 4,258 | 2009 | December 2019 | 20.7 | 8.9 | ||||||||||||
57 | Androusa** | 4,256 | 2010 | April 2021 | 19.5 | 18.6 | ||||||||||||
58 | Neokastro | 4,178 | 2011 | December 2020 | 9.8 | 9.4 | ||||||||||||
59 | Ulsan | 4,132 | 2002 | February 2012 | 18.4 | 16.5 | ||||||||||||
60 | Polar Brasil** | 3,800 | 2018 | June 2023 | 39.2 | 37.8 | ||||||||||||
61 | Lakonia | 2,586 | 2004 | December 2014 | 6.7 | 8.5 | ||||||||||||
62 | Scorpius | 2,572 | 2007 | September 2020 | 6.0 | 5.5 | ||||||||||||
63 | Etoile | 2,556 | 2005 | November 2017 | 8.4 | 7.9 | ||||||||||||
64 | Areopolis | 2,474 | 2000 | May 2014 | 5.8 | 5.2 | ||||||||||||
65 | Arkadia | 1,550 | 2001 | December 2023 | 5.0 | 4.7 | ||||||||||||
66 | Michigan | 1,300 | 2008 | April 2018 | 7.1 | 6.6 | ||||||||||||
67 | Trader | 1,300 | 2008 | April 2018 | 7.0 | 6.4 | ||||||||||||
68 | Luebeck | 1,078 | 2001 | August 2012 | 3.9 | 3.5 | ||||||||||||
TOTAL | 2,967.9 | 2,825.2 | ||||||||||||||||
(1) | For impairment test calculation, Carrying Value includes the unamortized balance of dry-docking cost as at December 31, 2023 and 2024. |
* | Indicates container vessel which we believe, as of December 31, 2024, may have had fair value below its carrying value. As of December 31, 2024, we believe that the carrying value of this vessel was $3.3 million more than its market value. |
** | Indicates container vessels which we believe, as of December 31, 2023, may have had fair values below their carrying values. As of December 31, 2023, we believe that the aggregate carrying value of these 12 vessels was $39.1 million more than their market value. |
Vessel | Size (dwt) | Built | Acquisition Date | Carrying Value December 31, 2023 ($ US Million)(1) | Carrying Value December 31, 2024 ($ US Million)(1) | |||||||||||||
1 | Frontier* | 181,415 | 2012 | July 2024 | — | 34.2 | ||||||||||||
2 | Miracle | 180,643 | 2011 | February 2024 | — | 26.1 | ||||||||||||
3 | Prosper | 179,895 | 2012 | June 2024 | — | 29.7 | ||||||||||||
4 | Dorado | 179,842 | 2011 | August 2023 | 23.2 | 25.9 | ||||||||||||
5 | Magnes | 179,546 | 2011 | November 2024 | — | 30.2 | ||||||||||||
6 | Enna | 175,975 | 2011 | August 2023 | 21.9 | 24.9 | ||||||||||||
7 | Aeolian | 83,478 | 2012 | August 2021 | 20.5 | 18.8 | ||||||||||||
8 | Greneta | 82,166 | 2010 | December 2021 | 18.0 | 16.7 | ||||||||||||
9 | Hydrus | 81,601 | 2011 | December 2021 | 16.8 | 16.0 | ||||||||||||
10 | Phoenix | 81,569 | 2012 | December 2021 | 19.2 | 18.0 | ||||||||||||
11 | Builder*,** | 81,541 | 2012 | June 2021 | 20.8 | 19.5 | ||||||||||||
Vessel | Size (dwt) | Built | Acquisition Date | Carrying Value December 31, 2023 ($ US Million)(1) | Carrying Value December 31, 2024 ($ US Million)(1) | |||||||||||||
12 | Farmer*,** | 81,541 | 2012 | September 2021 | 20.9 | 19.6 | ||||||||||||
13 | Sauvan | 79,700 | 2010 | July 2021 | 14.5 | 13.6 | ||||||||||||
14 | Rose*,** | 76,619 | 2008 | October 2021 | 17.2 | 15.6 | ||||||||||||
15 | Merchia | 63,585 | 2015 | December 2021 | 21.4 | 20.5 | ||||||||||||
16 | Dawn | 63,561 | 2018 | July 2021 | 21.7 | 21.7 | ||||||||||||
17 | Seabird | 63,553 | 2016 | July 2021 | 19.9 | 18.8 | ||||||||||||
18 | Orion | 63,473 | 2015 | November 2021 | 21.4 | 20.4 | ||||||||||||
19 | Damon | 63,301 | 2012 | December 2021 | 20.9 | 19.5 | ||||||||||||
20 | Arya | 61,424 | 2013 | September 2023 | 19.7 | 19.9 | ||||||||||||
21 | Alwine | 61,090 | 2014 | November 2024 | — | 24.0 | ||||||||||||
22 | August | 61,090 | 2015 | December 2024 | — | 25.2 | ||||||||||||
23 | Titan I(2) | 58,090 | 2009 | November 2021 | 14.2 | — | ||||||||||||
24 | Athena | 58,018 | 2012 | September 2021 | 15.1 | 14.1 | ||||||||||||
25 | Eracle | 58,018 | 2012 | July 2021 | 15.3 | 14.2 | ||||||||||||
26 | Pythias*,** | 58,018 | 2010 | December 2021 | 15.4 | 14.3 | ||||||||||||
27 | Norma** | 58,018 | 2010 | March 2022 | 15.0 | 14.0 | ||||||||||||
28 | Oracle(2),** | 57,970 | 2009 | January 2022 | 15.1 | — | ||||||||||||
29 | Uruguay | 57,937 | 2011 | September 2021 | 16.1 | 15.1 | ||||||||||||
30 | Curacao | 57,937 | 2011 | October 2021 | 16.2 | 15.1 | ||||||||||||
31 | Serena** | 57,266 | 2010 | August 2021 | 13.7 | 12.8 | ||||||||||||
32 | Pegasus(2),** | 56,726 | 2011 | June 2021 | 14.0 | — | ||||||||||||
33 | Libra*,** | 56,701 | 2010 | January 2022 | 15.0 | 13.8 | ||||||||||||
34 | Merida(2),** | 56,670 | 2012 | August 2021 | 14.7 | — | ||||||||||||
31 | Clara | 56,557 | 2008 | August 2021 | 13.8 | 12.4 | ||||||||||||
35 | Bermondi | 55,469 | 2009 | October 2021 | 14.8 | 14.6 | ||||||||||||
36 | Verity | 37,163 | 2012 | July 2021 | 13.6 | 12.6 | ||||||||||||
37 | Parity | 37,152 | 2012 | September 2021 | 13.9 | 12.9 | ||||||||||||
38 | Acuity | 37,152 | 2011 | July 2021 | 12.5 | 11.6 | ||||||||||||
39 | Equity** | 37,071 | 2013 | October 2021 | 15.1 | 14.0 | ||||||||||||
40 | Discovery(2) | 37,019 | 2012 | July 2021 | 13.8 | — | ||||||||||||
41 | Bernis | 35,995 | 2011 | July 2021 | 11.8 | 11.1 | ||||||||||||
42 | Alliance(2) | 33,751 | 2012 | July 2021 | 10.2 | — | ||||||||||||
43 | Resource | 31,775 | 2010 | September 2021 | 10.3 | 9.6 | ||||||||||||
TOTAL | 627.6 | 691.0 | ||||||||||||||||
(1) | For impairment test calculation, Carrying Value includes the unamortized balance of dry-docking cost as at December 31, 2023 and 2024. |
(2) | Vessel sold in 2024. |
* | Indicates dry bulk vessels which we believe, as of December 31, 2024, may have had fair values below their carrying values. As of December 31, 2024, we believe that the aggregate carrying value of these six vessels was $8.0 million more than their aggregate market value. |
** | Indicates dry bulk vessels which we believe, as of December 31, 2023, may have had fair values below their carrying values. As of December 31, 2023, we believe that the aggregate carrying value of these nine vessels was $12.7 million more than their aggregate market value. |
DIRECTORS, SENIOR MANAGEMENT AND EMPLOYEES |
A. | Directors and Senior Management |
Name | Age | Position | ||||
Konstantinos Konstantakopoulos | 55 | Chief Executive Officer, Chairman of the Board and Class III Director | ||||
Gregory Zikos | 56 | Chief Financial Officer and Class II Director | ||||
Vagn Lehd Møller | 78 | Class II Director | ||||
Charlotte Stratos | 70 | Class III Director | ||||
Konstantinos Zacharatos | 52 | Class I Director | ||||
Anastassios Gabrielides | 60 | General Counsel and Secretary | ||||
B. | Compensation of Directors and Senior Management |
C. | Board Practices |
• | a Code of Business Conduct and Ethics for all officers and employees, which incorporates a Code of Ethics for directors and a Code of Conduct for corporate officers; |
• | a Corporate Governance, Nominating and Compensation Committee Charter; and |
• | an Audit Committee Charter. |
• | the appointment, compensation, retention and oversight of independent auditors and approving any non-audit services performed by such auditors; |
• | assisting the board in monitoring the integrity of our financial statements, the independent auditors’ qualifications and independence, the performance of the independent accountants and our internal audit function and our compliance with legal and regulatory requirements; |
• | annually reviewing an independent auditors’ report describing the auditing firm’s internal quality-control procedures, and any material issues raised by the most recent internal quality control review, or peer review, of the auditing firm; |
• | discussing the annual audited financial and quarterly statements with management and the independent auditors; |
• | discussing earnings press releases, as well as financial information and earnings guidance provided to analysts and rating agencies; |
• | discussing policies with respect to risk assessment and risk management; |
• | meeting separately, and periodically, with management, internal auditors and the independent auditors; |
• | reviewing with the independent auditors any audit problems or difficulties and management’s responses; |
• | setting clear hiring policies for employees or former employees of the independent auditors; |
• | annually reviewing the adequacy of the audit committee’s written charter, the scope of the annual internal audit plan and the results of internal audits; |
• | establishing procedures for the consideration of all related-party transactions, including matters involving potential conflicts of interest or potential usurpations of corporate opportunities; |
• | reporting regularly to the full board of directors; and |
• | handling such other matters that are specifically delegated to the audit committee by the board of directors from time to time. |
• | nominating candidates, consistent with criteria approved by the full board of directors, for the approval of the full board of directors to fill board vacancies as and when they arise, as well as putting in place plans for succession, in particular, of the chairman of the board of directors and executive officers; |
• | selecting, or recommending that the full board of directors select, the director nominees for the next annual meeting of stockholders; |
• | developing and recommending to the full board of directors corporate governance guidelines applicable to us and keeping such guidelines under review; |
• | overseeing the evaluation of the board and management; and |
• | handling such other matters that are specifically delegated to the corporate governance, nominating and compensation committee by the board of directors from time to time. |
D. | Employees |
E. | Share Ownership |
MAJOR SHAREHOLDERS AND RELATED PARTY TRANSACTIONS |
A. | Major Shareholders |
• | each person or entity that we know beneficially owns 5% or more of our common stock; |
• | each of our officers and directors; and |
• | all our directors and officers as a group. |
Shares of Common Stock Beneficially Held | ||||||
Number of Shares | Percentage | |||||
Identity of Person or Group | ||||||
Officers and Directors | ||||||
Konstantinos Konstantakopoulos(1) | 34,593,548 | 28.8% | ||||
Gregory Zikos | * | |||||
Konstantinos Zacharatos(2) | * | |||||
Vagn Lehd Møller | * | |||||
Charlotte Stratos | — | |||||
Anastassios Gabrielides(3) | — | |||||
All officers and directors as a group (six persons) | 34,764,473 | 29.0% | ||||
5% Beneficial Owners | ||||||
Achillefs Konstantakopoulos(4) | 22,567,737 | 18.8% | ||||
Christos Konstantakopoulos(5) | 19,051,588 | 15.9% | ||||
(1) | Konstantinos Konstantakopoulos, our chairman and chief executive officer, owns 13,973,469 shares of common stock directly and 20,620,079 shares of common stock indirectly through entities he controls. He also holds 12,800 shares of Series B Preferred Stock, 23,003 shares of Series C Preferred Stock and 50,000 shares of Series D Preferred Stock through an entity he controls, 0.6%, 0.6% and 1.3%, respectively, of the issued and outstanding shares of Series B Preferred Stock, Series C Preferred Stock and Series D Preferred Stock, respectively. He also held 5.7% of the issued and outstanding shares of Series E Preferred Stock as of July 15, 2024, when the Company completed the full redemption of all of its 4,574,100 outstanding shares of Series E Preferred Stock. |
(2) | Konstantinos Zacharatos holds less than 1% of our issued and outstanding Series B Preferred Stock, Series C Preferred Stock and Series D Preferred Stock. |
(3) | Anastassios Gabrielides, our General Counsel and Secretary, holds less than 1% of our issued and outstanding Series D Preferred Stock. |
(4) | Achillefs Konstantakopoulos, the brother of our chairman and chief executive officer, owns 18,407,585 shares of common stock directly and 3,380,152 shares of common stock indirectly through entities he controls and his immediate family owns 780,000 shares of common stock. He also holds 30,203 shares of Series B Preferred Stock, 80,390 shares of Series C Preferred Stock and 102,300 shares of Series D Preferred Stock through an entity he controls, or 1.5%, 2.0% and 2.6% of the issued and outstanding shares of Series B Preferred Stock, Series C Preferred Stock and Series D Preferred Stock, respectively. His immediate family also holds 31,350 shares of Series B Preferred Stock and 4,400 shares of Series C Preferred Stock, or 1.6% and 0.1% of the issued and outstanding shares of Series B Preferred Stock and Series C Preferred Stock, respectively. |
(5) | Christos Konstantakopoulos, the brother of our chairman and chief executive officer, owns 19,051,588 shares of common stock directly. |
* | Owns less than 1% of our issued and outstanding common stock. |
B. | Related Party Transactions |
• | any moneys payable by us under the applicable agreement have not been paid when due or if on demand within 20 business days of payment having been demanded; |
• | if we materially breach the agreement and we have failed to cure such breach within 20 business days after we are given written notice from Costamare Shipping or Costamare Services, as applicable; or |
• | there is a change of control of our Company or the vessel-owning subsidiaries, as applicable. |
• | any moneys payable by Costamare Shipping or Costamare Services under or pursuant to the applicable agreement are not paid or accounted for within 10 business days after receiving written notice from us; |
• | Costamare Shipping or Costamare Services, as applicable materially breaches the agreement and has failed to cure such breach within 20 business days after receiving written notice from us; |
• | there is a change of control of Costamare Shipping or Costamare Services, as applicable; or |
• | Costamare Shipping or Costamare Services, as applicable, is convicted of, enters a plea of guilty or nolo contendere with respect to, or enters into a plea bargain or settlement admitting guilt for a crime (including fraud), which conviction, plea bargain or settlement is demonstrably and materially injurious to Costamare, if such crime is not a misdemeanor and such crime has been committed solely and directly by an officer or director of Costamare Shipping or Costamare Services, as applicable, acting within the terms of its employment or office. |
• | the other party ceases to conduct business, or all or substantially all of the equity interests, properties or assets of the other party are sold, seized or appropriated which, in the case of seizure or appropriation, is not discharged within 20 business days; |
• | the other party files a petition under any bankruptcy law, makes an assignment for the benefit of its creditors, seeks relief under any law for the protection of debtors or adopts a plan of liquidation, or if a petition is filed against such party seeking to have it declared insolvent or bankrupt and such petition is not dismissed or stayed within 90 business days of its filing, or such party admits in writing its insolvency or its inability to pay its debts as they mature, or if an order is made for the appointment of a liquidator, manager, receiver or trustee of such party of all or a substantial part of its assets, or if an encumbrancer takes possession of or a receiver or trustee is appointed over the whole or any part of such party’s undertaking, property or assets or if an order is made or a resolution is passed for Costamare Shipping’s, Costamare Services’ or our winding up; |
• | the other party is prevented from performing any obligations under the applicable agreement by any cause whatsoever of any nature or kind beyond the reasonable control of such party respectively for a period of two consecutive months or more (“Force Majeure”); or |
• | in the case of the Framework Agreement, all supervision agreements and all ship-management agreements are terminated in accordance with their respective terms. |
(a) | The Neptune Manager may terminate the Neptune Management Agreement with immediate effect by notice if: |
(i) | any moneys payable by Neptune under the Neptune Management Agreement have not been received by the Neptune Manager within a certain time period from relevant request by the Neptune Manager; |
(ii) | the Manager is required by Neptune to take any action that contravenes applicable law or is unduly hazardous or improper or hazardous to any crew member of any vessel financed or other person; or |
(iii) | an insolvency event of Neptune occurs. |
(b) | Neptune may terminate the Neptune Management Agreement with immediate effect by notice if a material breach by the Neptune Manager occurs in the performance of its obligations under the said agreement and such breach (if curable) is not cured within a certain period. |
C. | Interests of Experts and Counsel |
FINANCIAL INFORMATION |
A. | Consolidated Statements and Other Financial Information |
Payment Date | Preferred Series B amount paid per share | Preferred Series C amount paid per share | Preferred Series D amount paid per share | Preferred Series E amount paid per share | ||||||||
October 15, 2013 | $0.365400 | — | — | — | ||||||||
January 15, 2014 | $0.476563 | — | — | — | ||||||||
April 15, 2014 | $0.476563 | $0.495833 | — | — | ||||||||
July 15, 2014 | $0.476563 | $0.531250 | — | — | ||||||||
October 15, 2014 | $0.476563 | $0.531250 | — | — | ||||||||
January 15, 2015 | $0.476563 | $0.531250 | — | — | ||||||||
April 15, 2015 | $0.476563 | $0.531250 | — | — | ||||||||
July 15, 2015 | $0.476563 | $0.531250 | $0.376736 | — | ||||||||
October 15, 2015 | $0.476563 | $0.531250 | $0.546875 | — | ||||||||
January 15, 2016 | $0.476563 | $0.531250 | $0.546875 | — | ||||||||
April 15, 2016 | $0.476563 | $0.531250 | $0.546875 | — | ||||||||
July 15, 2016 | $0.476563 | $0.531250 | $0.546875 | — | ||||||||
October 17, 2016 | $0.476563 | $0.531250 | $0.546875 | — | ||||||||
January 17, 2017 | $0.476563 | $0.531250 | $0.546875 | — | ||||||||
April 17, 2017 | $0.476563 | $0.531250 | $0.546875 | — | ||||||||
July 17, 2017 | $0.476563 | $0.531250 | $0.546875 | — | ||||||||
October 16, 2017 | $0.476563 | $0.531250 | $0.546875 | — | ||||||||
January 16, 2018 | $0.476563 | $0.531250 | $0.546875 | — | ||||||||
April 16, 2018 | $0.476563 | $0.531250 | $0.546875 | $0.462240 | ||||||||
July 16, 2018 | $0.476563 | $0.531250 | $0.546875 | $0.554688 | ||||||||
October 15, 2018 | $0.476563 | $0.531250 | $0.546875 | $0.554688 | ||||||||
January 15, 2019 | $0.476563 | $0.531250 | $0.546875 | $0.554688 | ||||||||
April 15, 2019 | $0.476563 | $0.531250 | $0.546875 | $0.554688 | ||||||||
July 15, 2019 | $0.476563 | $0.531250 | $0.546875 | $0.554688 | ||||||||
October 15, 2019 | $0.476563 | $0.531250 | $0.546875 | $0.554688 | ||||||||
January 15, 2020 | $0.476563 | $0.531250 | $0.546875 | $0.554688 | ||||||||
April 15, 2020 | $0.476563 | $0.531250 | $0.546875 | $0.554688 | ||||||||
July 15, 2020 | $0.476563 | $0.531250 | $0.546875 | $0.554688 | ||||||||
October 15, 2020 | $0.476563 | $0.531250 | $0.546875 | $0.554688 | ||||||||
January 15, 2021 | $0.476563 | $0.531250 | $0.546875 | $0.554688 | ||||||||
April 15, 2021 | $0.476563 | $0.531250 | $0.546875 | $0.554688 | ||||||||
July 15, 2021 | $0.476563 | $0.531250 | $0.546875 | $0.554688 | ||||||||
October 15, 2021 | $0.476563 | $0.531250 | $0.546875 | $0.554688 | ||||||||
January 18, 2022 | $0.476563 | $0.531250 | $0.546875 | $0.554688 | ||||||||
April 18, 2022 | $0.476563 | $0.531250 | $0.546875 | $0.554688 | ||||||||
July 15, 2022 | $0.476563 | $0.531250 | $0.546875 | $0.554688 | ||||||||
October 17, 2022 | $0.476563 | $0.531250 | $0.546875 | $0.554688 | ||||||||
January 17, 2023 | $0.476563 | $0.531250 | $0.546875 | $0.554688 | ||||||||
April 17, 2023 | $0.476563 | $0.531250 | $0.546875 | $0.554688 | ||||||||
July 17, 2023 | $0.476563 | $0.531250 | $0.546875 | $0.554688 | ||||||||
October 16, 2023 | $0.476563 | $0.531250 | $0.546875 | $0.554688 | ||||||||
January 16, 2024 | $0.476563 | $0.531250 | $0.546875 | $0.554688 | ||||||||
April 15, 2024 | $0.476563 | $0.531250 | $0.546875 | $0.554688 | ||||||||
July 15, 2024 | $0.476563 | $0.531250 | $0.546875 | $0.554688 | ||||||||
October 15, 2024 | $0.476563 | $0.531250 | $0.546875 | — | ||||||||
January 15, 2025 | $0.476563 | $0.531250 | $0.546875 | — | ||||||||
Year Ended December 31, | ||||||||||||||||||
2020 | 2021 | 2022 | 2023 | 2024 | Total | |||||||||||||
(Expressed in millions of U.S. dollars) | ||||||||||||||||||
Common Stock dividends paid | $34.3 | $40.2 | $88.4 | $39.1 | $43.5 | $245.5 | ||||||||||||
Common Stock dividends paid in shares under the Dividend Reinvestment Plan | 13.8 | 12.6 | 30.3 | 16.3 | 11.3 | 84.3 | ||||||||||||
Preferred Stock dividends paid | 31.2 | 31.1 | 31.1 | 31.1 | 28.5 | 153.0 | ||||||||||||
Total | $79.3 | $83.9 | $149.8 | $86.5 | $83.3 | $482.8 | ||||||||||||
B. | Significant Changes |
THE OFFER AND LISTING |
ADDITIONAL INFORMATION |
A. | Share Capital |
B. | Memorandum and Articles of Association |
• | the designation of the series; |
• | the number of shares of the series; |
• | the preferences and relative, participating, option or other special rights, if any, and any qualifications, limitations or restrictions of such series; and |
• | the voting rights, if any, of the holders of the series. |
• | 10 days following the first public announcement that a person or group of affiliated or associated persons or an “acquiring person” has acquired or obtained the right to acquire beneficial ownership of 15% or more of our outstanding common stock; or |
• | 10 business days following the start of a tender or exchange offer that would result, if closed, in a person becoming an “acquiring person”. |
• | our common stock certificates will evidence the rights, and the rights will be transferable only with those certificates; and |
• | any new shares of common stock will be issued with rights, and new certificates will contain a notation incorporating the rights agreement by reference. |
• | we are acquired in a merger or other business combination transaction; or |
• | 50% or more of our assets, cash flows or earning power is sold or transferred. |
• | any person other than our existing stockholder becoming the beneficial owner of common stock with voting power equal to 50% or more of the total voting power of all shares of common stock entitled to vote in the election of directors; or |
• | the occurrence of a flip-over event. |
• | to cure any ambiguity, omission, defect or inconsistency; |
• | to make changes that do not adversely affect the interests of holders of rights, excluding the interests of any acquiring person; or |
• | to shorten or lengthen any time period under the rights agreement, except that we cannot change the time period when rights may be redeemed or lengthen any time period, unless such lengthening protects, enhances or clarifies the benefits of holders of rights other than an acquiring person. |
C. | Material Contracts |
(a) | Restrictive Covenant Agreement dated November 3, 2010, as amended and restated on July 1, 2021 between Costamare Inc. and Konstantinos Konstantakopoulos, please see “Item 7. Major Shareholders and Related Party Transactions—Related Party Transactions—Restrictive Covenant Agreements”. |
(b) | Stockholder Rights Agreement dated October 19, 2010, between Costamare Inc. and American Stock Transfer & Trust Company, LLC, as Rights Agent. For a description of the Stockholder Rights Agreement, please see “Item 10. Additional Information—B. Memorandum and Articles of Association—Stockholder Rights Plan”. |
(c) | Trademark License Agreement dated November 3, 2010 as amended and restated on March 14, 2022, between Costamare Inc. and Costamare Shipping Company S.A., please see “Item 7. Major Shareholders and Related Party Transactions—B. Related Party Transactions—Trademark License Agreement”. |
(d) | Restrictive Covenant Agreement dated July 24, 2012, between Costamare Inc. and Konstantinos Zacharatos, please see “Item 7. Major Shareholders and Related Party Transactions—B. Related Party Transactions—Restrictive Covenant Agreements”. |
(e) | Framework Deed dated May 15, 2013, as amended and restated on May 18, 2015, between Sparrow Holdings, L.P., York Capital Management Global Advisors LLC, Costamare Inc. and Costamare Ventures Inc., please see “Item 4. Information on the Company—B. Business Overview—Our Fleet—Framework Deed”. |
(f) | Services Agreement dated November 2, 2015, as amended and restated on June 28, 2021 and as further amended on December 12, 2024, by and between the subsidiaries of Costamare Inc. set out in Schedule A thereto and Costamare Shipping Services Ltd., please see “Item 7. Major Shareholders and Related Party Transactions—B. Related Party Transactions—Management and Services Agreement”. |
(g) | Amended and Restated Registration Rights Agreement dated as of November 27, 2015, between Costamare Inc. and the Stockholders named therein, please see “Item 7. Major Shareholders and Related Party Transactions—B. Related Party Transactions—Registration Rights Agreement”. |
(h) | Framework Agreement dated November 2, 2015, as amended and restated on January 17, 2020, on June 28, 2021 and as further amended on December 12, 2024, by and between Costamare Inc. and Costamare Shipping Company S.A., please see “Item 7. Major Shareholders and Related Party Transactions—B. Related Party Transactions—Management and Services Agreement”. |
(i) | Amended and Restated Subscription and Shareholders’ Agreement Relating to Neptune Maritime Leasing Limited dated March 14, 2023, by and among Snow White Investments Limited, International Maritime Holdings A.G., Codrus Capital A.G., Stephen Asplin, Konstantinos Karamanis, Costamare Maritime Finance Limited and Neptune Maritime Leasing Limited, please see “Item 4. Information on the Company—A. History and Development of the Company”. |
D. | Exchange Controls and Other Limitations Affecting Security Holders |
Marshall Islands | Delaware | ||
Shareholder Meetings | |||
Held at a time and place as designated in the bylaws. | May be held at such time or place as designated in the certificate of incorporation or the bylaws, or if not so designated, as determined by the Board of Directors. | ||
May be held in or outside of the Marshall Islands. | May be held in or outside of Delaware. | ||
Whenever shareholders are required to take action at a meeting, written notice shall state the place, date and | Whenever shareholders are required to take any action at a meeting, a written notice of the meeting shall be | ||
Marshall Islands | Delaware | ||
hour of the meeting, and unless it is the annual meeting, indicates that it is being issued by or at the direction of the person calling the meeting, and if such meeting is a special meeting such notice shall also state the purpose for which it is being called. | given which shall state the place, if any, date and hour of the meeting, and the means of remote communication, if any. | ||
A copy of the notice of any meeting shall be given personally, sent by mail or by electronic transmission not less than 15 nor more than 60 days before the date of the meeting. | Written notice shall be given not less than 10 nor more than 60 days before the meeting. | ||
Shareholder’s Voting Rights | |||
Any action required to be taken by a meeting of shareholders may be taken without a meeting if consent is in writing, sets forth the action so taken and is signed by all the shareholders entitled to vote or if the articles of incorporation so provide, by holders of outstanding shares having not less than the minimum number of votes that would be necessary to authorize or take such action at a meeting at which all shares entitled to vote thereon were present and voted. | With limited exceptions, shareholders may act by written consent to elect directors. | ||
Any person authorized to vote may authorize another person to act for him or her by proxy. | Any person authorized to vote may authorize another person or persons to act for him or her by proxy. | ||
Unless otherwise provided in the articles of incorporation or bylaws, a majority of shares entitled to vote constitutes a quorum. In no event shall a quorum consist of fewer than one-third of the shares entitled to vote at a meeting. | For stock corporations, the certificate of incorporation or bylaws may specify the number to constitute a quorum, but in no event shall a quorum consist of less than one third of shares entitled to vote at a meeting. In the absence of such specifications, a majority of shares entitled to vote shall constitute a quorum. | ||
When a quorum is once present to organize a meeting, it is not broken by the subsequent withdrawal of any shareholders. | When a quorum is once present to organize a meeting, it is not broken by the subsequent withdrawal of any shareholders. | ||
The articles of incorporation may provide for cumulative voting in the election of directors. | The certificate of incorporation may provide for cumulative voting. | ||
Any two or more domestic corporations may merge into a single corporation if approved by the board and if authorized by the vote of the majority of holders of outstanding shares entitled to vote at a shareholder meeting. | Any two or more corporations existing under the laws of the state may merge into a single corporation pursuant to a board resolution and upon the majority vote by shareholders of each constituent corporation at an annual or special meeting. | ||
Any sale, lease, exchange or other disposition of all or substantially all the assets of a corporation, if not made in the corporation’s usual or regular course of business, once approved by the board, shall be authorized by the affirmative vote of two-thirds of the shares of those entitled to vote at a shareholder meeting. | Every corporation may at any meeting of the board sell, lease or exchange all or substantially all of its property and assets as its board deems expedient and for the best interests of the corporation when so authorized by a resolution adopted by the holders of a majority of the outstanding stock of a corporation entitled to vote. | ||
Marshall Islands | Delaware | ||
Any domestic corporation owning at least 90% of the outstanding shares of each class of another domestic corporation may merge such other corporation into itself without the authorization of the shareholders of any corporation. | Any corporation owning at least 90% of the outstanding shares of each class of another corporation may merge the other corporation into itself and assume all of its obligations without the vote or consent of shareholders; however, in case the parent corporation is not the surviving corporation, the proposed merger shall be approved by a majority of the outstanding stock of the parent corporation entitled to vote at a duly called shareholder meeting. | ||
Any mortgage, pledge of or creation of a security interest in all or any part of the corporate property may be authorized without the vote or consent of the shareholders, unless otherwise provided for in the articles of incorporation. | Any mortgage or pledge of a corporation’s property and assets may be authorized without the vote or consent of shareholders, except to the extent that the certificate of incorporation otherwise provides. | ||
Directors | |||
The board of directors must consist of at least one member. | The board of directors must consist of at least one member. | ||
Number of members can be changed by an amendment to the bylaws, by the shareholders, or by action of the board pursuant to the bylaws. | Number of board members shall be fixed by the bylaws, unless the certificate of incorporation fixes the number of directors, in which case a change in the number shall be made only by amendment of the certificate of incorporation. | ||
If the board of directors is authorized to change the number of directors, it can only do so by a majority of the entire board and so long as no decrease in the number shall shorten the term of any incumbent director. | |||
Removal: | Removal: | ||
• Any or all of the directors may be removed for cause by vote of the shareholders. | • Any or all of the directors may be removed, with or without cause, by the holders of a majority of the shares entitled to vote unless the certificate of incorporation otherwise provides. | ||
• If the articles of incorporation or the bylaws so provide, any or all of the directors may be removed without cause by vote of the shareholders | • In the case of a classified board, shareholders may effect removal of any or all directors only for cause. | ||
Dissenter’s Rights of Appraisal | |||
With limited exceptions, appraisal rights shall be available for the shares of any class or series of stock of a corporation in a merger or consolidation. | With limited exceptions, appraisal rights shall be available for the shares of any class or series of stock of a corporation in a merger or consolidation. | ||
Marshall Islands | Delaware | ||
A holder of any adversely affected shares who does not vote on, or consent in writing to, an amendment to the articles of incorporation has the right to dissent and to receive payment for such shares if the amendment | The certificate of incorporation may provide that appraisal rights are available for shares as a result of an amendment to the certificate of incorporation, any merger or consolidation or the sale of all or substantially all of the assets. | ||
• alters or abolishes any preferential right of any outstanding shares having preference; • creates, alters, or abolishes any provision or right in respect to the redemption of any outstanding shares; • alters or abolishes any preemptive right of such holder to acquire shares or other securities; or • excludes or limits the right of such holder to vote on any matter, except as such right may be limited by the voting rights given to new shares then being authorized of any existing or new class. | |||
Shareholder’s Derivative Actions | |||
An action may be brought in the right of a corporation to procure a judgment in its favor, by a holder of shares or of voting trust certificates or of a beneficial interest in such shares or certificates. It shall be made to appear that the plaintiff is such a holder at the time of bringing the action and that he was such a holder at the time of the transaction of which he complains, or that his shares or his interest therein devolved upon him by operation of law. | In any derivative suit instituted by a shareholder of a corporation, it shall be averred in the complaint that the plaintiff was a shareholder of the corporation at the time of the transaction of which he complains or that such shareholder’s stock thereafter devolved upon such shareholder by operation of law. | ||
Complaint shall set forth with particularity the efforts of the plaintiff to secure the initiation of such action by the board of directors or the reasons for not making such effort. Such action shall not be discontinued, compromised or settled, without the approval of the High Court of the Marshall Islands Reasonable expenses, including attorneys’ fees, may be awarded if the action is successful Corporation may require a plaintiff bringing a derivative suit to give security for reasonable expenses if the plaintiff owns less than 5% of any class of stock and the shares have a value of less than $50,000. | |||
E. | Tax Considerations |
(a) | the use of vessels; |
(b) | the hiring or leasing of vessels for use on a time, operating or bareboat charter basis; |
(c) | the participation in a pool, partnership, strategic alliance, joint operating agreement or other joint venture it directly or indirectly owns or participates in that generates such income; or |
(d) | the performance of services directly related to those uses. |
(a) | it is organized in a foreign country (or the “country of organization”) that grants an “equivalent exemption” to U.S. corporations; and |
(b) | either |
(i) | more than 50% of the value of its stock is owned, directly or indirectly, by individuals who are “residents” of our country of organization or of another foreign country that grants an “equivalent exemption” to U.S. corporations; or |
(ii) | its stock is “primarily and regularly traded on an established securities market” in its country of organization, in another country that grants an “equivalent exemption” to U.S. corporations, or in the United States. |
(a) | we had, or were considered to have, a fixed place of business in the United States involved in the earning of U.S. source gross transportation income; and |
(b) | substantially all of our U.S. source gross transportation income was attributable to regularly scheduled transportation, such as the operation of a vessel that followed a published schedule with repeated sailings at regular intervals between the same points for voyages that begin or end in the United States. |
(a) | the common stock or Preferred Stock, as the case may be, is readily tradable on an established securities market in the United States (such as the NYSE); |
(b) | we are not a PFIC for the taxable year during which the dividend is paid or the immediately preceding taxable year (see the discussion below under “PFIC Status”); |
(c) | you own our common stock or our Preferred Stock for more than 60 days in the 121-day period beginning 60 days before the date on which the common stock or Preferred Stock becomes ex-dividend; |
(d) | you are not under an obligation to make related payments with respect to positions in substantially similar or related property; and |
(e) | certain other conditions are met. |
(a) | at least 75% of our gross income for such taxable year consists of “passive income” (e.g., dividends, interest, capital gains and rents derived other than in the active conduct of a rental business); or |
(b) | at least 50% of the average value of our assets during such taxable year consists of “passive assets” (i.e., assets that produce, or are held for the production of, passive income). |
(i) | the excess distribution or gain would be allocated ratably over your aggregate holding period for our common stock or Preferred Stock; |
(ii) | the amount allocated to the current taxable year and any taxable year prior to the taxable year we were first treated as a PFIC with respect to such U.S. holder who does not make a QEF or a “mark-to-market” election would be taxed as ordinary income; and |
(iii) | the amount allocated to each of the other taxable years would be subject to tax at the highest rate of tax in effect for the applicable class of taxpayer for that year, and an interest charge for the deemed deferral benefit would be imposed with respect to the resulting tax attributable to each such other taxable year. |
(a) | the gain is effectively connected with your conduct of a trade or business in the United States. If you are entitled to the benefits of an applicable income tax treaty with respect to that gain, that gain generally is taxable in the United States only if it is attributable to a permanent establishment maintained by you in the United States as required by such income tax treaty; or |
(b) | you are an individual who is present in the United States for 183 days or more during the taxable year of disposition and certain other conditions are met. |
(1) | fail to provide us with an accurate taxpayer identification number; |
(2) | are notified by the IRS that you have failed to report all interest or dividends required to be shown on your Federal income tax returns; or |
(3) | in certain circumstances, fail to comply with applicable certification requirements. |
F. | Dividends and Paying Agents |
G. | Statement by Experts |
H. | Documents on Display |
I. | Subsidiary Information |
J. | Annual Report to Security Holders |
QUANTITATIVE AND QUALITATIVE DISCLOSURES ABOUT MARKET RISK |
A. | Quantitative Information About Market Risk |
Year | Amount | ||
2025 | 5.5 | ||
2026 | 4.6 | ||
2027 | 3.8 | ||
2028 | 2.9 | ||
2029 | 1.2 | ||
DESCRIPTION OF SECURITIES OTHER THAN EQUITY SECURITIES |
DEFAULTS, DIVIDEND ARREARAGES AND DELINQUENCIES |
MATERIAL MODIFICATIONS TO THE RIGHTS OF SECURITY HOLDERS AND USE OF PROCEEDS |
A. | Material Modifications to the Rights of Security Holders |
CONTROLS AND PROCEDURES |
A. | Disclosure Controls and Procedures |
B. | Management’s Annual Report on Internal Control Over Financial Reporting |
C. | Attestation Report of the Registered Public Accounting Firm |
D. | Changes in Internal Control Over Financial Reporting |
AUDIT COMMITTEE FINANCIAL EXPERT |
CODE OF ETHICS |
PRINCIPAL ACCOUNTANT FEES AND SERVICES |
2024 | 2023 | |||||
Audit fees | €1,105,000 | €800,000 | ||||
Audit-related fees | €12,000 | €18,000 | ||||
Tax fees | €18,769 | €32,314 | ||||
All other fees | €— | — | ||||
Total fees | €1,135,769 | €850,314 | ||||
EXEMPTIONS FROM THE LISTING STANDARDS FOR AUDIT COMMITTEES |
PURCHASES OF EQUITY SECURITIES BY THE ISSUER AND AFFILIATED PURCHASERS |
Period | Total Number of Common Shares Purchased | Average Price Paid per Share ($) | Total Number of Shares Purchased as Part of Publicly Announced Plans or Programs | Maximum Number of Shares that May Yet be Purchased Under the Plans or Programs | ||||||||
January 2024 | ||||||||||||
February 2024 | 376,678(1) | |||||||||||
March 2024 | 74,800(2) | |||||||||||
April 2024 | ||||||||||||
May 2024 | 330,718(1) | |||||||||||
June 2024 | 74,800(2) | |||||||||||
July 2024 | ||||||||||||
August 2024 | 151,830(1) | |||||||||||
September 2024 | 74,800(2) | |||||||||||
October 2024 | ||||||||||||
November 2024 | ||||||||||||
December 2024 | 74,800(2) | |||||||||||
Total | 1,158,426 | |||||||||||
(1) | These shares were issued by the Company pursuant to the Dividend Reinvestment Plan. |
(2) | These shares were issued to Costamare Services by the Company pursuant to the Services Agreement in exchange for services provided to the Company’s vessel-owning subsidiaries. |
CHANGE IN REGISTRANT’S CERTIFYING ACCOUNTANT |
CORPORATE GOVERNANCE |
MINE SAFETY DISCLOSURE |
DISCLOSURE REGARDING FOREIGN JURISDICTIONS THAT PREVENT INSPECTIONS |
INSIDER TRADING POLICIES |
CYBERSECURITY |
• | periodic discussion and assessment of perceived material risks from cybersecurity; |
• | internal and external system assessments such as penetration and vulnerability testing; |
• | system protection measures, such as email filtering and access management; |
• | regular threat monitoring, both against the Company and against other companies in the industry; |
• | incident response procedures, for identification, reporting and remediation; |
• | analysis of cybersecurity incidents and results of security operations monitoring; |
• | regular employee training; |
• | compliance procedures in place designed to assist in complying with mandatory data protection legislation; and |
• | the existence and periodic review of internal cybersecurity policies. |
• | updating relevant policies and procedures; |
• | implementing additional technical and organizational measures to reduce the level of cyber risk; |
• | engaging specialized third-party service providers; |
• | assessing the materiality and determination of disclosure obligations (in the event of a cybersecurity incident); and |
• | reporting to the Audit Committee. |
• | conduct an incident investigation; |
• | conduct an incident evaluation and classification; |
• | internal escalation to our executives; |
• | containment of the incident and recovery of any affected infrastructure; |
• | conduct a materiality assessment; |
• | determine reporting obligations; and |
• | report to the Audit Committee. |
FINANCIAL STATEMENTS |
FINANCIAL STATEMENTS |
EXHIBITS |
Exhibit No. | Description | ||
1.1 | Second Amended and Restated Articles of Incorporation(1) | ||
1.2 | First Amended and Restated Bylaws(1) | ||
2.1 | Description of Securities | ||
4.1 | Restrictive Covenant Agreement dated November 3, 2010, as amended and restated on July 1, 2021 between Costamare Inc. and Konstantinos Konstantakopoulos(2) | ||
4.2 | Form of Stockholders Rights Agreement between Costamare Inc. and American Stock Transfer & Trust Company, LLC(3) | ||
4.3 | Trademark License Agreement dated November 3, 2010, as amended and restated on March 14, 2022 between Costamare Inc. and Costamare Shipping Company S.A.(4) | ||
4.4 | Form of Restrictive Covenant Agreement between Costamare Inc. and Konstantinos Zacharatos(5) | ||
4.5 | Services Agreement dated November 2, 2015, as amended and restated on June 28, 2021 by and between the subsidiaries of Costamare Inc. set out in Schedule A thereto and Costamare Shipping Services Ltd.(7) | ||
4.6 | Amended and Restated Registration Rights Agreement dated as of November 27, 2015 between Costamare Inc. and the Stockholders named therein(6) | ||
4.7 | Agreement Regarding Charter Brokerage dated January 1, 2018, by and between Costamare Shipping Company S.A. and Blue Net Chartering GmbH & Co. KG(8) | ||
4.8 | Framework Agreement dated November 2, 2015, as amended and restated on January 17, 2020, and as further amended and restated on June 28, 2021 by and between Costamare Inc. and Costamare Shipping Company S.A.(2) | ||
4.9 | Local Service Agreement dated November 14, 2022, as amended and restated on December 16, 2024, between Costamare Bulkers Inc. and Costamare Bulkers Services GmbH | ||
4.10 | Local Service Agreement dated November 14, 2022, as amended and restated on December 16, 2024, between Costamare Bulkers Inc. and Costamare Bulkers Services ApS | ||
4.11 | Local Service Agreement dated November 14, 2022, as amended and restated on December 16, 2024, between Costamare Bulkers Inc. and Costamare Bulkers Services Pte. Ltd. | ||
4.12 | Local Service Agreement dated November 20, 2023, as amended and restated on December 16, 2024, between Costamare Bulkers Inc. and Costamare Bulkers Services Co., Ltd. | ||
4.13 | Amended and Restated Subscription and Shareholders’ Agreement Relating to Neptune Maritime Leasing Limited dated March 14, 2023, by and among Snow White Investments Limited, International Maritime Holdings A.G., Codrus Capital A.G., Stephen Asplin, Konstantinos Karamanis, Costamare Maritime Finance Limited and Neptune Maritime Leasing Limited(9) | ||
4.14 | Amended and Restated Management Services Agreement dated March 14, 2023, among Neptune Maritime Leasing Limited and Neptune Global Financing Limited(9) | ||
4.15 | Form of Ship Management Agreement between certain vessel-owning subsidiaries of Costamare Inc. with Navilands Container Management Ltd.(4) | ||
4.16 | Form of Ship Management Agreement between certain vessel-owning subsidiaries of Costamare Inc. with Navilands Bulker Management Ltd.(4) | ||
4.17 | Tax Indemnity Deed dated April 30, 2024 between Costamare Bulkers Services Pte. Ltd. and Costamare Bulkers Inc. | ||
8.1 | List of Subsidiaries of Costamare Inc. | ||
11.1 | Policy Statement for Trading in Company Securities | ||
Exhibit No. | Description | ||
12.1 | Rule 13a-14(a)/15d-14(a) Certification of Costamare Inc.’s Chief Executive Officer | ||
12.2 | Rule 13a-14(a)/15d-14(a) Certification of Costamare Inc.’s Chief Financial Officer | ||
13.1 | Costamare Inc. Certification of Konstantinos Konstantakopoulos, Chief Executive Officer, pursuant to 18 U.S.C. Section 1350, as adopted pursuant to Section 906 of the U.S. Sarbanes-Oxley Act of 2002 | ||
13.2 | Costamare Inc. Certification of Gregory Zikos, Chief Financial Officer, pursuant to 18 U.S.C. Section 1350, as adopted pursuant to Section 906 of the U.S. Sarbanes-Oxley Act of 2002 | ||
15.1 | Consent of Independent Registered Public Accounting Firm | ||
97.1 | Incentive Compensation Recovery Policy(4) | ||
101.INS | XBRL Instance Document | ||
101.SCH | XBRL Taxonomy Extension Schema | ||
101.CAL | XBRL Taxonomy Extension Calculation Linkbase | ||
101.DEF | XBRL Taxonomy Extension Definition Linkbase | ||
101.LAB | XBRL Taxonomy Extension Label Linkbase | ||
101.PRE | XBRL Taxonomy Extension Presentation Linkbase | ||
(1) | Previously filed as an exhibit to Costamare Inc.’s Annual Report on Form 20-F for the fiscal year ended December 31, 2012, filed with the SEC on March 1, 2013 and hereby incorporated by reference to such Annual Report. |
(2) | Previously filed as an exhibit to Costamare Inc.’s Report on Form 6-K, filed with the SEC on August 10, 2021 and hereby incorporated by reference to such Form 6-K. |
(3) | Previously filed as an exhibit to Costamare Inc.’s Registration Statement on Form F-1 (File No. 333-170033), declared effective by the SEC on November 3, 2010 and hereby incorporated by reference to such Registration Statement. |
(4) | Previously filed as an exhibit to Costamare Inc.’s Annual Report on Form 20-F for the fiscal year ended December 31, 2023, filed with the SEC on March 29, 2024 and hereby incorporated by reference to such Annual Report. |
(5) | Previously filed as an exhibit to Costamare Inc.’s Annual Report on Form 20-F for the fiscal year ended December 31, 2012, filed with the SEC on March 1, 2013 and hereby incorporated by reference to such Annual Report. |
(6) | Previously filed as an exhibit to Costamare Inc.’s Annual Report on Form 20-F for the fiscal year ended December 31, 2015, filed with the SEC on April 27, 2016 and hereby incorporated by reference to such Annual Report. |
(7) | Previously filed as an exhibit to Costamare Inc.’s Report on Form 6-K, filed with the SEC on August 24, 2021 and hereby incorporated by reference to such Form 6-K. |
(8) | Previously filed as an exhibit to Costamare Inc.’s Annual Report on Form 20-F for the fiscal year ended December 31, 2018, filed with the SEC on March 7, 2019 and hereby incorporated by reference to such Annual Report. |
(9) | Previously filed as an exhibit to Costamare Inc.’s Annual Report on Form 20-F for the fiscal year ended December 31, 2022, filed with the SEC on April 3, 2023 and hereby incorporated by reference to such Annual Report. |
COSTAMARE INC., | |||||||||
By: | /s/ Konstantinos Konstantakopoulos | ||||||||
Name: | Konstantinos Konstantakopoulos | ||||||||
Title: | Chief Executive Officer | ||||||||
Impairment of vessels | |||
Description of the Matter | At December 31, 2024, the carrying value of the Company’s vessels was $3,387,012 thousand. As discussed in Notes 2(k), and 7 to the consolidated financial statements, the Company evaluates its vessels for impairment whenever events or changes in circumstances indicate that the carrying value of a vessel might exceed its fair value in accordance with the guidance in ASC 360 – Property, Plant and Equipment. As part of the assessment performed, management analyzes the future undiscounted net operating cash flows expected to be generated throughout the remaining useful life of each vessel and compares it to the carrying value to conclude whether indicators of impairment exist. Where the vessel’s carrying value exceeds the undiscounted net operating cash flows, management will recognize an impairment loss equal to the excess of the carrying value over the fair value of the vessel. During the year ended December 31, 2024, the Company recognized no impairment charge for any of its vessels. | ||
Impairment of vessels | |||
Auditing management’s recoverability assessment was complex given the judgement and estimation uncertainty involved in determining the assumption of the future charter rates for non-contracted revenue days, when forecasting net operating cash flows. These rates are particularly subjective as they involve the development and use of assumptions about shipping market through the end of the useful lives of the vessels which are forward looking and subject to the inherent unpredictability of future global economic and market conditions. | |||
How We Addressed the Matter in Our Audit | We obtained an understanding of the Company’s impairment process, evaluated the design, and tested the operating effectiveness of the controls over the Company’s determination of future charter rates for non-contracted revenue days. We analyzed management’s impairment assessment by comparing the methodology used to evaluate impairment of each vessel against the accounting guidance in ASC 360. To test management’s undiscounted net operating cash flow forecasts, our procedures included, among others, comparing the future vessel charter rates used by management for non-contracted revenue days, with historical market data from external analysts, historical data for vessels, and recent economic and industry changes. In addition, we performed sensitivity analyses to assess the impact of changes to future charter rates for non-contracted revenue days in the determination of the net operating cash flows. We assessed the adequacy of the Company’s disclosures in Notes 2(k), and 7 to the consolidated financial statements. | ||
December 31, 2023 | December 31, 2024 | |||||
ASSETS | ||||||
CURRENT ASSETS: | ||||||
Cash and cash equivalents (Note 2(e)) | $745,544 | $704,633 | ||||
Restricted cash (Note 2(e)) | 10,645 | 18,145 | ||||
Margin deposits (Note 22(d)) | 13,748 | 45,221 | ||||
Accounts receivable, net (Note 3) | 50,684 | 45,509 | ||||
Inventories (Note 6) | 61,266 | 57,656 | ||||
Due from related parties (Note 3) | 4,119 | 7,014 | ||||
Fair value of derivatives (Notes 22 and 23) | 33,310 | 10,607 | ||||
Insurance claims receivable | 18,458 | 10,881 | ||||
Time charter assumed (Note 14) | 405 | 195 | ||||
Accrued charter revenue (Note 14) | 9,752 | 11,929 | ||||
Short-term investments (Note 5) | 17,492 | 18,499 | ||||
Investment in leaseback vessels (Note 12(b)) | 27,362 | 30,561 | ||||
Net investment in sales type lease vessels, current (Note 12(c)) | 22,620 | 12,748 | ||||
Prepayments and other assets | 61,949 | 66,618 | ||||
Vessels held for sale (Note 7) | 40,307 | — | ||||
Total current assets | 1,117,661 | 1,040,216 | ||||
FIXED ASSETS, NET: | ||||||
Vessels and advances, net (Note 7) | 3,446,797 | 3,387,012 | ||||
Total fixed assets, net | 3,446,797 | 3,387,012 | ||||
OTHER NON-CURRENT ASSETS: | ||||||
Equity method investments (Note 10) | 552 | — | ||||
Investment in leaseback vessels, non-current (Note 12(b)) | 191,674 | 222,088 | ||||
Accounts receivable, net, non-current (Note 3) | 5,586 | 3,560 | ||||
Deferred charges, net (Note 8) | 72,801 | 71,807 | ||||
Finance leases, right-of-use assets (Note 12(a)) | 39,211 | 37,818 | ||||
Due from related parties, non-current (Note 3) | — | 2,175 | ||||
Net investment in sales type lease vessels, non-current (Note 12(c)) | 19,482 | 6,734 | ||||
Restricted cash, non-current (Note 2(e)) | 69,015 | 55,158 | ||||
Time charter assumed, non-current (Note 14) | 269 | 74 | ||||
Accrued charter revenue, non-current (Note 14) | 10,937 | 2,688 | ||||
Fair value of derivatives, non-current (Notes 22 and 23) | 28,639 | 21,382 | ||||
Operating leases, right-of-use assets (Note 13) | 284,398 | 297,975 | ||||
Total assets | $5,287,022 | $5,148,687 | ||||
LIABILITIES AND STOCKHOLDERS’ EQUITY | ||||||
CURRENT LIABILITIES: | ||||||
Current portion of long-term debt, net of deferred financing costs (Note 11) | $347,027 | $317,865 | ||||
Accounts payable | 46,769 | 49,425 | ||||
Due to related parties (Note 3) | 3,172 | 6,833 | ||||
Finance lease liability (Note 12 (a)) | 2,684 | 23,877 | ||||
Operating lease liabilities, current portion (Note 13) | 160,993 | 205,172 | ||||
Accrued liabilities | 39,521 | 31,885 | ||||
Unearned revenue (Note 14) | 52,177 | 47,813 | ||||
Fair value of derivatives (Notes 22 and 23) | 3,050 | 34,221 | ||||
Other current liabilities | 7,377 | 28,469 | ||||
Total current liabilities | 662,770 | 745,560 | ||||
December 31, 2023 | December 31, 2024 | |||||
NON-CURRENT LIABILITIES: | ||||||
Long-term debt, net of current portion and deferred financing costs (Note 11) | 1,999,193 | 1,716,204 | ||||
Finance lease liability, net of current portion (Note 12 (a)) | 23,877 | — | ||||
Operating lease liabilities, non-current portion (Note 13) | 114,063 | 87,424 | ||||
Fair value of derivatives, non-current portion (Notes 22 and 23) | 11,194 | 5,174 | ||||
Unearned revenue, net of current portion (Note 14) | 27,352 | 14,620 | ||||
Other non-current liabilities | 9,184 | 11,099 | ||||
Total non-current liabilities | 2,184,863 | 1,834,521 | ||||
COMMITMENTS AND CONTINGENCIES (Note 15) | — | — | ||||
Temporary equity – Redeemable non-controlling interest in subsidiary – (Note 16) | 629 | (2,453) | ||||
STOCKHOLDERS’ EQUITY: | ||||||
Preferred stock (Note 17) | — | — | ||||
Common stock (Note 17) | 13 | 13 | ||||
Treasury stock (Note 17) | (120,095) | (120,095) | ||||
Additional paid-in capital | 1,435,294 | 1,336,646 | ||||
Retained earnings | 1,045,932 | 1,279,605 | ||||
Accumulated other comprehensive income (Notes 22 and 24) | 21,387 | 17,345 | ||||
Total Costamare Inc. stockholders’ equity | 2,382,531 | 2,513,514 | ||||
Non-controlling interest (Note 1) | 56,229 | 57,545 | ||||
Total stockholders’ equity | 2,438,760 | 2,571,059 | ||||
Total liabilities and stockholders’ equity | $5,287,022 | $5,148,687 | ||||
For the years ended December 31, | |||||||||
2022 | 2023 | 2024 | |||||||
REVENUES: | |||||||||
Voyage revenue (Note 19) | $1,113,859 | $1,502,491 | $1,849,860 | ||||||
Voyage revenue – related parties (Notes 3 and 19) | — | — | 210,087 | ||||||
Total voyage revenue | 1,113,859 | 1,502,491 | 2,059,947 | ||||||
Income from investments in leaseback vessels | — | 8,915 | 23,947 | ||||||
Total revenues | 1,113,859 | 1,511,406 | 2,083,894 | ||||||
EXPENSES: | |||||||||
Voyage expenses | (49,069) | (275,856) | (371,058) | ||||||
Charter-in hire expenses (Note 2(q)) | — | (340,926) | (706,569) | ||||||
Voyage expenses-related parties (Note 3) | (15,418) | (13,993) | (21,566) | ||||||
Vessels’ operating expenses | (269,231) | (258,088) | (240,207) | ||||||
General and administrative expenses | (9,737) | (15,674) | (22,091) | ||||||
General and administrative expenses – related parties (Note 3) | (9,792) | (8,542) | (11,376) | ||||||
Management and agency fees-related parties (Note 3) | (46,735) | (56,254) | (59,281) | ||||||
Amortization of dry-docking and special survey costs (Note 8) | (13,486) | (19,782) | (23,627) | ||||||
Depreciation (Notes 7, 12 and 24) | (165,998) | (166,340) | (164,206) | ||||||
Gain on sale of vessels, net (Notes 7 and 12 (c)) | 126,336 | 112,220 | 3,788 | ||||||
Loss on vessels held for sale (Note 7) | — | (2,305) | — | ||||||
Vessels’ impairment loss (Notes 7 and 8) | (1,691) | (434) | — | ||||||
Foreign exchange gains / (losses) | 3,208 | 2,576 | (5,440) | ||||||
Operating income | 662,246 | 468,008 | 462,261 | ||||||
OTHER INCOME / (EXPENSES): | |||||||||
Interest income | 5,956 | 32,447 | 33,185 | ||||||
Interest and finance costs (Note 20) | (122,233) | (144,429) | (133,123) | ||||||
Income from equity method investments (Note 10) | 2,296 | 764 | 12 | ||||||
Other, net | 3,729 | 6,941 | 2,873 | ||||||
Gain / (loss) on derivative instruments, net (Note 22) | 2,698 | 17,288 | (48,874) | ||||||
Total other expenses, net | (107,554) | (86,989) | (145,927) | ||||||
Net income | $554,692 | $381,019 | $316,334 | ||||||
Net loss attributable to the non-controlling interest (Note 16) | 263 | 4,730 | 3,585 | ||||||
Net income attributable to Costamare Inc. | $554,955 | $385,749 | $319,919 | ||||||
Earnings allocated to Preferred Stock (Note 18) | (31,068) | (31,068) | (23,796) | ||||||
Deemed dividend in redemption of Series E Preferred Stock (Note 17) | — | — | (5,446) | ||||||
Net income available to Common Stockholders | $523,887 | $354,681 | $290,677 | ||||||
Earnings per common share, basic and diluted (Note 18) | $4.26 | $2.95 | $2.44 | ||||||
Weighted average number of shares, basic and diluted (Note 18) | 122,964,358 | 120,299,172 | 119,299,405 | ||||||
For the years ended December 31, | |||||||||
2022 | 2023 | 2024 | |||||||
Net income for the year | $554,692 | $381,019 | $316,334 | ||||||
Other comprehensive income / (loss): | |||||||||
Unrealized gain / (loss) on cash flow hedges, net (Notes 22 and 24) | 46,435 | (29,876) | (9,968) | ||||||
Reclassification of amount excluded from the interest rate caps assessment of effectiveness based on an amortization approach to Interest and finance costs (Notes 20, 22 and 24) | 1,286 | 4,354 | 6,084 | ||||||
Effective portion of changes in fair value of cash flow hedges (Notes 22 and 24) | 868 | 425 | (157) | ||||||
Amounts reclassified from Net settlements on interest rate swaps qualifying for hedge accounting to Depreciation (Notes 22 and 24) | 63 | 63 | 63 | ||||||
Other comprehensive income / (loss) for the year | $48,652 | $(25,034) | $(3,978) | ||||||
Other comprehensive gain attributable to the non-controlling interest (Note 24) | — | — | (64) | ||||||
Other comprehensive income / (loss) attributable to Costamare Inc. | $48,652 | $(25,034) | $(4,042) | ||||||
Total comprehensive income for the year | $603,344 | $355,985 | $312,356 | ||||||
Comprehensive loss attributable to the non-controlling interest (Notes 16 and 18) | 263 | 4,730 | 3,585 | ||||||
Total comprehensive income for the year attributable to Costamare Inc. | $603,607 | $360,715 | $315,877 | ||||||
Preferred Stock (Series E) | Preferred Stock (Series D) | Preferred Stock (Series C) | Preferred Stock (Series B) | Common Stock | Treasury Stock | Additional Paid-in Capital | Accumulated Other Comprehensive Income / (Loss) | (Accumulated deficit)/ Retained Earnings | Costamare Inc. | Non- controlling interest | Total | |||||||||||||||||||||||||||||||||||||||||||
# of shares | Par value | # of shares | Par value | # of shares | Par value | # of shares | Par value | # of shares | Par value | # of shares | Amount | |||||||||||||||||||||||||||||||||||||||||||
BALANCE, January 1, 2022 | 4,574,100 | $— | 3,986,542 | $— | 3,973,135 | $— | 1,970,649 | $— | 123,985,104 | $12 | — | $— | $1,386,636 | $(2,231) | $341,482 | $1,725,899 | $— | $1,725,899 | ||||||||||||||||||||||||||||||||||||
- Net income | — | — | — | — | — | — | — | — | — | — | — | — | — | — | 554,955 | 554,955 | — | 554,955 | ||||||||||||||||||||||||||||||||||||
- Issuance of common stock (Notes 3 and 17) | — | — | — | — | — | — | — | — | 3,053,309 | — | — | — | 37,318 | — | — | 37,318 | — | 37,318 | ||||||||||||||||||||||||||||||||||||
- Repurchase of common stock (Note 17) | — | — | — | — | — | — | — | — | — | — | (4,736,702) | (60,095) | — | — | — | (60,095) | — | (60,095) | ||||||||||||||||||||||||||||||||||||
- Dividends – Common stock (Note 17) | — | — | — | — | — | — | — | — | — | — | — | — | — | — | (118,711) | (118,711) | — | (118,711) | ||||||||||||||||||||||||||||||||||||
- Dividends – Preferred stock (Note 17) | — | — | — | — | — | — | — | — | — | — | — | — | — | — | (31,068) | (31,068) | — | (31,068) | ||||||||||||||||||||||||||||||||||||
- Other comprehensive income (Note 22 and 24) | — | — | — | — | — | — | — | — | — | — | — | — | — | 48,652 | — | 48,652 | — | 48,652 | ||||||||||||||||||||||||||||||||||||
BALANCE, December 31, 2022 | 4,574,100 | $— | 3,986,542 | $— | 3,973,135 | $— | 1,970,649 | $— | 127,038,413 | $12 | (4,736,702) | $(60,095) | $1,423,954 | $46,421 | $746,658 | $2,156,950 | $— | $2,156,950 | ||||||||||||||||||||||||||||||||||||
-Acquisition of non-controlling interest (Note 1) | — | — | — | — | — | — | — | — | — | — | — | — | — | — | — | — | 34,132 | 34,132 | ||||||||||||||||||||||||||||||||||||
- Net income(1) | — | — | — | — | — | — | — | — | — | — | — | — | — | — | 385,749 | 385,749 | 1,878 | 387,627 | ||||||||||||||||||||||||||||||||||||
- Issuance of subsidiary shares to non-controlling interest (Note 1) | — | — | — | — | — | — | — | — | — | — | — | — | (10,831) | — | — | (10,831) | 22,091 | 11,260 | ||||||||||||||||||||||||||||||||||||
- Issuance of common stock (Notes 3 and 17) | — | — | — | — | — | — | — | — | 2,340,720 | 1 | — | — | 22,171 | — | — | 22,172 | — | 22,172 | ||||||||||||||||||||||||||||||||||||
- Repurchase of common stock (Note 17) | — | — | — | — | — | — | — | — | — | — | (6,267,808) | (60,000) | — | — | — | (60,000) | — | (60,000) | ||||||||||||||||||||||||||||||||||||
- Dividends to non-controlling shareholders of subsidiary | — | — | — | — | — | — | — | — | — | — | — | — | — | — | — | — | (1,872) | (1,872) | ||||||||||||||||||||||||||||||||||||
- Dividends – Common stock (Note 17) | — | — | — | — | — | — | — | — | — | — | — | — | — | — | (55,407) | (55,407) | — | (55,407) | ||||||||||||||||||||||||||||||||||||
- Dividends – Preferred stock (Note 17) | — | — | — | — | — | — | — | — | — | — | — | — | — | — | (31,068) | (31,068) | — | (31,068) | ||||||||||||||||||||||||||||||||||||
- Other comprehensive loss (Notes 22 and 24) | — | — | — | — | — | — | — | — | — | — | — | — | — | (25,034) | — | (25,034) | — | (25,034) | ||||||||||||||||||||||||||||||||||||
BALANCE, December 31, 2023 | 4,574,100 | $— | 3,986,542 | $— | 3,973,135 | $— | 1,970,649 | $— | 129,379,133 | $13 | (11,004,510) | $(120,095) | $1,435,294 | $21,387 | $1,045,932 | $2,382,531 | $56,229 | $ 2,438,760 | ||||||||||||||||||||||||||||||||||||
- Net income(1) | — | — | — | — | — | — | — | — | — | — | — | — | — | — | 319,919 | 319,919 | 3,254 | 323,173 | ||||||||||||||||||||||||||||||||||||
-Acquisition of non-controlling interest (Notes 1 and 16) | — | — | — | — | — | — | — | — | — | — | — | — | (7,142) | — | — | (7,142) | — | (7,142) | ||||||||||||||||||||||||||||||||||||
- Issuance of subsidiary shares to non-controlling interest (Note 1) | — | — | — | — | — | — | — | — | — | — | — | — | (591) | — | — | (591) | 973 | 382 | ||||||||||||||||||||||||||||||||||||
- Issuance of common stock (Notes 3 and 17) | — | — | — | — | — | — | — | — | 1,579,810 | — | — | — | 19,683 | — | — | 19,683 | — | 19,683 | ||||||||||||||||||||||||||||||||||||
-Redemption of Preferred Stock (Series E) (Note 17) | (4,574,100) | — | — | — | — | — | — | — | — | — | — | — | (110,598) | — | (5,446) | (116,044) | — | (116,044) | ||||||||||||||||||||||||||||||||||||
- Dividends to non-controlling shareholders of subsidiary | — | — | — | — | — | — | — | — | — | — | — | — | — | — | — | — | (2,975) | (2,975) | ||||||||||||||||||||||||||||||||||||
- Dividends – Common stock (Note 17) | — | — | — | — | — | — | — | — | — | — | — | — | — | — | (54,806) | (54,806) | — | (54,806) | ||||||||||||||||||||||||||||||||||||
- Dividends – Preferred stock (Note 17) | — | — | — | — | — | — | — | — | — | — | — | — | — | — | (25,994) | (25,994) | — | (25,994) | ||||||||||||||||||||||||||||||||||||
- Other comprehensive loss (Notes 22 and 24) | — | — | — | — | — | — | — | — | — | — | — | — | — | (4,042) | — | (4,042) | 64 | (3,978) | ||||||||||||||||||||||||||||||||||||
BALANCE, December 31, 2024 | — | $— | 3,986,542 | $— | 3,973,135 | $— | 1,970,649 | $— | 130,958,943 | $13 | (11,004,510) | $(120,095) | $1,336,646 | $17,345 | $1,279,605 | $2,513,514 | $57,545 | $2,571,059 | ||||||||||||||||||||||||||||||||||||
(1) | Net income excludes net loss attributable to non-controlling interest of $263, $6,608 and $6,839 during the years ended December 31, 2022, 2023 and 2024, respectively. Temporary equity - non-controlling interest in subsidiary is reflected outside of the permanent stockholders’ equity on the December 31, 2023 and 2024 consolidated balance sheets. See Note 16 of the Notes to the Consolidated Financial Statements. |
For the years ended December 31, | |||||||||
2022 | 2023 | 2024 | |||||||
Cash Flows From Operating Activities: | |||||||||
Net income: | $554,692 | $381,019 | $316,334 | ||||||
Adjustments to reconcile net income to net cash provided by operating activities: | |||||||||
Depreciation | 165,998 | 166,340 | 164,206 | ||||||
Amortization and write-off of financing costs | 10,255 | 8,918 | 8,876 | ||||||
Amortization of deferred dry-docking and special survey costs | 13,486 | 19,782 | 23,627 | ||||||
Amortization of assumed time charter | 198 | (197) | (625) | ||||||
Amortization of hedge effectiveness excluded component from cash flow hedges | 1,286 | 4,354 | 6,084 | ||||||
Equity based payments | 7,089 | 5,850 | 8,427 | ||||||
Increase in short-term investments | (1,296) | (3,618) | (926) | ||||||
(Gain) / loss on derivative instruments, net | (2,698) | (4,801) | 38,052 | ||||||
Gain on sale of vessels, net | (126,336) | (112,220) | (3,788) | ||||||
Loss on vessels held for sale | — | 2,305 | — | ||||||
Vessels’ impairment loss | 1,691 | 434 | — | ||||||
Income from equity method investments | (2,296) | (764) | (12) | ||||||
Changes in operating assets and liabilities: | |||||||||
Accounts receivable and margin deposits | (6,150) | (36,619) | (24,272) | ||||||
Due from related parties | (3,838) | (281) | (5,070) | ||||||
Inventories | (6,674) | (32,975) | 3,610 | ||||||
Insurance claims receivable | (4,209) | (20,582) | (3,512) | ||||||
Prepayments and other | (361) | (59,088) | 8,625 | ||||||
Accounts payable | (710) | 27,896 | 2,656 | ||||||
Due to related parties | 638 | (928) | 3,661 | ||||||
Accrued liabilities | 21,903 | (12,542) | (6,054) | ||||||
Unearned revenue | (2,267) | 17,191 | (3,373) | ||||||
Other liabilities | 1,039 | 11,140 | 10,511 | ||||||
Dividend from equity method investees | 1,114 | 4,002 | — | ||||||
Dry-dockings | (38,330) | (43,233) | (24,188) | ||||||
Accrued charter revenue | (2,631) | 9,985 | 14,867 | ||||||
Net Cash provided by Operating Activities | 581,593 | 331,368 | 537,716 | ||||||
Cash Flows From Investing Activities: | |||||||||
Capital provided to equity method investments | — | (1,274) | — | ||||||
Return of capital from equity method investments | 14 | 2,927 | 544 | ||||||
Payments to acquire short-term investments | (178,718) | (199,555) | (72,064) | ||||||
Settlements of short-term investments | 60,000 | 305,695 | 71,983 | ||||||
Proceeds from the settlement of insurance claims | 2,769 | 7,763 | 11,089 | ||||||
Acquisition of a subsidiary, net of cash acquired | — | 2,796 | — | ||||||
Acquisition of non-controlling interest in subsidiary | — | — | (282) | ||||||
Issuance of investments in leaseback vessels | — | (198,832) | (99,399) | ||||||
Capital collections from vessels’ leaseback arrangements | — | 18,832 | 65,786 | ||||||
Vessel acquisition and advances/Additions to vessel cost | (61,895) | (83,494) | (181,084) | ||||||
Proceeds from the sale of vessels, net | 220,318 | 224,235 | 123,920 | ||||||
Net Cash provided by / (used in) in Investing Activities | 42,488 | 79,093 | (79,507) | ||||||
For the years ended December 31, | |||||||||
2022 | 2023 | 2024 | |||||||
Cash Flows From Financing Activities: | |||||||||
Proceeds from long-term debt and finance leases | 1,014,284 | 576,206 | 528,007 | ||||||
Repayment of long-term debt and finance leases | (984,313) | (832,168) | (841,979) | ||||||
Payment of financing costs | (20,129) | (25,149) | (3,381) | ||||||
Capital contribution from non-controlling interest to subsidiary | 3,750 | 16,163 | 376 | ||||||
Repurchase of common stock | (60,095) | (60,000) | — | ||||||
Redemption of Preferred Stock (Series E) | — | — | (114,353) | ||||||
Dividends paid | (119,548) | (71,867) | (74,147) | ||||||
Net Cash used in Financing Activities | (166,051) | (396,815) | (505,477) | ||||||
Net increase /(decrease) in cash, cash equivalents and restricted cash | 458,030 | 13,646 | (47,268) | ||||||
Cash, cash equivalents and restricted cash at beginning of the year | 353,528 | 811,558 | 825,204 | ||||||
Cash, cash equivalents and restricted cash at end of the year | $811,558 | $825,204 | $777,936 | ||||||
Supplemental Cash Information: | |||||||||
Cash paid during the year for interest | $100,699 | $152,628 | $147,070 | ||||||
Non-Cash Investing and Financing Activities: | |||||||||
Dividend reinvested in common stock of the Company | $30,231 | $16,321 | $11,256 | ||||||
Right-of-use assets obtained in exchange for operating lease obligations | $— | $440,202 | $281,629 | ||||||
For the years ended December 31, | |||||||||
2022 | 2023 | 2024 | |||||||
Reconciliation of cash, cash equivalents and restricted cash | |||||||||
Cash and cash equivalents | $718,049 | $745,544 | $704,633 | ||||||
Restricted cash – current portion | 9,768 | 10,645 | 18,145 | ||||||
Restricted cash – non-current portion | 83,741 | 69,015 | 55,158 | ||||||
Total cash, cash equivalents and restricted cash | $811,558 | $825,204 | $777,936 | ||||||
2022 | 2023 | 2024 | |||||||
A (*) | 13% | 10% | 9% | ||||||
B (*) | 18% | 9% | 6% | ||||||
C (*) | 8% | 12% | 9% | ||||||
D (**) | — | 2% | 11% | ||||||
E (**) | — | — | 10% | ||||||
Total | 39% | 33% | 45% | ||||||
(*) | Container vessels segment |
(**) | Dry bulk operating platform segment |
For the year ended December 31, 2024 | |||||||||||||||
Container vessels segment | Dry bulk vessels segment | CBI | NML | Total | |||||||||||
Voyage revenue | $864,545 | $175,646 | $809,669 | $— | $1,849,860 | ||||||||||
Intersegment voyage revenue | — | 22,062 | — | — | 22,062 | ||||||||||
Voyage revenue -related parties | — | — | 210,087 | — | 210,087 | ||||||||||
Income from investment in leaseback vessels | — | — | — | 23,947 | 23,947 | ||||||||||
Total revenues | $864,545 | $197,708 | $1,019,756 | $23,947 | $2,105,956 | ||||||||||
Reconciliation of revenue: | |||||||||||||||
Elimination of intersegment revenues | (22,062) | ||||||||||||||
Total consolidated revenues | $2,083,894 | ||||||||||||||
Less(1): | |||||||||||||||
Voyage expenses | (25,769) | (21,045) | (325,325) | — | |||||||||||
Charter-in hire expenses | — | — | (727,550) | — | |||||||||||
Voyage expenses-related parties | (12,163) | (2,429) | (6,974) | — | |||||||||||
Vessels’ operating expenses | (158,164) | (82,043) | — | — | |||||||||||
Realized losses on FFAs and bunker swaps, net | — | — | (15,554) | — | |||||||||||
Interest and finance costs | (99,483) | (22,669) | (1,934) | (10,081) | |||||||||||
Other segment items(2) | (144,166) | (43,667) | — | — | |||||||||||
Segment profit/ (loss) | $424,800 | $25,855 | $(57,581) | $13,866 | $406,940 | ||||||||||
Reconciliation of segment profit or loss: | |||||||||||||||
General and administrative expenses | (22,091) | ||||||||||||||
General and administrative expenses – related parties | (11,376) | ||||||||||||||
Management and agency fees-related parties | (59,281) | ||||||||||||||
Gain on sale of vessels, net | 3,788 | ||||||||||||||
Foreign exchange losses | (5,440) | ||||||||||||||
Elimination of intersegment expenses | 1,044 | ||||||||||||||
Interest income | 33,185 | ||||||||||||||
Income from equity method investments | 12 | ||||||||||||||
Other, net | 2,873 | ||||||||||||||
Unallocated loss on derivative instruments, net | (33,320) | ||||||||||||||
Net income | $316,334 | ||||||||||||||
(1) | The significant expense categories and amounts align with the segment-level information that is regularly provided to the CODM. Intersegment expenses are included within the amounts shown. |
(2) | Other segment items for each reportable segment include: (i) Container vessels segment – depreciation expense of the vessels and amortization of dry-docking and special survey costs and (ii) Dry bulk vessels segment - depreciation expense of the vessels and amortization of dry-docking and special survey costs. |
For the year ended December 31, 2023 | |||||||||||||||
Container vessels segment | Dry bulk vessels segment | CBI | NML | Total | |||||||||||
Voyage revenue | $839,374 | $155,892 | $507,225 | $— | $1,502,491 | ||||||||||
Intersegment voyage revenue | — | 11,902 | — | — | 11,902 | ||||||||||
Income from investment in leaseback vessels | — | — | — | 8,915 | 8,915 | ||||||||||
Total revenues | $839,374 | $167,794 | $507,225 | $8,915 | $1,523,308 | ||||||||||
Reconciliation of revenue: | |||||||||||||||
Elimination of intersegment revenues | (11,902) | ||||||||||||||
Total consolidated revenues | $1,511,406 | ||||||||||||||
Less(1): | |||||||||||||||
Voyage expenses | (12,490) | (32,201) | (231,596) | — | |||||||||||
Charter-in hire expenses | — | — | (352,397) | — | |||||||||||
Voyage expenses-related parties | (11,881) | (2,112) | — | — | |||||||||||
Vessels’ operating expenses | (161,155) | (96,933) | — | — | |||||||||||
Realized losses on FFAs and bunker swaps, net | — | — | (4,676) | — | |||||||||||
Interest and finance costs | (117,036) | (23,941) | (1,243) | (2,208) | |||||||||||
Other segment items(2) | (142,063) | (44,059) | — | — | |||||||||||
Segment profit/ (loss) | $394,749 | $(31,452) | $(82,687) | $6,707 | $287,317 | ||||||||||
Reconciliation of segment profit or loss: | |||||||||||||||
General and administrative expenses | (15,674) | ||||||||||||||
General and administrative expenses – related parties | (8,542) | ||||||||||||||
Management and agency fees-related parties | (56,254) | ||||||||||||||
Gain on sale of vessels, net | 112,220 | ||||||||||||||
Loss on vessels held for sale | (2,305) | ||||||||||||||
Vessels’ impairment loss | (434) | ||||||||||||||
Foreign exchange gains | 2,576 | ||||||||||||||
Interest income | 32,447 | ||||||||||||||
Unallocated interest and finance costs | (1) | ||||||||||||||
Income from equity method investments | 764 | ||||||||||||||
Other, net | 6,941 | ||||||||||||||
Unallocated gain on derivative instruments, net | 21,964 | ||||||||||||||
Net income | $381,019 | ||||||||||||||
(1) | The significant expense categories and amounts align with the segment-level information that is regularly provided to the CODM. Intersegment expenses are included within the amounts shown. |
(2) | Other segment items for each reportable segment include: (i) Container vessels segment – depreciation expense of the vessels and amortization of dry-docking and special survey costs and (ii) Dry bulk vessels segment - depreciation expense of the vessels and amortization of dry-docking and special survey costs. |
For the year ended December 31, 2022 | ||||||||||||
Container vessels segment | Dry bulk vessels segment | CBI | Total | |||||||||
Voyage revenue | $797,392 | $316,100 | $367 | $1,113,859 | ||||||||
Intersegment voyage revenue | — | 800 | — | 800 | ||||||||
Total revenues | $797,392 | $316,900 | $367 | $1,114,659 | ||||||||
Reconciliation of revenue: | ||||||||||||
Elimination of intersegment revenues | (800) | |||||||||||
Total consolidated revenues | $1,113,859 | |||||||||||
Less(1): | ||||||||||||
Voyage expenses | (11,323) | (37,602) | (944) | |||||||||
Voyage expenses-related parties | (11,458) | (3,960) | — | |||||||||
Vessels’ operating expenses | (169,426) | (99,805) | — | |||||||||
Interest and finance costs | (101,888) | (20,333) | (12) | |||||||||
Other segment items(2) | (138,171) | (41,313) | — | |||||||||
Segment profit/ (loss) | $365,126 | $113,887 | $(589) | $478,424 | ||||||||
Reconciliation of segment profit or loss: | ||||||||||||
General and administrative expenses | (9,737) | |||||||||||
General and administrative expenses – related parties | (9,792) | |||||||||||
Management and agency fees-related parties | (46,735) | |||||||||||
Gain on sale of vessels, net | 126,336 | |||||||||||
Vessels’ impairment loss | (1,691) | |||||||||||
Foreign exchange gains | 3,208 | |||||||||||
Interest income | 5,956 | |||||||||||
Income from equity method investments | 2,296 | |||||||||||
Other, net | 3,729 | |||||||||||
Unallocated gain on derivative instruments, net | 2,698 | |||||||||||
Net income | $554,692 | |||||||||||
(1) | The significant expense categories and amounts align with the segment-level information that is regularly provided to the CODM. Intersegment expenses are included within the amounts shown. |
(2) | Other segment items for each reportable segment include: (i) Container vessels segment – depreciation expense of the vessels and amortization of dry-docking and special survey costs and (ii) Dry bulk vessels segment - depreciation expense of the vessels and amortization of dry-docking and special survey costs. |
As of December 31, 2024 | |||||||||||||||||||||
Container vessels segment | Dry bulk vessels segment | CBI | NML | Other corporate assets(*) | Eliminations | Total | |||||||||||||||
Total Assets | $2,980,145 | $770,075 | $513,369 | $333,108 | $681,412 | $(129,422) | $5,148,687 | ||||||||||||||
As of December 31, 2023 | |||||||||||||||||||||
Container vessels segment | Dry bulk vessels segment | CBI | NML | Other corporate assets(*) | Eliminations | Total | |||||||||||||||
Total Assets | $3,153,806 | $734,817 | $455,568 | $238,667 | $707,284 | $(3,120) | $5,287,022 | ||||||||||||||
(*) | Corporate assets primarily include due from related parties balances, cash balances and short-term investments, which are not allocated to any reportable segment. |
Vessel Cost | Accumulated Depreciation | Net Book Value | |||||||
Balance, January 1, 2023 | $4,796,102 | $(1,129,241) | $3,666,861 | ||||||
Depreciation | — | (165,460) | (165,460) | ||||||
Vessel acquisitions, advances and other vessels’ costs | 88,506 | — | 88,506 | ||||||
Vessel sales, transfers and other movements | (196,884) | 53,774 | (143,110) | ||||||
Balance, December 31, 2023 | $4,687,724 | $(1,240,927) | $3,446,797 | ||||||
Depreciation | — | (162,750) | (162,750) | ||||||
Vessel acquisitions, advances and other vessels’ costs | 181,239 | — | 181,239 | ||||||
Vessel sales, transfers and other movements | (91,679) | 13,405 | (78,274) | ||||||
Balance, December 31, 2024 | $4,777,284 | $(1,390,272) | $3,387,012 | ||||||
Balance, January 1, 2023 | $55,035 | ||
Additions | 43,233 | ||
Amortization | (19,782) | ||
Write-off and other movements (Note 7) | (5,685) | ||
Balance, December 31, 2023 | $72,801 | ||
Additions | 24,188 | ||
Amortization | (23,627) | ||
Write-off and other movements (Note 7) | (1,555) | ||
Balance, December 31, 2024 | $71,807 | ||
December 31, 2023 | December 31, 2024 | |||||
Current assets | $1,386 | $ — | ||||
Non-current assets | — | — | ||||
Total assets | $1,386 | $— | ||||
Current liabilities | $123 | $— | ||||
Non-current liabilities | — | — | ||||
Total liabilities | $123 | $— | ||||
For the years ended December 31, | |||||||||
2022 | 2023 | 2024 | |||||||
Voyage revenue | $23,789 | $13,832 | $ — | ||||||
Net income | $4,686 | $1,559 | $24 | ||||||
Borrower(s) | December 31, 2023 | December 31, 2024 | ||||||||||
A. | Term Loans: | |||||||||||
1 | Singleton Shipping Co. and Tatum Shipping Co. | $— | $— | |||||||||
2 | Bastian Shipping Co. and Cadence Shipping Co. | — | — | |||||||||
3 | Adele Shipping Co. | — | — | |||||||||
4 | Costamare Inc. | — | — | |||||||||
5 | Capetanissa Maritime Corporation et al. | — | — | |||||||||
6 | Caravokyra Maritime Corporation et al. | — | — | |||||||||
7 | Berg Shipping Co. | — | — | |||||||||
8 | Evantone Shipping Co. and Fortrose Shipping Co. | — | — | |||||||||
9 | Ainsley Maritime Co. and Ambrose Maritime Co. | 120,536 | 109,821 | |||||||||
10 | Hyde Maritime Co. and Skerrett Maritime Co. | 115,904 | 104,596 | |||||||||
11 | Kemp Maritime Co. | 58,525 | 52,825 | |||||||||
12 | Achilleas Maritime Corporation et al. | 48,569 | 33,492 | |||||||||
13 | Novara et al. | — | — | |||||||||
14 | Costamare Inc. | 29,735 | — | |||||||||
15 | Costamare Inc. | — | — | |||||||||
16 | Amoroto et al. | 50,661 | — | |||||||||
17 | Bernis Marine Corp. et al. | 41,695 | — | |||||||||
18 | Costamare Inc. | — | — | |||||||||
19 | Costamare Inc. | 38,500 | 27,750 | |||||||||
Borrower(s) | December 31, 2023 | December 31, 2024 | ||||||||||
20 | Amoroto et al. | 24,240 | — | |||||||||
21 | Benedict et al. | 376,857 | 294,762 | |||||||||
22 | Reddick Shipping Co. and Verandi Shipping Co. | 33,000 | 21,000 | |||||||||
23 | Quentin Shipping Co. and Sander Shipping Co. | 74,625 | 64,250 | |||||||||
24 | Greneta Marine Corp. et al. | 26,045 | — | |||||||||
25 | Bastian Shipping Co. et al. | 260,630 | 199,390 | |||||||||
26 | Adstone Marine Corp. et al. | 101,065 | — | |||||||||
27 | NML Loan 1 | 5,995 | — | |||||||||
28 | Kalamata Shipping Corporation et al. | 64,000 | 54,000 | |||||||||
29 | Capetanissa Maritime Corporation et al. | 22,417 | 18,917 | |||||||||
30 | Costamare Inc. | 63,312 | — | |||||||||
31 | NML Loan 2 | 34,920 | 23,250 | |||||||||
32 | NML Loan 3 | 18,460 | 8,190 | |||||||||
33 | Barlestone Marine Corp. et al. | 12,000 | — | |||||||||
34 | NML Loan 4 | — | 11,628 | |||||||||
35 | NML Loan 5 | — | 4,942 | |||||||||
36 | NML Loan 6 | — | 5,510 | |||||||||
37 | NML Loan 7 | — | 9,581 | |||||||||
38 | NML Loan 8 | — | 11,196 | |||||||||
39 | NML Loan 9 | — | 10,900 | |||||||||
40 | NML Loan 10 | — | 21,392 | |||||||||
41 | Bermondi Marine Corp. et al. | — | — | |||||||||
42 | NML Loan 11 | — | 16,485 | |||||||||
43 | Adstone Marine Corp. et al. | — | 147,709 | |||||||||
44 | Silkstone Marine Corp. et al. | — | 34,611 | |||||||||
45 | Andati Marine Corp. et al. | — | 84,931 | |||||||||
46 | Archet Marine Corp. et al. | — | 72,000 | |||||||||
47 | NML Loan 12 | 5,910 | ||||||||||
48 | NML Loan 13 | — | 5,302 | |||||||||
49 | NML Loan 14 | — | 4,385 | |||||||||
50 | NML Loan 15 | — | 5,130 | |||||||||
Total Term Loans | $1,621,691 | $1,463,855 | ||||||||||
B. | Other financing arrangements | 632,892 | 584,632 | |||||||||
C. | Unsecured Bond Loan | 110,500 | — | |||||||||
Total long-term debt | $2,365,083 | $2,048,487 | ||||||||||
Less: Deferred financing costs | (18,863) | (14,418) | ||||||||||
Total long-term debt, net | $2,346,220 | $2,034,069 | ||||||||||
Less: Long-term debt current portion | (352,140) | (322,260) | ||||||||||
Add: Deferred financing costs, current portion | 5,113 | 4,395 | ||||||||||
Total long-term debt, non-current, net | $1,999,193 | $1,716,204 | ||||||||||
Year ending December 31, | Amount | ||
2025 | $322,261 | ||
2026 | 312,603 | ||
2027 | 324,666 | ||
2028 | 375,870 | ||
2029 | 408,009 | ||
2030 and thereafter | 305,078 | ||
Total | $2,048,487 | ||
Balance, January 1, 2023 | $22,913 | ||
Additions | 4,075 | ||
Amortization and write-off | (8,125) | ||
Balance, December 31, 2023 | $18,863 | ||
Additions | 3,381 | ||
Amortization and write-off | (7,826) | ||
Balance, December 31, 2024 | $14,418 | ||
Less: Current portion of financing costs | (4,395) | ||
Financing costs, non-current portion | $10,023 | ||
Year ending December 31, | Amount | ||
2025 | $24,280 | ||
Total | $24,280 | ||
Less: Discount | (403) | ||
Total finance lease liability | $23,877 | ||
December 31, 2023 | December 31, 2024 | |||||
Finance lease liabilities – current | $2,684 | $23,877 | ||||
Finance lease liabilities – non-current | 23,877 | — | ||||
Total | $26,561 | $23,877 | ||||
December 31, 2023 | December 31, 2024 | |||||
Lease receivable | $41,901 | $18,976 | ||||
Unguaranteed residual value | 201 | 506 | ||||
Net investment in sales-type lease vessels | $42,102 | $19,482 | ||||
Net investment in sales-type lease vessels, current | (22,620) | (12,748) | ||||
Net investment in sales-type lease vessels, non-current | $19,482 | $6,734 | ||||
12-month period ending December 31, | Amount | ||
2025 | $24,541 | ||
2026 | 6,038 | ||
2027 | 5,606 | ||
2028 | 1,741 | ||
Total undiscounted cash flows | $37,926 | ||
Present value of lease payments* | $18,976 | ||
* | The difference between the present value of the lease payments and the net investment in the lease balance in the balance sheet is due to the vessels unguaranteed residual value, which is included in the net investment in the lease balance but is not included in the future lease payments. |
12-month period ending December 31, | Amount | ||
2025 | $218,690 | ||
2026 | 98,693 | ||
2027 | 384 | ||
Total | $317,767 | ||
Discount based on incremental borrowing rate | (25,171) | ||
Operating lease liabilities, including current portion | $292,596 | ||
12-month period ending December 31, | Amount | ||
2025 | $(4,936) | ||
2026 | (8,433) | ||
2027 | (2,403) | ||
2028 | (956) | ||
2029 | (140) | ||
Total | $(16,868) | ||
December 31, 2023 | December 31, 2024 | |||||
Hires collected in advance | $34,258 | $30,884 | ||||
Charter revenue resulting from varying charter rates | 44,331 | 31,485 | ||||
Unamortized balance of charters assumed | 940 | 64 | ||||
Total | $79,529 | $62,433 | ||||
Less current portion | (52,177) | (47,813) | ||||
Non-current portion | $27,352 | $14,620 | ||||
12-month period ending December 31, | Amount | ||
2025 | $1,101,742 | ||
2026 | 624,220 | ||
2027 | 465,478 | ||
2028 | 339,193 | ||
2029 | 193,996 | ||
2030 and thereafter | 138,426 | ||
Total | $2,863,055 | ||
Temporary equity – Redeemable non-controlling interest in subsidiary | Amount | ||
Balance, December 31, 2022 | $3,487 | ||
Capital increase in non-controlling interest | 3,750 | ||
Net loss attributable to redeemable non-controlling interest | (6,608) | ||
Balance, December 31, 2023 | $629 | ||
Net loss attributable to redeemable non-controlling interest | (6,839) | ||
Transfer to Additional Paid-In Capital due to purchase of non-controlling interest | 3,757 | ||
Balance, December 31, 2024 | $(2,453) | ||
For the year ended December 31, | |||||||||
2022 | 2023 | 2024 | |||||||
Basic EPS | Basic EPS | Basic EPS | |||||||
Net income | $554,692 | $381,019 | $316,334 | ||||||
Less: Net loss attributable to non-controlling interest in subsidiaries | 263 | 4,730 | 3,585 | ||||||
Net income attributable to Costamare Inc. | 554,955 | 385,749 | 319,919 | ||||||
Less: paid and accrued earnings allocated to Preferred Stock | (31,068) | (31,068) | (23,796) | ||||||
Less: deemed dividend in redemption of Series E Preferred Stock | — | — | (5,446) | ||||||
Net income available to common stockholders | $523,887 | $354,681 | $290,677 | ||||||
Weighted average number of common shares, basic and diluted | 122,964,358 | 120,299,172 | 119,299,405 | ||||||
Earnings per common share, basic and diluted | $4.26 | $2.95 | $2.44 | ||||||
For the year ended December 31, 2024 | ||||||||||||
Container vessels segment | Dry bulk vessels segment | CBI | Total | |||||||||
Time charters | $864,545 | $175,646 | $87,400 | $1,127,591 | ||||||||
Voyage charters and Contracts of Affreightment | — | — | 722,269 | 722,269 | ||||||||
Voyage charters – related parties (Note 3(d)) | — | — | 210,087 | 210,087 | ||||||||
Total | $864,545 | $175,646 | $1,019,756 | $2,059,947 | ||||||||
For the year ended December 31, 2023 | ||||||||||||
Container vessels segment | Dry bulk vessels segment | CBI | Total | |||||||||
Time charters | $839,374 | $151,137 | $77,683 | $1,068,194 | ||||||||
Voyage charters and Contracts of Affreightment | — | 4,755 | 429,542 | 434,297 | ||||||||
Total | $839,374 | $155,892 | $507,225 | $1,502,491 | ||||||||
For the year ended December 31, 2022 | ||||||||||||
Container vessels segment | Dry bulk vessels segment | CBI | Total | |||||||||
Time charters | $797,392 | $313,276 | $— | $1,110,668 | ||||||||
Voyage charters and Contracts of Affreightment | — | 2,824 | 367 | 3,191 | ||||||||
Total | $797,392 | $316,100 | $367 | $1,113,859 | ||||||||
For the year ended December 31, | |||||||||
2022 | 2023 | 2024 | |||||||
Interest expense | $107,205 | $152,123 | $139,957 | ||||||
Derivatives’ effect | (483) | (22,876) | (23,254) | ||||||
Amortization and write-off of financing costs | 10,255 | 8,125 | 7,826 | ||||||
Amortization of excluded component related to cash flow hedges | 1,286 | 4,354 | 6,084 | ||||||
Bank charges and other financing costs | 3,970 | 2,703 | 2,510 | ||||||
Total | $122,233 | $144,429 | $133,123 | ||||||
Effective date | Termination date | Notional amount (Non-amortizing) on effective date in Euro | Notional amount (Non-amortizing) on effective date in USD | Fixed rate (Costamare receives in Euro) | Fixed rate (Costamare pays in USD) | Fair value December 31, 2024 (in USD) | ||||||||||||
21/5/2021 | 21/11/2025 | €50,000 | $61,175 | 2.70% | 4.10% | $(9,310) | ||||||||||||
25/5/2021 | 21/11/2025 | €50,000 | $61,200 | 2.70% | 4.05% | $(9,077) | ||||||||||||
Total fair value | $(18,387) | |||||||||||||||||
December 31, 2024 | ||||||
Derivatives Assets-Current | Derivatives Assets-Non- Current | |||||
FFAs* | $8,590 | $120 | ||||
Bunker swaps | 37 | — | ||||
Bunker swaps* | 304 | — | ||||
Interest rate swaps | 5,684 | 14,846 | ||||
Interest rate caps | 4,726 | 6,389 | ||||
EUA Futures | 160 | 147 | ||||
Total gross derivative contracts | $19,501 | $21,502 | ||||
Amounts offset | ||||||
Counterparty netting* | (8,894) | (120) | ||||
Total derivative assets, December 31, 2024 | $10,607 | $21,382 | ||||
Derivatives Liabilities- Current | Derivatives Liabilities-Non Current | |||||
FFAs* | $(22,653) | $(5,212) | ||||
Bunker swaps | (308) | (15) | ||||
Bunker swaps* | (398) | (67) | ||||
Cross-currency rate swaps | (18,387) | — | ||||
Forward currency contracts | (1,369) | — | ||||
Total gross derivative contracts | $(43,115) | $(5,294) | ||||
Amounts offset | ||||||
Counterparty netting* | 8,894 | 120 | ||||
Total derivative liabilities, December 31, 2024 | $(34,221) | $(5,174) | ||||
* | The Company has adopted net presentation for assets and liabilities related to FFA derivative instruments and bunker swaps. |
December 31, 2023 | ||||||
Derivatives Assets-Current | Derivatives Assets-Non- Current | |||||
FFAs* | $30,404 | $2,758 | ||||
Bunker swaps | 101 | — | ||||
Interest rate swaps | 7,827 | 12,864 | ||||
Interest rate caps | 14,716 | 11,701 | ||||
Forward currency contracts | 1,873 | 1,656 | ||||
Total gross derivative contracts | $54,921 | $28,979 | ||||
Amounts offset | ||||||
Counterparty netting* | (21,611) | (340) | ||||
Total derivative assets, December 31, 2023 | $33,310 | $28,639 | ||||
Derivatives Liabilities- Current | Derivatives Liabilities-Non- Current | |||||
FFAs* | $(21,611) | $(340) | ||||
Bunker swaps | (912) | (1,699) | ||||
Cross-currency rate swaps | (2,138) | (9,495) | ||||
Total gross derivative contracts | $(24,661) | $(11,534) | ||||
Amounts offset | ||||||
Counterparty netting* | 21,611 | 340 | ||||
Total derivative liabilities, December 31, 2023 | $(3,050) | $(11,194) | ||||
* | The Company has adopted net presentation for assets and liabilities related to FFA derivative instruments. |
The Effect of Derivative Instruments for the years ended December 31, 2022, 2023 and 2024 | |||||||||
Derivatives in ASC 815 Cash Flow Hedging Relationships | |||||||||
Amount of Gain / (Loss) Recognized in OCI on Derivative | |||||||||
2022 | 2023 | 2024 | |||||||
Interest rate swaps and cross-currency swaps | $36,591 | $3,385 | $24,337 | ||||||
Interest rate caps (included component) | 4,495 | 6,629 | (4,564) | ||||||
Interest rate caps (excluded component)(1) | 6,700 | (16,589) | (6,708) | ||||||
Reclassification to Interest and finance costs | (483) | (22,876) | (23,254) | ||||||
Reclassification of amount excluded from the interest rate caps assessment of hedge effectiveness based on an amortization approach to Interest and finance costs | 1,286 | 4,354 | 6,084 | ||||||
Amounts reclassified from Net settlements on interest rate swaps qualifying for hedge accounting to Depreciation | 63 | 63 | 63 | ||||||
Total | $48,652 | $(25,034) | $(4,042) | ||||||
(1) | Excluded component represents interest rate caps instruments time value. |
Derivatives Not Designated as Hedging Instruments under ASC 815 | ||||||||||||
Location of Gain / (Loss) Recognized in Gain / (Loss) on derivative instruments, net | Amount of Gain / (Loss) Recognized in Gain / (Loss) on derivative instruments, net | |||||||||||
2022 | 2023 | 2024 | ||||||||||
Interest rate swaps / caps and cross-currency swaps | Gain / (loss) on derivative instruments, net | $(182) | $12,207 | $(393) | ||||||||
Forward Freight Agreements | Gain / (loss) on derivative instruments, net | 108 | 5,420 | (47,684) | ||||||||
Bunker swap agreements | Gain / (loss) on derivative instruments, net | (12) | (1,490) | 3,825 | ||||||||
EUA futures | Gain / (loss) on derivative instruments, net | — | — | 276 | ||||||||
Forward currency contracts | Gain / (loss) on derivative instruments, net | 2,784 | 1,151 | (4,898) | ||||||||
Total | $2,698 | $17,288 | $(48,874) | |||||||||
December 31, 2023 | Quoted Prices in Active Markets for Identical Assets (Level 1) | Significant Other Observable Inputs (Level 2) | Unobservable Inputs (Level 3) | |||||||||
Recurring measurements: | ||||||||||||
Forward currency contracts-asset position | $3,529 | $ — | $3,529 | $ — | ||||||||
Forward Freight Agreements-asset position | 11,210 | — | 11,210 | — | ||||||||
Bunker swap agreements-liability position | (2,509) | — | (2,509) | — | ||||||||
Interest rate swaps-asset position | 20,691 | — | 20,691 | — | ||||||||
Interest rate caps-asset position | 26,417 | — | 26,417 | — | ||||||||
Cross-currency rate swaps-liability position | (11,633) | — | (11,633) | — | ||||||||
Total | $47,705 | $— | $47,705 | $— | ||||||||
December 31, 2024 | Quoted Prices in Active Markets for Identical Assets (Level 1) | Significant Other Observable Inputs (Level 2) | Unobservable Inputs (Level 3) | |||||||||
Recurring measurements: | ||||||||||||
Forward currency contracts-liability position | $(1,369) | $ — | $(1,369) | $ — | ||||||||
Forward Freight Agreements-liability position | (19,155) | — | (19,155) | — | ||||||||
EUA futures-asset position | 307 | — | 307 | — | ||||||||
Bunker swap agreements-asset position | 37 | — | 37 | — | ||||||||
Bunker swap agreements-liability position | (484) | — | (484) | — | ||||||||
Interest rate swaps-asset position | 20,530 | — | 20,530 | — | ||||||||
Interest rate caps-asset position | 11,115 | — | 11,115 | — | ||||||||
Cross-currency rate swaps-liability position | (18,387) | — | (18,387) | — | ||||||||
Total | $(7,406) | $— | $(7,406) | $— | ||||||||
December 31, 2023 | Quoted Prices in Active Markets for Identical Assets (Level 1) | Significant Other Observable Inputs (Level 2) | Unobservable Inputs (Level 3) | |||||||||
Non-Recurring measurements: | ||||||||||||
Vessels | $10,250 | $ — | $10,250 | $ — | ||||||||
Total | $10,250 | $— | $10,250 | $— | ||||||||
(a) | Declaration and payment of dividends (common stock): On January 2, 2025, the Company declared a dividend of $0.115 per share on the common stock, which was paid on February 6, 2025, to holders of record of common stock as of January 21, 2025. |
(b) | Declaration and payment of dividends (preferred stock Series B, Series C and Series D): On January 2, 2025, the Company declared a dividend of $0.476563 per share on the Series B Preferred Stock, $0.531250 per share on the Series C Preferred Stock and $0.546875 per share on the Series D Preferred Stock, which were all paid on January 15, 2025 to holders of record as of January 14, 2025. |
(c) | Investment in leaseback vessels: In January 2025, NML signed a commitment letter, subject to final documentation, with a shipowner (seller) to acquire three offshore support vessels, under which the vessels will be chartered back to the seller under bareboat charter agreements, for an amount of up to $24,490. |
(d) |