Shareholder Report
|
12 Months Ended |
|
May 31, 2025
USD ($)
Holding
|
|---|
| Shareholder Report [Line Items] |
|
|
| Document Type |
N-CSR
|
|
| Amendment Flag |
false
|
|
| Registrant Name |
SEI INSTITUTIONAL INVESTMENTS TRUST
|
|
| Entity Central Index Key |
0000939934
|
|
| Entity Investment Company Type |
N-1A
|
|
| Document Period End Date |
May 31, 2025
|
|
| C000018356 |
|
|
| Shareholder Report [Line Items] |
|
|
| Fund Name |
Large Cap Fund
|
|
| Class Name |
Class A
|
|
| Trading Symbol |
SLCAX
|
|
| Annual or Semi-Annual Statement [Text Block] |
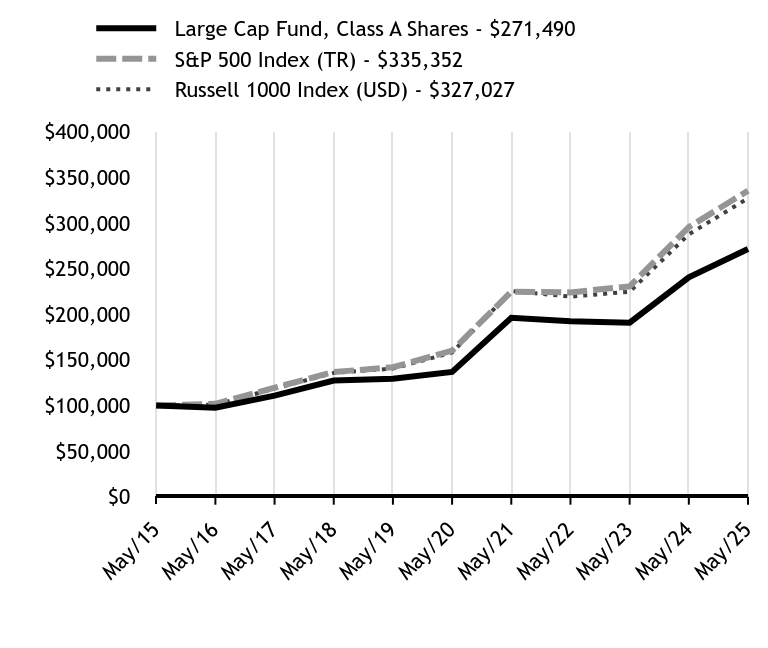
This annual shareholder report contains important information about Class A Shares of the Large Cap Fund (the "Fund") for the period from June 1, 2024 to May 31, 2025.
|
|
| Shareholder Report Annual or Semi-Annual |
Annual Shareholder Report
|
|
| Additional Information [Text Block] |
You can find additional information about the Fund at https://www.seic.com/mutual-fund-documentation/prospectuses-and-reports. You can also request this information by contacting us at 1-800-DIAL-SEI.
|
|
| Additional Information Phone Number |
1-800-DIAL-SEI
|
|
| Additional Information Website |
https://www.seic.com/mutual-fund-documentation/prospectuses-and-reports
|
|
| Expenses [Text Block] |
What were the Fund costs for the last year?(based on a hypothetical $10,000 investment) Fund Name | Costs of a $10,000 investment | Costs paid as a percentage of a $10,000 investment |
|---|
Large Cap Fund, Class A Shares | $19 | 0.18% |
|---|
|
|
| Expenses Paid, Amount |
$ 19
|
|
| Expense Ratio, Percent |
0.18%
|
|
| Factors Affecting Performance [Text Block] |
How did the Fund perform in the last year?The Fund underperformed its benchmark, the Russell 1000 Index (USD)—which tracks the performance of 1000 of the largest U.S. equity securities based on market capitalization—for the 12-month period ending May 31, 2025. Fund performance was hampered by its value tilt and preference for companies with consistent free cash flow. This resulted in underweight allocations to several strong-performing stocks within the consumer discretionary sector, particularly within the automobile industry. The Fund’s gains were concentrated in the financials and communication services sectors. Among Fund managers, Cullen Capital Management LLC’s performance lagged the Russell 1000 Index (USD) due to its value style, its dividend orientation, and its underweight allocation to the consumer discretionary sector. LSV Asset Management underperformed due to its value orientation and underweight allocations to growth stocks including those in the information technology and consumer discretionary sectors. Copeland Capital Management, LLC lagged due to its dividend orientation, an underweight to communication services, and security selection within the consumer discretionary sector. Acadian Asset Management LLC’s outperformance was attributable to its momentum orientation, an underweight to the healthcare sector, and favorable security selection within healthcare and communication services. Fred Alger Management, LLC benefited from its momentum orientation and favorable security selection within the information technology sector. During the portion of the year in which Mar Vista Investment Partners, LLC (“Mar Vista”) was a Fund sub-adviser, its performance lagged the benchmark due to the lack of exposure to the automobile industry and security selection within the information technology and industrials sectors. During the portion of the year in which PineStone Asset Management, Inc. (“PineStone”) was a Fund manager, its performance was in line with the benchmark as its favorable security selection within the financials and consumer discretionary sectors was offset by negative security selection within healthcare. |
|
| Performance Past Does Not Indicate Future [Text] |
Past performance is not indicative of future performance.
|
|
| Line Graph [Table Text Block] |
| Large Cap Fund, Class A Shares - $271490 | S&P 500 Index (TR) - $335352 | Russell 1000 Index (USD) - $327027 |
|---|
May/15 | $100000 | $100000 | $100000 |
|---|
May/16 | $97587 | $101716 | $100776 |
|---|
May/17 | $110705 | $119484 | $118388 |
|---|
May/18 | $127315 | $136671 | $135668 |
|---|
May/19 | $129214 | $141841 | $140371 |
|---|
May/20 | $136682 | $160050 | $157970 |
|---|
May/21 | $195993 | $224579 | $225363 |
|---|
May/22 | $192146 | $223907 | $219261 |
|---|
May/23 | $190733 | $230448 | $224627 |
|---|
May/24 | $240418 | $295404 | $287539 |
|---|
May/25 | $271490 | $335352 | $327027 |
|---|
|
|
| Average Annual Return [Table Text Block] |
Fund/Index Name | 1 Year | 5 Years | 10 Years |
|---|
Large Cap Fund, Class A Shares | 12.92% | 14.71% | 10.50% |
|---|
S&P 500 Index (TR) | 13.52% | 15.94% | 12.86% |
|---|
Russell 1000 Index (USD) | 13.73% | 15.66% | 12.58% |
|---|
|
|
| No Deduction of Taxes [Text Block] |
The table and graph presented above do not reflect the deduction of taxes a shareholder would pay on Fund distributions or the redemption of Fund Shares.
|
|
| AssetsNet |
$ 803,516,000
|
|
| Holdings Count | Holding |
391
|
|
| Advisory Fees Paid, Amount |
$ 1,320
|
|
| InvestmentCompanyPortfolioTurnover |
85.00%
|
|
| Additional Fund Statistics [Text Block] |
Key Fund Statistics as of May 31, 2025 | Total Net Assets (000's) | Number of Holdings | Total Advisory Fees Paid (000's) | Portfolio Turnover Rate |
|---|
| $803,516 | 391 | $1,320 | 85% |
|---|
|
|
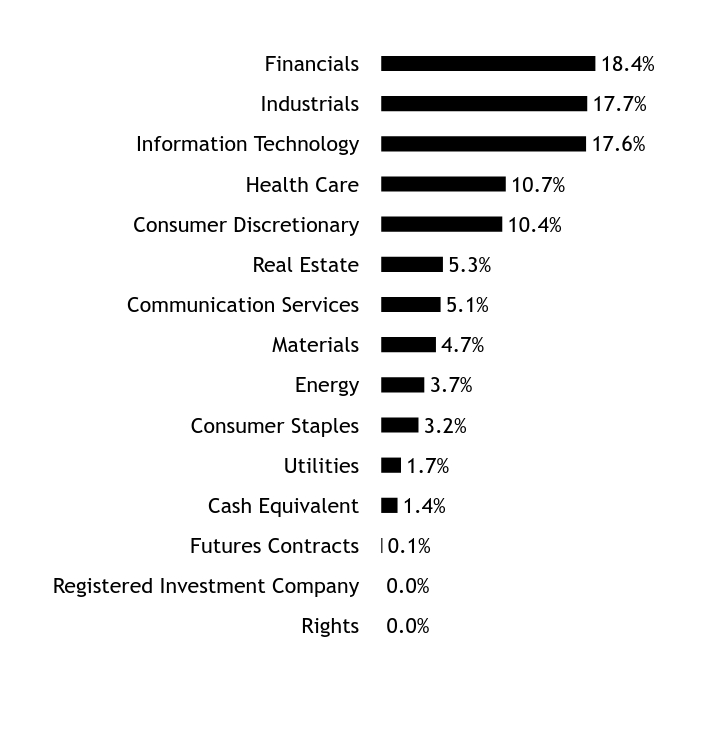
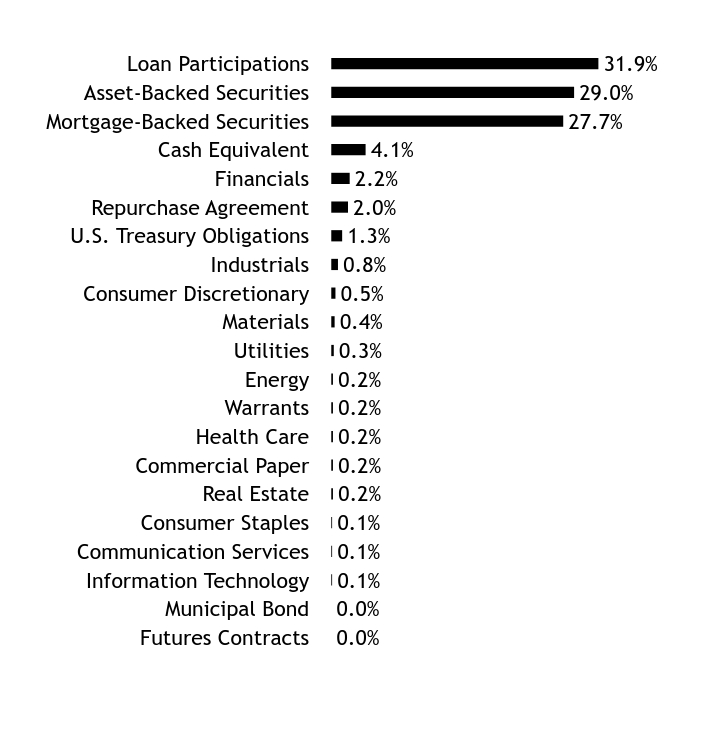
| Holdings [Text Block] |
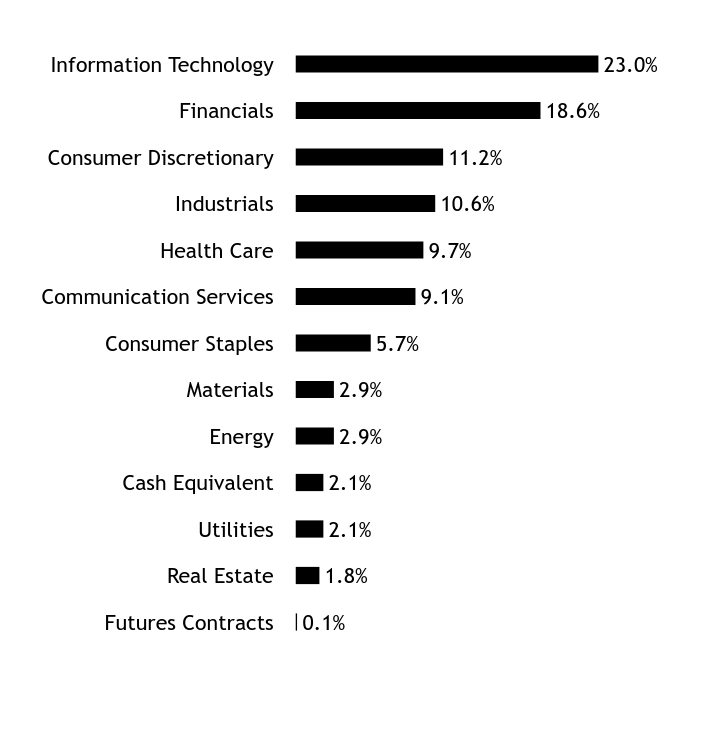
Asset/Sector WeightingsFootnote Reference*Value | Value |
|---|
Futures Contracts | 0.1% | Real Estate | 1.8% | Utilities | 2.1% | Cash Equivalent | 2.1% | Energy | 2.9% | Materials | 2.9% | Consumer Staples | 5.7% | Communication Services | 9.1% | Health Care | 9.7% | Industrials | 10.6% | Consumer Discretionary | 11.2% | Financials | 18.6% | Information Technology | 23.0% |
| Footnote | Description | Footnote* | Percentages are calculated based on total net assets. |
|
|
| Largest Holdings [Text Block] |
Holding Name | | | Percentage of
Total Net AssetsFootnote Reference(A) |
|---|
Microsoft Corp | | | 5.2% | NVIDIA Corp | | | 2.8% | Broadcom Inc | | | 2.1% | Meta Platforms Inc, Cl A | | | 2.0% | Apple Inc | | | 1.9% | Amazon.com Inc | | | 1.9% | Alphabet Inc, Cl A | | | 1.7% | Visa Inc, Cl A | | | 1.4% | Johnson & Johnson | | | 1.3% | JPMorgan Chase & Co | | | 1.3% |
| Footnote | Description | Footnote(A) | Cash Equivalents are not shown in the top ten chart. |
|
|
| Material Fund Change [Text Block] |
PineStone replaced Mar Vista as a Fund sub-adviser in January 2025. |
|
| C000018358 |
|
|
| Shareholder Report [Line Items] |
|
|
| Fund Name |
Large Cap Disciplined Equity Fund
|
|
| Class Name |
Class A
|
|
| Trading Symbol |
SCPAX
|
|
| Annual or Semi-Annual Statement [Text Block] |
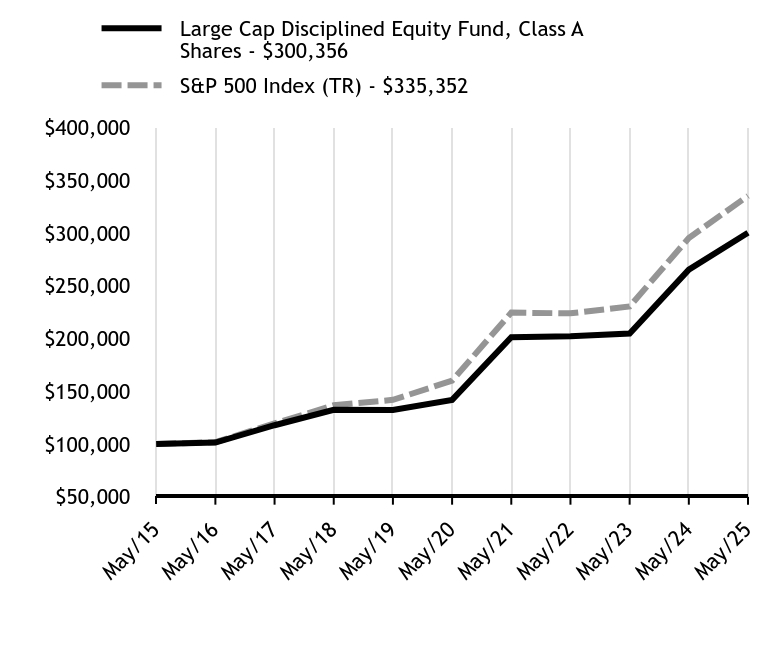
This annual shareholder report contains important information about Class A Shares of the Large Cap Disciplined Equity Fund (the "Fund") for the period from June 1, 2024 to May 31, 2025.
|
|
| Shareholder Report Annual or Semi-Annual |
Annual Shareholder Report
|
|
| Additional Information [Text Block] |
You can find additional information about the Fund at https://www.seic.com/mutual-fund-documentation/prospectuses-and-reports. You can also request this information by contacting us at 1-800-DIAL-SEI.
|
|
| Additional Information Phone Number |
1-800-DIAL-SEI
|
|
| Additional Information Website |
https://www.seic.com/mutual-fund-documentation/prospectuses-and-reports
|
|
| Expenses [Text Block] |
What were the Fund costs for the last year?(based on a hypothetical $10,000 investment) Fund Name | Costs of a $10,000 investment | Costs paid as a percentage of a $10,000 investment |
|---|
Large Cap Disciplined Equity Fund, Class A Shares | $19 | 0.18% |
|---|
|
|
| Expenses Paid, Amount |
$ 19
|
|
| Expense Ratio, Percent |
0.18%
|
|
| Factors Affecting Performance [Text Block] |
How did the Fund perform in the last year?The Fund modestly underperformed its primary benchmark, the S&P 500 Index (TR)—a capitalization-weighted index consisting of roughly 500 large U.S. companies that are considered representative of the broad U.S. stock market—for the 12-month period ending May 31, 2025. The Fund’s value tilt and underweight allocation to mega-cap technology stocks served as headwinds to performance, particularly in the first half of the reporting period. Fund performance was enhanced by its overweight to the financials sector and favorable stock selection in healthcare, while stock selection in the consumer discretionary sector was a detractor. Among Fund sub-advisers, Acadian Asset Management LLC outperformed the benchmark S&P 500 Index (TR) due to its momentum (in which investors buy stocks that have shown recent price gains and sell stocks that have recently declined) orientation, an underweight allocation to the healthcare sector, and favorable security selection in the healthcare and communication services sectors. Copeland Capital Management, LLC slightly lagged the benchmark due to its dividend growth orientation, underweight to the communication services sector, and unfavorable stock selection in the consumer discretionary sector. These negative effects were partially offset by favorable stock selection in the information technology sector. Mackenzie Investments Corporation slightly underperformed due to its value tilt and unfavorable stock selection in the energy and information technology sectors. These negative effects were partially counterbalanced by favorable stock selection in the consumer staples and healthcare sectors. Brandywine Global Investment Management, LLC lagged the benchmark due to its significant value bias and underweights to the information technology and consumer discretionary sectors. PineStone Asset Management LLC’s (“PineStone”) performance was in line with that of the benchmark as positive security selection in the financials and consumer discretionary sectors was offset by adverse security selection effects in healthcare. |
|
| Performance Past Does Not Indicate Future [Text] |
Past performance is not indicative of future performance.
|
|
| Line Graph [Table Text Block] |
| Large Cap Disciplined Equity Fund, Class A Shares - $300356 | S&P 500 Index (TR) - $335352 |
|---|
May/15 | $100000 | $100000 |
|---|
May/16 | $101340 | $101716 |
|---|
May/17 | $117785 | $119484 |
|---|
May/18 | $132424 | $136671 |
|---|
May/19 | $132236 | $141841 |
|---|
May/20 | $141792 | $160050 |
|---|
May/21 | $201344 | $224579 |
|---|
May/22 | $202120 | $223907 |
|---|
May/23 | $204690 | $230448 |
|---|
May/24 | $265375 | $295404 |
|---|
May/25 | $300356 | $335352 |
|---|
|
|
| Average Annual Return [Table Text Block] |
Fund/Index Name | 1 Year | 5 Years | 10 Years |
|---|
Large Cap Disciplined Equity Fund, Class A Shares | 13.18% | 16.20% | 11.63% |
|---|
S&P 500 Index (TR) | 13.52% | 15.94% | 12.86% |
|---|
|
|
| No Deduction of Taxes [Text Block] |
The table and graph presented above do not reflect the deduction of taxes a shareholder would pay on Fund distributions or the redemption of Fund Shares.
|
|
| AssetsNet |
$ 1,318,047,000
|
|
| Holdings Count | Holding |
333
|
|
| Advisory Fees Paid, Amount |
$ 2,042
|
|
| InvestmentCompanyPortfolioTurnover |
113.00%
|
|
| Additional Fund Statistics [Text Block] |
Key Fund Statistics as of May 31, 2025 | Total Net Assets (000's) | Number of Holdings | Total Advisory Fees Paid (000's) | Portfolio Turnover Rate |
|---|
| $1,318,047 | 333 | $2,042 | 113% |
|---|
|
|
| Holdings [Text Block] |
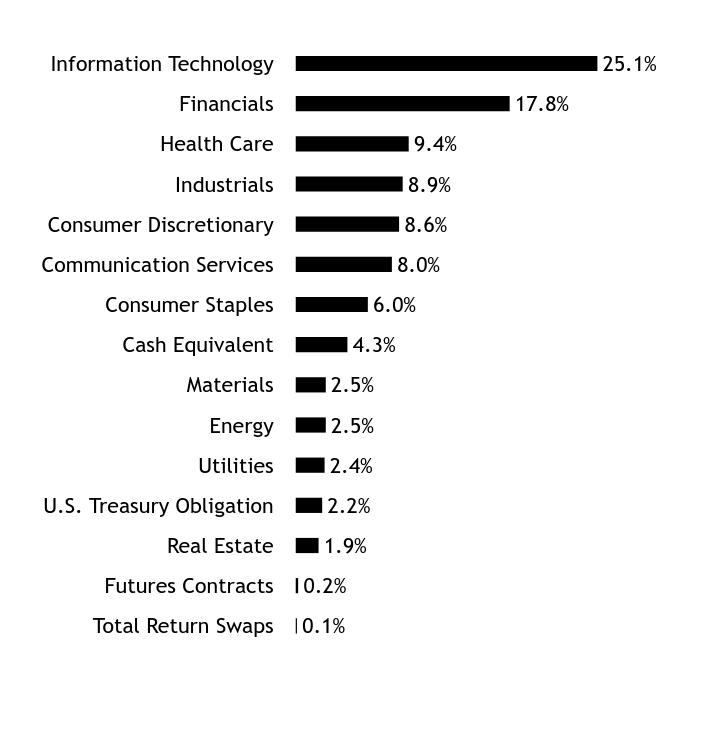
Asset/Sector WeightingsFootnote Reference*Value | Value |
|---|
Total Return Swaps | 0.1% | Futures Contracts | 0.2% | Real Estate | 1.9% | U.S. Treasury Obligation | 2.2% | Utilities | 2.4% | Energy | 2.5% | Materials | 2.5% | Cash Equivalent | 4.3% | Consumer Staples | 6.0% | Communication Services | 8.0% | Consumer Discretionary | 8.6% | Industrials | 8.9% | Health Care | 9.4% | Financials | 17.8% | Information Technology | 25.1% |
| Footnote | Description | Footnote* | Percentages are calculated based on total net assets. |
|
|
| Largest Holdings [Text Block] |
Holding Name | | | Percentage of
Total Net AssetsFootnote Reference(A) |
|---|
Microsoft Corp | | | 5.4% | Apple Inc | | | 4.1% | Meta Platforms Inc, Cl A | | | 2.5% | NVIDIA Corp | | | 2.4% | U.S. Treasury Bill, 4.29%, 8/21/2025 | | | 2.2% | JPMorgan Chase & Co | | | 1.8% | Broadcom Inc | | | 1.7% | Amazon.com Inc | | | 1.6% | Visa Inc, Cl A | | | 1.4% | Alphabet Inc, Cl A | | | 1.4% |
| Footnote | Description | Footnote(A) | Cash Equivalents are not shown in the top ten chart. |
|
|
| Material Fund Change [Text Block] |
PineStone was hired as a Fund manager in December 2024. |
|
| C000018357 |
|
|
| Shareholder Report [Line Items] |
|
|
| Fund Name |
Large Cap Index Fund
|
|
| Class Name |
Class A
|
|
| Trading Symbol |
LCIAX
|
|
| Annual or Semi-Annual Statement [Text Block] |
This annual shareholder report contains important information about Class A Shares of the Large Cap Index Fund (the "Fund") for the period from June 1, 2024 to May 31, 2025.
|
|
| Shareholder Report Annual or Semi-Annual |
Annual Shareholder Report
|
|
| Additional Information [Text Block] |
You can find additional information about the Fund at https://www.seic.com/mutual-fund-documentation/prospectuses-and-reports. You can also request this information by contacting us at 1-800-DIAL-SEI.
|
|
| Additional Information Phone Number |
1-800-DIAL-SEI
|
|
| Additional Information Website |
https://www.seic.com/mutual-fund-documentation/prospectuses-and-reports
|
|
| Expenses [Text Block] |
What were the Fund costs for the last year?(based on a hypothetical $10,000 investment) Fund Name | Costs of a $10,000 investment | Costs paid as a percentage of a $10,000 investment |
|---|
Large Cap Index Fund, Class A Shares | $4 | 0.04% |
|---|
|
|
| Expenses Paid, Amount |
$ 4
|
|
| Expense Ratio, Percent |
0.04%
|
|
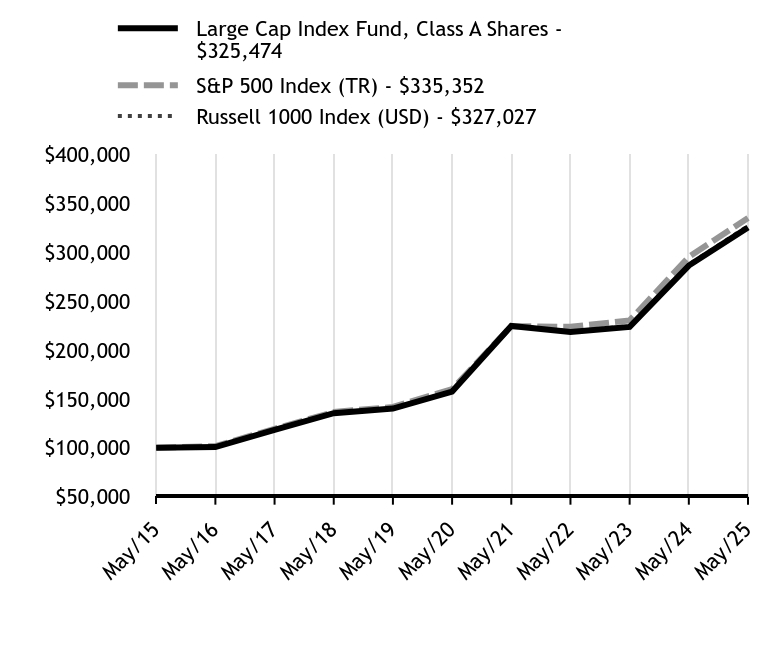
| Factors Affecting Performance [Text Block] |
How did the Fund perform in the last year?The Fund’s benchmark, the Russell 1000 Index (USD)—which is used to measure the performance of the U.S. large-cap equity market—returned 13.73% for the 12-month period ending May 31, 2025. During the reporting period, the Fund achieved its objective of tracking the performance of the Russell 1000 Index (USD). |
|
| Performance Past Does Not Indicate Future [Text] |
Past performance is not indicative of future performance.
|
|
| Line Graph [Table Text Block] |
| Large Cap Index Fund, Class A Shares - $325474 | S&P 500 Index (TR) - $335352 | Russell 1000 Index (USD) - $327027 |
|---|
May/15 | $100000 | $100000 | $100000 |
|---|
May/16 | $100760 | $101716 | $100776 |
|---|
May/17 | $118329 | $119484 | $118388 |
|---|
May/18 | $135526 | $136671 | $135668 |
|---|
May/19 | $140175 | $141841 | $140371 |
|---|
May/20 | $157662 | $160050 | $157970 |
|---|
May/21 | $224776 | $224579 | $225363 |
|---|
May/22 | $218618 | $223907 | $219261 |
|---|
May/23 | $223835 | $230448 | $224627 |
|---|
May/24 | $286573 | $295404 | $287539 |
|---|
May/25 | $325474 | $335352 | $327027 |
|---|
|
|
| Average Annual Return [Table Text Block] |
Fund/Index Name | 1 Year | 5 Years | 10 Years |
|---|
Large Cap Index Fund, Class A Shares | 13.57% | 15.60% | 12.53% |
|---|
S&P 500 Index (TR) | 13.52% | 15.94% | 12.86% |
|---|
Russell 1000 Index (USD) | 13.73% | 15.66% | 12.58% |
|---|
|
|
| No Deduction of Taxes [Text Block] |
The table and graph presented above do not reflect the deduction of taxes a shareholder would pay on Fund distributions or the redemption of Fund Shares.
|
|
| AssetsNet |
$ 1,952,244,000
|
|
| Holdings Count | Holding |
1,004
|
|
| Advisory Fees Paid, Amount |
$ 183
|
|
| InvestmentCompanyPortfolioTurnover |
16.00%
|
|
| Additional Fund Statistics [Text Block] |
Key Fund Statistics as of May 31, 2025 | Total Net Assets (000's) | Number of Holdings | Total Advisory Fees Paid (000's) | Portfolio Turnover Rate |
|---|
| $1,952,244 | 1,004 | $183 | 16% |
|---|
|
|
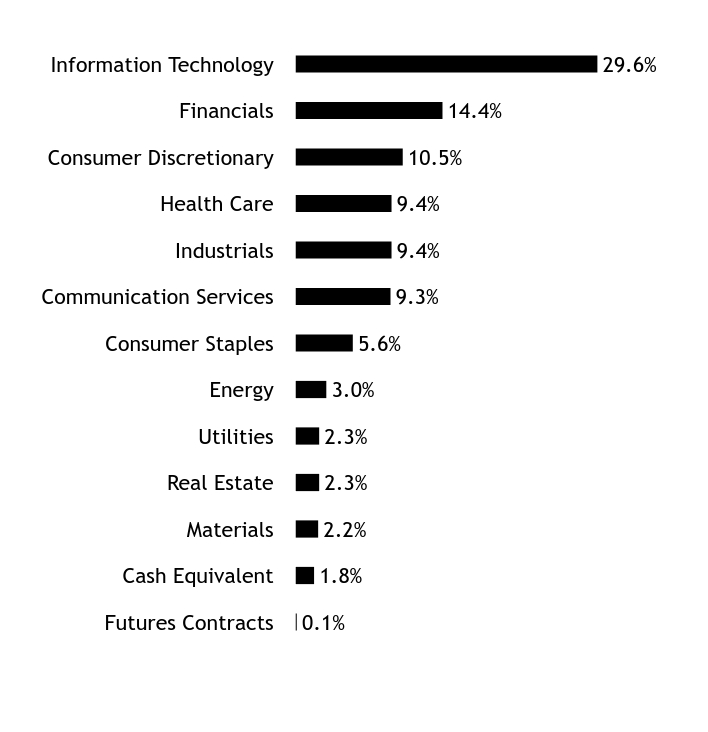
| Holdings [Text Block] |
Asset/Sector WeightingsFootnote Reference*Value | Value |
|---|
Futures Contracts | 0.1% | Cash Equivalent | 1.8% | Materials | 2.2% | Real Estate | 2.3% | Utilities | 2.3% | Energy | 3.0% | Consumer Staples | 5.6% | Communication Services | 9.3% | Industrials | 9.4% | Health Care | 9.4% | Consumer Discretionary | 10.5% | Financials | 14.4% | Information Technology | 29.6% |
| Footnote | Description | Footnote* | Percentages are calculated based on total net assets. |
|
|
| Largest Holdings [Text Block] |
Holding Name | | | Percentage of
Total Net AssetsFootnote Reference(A) |
|---|
Microsoft Corp | | | 6.2% | NVIDIA Corp | | | 5.7% | Apple Inc | | | 5.3% | Amazon.com Inc | | | 3.5% | Meta Platforms Inc, Cl A | | | 2.6% | Broadcom Inc | | | 2.0% | Alphabet Inc, Cl A | | | 1.8% | Tesla Inc | | | 1.7% | Berkshire Hathaway Inc, Cl B | | | 1.7% | Alphabet Inc, Cl C | | | 1.5% |
| Footnote | Description | Footnote(A) | Cash Equivalents are not shown in the top ten chart. |
|
|
| Material Fund Change [Text Block] |
There were no material fund changes during the reporting period. |
|
| C000134335 |
|
|
| Shareholder Report [Line Items] |
|
|
| Fund Name |
S&P 500 Index Fund
|
|
| Class Name |
Class A
|
|
| Trading Symbol |
SPINX
|
|
| Annual or Semi-Annual Statement [Text Block] |
This annual shareholder report contains important information about Class A Shares of the S&P 500 Index Fund (the "Fund") for the period from June 1, 2024 to May 31, 2025.
|
|
| Shareholder Report Annual or Semi-Annual |
Annual Shareholder Report
|
|
| Additional Information [Text Block] |
You can find additional information about the Fund at https://www.seic.com/mutual-fund-documentation/prospectuses-and-reports. You can also request this information by contacting us at 1-800-DIAL-SEI.
|
|
| Additional Information Phone Number |
1-800-DIAL-SEI
|
|
| Additional Information Website |
https://www.seic.com/mutual-fund-documentation/prospectuses-and-reports
|
|
| Expenses [Text Block] |
What were the Fund costs for the last year?(based on a hypothetical $10,000 investment) Fund Name | Costs of a $10,000 investment | Costs paid as a percentage of a $10,000 investment |
|---|
S&P 500 Index Fund, Class A Shares | $5 | 0.05% |
|---|
|
|
| Expenses Paid, Amount |
$ 5
|
|
| Expense Ratio, Percent |
0.05%
|
|
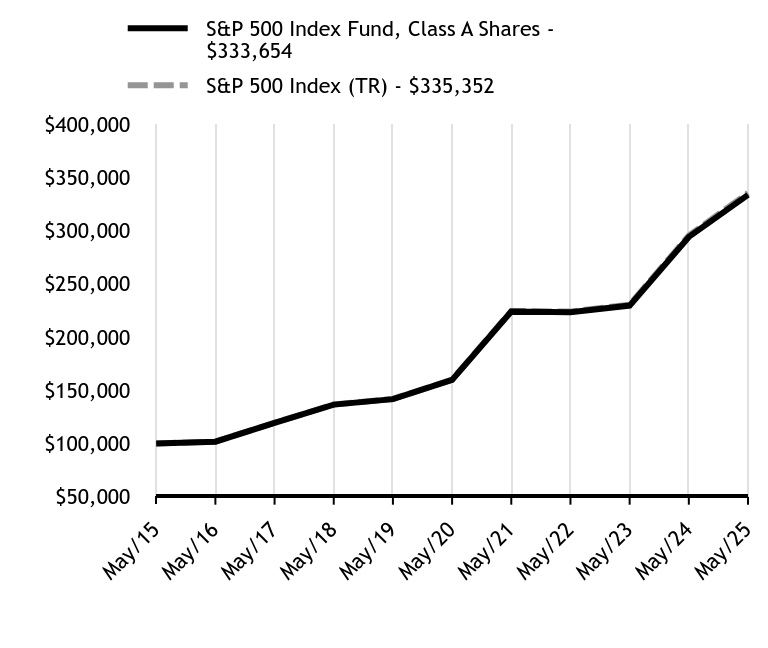
| Factors Affecting Performance [Text Block] |
How did the Fund perform in the last year?The S&P 500 Index (TR)—a market-weighted index that tracks the performance of the 500 largest publicly traded U.S. companies and is considered representative of the broad U.S. stock market—returned 13.52% for the 12-month period ending May 31, 2025. During the reporting period, the Fund achieved its objective of tracking the performance of the S&P 500 Index (TR). |
|
| Performance Past Does Not Indicate Future [Text] |
Past performance is not indicative of future performance.
|
|
| Line Graph [Table Text Block] |
| S&P 500 Index Fund, Class A Shares - $333654 | S&P 500 Index (TR) - $335352 |
|---|
May/15 | $100000 | $100000 |
|---|
May/16 | $101663 | $101716 |
|---|
May/17 | $119377 | $119484 |
|---|
May/18 | $136516 | $136671 |
|---|
May/19 | $141658 | $141841 |
|---|
May/20 | $159752 | $160050 |
|---|
May/21 | $224031 | $224579 |
|---|
May/22 | $223291 | $223907 |
|---|
May/23 | $229578 | $230448 |
|---|
May/24 | $294098 | $295404 |
|---|
May/25 | $333654 | $335352 |
|---|
|
|
| Average Annual Return [Table Text Block] |
Fund/Index Name | 1 Year | 5 Years | 10 Years |
|---|
S&P 500 Index Fund, Class A Shares | 13.45% | 15.87% | 12.81% |
|---|
S&P 500 Index (TR) | 13.52% | 15.94% | 12.86% |
|---|
|
|
| No Deduction of Taxes [Text Block] |
The table and graph presented above do not reflect the deduction of taxes a shareholder would pay on Fund distributions or the redemption of Fund Shares.
|
|
| AssetsNet |
$ 4,177,021,000
|
|
| Holdings Count | Holding |
506
|
|
| Advisory Fees Paid, Amount |
$ 427
|
|
| InvestmentCompanyPortfolioTurnover |
5.00%
|
|
| Additional Fund Statistics [Text Block] |
Key Fund Statistics as of May 31, 2025 | Total Net Assets (000's) | Number of Holdings | Total Advisory Fees Paid (000's) | Portfolio Turnover Rate |
|---|
| $4,177,021 | 506 | $427 | 5% |
|---|
|
|
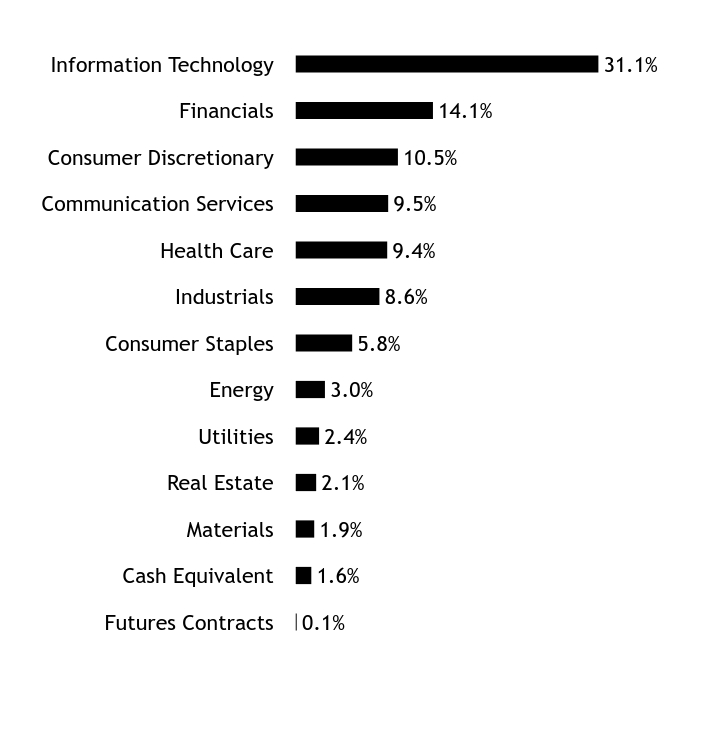
| Holdings [Text Block] |
Asset/Sector WeightingsFootnote Reference*Value | Value |
|---|
Futures Contracts | 0.1% | Cash Equivalent | 1.6% | Materials | 1.9% | Real Estate | 2.1% | Utilities | 2.4% | Energy | 3.0% | Consumer Staples | 5.8% | Industrials | 8.6% | Health Care | 9.4% | Communication Services | 9.5% | Consumer Discretionary | 10.5% | Financials | 14.1% | Information Technology | 31.1% |
| Footnote | Description | Footnote* | Percentages are calculated based on total net assets. |
|
|
| Largest Holdings [Text Block] |
Holding Name | | | Percentage of
Total Net AssetsFootnote Reference(A) |
|---|
Microsoft Corp | | | 6.7% | NVIDIA Corp | | | 6.5% | Apple Inc | | | 5.9% | Amazon.com Inc | | | 3.8% | Meta Platforms Inc, Cl A | | | 2.8% | Broadcom Inc | | | 2.2% | Alphabet Inc, Cl A | | | 2.0% | Tesla Inc | | | 1.9% | Berkshire Hathaway Inc, Cl B | | | 1.8% | Alphabet Inc, Cl C | | | 1.6% |
| Footnote | Description | Footnote(A) | Cash Equivalents are not shown in the top ten chart. |
|
|
| Material Fund Change [Text Block] |
There were no material fund changes during the reporting period. |
|
| C000109763 |
|
|
| Shareholder Report [Line Items] |
|
|
| Fund Name |
Extended Market Index Fund
|
|
| Class Name |
Class A
|
|
| Trading Symbol |
SMXAX
|
|
| Annual or Semi-Annual Statement [Text Block] |
This annual shareholder report contains important information about Class A Shares of the Extended Market Index Fund (the "Fund") for the period from June 1, 2024 to May 31, 2025.
|
|
| Shareholder Report Annual or Semi-Annual |
Annual Shareholder Report
|
|
| Additional Information [Text Block] |
You can find additional information about the Fund at https://www.seic.com/mutual-fund-documentation/prospectuses-and-reports. You can also request this information by contacting us at 1-800-DIAL-SEI.
|
|
| Additional Information Phone Number |
1-800-DIAL-SEI
|
|
| Additional Information Website |
https://www.seic.com/mutual-fund-documentation/prospectuses-and-reports
|
|
| Expenses [Text Block] |
What were the Fund costs for the last year?(based on a hypothetical $10,000 investment) Fund Name | Costs of a $10,000 investment | Costs paid as a percentage of a $10,000 investment |
|---|
Extended Market Index Fund, Class A Shares | $6 | 0.06% |
|---|
|
|
| Expenses Paid, Amount |
$ 6
|
|
| Expense Ratio, Percent |
0.06%
|
|
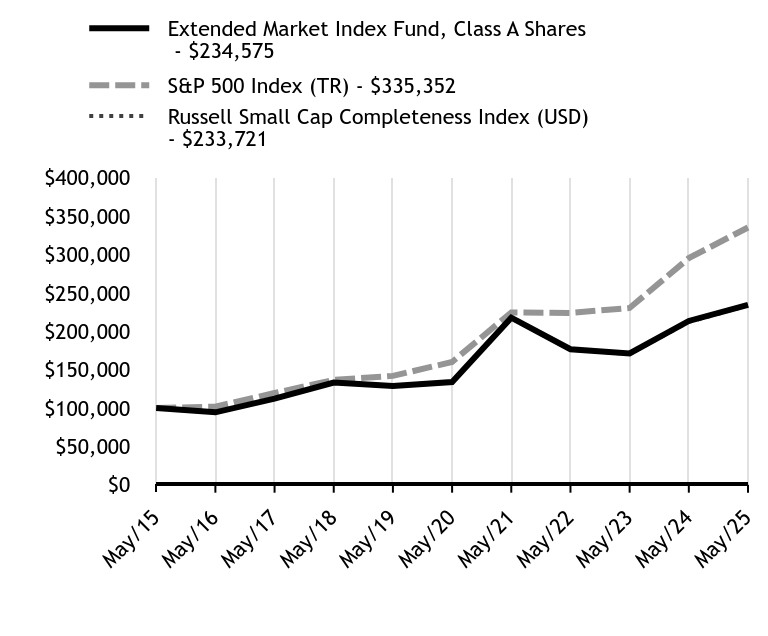
| Factors Affecting Performance [Text Block] |
How did the Fund perform in the last year?The Fund modestly underperformed its benchmark, the Russell Small Cap Completeness Index (USD) — which measures the performance of the Russell 3000 Index companies excluding S&P 500 Index constituents — for the 12-month period ending May 31, 2025. The Fund employed equity index futures to provide stock-like performance to a portion of the liquidity reserve account, which contained cash available for fund withdrawals. This weighed on the Fund’s relative performance during the reporting period. |
|
| Performance Past Does Not Indicate Future [Text] |
Past performance is not indicative of future performance.
|
|
| Line Graph [Table Text Block] |
| Extended Market Index Fund, Class A Shares - $234575 | S&P 500 Index (TR) - $335352 | Russell Small Cap Completeness Index (USD) - $233721 |
|---|
May/15 | $100000 | $100000 | $100000 |
|---|
May/16 | $94338 | $101716 | $94235 |
|---|
May/17 | $112287 | $119484 | $112194 |
|---|
May/18 | $133154 | $136671 | $132983 |
|---|
May/19 | $128772 | $141841 | $128435 |
|---|
May/20 | $133775 | $160050 | $133351 |
|---|
May/21 | $217765 | $224579 | $217126 |
|---|
May/22 | $176662 | $223907 | $176006 |
|---|
May/23 | $171173 | $230448 | $170521 |
|---|
May/24 | $213479 | $295404 | $212290 |
|---|
May/25 | $234575 | $335352 | $233721 |
|---|
|
|
| Average Annual Return [Table Text Block] |
Fund/Index Name | 1 Year | 5 Years | 10 Years |
|---|
Extended Market Index Fund, Class A Shares | 9.88% | 11.89% | 8.90% |
|---|
S&P 500 Index (TR) | 13.52% | 15.94% | 12.86% |
|---|
Russell Small Cap Completeness Index (USD) | 10.09% | 11.88% | 8.86% |
|---|
|
|
| No Deduction of Taxes [Text Block] |
The table and graph presented above do not reflect the deduction of taxes a shareholder would pay on Fund distributions or the redemption of Fund Shares.
|
|
| AssetsNet |
$ 1,122,322,000
|
|
| Holdings Count | Holding |
2,227
|
|
| Advisory Fees Paid, Amount |
$ 342
|
|
| InvestmentCompanyPortfolioTurnover |
21.00%
|
|
| Additional Fund Statistics [Text Block] |
Key Fund Statistics as of May 31, 2025 | Total Net Assets (000's) | Number of Holdings | Total Advisory Fees Paid (000's) | Portfolio Turnover Rate |
|---|
| $1,122,322 | 2,227 | $342 | 21% |
|---|
|
|
| Holdings [Text Block] |
Asset/Sector WeightingsFootnote Reference*Value | Value |
|---|
Rights | 0.0% | Registered Investment Company | 0.0% | Futures Contracts | 0.1% | Cash Equivalent | 1.4% | Utilities | 1.7% | Consumer Staples | 3.2% | Energy | 3.7% | Materials | 4.7% | Communication Services | 5.1% | Real Estate | 5.3% | Consumer Discretionary | 10.4% | Health Care | 10.7% | Information Technology | 17.6% | Industrials | 17.7% | Financials | 18.4% |
| Footnote | Description | Footnote* | Percentages are calculated based on total net assets. |
|
|
| Largest Holdings [Text Block] |
Holding Name | | | Percentage of
Total Net AssetsFootnote Reference(A) |
|---|
AppLovin Corp, Cl A | | | 1.5% | Spotify Technology SA | | | 1.4% | MicroStrategy Inc, Cl A | | | 1.2% | Snowflake Inc, Cl A | | | 0.9% | CRH PLC | | | 0.9% | Cheniere Energy Inc | | | 0.8% | Marvell Technology Inc | | | 0.7% | Cloudflare Inc, Cl A | | | 0.7% | ROBLOX Corp, Cl A | | | 0.7% | Robinhood Markets Inc, Cl A | | | 0.6% |
| Footnote | Description | Footnote(A) | Cash Equivalents are not shown in the top ten chart. |
|
|
| Material Fund Change [Text Block] |
There were no material fund changes during the reporting period. |
|
| C000018361 |
|
|
| Shareholder Report [Line Items] |
|
|
| Fund Name |
Small Cap Fund
|
|
| Class Name |
Class A
|
|
| Trading Symbol |
SLPAX
|
|
| Annual or Semi-Annual Statement [Text Block] |
This annual shareholder report contains important information about Class A Shares of the Small Cap Fund (the "Fund") for the period from June 1, 2024 to May 31, 2025.
|
|
| Shareholder Report Annual or Semi-Annual |
Annual Shareholder Report
|
|
| Additional Information [Text Block] |
You can find additional information about the Fund at https://www.seic.com/mutual-fund-documentation/prospectuses-and-reports. You can also request this information by contacting us at 1-800-DIAL-SEI.
|
|
| Additional Information Phone Number |
1-800-DIAL-SEI
|
|
| Additional Information Website |
https://www.seic.com/mutual-fund-documentation/prospectuses-and-reports
|
|
| Expenses [Text Block] |
What were the Fund costs for the last year?(based on a hypothetical $10,000 investment) Fund Name | Costs of a $10,000 investment | Costs paid as a percentage of a $10,000 investment |
|---|
Small Cap Fund, Class A Shares | $43 | 0.42% |
|---|
|
|
| Expenses Paid, Amount |
$ 43
|
|
| Expense Ratio, Percent |
0.42%
|
|
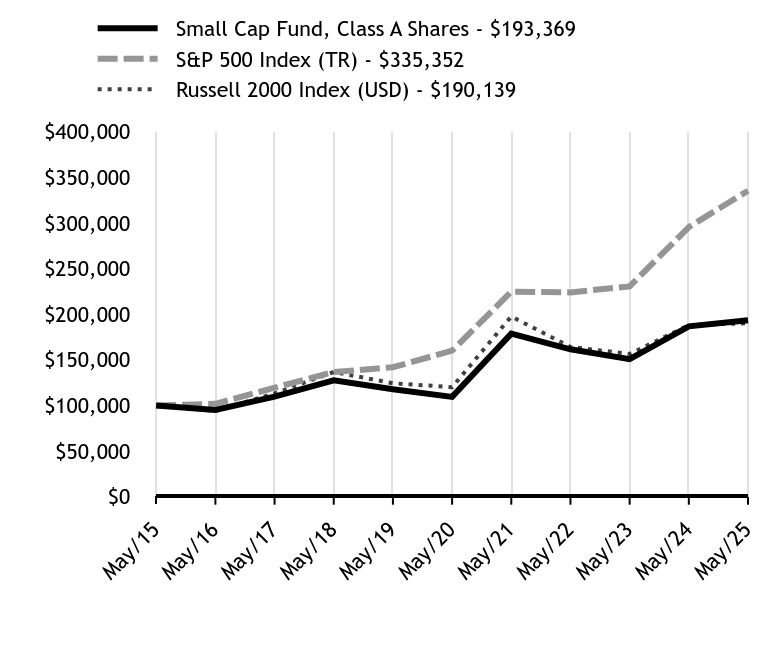
| Factors Affecting Performance [Text Block] |
How did the Fund perform in the last year?The Fund outperformed its benchmark, the Russell 2000 Index (USD)—which tracks the performance of the small-cap segment of the U S. equity market—for the 12-month period ending May 31, 2025. Most of the Fund’s outperformance over the reporting period occurred during the volatile market environment in early April 2025. Los Angeles Capital Management LLC (LA Capital) and Martingale Asset Management, L.P. (Martingale) were the top-performing sub-advisers during the period. Martingale’s low volatility-focused strategy benefited as the low volatility factor performed well. LA Capital’s strong performance was attributable mainly to positive stock selection results, especially in the information technology and energy sectors. LSV Asset Management more modestly outperformed versus the benchmark, as the value style did not experience strong performance during the period. Axiom Investors LLC and The Informed Momentum Company LLC (IMC) (fka EAM Investors, LLC) detracted from Fund performance. While these strategies benefited from the positive performance of momentum factor investing (in which investors buy stocks that have shown recent price gains and sell stocks that have recently declined) in 2024, they struggled with the rapid shift in leadership in the first quarter of 2025. At the sector level, Fund performance benefited moderately from active sector positioning. An overweight allocation to the consumer staples and financials sectors, as well as underweights to energy and healthcare, enhanced Fund performance for the reporting period. Overall stock selection had a positive impact on Fund performance, particularly in the healthcare, financials, and energy sectors. Conversely, stock selection in industrials detracted from Fund performance. The Fund’s higher-quality positioning generally provided a tailwind to performance as lower-quality stocks significantly lagged the Russell 2000 Index during the reporting period. Similarly, while the Fund’s bias toward the least-expensive stocks in the Index did not contribute to its outperformance for the period, its bias away from the most-expensive names bolstered performance. An overweight allocation to the momentum factor investing style also contributed positively to Fund performance. |
|
| Performance Past Does Not Indicate Future [Text] |
Past performance is not indicative of future performance.
|
|
| Line Graph [Table Text Block] |
| Small Cap Fund, Class A Shares - $193369 | S&P 500 Index (TR) - $335352 | Russell 2000 Index (USD) - $190139 |
|---|
May/15 | $100000 | $100000 | $100000 |
|---|
May/16 | $95011 | $101716 | $94027 |
|---|
May/17 | $109644 | $119484 | $113172 |
|---|
May/18 | $127521 | $136671 | $136672 |
|---|
May/19 | $117683 | $141841 | $124310 |
|---|
May/20 | $109397 | $160050 | $120036 |
|---|
May/21 | $178732 | $224579 | $197536 |
|---|
May/22 | $161533 | $223907 | $164123 |
|---|
May/23 | $150660 | $230448 | $156443 |
|---|
May/24 | $186706 | $295404 | $187911 |
|---|
May/25 | $193369 | $335352 | $190139 |
|---|
|
|
| Average Annual Return [Table Text Block] |
Fund/Index Name | 1 Year | 5 Years | 10 Years |
|---|
Small Cap Fund, Class A Shares | 3.57% | 12.07% | 6.82% |
|---|
S&P 500 Index (TR) | 13.52% | 15.94% | 12.86% |
|---|
Russell 2000 Index (USD) | 1.19% | 9.64% | 6.64% |
|---|
|
|
| No Deduction of Taxes [Text Block] |
The table and graph presented above do not reflect the deduction of taxes a shareholder would pay on Fund distributions or the redemption of Fund Shares.
|
|
| AssetsNet |
$ 251,278,000
|
|
| Holdings Count | Holding |
851
|
|
| Advisory Fees Paid, Amount |
$ 1,025
|
|
| InvestmentCompanyPortfolioTurnover |
90.00%
|
|
| Additional Fund Statistics [Text Block] |
Key Fund Statistics as of May 31, 2025 | Total Net Assets (000's) | Number of Holdings | Total Advisory Fees Paid (000's) | Portfolio Turnover Rate |
|---|
| $251,278 | 851 | $1,025 | 90% |
|---|
|
|
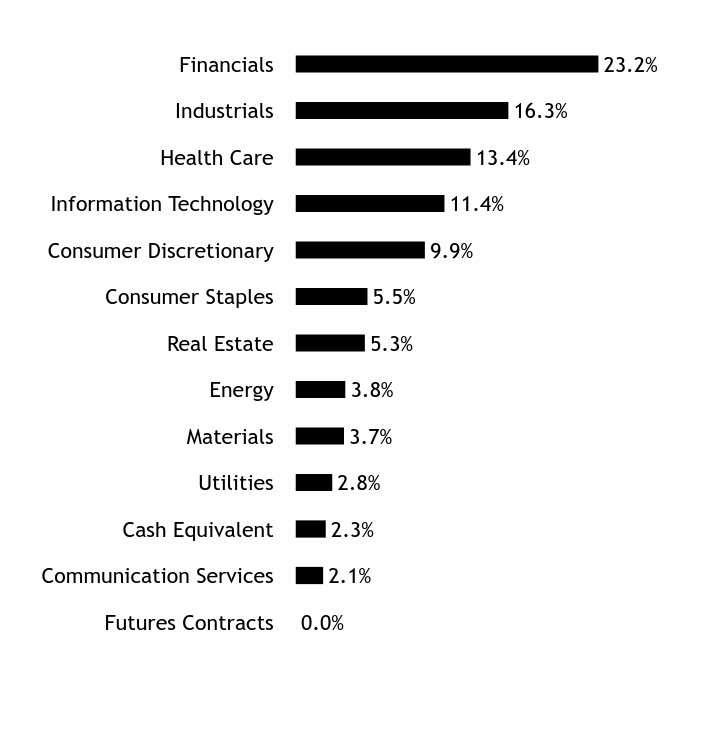
| Holdings [Text Block] |
Asset/Sector WeightingsFootnote Reference*Value | Value |
|---|
Futures Contracts | 0.0% | Communication Services | 2.1% | Cash Equivalent | 2.3% | Utilities | 2.8% | Materials | 3.7% | Energy | 3.8% | Real Estate | 5.3% | Consumer Staples | 5.5% | Consumer Discretionary | 9.9% | Information Technology | 11.4% | Health Care | 13.4% | Industrials | 16.3% | Financials | 23.2% |
| Footnote | Description | Footnote* | Percentages are calculated based on total net assets. |
|
|
| Largest Holdings [Text Block] |
Holding Name | | | Percentage of
Total Net AssetsFootnote Reference(A) |
|---|
National Fuel Gas Co | | | 0.7% | Casella Waste Systems Inc, Cl A | | | 0.6% | CommVault Systems Inc | | | 0.6% | Sprouts Farmers Market Inc | | | 0.5% | Exelixis Inc | | | 0.5% | Ensign Group Inc/The | | | 0.5% | Badger Meter Inc | | | 0.5% | Banco Latinoamericano de Comercio Exterior SA | | | 0.5% | Casey's General Stores Inc | | | 0.5% | Merit Medical Systems Inc | | | 0.5% |
| Footnote | Description | Footnote(A) | Cash Equivalents are not shown in the top ten chart. |
|
|
| Material Fund Change [Text Block] |
There were no material fund changes during the reporting period. |
|
| C000111997 |
|
|
| Shareholder Report [Line Items] |
|
|
| Fund Name |
Small Cap II Fund
|
|
| Class Name |
Class A
|
|
| Trading Symbol |
SECAX
|
|
| Annual or Semi-Annual Statement [Text Block] |
This annual shareholder report contains important information about Class A Shares of the Small Cap II Fund (the "Fund") for the period from June 1, 2024 to May 31, 2025.
|
|
| Shareholder Report Annual or Semi-Annual |
Annual Shareholder Report
|
|
| Additional Information [Text Block] |
You can find additional information about the Fund at https://www.seic.com/mutual-fund-documentation/prospectuses-and-reports. You can also request this information by contacting us at 1-800-DIAL-SEI.
|
|
| Additional Information Phone Number |
1-800-DIAL-SEI
|
|
| Additional Information Website |
https://www.seic.com/mutual-fund-documentation/prospectuses-and-reports
|
|
| Expenses [Text Block] |
What were the Fund costs for the last year?(based on a hypothetical $10,000 investment) Fund Name | Costs of a $10,000 investment | Costs paid as a percentage of a $10,000 investment |
|---|
Small Cap II Fund, Class A Shares | $40 | 0.40% |
|---|
|
|
| Expenses Paid, Amount |
$ 40
|
|
| Expense Ratio, Percent |
0.40%
|
|
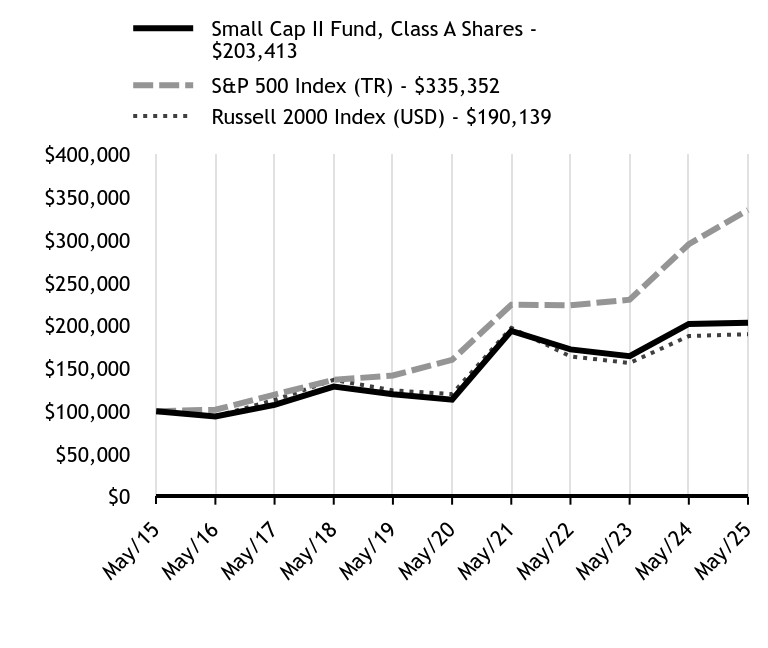
| Factors Affecting Performance [Text Block] |
How did the Fund perform in the last year?The Fund underperformed its benchmark, the Russell 2000 Index (USD)—which tracks the performance of the small-cap segment of the U S. equity market—for the 12-month period ending May 31, 2025. The Fund lost ground during the risk-on rally that gripped U.S. small-cap stocks in July 2024. This was partially offset in March and April 2025, as risk-off investor sentiment took hold amid economic uncertainty and announcements of U.S. tariffs. Among the Fund’s sub-advisors, Los Angeles Capital Management LLC benefited from its dynamic approach (in which asset allocations and holdings are actively adjusted based on changing market conditions and trends). Stock selection within the information technology and energy sectors added to Fund performance. Leeward Investments, LLC benefited from its low volatility exposure throughout early 2025. Copeland Capital Management, LLC detracted modestly from Fund performance. The manager struggled notably during the fourth quarter of 2024, amid a positive quarter for more speculative names in the Russell 2000 Index (USD), but rebounded during the volatility in the first several months of 2025. The Informed Momentum Company LLC (IMC) (fka EAM Investors, LLC) weighed on Fund performance to a slightly larger degree, initially benefiting from positive returns for the momentum investing style (in which investors buy stocks that have shown recent price gains and sell stocks that have recently declined) in 2024, but struggling with the shift in market leadership in 2025. Easterly Investment Partners LLC faced value style headwinds and adverse stock selection in the materials and information technology sectors. An overweight allocation to the energy sector hampered Fund performance for the period. This was partially offset by the positive impact of an overweight to financials. Stock selection in materials, information technology, and industrials weighed on Fund performance. This was mostly offset by positive stock selection in energy and financials. At the factor level, the Fund’s bias away from the lowest-quality stocks in the Russell 2000 Index (USD) bolstered performance, but its overweight to the least-expensive stocks in the Index was a detractor. |
|
| Performance Past Does Not Indicate Future [Text] |
Past performance is not indicative of future performance.
|
|
| Line Graph [Table Text Block] |
| Small Cap II Fund, Class A Shares - $203413 | S&P 500 Index (TR) - $335352 | Russell 2000 Index (USD) - $190139 |
|---|
May/15 | $100000 | $100000 | $100000 |
|---|
May/16 | $93935 | $101716 | $94027 |
|---|
May/17 | $107341 | $119484 | $113172 |
|---|
May/18 | $128780 | $136671 | $136672 |
|---|
May/19 | $119790 | $141841 | $124310 |
|---|
May/20 | $113562 | $160050 | $120036 |
|---|
May/21 | $193952 | $224579 | $197536 |
|---|
May/22 | $172354 | $223907 | $164123 |
|---|
May/23 | $164337 | $230448 | $156443 |
|---|
May/24 | $202052 | $295404 | $187911 |
|---|
May/25 | $203413 | $335352 | $190139 |
|---|
|
|
| Average Annual Return [Table Text Block] |
Fund/Index Name | 1 Year | 5 Years | 10 Years |
|---|
Small Cap II Fund, Class A Shares | 0.67% | 12.36% | 7.36% |
|---|
S&P 500 Index (TR) | 13.52% | 15.94% | 12.86% |
|---|
Russell 2000 Index (USD) | 1.19% | 9.64% | 6.64% |
|---|
|
|
| No Deduction of Taxes [Text Block] |
The table and graph presented above do not reflect the deduction of taxes a shareholder would pay on Fund distributions or the redemption of Fund Shares.
|
|
| AssetsNet |
$ 252,161,000
|
|
| Holdings Count | Holding |
572
|
|
| Advisory Fees Paid, Amount |
$ 999
|
|
| InvestmentCompanyPortfolioTurnover |
94.00%
|
|
| Additional Fund Statistics [Text Block] |
Key Fund Statistics as of May 31, 2025 | Total Net Assets (000's) | Number of Holdings | Total Advisory Fees Paid (000's) | Portfolio Turnover Rate |
|---|
| $252,161 | 572 | $999 | 94% |
|---|
|
|
| Holdings [Text Block] |
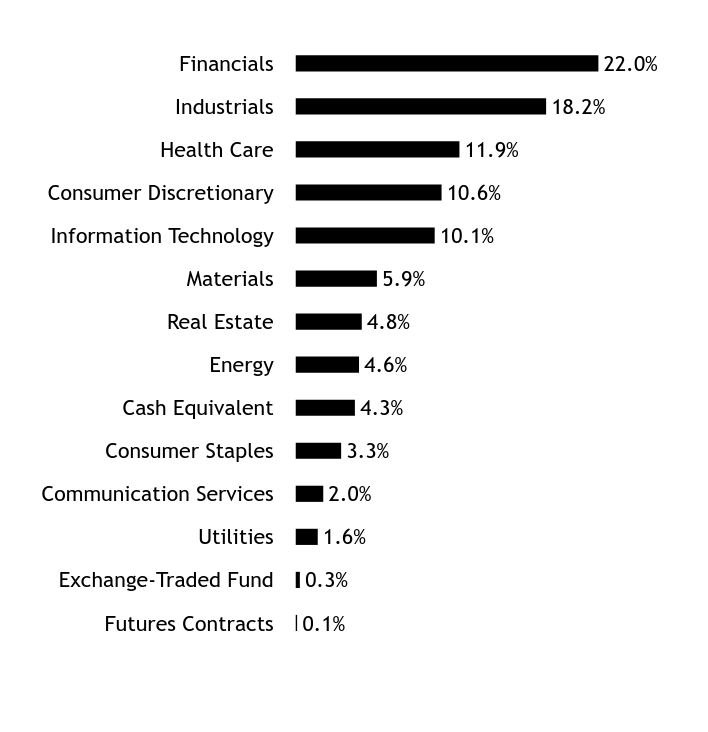
Asset/Sector WeightingsFootnote Reference*Value | Value |
|---|
Futures Contracts | 0.1% | Exchange-Traded Fund | 0.3% | Utilities | 1.6% | Communication Services | 2.0% | Consumer Staples | 3.3% | Cash Equivalent | 4.3% | Energy | 4.6% | Real Estate | 4.8% | Materials | 5.9% | Information Technology | 10.1% | Consumer Discretionary | 10.6% | Health Care | 11.9% | Industrials | 18.2% | Financials | 22.0% |
| Footnote | Description | Footnote* | Percentages are calculated based on total net assets. |
|
|
| Largest Holdings [Text Block] |
Holding Name | | | Percentage of
Total Net AssetsFootnote Reference(A) |
|---|
Columbia Banking System Inc | | | 1.1% | Old National Bancorp/IN | | | 1.1% | Encompass Health Corp | | | 1.0% | Delek US Holdings Inc | | | 0.9% | Jackson Financial Inc, Cl A | | | 0.8% | Astec Industries Inc | | | 0.8% | WESCO International Inc | | | 0.7% | Lincoln National Corp | | | 0.7% | FMC Corp | | | 0.7% | Comerica Inc | | | 0.7% |
| Footnote | Description | Footnote(A) | Cash Equivalents are not shown in the top ten chart. |
|
|
| Material Fund Change [Text Block] |
There were no material fund changes during the reporting period. |
|
| C000018359 |
|
|
| Shareholder Report [Line Items] |
|
|
| Fund Name |
Small/Mid Cap Equity Fund
|
|
| Class Name |
Class A
|
|
| Trading Symbol |
SSMAX
|
|
| Annual or Semi-Annual Statement [Text Block] |
This annual shareholder report contains important information about Class A Shares of the Small/Mid Cap Equity Fund (the "Fund") for the period from June 1, 2024 to May 31, 2025.
|
|
| Shareholder Report Annual or Semi-Annual |
Annual Shareholder Report
|
|
| Additional Information [Text Block] |
You can find additional information about the Fund at https://www.seic.com/mutual-fund-documentation/prospectuses-and-reports. You can also request this information by contacting us at 1-800-DIAL-SEI.
|
|
| Additional Information Phone Number |
1-800-DIAL-SEI
|
|
| Additional Information Website |
https://www.seic.com/mutual-fund-documentation/prospectuses-and-reports
|
|
| Expenses [Text Block] |
What were the Fund costs for the last year?(based on a hypothetical $10,000 investment) Fund Name | Costs of a $10,000 investment | Costs paid as a percentage of a $10,000 investment |
|---|
Small/Mid Cap Equity Fund, Class A Shares | $40 | 0.40% |
|---|
|
|
| Expenses Paid, Amount |
$ 40
|
|
| Expense Ratio, Percent |
0.40%
|
|
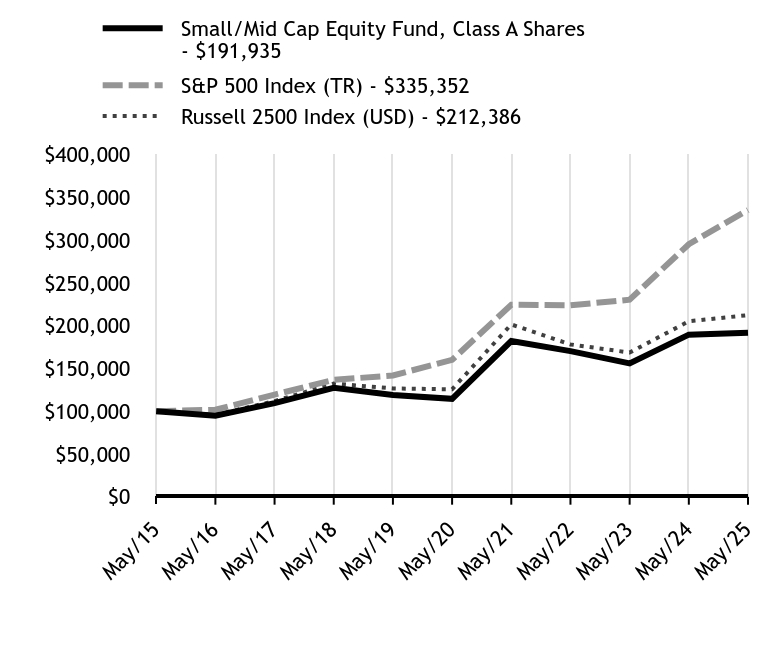
| Factors Affecting Performance [Text Block] |
How did the Fund perform in the last year?The Fund underperformed its benchmark, the Russell 2500 Index (USD)—which tracks the performance of the small- to mid-cap segment of the U.S. equity universe, commonly referred to as "smid" cap—for the 12-month period ending May 31, 2025. The Fund declined during the more speculative environment in the fourth quarter of 2024 following the results of the U.S. presidential election in November. The Fund regained this lost ground amid the market volatility of late March and early April 2025, but manager-specific results weighed on performance again at the end of the reporting period in May. Among the Fund’s sub-advisers, Geneva Capital Management LLC benefited from its higher-quality/low-volatility positioning in the first quarter of 2025. The manager also saw an upturn in July 2024, attributable to stock-specific results during a more beta-driven rally (beta is a quantitative measure of the volatility relative to a benchmark) for small-cap stocks. Jackson Creek Investment Advisors LLC slightly outperformed the benchmark Russell 2500 Index for the period, bolstered by its tilt toward the momentum investing style (in which investors buy stocks that have shown recent price gains and sell stocks that have recently declined). Axiom Investors LLC detracted modestly from Fund performance for the reporting period due to style tailwinds in 2024, but struggled with the change in market leadership for the first five months of 2025. LSV Asset Management underperformed more significantly due largely to value style headwinds over the period. Copeland Capital Management, LLC was the largest detractor from Fund performance for the period, attributable mainly to weakness in the fourth quarter of 2024. This was only partially offset by positive performance for the manager’s holdings in low-volatility stocks in the first quarter of 2025. Sector positioning modestly hampered Fund performance for the period due largely to a slight underweight to utilities. Stock selection in consumer discretionary, energy, financials, and information technology detracted from Fund performance. This was partially offset by positive stock selection in healthcare. |
|
| Performance Past Does Not Indicate Future [Text] |
Past performance is not indicative of future performance.
|
|
| Line Graph [Table Text Block] |
| Small/Mid Cap Equity Fund, Class A Shares - $191935 | S&P 500 Index (TR) - $335352 | Russell 2500 Index (USD) - $212386 |
|---|
May/15 | $100000 | $100000 | $100000 |
|---|
May/16 | $94672 | $101716 | $95700 |
|---|
May/17 | $109374 | $119484 | $111848 |
|---|
May/18 | $127437 | $136671 | $132307 |
|---|
May/19 | $119048 | $141841 | $126634 |
|---|
May/20 | $114522 | $160050 | $125619 |
|---|
May/21 | $182052 | $224579 | $201558 |
|---|
May/22 | $170277 | $223907 | $178138 |
|---|
May/23 | $155978 | $230448 | $168633 |
|---|
May/24 | $189591 | $295404 | $205232 |
|---|
May/25 | $191935 | $335352 | $212386 |
|---|
|
|
| Average Annual Return [Table Text Block] |
Fund/Index Name | 1 Year | 5 Years | 10 Years |
|---|
Small/Mid Cap Equity Fund, Class A Shares | 1.24% | 10.88% | 6.74% |
|---|
S&P 500 Index (TR) | 13.52% | 15.94% | 12.86% |
|---|
Russell 2500 Index (USD) | 3.49% | 11.07% | 7.82% |
|---|
|
|
| No Deduction of Taxes [Text Block] |
The table and graph presented above do not reflect the deduction of taxes a shareholder would pay on Fund distributions or the redemption of Fund Shares.
|
|
| AssetsNet |
$ 837,763,000
|
|
| Holdings Count | Holding |
464
|
|
| Advisory Fees Paid, Amount |
$ 3,085
|
|
| InvestmentCompanyPortfolioTurnover |
67.00%
|
|
| Additional Fund Statistics [Text Block] |
Key Fund Statistics as of May 31, 2025 | Total Net Assets (000's) | Number of Holdings | Total Advisory Fees Paid (000's) | Portfolio Turnover Rate |
|---|
| $837,763 | 464 | $3,085 | 67% |
|---|
|
|
| Holdings [Text Block] |
Asset/Sector WeightingsFootnote Reference*Value | Value |
|---|
Futures Contracts | 0.1% | Utilities | 1.6% | Communication Services | 2.2% | Energy | 3.3% | Consumer Staples | 4.0% | Real Estate | 4.2% | Materials | 4.3% | Cash Equivalent | 4.3% | Health Care | 10.9% | Consumer Discretionary | 11.1% | Information Technology | 13.1% | Financials | 16.9% | Industrials | 23.8% |
| Footnote | Description | Footnote* | Percentages are calculated based on total net assets. |
|
|
| Largest Holdings [Text Block] |
Holding Name | | | Percentage of
Total Net AssetsFootnote Reference(A) |
|---|
ExlService Holdings Inc | | | 1.0% | Ensign Group Inc/The | | | 1.0% | RBC Bearings Inc | | | 1.0% | Kinsale Capital Group Inc | | | 0.8% | Axon Enterprise Inc | | | 0.7% | Casey's General Stores Inc | | | 0.7% | Matador Resources Co | | | 0.7% | Pool Corp | | | 0.6% | Tyler Technologies Inc | | | 0.6% | Balchem Corp | | | 0.6% |
| Footnote | Description | Footnote(A) | Cash Equivalents are not shown in the top ten chart. |
|
|
| Material Fund Change [Text Block] |
There were no material fund changes during the reporting period. |
|
| C000198133 |
|
|
| Shareholder Report [Line Items] |
|
|
| Fund Name |
U.S. Equity Factor Allocation Fund
|
|
| Class Name |
Class A
|
|
| Trading Symbol |
SEHAX
|
|
| Annual or Semi-Annual Statement [Text Block] |
This annual shareholder report contains important information about Class A Shares of the U.S. Equity Factor Allocation Fund (the "Fund") for the period from June 1, 2024 to May 31, 2025.
|
|
| Shareholder Report Annual or Semi-Annual |
Annual Shareholder Report
|
|
| Additional Information [Text Block] |
You can find additional information about the Fund at https://www.seic.com/mutual-fund-documentation/prospectuses-and-reports. You can also request this information by contacting us at 1-800-DIAL-SEI.
|
|
| Additional Information Phone Number |
1-800-DIAL-SEI
|
|
| Additional Information Website |
https://www.seic.com/mutual-fund-documentation/prospectuses-and-reports
|
|
| Expenses [Text Block] |
What were the Fund costs for the last year?(based on a hypothetical $10,000 investment) Fund Name | Costs of a $10,000 investment | Costs paid as a percentage of a $10,000 investment |
|---|
U.S. Equity Factor Allocation Fund, Class A Shares | $2 | 0.02% |
|---|
|
|
| Expenses Paid, Amount |
$ 2
|
|
| Expense Ratio, Percent |
0.02%
|
|
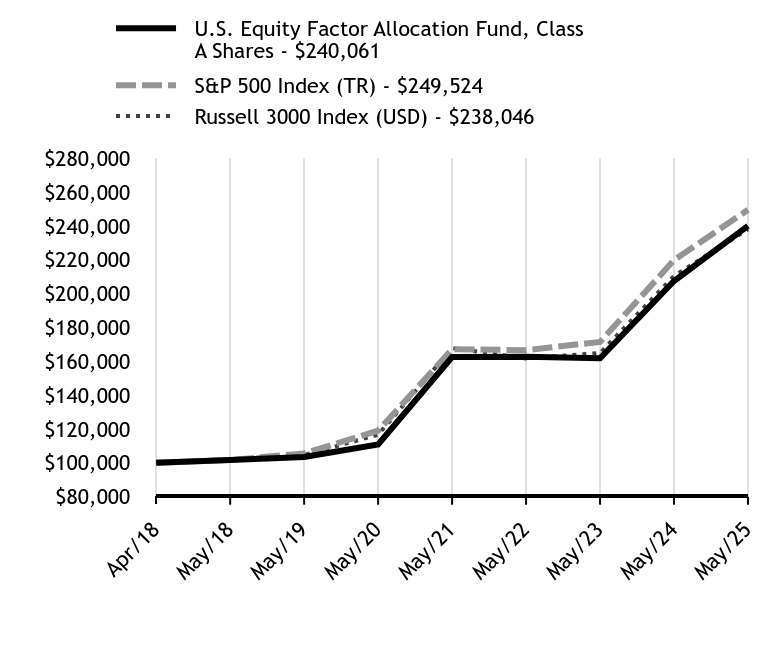
| Factors Affecting Performance [Text Block] |
How did the Fund perform in the last year?The Fund outperformed its benchmark, the Russell 3000 Index (USD)—which tracks the performance of the 3,000 largest U.S. companies representing approximately 96% of the investable U.S. equity market— for the 12-month period ending May 31, 2025. Fund performance for the reporting period was bolstered by gains from the momentum strategy, which continued to benefit from the dominance of artificial intelligence (AI)-themed stocks. The strategy benefited from stock selection across multiple sectors, including information technology (with overweight positions in companies such as AppLovin, Guidewire, and Broadcom); consumer staples (overweighting Sprouts Farmers Market, Walmart, and Philip Morris); and healthcare (the lack of exposure to UnitedHealth Group, Merck & Co., and Gilead Sciences). The value and low volatility strategies enhanced Fund performance for the reporting period. The value strategy was bolstered by stock selection in the healthcare sector (especially overweight allocations to Cardinal Health, Merck & Co., and Gilead Sciences), as well as stock selection in the utilities and industrials sectors. The low volatility strategy also benefited from stock selection in the healthcare sector, along with stock selection in the information technology. The Fund’s quality strategy saw virtually flat performance during the reporting period, as investors’ attention shifted toward high-volatility, speculative stocks. In addition to the absence of holdings in strong-performing technology stocks such as Tesla and Broadcom, the was hampered by an underweight position in the financials sector (notably J.P. Morgan, Wells Fargo, and Bank of America), which benefited from a combination of expectations for Trump administration policies and stock-specific corporate earnings guidance. Stock selection in the consumer discretionary and communication services sectors also detracted from the strategy’s performance. This was partially offset by positive stock selection in the healthcare and consumer staples sectors. |
|
| Performance Past Does Not Indicate Future [Text] |
Past performance is not indicative of future performance.
|
|
| Line Graph [Table Text Block] |
| U.S. Equity Factor Allocation Fund, Class A Shares - $240061 | S&P 500 Index (TR) - $249524 | Russell 3000 Index (USD) - $238046 |
|---|
Apr/18 | $100000 | $100000 | $100000 |
|---|
May/18 | $101700 | $101692 | $102083 |
|---|
May/19 | $103470 | $105539 | $104631 |
|---|
May/20 | $110927 | $119088 | $116625 |
|---|
May/21 | $162555 | $167102 | $167837 |
|---|
May/22 | $162724 | $166601 | $161654 |
|---|
May/23 | $161796 | $171469 | $164944 |
|---|
May/24 | $207463 | $219800 | $210440 |
|---|
May/25 | $240061 | $249524 | $238046 |
|---|
|
|
| Average Annual Return [Table Text Block] |
Fund/Index Name | 1 Year | 5 Years | Annualized
Since
Inception |
|---|
U.S. Equity Factor Allocation Fund, Class A Shares | 15.71% | 16.70% | 13.12% |
|---|
S&P 500 Index (TR) | 13.52% | 15.94% | 13.74% |
|---|
Russell 3000 Index (USD) | 13.12% | 15.34% | 12.99% |
|---|
|
|
| Performance Inception Date |
Apr. 26, 2018
|
|
| No Deduction of Taxes [Text Block] |
The table and graph presented above do not reflect the deduction of taxes a shareholder would pay on Fund distributions or the redemption of Fund Shares.
|
|
| AssetsNet |
$ 2,535,640,000
|
|
| Holdings Count | Holding |
439
|
|
| Advisory Fees Paid, Amount |
$ 0
|
|
| InvestmentCompanyPortfolioTurnover |
47.00%
|
|
| Additional Fund Statistics [Text Block] |
Key Fund Statistics as of May 31, 2025 | Total Net Assets (000's) | Number of Holdings | Total Advisory Fees Paid (000's) | Portfolio Turnover Rate |
|---|
| $2,535,640 | 439 | $- | 47% |
|---|
|
|
| Holdings [Text Block] |
Asset/Sector WeightingsFootnote Reference*Value | Value |
|---|
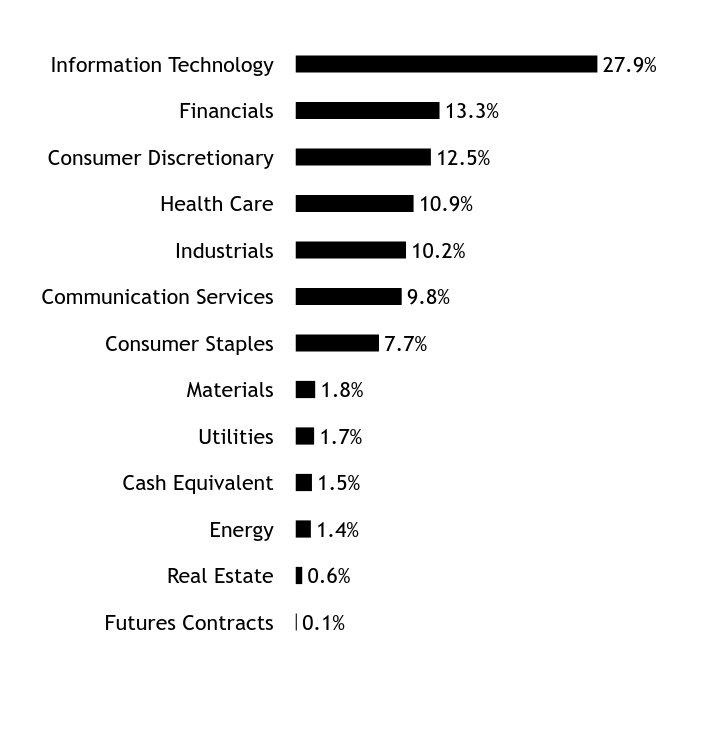
Futures Contracts | 0.1% | Real Estate | 0.6% | Energy | 1.4% | Cash Equivalent | 1.5% | Utilities | 1.7% | Materials | 1.8% | Consumer Staples | 7.7% | Communication Services | 9.8% | Industrials | 10.2% | Health Care | 10.9% | Consumer Discretionary | 12.5% | Financials | 13.3% | Information Technology | 27.9% |
| Footnote | Description | Footnote* | Percentages are calculated based on total net assets. |
|
|
| Largest Holdings [Text Block] |
Holding Name | | | Percentage of
Total Net AssetsFootnote Reference(A) |
|---|
Microsoft Corp | | | 4.9% | Apple Inc | | | 3.9% | NVIDIA Corp | | | 3.6% | Meta Platforms Inc, Cl A | | | 1.9% | Alphabet Inc, Cl A | | | 1.8% | Amazon.com Inc | | | 1.6% | Cisco Systems Inc | | | 1.4% | Visa Inc, Cl A | | | 1.2% | AT&T Inc | | | 1.2% | Philip Morris International Inc | | | 1.1% |
| Footnote | Description | Footnote(A) | Cash Equivalents are not shown in the top ten chart. |
|
|
| Material Fund Change [Text Block] |
There were no material fund changes during the reporting period. |
|
| C000036888 |
|
|
| Shareholder Report [Line Items] |
|
|
| Fund Name |
U.S. Managed Volatility Fund
|
|
| Class Name |
Class A
|
|
| Trading Symbol |
SVYAX
|
|
| Annual or Semi-Annual Statement [Text Block] |
This annual shareholder report contains important information about Class A Shares of the U.S. Managed Volatility Fund (the "Fund") for the period from June 1, 2024 to May 31, 2025.
|
|
| Shareholder Report Annual or Semi-Annual |
Annual Shareholder Report
|
|
| Additional Information [Text Block] |
You can find additional information about the Fund at https://www.seic.com/mutual-fund-documentation/prospectuses-and-reports. You can also request this information by contacting us at 1-800-DIAL-SEI.
|
|
| Additional Information Phone Number |
1-800-DIAL-SEI
|
|
| Additional Information Website |
https://www.seic.com/mutual-fund-documentation/prospectuses-and-reports
|
|
| Expenses [Text Block] |
What were the Fund costs for the last year?(based on a hypothetical $10,000 investment) Fund Name | Costs of a $10,000 investment | Costs paid as a percentage of a $10,000 investment |
|---|
U.S. Managed Volatility Fund, Class A Shares | $21 | 0.20% |
|---|
|
|
| Expenses Paid, Amount |
$ 21
|
|
| Expense Ratio, Percent |
0.20%
|
|
| Factors Affecting Performance [Text Block] |
How did the Fund perform in the last year?The Fund modestly outperformed its primary benchmark, the Russell 3000 Index (USD)—which tracks the performance of the 3,000 largest U.S. companies representing approximately 96% of the investable U.S. equity market—for the 12-month period ending May 31, 2025. The Fund underperformed for the first half of the reporting period due to its low-beta exposure (beta is a quantitative measure of the volatility relative to a benchmark) and value exposure. These trends reversed in 2025 due to heightened market volatility amid uncertainty around U.S. tariff policy and concerns around artificial intelligence (AI) capital expenditures. Fund performance benefited from this market rotation due to its low-volatility bias and exposure to value. Overall, the Fund’s alpha source (the investment approach that an active investment manager takes in an effort to generate excess returns relative to a benchmark) exposures delivered mixed results. Positions in low-volatility and value stocks detracted from performance in the first half of the reporting period, but exposure to low-volatility and value stocks in 2025 more than offset the underperformance in 2024. Among the Fund’s sub-advisers, LSV Asset Management outperformed the benchmark Russell 3000 Index (USD) due to favorable stock selection among low-volatility stocks, as well as strong stock selection in the healthcare sector. During the portion of the reporting period in which Allspring Global Investments, LLC (“Allspring”) was a Fund sub-adviser, the manager’s performance modestly outperformed the benchmark due to its low-beta exposure, positions in value stocks, and strong stock selection in the healthcare and information technology sectors. During the brief period in which Acadian Asset Management LLC (“Acadian”) was a sub-adviser, the manager underperformed the benchmark. |
|
| Performance Past Does Not Indicate Future [Text] |
Past performance is not indicative of future performance.
|
|
| Line Graph [Table Text Block] |
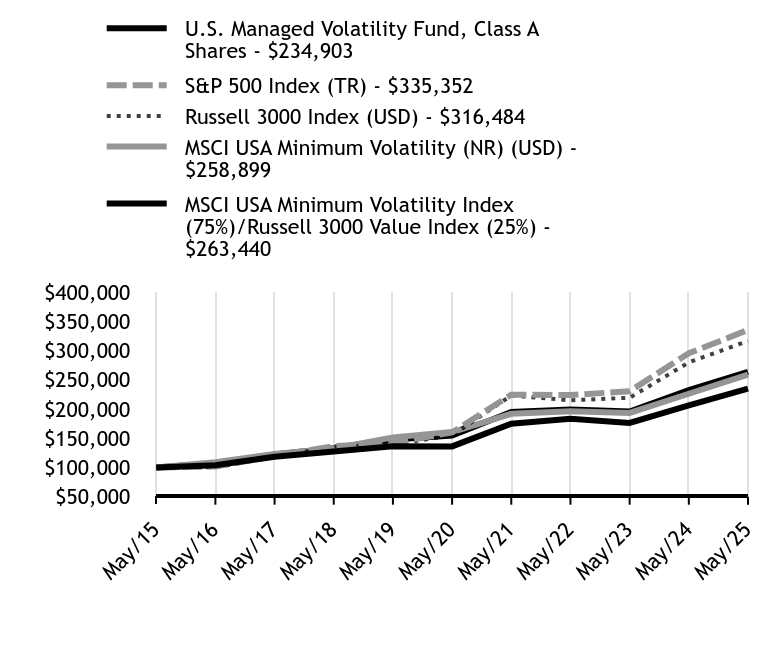
| U.S. Managed Volatility Fund, Class A Shares - $234903 | S&P 500 Index (TR) - $335352 | Russell 3000 Index (USD) - $316484 | MSCI USA Minimum Volatility (NR) (USD) - $258899 | MSCI USA Minimum Volatility Index (75%)/Russell 3000 Value Index (25%) - $263440 |
|---|
May/15 | $100000 | $100000 | $100000 | $100000 | $100000 |
|---|
May/16 | $103715 | $101716 | $100223 | $108897 | $107178 |
|---|
May/17 | $118160 | $119484 | $117954 | $122950 | $122326 |
|---|
May/18 | $127384 | $136671 | $135720 | $132679 | $132954 |
|---|
May/19 | $136426 | $141841 | $139107 | $151505 | $147894 |
|---|
May/20 | $136008 | $160050 | $155054 | $160572 | $154442 |
|---|
May/21 | $174913 | $224579 | $223141 | $191829 | $195073 |
|---|
May/22 | $183158 | $223907 | $214920 | $196217 | $199381 |
|---|
May/23 | $176284 | $230448 | $219293 | $193295 | $195650 |
|---|
May/24 | $206199 | $295404 | $279781 | $226119 | $232274 |
|---|
May/25 | $234903 | $335352 | $316484 | $258899 | $263440 |
|---|
|
|
| Average Annual Return [Table Text Block] |
Fund/Index Name | 1 Year | 5 Years | 10 Years |
|---|
U.S. Managed Volatility Fund, Class A Shares | 13.92% | 11.55% | 8.92% |
|---|
S&P 500 Index (TR) | 13.52% | 15.94% | 12.86% |
|---|
Russell 3000 Index (USD) | 13.12% | 15.34% | 12.21% |
|---|
MSCI USA Minimum Volatility (NR) (USD) | 14.50% | 10.03% | 9.98% |
|---|
MSCI USA Minimum Volatility Index (75%)/Russell 3000 Value Index (25%) | 13.42% | 11.27% | 10.17% |
|---|
|
|
| No Deduction of Taxes [Text Block] |
The table and graph presented above do not reflect the deduction of taxes a shareholder would pay on Fund distributions or the redemption of Fund Shares.
|
|
| AssetsNet |
$ 700,961,000
|
|
| Holdings Count | Holding |
208
|
|
| Advisory Fees Paid, Amount |
$ 1,311
|
|
| InvestmentCompanyPortfolioTurnover |
116.00%
|
|
| Additional Fund Statistics [Text Block] |
Key Fund Statistics as of May 31, 2025 | Total Net Assets (000's) | Number of Holdings | Total Advisory Fees Paid (000's) | Portfolio Turnover Rate |
|---|
| $700,961 | 208 | $1,311 | 116% |
|---|
|
|
| Holdings [Text Block] |
Asset/Sector WeightingsFootnote Reference*Value | Value |
|---|
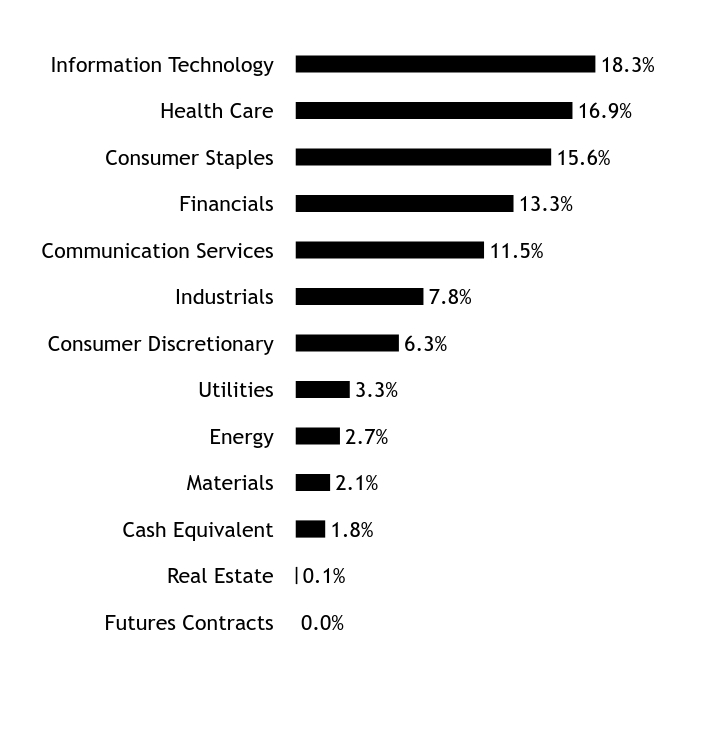
Futures Contracts | 0.0% | Real Estate | 0.1% | Cash Equivalent | 1.8% | Materials | 2.1% | Energy | 2.7% | Utilities | 3.3% | Consumer Discretionary | 6.3% | Industrials | 7.8% | Communication Services | 11.5% | Financials | 13.3% | Consumer Staples | 15.6% | Health Care | 16.9% | Information Technology | 18.3% |
| Footnote | Description | Footnote* | Percentages are calculated based on total net assets. |
|
|
| Largest Holdings [Text Block] |
Holding Name | | | Percentage of
Total Net AssetsFootnote Reference(A) |
|---|
Verizon Communications Inc | | | 2.0% | Cisco Systems Inc | | | 1.9% | AT&T Inc | | | 1.8% | Johnson & Johnson | | | 1.7% | Amdocs Ltd | | | 1.5% | Altria Group Inc | | | 1.4% | Gilead Sciences Inc | | | 1.4% | Comcast Corp, Cl A | | | 1.4% | Bank of New York Mellon Corp/The | | | 1.4% | eBay Inc | | | 1.3% |
| Footnote | Description | Footnote(A) | Cash Equivalents are not shown in the top ten chart. |
|
|
| Material Fund Change [Text Block] |
In early April 2025, Allspring was terminated as a Fund sub-adviser as the firm discontinued its alternative equity strategies. Acadian was added as a sub-adviser at this time and the assets from Allspring were reallocated to Acadian. In addition, during the reporting period, the Advisory fee for the Fund was reduced. |
|
| C000160603 |
|
|
| Shareholder Report [Line Items] |
|
|
| Fund Name |
Global Managed Volatility Fund
|
|
| Class Name |
Class A
|
|
| Trading Symbol |
SGMAX
|
|
| Annual or Semi-Annual Statement [Text Block] |
This annual shareholder report contains important information about Class A Shares of the Global Managed Volatility Fund (the "Fund") for the period from June 1, 2024 to May 31, 2025.
|
|
| Shareholder Report Annual or Semi-Annual |
Annual Shareholder Report
|
|
| Additional Information [Text Block] |
You can find additional information about the Fund at https://www.seic.com/mutual-fund-documentation/prospectuses-and-reports. You can also request this information by contacting us at 1-800-DIAL-SEI.
|
|
| Additional Information Phone Number |
1-800-DIAL-SEI
|
|
| Additional Information Website |
https://www.seic.com/mutual-fund-documentation/prospectuses-and-reports
|
|
| Expenses [Text Block] |
What were the Fund costs for the last year?(based on a hypothetical $10,000 investment) Fund Name | Costs of a $10,000 investment | Costs paid as a percentage of a $10,000 investment |
|---|
Global Managed Volatility Fund, Class A Shares | $27 | 0.25%Footnote Reference(1) |
|---|
| Footnote | Description | Footnote(1) | The expense ratio includes a proxy fee expense. Had this expense been excluded the ratio would have been 0.24%. |
|
|
| Expenses Paid, Amount |
$ 27
|
|
| Expense Ratio, Percent |
0.25%
|
[1] |
| Factors Affecting Performance [Text Block] |
How did the Fund perform in the last year?The Fund outperformed its primary benchmark, the MSCI World Index (Net) (USD), for the 12-month period ending May 31, 2025. The Fund underperformed for the first half of the reporting period due to headwinds to low-volatility, value exposure, and an underweight allocation to the U.S. These trends reversed in 2025 due to heightened market volatility amid uncertainty around U.S. tariff policy and concerns around artificial intelligence (AI) capital expenditures. Fund performance benefited from this market rotation given its low-volatility bias, exposure to value, and underweight to the U.S. Overall, the Fund’s alpha source (the investment approach that an active investment manager takes in an effort to generate excess returns relative to a benchmark) exposures delivered mixed results for the reporting period as positions in low-volatility and value stocks detracted from performance in the first half of the reporting period, but exposure to low-volatility and value stocks in 2025 more than offset the underperformance in 2024. Among the Fund’s sub-advisers, Acadian Asset Management LLC outperformed the benchmark MSCI World Index due to favorable stock selection in the consumer staples, healthcare, and information technology sectors, as well as strong selection among small and mega-cap stocks. LSV Asset Management outperformed the benchmark due to its exposure to value within the low-volatility segment of the market, along with favorable stock selection in the healthcare and consumer staples sectors. During the portion of the reporting period in which Allspring Global Investments (“Allspring”) was a Fund sub-adviser, the manager modestly outperformed the benchmark due to its low-beta exposure (beta is a quantitative measure of the volatility relative to a benchmark) and strong stock selection in the information technology, healthcare, and financials sectors. |
|
| Performance Past Does Not Indicate Future [Text] |
Past performance is not indicative of future performance.
|
|
| Line Graph [Table Text Block] |
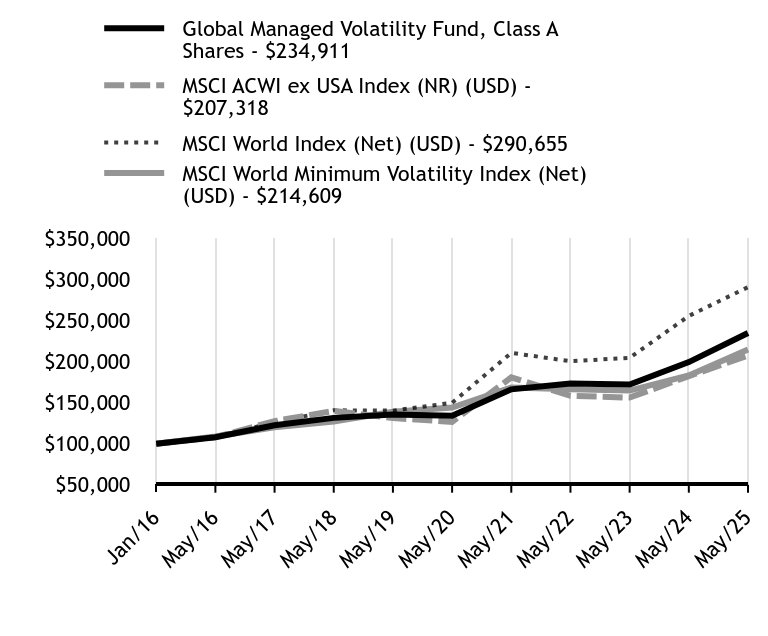
| Global Managed Volatility Fund, Class A Shares - $234911 | MSCI ACWI ex USA Index (NR) (USD) - $207318 | MSCI World Index (Net) (USD) - $290655 | MSCI World Minimum Volatility Index (Net) (USD) - $214609 |
|---|
Jan/16 | $100000 | $100000 | $100000 | $100000 |
|---|
May/16 | $107800 | $107857 | $108273 | $108755 |
|---|
May/17 | $122350 | $127533 | $126055 | $119968 |
|---|
May/18 | $131415 | $139868 | $140637 | $126940 |
|---|
May/19 | $135538 | $131112 | $140229 | $138924 |
|---|
May/20 | $134069 | $126611 | $149758 | $143914 |
|---|
May/21 | $166147 | $180770 | $210598 | $168375 |
|---|
May/22 | $173207 | $158342 | $200456 | $166284 |
|---|
May/23 | $172137 | $156117 | $204608 | $164694 |
|---|
May/24 | $199406 | $182256 | $255596 | $183107 |
|---|
May/25 | $234911 | $207318 | $290655 | $214609 |
|---|
|
|
| Average Annual Return [Table Text Block] |
Fund/Index Name | 1 Year | 5 Years | Annualized
Since
Inception |
|---|
Global Managed Volatility Fund, Class A Shares | 17.81% | 11.87% | 9.57% |
|---|
MSCI ACWI ex USA Index (NR) (USD) | 13.75% | 10.37% | 8.12% |
|---|
MSCI World Index (Net) (USD) | 13.72% | 14.18% | 12.11% |
|---|
MSCI World Minimum Volatility Index (Net) (USD) | 17.20% | 8.32% | 8.52% |
|---|
|
|
| Performance Inception Date |
Jan. 29, 2016
|
|
| No Deduction of Taxes [Text Block] |
The table and graph presented above do not reflect the deduction of taxes a shareholder would pay on Fund distributions or the redemption of Fund Shares.
|
|
| AssetsNet |
$ 2,090,473,000
|
|
| Holdings Count | Holding |
577
|
|
| Advisory Fees Paid, Amount |
$ 4,330
|
|
| InvestmentCompanyPortfolioTurnover |
102.00%
|
|
| Additional Fund Statistics [Text Block] |
Key Fund Statistics as of May 31, 2025 | Total Net Assets (000's) | Number of Holdings | Total Advisory Fees Paid (000's) | Portfolio Turnover Rate |
|---|
| $2,090,473 | 577 | $4,330 | 102% |
|---|
|
|
| Holdings [Text Block] |
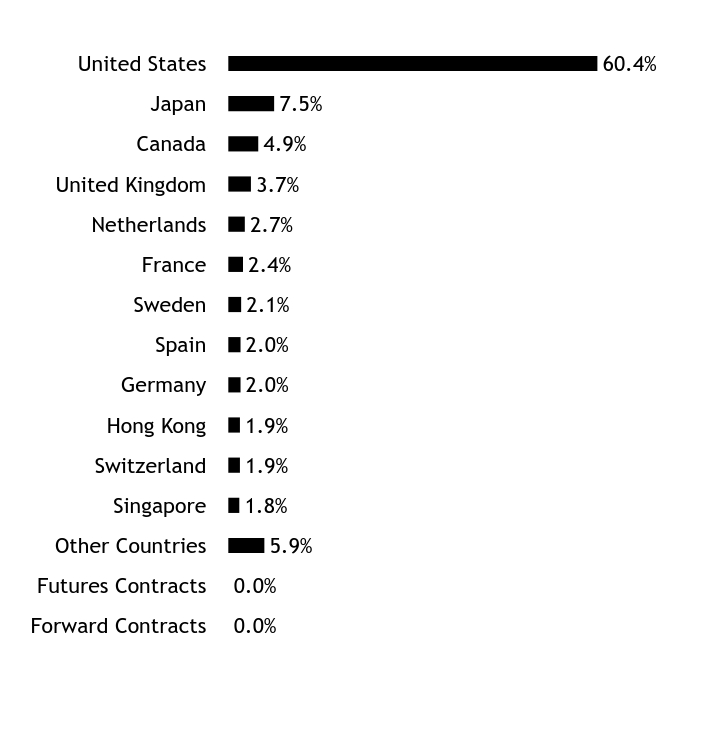
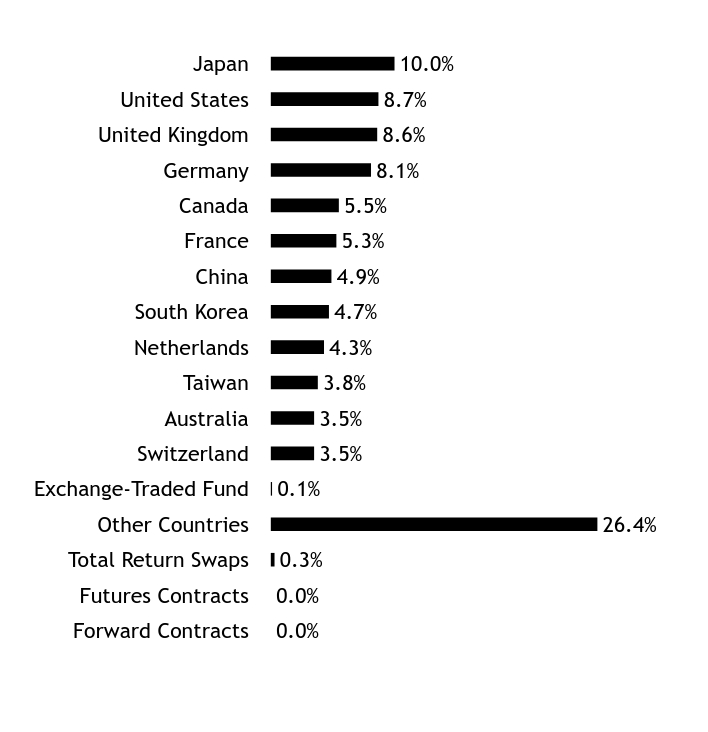
Asset/Country WeightingsFootnote Reference*Value | Value |
|---|
Forward Contracts | 0.0% | Futures Contracts | 0.0% | Other Countries | 5.9% | Singapore | 1.8% | Switzerland | 1.9% | Hong Kong | 1.9% | Germany | 2.0% | Spain | 2.0% | Sweden | 2.1% | France | 2.4% | Netherlands | 2.7% | United Kingdom | 3.7% | Canada | 4.9% | Japan | 7.5% | United States | 60.4% |
| Footnote | Description | Footnote* | Percentages are calculated based on total net assets. |
|
|
| Largest Holdings [Text Block] |
Holding Name | | | Percentage of
Total Net AssetsFootnote Reference(A) |
|---|
Cisco Systems Inc | | | 1.8% | AT&T Inc | | | 1.7% | Verizon Communications Inc | | | 1.7% | Johnson & Johnson | | | 1.3% | Novartis AG | | | 1.3% | Endesa SA | | | 1.2% | Comcast Corp, Cl A | | | 1.2% | Koninklijke Ahold Delhaize NV | | | 1.1% | eBay Inc | | | 1.0% | Imperial Brands PLC | | | 1.0% |
| Footnote | Description | Footnote(A) | Cash Equivalents are not shown in the top ten chart. |
|
|
| Material Fund Change [Text Block] |
In early April 2025, Allspring was terminated as a Fund sub-adviser as the firm discontinued its alternative equity strategies. The assets were reallocated to the Fund’s existing sub-advisers, Acadian Asset Management LLC and LSV Asset Management. |
|
| C000018354 |
|
|
| Shareholder Report [Line Items] |
|
|
| Fund Name |
World Equity Ex-US Fund
|
|
| Class Name |
Class A
|
|
| Trading Symbol |
WEUSX
|
|
| Annual or Semi-Annual Statement [Text Block] |
This annual shareholder report contains important information about Class A Shares of the World Equity Ex-US Fund (the "Fund") for the period from June 1, 2024 to May 31, 2025.
|
|
| Shareholder Report Annual or Semi-Annual |
Annual Shareholder Report
|
|
| Additional Information [Text Block] |
You can find additional information about the Fund at https://www.seic.com/mutual-fund-documentation/prospectuses-and-reports. You can also request this information by contacting us at 1-800-DIAL-SEI. This annual shareholder report describes changes to the Fund that occurred during the reporting period.
|
|
| Additional Information Phone Number |
1-800-DIAL-SEI
|
|
| Additional Information Website |
https://www.seic.com/mutual-fund-documentation/prospectuses-and-reports
|
|
| Expenses [Text Block] |
What were the Fund costs for the last year?(based on a hypothetical $10,000 investment) Fund Name | Costs of a $10,000 investment | Costs paid as a percentage of a $10,000 investment |
|---|
World Equity Ex-US Fund, Class A Shares | $29 | 0.27% |
|---|
|
|
| Expenses Paid, Amount |
$ 29
|
|
| Expense Ratio, Percent |
0.27%
|
|
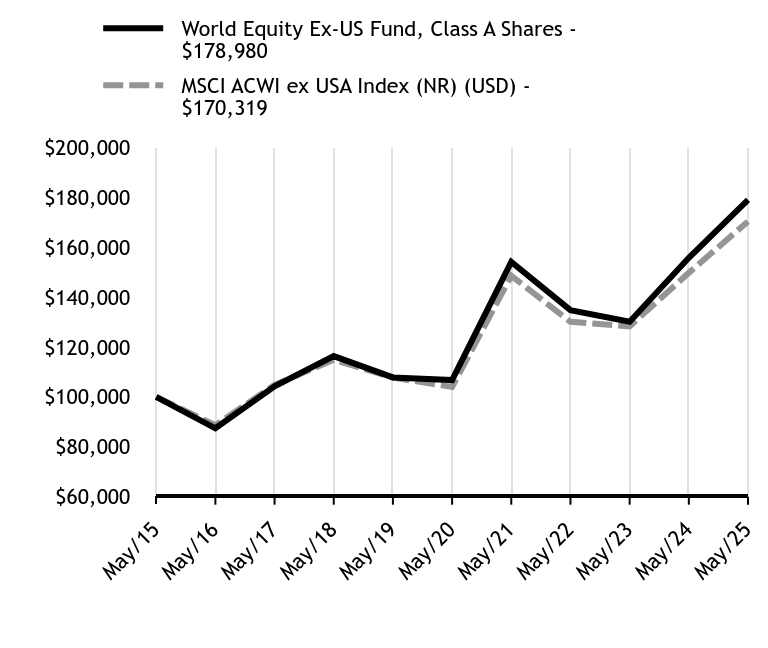
| Factors Affecting Performance [Text Block] |
How did the Fund perform in the last year?The Fund outperformed its benchmark, the MSCI ACWI ex USA Index (NR) (USD)—which tracks the performance of both developed-market and emerging market countries, excluding the United States—for the 12-month period ending May 31, 2025. Alpha source exposures (the investment approach that an active investment manager takes in an effort to generate excess returns relative to a benchmark) contributed positively to Fund performance, particularly value and momentum, as both factors performed well despite the broader underperformance of quality stocks. Four out of the Fund’s five sub-advisers outperformed the benchmark MSCI ACWI ex USA Index (NR) (USD) for the reporting period. Lazard Asset Management LLC's (Lazard) 130/30 Momentum strategy benefited from a favorable momentum environment and effective short positioning. Notably, Lazard is the only Fund manager utilizing derivatives, which comprise approximately 50% of its 160% gross exposure. Acadian Asset Management LLC's outperformance was attributable to strong returns from value and momentum exposures. Pzena Investment Management, LLC, a deep value manager, outperformed due primarily to its allocation to European banks. Lazard’s International Quality Growth strategy also outperformed despite the headwinds faced by quality factors overall. Strong stock selection in the technology sector and in numerous equity markets globally contributed significantly to performance. The performance of Brickwood Asset Management LLP (Brickwood), the Fund’s second value manager, lagged the benchmark over the reporting period, attributable to positions in the consumer discretionary and industrials sectors. Finally, Delaware Investments Fund Advisers, a series of Macquarie Investment Management Business Trust underperformed. As a quality manager with a low-volatility bias, both of its core factors lagged in the strong market environment consistent with our expectations. Stock selection, especially in consumer-focused apparel names, weighed further on performance. |
|
| Performance Past Does Not Indicate Future [Text] |
Past performance is not indicative of future performance.
|
|
| Line Graph [Table Text Block] |
| World Equity Ex-US Fund, Class A Shares - $178980 | MSCI ACWI ex USA Index (NR) (USD) - $170319 |
|---|
May/15 | $100000 | $100000 |
|---|
May/16 | $87398 | $88608 |
|---|
May/17 | $104253 | $104772 |
|---|
May/18 | $116346 | $114906 |
|---|
May/19 | $107802 | $107713 |
|---|
May/20 | $106724 | $104015 |
|---|
May/21 | $154088 | $148508 |
|---|
May/22 | $134779 | $130083 |
|---|
May/23 | $130104 | $128255 |
|---|
May/24 | $155749 | $149729 |
|---|
May/25 | $178980 | $170319 |
|---|
|
|
| Average Annual Return [Table Text Block] |
Fund/Index Name | 1 Year | 5 Years | 10 Years |
|---|
World Equity Ex-US Fund, Class A Shares | 14.92% | 10.89% | 5.99% |
|---|
MSCI ACWI ex USA Index (NR) (USD) | 13.75% | 10.37% | 5.47% |
|---|
|
|
| No Deduction of Taxes [Text Block] |
The table and graph presented above do not reflect the deduction of taxes a shareholder would pay on Fund distributions or the redemption of Fund Shares.
|
|
| AssetsNet |
$ 8,412,365,000
|
|
| Holdings Count | Holding |
994
|
|
| Advisory Fees Paid, Amount |
$ 18,809
|
|
| InvestmentCompanyPortfolioTurnover |
54.00%
|
|
| Additional Fund Statistics [Text Block] |
Key Fund Statistics as of May 31, 2025 | Total Net Assets (000's) | Number of Holdings | Total Advisory Fees Paid (000's) | Portfolio Turnover Rate |
|---|
| $8,412,365 | 994 | $18,809 | 54% |
|---|
|
|
| Holdings [Text Block] |
Asset/Country WeightingsFootnote Reference*Value | Value |
|---|
Futures Contracts | 0.0% | Total Return Swaps | 0.2% | Other Countries | 25.4% | Exchange-Traded Fund | 0.1% | Brazil | 2.7% | Australia | 2.8% | Taiwan | 3.7% | South Korea | 4.0% | Netherlands | 4.6% | Canada | 4.7% | Switzerland | 5.1% | China | 5.9% | France | 7.4% | Germany | 9.0% | Japan | 10.5% | United Kingdom | 11.7% |
| Footnote | Description | Footnote* | Percentages are calculated based on total net assets. |
|
|
| Largest Holdings [Text Block] |
Holding Name | | | Percentage of
Total Net AssetsFootnote Reference(A) |
|---|
Roche Holding AG | | | 1.4% | SAP SE | | | 1.1% | Continental AG | | | 1.0% | Wolters Kluwer NV | | | 1.0% | Reckitt Benckiser Group PLC | | | 1.0% | Teleperformance SE | | | 0.9% | Samsung Electronics Co Ltd | | | 0.9% | Taiwan Semiconductor Manufacturing Co Ltd | | | 0.8% | Bayer AG | | | 0.8% | AIA Group Ltd | | | 0.8% |
| Footnote | Description | Footnote(A) | Cash Equivalents are not shown in the top ten chart. |
|
|
| Material Fund Change [Text Block] |
During the reporting period, Jupiter Asset Management Limited was terminated as sub-adviser and was replaced by Brickwood. Additionally, the portfolio management team currently at Brickwood had previously been employed by Jupiter Asset Management Limited. |
|
| C000054521 |
|
|
| Shareholder Report [Line Items] |
|
|
| Fund Name |
Screened World Equity Ex-US Fund
|
|
| Class Name |
Class A
|
|
| Trading Symbol |
SSEAX
|
|
| Annual or Semi-Annual Statement [Text Block] |
This annual shareholder report contains important information about Class A Shares of the Screened World Equity Ex-US Fund (the "Fund") for the period from June 1, 2024 to May 31, 2025.
|
|
| Shareholder Report Annual or Semi-Annual |
Annual Shareholder Report
|
|
| Additional Information [Text Block] |
You can find additional information about the Fund at https://www.seic.com/mutual-fund-documentation/prospectuses-and-reports. You can also request this information by contacting us at 1-800-DIAL-SEI.
|
|
| Additional Information Phone Number |
1-800-DIAL-SEI
|
|
| Additional Information Website |
https://www.seic.com/mutual-fund-documentation/prospectuses-and-reports
|
|
| Expenses [Text Block] |
What were the Fund costs for the last year?(based on a hypothetical $10,000 investment) Fund Name | Costs of a $10,000 investment | Costs paid as a percentage of a $10,000 investment |
|---|
Screened World Equity Ex-US Fund, Class A Shares | $38 | 0.35% |
|---|
|
|
| Expenses Paid, Amount |
$ 38
|
|
| Expense Ratio, Percent |
0.35%
|
|
| Factors Affecting Performance [Text Block] |
How did the Fund perform in the last year?The Fund outperformed its benchmark, the MSCI ACWI ex USA Index (NR) (USD)—which tracks the performance of both developed-market and emerging market countries, excluding the United States—for the 12-month period ending May 31, 2025. Alpha source exposures (the investment approach that an active investment manager takes in an effort to generate excess returns relative to a benchmark) contributed positively to Fund performance, particularly value and momentum, as both factors performed well despite the broader underperformance of quality stocks. Three of the Fund’s four sub-advisers outperformed the benchmark MSCI ACWI ex USA Index over the reporting period. Lazard Asset Management LLC's (“Lazard”) 130/30 Momentum strategy benefited from a favorable momentum environment and effective short positioning. Notably, Lazard is the only Fund manager utilizing derivatives, which comprise approximately 50% of its 160% gross exposure. Acadian Asset Management LLC’s outperformance was attributable to strong returns from value and momentum exposures. Lazard’s International Quality Growth strategy also outperformed the Fund’s benchmark despite the headwinds faced by quality factors overall. Strong stock selection in the information technology sector and in numerous equity markets globally contributed significantly to performance. The performance of Brickwood Asset Management LLP (“Brickwood”), the Fund’s International Value strategy manager, lagged the benchmark during the reporting period. The manager’s underperformance was driven by positions in the consumer discretionary and information technology sectors. |
|
| Performance Past Does Not Indicate Future [Text] |
Past performance is not indicative of future performance.
|
|
| Line Graph [Table Text Block] |
| Screened World Equity Ex-US Fund, Class A Shares - $208859 | MSCI ACWI ex USA Index (NR) (USD) - $170319 |
|---|
May/15 | $100000 | $100000 |
|---|
May/16 | $91216 | $88608 |
|---|
May/17 | $113096 | $104772 |
|---|
May/18 | $128074 | $114906 |
|---|
May/19 | $119662 | $107713 |
|---|
May/20 | $119864 | $104015 |
|---|
May/21 | $178040 | $148508 |
|---|
May/22 | $158475 | $130083 |
|---|
May/23 | $154436 | $128255 |
|---|
May/24 | $182133 | $149729 |
|---|
May/25 | $208859 | $170319 |
|---|
|
|
| Average Annual Return [Table Text Block] |
Fund/Index Name | 1 Year | 5 Years | 10 Years |
|---|
Screened World Equity Ex-US Fund, Class A Shares | 14.67% | 11.75% | 7.64% |
|---|
MSCI ACWI ex USA Index (NR) (USD) | 13.75% | 10.37% | 5.47% |
|---|
|
|
| No Deduction of Taxes [Text Block] |
The table and graph presented above do not reflect the deduction of taxes a shareholder would pay on Fund distributions or the redemption of Fund Shares.
|
|
| AssetsNet |
$ 175,851,000
|
|
| Holdings Count | Holding |
849
|
|
| Advisory Fees Paid, Amount |
$ 379
|
|
| InvestmentCompanyPortfolioTurnover |
67.00%
|
|
| Additional Fund Statistics [Text Block] |
Key Fund Statistics as of May 31, 2025 | Total Net Assets (000's) | Number of Holdings | Total Advisory Fees Paid (000's) | Portfolio Turnover Rate |
|---|
| $175,851 | 849 | $379 | 67% |
|---|
|
|
| Holdings [Text Block] |
Asset/Country WeightingsFootnote Reference*Value | Value |
|---|
Forward Contracts | 0.0% | Futures Contracts | 0.0% | Total Return Swaps | 0.3% | Other Countries | 26.4% | Exchange-Traded Fund | 0.1% | Switzerland | 3.5% | Australia | 3.5% | Taiwan | 3.8% | Netherlands | 4.3% | South Korea | 4.7% | China | 4.9% | France | 5.3% | Canada | 5.5% | Germany | 8.1% | United Kingdom | 8.6% | United States | 8.7% | Japan | 10.0% |
| Footnote | Description | Footnote* | Percentages are calculated based on total net assets. |
|
|
| Largest Holdings [Text Block] |
Holding Name | | | Percentage of
Total Net AssetsFootnote Reference(A) |
|---|
AP Moller - Maersk A/S, Cl B | | | 1.3% | Flow Traders Ltd | | | 1.3% | AIA Group Ltd | | | 1.2% | Continental AG | | | 1.1% | Burberry Group PLC | | | 1.0% | SAP SE | | | 0.9% | SES SA, Cl A | | | 0.9% | Reckitt Benckiser Group PLC | | | 0.9% | Dollarama Inc | | | 0.8% | KT&G Corp | | | 0.8% |
| Footnote | Description | Footnote(A) | Cash Equivalents are not shown in the top ten chart. |
|
|
| Material Fund Change [Text Block] |
During the reporting period, Jupiter Asset Management Limited was terminated as sub-adviser and was replaced by Brickwood Asset Management LLP. Additionally, the portfolio management team currently at Brickwood Asset Management LLP had previously been employed by Jupiter Asset Management Limited. |
|
| C000030145 |
|
|
| Shareholder Report [Line Items] |
|
|
| Fund Name |
Emerging Markets Equity Fund
|
|
| Class Name |
Class A
|
|
| Trading Symbol |
SMQFX
|
|
| Annual or Semi-Annual Statement [Text Block] |
This annual shareholder report contains important information about Class A Shares of the Emerging Markets Equity Fund (the "Fund") for the period from June 1, 2024 to May 31, 2025.
|
|
| Shareholder Report Annual or Semi-Annual |
Annual Shareholder Report
|
|
| Additional Information [Text Block] |
You can find additional information about the Fund at https://www.seic.com/mutual-fund-documentation/prospectuses-and-reports. You can also request this information by contacting us at 1-800-DIAL-SEI.
|
|
| Additional Information Phone Number |
1-800-DIAL-SEI
|
|
| Additional Information Website |
https://www.seic.com/mutual-fund-documentation/prospectuses-and-reports
|
|
| Expenses [Text Block] |
What were the Fund costs for the last year?(based on a hypothetical $10,000 investment) Fund Name | Costs of a $10,000 investment | Costs paid as a percentage of a $10,000 investment |
|---|
Emerging Markets Equity Fund, Class A Shares | $67 | 0.63% |
|---|
|
|
| Expenses Paid, Amount |
$ 67
|
|
| Expense Ratio, Percent |
0.63%
|
|
| Factors Affecting Performance [Text Block] |
How did the Fund perform in the last year?The Fund underperformed its benchmark, the MSCI EFM (Emerging+Frontier Markets) Index (Net) (USD) ("MSCI EFM Index"), for the 12-month period ending May 31, 2025. Large-cap stocks drove the benchmark MSCI EFM Index’s gains over the reporting period, led by a combination of enthusiasm over artificial intelligence (AI)-driven growth in shares of large-cap Chinese ecommerce and internet companies, expectations of government support, and continued strength in Taiwanese technology stocks from AI demand from U.S. technology companies. The Fund is underweight to these themes and areas of the market due to its structural allocation to frontier- and emerging-market small-cap stocks. Consequently, China was the biggest detractor from performance among countries given its underweight position in the Fund. Communication services and information technology were the biggest detractors among sectors for the period. Regarding the Fund’s sub-advisers, JOHCM (USA) Inc. (“JOHCM”) weighed on performance as its momentum investment style (in which investors buy stocks that have shown recent price gains and sell stocks that have recently declined) faced headwinds over the reporting period from China’s resurgence and India’s underperformance. JOHCM’s focus on small-cap stocks also had a negative impact on Fund performance as large caps outperformed over the period. Causeway Capital Management LLC’s multifactor investment approach faced headwinds as momentum and quality both lagged the market over the period; this was not enough to offset the outperformance of the manager’s exposure to the value factor. WCM Investment Management, LLC was the largest contributor to Fund performance due to positive stock selection. RWC Asset Advisors (US) LLC performed well due to frontier markets’ outperformance versus emerging markets during the reporting period. Robeco Institutional Asset Management US Inc. (“Robeco”) also contributed positively to Fund performance over the period due to a tailwind to value stocks. Robeco posted strong results in the financials, real estate, and industrials sectors, especially Greek banks and United Arab Emirates real estate stocks. |
|
| Performance Past Does Not Indicate Future [Text] |
Past performance is not indicative of future performance.
|
|
| Line Graph [Table Text Block] |
| Emerging Markets Equity Fund, Class A Shares - $171048 | MSCI ACWI ex USA Index (NR) (USD) - $170319 | MSCI EFM (Emerging+Frontier Markets) Index (Net) (USD) - $146874 |
|---|
May/15 | $100000 | $100000 | $100000 |
|---|
May/16 | $87474 | $88608 | $82567 |
|---|
May/17 | $106386 | $104772 | $104930 |
|---|
May/18 | $119542 | $114906 | $119457 |
|---|
May/19 | $106886 | $107713 | $109271 |
|---|
May/20 | $101393 | $104015 | $104349 |
|---|
May/21 | $156498 | $148508 | $157289 |
|---|
May/22 | $135882 | $130083 | $126249 |
|---|
May/23 | $129313 | $128255 | $115521 |
|---|
May/24 | $153441 | $149729 | $129853 |
|---|
May/25 | $171048 | $170319 | $146874 |
|---|
|
|
| Average Annual Return [Table Text Block] |
Fund/Index Name | 1 Year | 5 Years | 10 Years |
|---|
Emerging Markets Equity Fund, Class A Shares | 11.47% | 11.03% | 5.51% |
|---|
MSCI ACWI ex USA Index (NR) (USD) | 13.75% | 10.37% | 5.47% |
|---|
MSCI EFM (Emerging+Frontier Markets) Index (Net) (USD) | 13.11% | 7.08% | 3.92% |
|---|
|
|
| No Deduction of Taxes [Text Block] |
The table and graph presented above do not reflect the deduction of taxes a shareholder would pay on Fund distributions or the redemption of Fund Shares.
|
|
| AssetsNet |
$ 767,426,000
|
|
| Holdings Count | Holding |
412
|
|
| Advisory Fees Paid, Amount |
$ 4,510
|
|
| InvestmentCompanyPortfolioTurnover |
54.00%
|
|
| Additional Fund Statistics [Text Block] |
Key Fund Statistics as of May 31, 2025 | Total Net Assets (000's) | Number of Holdings | Total Advisory Fees Paid (000's) | Portfolio Turnover Rate |
|---|
| $767,426 | 412 | $4,510 | 54% |
|---|
|
|
| Holdings [Text Block] |
Asset/Country WeightingsFootnote Reference*Value | Value |
|---|
Futures Contracts | 0.0% | Other Countries | 20.6% | Kazakhstan | 2.1% | Vietnam | 2.3% | Greece | 2.5% | Philippines | 2.5% | United Arab Emirates | 2.8% | South Africa | 3.1% | Indonesia | 3.8% | Brazil | 5.3% | India | 10.2% | Taiwan | 12.0% | South Korea | 12.8% | China | 18.1% |
| Footnote | Description | Footnote* | Percentages are calculated based on total net assets. |
|
|
| Largest Holdings [Text Block] |
Holding Name | | | Percentage of
Total Net AssetsFootnote Reference(A) |
|---|
Taiwan Semiconductor Manufacturing Co Ltd | | | 6.1% | Tencent Holdings Ltd | | | 2.0% | Alibaba Group Holding Ltd | | | 1.8% | Naspers Ltd, Cl N | | | 1.7% | Emaar Properties PJSC | | | 1.4% | Samsung Electronics Co Ltd | | | 1.3% | Hana Financial Group Inc | | | 1.2% | Contemporary Amperex Technology Co Ltd, Cl A | | | 1.1% | Piraeus Financial Holdings SA | | | 1.0% | Itau Unibanco Holding SA ADR | | | 1.0% |
| Footnote | Description | Footnote(A) | Cash Equivalents are not shown in the top ten chart. |
|
|
| Material Fund Change [Text Block] |
There were no material fund changes during the reporting period. |
|
| C000039813 |
|
|
| Shareholder Report [Line Items] |
|
|
| Fund Name |
Opportunistic Income Fund
|
|
| Class Name |
Class A
|
|
| Trading Symbol |
ENIAX
|
|
| Annual or Semi-Annual Statement [Text Block] |
This annual shareholder report contains important information about Class A Shares of the Opportunistic Income Fund (the "Fund") for the period from June 1, 2024 to May 31, 2025.
|
|
| Shareholder Report Annual or Semi-Annual |
Annual Shareholder Report
|
|
| Additional Information [Text Block] |
You can find additional information about the Fund at https://www.seic.com/mutual-fund-documentation/prospectuses-and-reports. You can also request this information by contacting us at 1-800-DIAL-SEI.
|
|
| Additional Information Phone Number |
1-800-DIAL-SEI
|
|
| Additional Information Website |
https://www.seic.com/mutual-fund-documentation/prospectuses-and-reports
|
|
| Expenses [Text Block] |
What were the Fund costs for the last year?(based on a hypothetical $10,000 investment) Fund Name | Costs of a $10,000 investment | Costs paid as a percentage of a $10,000 investment |
|---|
Opportunistic Income Fund, Class A Shares | $30 | 0.29% |
|---|
|
|
| Expenses Paid, Amount |
$ 30
|
|
| Expense Ratio, Percent |
0.29%
|
|
| Factors Affecting Performance [Text Block] |
How did the Fund perform in the last year?The Fund outperformed its benchmark, the ICE BofA USD 3-Month Deposit Offered Rate Constant Maturity Index, which tracks the performance of a synthetic asset paying a deposit offered rate to the stated maturity—for the 12-month period ending May 31, 2025. The Federal Reserve (Fed) surprised the markets by reducing the federal-funds rate by 50 basis points at its September 2024 meeting. The central bank subsequently implemented additional 25-basis-point cuts following its meetings in November and December 2024. The Fed then paused its rate-cutting cycle through the end of the reporting period as it continues to evaluate the effects of trade and fiscal policy on the broader economy and financial markets. Fund performance for the reporting period was bolstered by holdings in spread sectors. An allocation to corporate bonds contributed to Fund performance as spreads in the front end of the yield curve remained relatively steady despite volatility during the first five months of 2025. The Fund’s positions in asset-backed securities (ABS) enhanced performance as various subsectors, such as franchises and student loans, performed well. Holdings in commercial mortgage-backed securities (CMBS) also contributed positively to Fund performance. Positions in non-Agency MBS contributed positively to performance as the sector remained supported by home- price appreciation and limited supply. An allocation to collateralized loan obligations (CLOs) also added to performance. The Fund’s holdings in bank loans performed well and were positive contributors during the reporting period as credit fundamentals remained on solid footing and risk assets outperformed the overall fixed-income market. Regarding the Fund’s sub-advisers, Manulife Investment Management (US) LLC benefited from allocations to ABS, CMBS, and Non-Agency MBS. Wellington Management Company, LLP's strong performance for the period was attributable to an allocation to non-agency MBS, corporate bonds, and AAA CLOs. Ares Capital Management II, LLC's performance was enhanced by positioning in bank loans. The Fund’s use of derivatives had no material impact on performance during the period. |
|
| Performance Past Does Not Indicate Future [Text] |
Past performance is not indicative of future performance.
|
|
| Line Graph [Table Text Block] |
| Opportunistic Income Fund, Class A Shares - $147228 | Bloomberg U.S. Aggregate Bond Index (TR) (USD) - $115957 | ICE BofA USD 3-Month Deposit Offered Rate Constant Maturity Index - $123449 |
|---|
May/15 | $100000 | $100000 | $100000 |
|---|
May/16 | $100929 | $102995 | $100375 |
|---|
May/17 | $105541 | $104621 | $101205 |
|---|
May/18 | $109088 | $104229 | $102645 |
|---|
May/19 | $113340 | $110900 | $105253 |
|---|
May/20 | $113088 | $121342 | $107699 |
|---|
May/21 | $121112 | $120850 | $108000 |
|---|
May/22 | $119936 | $110914 | $108068 |
|---|
May/23 | $125267 | $108537 | $111439 |
|---|
May/24 | $137523 | $109954 | $117555 |
|---|
May/25 | $147228 | $115957 | $123449 |
|---|
|
|
| Average Annual Return [Table Text Block] |
Fund/Index Name | 1 Year | 5 Years | 10 Years |
|---|
Opportunistic Income Fund, Class A Shares | 7.06% | 5.42% | 3.94% |
|---|
Bloomberg U.S. Aggregate Bond Index (TR) (USD) | 5.46% | -0.90% | 1.49% |
|---|
ICE BofA USD 3-Month Deposit Offered Rate Constant Maturity Index | 5.01% | 2.77% | 2.13% |
|---|
|
|
| No Deduction of Taxes [Text Block] |
The table and graph presented above do not reflect the deduction of taxes a shareholder would pay on Fund distributions or the redemption of Fund Shares.
|
|
| AssetsNet |
$ 406,809,000
|
|
| Holdings Count | Holding |
901
|
|
| Advisory Fees Paid, Amount |
$ 866
|
|
| InvestmentCompanyPortfolioTurnover |
48.00%
|
|
| Additional Fund Statistics [Text Block] |
Key Fund Statistics as of May 31, 2025 | Total Net Assets (000's) | Number of Holdings | Total Advisory Fees Paid (000's) | Portfolio Turnover Rate |
|---|
| $406,809 | 901 | $866 | 48% |
|---|
|
|
| Holdings [Text Block] |
Asset/Sector WeightingsFootnote Reference*Value | Value |
|---|
Futures Contracts | 0.0% | Municipal Bond | 0.0% | Information Technology | 0.1% | Communication Services | 0.1% | Consumer Staples | 0.1% | Real Estate | 0.2% | Commercial Paper | 0.2% | Health Care | 0.2% | Warrants | 0.2% | Energy | 0.2% | Utilities | 0.3% | Materials | 0.4% | Consumer Discretionary | 0.5% | Industrials | 0.8% | U.S. Treasury Obligations | 1.3% | Repurchase Agreement | 2.0% | Financials | 2.2% | Cash Equivalent | 4.1% | Mortgage-Backed Securities | 27.7% | Asset-Backed Securities | 29.0% | Loan Participations | 31.9% |
| Footnote | Description | Footnote* | Percentages are calculated based on total net assets. |
|
|
| Largest Holdings [Text Block] |
Holding Name | Coupon Rate | Maturity Date | Percentage of Total
Net AssetsFootnote Reference(A) |
|---|
Towd Point Mortgage Trust, Ser 2019-HY2, Cl M2, TSFR1M + 2.014% | 6.339%
| 05/25/58
| 0.7% | U.S. Treasury Bills | 4.249%
| 06/03/25
| 0.6% | FHLMC STACR REMIC Trust, Ser 2023-HQA1, Cl M1B, SOFR30A + 3.500% | 7.822%
| 05/25/43
| 0.5% | FHLMC STACR REMIC Trust, Ser 2023-DNA1, Cl M1B, SOFR30A + 3.100% | 7.421%
| 03/25/43
| 0.5% | FHLMC STACR REMIC Trust, Ser 2022-DNA3, Cl M1B, SOFR30A + 2.900% | 7.222%
| 04/25/42
| 0.5% | Connecticut Avenue Securities Trust, Ser 2023-R04, Cl 1M1, SOFR30A + 2.300% | 6.621%
| 05/25/43
| 0.5% | Sesac Finance LLC, Ser 2019-1, Cl A2 | 5.216%
| 07/25/49
| 0.5% | GRACIE POINT INTERNATIONAL FUNDING, Ser 2023-1A, Cl A, SOFR90A + 1.950% | 6.298%
| 09/01/26
| 0.5% | SLM Private Credit Student Loan Trust, Ser 2006-B, Cl A5, TSFR3M + 0.532% | 4.831%
| 12/15/39
| 0.5% | Structured Asset Investment Loan Trust, Ser 2004-8, Cl A8, TSFR1M + 1.114% | 5.439%
| 09/25/34
| 0.4% |
| Footnote | Description | Footnote(A) | Cash Equivalents and Short-Term Investments are not shown in the top ten chart. |
|
|
| Material Fund Change [Text Block] |
There were no material fund changes during the reporting period. |
|
| C000018355 |
|
|
| Shareholder Report [Line Items] |
|
|
| Fund Name |
Core Fixed Income Fund
|
|
| Class Name |
Class A
|
|
| Trading Symbol |
SCOAX
|
|
| Annual or Semi-Annual Statement [Text Block] |
This annual shareholder report contains important information about Class A Shares of the Core Fixed Income Fund (the "Fund") for the period from June 1, 2024 to May 31, 2025.
|
|
| Shareholder Report Annual or Semi-Annual |
Annual Shareholder Report
|
|
| Additional Information [Text Block] |
You can find additional information about the Fund at https://www.seic.com/mutual-fund-documentation/prospectuses-and-reports. You can also request this information by contacting us at 1-800-DIAL-SEI.
|
|
| Additional Information Phone Number |
1-800-DIAL-SEI
|
|
| Additional Information Website |
https://www.seic.com/mutual-fund-documentation/prospectuses-and-reports
|
|
| Expenses [Text Block] |
What were the Fund costs for the last year?(based on a hypothetical $10,000 investment) Fund Name | Costs of a $10,000 investment | Costs paid as a percentage of a $10,000 investment |
|---|
Core Fixed Income Fund, Class A Shares | $12 | 0.12% |
|---|
|
|
| Expenses Paid, Amount |
$ 12
|
|
| Expense Ratio, Percent |
0.12%
|
|
| Factors Affecting Performance [Text Block] |
How did the Fund perform in the last year?The Fund modestly outperformed its benchmark, the Bloomberg U.S. Aggregate Bond Index (TR) (USD)—which tracks the performance of fixed-rate, publicly issued, non-investment-grade bonds—for the 12-month period ending May 31, 2025. The Federal Reserve (Fed) surprised the markets by reducing the federal-funds rate by 50 basis points at its September 2024 meeting. The central bank subsequently implemented additional 25-basis-point cuts following its meetings in November and December 2024. The Fed then paused its rate-cutting cycle through the end of the reporting period as it continues to evaluate the effects of trade and fiscal policy on the broader economy and financial markets. Fund performance for the reporting period benefited from holdings in spread sectors. Both an overweight position and security selection in agency mortgage-backed securities (MBS) contributed to Fund performance given the managers’ general preference for specified pools. Positioning within the corporate credit sector bolstered Fund performance due to security selection in the industrials sector. An overweight to asset-backed securities (ABS) added to Fund performance as the managers preferred prime tranches within auto loans and credit cards. Within commercial mortgage-backed securities (CMBS), allocations to higher-quality tranches and class-A properties contributed. The Fund’s slightly long duration posture had minimal impact on performance while a steepening yield curve position had a positive impact as the curve steepened over the period. Regarding the Fund’s sub-advisers, Allspring Global Investments, LLC benefited from security selection in both corporate bonds and securitized assets. Jennison Associates LLC’s yield-curve positioning enhanced Fund performance as the curve steepened over the period. Metropolitan West Asset Management, LLC outperformed due to an overweight to agency MBS. The performance of MetLife Investment Management, LLC was bolstered by security selection within the corporate sector. The Fund’s use of derivatives had no material impact on performance during the reporting period. |
|
| Performance Past Does Not Indicate Future [Text] |
Past performance is not indicative of future performance.
|
|
| Line Graph [Table Text Block] |
| Core Fixed Income Fund, Class A Shares - $120922 | Bloomberg U.S. Aggregate Bond Index (TR) (USD) - $115957 |
|---|
May/15 | $100000 | $100000 |
|---|
May/16 | $102974 | $102995 |
|---|
May/17 | $105558 | $104621 |
|---|
May/18 | $105745 | $104229 |
|---|
May/19 | $112852 | $110900 |
|---|
May/20 | $124339 | $121342 |
|---|
May/21 | $125584 | $120850 |
|---|
May/22 | $114881 | $110914 |
|---|
May/23 | $112397 | $108537 |
|---|
May/24 | $114188 | $109954 |
|---|
May/25 | $120922 | $115957 |
|---|
|
|
| Average Annual Return [Table Text Block] |
Fund/Index Name | 1 Year | 5 Years | 10 Years |
|---|
Core Fixed Income Fund, Class A Shares | 5.90% | -0.56% | 1.92% |
|---|
Bloomberg U.S. Aggregate Bond Index (TR) (USD) | 5.46% | -0.90% | 1.49% |
|---|
|
|
| No Deduction of Taxes [Text Block] |
The table and graph presented above do not reflect the deduction of taxes a shareholder would pay on Fund distributions or the redemption of Fund Shares.
|
|
| AssetsNet |
$ 8,868,764,000
|
|
| Holdings Count | Holding |
3,315
|
|
| Advisory Fees Paid, Amount |
$ 7,452
|
|
| InvestmentCompanyPortfolioTurnover |
373.00%
|
|
| Additional Fund Statistics [Text Block] |
Key Fund Statistics as of May 31, 2025 | Total Net Assets (000's) | Number of Holdings | Total Advisory Fees Paid (000's) | Portfolio Turnover Rate |
|---|
| $8,868,764 | 3,315 | $7,452 | 373% |
|---|
|
|
| Holdings [Text Block] |
Asset/Sector WeightingsFootnote Reference*Value | Value |
|---|
Futures Contracts | 0.0% | Purchased Swaption | 0.0% | Municipal Bonds | 0.1% | U.S. Government Agency Obligations | 0.2% | Sovereign Debt | 0.3% | Materials | 0.5% | Real Estate | 0.9% | Consumer Discretionary | 1.0% | Energy | 1.4% | Consumer Staples | 1.5% | Information Technology | 1.6% | Communication Services | 1.7% | Industrials | 1.8% | Health Care | 2.3% | Cash Equivalent | 2.6% | Utilities | 3.1% | Financials | 7.1% | Asset-Backed Securities | 7.4% | U.S. Treasury Obligations | 30.8% | Mortgage-Backed Securities | 41.9% |
| Footnote | Description | Footnote* | Percentages are calculated based on total net assets. |
|
|
| Largest Holdings [Text Block] |
Holding Name | Coupon Rate | Maturity Date | Percentage of Total
Net AssetsFootnote Reference(A) |
|---|
U.S. Treasury Notes | 4.000%
| 05/31/30
| 3.5% | U.S. Treasury Notes | 3.750%
| 05/15/28
| 2.6% | U.S. Treasury Bonds | 4.750%
| 02/15/45
| 1.9% | U.S. Treasury Bonds | 4.750%
| 05/15/55
| 1.7% | U.S. Treasury Notes | 3.875%
| 05/31/27
| 1.6% | U.S. Treasury Notes | 4.125%
| 05/31/32
| 1.6% | U.S. Treasury Bills | 4.244%
| 07/24/25
| 1.5% | U.S. Treasury Notes | 4.250%
| 05/15/35
| 1.0% | UMBS | 3.500%
| 06/15/55
| 1.0% | U.S. Treasury Notes | 3.875%
| 04/30/30
| 0.9% |
| Footnote | Description | Footnote(A) | Cash Equivalents are not shown in the top ten chart. |
|
|
| Material Fund Change [Text Block] |
During the fourth quarter of 2024, Western Asset Management was removed as a Fund sub-adviser. Western’s allocation was split among the existing Fund managers. |
|
| C000018352 |
|
|
| Shareholder Report [Line Items] |
|
|
| Fund Name |
High Yield Bond Fund
|
|
| Class Name |
Class A
|
|
| Trading Symbol |
SGYAX
|
|
| Annual or Semi-Annual Statement [Text Block] |
This annual shareholder report contains important information about Class A Shares of the High Yield Bond Fund (the "Fund") for the period from June 1, 2024 to May 31, 2025.
|
|
| Shareholder Report Annual or Semi-Annual |
Annual Shareholder Report
|
|
| Additional Information [Text Block] |
You can find additional information about the Fund at https://www.seic.com/mutual-fund-documentation/prospectuses-and-reports. You can also request this information by contacting us at 1-800-DIAL-SEI.
|
|
| Additional Information Phone Number |
1-800-DIAL-SEI
|
|
| Additional Information Website |
https://www.seic.com/mutual-fund-documentation/prospectuses-and-reports
|
|
| Expenses [Text Block] |
What were the Fund costs for the last year?(based on a hypothetical $10,000 investment) Fund Name | Costs of a $10,000 investment | Costs paid as a percentage of a $10,000 investment |
|---|
High Yield Bond Fund, Class A Shares | $30 | 0.29% |
|---|
|
|
| Expenses Paid, Amount |
$ 30
|
|
| Expense Ratio, Percent |
0.29%
|
|
| Factors Affecting Performance [Text Block] |
How did the Fund perform in the last year?The Fund modestly outperformed its benchmark, the ICE BofA U.S. High Yield Constrained Index (USD), over the 12-month period ending May 31, 2025. Positive contributors to Fund performance for the reporting period included an overweight position and security selection in the healthcare sector, security selection in telecommunications, and an underweight position and security selection in the leisure sector. Fund performance was hampered by security selection in the transportation, retail, and basic industry sectors. Among the Fund’s sub-advisers, Ares Capital Management II, LLC outperformed the benchmark ICE BofA U.S. High Yield Constrained Index (USD) due to security selection in the healthcare sector, and both an underweight allocation to and security selection in retail. Benefit Street Partners, LLC's outperformance was attributable to security selection in financial services and technology and electronics. Brigade Capital Management, LP outperformed due to an overweight to and security selection in the healthcare and telecommunications sectors. J.P. Morgan Investment Management, Inc.'s outperformance resulted from an overweight position and security selection in media, and an underweight to and security selection in capital goods. T. Rowe Price Associates, Inc. lagged the benchmark due to an overweight to and security selection in energy, as well as security selection in retail. SEI Investment Management Corporation’s longstanding allocation to structured credit underperformed the broader high-yield market over the reporting period. Regarding the use of derivatives during the reporting period, the Fund employed currency forwards for the Canadian dollar and the Australian dollar. These positions did not have an impact on Fund performance. |
|
| Performance Past Does Not Indicate Future [Text] |
Past performance is not indicative of future performance.
|
|
| Line Graph [Table Text Block] |
| High Yield Bond Fund, Class A Shares - $171263 | Bloomberg U.S. Aggregate Bond Index (TR) (USD) - $115957 | ICE BofA U.S. High Yield Constrained Index (USD) - $161818 |
|---|
May/15 | $100000 | $100000 | $100000 |
|---|
May/16 | $97833 | $102995 | $99116 |
|---|
May/17 | $112559 | $104621 | $112837 |
|---|
May/18 | $116597 | $104229 | $115424 |
|---|
May/19 | $122795 | $110900 | $121616 |
|---|
May/20 | $118213 | $121342 | $121984 |
|---|
May/21 | $145259 | $120850 | $140441 |
|---|
May/22 | $140769 | $110914 | $133413 |
|---|
May/23 | $139081 | $108537 | $133187 |
|---|
May/24 | $156195 | $109954 | $148082 |
|---|
May/25 | $171263 | $115957 | $161818 |
|---|
|
|
| Average Annual Return [Table Text Block] |
Fund/Index Name | 1 Year | 5 Years | 10 Years |
|---|
High Yield Bond Fund, Class A Shares | 9.65% | 7.70% | 5.53% |
|---|
Bloomberg U.S. Aggregate Bond Index (TR) (USD) | 5.46% | -0.90% | 1.49% |
|---|
ICE BofA U.S. High Yield Constrained Index (USD) | 9.28% | 5.81% | 4.93% |
|---|
|
|
| No Deduction of Taxes [Text Block] |
The table and graph presented above do not reflect the deduction of taxes a shareholder would pay on Fund distributions or the redemption of Fund Shares.
|
|
| AssetsNet |
$ 2,004,311,000
|
|
| Holdings Count | Holding |
1,284
|
|
| Advisory Fees Paid, Amount |
$ 5,033
|
|
| InvestmentCompanyPortfolioTurnover |
53.00%
|
|
| Additional Fund Statistics [Text Block] |
Key Fund Statistics as of May 31, 2025 | Total Net Assets (000's) | Number of Holdings | Total Advisory Fees Paid (000's) | Portfolio Turnover Rate |
|---|
| $2,004,311 | 1,284 | $5,033 | 53% |
|---|
|
|
| Holdings [Text Block] |
Asset/Sector WeightingsFootnote Reference*Value | Value |
|---|
Forwards | 0.0% | Warrants | 0.1% | U.S. Treasury Obligations | 0.2% | Preferred Stock | 0.5% | Cash Equivalent | 2.3% | Real Estate | 2.5% | Utilities | 2.7% | Consumer Staples | 3.0% | Information Technology | 3.5% | Health Care | 6.5% | Materials | 6.6% | Asset-Backed Securities | 7.5% | Financials | 8.4% | Loan Participations | 8.6% | Industrials | 9.8% | Energy | 10.1% | Consumer Discretionary | 12.2% | Communication Services | 14.3% |
| Footnote | Description | Footnote* | Percentages are calculated based on total net assets. |
|
|
| Largest Holdings [Text Block] |
Holding Name | Coupon Rate | Maturity Date | Percentage of Total
Net AssetsFootnote Reference(A) |
|---|
CCO Holdings LLC | 4.250%
| 01/15/34
| 0.7% | X Corp., Tranche B-3 Term Loan, 1st Lien, FIXED + 9.500% | 9.500%
| 10/26/29
| 0.7% | 1261229 BC | 10.000%
| 04/15/32
| 0.5% | DISH Network | 11.750%
| 11/15/27
| 0.5% | Zayo Group Holdings | 4.000%
| 03/01/27
| 0.4% | TransDigm | 7.125%
| 12/01/31
| 0.4% | Medline Borrower LP | 3.875%
| 04/01/29
| 0.4% | Voya CLO, Ser 2024-6A, Cl SUB | 0.000%
| 01/20/38
| 0.4% | LifeScan Global Corporation, Initial Term Loan, 1st Lien, CME Term SOFR + 6.500% | 10.922%
| 12/31/26
| 0.4% | CCO Holdings LLC | 4.250%
| 02/01/31
| 0.4% |
| Footnote | Description | Footnote(A) | Cash Equivalents are not shown in the top ten chart. |
|
|
| Material Fund Change [Text Block] |
There were no material fund changes during the reporting period. |
|
| C000112815 |
|
|
| Shareholder Report [Line Items] |
|
|
| Fund Name |
Long Duration Fund
|
|
| Class Name |
Class A
|
|
| Trading Symbol |
LDRAX
|
|
| Annual or Semi-Annual Statement [Text Block] |
This annual shareholder report contains important information about Class A Shares of the Long Duration Fund (the "Fund") for the period from June 1, 2024 to May 31, 2025.
|
|
| Shareholder Report Annual or Semi-Annual |
Annual Shareholder Report
|
|
| Additional Information [Text Block] |
You can find additional information about the Fund at https://www.seic.com/mutual-fund-documentation/prospectuses-and-reports. You can also request this information by contacting us at 1-800-DIAL-SEI.
|
|
| Additional Information Phone Number |
1-800-DIAL-SEI
|
|
| Additional Information Website |
https://www.seic.com/mutual-fund-documentation/prospectuses-and-reports
|
|
| Expenses [Text Block] |
What were the Fund costs for the last year?(based on a hypothetical $10,000 investment) Fund Name | Costs of a $10,000 investment | Costs paid as a percentage of a $10,000 investment |
|---|
Long Duration Fund, Class A Shares | $16 | 0.16% |
|---|
|
|
| Expenses Paid, Amount |
$ 16
|
|
| Expense Ratio, Percent |
0.16%
|
|
| Factors Affecting Performance [Text Block] |
How did the Fund perform in the last year?The Fund outperformed its benchmark, a 70%/30% blend of the Bloomberg U.S. Long Credit Index and the Bloomberg U.S. Long Government Index, for the 12-month period ending May 31, 2025. The Federal Reserve (Fed) surprised the markets by reducing the federal-funds rate by 50 basis points at its September 2024 meeting. The central bank subsequently implemented additional 25-basis-point cuts following its meetings in November and December 2024. The Fed then paused its rate-cutting cycle through the end of the reporting period as it continues to evaluate the effects of trade and fiscal policy on the broader economy and financial markets. The implementation of tariffs during the first four months of 2025 caused spreads to widen materially before tightening back close to pre-tariff levels. Fund performance for the reporting period was bolstered by holdings in corporate bonds, particularly in the industrials and financials sectors. This was partially offset by the negative impact of an underweight allocation to corporate bonds and an overweight to U.S. Treasurys, as the corporate sector outperformed over the period. An underweight position in BBB rated issues detracted from Fund performance as lower-quality securities outperformed during the reporting period. Regarding the Fund’s sub-advisers, Legal & General Investment Management America, Inc. (LGIM) benefited from selection in the industrials sector, most notably in consumer non-cyclical and capital goods. Jennison Associates LLCs’ performance was enhanced by a yield-curve steepening position; this was partially offset by defensive credit positioning, while Metropolitan West Asset Management, LLC benefited from security selection in the financials sector. Income Research + Management (IRM) slightly outperformed the Fund's Blended Benchmark for the period due to security selection. The Fund’s use of derivatives had no material impact on performance during the period. |
|
| Performance Past Does Not Indicate Future [Text] |
Past performance is not indicative of future performance.
|
|
| Line Graph [Table Text Block] |
| Long Duration Fund, Class A Shares - $121257 | Bloomberg U.S. Aggregate Bond Index (TR) (USD) - $115957 | 70/30 Bloomberg U.S. Long Credit/U.S. Long Govt - $116132 |
|---|
May/15 | $100000 | $100000 | $100000 |
|---|
May/16 | $106186 | $102995 | $106120 |
|---|
May/17 | $110865 | $104621 | $110138 |
|---|
May/18 | $111884 | $104229 | $110886 |
|---|
May/19 | $123312 | $110900 | $121866 |
|---|
May/20 | $149019 | $121342 | $144543 |
|---|
May/21 | $147837 | $120850 | $141701 |
|---|
May/22 | $126158 | $110914 | $120760 |
|---|
May/23 | $118822 | $108537 | $114003 |
|---|
May/24 | $118281 | $109954 | $113784 |
|---|
May/25 | $121257 | $115957 | $116132 |
|---|
|
|
| Average Annual Return [Table Text Block] |
Fund/Index Name | 1 Year | 5 Years | 10 Years |
|---|
Long Duration Fund, Class A Shares | 2.52% | -4.04% | 1.95% |
|---|
Bloomberg U.S. Aggregate Bond Index (TR) (USD) | 5.46% | -0.90% | 1.49% |
|---|
70/30 Bloomberg U.S. Long Credit/U.S. Long Govt | 2.06% | -4.28% | 1.51% |
|---|
|
|
| No Deduction of Taxes [Text Block] |
The table and graph presented above do not reflect the deduction of taxes a shareholder would pay on Fund distributions or the redemption of Fund Shares.
|
|
| AssetsNet |
$ 495,003,000
|
|
| Holdings Count | Holding |
972
|
|
| Advisory Fees Paid, Amount |
$ 487
|
|
| InvestmentCompanyPortfolioTurnover |
176.00%
|
|
| Additional Fund Statistics [Text Block] |
Key Fund Statistics as of May 31, 2025 | Total Net Assets (000's) | Number of Holdings | Total Advisory Fees Paid (000's) | Portfolio Turnover Rate |
|---|
| $495,003 | 972 | $487 | 176% |
|---|
|
|
| Holdings [Text Block] |
Asset/Sector WeightingsFootnote Reference*Value | Value |
|---|
Futures Contracts | 0.0% | Mortgage-Backed Securities | 0.2% | U.S. Government Agency Obligations | 0.5% | Real Estate | 0.9% | Sovereign Debt | 1.1% | Materials | 1.3% | Municipal Bonds | 1.8% | Cash Equivalent | 2.3% | Consumer Discretionary | 2.4% | Consumer Staples | 3.6% | Information Technology | 4.8% | Energy | 5.8% | Industrials | 6.3% | Communication Services | 6.8% | Health Care | 9.2% | Utilities | 9.6% | Financials | 10.8% | U.S. Treasury Obligations | 33.1% |
| Footnote | Description | Footnote* | Percentages are calculated based on total net assets. |
|
|
| Largest Holdings [Text Block] |
Holding Name | Coupon Rate | Maturity Date | Percentage of Total
Net AssetsFootnote Reference(A) |
|---|
U.S. Treasury Bonds | 4.750%
| 05/15/55
| 4.9% | U.S. Treasury Bonds | 4.625%
| 02/15/55
| 2.4% | U.S. Treasury Notes | 4.250%
| 05/15/35
| 2.3% | U.S. Treasury Bonds | 4.750%
| 02/15/45
| 2.3% | U.S. Treasury Bonds | 2.000%
| 11/15/41
| 2.0% | U.S. Treasury Bonds | 3.375%
| 11/15/48
| 2.0% | U.S. Treasury Bonds | 4.625%
| 11/15/44
| 1.8% | U.S. Treasury Bonds | 3.000%
| 08/15/48
| 1.6% | U.S. Treasury Bonds | 2.250%
| 08/15/46
| 1.4% | U.S. Treasury Bonds | 4.500%
| 02/15/44
| 0.9% |
| Footnote | Description | Footnote(A) | Cash Equivalents are not shown in the top ten chart. |
|
|
| Material Fund Change [Text Block] |
There were no material fund changes during the reporting period. |
|
| C000018351 |
|
|
| Shareholder Report [Line Items] |
|
|
| Fund Name |
Long Duration Credit Fund
|
|
| Class Name |
Class A
|
|
| Trading Symbol |
SLDAX
|
|
| Annual or Semi-Annual Statement [Text Block] |
This annual shareholder report contains important information about Class A Shares of the Long Duration Credit Fund (the "Fund") for the period from June 1, 2024 to May 31, 2025.
|
|
| Shareholder Report Annual or Semi-Annual |
Annual Shareholder Report
|
|
| Additional Information [Text Block] |
You can find additional information about the Fund at https://www.seic.com/mutual-fund-documentation/prospectuses-and-reports. You can also request this information by contacting us at 1-800-DIAL-SEI.
|
|
| Additional Information Phone Number |
1-800-DIAL-SEI
|
|
| Additional Information Website |
https://www.seic.com/mutual-fund-documentation/prospectuses-and-reports
|
|
| Expenses [Text Block] |
What were the Fund costs for the last year?(based on a hypothetical $10,000 investment) Fund Name | Costs of a $10,000 investment | Costs paid as a percentage of a $10,000 investment |
|---|
Long Duration Credit Fund, Class A Shares | $15 | 0.15% |
|---|
|
|
| Expenses Paid, Amount |
$ 15
|
|
| Expense Ratio, Percent |
0.15%
|
|
| Factors Affecting Performance [Text Block] |
How did the Fund perform in the last year?The Fund outperformed its benchmark, the Bloomberg Long A+ U.S. Credit Index (USD)—which tracks the performance of highly rated corporate and international dollar-denominated bonds with a remaining maturity of 10 years or more—for the 12-month period ending May 31, 2025. The Federal Reserve (Fed) surprised the markets by reducing the federal-funds rate by 50 basis points at its September 2024 meeting. The central bank subsequently implemented additional 25-basis-point cuts following its meetings in November and December 2024. The Fed then paused its rate-cutting cycle through the end of the reporting period as it continues to evaluate the effects of trade and fiscal policy on the broader economy and financial markets. Corporate spreads widened slightly over the reporting period. Volatility was muted through 2024; however, the implementation of tariffs during the first four months of 2025 caused spreads to widen materially before tightening back close to pre-tariff levels. Fund performance for the reporting period was bolstered by holdings in corporate bonds, particularly in the industrials and financials sectors. An overweight allocation to financials partially detracted from Fund performance, as it was the worst performing long-term corporate subsector during the period. An allocation to BBB rated bonds, which are not represented in the benchmark Bloomberg Long A+ U.S. Credit Index (USD), contributed to Fund performance, as lower-quality issues outperformed higher-quality securities over the period. An allocation to U.S. Treasury detracted from Fund performance as the credit sector outperformed during the period. Regarding the Fund’s sub-advisers, MetLife Investment Management, LLC's performance for the reporting period was enhanced by an allocation to BBB rated bonds. Both Income Research + Management (IRM) and Legal & General Investment Management America, Inc. benefited from security selection in the corporate sector, while Jennison Associates’ yield curve steepener contributed positively to Fund performance. Metropolitan West Asset Management, LLC's performance was bolstered by security selection in the financials sector, particularly banks. The Fund’s use of derivatives had no material impact on performance during the period. |
|
| Performance Past Does Not Indicate Future [Text] |
Past performance is not indicative of future performance.
|
|
| Line Graph [Table Text Block] |
| Long Duration Credit Fund, Class A Shares - $123410 | Bloomberg U.S. Aggregate Bond Index (TR) (USD) - $115957 | Bloomberg Long A+ U.S. Credit Index (USD) - $119645 |
|---|
May/15 | $100000 | $100000 | $100000 |
|---|
May/16 | $107374 | $102995 | $107822 |
|---|
May/17 | $112342 | $104621 | $111922 |
|---|
May/18 | $113063 | $104229 | $112672 |
|---|
May/19 | $123807 | $110900 | $123200 |
|---|
May/20 | $146675 | $121342 | $143726 |
|---|
May/21 | $147445 | $120850 | $143776 |
|---|
May/22 | $125729 | $110914 | $122159 |
|---|
May/23 | $119023 | $108537 | $115833 |
|---|
May/24 | $120283 | $109954 | $117058 |
|---|
May/25 | $123410 | $115957 | $119645 |
|---|
|
|
| Average Annual Return [Table Text Block] |
Fund/Index Name | 1 Year | 5 Years | 10 Years |
|---|
Long Duration Credit Fund, Class A Shares | 2.60% | -3.40% | 2.13% |
|---|
Bloomberg U.S. Aggregate Bond Index (TR) (USD) | 5.46% | -0.90% | 1.49% |
|---|
Bloomberg Long A+ U.S. Credit Index (USD) | 2.21% | -3.60% | 1.81% |
|---|
|
|
| No Deduction of Taxes [Text Block] |
The table and graph presented above do not reflect the deduction of taxes a shareholder would pay on Fund distributions or the redemption of Fund Shares.
|
|
| AssetsNet |
$ 3,010,429,000
|
|
| Holdings Count | Holding |
1,202
|
|
| Advisory Fees Paid, Amount |
$ 3,803
|
|
| InvestmentCompanyPortfolioTurnover |
79.00%
|
|
| Additional Fund Statistics [Text Block] |
Key Fund Statistics as of May 31, 2025 | Total Net Assets (000's) | Number of Holdings | Total Advisory Fees Paid (000's) | Portfolio Turnover Rate |
|---|
| $3,010,429 | 1,202 | $3,803 | 79% |
|---|
|
|
| Holdings [Text Block] |
Asset/Sector WeightingsFootnote Reference*Value | Value |
|---|
Futures Contracts | 0.0% | Cash Equivalent | 1.2% | Sovereign Debt | 1.2% | Real Estate | 1.3% | Materials | 1.5% | Municipal Bonds | 3.7% | Consumer Discretionary | 3.8% | Communication Services | 5.4% | Consumer Staples | 5.6% | Energy | 6.0% | Information Technology | 6.1% | U.S. Treasury Obligations | 6.3% | Industrials | 7.3% | Health Care | 13.5% | Utilities | 16.9% | Financials | 19.4% |
| Footnote | Description | Footnote* | Percentages are calculated based on total net assets. |
|
|
| Largest Holdings [Text Block] |
Holding Name | Coupon Rate | Maturity Date | Percentage of Total
Net AssetsFootnote Reference(A) |
|---|
U.S. Treasury Bonds | 4.625%
| 02/15/55
| 1.4% | Anheuser-Busch Cos LLC / Anheuser-Busch InBev Worldwide | 4.900%
| 02/01/46
| 1.4% | Bank of America, SOFRRATE + 1.930% | 2.676%
| 06/19/41
| 0.8% | Comcast | 2.937%
| 11/01/56
| 0.8% | U.S. Treasury Notes | 4.250%
| 05/15/35
| 0.7% | U.S. Treasury Bonds | 4.625%
| 11/15/44
| 0.6% | Comcast | 2.987%
| 11/01/63
| 0.6% | JPMorgan Chase, TSFR3M + 1.622% | 3.882%
| 07/24/38
| 0.6% | Anheuser-Busch Cos LLC / Anheuser-Busch InBev Worldwide | 4.700%
| 02/01/36
| 0.6% | AbbVie | 4.250%
| 11/21/49
| 0.5% |
| Footnote | Description | Footnote(A) | Cash Equivalents are not shown in the top ten chart. |
|
|
| Material Fund Change [Text Block] |
There were no material fund changes during the reporting period. |
|
| C000096276 |
|
|
| Shareholder Report [Line Items] |
|
|
| Fund Name |
Ultra Short Duration Bond Fund
|
|
| Class Name |
Class A
|
|
| Trading Symbol |
SUSAX
|
|
| Annual or Semi-Annual Statement [Text Block] |
This annual shareholder report contains important information about Class A Shares of the Ultra Short Duration Bond Fund (the "Fund") for the period from June 1, 2024 to May 31, 2025.
|
|
| Shareholder Report Annual or Semi-Annual |
Annual Shareholder Report
|
|
| Additional Information [Text Block] |
You can find additional information about the Fund at https://www.seic.com/mutual-fund-documentation/prospectuses-and-reports. You can also request this information by contacting us at 1-800-DIAL-SEI.
|
|
| Additional Information Phone Number |
1-800-DIAL-SEI
|
|
| Additional Information Website |
https://www.seic.com/mutual-fund-documentation/prospectuses-and-reports
|
|
| Expenses [Text Block] |
What were the Fund costs for the last year?(based on a hypothetical $10,000 investment) Fund Name | Costs of a $10,000 investment | Costs paid as a percentage of a $10,000 investment |
|---|
Ultra Short Duration Bond Fund, Class A Shares | $14 | 0.14% |
|---|
|
|
| Expenses Paid, Amount |
$ 14
|
|
| Expense Ratio, Percent |
0.14%
|
|
| Factors Affecting Performance [Text Block] |
How did the Fund perform in the last year?The Fund outperformed its benchmark, the Bloomberg Short U.S. Treasury 9-12 Month Index (USD), for the 12-month period ending May 31, 2025. The Federal Reserve (Fed) surprised the markets by reducing the federal-funds rate by 50 basis points at its September 2024 meeting. The central bank subsequently implemented additional 25-basis-point cuts following its meetings in November and December 2024. The Fed then paused its rate-cutting cycle through the end of the reporting period as it continues to evaluate the effects of trade and fiscal policy on the broader economy and financial markets. Fund performance for the reporting period benefited from an allocation to corporate bonds as spreads in the front end of the yield curve remained relatively steady despite volatility during the first five months of 2025. Allocations within asset-backed securities (ABS) benefited performance as the Fund’s managers generally preferred higher-quality prime tranches within credit cards and auto loans. Non-agency mortgage-backed securities (MBS) contributed positively to performance as the sector remained supported by home-price appreciation and limited supply. A small allocation to AAA rated collateralized loan obligations (CLOs) also added to performance. Regarding the Fund’s sub-advisers, both MetLife Investment Management, LLC (“MetLife”) and Wellington Management Company, LLP (“Wellington”) outperformed the benchmark for the period. MetLife benefited from allocations to corporate bonds and prime credit cards and auto loans. Wellington’s outperformance was attributable to an allocation to non-agency MBS, corporate bonds, and AAA rated CLOs. The Fund’s use of derivatives had no material impact on performance during the period. |
|
| Performance Past Does Not Indicate Future [Text] |
Past performance is not indicative of future performance.
|
|
| Line Graph [Table Text Block] |
| Ultra Short Duration Bond Fund, Class A Shares - $127179 | Bloomberg U.S. Aggregate Bond Index (TR) (USD) - $115957 | Bloomberg Short U.S. Treasury 9-12 Month Index (USD) - $120858 |
|---|
May/15 | $100000 | $100000 | $100000 |
|---|
May/16 | $101008 | $102995 | $100410 |
|---|
May/17 | $102781 | $104621 | $101053 |
|---|
May/18 | $104524 | $104229 | $102088 |
|---|
May/19 | $107781 | $110900 | $104761 |
|---|
May/20 | $110420 | $121342 | $108040 |
|---|
May/21 | $112022 | $120850 | $108317 |
|---|
May/22 | $110655 | $110914 | $107638 |
|---|
May/23 | $113488 | $108537 | $109461 |
|---|
May/24 | $120397 | $109954 | $115070 |
|---|
May/25 | $127179 | $115957 | $120858 |
|---|
|
|
| Average Annual Return [Table Text Block] |
Fund/Index Name | 1 Year | 5 Years | 10 Years |
|---|
Ultra Short Duration Bond Fund, Class A Shares | 5.63% | 2.87% | 2.43% |
|---|
Bloomberg U.S. Aggregate Bond Index (TR) (USD) | 5.46% | -0.90% | 1.49% |
|---|
Bloomberg Short U.S. Treasury 9-12 Month Index (USD) | 5.03% | 2.27% | 1.91% |
|---|
|
|
| No Deduction of Taxes [Text Block] |
The table and graph presented above do not reflect the deduction of taxes a shareholder would pay on Fund distributions or the redemption of Fund Shares.
|
|
| AssetsNet |
$ 455,543,000
|
|
| Holdings Count | Holding |
564
|
|
| Advisory Fees Paid, Amount |
$ 417
|
|
| InvestmentCompanyPortfolioTurnover |
77.00%
|
|
| Additional Fund Statistics [Text Block] |
Key Fund Statistics as of May 31, 2025 | Total Net Assets (000's) | Number of Holdings | Total Advisory Fees Paid (000's) | Portfolio Turnover Rate |
|---|
| $455,543 | 564 | $417 | 77% |
|---|
|
|
| Holdings [Text Block] |
Asset/Sector WeightingsFootnote Reference*Value | Value |
|---|
Real Estate | 0.1% | U.S. Government Agency Obligation | 0.3% | Materials | 0.4% | Communication Services | 0.7% | Cash Equivalent | 0.7% | Commercial Paper | 0.7% | Information Technology | 1.0% | Health Care | 1.5% | Energy | 1.5% | Municipal Bonds | 1.6% | Consumer Staples | 1.9% | Industrials | 2.3% | Consumer Discretionary | 3.2% | Utilities | 3.2% | Repurchase Agreements | 6.5% | U.S. Treasury Obligations | 9.4% | Mortgage-Backed Securities | 13.7% | Financials | 20.4% | Asset-Backed Securities | 31.5% |
| Footnote | Description | Footnote* | Percentages are calculated based on total net assets. |
|
|
| Largest Holdings [Text Block] |
Holding Name | Coupon Rate | Maturity Date | Percentage of Total
Net AssetsFootnote Reference(A) |
|---|
U.S. Treasury Notes | 1.250%
| 12/31/26
| 2.0% | U.S. Treasury Notes | 0.750%
| 08/31/26
| 1.6% | U.S. Treasury Bills | 0.000%
| 05/14/26
| 1.5% | U.S. Treasury Bills | 4.263%
| 07/15/25
| 1.0% | U.S. Treasury Bills | 4.263%
| 07/22/25
| 1.0% | U.S. Treasury Notes | 0.375%
| 11/30/25
| 1.0% | Truist Bank, SOFRRATE + 0.590% | 4.671%
| 05/20/27
| 0.9% | JPMorgan Chase, SOFRRATE + 0.765% | 1.470%
| 09/22/27
| 0.8% | Morgan Stanley, SOFRRATE + 0.858% | 1.512%
| 07/20/27
| 0.8% | Wells Fargo, TSFR3M + 1.432% | 3.196%
| 06/17/27
| 0.8% |
| Footnote | Description | Footnote(A) | Cash Equivalents and Short-Term Investments are not shown in the top ten chart. |
|
|
| Material Fund Change [Text Block] |
There were no material fund changes during the reporting period. |
|
| C000018353 |
|
|
| Shareholder Report [Line Items] |
|
|
| Fund Name |
Emerging Markets Debt Fund
|
|
| Class Name |
Class A
|
|
| Trading Symbol |
SEDAX
|
|
| Annual or Semi-Annual Statement [Text Block] |
This annual shareholder report contains important information about Class A Shares of the Emerging Markets Debt Fund (the "Fund") for the period from June 1, 2024 to May 31, 2025.
|
|
| Shareholder Report Annual or Semi-Annual |
Annual Shareholder Report
|
|
| Additional Information [Text Block] |
You can find additional information about the Fund at https://www.seic.com/mutual-fund-documentation/prospectuses-and-reports. You can also request this information by contacting us at 1-800-DIAL-SEI.
|
|
| Additional Information Phone Number |
1-800-DIAL-SEI
|
|
| Additional Information Website |
https://www.seic.com/mutual-fund-documentation/prospectuses-and-reports
|
|
| Expenses [Text Block] |
What were the Fund costs for the last year?(based on a hypothetical $10,000 investment) Fund Name | Costs of a $10,000 investment | Costs paid as a percentage of a $10,000 investment |
|---|
Emerging Markets Debt Fund, Class A Shares | $46 | 0.44% |
|---|
|
|
| Expenses Paid, Amount |
$ 46
|
|
| Expense Ratio, Percent |
0.44%
|
|
| Factors Affecting Performance [Text Block] |
How did the Fund perform in the last year?The Fund outperformed its performance benchmark, a 50%/50% blend of the JPM EMBI Global Diversified Index and the JPM GBI-EM Global Diversified Index, for the 12-month period ending May 31, 2025. Over the reporting period, in hard-currency emerging markets, high-yield bonds outperformed investment-grade securities. Local-currency markets also garnered positive returns due mainly to a rally in local rates. Emerging-market currencies recorded modestly positive returns during the period, as most currencies depreciated against the U.S. dollar. Among the Fund’s sub-advisers, Marathon Asset Management (“Marathon”), Grantham Mayo van Otterloo ("GMO"), and Neuberger Berman Investment Advisers (“Neuberger”) (which was terminated in December 2024) added value through high-yield exposure, particularly to Argentina and Venezuela. Marathon also benefited from strong security selection and overweights to Peru and Mexico. Local-currency sub-adviser Ninety One UK Ltd. (“Ninety One”) (terminated in December 2024) outperformed the Fund’s blended benchmark, bolstered by underweight allocations to South Africa and Mexico. This was partly offset by the negative impact of the exposure to Brazil. Colchester Global Investors underperformed as emerging-market currencies depreciated over the reporting period, most notably in the Latin America region, where the sub-adviser had an overweight position. New local-currency managers Artisan Partners Limited Partnership (“Artisan”) and Invesco Advisers (“Invesco”), both of which were added as Fund sub-advisers in December 2024, saw gains from Brazilian and Mexican exposures, which performed well against the U.S. dollar during the period. However, Turkish rates and currency exposure detracted from performance, particularly for Invesco. Regarding the use of derivatives over the reporting period, the Fund employed currency forwards and interest rate swaps to manage active currency and duration exposures. Currency forwards and interest rate swaps had a positive impact on Fund performance, with effects varying by country, depending on local-rate and currency moves. |
|
| Performance Past Does Not Indicate Future [Text] |
Past performance is not indicative of future performance.
|
|
| Line Graph [Table Text Block] |
| Emerging Markets Debt Fund, Class A Shares - $132466 | Bloomberg Global Aggregate Index (USD) - $109779 | 50/50 JPM EMBI Global Div & JPM GBI EM Global Div - $127574 |
|---|
May/15 | $100000 | $100000 | $100000 |
|---|
May/16 | $98229 | $105320 | $99863 |
|---|
May/17 | $110199 | $106129 | $110851 |
|---|
May/18 | $111544 | $107957 | $111175 |
|---|
May/19 | $113364 | $111293 | $115514 |
|---|
May/20 | $113676 | $117519 | $117000 |
|---|
May/21 | $127367 | $122769 | $127933 |
|---|
May/22 | $107436 | $106549 | $107658 |
|---|
May/23 | $108742 | $101777 | $108522 |
|---|
May/24 | $120429 | $102564 | $117219 |
|---|
May/25 | $132466 | $109779 | $127574 |
|---|
|
|
| Average Annual Return [Table Text Block] |
Fund/Index Name | 1 Year | 5 Years | 10 Years |
|---|
Emerging Markets Debt Fund, Class A Shares | 10.00% | 3.11% | 2.85% |
|---|
Bloomberg Global Aggregate Index (USD) | 7.03% | -1.35% | 0.94% |
|---|
50/50 JPM EMBI Global Div & JPM GBI EM Global Div | 8.83% | 1.75% | 2.47% |
|---|
|
|
| No Deduction of Taxes [Text Block] |
The table and graph presented above do not reflect the deduction of taxes a shareholder would pay on Fund distributions or the redemption of Fund Shares.
|
|
| AssetsNet |
$ 1,676,351,000
|
|
| Holdings Count | Holding |
979
|
|
| Advisory Fees Paid, Amount |
$ 6,308
|
|
| InvestmentCompanyPortfolioTurnover |
142.00%
|
|
| Additional Fund Statistics [Text Block] |
Key Fund Statistics as of May 31, 2025 | Total Net Assets (000's) | Number of Holdings | Total Advisory Fees Paid (000's) | Portfolio Turnover Rate |
|---|
| $1,676,351 | 979 | $6,308 | 142% |
|---|
|
|
| Holdings [Text Block] |
Asset/Country WeightingsFootnote Reference*Value | Value |
|---|
Forward Contracts | -0.2% | Written Options | -0.1% | Credit Default Swaps | 0.0% | Written Swaptions | 0.0% | Futures Contracts | 0.0% | Total Return Swaps | 0.0% | Purchased Options | 0.1% | Interest Rate Swaps | 0.3% | Other Countries | 40.3% | Romania | 2.4% | Egypt | 2.5% | Supranational | 2.7% | Peru | 3.1% | Poland | 3.4% | Brazil | 3.9% | Turkey | 4.1% | Colombia | 4.9% | Malaysia | 5.9% | South Africa | 6.2% | Indonesia | 7.3% | Mexico | 8.2% |
| Footnote | Description | Footnote* | Percentages are calculated based on total net assets. |
|
|
| Largest Holdings [Text Block] |
Holding Name | Coupon Rate | Maturity Date | Percentage of Total
Net Assets |
|---|
Malaysia Government Bond, MYR | 3.955%
| 09/15/25
| 1.1% | Indonesia Treasury Bond | 6.750%
| 07/15/35
| 1.1% | U.S. Treasury Notes, USBMMY3M + 0.160% | 4.456%
| 04/30/27
| 1.0% | Republic of South Africa Government Bond, ZAR | 8.750%
| 01/31/44
| 0.9% | Mexican Bonos | 8.500%
| 03/02/28
| 0.9% | Peru Government Bond | 5.400%
| 08/12/34
| 0.8% | Petroleos Mexicanos | 7.690%
| 01/23/50
| 0.8% | Republic of South Africa Government Bond | 9.000%
| 01/31/40
| 0.8% | Republic of South Africa Government International Bond | 5.750%
| 09/30/49
| 0.8% | Mexican Bonos | 8.500%
| 03/01/29
| 0.7% |
|
|
| Material Fund Change [Text Block] |
Artisan and Invesco replaced Neuberger and Ninety One as Fund sub-advisers in December 2024. In addition, during the reporting period, the Advisory fee for the Fund was reduced. |
|
| C000036889 |
|
|
| Shareholder Report [Line Items] |
|
|
| Fund Name |
Real Return Fund
|
|
| Class Name |
Class A
|
|
| Trading Symbol |
RRPAX
|
|
| Annual or Semi-Annual Statement [Text Block] |
This annual shareholder report contains important information about Class A Shares of the Real Return Fund (the "Fund") for the period from June 1, 2024 to May 31, 2025.
|
|
| Shareholder Report Annual or Semi-Annual |
Annual Shareholder Report
|
|
| Additional Information [Text Block] |
You can find additional information about the Fund at https://www.seic.com/mutual-fund-documentation/prospectuses-and-reports. You can also request this information by contacting us at 1-800-DIAL-SEI.
|
|
| Additional Information Phone Number |
1-800-DIAL-SEI
|
|
| Additional Information Website |
https://www.seic.com/mutual-fund-documentation/prospectuses-and-reports
|
|
| Expenses [Text Block] |
What were the Fund costs for the last year?(based on a hypothetical $10,000 investment) Fund Name | Costs of a $10,000 investment | Costs paid as a percentage of a $10,000 investment |
|---|
Real Return Fund, Class A Shares | $2 | 0.02% |
|---|
|
|
| Expenses Paid, Amount |
$ 2
|
|
| Expense Ratio, Percent |
0.02%
|
|
| Factors Affecting Performance [Text Block] |
How did the Fund perform in the last year?The Fund performed in line with its benchmark, the Bloomberg 1-5 Year U.S. TIPS Index (USD), for the 12-month period ending May 31, 2025. The Bloomberg 1-5 Year U.S. TIPS Index (USD) returned 6.97% over the reporting period, outperforming the comparable Bloomberg 1-5 Year U.S.Treasury Index (USD), which returned 6.07%. The outperformance of the the Bloomberg 1-5 Year U.S. TIPS Index (USD) was driven primarily by a significant decline in short-dated real U.S. Treasury yields (yields after adjusting for inflation). The 2-year real yield fell 134 basis points (bps) over the reporting period and the 5-year real yield declined by 59 bps, providing strong price support to inflation-linked securities. In contrast, longer-dated real U.S. Treasury yields rose modestly, leading to a steepening of the real yield curve (in which the spread between short- and long-term yields increases). The breakeven inflation rate (the difference between the nominal yield on a fixed-rate bond and the real yield on an inflation-linked bond) widened slightly at the front end of the U.S. Treasury yield curve during the reporting period, with 2-year breakevens rising by 35 bps, suggesting modest repricing of near-term inflation expectations. The 5-year breakeven yield curve was little changed, and longer-dated breakevens were broadly stable to slightly narrower. Overall, the inflation risk premium was largely unchanged, reinforcing the idea that performance was dominated by real yield compression (a decrease in the real yield of a bond) rather than breakeven expansion. |
|
| Performance Past Does Not Indicate Future [Text] |
Past performance is not indicative of future performance.
|
|
| Line Graph [Table Text Block] |
| Real Return Fund, Class A Shares - $130721 | Bloomberg U.S. Aggregate Bond Index (TR) (USD) - $115957 | Bloomberg 1-5 Year U.S. TIPS Index (USD) - $131355 |
|---|
May/15 | $100000 | $100000 | $100000 |
|---|
May/16 | $100521 | $102995 | $100678 |
|---|
May/17 | $102287 | $104621 | $102524 |
|---|
May/18 | $102776 | $104229 | $103059 |
|---|
May/19 | $105683 | $110900 | $105969 |
|---|
May/20 | $109323 | $121342 | $109725 |
|---|
May/21 | $117201 | $120850 | $117787 |
|---|
May/22 | $119618 | $110914 | $120318 |
|---|
May/23 | $117116 | $108537 | $117856 |
|---|
May/24 | $122093 | $109954 | $122795 |
|---|
May/25 | $130721 | $115957 | $131355 |
|---|
|
|
| Average Annual Return [Table Text Block] |
Fund/Index Name | 1 Year | 5 Years | 10 Years |
|---|
Real Return Fund, Class A Shares | 7.07% | 3.64% | 2.72% |
|---|
Bloomberg U.S. Aggregate Bond Index (TR) (USD) | 5.46% | -0.90% | 1.49% |
|---|
Bloomberg 1-5 Year U.S. TIPS Index (USD) | 6.97% | 3.66% | 2.76% |
|---|
|
|
| No Deduction of Taxes [Text Block] |
The table and graph presented above do not reflect the deduction of taxes a shareholder would pay on Fund distributions or the redemption of Fund Shares.
|
|
| AssetsNet |
$ 254,149,000
|
|
| Holdings Count | Holding |
21
|
|
| Advisory Fees Paid, Amount |
$ 0
|
|
| InvestmentCompanyPortfolioTurnover |
34.00%
|
|
| Additional Fund Statistics [Text Block] |
Key Fund Statistics as of May 31, 2025 | Total Net Assets (000's) | Number of Holdings | Total Advisory Fees Paid (000's) | Portfolio Turnover Rate |
|---|
| $254,149 | 21 | $- | 34% |
|---|
|
|
| Holdings [Text Block] |
Asset/Sector WeightingsFootnote Reference*Value | Value |
|---|
U.S. Treasury Obligations | 99.4% |
| Footnote | Description | Footnote* | Percentages are calculated based on total net assets. |
|
|
| Largest Holdings [Text Block] |
Holding Name | Coupon Rate | Maturity Date | Percentage of Total
Net Assets |
|---|
U.S. Treasury Inflation Indexed Bonds | 1.625%
| 10/15/29
| 6.8% | U.S. Treasury Inflation Indexed Bonds | 2.125%
| 04/15/29
| 6.7% | U.S. Treasury Inflation-Protected Securities | 2.375%
| 10/15/28
| 6.4% | U.S. Treasury Inflation-Protected Securities | 1.625%
| 10/15/27
| 6.2% | U.S. Treasury Inflation-Protected Securities | 1.250%
| 04/15/28
| 6.0% | U.S. Treasury Inflation-Protected Securities | 0.125%
| 04/15/27
| 6.0% | U.S. Treasury Inflation-Protected Securities | 0.125%
| 10/15/26
| 5.9% | U.S. Treasury Inflation-Protected Securities | 0.500%
| 01/15/28
| 5.4% | U.S. Treasury Inflation-Protected Securities | 0.375%
| 07/15/27
| 5.3% | U.S. Treasury Inflation-Protected Securities | 0.125%
| 01/15/30
| 5.3% |
|
|
| Material Fund Change [Text Block] |
There were no material fund changes during the reporting period. |
|
| C000144225 |
|
|
| Shareholder Report [Line Items] |
|
|
| Fund Name |
Limited Duration Bond Fund
|
|
| Class Name |
Class A
|
|
| Trading Symbol |
SLDBX
|
|
| Annual or Semi-Annual Statement [Text Block] |
This annual shareholder report contains important information about Class A Shares of the Limited Duration Bond Fund (the "Fund") for the period from June 1, 2024 to May 31, 2025.
|
|
| Shareholder Report Annual or Semi-Annual |
Annual Shareholder Report
|
|
| Additional Information [Text Block] |
You can find additional information about the Fund at https://www.seic.com/mutual-fund-documentation/prospectuses-and-reports. You can also request this information by contacting us at 1-800-DIAL-SEI.
|
|
| Additional Information Phone Number |
1-800-DIAL-SEI
|
|
| Additional Information Website |
https://www.seic.com/mutual-fund-documentation/prospectuses-and-reports
|
|
| Expenses [Text Block] |
What were the Fund costs for the last year?(based on a hypothetical $10,000 investment) Fund Name | Costs of a $10,000 investment | Costs paid as a percentage of a $10,000 investment |
|---|
Limited Duration Bond Fund, Class A Shares | $11 | 0.11%Footnote Reference(1) |
|---|
| Footnote | Description | Footnote(1) | The expense ratio includes a proxy fee expense. Had this expense been excluded the ratio would have been 0.10%. |
|
|
| Expenses Paid, Amount |
$ 11
|
|
| Expense Ratio, Percent |
0.11%
|
[2] |
| Factors Affecting Performance [Text Block] |
How did the Fund perform in the last year?The Fund outperformed its benchmark, the ICE BofA 1-3 Year U.S. Treasury Index (USD)—which tracks the performance of the direct sovereign debt of the U. S. government with a maturity of at least one year and less than three years—for the 12-month period ending May 31, 2025. The Federal Reserve (Fed) surprised the markets by reducing the federal-funds rate by 50 basis points at its September 2024 meeting. The central bank subsequently implemented additional 25-basis-point cuts following its meetings in November and December 2024. The Fed then paused its rate-cutting cycle through the end of the reporting period as it continues to evaluate the effects of trade and fiscal policy on the broader economy and financial markets. Fund performance for the reporting period benefited from holdings in spread sectors. An allocation to corporate bonds contributed to Fund performance as spreads in the front end of the yield curve remained relatively steady despite volatility during the first five months of 2025. Allocations to asset-backed securities (ABS) also contributed positively to performance. Despite interest-rate volatility, agency mortgage-backed securities (MBS) performed well during the reporting period. Consequently, the Fund’s positioning and security selection in the sector bolstered performance. Additionally, positions in commercial mortgage-backed securities (CMBS), enhanced Fund performance, with the managers preferring senior tranches. A small allocation to AAA rated collateralized loan obligations (CLOs) also had a positive impact on performance. Regarding the Fund’s sub-advisers, both MetLife Investment Management, LLC (“MetLife”) and Metropolitan West Asset Management, LLC (“MetWest”) outperformed the benchmark ICE BofA 1-3 Year U.S. Treasury Index (USD) for the reporting period. MetLife benefitted from allocations to corporate bonds and prime credit cards and auto loans. MetWest’s outperformance was attributable to allocations to agency MBS and corporate bonds. The Fund’s use of derivatives had no material impact on performance during the reporting period. |
|
| Performance Past Does Not Indicate Future [Text] |
Past performance is not indicative of future performance.
|
|
| Line Graph [Table Text Block] |
| Limited Duration Bond Fund, Class A Shares - $123523 | Bloomberg U.S. Aggregate Bond Index (TR) (USD) - $115957 | ICE BofA 1-3 Year U.S. Treasury Index (USD) - $116608 |
|---|
May/15 | $100000 | $100000 | $100000 |
|---|
May/16 | $101263 | $102995 | $100729 |
|---|
May/17 | $102492 | $104621 | $101304 |
|---|
May/18 | $103321 | $104229 | $101288 |
|---|
May/19 | $107029 | $110900 | $104773 |
|---|
May/20 | $111463 | $121342 | $109571 |
|---|
May/21 | $113575 | $120850 | $109849 |
|---|
May/22 | $110387 | $110914 | $106680 |
|---|
May/23 | $111309 | $108537 | $106715 |
|---|
May/24 | $116277 | $109954 | $110372 |
|---|
May/25 | $123523 | $115957 | $116608 |
|---|
|
|
| Average Annual Return [Table Text Block] |
Fund/Index Name | 1 Year | 5 Years | 10 Years |
|---|
Limited Duration Bond Fund, Class A Shares | 6.23% | 2.08% | 2.14% |
|---|
Bloomberg U.S. Aggregate Bond Index (TR) (USD) | 5.46% | -0.90% | 1.49% |
|---|
ICE BofA 1-3 Year U.S. Treasury Index (USD) | 5.65% | 1.25% | 1.55% |
|---|
|
|
| No Deduction of Taxes [Text Block] |
The table and graph presented above do not reflect the deduction of taxes a shareholder would pay on Fund distributions or the redemption of Fund Shares.
|
|
| AssetsNet |
$ 1,967,138,000
|
|
| Holdings Count | Holding |
471
|
|
| Advisory Fees Paid, Amount |
$ 1,695
|
|
| InvestmentCompanyPortfolioTurnover |
289.00%
|
|
| Additional Fund Statistics [Text Block] |
Key Fund Statistics as of May 31, 2025 | Total Net Assets (000's) | Number of Holdings | Total Advisory Fees Paid (000's) | Portfolio Turnover Rate |
|---|
| $1,967,138 | 471 | $1,695 | 289% |
|---|
|
|
| Holdings [Text Block] |
Asset/Sector WeightingsFootnote Reference*Value | Value |
|---|
Futures Contracts | 0.0% | Purchased Swaption | 0.0% | Energy | 0.1% | Materials | 0.2% | Communication Services | 0.4% | Sovereign Debt | 0.5% | U.S. Government Agency Obligation | 0.7% | Health Care | 0.8% | Real Estate | 1.1% | Information Technology | 1.5% | Municipal Bonds | 1.9% | Consumer Discretionary | 2.1% | Consumer Staples | 2.8% | Utilities | 2.9% | Industrials | 3.7% | Cash Equivalent | 6.6% | Financials | 13.0% | Mortgage-Backed Securities | 19.7% | Asset-Backed Securities | 21.0% | U.S. Treasury Obligations | 32.1% |
| Footnote | Description | Footnote* | Percentages are calculated based on total net assets. |
|
|
| Largest Holdings [Text Block] |
Holding Name | Coupon Rate | Maturity Date | Percentage of Total
Net AssetsFootnote Reference(A) |
|---|
U.S. Treasury Notes | 3.875%
| 05/31/27
| 6.0% | U.S. Treasury Notes | 3.250%
| 06/30/27
| 5.6% | U.S. Treasury Notes | 2.500%
| 03/31/27
| 5.2% | U.S. Treasury Notes | 0.500%
| 10/31/27
| 4.2% | U.S. Treasury Notes | 3.125%
| 08/31/27
| 3.5% | U.S. Treasury Notes | 3.750%
| 05/15/28
| 2.9% | U.S. Treasury Notes | 3.625%
| 05/31/28
| 2.5% | U.S. Treasury Notes | 1.250%
| 12/31/26
| 2.2% | UMBS | 5.000%
| 06/15/40
| 1.1% | UMBS | 4.500%
| 06/15/40
| 1.0% |
| Footnote | Description | Footnote(A) | Cash Equivalents are not shown in the top ten chart. |
|
|
| Material Fund Change [Text Block] |
There were no material fund changes during the reporting period. |
|
| C000150792 |
|
|
| Shareholder Report [Line Items] |
|
|
| Fund Name |
Intermediate Duration Credit Fund
|
|
| Class Name |
Class A
|
|
| Trading Symbol |
SIDCX
|
|
| Annual or Semi-Annual Statement [Text Block] |
This annual shareholder report contains important information about Class A Shares of the Intermediate Duration Credit Fund (the "Fund") for the period from June 1, 2024 to May 31, 2025.
|
|
| Shareholder Report Annual or Semi-Annual |
Annual Shareholder Report
|
|
| Additional Information [Text Block] |
You can find additional information about the Fund at https://www.seic.com/mutual-fund-documentation/prospectuses-and-reports. You can also request this information by contacting us at 1-800-DIAL-SEI.
|
|
| Additional Information Phone Number |
1-800-DIAL-SEI
|
|
| Additional Information Website |
https://www.seic.com/mutual-fund-documentation/prospectuses-and-reports
|
|
| Expenses [Text Block] |
What were the Fund costs for the last year?(based on a hypothetical $10,000 investment) Fund Name | Costs of a $10,000 investment | Costs paid as a percentage of a $10,000 investment |
|---|
Intermediate Duration Credit Fund, Class A Shares | $14 | 0.14% |
|---|
|
|
| Expenses Paid, Amount |
$ 14
|
|
| Expense Ratio, Percent |
0.14%
|
|
| Factors Affecting Performance [Text Block] |
How did the Fund perform in the last year?The Fund modestly outperformed its benchmark, the Bloomberg A+ U.S. Credit Index (USD)—which tracks the performance of fixed-income securities with one of the three highest credit ratings—for the 12-month period ending May 31, 2025. The Federal Reserve (Fed) surprised the markets by reducing the federal-funds rate by 50 basis points at its September 2024 meeting. The central bank subsequently implemented additional 25-basis-point cuts following its meetings in November and December 2024. The Fed then paused its rate-cutting cycle through the end of the reporting period as it continues to evaluate the effects of trade and fiscal policy on the broader economy and financial markets. Corporate spreads widened slightly over the reporting period. Volatility was muted through 2024; however, the implementation of tariffs during the first four months of 2025 caused spreads to widen materially before tightening back close to pre-tariff levels. Fund performance for the period was enhanced by holdings in corporate bonds, particularly in the industrials and financials sectors, as well as an overweight allocation to the financials sector. An allocation to BBB rated securities contributed to Fund performance as lower-quality issues outperformed higher-quality securities over the reporting period. The Fund’s position in U.S. Treasurys, which are not represented in the benchmark Bloomberg A+ U.S. Credit Index (USD), detracted from performance. Among the Fund’s sub-advisers, MetLife Investment Management, LLC benefited from an allocation to BBB rated credits. The performance of both Income Research + Management (IRM) and Legal & General Investment Management America, Inc. (LGIM) was bolstered by corporate credit selection in financial and utility sectors. The Fund’s use of derivatives had no material impact on performance for the reporting period. |
|
| Performance Past Does Not Indicate Future [Text] |
Past performance is not indicative of future performance.
|
|
| Line Graph [Table Text Block] |
| Intermediate Duration Credit Fund, Class A Shares - $127367 | Bloomberg U.S. Aggregate Bond Index (TR) (USD) - $115957 | Bloomberg A+ U.S. Credit Index (USD) - $122728 |
|---|
May/15 | $100000 | $100000 | $100000 |
|---|
May/16 | $104162 | $102995 | $104289 |
|---|
May/17 | $107681 | $104621 | $106705 |
|---|
May/18 | $107830 | $104229 | $106572 |
|---|
May/19 | $115378 | $110900 | $113992 |
|---|
May/20 | $128059 | $121342 | $125995 |
|---|
May/21 | $131002 | $120850 | $127286 |
|---|
May/22 | $118483 | $110914 | $115213 |
|---|
May/23 | $116445 | $108537 | $113121 |
|---|
May/24 | $120678 | $109954 | $116479 |
|---|
May/25 | $127367 | $115957 | $122728 |
|---|
|
|
| Average Annual Return [Table Text Block] |
Fund/Index Name | 1 Year | 5 Years | 10 Years |
|---|
Intermediate Duration Credit Fund, Class A Shares | 5.54% | -0.11% | 2.45% |
|---|
Bloomberg U.S. Aggregate Bond Index (TR) (USD) | 5.46% | -0.90% | 1.49% |
|---|
Bloomberg A+ U.S. Credit Index (USD) | 5.36% | -0.52% | 2.07% |
|---|
|
|
| No Deduction of Taxes [Text Block] |
The table and graph presented above do not reflect the deduction of taxes a shareholder would pay on Fund distributions or the redemption of Fund Shares.
|
|
| AssetsNet |
$ 4,123,796,000
|
|
| Holdings Count | Holding |
1,021
|
|
| Advisory Fees Paid, Amount |
$ 4,896
|
|
| InvestmentCompanyPortfolioTurnover |
130.00%
|
|
| Additional Fund Statistics [Text Block] |
Key Fund Statistics as of May 31, 2025 | Total Net Assets (000's) | Number of Holdings | Total Advisory Fees Paid (000's) | Portfolio Turnover Rate |
|---|
| $4,123,796 | 1,021 | $4,896 | 130% |
|---|
|
|
| Holdings [Text Block] |
Asset/Sector WeightingsFootnote Reference*Value | Value |
|---|
Futures Contracts | 0.0% | Sovereign Debt | 0.5% | Cash Equivalent | 1.5% | Materials | 2.2% | Municipal Bonds | 2.6% | Real Estate | 2.8% | Information Technology | 3.4% | Consumer Discretionary | 3.8% | Communication Services | 4.0% | Energy | 4.6% | Consumer Staples | 5.7% | Industrials | 7.5% | Health Care | 7.7% | U.S. Treasury Obligations | 7.8% | Utilities | 11.6% | Financials | 34.5% |
| Footnote | Description | Footnote* | Percentages are calculated based on total net assets. |
|
|
| Largest Holdings [Text Block] |
Holding Name | Coupon Rate | Maturity Date | Percentage of Total
Net AssetsFootnote Reference(A) |
|---|
U.S. Treasury Notes | 4.250%
| 05/15/35
| 1.1% | U.S. Treasury Notes | 3.750%
| 05/15/28
| 1.0% | U.S. Treasury Bonds | 4.625%
| 02/15/55
| 1.0% | U.S. Treasury Notes | 3.750%
| 04/15/28
| 0.9% | U.S. Treasury Notes | 4.250%
| 01/15/28
| 0.6% | Bank of America, SOFRRATE + 1.930% | 2.676%
| 06/19/41
| 0.5% | U.S. Treasury Notes | 3.875%
| 04/30/30
| 0.5% | Goldman Sachs Group, SOFRRATE + 1.248% | 2.383%
| 07/21/32
| 0.5% | U.S. Treasury Bonds | 5.000%
| 05/15/45
| 0.4% | Anheuser-Busch Cos LLC / Anheuser-Busch InBev Worldwide | 4.900%
| 02/01/46
| 0.4% |
| Footnote | Description | Footnote(A) | Cash Equivalents are not shown in the top ten chart. |
|
|
| Material Fund Change [Text Block] |
There were no material fund changes during the reporting period. |
|
| C000081914 |
|
|
| Shareholder Report [Line Items] |
|
|
| Fund Name |
Dynamic Asset Allocation Fund
|
|
| Class Name |
Class A
|
|
| Trading Symbol |
SDLAX
|
|
| Annual or Semi-Annual Statement [Text Block] |
This annual shareholder report contains important information about Class A Shares of the Dynamic Asset Allocation Fund (the "Fund") for the period from June 1, 2024 to May 31, 2025.
|
|
| Shareholder Report Annual or Semi-Annual |
Annual Shareholder Report
|
|
| Additional Information [Text Block] |
You can find additional information about the Fund at https://www.seic.com/mutual-fund-documentation/prospectuses-and-reports. You can also request this information by contacting us at 1-800-DIAL-SEI.
|
|
| Additional Information Phone Number |
1-800-DIAL-SEI
|
|
| Additional Information Website |
https://www.seic.com/mutual-fund-documentation/prospectuses-and-reports
|
|
| Expenses [Text Block] |
What were the Fund costs for the last year?(based on a hypothetical $10,000 investment) Fund Name | Costs of a $10,000 investment | Costs paid as a percentage of a $10,000 investment |
|---|
Dynamic Asset Allocation Fund, Class A Shares | $3 | 0.03% |
|---|
|
|
| Expenses Paid, Amount |
$ 3
|
|
| Expense Ratio, Percent |
0.03%
|
|
| Factors Affecting Performance [Text Block] |
How did the Fund perform in the last year?The Fund outperformed its benchmark, the broad-market S&P 500 Index (TR)—a market-weighted index that tracks the performance of the 500 largest publicly traded U.S. companies and is considered representative of the broad U.S. stock market—for the 12-month period ending May 31, 2025. Interest rate positions were the largest contributors to the Fund’s outperformance relative to the benchmark for the reporting period, attributable mainly to two yield curve steepeners. Yield curve steepeners benefit when the yield spread between short- and long-maturity U.S. Treasury securities increases. During the period, short-term yields were relatively anchored, while longer-term Treasury yields moved higher. The Fund held two U.S. consumer-price index (CPI) swaps, which in aggregate contributed positively to relative performance as inflation expectations rose over the reporting period. Two short-term U.S. interest rate positions based on the one-year Treasury note yield also enhanced Fund performance. These positions benefitted from market expectations for Federal Reserve interest rate cuts were tempered (the central bank implemented fewer rate cuts than previously expected). The Fund’s currency positions largely detracted from relative performance over the reporting period. A euro versus U.S. dollar put option, a euro versus Japanese yen put option, and a Chinese yuan put option all weighed on Fund performance over the period. A position in broad commodities had a modestly positive impact as performance was mixed across commodities markets. Weakness in economically sensitive sectors such as energy and industrial metals was largely offset by strength in the precious metals sectors. |
|
| Performance Past Does Not Indicate Future [Text] |
Past performance is not indicative of future performance.
|
|
| Line Graph [Table Text Block] |
| Dynamic Asset Allocation Fund, Class A Shares - $324011 | S&P 500 Index (TR) - $335352 |
|---|
May/15 | $100000 | $100000 |
|---|
May/16 | $99678 | $101716 |
|---|
May/17 | $118789 | $119484 |
|---|
May/18 | $131649 | $136671 |
|---|
May/19 | $132630 | $141841 |
|---|
May/20 | $148349 | $160050 |
|---|
May/21 | $215421 | $224579 |
|---|
May/22 | $221894 | $223907 |
|---|
May/23 | $221396 | $230448 |
|---|
May/24 | $279727 | $295404 |
|---|
May/25 | $324011 | $335352 |
|---|
|
|
| Average Annual Return [Table Text Block] |
Fund/Index Name | 1 Year | 5 Years | 10 Years |
|---|
Dynamic Asset Allocation Fund, Class A Shares | 15.83% | 16.91% | 12.47% |
|---|
S&P 500 Index (TR) | 13.52% | 15.94% | 12.86% |
|---|
|
|
| No Deduction of Taxes [Text Block] |
The table and graph presented above do not reflect the deduction of taxes a shareholder would pay on Fund distributions or the redemption of Fund Shares.
|
|
| AssetsNet |
$ 1,684,842,000
|
|
| Holdings Count | Holding |
535
|
|
| Advisory Fees Paid, Amount |
$ 169
|
|
| InvestmentCompanyPortfolioTurnover |
26.00%
|
|
| Additional Fund Statistics [Text Block] |
Key Fund Statistics as of May 31, 2025 | Total Net Assets (000's) | Number of Holdings | Total Advisory Fees Paid (000's) | Portfolio Turnover Rate |
|---|
| $1,684,842 | 535 | $169 | 26% |
|---|
|
|
| Holdings [Text Block] |
Asset/Sector WeightingsFootnote Reference*Value | Value |
|---|
Written Options | -0.1% | Written Swaptions | -0.1% | Cross-Currency Swaps | 0.0% | Purchased Options | 0.2% | Purchased Swaption | 0.4% | Futures Contracts | 0.8% | Cash Equivalent | 1.2% | Materials | 1.5% | Real Estate | 1.7% | Utilities | 1.9% | Energy | 2.3% | Consumer Staples | 4.6% | Interest Rate Swaps | 4.6% | Industrials | 6.8% | Communication Services | 7.4% | Health Care | 7.4% | Consumer Discretionary | 8.2% | Financials | 11.1% | Information Technology | 24.6% |
| Footnote | Description | Footnote* | Percentages are calculated based on total net assets. |
|
|
| Largest Holdings [Text Block] |
Holding Name | | | Percentage of
Total Net AssetsFootnote Reference(A) |
|---|
Microsoft Corp | | | 5.3% | NVIDIA Corp | | | 5.1% | Apple Inc | | | 4.7% | Amazon.com Inc | | | 3.0% | Meta Platforms Inc, Cl A | | | 2.2% | Broadcom Inc | | | 1.8% | Alphabet Inc, Cl A | | | 1.5% | Interest Rate Swap 4.35% 11/02/2031 | | | 1.5% | Tesla Inc | | | 1.5% | Berkshire Hathaway Inc, Cl B | | | 1.4% |
| Footnote | Description | Footnote(A) | Cash Equivalents are not shown in the top ten chart. |
|
|
| Material Fund Change [Text Block] |
There were no material fund changes during the reporting period. |
|
| C000102014 |
|
|
| Shareholder Report [Line Items] |
|
|
| Fund Name |
Multi-Asset Real Return Fund
|
|
| Class Name |
Class A
|
|
| Trading Symbol |
SEIAX
|
|
| Annual or Semi-Annual Statement [Text Block] |
This annual shareholder report contains important information about Class A Shares of the Multi-Asset Real Return Fund (the "Fund") for the period from June 1, 2024 to May 31, 2025.
|
|
| Shareholder Report Annual or Semi-Annual |
Annual Shareholder Report
|
|
| Additional Information [Text Block] |
You can find additional information about the Fund at https://www.seic.com/mutual-fund-documentation/prospectuses-and-reports. You can also request this information by contacting us at 1-800-DIAL-SEI.
|
|
| Additional Information Phone Number |
1-800-DIAL-SEI
|
|
| Additional Information Website |
https://www.seic.com/mutual-fund-documentation/prospectuses-and-reports
|
|
| Expenses [Text Block] |
What were the Fund costs for the last year?(based on a hypothetical $10,000 investment) Fund Name | Costs of a $10,000 investment | Costs paid as a percentage of a $10,000 investment |
|---|
Multi-Asset Real Return Fund, Class A Shares | $60 | 0.59%Footnote Reference(1) |
|---|
| Footnote | Description | Footnote(1) | The expense ratio includes dividend, interest, and proxy fee expense. Had this expense been excluded the ratio would have been 0.21%. |
|
|
| Expenses Paid, Amount |
$ 60
|
|
| Expense Ratio, Percent |
0.59%
|
[3] |
| Factors Affecting Performance [Text Block] |
How did the Fund perform in the last year?The Fund underperformed its benchmark, the Bloomberg 1-5 Year U.S. TIPS Index (USD), for the 12-month period ending May 31, 2025. The majority of the Fund's underperformance relative to its benchmark for the reporting period was attributable to its commodities exposure, which saw mixed performance. The Fund’s equity long/short strategy detracted from performance as inflation moderated, with less inflation-sensitive sectors generally outperforming those with greater inflation-sensitivity. At the sector level, the Fund’s short exposure to consumer discretionary challenged performance as the job market remained robust and consumers continued to spend on non-essential goods and services. Holdings in the energy sector detracted from Fund performance due to pressured crude oil prices. The Fund's TIPS plus (Treasury Inflation-Protected Securities) allocation contributed positively to performance, benefiting from its credit exposure. Among the Fund’s sub-advisers, Columbia Management Investment Advisers and UBS Asset Management underperformed the benchmark due to mixed performance for commodities. Equity long/short manager Franklin Advisers, Inc. also underperformed the benchmark as less inflation-sensitive sectors outperformed. Conversely, AllianceBernstein L.P benefited from its overweight credit exposure amid tighter credit spreads, especially in below-investment-grade bonds. Regarding the use of derivatives during the reporting period, the Fund employed equity-index futures to hedge broad equity-market exposure; equity-index sector futures to obtain strategic exposure to equity-index sectors; bond futures and interest-rate swaps to hedge duration; credit default swaps (CDS) to hedge credit risk; and commodity futures to obtain diversified strategic exposure to commodities. The Fund’s allocation to commodity futures and exposure to equity-index sector futures contributed to performance. The exposures obtained through interest-rate swaps, CDS, equity-index futures, and bond futures detracted from Fund performance for the period, but provided the intended hedging. |
|
| Performance Past Does Not Indicate Future [Text] |
Past performance is not indicative of future performance.
|
|
| Line Graph [Table Text Block] |
| Multi-Asset Real Return Fund, Class A Shares - $130615 | Bloomberg U.S. Aggregate Bond Index (TR) (USD) - $115957 | Bloomberg 1-5 Year U.S. TIPS Index (USD) - $131355 | Bloomberg 1-5 Year U.S. TIPS Index (70%)/Bloomberg Commodity Index Total Return Index (20%)/S&P 500 Index (10%) - $145523 |
|---|
May/15 | $100000 | $100000 | $100000 | $100000 |
|---|
May/16 | $96806 | $102995 | $100678 | $98293 |
|---|
May/17 | $95979 | $104621 | $102524 | $100424 |
|---|
May/18 | $97366 | $104229 | $103059 | $104373 |
|---|
May/19 | $97399 | $110900 | $105969 | $104251 |
|---|
May/20 | $94103 | $121342 | $109725 | $104557 |
|---|
May/21 | $107437 | $120850 | $117787 | $122914 |
|---|
May/22 | $124409 | $110914 | $120318 | $134241 |
|---|
May/23 | $116891 | $108537 | $117856 | $126414 |
|---|
May/24 | $125392 | $109954 | $122795 | $136410 |
|---|
May/25 | $130615 | $115957 | $131355 | $145523 |
|---|
|
|
| Average Annual Return [Table Text Block] |
Fund/Index Name | 1 Year | 5 Years | 10 Years |
|---|
Multi-Asset Real Return Fund, Class A Shares | 4.17% | 6.78% | 2.71% |
|---|
Bloomberg U.S. Aggregate Bond Index (TR) (USD) | 5.46% | -0.90% | 1.49% |
|---|
Bloomberg 1-5 Year U.S. TIPS Index (USD) | 6.97% | 3.66% | 2.76% |
|---|
Bloomberg 1-5 Year U.S. TIPS Index (70%)/Bloomberg Commodity Index Total Return Index (20%)/S&P 500 Index (10%) | 6.68% | 6.84% | 3.82% |
|---|
|
|
| No Deduction of Taxes [Text Block] |
The table and graph presented above do not reflect the deduction of taxes a shareholder would pay on Fund distributions or the redemption of Fund Shares.
|
|
| AssetsNet |
$ 781,955,000
|
|
| Holdings Count | Holding |
1,224
|
|
| Advisory Fees Paid, Amount |
$ 1,370
|
|
| InvestmentCompanyPortfolioTurnover |
41.00%
|
|
| Additional Fund Statistics [Text Block] |
Key Fund Statistics as of May 31, 2025 | Total Net Assets (000's) | Number of Holdings | Total Advisory Fees Paid (000's) | Portfolio Turnover Rate |
|---|
| $781,955 | 1,224 | $1,370 | 41% |
|---|
|
|
| Holdings [Text Block] |
Asset/Sector WeightingsFootnote Reference*Value | Value |
|---|
Futures Contracts | -1.0% | Information Technology | -0.4% | Rights | 0.0% | Forwards | 0.0% | Credit Default Swaps | 0.0% | Industrials | 0.0% | Sovereign Debt | 0.1% | Interest Rate Swaps | 0.3% | U.S. Government Agency Obligations | 1.3% | Utilities | 1.4% | Communication Services | 1.8% | Real Estate | 2.9% | Mortgage-Backed Securities | 2.9% | Asset-Backed Securities | 3.3% | Health Care | 5.3% | Corporate Obligations | 6.4% | Energy | 7.0% | Consumer Staples | 7.2% | U.S. Treasury Obligations | 54.3% |
| Footnote | Description | Footnote* | Percentages are calculated based on total net assets. |
|
|
| Largest Holdings [Text Block] |
Holding Name | Coupon Rate | Maturity Date | Percentage of Total
Net Assets |
|---|
U.S. Treasury Inflation-Protected Securities | 0.375%
| 07/15/27
| 18.0% | U.S. Treasury Inflation-Protected Securities | 0.250%
| 07/15/29
| 14.5% | U.S. Treasury Inflation-Protected Securities | 0.750%
| 07/15/28
| 2.8% | U.S. Treasury Bills | 4.229%
| 06/20/25
| 2.1% | U.S. Treasury Inflation-Protected Securities | 0.125%
| 07/15/30
| 2.0% | Exxon Mobil Corp | —
| — | 1.8% | U.S. Treasury Bills | 4.248%
| 07/24/25
| 1.4% | U.S. Treasury Bills | 4.257%
| 06/12/25
| 1.4% | U.S. Treasury Notes, USBMMY3M + 0.170% | 4.471%
| 10/31/25
| 1.2% | Microsoft Corp | —
| — | 1.1% |
|
|
| Material Fund Change [Text Block] |
There were no material fund changes during the reporting period. |
|
|
|