Shareholder Report
May 31, 2025
USD ($)
$ / shares
WHAT WERE THE FUND COSTS FOR THE LAST SIX MONTHS? (based on a hypothetical $10,000 investment)
|
Class Name
|
Costs of a $10,000 investment
|
Costs paid as a percentage of a $10,000 investment*
|
|
Class A
|
$62
|
1.24%
|
HOW DID THE FUND PERFORM DURING THE LAST SIX MONTHS AND WHAT AFFECTED ITS PERFORMANCE?
The MSCI ACWI Net Total Return Index returned 2.83% versus the Fund’s Class A shares return of 0.13% during the period.The Fund underperformed due stock selection within the Industrials, Consumer Staples, and Consumer Discretionary sectors. Darling Ingredients (DAR US) within the Consumer Staples sector was the top detracting position during the period. Health Care was the top contributing sector due to stock selection and our underweight allocation within the sector. StoneX Group (SNEX US) within the Financials sector was the top contributing position during the period.
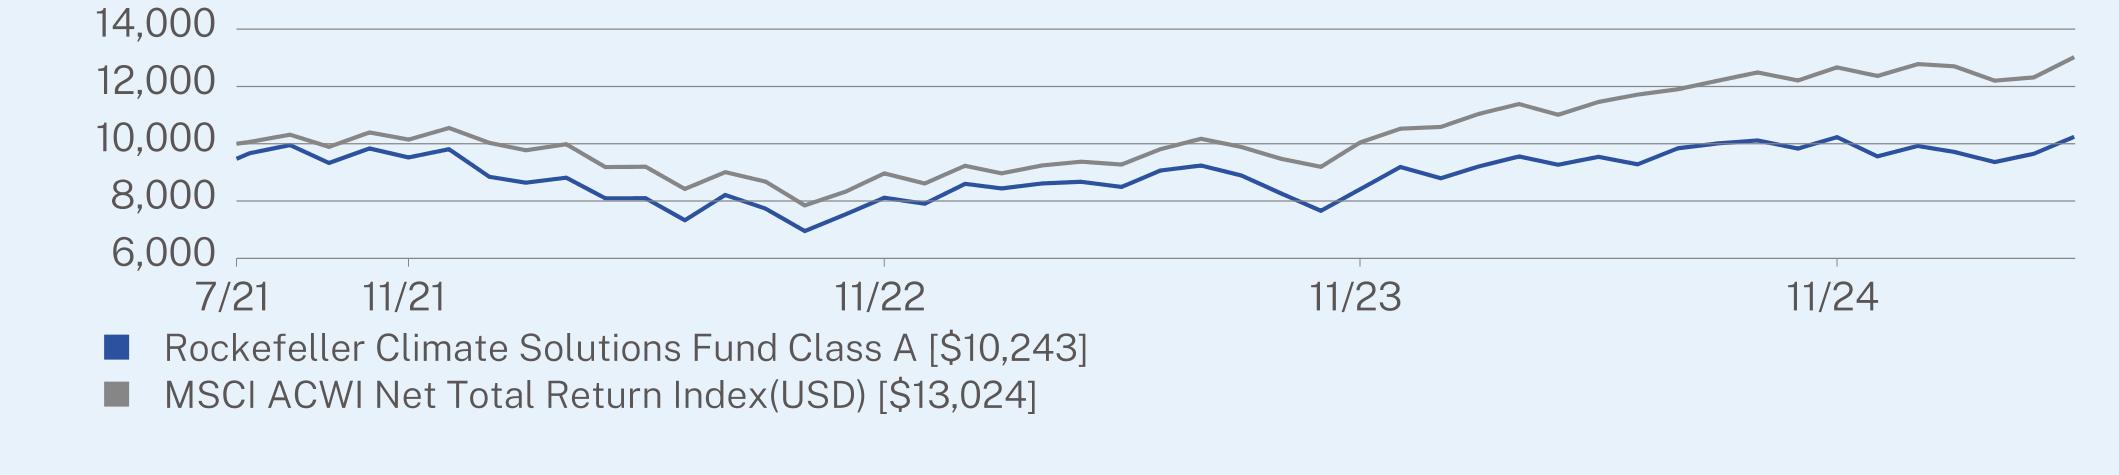
ANNUAL AVERAGE TOTAL RETURN (%)
|
|
1 Year
|
Since Inception
(07/21/2021) |
|
Class A (without sales charge)
|
7.33
|
2.04
|
|
Class A (with sales charge)
|
1.70
|
0.62
|
|
MSCI ACWI Net Total Return Index (USD)
|
13.65
|
7.08
|
Visit https://www.rockefellerfunds.com/equity-funds/ for more recent performance information.
KEY FUND STATISTICS (as of May 31, 2025)
|
Net Assets
|
$87,032,067
|
|
Number of Holdings
|
47
|
|
Portfolio Turnover
|
14%
|

|
Top 10 Issuers
|
(%)
|
|
StoneX Group, Inc.
|
4.4%
|
|
Mueller Industries, Inc.
|
3.9%
|
|
Schneider Electric SE
|
3.6%
|
|
Chubb Ltd.
|
3.5%
|
|
Bureau Veritas SA
|
3.4%
|
|
Limbach Holdings, Inc.
|
3.3%
|
|
Badger Meter, Inc.
|
3.2%
|
|
Cie de Saint-Gobain
|
3.1%
|
|
Trimble, Inc.
|
2.9%
|
|
Veralto Corp.
|
2.9%
|
CHANGE IN ACCOUNTANT
Effective February 11, 2025, Deloitte & Touche LLP (“Deloitte”) ceased to serve as the independent registered public accounting firm of the Fund. The Board of Trustees of Trust for Professional Managers (the “Board”), and the Audit Committee of the Board, approved Cohen & Company, Ltd. to serve as the new independent registered public accounting firm of the Fund for the fiscal year ending November 30, 2025. There were no disagreements with Deloitte during the fiscal years ended November 30, 2023 and 2024, and the subsequent interim period of December 1, 2024 through February 11, 2025.
WHAT WERE THE FUND COSTS FOR THE LAST SIX MONTHS? (based on a hypothetical $10,000 investment)
|
Class Name
|
Costs of a $10,000 investment
|
Costs paid as a percentage of a $10,000 investment*
|
|
Institutional Class
|
$49
|
0.99%
|
HOW DID THE FUND PERFORM DURING THE LAST SIX MONTHS AND WHAT AFFECTED ITS PERFORMANCE?
The MSCI ACWI Net Total Return Index returned 2.83% versus the Fund’s Institutional Class shares return of 0.26% during the period. The Fund underperformed due stock selection within the Industrials, Consumer Staples, and Consumer Discretionary sectors. Darling Ingredients (DAR US) within the Consumer Staples sector was the top detracting position during the period. Health Care was the top contributing sector due to stock selection and our underweight allocation within the sector. StoneX Group (SNEX US) within the Financials sector was the top contributing position during the period.
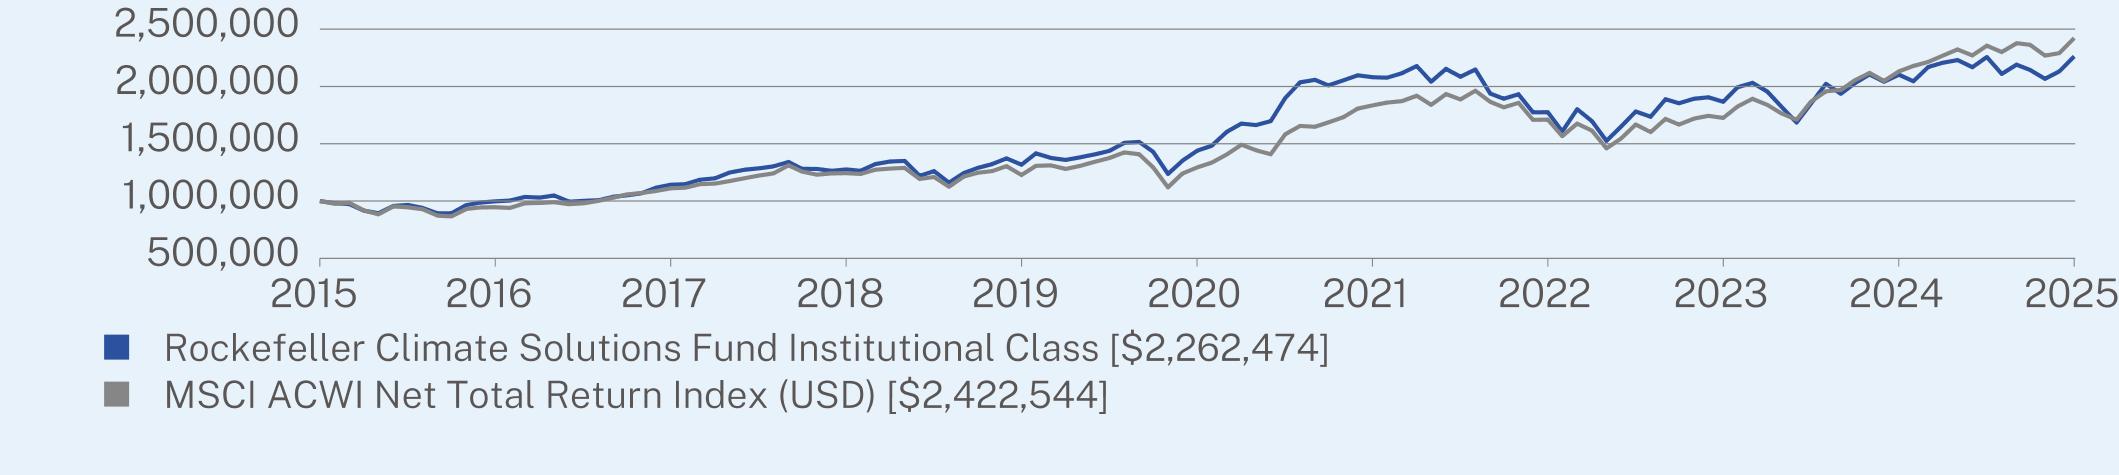
ANNUAL AVERAGE TOTAL RETURN (%)
|
|
1 Year
|
5 Year
|
10 Year**
|
|
Insitutional Class
|
7.60
|
9.46
|
8.51
|
|
MSCI ACWI Net Total Return Index (USD)
|
13.65
|
13.37
|
9.25
|
Visit https://www.rockefellerfunds.com/equity-funds/ for more recent performance information.
KEY FUND STATISTICS (as of May 31, 2025)
|
Net Assets
|
$87,032,067
|
|
Number of Holdings
|
47
|
|
Portfolio Turnover
|
14%
|
|
Top 10 Issuers
|
(%)
|
|
StoneX Group, Inc.
|
4.4%
|
|
Mueller Industries, Inc.
|
3.9%
|
|
Schneider Electric SE
|
3.6%
|
|
Chubb Ltd.
|
3.5%
|
|
Bureau Veritas SA
|
3.4%
|
|
Limbach Holdings, Inc.
|
3.3%
|
|
Badger Meter, Inc.
|
3.2%
|
|
Cie de Saint-Gobain
|
3.1%
|
|
Trimble, Inc.
|
2.9%
|
|
Veralto Corp.
|
2.9%
|

CHANGE IN ACCOUNTANT
Effective February 11, 2025, Deloitte & Touche LLP (“Deloitte”) ceased to serve as the independent registered public accounting firm of the Fund. The Board of Trustees of Trust for Professional Managers (the “Board”), and the Audit Committee of the Board, approved Cohen & Company, Ltd. to serve as the new independent registered public accounting firm of the Fund for the fiscal year ending November 30, 2025. There were no disagreements with Deloitte during the fiscal years ended November 30, 2023 and 2024, and the subsequent interim period of December 1, 2024 through February 11, 2025.
WHAT WERE THE FUND COSTS FOR THE LAST SIX MONTHS? (based on a hypothetical $10,000 investment)
|
Class Name
|
Costs of a $10,000 investment
|
Costs paid as a percentage of a $10,000 investment*
|
|
Class A
|
$62
|
1.30%
|
HOW DID THE FUND PERFORM DURING THE LAST SIX MONTHS AND WHAT AFFECTED ITS PERFORMANCE?
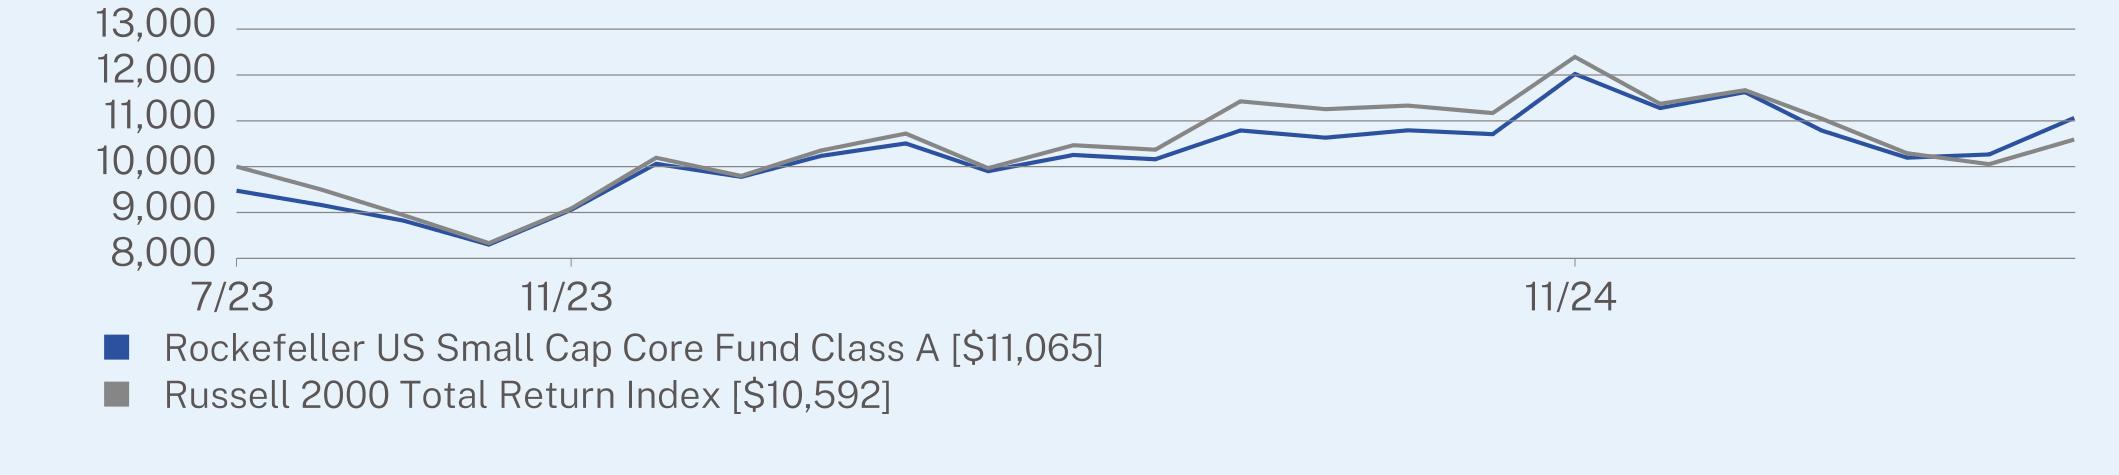
The Russell 2000 Total Return Index returned -14.54% versus the Fund’s Class A shares return of -7.96% during the period. The Fund outperformed as stock selection in the Industrials, Consumer Discretionary, and Financials sectors contributed to performance. Stride Inc. (LRN US) in Consumer Discretionary was the top contributing stock during the period. Stock selection in Communication Services and Consumer Staples detracted from performance. TechTarget (TTGT US) within the Communication Services sector was the top detracting position during the period and was eliminated in April.
ANNUAL AVERAGE TOTAL RETURN (%)
|
|
1 Year
|
Since Inception
(07/31/2023) |
|
Class A (without sales charge)
|
7.95
|
8.83
|
|
Class A (with sales charge)
|
2.28
|
5.68
|
|
Russell 2000 Total Return Index
|
1.19
|
3.18
|
Visit https://www.rockefellerfunds.com/equity-funds/ for more recent performance information.
KEY FUND STATISTICS (as of May 31, 2025)
|
Net Assets
|
$102,608,236
|
|
Number of Holdings
|
42
|
|
Portfolio Turnover
|
40%
|

|
Top 10 Issuers
|
(%)
|
|
Korn Ferry
|
4.3%
|
|
StoneX Group, Inc.
|
4.2%
|
|
Stride, Inc.
|
3.9%
|
|
ONE Gas, Inc.
|
3.5%
|
|
SunOpta, Inc.
|
3.4%
|
|
RadNet, Inc.
|
3.2%
|
|
Limbach Holdings, Inc.
|
3.1%
|
|
LeMaitre Vascular, Inc.
|
3.0%
|
|
ESCO Technologies, Inc.
|
3.0%
|
|
Agilysys, Inc.
|
2.8%
|
Effective February 11, 2025, Deloitte & Touche LLP (“Deloitte”) ceased to serve as the independent registered public accounting firm of the Fund. The Board of Trustees of Trust for Professional Managers (the “Board”), and the Audit Committee of the Board, approved Cohen & Company, Ltd. to serve as the new independent registered public accounting firm of the Fund for the fiscal year ending November 30, 2025. There were no disagreements with Deloitte during the fiscal years ended November 30, 2023 and 2024, and the subsequent interim period of December 1, 2024 through February 11, 2025.
WHAT WERE THE FUND COSTS FOR THE LAST SIX MONTHS? (based on a hypothetical $10,000 investment)
|
Class Name
|
Costs of a $10,000 investment
|
Costs paid as a percentage of a $10,000 investment*
|
|
Class I
|
$50
|
1.05%
|
HOW DID THE FUND PERFORM DURING THE LAST SIX MONTHS AND WHAT AFFECTED ITS PERFORMANCE?
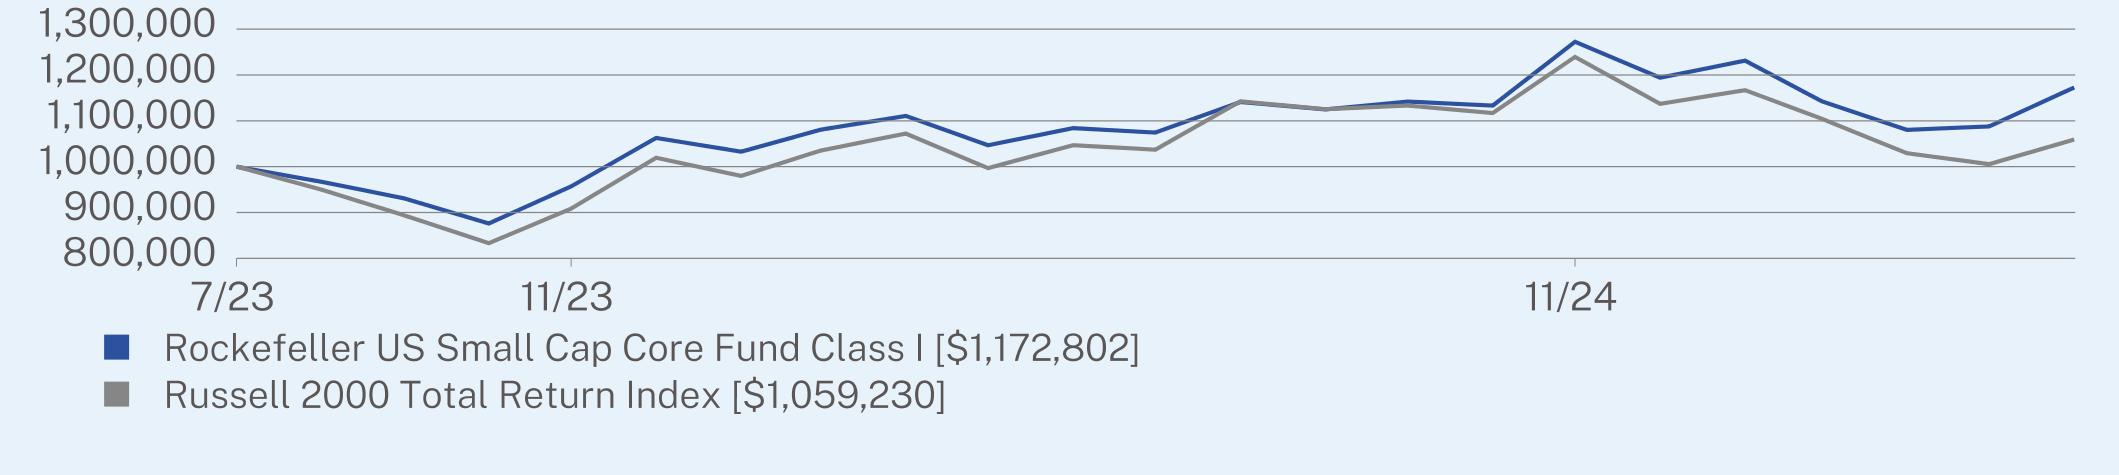
The Russell 2000 Total Return Index returned -14.54% versus the Fund’s Class I shares return of -7.84% during the period. The Fund outperformed as stock selection in the Industrials, Consumer Discretionary, and Financials sectors contributed to performance. Stride Inc. (LRN US) in Consumer Discretionary was the top contributing stock during the period. Stock selection in Communication Services and Consumer Staples detracted from performance. TechTarget (TTGT US) within the Communication Services sector was the top detracting position during the period and was eliminated in April.
ANNUAL AVERAGE TOTAL RETURN (%)
|
|
1 Year
|
Since Inception
(07/31/2023) |
|
Class I
|
8.25
|
9.09
|
|
Russell 2000 Total Return Index
|
1.19
|
3.18
|
Visit https://www.rockefellerfunds.com/equity-funds/ for more recent performance information.
KEY FUND STATISTICS (as of May 31, 2025)
|
Net Assets
|
$102,608,236
|
|
Number of Holdings
|
42
|
|
Portfolio Turnover
|
40%
|
|
Top 10 Issuers
|
(%)
|
|
Korn Ferry
|
4.3%
|
|
StoneX Group, Inc.
|
4.2%
|
|
Stride, Inc.
|
3.9%
|
|
ONE Gas, Inc.
|
3.5%
|
|
SunOpta, Inc.
|
3.4%
|
|
RadNet, Inc.
|
3.2%
|
|
Limbach Holdings, Inc.
|
3.1%
|
|
LeMaitre Vascular, Inc.
|
3.0%
|
|
ESCO Technologies, Inc.
|
3.0%
|
|
Agilysys, Inc.
|
2.8%
|
Effective February 11, 2025, Deloitte & Touche LLP (“Deloitte”) ceased to serve as the independent registered public accounting firm of the Fund. The Board of Trustees of Trust for Professional Managers (the “Board”), and the Audit Committee of the Board, approved Cohen & Company, Ltd. to serve as the new independent registered public accounting firm of the Fund for the fiscal year ending November 30, 2025. There were no disagreements with Deloitte during the fiscal years ended November 30, 2023 and 2024, and the subsequent interim period of December 1, 2024 through February 11, 2025.
| [1] |
|
||
| [2] |
|
||
| [3] |
|
||
| [4] |
|
||
| [5] |
|