Shareholder Report
May 31, 2025
USD ($)
$ / shares
WHAT WERE THE FUND COSTS FOR THE LAST SIX MONTHS? (based on a hypothetical $10,000 investment)
|
Fund Name
|
Costs of a $10,000 investment
|
Costs paid as a percentage of a $10,000 investment*
|
|
YCG Enhanced Fund
|
$59
|
1.17%
|
HOW DID THE FUND PERFORM THE LAST SIX-MONTHS AND WHAT AFFECTED ITS PERFORMANCE?
DOGE-driven cuts in government spending combined with rising tariffs to heighten investors’ concerns about the potential for stagflation. Additionally, the rise of Chinese-based LLMs like Deepseek dampened investor enthusiasm for American AI winners. Taken together, these news items drove the underperformance of both cyclical and AI-related names and the outperformance of more defensive, consumer staple-like companies. We took this opportunity to rebalance the portfolio and initiate positions in the American aggregates sector.
Notable contributors to performance over the six months ended May 31, 2025 were Hermßs, Republic Services, Microsoft, Mastercard, and Intuit.
Notable detractors to performance over the six months ended May 31, 2025 were Copart, Fair Isaac, Apple, L’Oréal, and MSCI.
Notable contributors to performance over the six months ended May 31, 2025 were Hermßs, Republic Services, Microsoft, Mastercard, and Intuit.
Notable detractors to performance over the six months ended May 31, 2025 were Copart, Fair Isaac, Apple, L’Oréal, and MSCI.
In our Annual and Semi-Annual reports, we include all of the required quantitative information, such as financial statements, detailed footnotes, performance reports and fund holdings. We also produce a Manager Commentary which is a more qualitative perspective on fund performance, discuss our thoughts on individual holdings, and share our investment outlook. You may obtain a copy of the current Manager Commentary either on the Fund’s website at https://ycgfunds.com/how-to-invest/ or by calling 1-512-505-2347
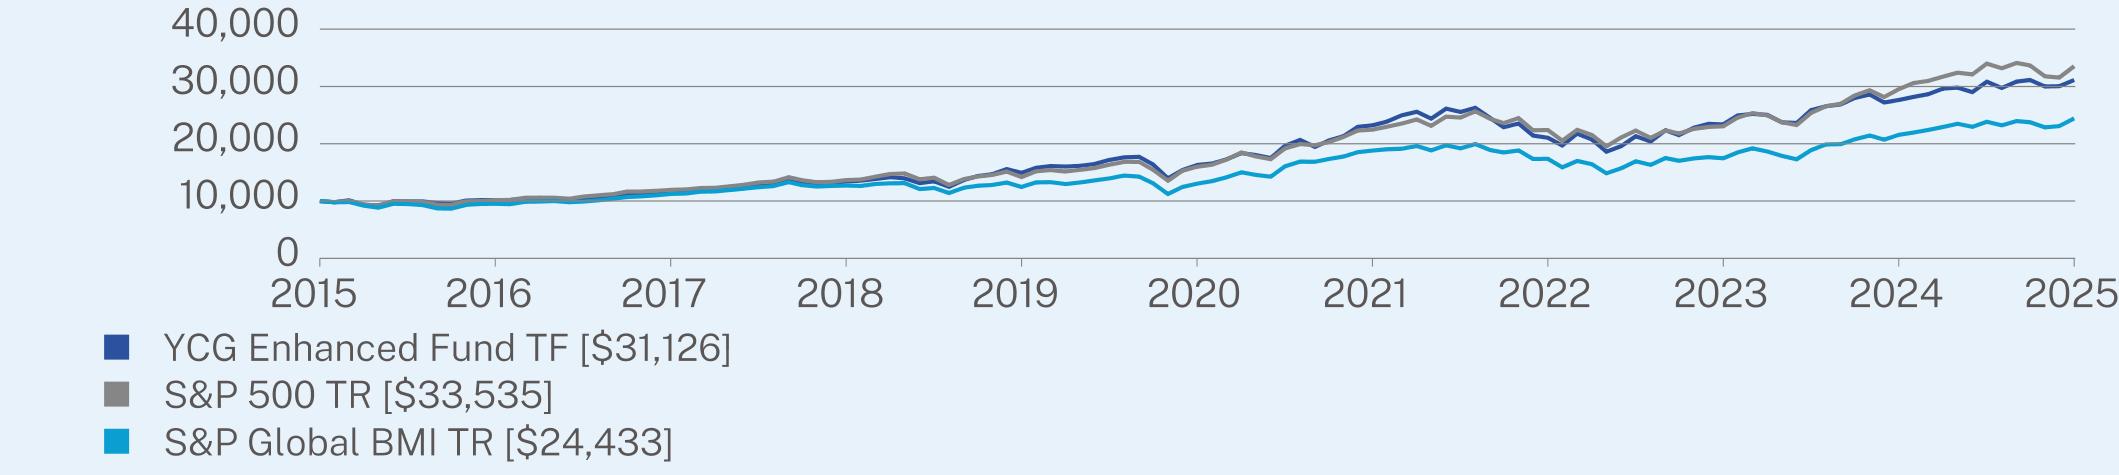
ANNUAL AVERAGE TOTAL RETURNS (%) (as of May 31, 2025)
|
|
1 Year
|
5 Year
|
10 Year
|
|
TF (without sales charge)
|
12.56
|
13.82
|
12.02
|
|
S&P 500 TR
|
13.52
|
15.94
|
12.86
|
|
S&P Global BMI TR
|
13.32
|
13.37
|
9.34
|
Visit https://ycgfunds.com/how-to-invest/ for more recent performance information.
Visit https://ycgfunds.com/how-to-invest/ for more recent performance information.
KEY FUND STATISTICS (as of May 31, 2025)
|
Net Assets
|
$589,500,012
|
|
Number of Holdings
|
66
|
|
Portfolio Turnover Rate
|
4%
|
|
Top Sectors
|
(%)**
|
|
Financials
|
33.1%
|
|
Industrials
|
19.2%
|
|
Information Technology
|
17.6%
|
|
Consumer Discretionary
|
12.7%
|
|
Real Estate
|
4.4%
|
|
Consumer Staples
|
2.5%
|
|
Communication Services
|
2.5%
|
|
Materials
|
1.6%
|
|
Cash & Other
|
6.4%
|
|
Top Holdings
|
(%)
|
|
Microsoft Corp.
|
7.6%
|
|
MasterCard, Inc. - Class A
|
6.8%
|
|
Moody’s Corp.
|
6.1%
|
|
Hermes International
|
5.3%
|
|
Amazon.com, Inc.
|
4.4%
|
|
Copart, Inc.
|
4.2%
|
|
Republic Services, Inc.
|
4.0%
|
|
MSCI, Inc.
|
4.0%
|
|
Waste Management, Inc.
|
4.0%
|
|
Marsh & McLennan Cos, Inc.
|
3.9%
|
|
Top Ten Countries
|
(%)
|
|
United States
|
80.5%
|
|
France
|
6.4%
|
|
Ireland
|
4.3%
|
|
Canada
|
4.1%
|
|
Netherlands
|
1.9%
|
|
Cash & Other
|
2.8%
|
| [1] |
|
||
| [2] |
|