img109187306_0.jpg

August 6, 2025

Management’s Discussion and Analysis

Management's Discussion and Analysis ("MD&A") for Enerflex Ltd. ("Enerflex" or the “Company") should be read in conjunction with the unaudited interim condensed consolidated financial statements (the "Financial Statements") for the three and six months ended June 30, 2025 and 2024, the Company’s 2024 Annual Report, the Annual Information Form (“AIF”) for the year ended December 31, 2024, and the cautionary statements regarding forward-looking information and statements in the “Forward-Looking Statements” section of this MD&A.

The MD&A focuses on information and material results from the Financial Statements and considers known risks and uncertainties relating to the energy sector. This discussion should not be considered exhaustive, as it excludes possible future changes that may occur in general economic, political, technological, and environmental conditions. Additionally, other factors and events may or may not occur, which could affect industry conditions and/or Enerflex in the future. Additional information relating to the Company can be found in the Management Information Circular dated March 21, 2025, the AIF, and the Form 40-F Annual Report, which are available on the Company’s website at www.enerflex.com and under the Company’s SEDAR+ and EDGAR profiles at www.sedarplus.ca and www.sec.gov/edgar, respectively.

The financial information reported herein has been prepared in accordance with International Financial Reporting Standards (“IFRS”) as issued by the International Accounting Standards Board (“IASB”) applicable to the preparation of interim financial statements, in particular IAS 34 “Interim Financial Reporting”, and is presented in United States dollars ("USD") unless otherwise stated.

Enerflex Strategy

Enerflex’s 45-year success is built upon our shared Vision of Transforming Energy for a Sustainable Future, propelled by a long-term strategy centered on four foundational pillars:

Leading Position in Growing Markets: Using the Company’s strong market position in core countries to benefit from expected growth in natural gas and produced water volumes.
Stable Energy Infrastructure ("EI") Platform: Building upon an EI platform that generates steady, recurring revenue.
Engineered Systems ("ES"), a Strategic Differentiator: Our ES modularized energy solutions distinguish Enerflex through our commitment to technical excellence and provides unique advantages to Enerflex’s EI and After-Market Service ("AMS") business lines.
Financial Strength and Discipline: Maintaining balance sheet strength while paying a sustainable dividend.

Through simplifying and optimizing our core business, and with our disciplined execution, and strong reputation for quality production and services, we are well-positioned over the medium and long-term to meet the increasing demand for sustainable energy infrastructure via our integrated natural gas, treated water, and energy transition solutions – and to continue generating lasting value for all stakeholders.


img109187306_1.jpg

M-1 img109187306_2.jpg


Outlook

Enerflex’s near-term priorities remain unchanged and include: (1) enhancing the profitability of core operations; (2) leveraging the Company’s leading position in core operating countries to capitalize on expected increases in natural gas and produced water volumes; and (3) maximizing free cash flow to further strengthen Enerflex’s financial position, provide direct shareholder returns, and invest in selective customer supported growth opportunities.

Enerflex continues to expect operating results to be underpinned by the highly contracted EI product line and the recurring nature of AMS, which together are expected to account for approximately 65% of gross margin before depreciation and amortization during 2025. The EI product line is supported by customer contracts expected to generate approximately $1.5 billion of revenue over their remaining terms.

Demand in the ES product line remains constructive, although the Company is actively monitoring near-term risks and uncertainties, including the impact of tariffs and commodity price volatility. Enerflex expects ES revenue to remain steady in the near term, supported by a backlog of approximately $1.2 billion as at June 30, 2025, and gross margin for the ES product line to align more closely with historical averages, reflective of a shift in project mix.

The medium-term outlook for each of Enerflex’s product lines remains attractive, supported by anticipated growth in the supply of natural gas and associated liquids, especially within Enerflex’s North American footprint.

Capital Allocation

Enerflex is refining its capital expenditure guidance for 2025. The Company now expects capital expenditures of approximately $120 million this year (prior guidance of $110 million to $130 million), including approximately $60 million allocated to growth opportunities (prior guidance of $40 million to $60 million) and $60 million for maintenance and PP&E expenditures (prior guidance $70 million). Growth investments will focus on customer-supported opportunities, primarily in the U.S. contract compression business line, where market fundamentals remain strong. This strength is underpinned by expected increases in natural gas production in the Permian Basin and continued capital discipline from industry participants.

Providing meaningful direct shareholder returns is a priority for Enerflex. During the second quarter of 2025, Enerflex returned $18 million to shareholders through dividend ($4 million) and share repurchases ($14 million).

The current normal course issuer bid ("NCIB") commenced on April 1, 2025, and will terminate no later than March 31, 2026, with the Company authorized to acquire up to a maximum of 6,159,695 Common Shares or approximately 5% of its public float as at the application date, for cancellation. During the second quarter of 2025, Enerflex repurchased 1,899,200 Common Shares at an average price of C$10.08 per share.

Going forward, capital allocation decisions will be based on delivering value to Enerflex shareholders and measured against Enerflex’s ability to maintain balance sheet strength. In addition to disciplined growth capital spending, share repurchases and dividends, Enerflex will also consider further debt reduction to strengthen its balance sheet and lower net finance costs. Unlocking greater financial flexibility positions the Company to respond to evolving market conditions and capitalize on opportunities to optimize its debt stack.


img109187306_3.jpg M-2Q2 2025 Report 2025


Summary Results


Three months ended June 30,


Six months ended June 30,


($ millions, except percentages)


2025


2024


2025


2024


Revenue


$

615


$

614


$

1,167


$

1,252


Gross margin ("GM")


139


136


267


223


GM as a percentage of revenue ("GM %")


22.6

%


22.1

%


22.9

%


17.8

%

Selling, general and administrative expenses (“SG&A”)


61


75


118


153


Foreign exchange loss


2


3


2


4


Operating income


76


58


147


66


EBITDA1


134


103


239


150


EBIT1


92


55


158


58


Net earnings (loss)


60


5


84


(13

)

Long-term debt


679


889


679


889


Net debt2


608


763


608


763


Cash (used in) provided by operating activities


(4

)


12


92


113


Key Financial Performance Indicators (“KPIs”)


ES backlog3


$

1,227


$

1,251


$

1,227


$

1,251


ES bookings3


365


331


570


751


EI contract backlog4


1,462


1,604


1,462


1,604


GM before depreciation and amortization (“GM before D&A”)5


175


173


336


292


GM before D&A as a percentage of revenue ("GM before D&A %")5


28.5

%


28.2

%


28.8

%


23.3

%

Adjusted EBITDA6


130


122


243


191


Free cash flow7


(39

)


(4

)


46


68


Bank-adjusted net debt to EBITDA ratio7


1.3

x


2.2x


1.3

x


2.2x


Return on capital employed (“ROCE”)7,8


16.4

%


1.7

%


16.4

%


1.7

%

1EBITDA is defined as earnings before finance costs, income taxes, depreciation and amortization. EBIT is defined as earnings before finance costs and income taxes.

2 Net debt is defined as total long-term debt less cash and cash equivalent as presented in the Financial Statements.

3Refer to the “ES Bookings and Backlog” section of this MD&A for further details.

4Refer to the “EI Contract Backlog” section of this MD&A for further details.

5Refer to the “GM before D&A by Product Line and Recurring GM before D&A” section of this MD&A for further details.

6Refer to the “Adjusted EBITDA” section of this MD&A for further details.

7Refer to the “Non-IFRS Measures” section of this MD&A for further details.

8Determined by using the trailing 12-month period.


img109187306_4.jpg

M-3 img109187306_2.jpg


Results Overview

Revenue in the second quarter of 2025 was $615 million, consistent with the $614 million generated for the same period of 2024, attributable to steady revenue generated across all product lines. The Company generated $1.2 billion of revenue for the six months ended June 30, 2025, a decrease from revenue of $1.3 billion generated in the same period in 2024, primarily attributable to upfront revenue recognized in the EI product line on conversion of an existing EI asset from an operating lease to a finance lease in the Eastern Hemisphere ('EH") segment during the first quarter of 2024.
Gross margin for the second quarter of 2025 was $139 million and 22.6%, a slight increase from the $136 million and 22.1% during the same period in 2024, primarily due to gross margin contribution from the sale of certain EI assets in Latin America ("LATAM") segment, partially offset by lower gross margin contributions from the North America (“NAM”) ES business during the second quarter of 2025. Gross margin for the six months ended June 30, 2025 was $267 million and 22.9% increasing from $223 million and 17.8% for the same period of 2024, primarily due to the costs recognized on an international ES project in the first quarter of 2024, and contributions from the sale of EI assets in LATAM in the first two quarters of 2025.
SG&A was $61 million for the three months ended June 30, 2025, a decrease of $14 million compared to the same period in 2024. The reduction was primarily driven by completion of integration and restructuring activities in 2024 that have resulted in cost reductions and improved operational efficiencies, and lower amortization of intangible assets in the current period. SG&A was $118 million for the six months ended June 30, 2025, a decrease of $35 million from the same period in 2024. The decrease reflects lower share-based compensation expense as a result of share price volatility, lower amortization of intangible assets, and sustained cost reductions and operational efficiencies, partially offset by executive transition costs incurred during the first half of 2025.
Net earnings of $60 million or $0.49 per share and $84 million or $0.68 per share for the three and six months ended June 30, 2025 respectively, increased from the same periods in 2024, primarily attributable to higher gross margin, lower SG&A expenses, lower net finance costs, and an unrealized gain on redemption options related to the Senior Secured Notes (the "Notes") in the first half of 2025. Net earnings for the three months ended June 30, 2025 also benefited from lower income tax expenses.
Adjusted earnings before finance, costs, income taxes, depreciation and amortization ("adjusted EBITDA") for the three and six months ended June 30, 2025 of $130 million and $243 million respectively, increased from $122 million and $191 million in the same period of 2024. Adjusted EBITDA for the current periods benefited from higher gross margin before depreciation and amortization, cost-saving initiatives and improved operational efficiencies.
Return on capital employed (“ROCE”) increased to 16.4% in the three months ended June 30, 2025, compared to 1.7% in the same period in 2024. ROCE during the second quarter of 2025 was the highest in over five years, benefiting on a year-over-year basis from an increase in trailing 12-month EBIT and lower average capital employed, predominantly due to a decline in net debt.
Cash used in operating activities was $4 million during the three months ended June 30, 2025, compared to cash provided by operating activities of $12 million in the same period in 2024. The change was driven by a build of working capital from a strategic investment in inventories, primarily offset by higher net earnings during the second quarter of 2025. Cash provided by operating activities of $92 million during the six months ended June 30, 2025, decreased by $21 million from the same period in 2024, also attributable to the build of working capital.


img109187306_3.jpg M-4Q2 2025 Report 2025


Free cash flow was a use of cash of $39 million during the three months ended June 30, 2025, compared to a use of cash of $4 million during the same period in 2024. Compared to the second quarter of 2024, increased net earnings were more than offset by increased growth capital spending and a build in net working capital, notably: (1) strategic inventory investments to support future projects, including work-in-progress related to EI assets and purchases of select major components with increasing lead times; (2) income tax payments; and (3) executive transition costs. Free cash flow was $46 million during the six months ended June 30, 2025, a decrease of $22 million from the same period of 2024, also attributable to higher capital expenditures and net working capital changes, partially offset by strong performance during the first half of 2025.
Enerflex continues to constructively manage its leverage ratio and maintained its net funded debt to EBITDA (“bank-adjusted net debt to EBITDA”) ratio at approximately 1.3x at the end of the second quarter of 2025 through strong performance and disciplined capital allocation. At June 30, 2025, the Company was in compliance with its covenants.
The Company invested $34 million in capital expenditures ("CAPEX") during the three months ended June 30, 2025, comprised of $11 million in maintenance expenditures across the global EI assets and PP&E and $23 million to expand the EI asset fleet and a manufacturing facility in NAM. The Company also invested $37 million during the three months ended June 30, 2025 to expand an EI project in EH that was commissioned early in the third quarter of 2025 and will be accounted for as a finance lease. The Company now expects capital spending of $120 million this year, including approximately $60 million allocated to growth opportunities and $60 million for maintenance and PP&E expenditures.
ES backlog remains healthy at $1.2 billion at June 30, 2025, reflecting new bookings and strong revenue recognition on advancement of ES projects in NAM segment during the second quarter of 2025. Enerflex's backlog provides strong visibility for the ES business and the Company expects near-term revenue for the ES business to remain steady. Enerflex recorded ES bookings of $365 million during the three months ended June 30, 2025, compared to $331 million during the same period of 2024 and the 8-quarter average of $329 million, attributable to higher activity levels in NAM during the three months ended June 30, 2025. Enerflex recorded ES bookings of $570 million during the first half of 2025, compared to $751 million during the same period of 2024. The decrease is primarily due to first quarter bookings being impacted by accelerated client activity in the latter part of the fourth quarter of 2024 and an EI expansion project in EH that would be accounted for as a finance lease booked during the first quarter of 2024.
The Company’s EI contract backlog of $1.5 billion at June 30, 2025 remained consistent with the backlog of $1.5 billion at December 31, 2024.
Subsequent to June 30, 2025, Enerflex declared a quarterly dividend of CAD $0.0375 per share, payable on September 2, 2025 to shareholders of record on August 18, 2025. The Board will continue to evaluate dividend payments on a quarterly basis, based on availability of cash flow, anticipated market conditions, and the general needs of the business.


img109187306_4.jpg

M-5 img109187306_2.jpg


Adjusted EBITDA

Enerflex’s financial results include items that are unique, and items that Management and users of the Financial Statements adjust for when evaluating results. The Company removes the impact of these items when calculating Adjusted EBITDA. The presentation of Adjusted EBITDA should not be considered in isolation from EBIT or EBITDA or as a replacement for measures prepared as determined under IFRS. Adjusted EBITDA may not be comparable to similar non-IFRS measures disclosed by other issuers.

Enerflex believes adjustment of items that are unique or not in the normal course of continuing operations increases the comparability across items within the Financial Statements or between periods of the Financial Statements. Items the Company has adjusted for in the past include, but are not limited to, restructuring, transaction, and integration costs; share-based compensation which fluctuates based on share price that can be influenced by factors not directly relevant to the Company's operations; impact of finance leases to account for the lease principal payments received over the term of the related lease and removing the non-cash upfront selling profit; gain or loss on redemption options associated with the Company’s Notes; and impairment of goodwill. These items are considered either unique, non-recurring, or non-cash transactions, and not indicative of the ongoing normal operations of the Company.

Three months ended June 30, 2025


($ millions)


NAM


LATAM


EH


Total


Net earnings1


$

60


Income taxes1


14


Net finance costs1,2


18


EBIT3


$

51


$

20


$

6


$

92


Depreciation and amortization


15


10


17


42


EBITDA


$

66


$

30


$

23


$

134


Share-based compensation


2


1


-


3


Impact of finance leases


Principal payments received


-


-


8


8


Unrealized gain on redemption options3


(15

)

Adjusted EBITDA


$

68


$

31


$

31


$

130


1The Company included net earnings (loss), income taxes, and net finance costs on a consolidated basis to reconcile to EBIT.

2Net finance costs are considered corporate expenditure and therefore have not been allocated to reporting segments.

3EBIT includes $15 million unrealized gain on redemption options associated with the Notes. Debt is managed within Corporate and is not allocated to reporting segments.


Three months ended June 30, 2024


($ millions)


NAM


LATAM


EH


Total


Net loss1


$

5


Income taxes1


27


Net finance costs1,2


23


EBIT


$

50


$

-


$

5


$

55


Depreciation and amortization


18


17


13


48


EBITDA


$

68


$

17


$

18


$

103


Restructuring, transaction and integration costs


2


2


1


5


Share-based compensation


2


-


-


2


Impact of finance leases


Principal payments received


-


-


12


12


Adjusted EBITDA


$

72


$

19


$

31


$

122


1The Company included net earnings (loss), income taxes, and net finance costs on a consolidated basis to reconcile to EBIT.

2Net finance costs are considered corporate expenditure and therefore have not been allocated to reporting segments.


img109187306_3.jpg M-6Q2 2025 Report 2025


Six months ended June 30, 2025


($ millions)


NAM


LATAM


EH


Total


Net earnings1


$

84


Income taxes1


33


Net finance costs1,2


41


EBIT3


$

89


$

39


$

18


$

158


Depreciation and amortization


31


21


29


81


EBITDA


$

120


$

60


$

47


$

239


Impact of finance leases


Principal payments received


-


-


16


16


Unrealized gain on redemption options3


(12

)

Adjusted EBITDA


$

120


$

60


$

63


$

243


1The Company included net earnings (loss), income taxes, and net finance costs on a consolidated basis to reconcile to EBIT.

2Net finance costs are considered corporate expenditure and therefore have not been allocated to reporting segments.

3EBIT includes $12 million unrealized gain on redemption options associated with the Notes. Debt is managed within Corporate and is not allocated to reporting segments.


Six months ended June 30, 2024


($ millions)


NAM


LATAM


EH


Total


Net loss1


$

(13

)

Income taxes1


22


Net finance costs1,2


49


EBIT


$

83


$

5


$

(30

)


$

58


Depreciation and amortization


36


27


29


92


EBITDA


$

119


$

32


$

(1

)


$

150


Restructuring, transaction and integration costs


5


4


2


11


Share-based compensation


5


1


2


8


Impact of finance leases


Upfront gain


-


-


(3

)


(3

)

Principal payments received


-


-


25


25


Adjusted EBITDA


$

129


$

37


$

25


$

191


1The Company included net earnings (loss), income taxes, and net finance costs on a consolidated basis to reconcile to EBIT.

2Net finance costs are considered corporate expenditure and therefore have not been allocated to reporting segments.


Refer to the section “Segmented Results” of this MD&A for information about results by reporting segment.


img109187306_4.jpg

M-7 img109187306_2.jpg


Engineered Systems Backlog and Bookings

Enerflex monitors its ES backlog and bookings as indicators of future revenue generation and business activity levels for the ES product line. ES bookings are recorded in the period when a firm commitment or order is received from clients. Bookings increase backlog in the period they are received, while revenue recognized on ES projects decrease backlog in the period the revenue is recognized. Accordingly, ES backlog is an indication of revenue to be recognized in future periods. Revenue from contracts that have been classified as finance leases for newly built equipment is recorded as ES bookings. The full amount of revenue is removed from backlog at commencement of the lease.

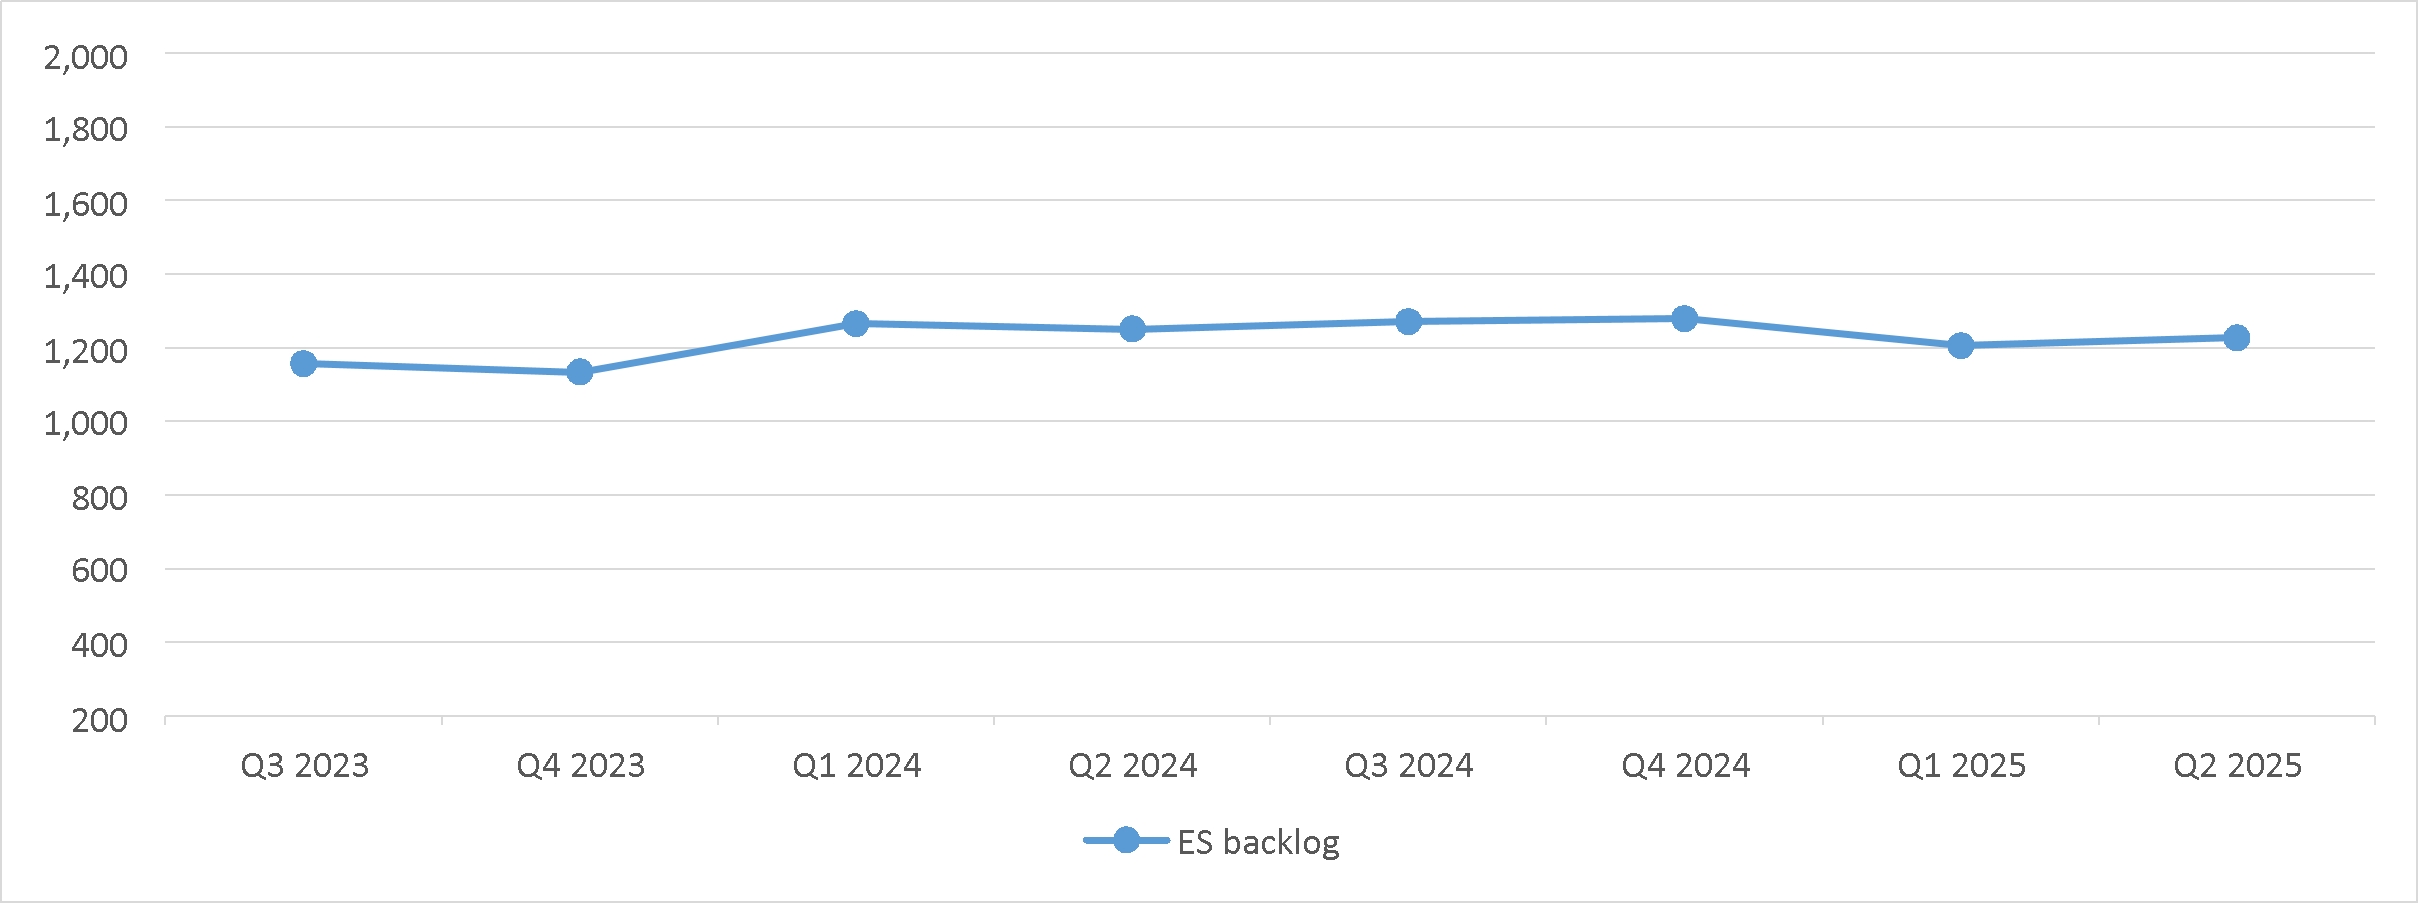
Enerflex's ES backlog remains healthy at $1.2 billion at June 30, 2025, consistent with the 8-quarter average ES backlog of approximately $1.2 billion. This sustained level of backlog over a two-year period reflects stable demand for Enerflex's ES solutions across global energy infrastructure markets. The 8-quarter average also serves as a key indicator of operational consistency and revenue visibility, smoothing out short-term fluctuations in ES bookings and project timings. This trend demonstrates that the ES product line continues to benefit from a diversified portfolio of gas compression and processing projects, reinforcing management's confidence in the ES product line's ability to generate predictable revenue and margin performance in the near-term. ES backlog includes revenue on expansion of an EI project that was commissioned early in the third quarter of 2025 which will be accounted for as a finance lease, and will result in a reduction of backlog by approximately $116 million.

ES backlog for the past 8 quarters are illustrated below in millions:


img109187306_5.jpg

Enerflex recorded ES bookings of $365 million during the three months ended June 30, 2025, compared to $331 million during the same period of 2024 and the 8-quarter average of $329 million. The increase is attributable to higher activity levels in NAM during the three months ended June 30, 2025. ES bookings of $570 million for the six months ended June 30, 2025 decreased from $751 million during the same period of 2024, primarily due to lower bookings in the first quarter of 2025 and the expansion of an EI project in EH which was booked in the first quarter of 2024. The year-over-year decrease is partially offset by higher bookings in NAM during the three months ended June 30, 2025.

The ES product line has maintained a book-to-bill ratio (calculated as bookings divided by revenue) of 1.1x during the second quarter of 2025, indicating that new bookings are generally keeping pace with revenue recognition. The current balance between bookings and revenue supports near-term revenue visibility and reflects a stable demand environment. The trailing 12-month ("TTM") book-to-bill ratio has also remained at 1.0x, an indication that the Company is consistently replenishing its backlog in line with project execution.

ES backlog and bookings by reporting segment are disclosed in the “Segmented Results” section of this MD&A.


img109187306_3.jpg M-8Q2 2025 Report 2025


EI Contract Backlog

The Company’s EI contract backlog is recognized from lease agreements executed with clients for leasing and/or operations and maintenance of the Company’s EI assets. Lease agreements executed during the period increase EI contract backlog while revenue recognized on EI assets decreases the EI contract backlog in the period the revenue is recognized.

Enerflex has lease agreements with clients for EI assets with initial terms ranging from one to 10 years. Information on recognition of revenue from the EI contract backlog is included in Note 10 of the Financial Statements.

The following table sets forth EI contract backlog by reporting segment:


($ millions)


June 30, 2025


December 31, 2024


NAM


$

152


$

136


LATAM


422


458


EH


888


951


Total EI contract backlog


$

1,462


$

1,545


Enerflex's EI contract backlog of $1.5 billion at June 30, 2025 has remained consistent with the backlog of $1.5 billion at December 31, 2024, reflecting revenue recognized during the first half of 2025, partially offset by EI contract bookings in the NAM segment.

Segmented Results

Enerflex has three reporting segments: NAM, LATAM, and EH, each of which are supported by Enerflex’s corporate functions. Corporate overhead is allocated to the operating segments based on revenue. In assessing its operating segments, the Company considers geographic locations, economic characteristics, the nature of products and services provided, the nature of production processes, the types of clients for its products and services, and distribution methods used.


img109187306_4.jpg

M-9 img109187306_2.jpg


NAM


Three months ended June 30,


Six months ended June 30,


($ millions, except percentages)


2025


2024


2025


2024


ES backlog


$

1,048


$

977


$

1,048


$

977


ES bookings


357


303


526


622


EI contract backlog


152


105


152


105


Segment revenue


$

435


$

439


$

803


$

824


Intersegment revenue


(2

)


(20

)


(8

)


(36

)

Revenue


$

433


$

419


$

795


$

788


EI


$

38


$

37


$

74


$

73


AMS


64


72


124


138


ES


331


310


597


577


Revenue


433


419


795


788


EI


17


16


35


35


AMS


12


14


20


24


ES


58


63


102


109


GM


87


93


157


168


GM %


20.1

%


22.2

%


19.7

%


21.3

%


EI


28


24


54


51


AMS


13


16


23


27


ES


59


64


105


112


GM before D&A


100


104


182


190


GM before D&A %


23.1

%


24.8

%


22.9

%


24.1

%


SG&A


35


43


67


85


Foreign exchange loss


2


-


2


-


Operating income


50


50


88


83


EBIT


51


50


89


83


EBITDA


66


68


120


119


Adjusted EBITDA


68


72


120


129


ES backlog $1.0 billion at June 30, 2025 reflects increased ES bookings during the quarter, and is expected to result in steady ES revenue generation over the near term. ES bookings of $357 million in the second quarter of 2025 increased by $54 million compared to the same period in 2024, attributable to increased activity levels in the U.S. during the three months ended June 30, 2025.

EI contract backlog of $152 million at June 30, 2025, increased from $105 million at June 30, 2024, attributable to new bookings, partially offset by revenue recognized on ongoing contracts.

Revenue increased by $14 million during the three months ended June 30, 2025 compared to the same period of 2024, primarily due to increased ES revenues from higher activity levels and increased operational activity during the quarter, partially offset by lower AMS revenue compared to the same period in 2024 due to higher than typical AMS activity levels in that year. Revenue increased by $7 million during the six months ended June 30, 2025 compared to the same period in 2024, primarily due to increased ES revenue in the first half of 2025 on progression of projects in the second quarter of 2025, partially offset by higher than typical AMS activity levels during the first half of 2024.

Although revenue increased for the segment, gross margin decreased during the three and six months ended June 30, 2025, compared to the same period of 2024, due to lower margin contribution from the AMS business and execution of a different product mix in the ES business during the first half of 2025.

SG&A for the three and six months ended June 30, 2025, decreased by $8 million and $18 million, respectively, compared to the same periods of 2024. These decreases were primarily driven by completion of integration and restructuring activities in 2024 that have resulted in cost reductions and improved operational efficiencies, and lower share-based compensation in the first half of 2025.

At June 30, 2025, the U.S. contract compression fleet totaled approximately 456,000 horsepower with average utilization for the three and six months ended June 30, 2025, of 94% consistent with the 94% utilization for the three and six months ended June 30, 2024.


img109187306_3.jpg M-10Q2 2025 Report 2025


LATAM


Three months ended June 30,


Six months ended June 30,


($ millions, except percentages)


2025


2024


2025


2024


ES backlog


$

9


$

53


$

9


$

53


ES bookings


1


3


6


8


EI contract backlog


422


481


422


481


Segment revenue


$

89


$

100


$

191


$

184


Intersegment revenue


-


-


-


-


Revenue


$

89


$

100


$

191


$

184


EI


$

69


$

63


$

143


$

120


AMS


15


16


35


30


ES


5


21


13


34


Revenue


89


100


191


184


EI


24


13


47


31


AMS


4


5


10


9


ES


-


4


2


6


GM


28


22


59


46


GM %


31.5

%


22.0

%


30.9

%


25.0

%


EI


34


28


67


57


AMS


4


5


10


9


ES


-


4


2


6


GM before D&A


38


37


79


72


GM before D&A %


42.7

%


37.0

%


41.4

%


39.1

%


SG&A


9


16


19


29


Foreign exchange loss (gain)


(1

)


3


(1

)


4


Operating income


20


3


41


13


EBIT


20


-


39


5


EBITDA


30


17


60


32


Adjusted EBITDA


31


19


60


37


ES backlog of $9 million at June 30, 2025 reflects ongoing projects near completion.

EI contract backlog was $422 million at June 30, 2025, compared to $481 million at June 30, 2024. The decrease of $59 million is primarily due to revenue recognition on existing contracts partially offset by incremental contract bookings resulting from rate adjustments and renewals of existing contracts in the first six months of 2025.

Revenue for the second quarter of 2025 was $89 million, a decrease of $11 million from the same period in 2024, attributable to lower ES revenue from projects near completion, partially offset by increased EI revenue from sale of certain EI assets and rate adjustments on existing contracts. Revenue during the six months ended June 30, 2025 was $191 million, an increase of $7 million when compared to the same period in 2024, driven by stronger parts sales in the AMS business, sale of EI assets, and rate adjustments on existing contracts which took effect in the later part of 2024, partially offset by the lower ES revenue in the first half of 2025.

Despite lower revenue generated in the current quarter, gross margin increased by $6 million and $13 million during the three and six months ended June 30, 2025, compared to the same periods of 2024. This was attributable to higher margin on the EI asset sales, higher parts sales revenue in the first half of 2025, and one-time accelerated depreciation in the second quarter of 2024, partially offset by lower gross margin contribution from the ES product line.

SG&A of $9 million and $19 million during the three and six months ended June 30, 2025, decreased by $7 million and $10 million, respectively, compared to the same periods of 2024. These decreases were primarily driven by completion of integration and restructuring activities in 2024 that have resulted in cost reductions, and improved operational efficiencies.


img109187306_4.jpg

M-11 img109187306_2.jpg


EH


Three months ended June 30,


Six months ended June 30,


($ millions, except percentages)


2025


2024


2025


2024


ES backlog


$

170


$

221


$

170


$

221


ES bookings


7


25


38


121


EI contract backlog


888


1,018


888


1,018


Segment revenue


$

93


$

97


$

182


$

283


Intersegment revenue


-


(2

)


(1

)


(3

)

Revenue


$

93


$

95


$

181


$

280


EI


$

40


$

41


$

83


$

177


AMS


45


39


85


80


ES


8


15


13


23


Revenue


93


95


181


280


EI


12


16


28


31


AMS


10


8


20


18


ES


2


(3

)


3


(40

)

GM


24


21


51


9


GM %


25.8

%


22.1

%


28.2

%


3.2

%


EI


24


25


51


49


AMS


11


9


21


20


ES


2


(2

)


3


(39

)

GM before D&A


37


32


75


30


GM before D&A %


39.8

%


33.7

%


41.4

%


10.7

%


SG&A


17


16


32


39


Foreign exchange loss


1


-


1


-


Operating income (loss)


6


5


18


(30

)

EBIT


6


5


18


(30

)

EBITDA


23


18


47


(1

)

Adjusted EBITDA


31


31


63


25


ES backlog of $170 million decreased from $221 million at June 30, 2024, attributable to termination of an International ES project during the fourth quarter of 2024 and revenue recognized from ongoing projects, partially offset by new bookings. ES bookings of $7 million and $38 million for the three and six months ended June 30, 2025 respectively, decreased from the same periods in 2024, attributable to expansion of an existing EI project that occurred in the first half of 2024. The segment's ES backlog includes revenue on expansion of an EI project that was commissioned early in the third quarter of 2025 which will be accounted for as a finance lease, and will result in a reduction of backlog by approximately $116 million.

EI contract backlog was $0.9 billion at June 30, 2025, a decrease from the $1.0 billion at June 30, 2024, attributable to revenue recognition from existing contracts, partially offset by new bookings secured during the quarter.

Revenue for the three months ended June 30, 2025 remained consistent with the same period in 2024. Revenue decreased by $99 million during the six months ended June 30, 2025 when compared to the same period last year, primarily attributable to upfront revenue recognized on conversion of an existing EI asset from operating lease to a finance lease in the first quarter of 2024.

Gross margin and gross margin percentage for the three months ended June 30, 2025, increased slightly when compared to the same period of 2024, primarily attributable to margin contribution from higher AMS revenue, lower costs on current ES projects relative to those that were active in the prior year, partially offset by the depreciation adjustment following the early conclusion of an EI contract during the second quarter of 2025. Gross margin for the six months ended June 30, 2025, increased when compared to the six months ended June 30, 2024, primarily due to costs recognized on an international ES project in the first quarter of 2024.

SG&A decreased for the six months ended June 30, 2025 by $7 million compared to the same period in 2024. The decrease in SG&A is attributable to lower amortization cost of the segment's intangible assets, a tax refund received in the first quarter of 2025, and completion of integration and restructuring activities in 2024 that have resulted in cost reductions, and improved operational efficiencies.


img109187306_3.jpg M-12Q2 2025 Report 2025


Non-IFRS Measures

Enerflex measures its financial performance using several key financial performance indicators, some of which do not have standardized meanings as prescribed by IFRS and therefore may not be comparable to similar measures presented by other issuers. These non-IFRS measures include adjusted EBITDA, ES backlog and bookings, ES book to bill ratio, EI contract backlog, gross margin before D&A, recurring gross margin before D&A, free cash flow, dividend payout ratio, bank-adjusted net debt to EBITDA ratio and ROCE. These measures should not be considered as alternatives to net earnings or any other measure of performance under IFRS. Reconciliation of these non-IFRS measures to the most directly comparable IFRS measure is provided below and in the relevant sections where appropriate. ES backlog and bookings, ES book to bill ratio and EI contract backlog do not have a directly comparable IFRS measure.

GM before D&A by Product Line & Recurring GM before D&A

Enerflex’s three reporting segments oversee execution of three main product lines:

EI (Energy Infrastructure): Infrastructure solutions under contract for natural gas processing, compression, treated water, and electric power.
AMS (After-Market Services): Provision of after-market services such as mechanical maintenance, parts distribution, operations and maintenance solutions, equipment optimization and maintenance programs, manufacturer warranties, exchange components, and long-term service agreements.
ES (Engineered Systems): Engineer, design, and manufacture processing, compression, cryogenic, electric power, treated water, and low-carbon solutions, including carbon capture.

EI and AMS product lines are considered recurring, as they are typically contracted and extend into future periods, generating ongoing revenue for the Company. In contrast, the ES product line is non-recurring, as it does not typically generate repeat revenue after delivery of products. While the EI and AMS contracts may vary in duration and are subject to cancellation, the Company believes they exhibit characteristics consistent with recurring business activities.

The Company uses gross margin before depreciation and amortization ("GM before D&A") to assess operational performance of each product line. GM before D&A is defined as gross margin excluding depreciation and amortization, which can vary based on the nature and origin of assets. The presentation of GM before D&A should not be considered in isolation from gross margin or as a replacement for measures prepared as determined under IFRS.

The Company also presents recurring GM before D&A to evaluate its recurring business, and it is defined as GM before D&A from the EI and AMS product lines.

Reconciliation of GM before D&A to the most comparable IFRS measure, and recurring GM before D&A is presented in the tables below.

Three months ended June 30, 2025


($ millions, except percentages)


EI


AMS


Recurring
Product Lines


ES


Total


Revenue


$

147


$

124


$

271


$

344


$

615


Cost of goods sold:


Operating expenses


61


96


157


283


440


Depreciation and amortization


33


2


35


1


36


Gross margin


$

53


$

26


$

79


$

60


$

139


Gross margin %


36.1

%


21.0

%


29.2

%


17.4

%


22.6

%

Gross margin before D&A


$

86


$

28


$

114


$

61


$

175


Gross margin before D&A %


58.5

%


22.6

%


42.1

%


17.7

%


28.5

%

% of total Gross margin before D&A


49.1

%


16.0

%


65.1

%


34.9

%


img109187306_4.jpg

M-13 img109187306_2.jpg


Three months ended June 30, 2024


($ millions, except percentages)


EI


AMS


Recurring
Product Lines


ES


Total


Revenue


$

141


$

127


$

268


$

346


$

614


Cost of goods sold:


Operating expenses


64


97


161


280


441


Depreciation and amortization


32


3


35


2


37


Gross margin


$

45


$

27


$

72


$

64


$

136


Gross margin %


31.9

%


21.3

%


26.9

%


18.5

%


22.1

%

Gross margin before D&A


$

77


$

30


$

107


$

66


$

173


Gross margin before D&A %


54.6

%


23.6

%


39.9

%


19.1

%


28.2

%

% of total Gross margin before D&A


44.5

%


17.3

%


61.8

%


38.2

%


Six months ended June 30, 2025


($ millions, except percentages)


EI


AMS


Recurring
Product Lines


ES


Total


Revenue


$

300


$

244


$

544


$

623


$

1,167


Cost of goods sold:


Operating expenses


128


190


318


513


831


Depreciation and amortization


62


4


66


3


69


Gross margin


$

110


$

50


$

160


$

107


$

267


Gross margin %


36.7

%


20.5

%


29.4

%


17.2

%


22.9

%

Gross margin before D&A


$

172


$

54


$

226


$

110


$

336


Gross margin before D&A %


57.3

%


22.1

%


41.5

%


17.7

%


28.8

%

% of total Gross margin before D&A


51.2

%


16.1

%


67.3

%


32.7

%


Six months ended June 30, 2024


($ millions, except percentages)


EI


AMS


Recurring
Product Lines


ES


Total


Revenue


$

370


$

248


$

618


$

634


$

1,252


Cost of goods sold:


Operating expenses


213


192


405


555


960


Depreciation and amortization


60


5


65


4


69


Gross margin


$

97


$

51


$

148


$

75


$

223


Gross margin %


26.2

%


20.6

%


23.9

%


11.8

%


17.8

%

Gross margin before D&A


$

157


$

56


$

213


$

79


$

292


Gross margin before D&A %


42.4

%


22.6

%


34.5

%


12.5

%


23.3

%

% of total Gross margin before D&A


53.8

%


19.2

%


72.9

%


27.1

%


1Recurring gross margin as a percentage of total gross margins for the first half of 2024 was impacted by lower gross margin in the ES product line, resulting from project delays and increased costs recognized on an international ES project.


img109187306_3.jpg M-14Q2 2025 Report 2025


Free Cash Flow and Dividend Payout Ratio

The Company defines free cash flow ("FCF") as cash provided by (used in) operating activities, less total capital expenditures (growth and maintenance) for EI assets - operating leases and PP&E, mandatory debt repayments, and lease payments, while proceeds on disposals of EI assets - operating leases and PP&E are added back. FCF may not be comparable to similar measures presented by other companies as it does not have a standardized meaning under IFRS. Management uses this non-IFRS measure to assess the level of free cash generated to fund other non-operating activities. These activities could include dividend payments, share repurchases, and non-mandatory debt repayments. FCF is also used in calculating the dividend payout ratio.

The Company defines dividend payout ratio as dividends divided by free cash flow. The dividend payout ratio is a non-IFRS measure and may not be comparable to similar measures presented by other companies as it does not have a standardized meaning under IFRS. Dividend payout ratio is used to assess the proportion of free cash flow being returned to shareholders.

Reconciliation of FCF to the most directly comparable IFRS measure, cash provided by operating activities:


Three months ended June 30,


Six months ended June 30,


($ millions, except percentages)


2025


2024


2025


2024


Cash provided by operating activities before changes in working capital and other1


$

89


$

63


$

151


$

81


Net change in working capital and other


(93

)


(51

)


(59

)


32


Cash (used in) provided by operating activities2


$

(4

)


$

12


$

92


$

113


Less:


Capital expenditures - Maintenance and PP&E


(11

)


(9

)


(19

)


(18

)

Capital expenditures - Growth


(23

)


(1

)


(29

)


(9

)

Mandatory debt repayments


-


-


-


(10

)

Lease payments


(5

)


(6

)


(11

)


(10

)

Add:


Proceeds on disposals of PP&E and EI assets - operating leases


4


-


13


2


Free cash flow


$

(39

)


$

(4

)


$

46


$

68


Dividends paid


4


3


10


5


Dividend payout ratio


-


-


21.7

%


7.4

%

1Enerflex also refers to cash provided by operating activities before changes in working capital and other as “Funds from Operations” or “FFO”.

2Enerflex also refers to cash provided by operating activities as “Cashflow from Operations” or “CFO”

Bank-Adjusted Net Debt to EBITDA Ratio

Enerflex defines bank-adjusted net debt to EBITDA as borrowings under the Revolving Credit Facility (“RCF”) and Notes less cash and cash equivalents, divided by EBITDA for the trailing 12-months, as defined by the Company’s lenders. In assessing the Company's compliance with financial covenants related to its debt, certain adjustments are made to EBITDA to determine Enerflex's bank-adjusted net debt to EBITDA ratio. These adjustments, and Enerflex's bank-adjusted net debt to EBITDA ratio, are calculated in accordance with, and derived from, the Company's financing agreements.


img109187306_4.jpg

M-15 img109187306_2.jpg


ROCE

ROCE is a measure used to analyze operating performance and efficiency of the Company’s capital allocation process. The ratio is calculated by taking TTM EBIT divided by capital employed. Capital employed is average debt and Shareholders’ equity less average cash for the trailing four quarters.


Six months ended June 30,


($ millions, except percentages)


2025


2024


Trailing 12-month EBIT


$

279


$

31


Average capital employed


Average net debt1


$

620


$

809


Average shareholders’ equity1


1,077


1,062


Average capital employed


$

1,697


$

1,871


ROCE


16.4

%


1.7

%


1Based on a trailing four-quarter average.

Liquidity

The Company expects that cash flows from operations in 2025, together with cash and cash equivalents on hand and currently available credit facilities, will be more than sufficient to fund its requirements for investments in working capital and capital assets.

($ millions)


June 30, 2025


Cash and cash equivalents


 $


71


RCF


800


Less: Drawings on the RCF


(154

)


Less: Letters of Credit1


(87

)


559


Available liquidity


 $


630


1Represents letters of credit that the Company has funded with the RCF. Additional letters of credit of $29 million are funded from the $70 million LC Facility. Refer to Note 7 “Long-Term Debt” of the Financial Statements for further details.

Covenant Compliance

As at June 30, 2025, the Company met the covenant requirements of its funded debt, comprised of the secured RCF and Notes, reflecting strong performance and cash flow generation, and Enerflex’s focus of repaying debt and lowering finance costs.

The following table sets forth a summary of the covenant requirements and the Company’s performance:


For the six months ended June 30,


2025


2024


Requirement


Performance


Performance

Senior secured net funded debt to EBITDA ratio1 – Maximum


2.5x


0.2

x


0.5x

Bank-adjusted net debt to EBITDA ratio2 – Maximum


4.0x


1.3

x


2.2x

Interest coverage ratio3 – Minimum


2.5x


5.4

x


3.9x


1Senior secured net funded debt to EBITDA is defined as borrowings under the RCF less cash and cash equivalents, divided by trailing 12-month EBITDA as defined by the Company’s lenders.

2Refer to the "Bank-Adjusted Net Debt to EBITDA Ratio" section of this MD&A.

3Interest coverage ratio is calculated by dividing the trailing 12-month EBITDA, as defined by the Company’s lenders, by interest expense over the same timeframe.


img109187306_3.jpg M-16Q2 2025 Report 2025


Credit Rating

Enerflex’s credit ratings affect the cost and ability to access the capital markets, and it is the Company’s objective to maintain high quality credit ratings. As at August 6, 2025, S&P Global Ratings ("S&P"), Moody’s Investors Service, Inc. ("Moody’s"), and Fitch Ratings, Inc. ("Fitch") assigned the following credit ratings to Enerflex and the Notes:

S&P

Moody’s

Fitch

Corporate Credit Rating

BB

(stable outlook)

Ba3

(positive outlook)

BB-

(positive outlook)

Notes

BB+

(stable outlook)

B1

(positive outlook)

BB

(positive outlook)


Summarized Statements of Cash Flow


Three months ended June 30,


Six months ended June 30,


($ millions)


2025


2024


2025


2024


Cash and cash equivalents, beginning of period


$

75


$

110


$

92


$

95


Cash provided by (used in):


Operating activities


(4

)


12


92


113


Investing activities


(10

)


(17

)


(36

)


(24

)

Financing activities


10


23


(76

)


(55

)

Effect of exchange rate changes on cash and cash equivalents denominated in foreign currencies


-


(2

)


(1

)


(3

)

Cash and cash equivalents, end of period


$

71


$

126


$

71


$

126


Operating Activities

Cash used in operating activities was $4 million during the three months ended June 30, 2025, compared to cash provided by operating activities of $12 million in the same period in 2024. The change was driven by a build of working capital from a strategic investment in inventories, primarily offset by higher net earnings during the second quarter of 2025. Cash provided by operating activities of $92 million during the six months ended June 30, 2025, decreased by $21 million from the same period in 2024, also attributable to the build of working capital.

Investing Activities

Cash used in investing activities for the three months ended June 30, 2025, was lower when compared to the same period in 2024, attributable to recovery of net working capital for investing activities and proceeds from short term investments and disposal of EI assets, partially offset by the increased capital expenditures in the second quarter of 2025. Cash used in investing activities for the six months ended June 30, 2025 was higher when compared to the same period in 2024, attributable to increased capital expenditures, partially offset by the sale of EI assets during the first half of 2025.

Financing Activities

During the three months ended June 30, 2025, cash provided by financing activities was lower when compared to the same period in 2024, primarily due to repurchase of the Company's own shares through the NCIB during the three months ended June 30, 2025. Cash used in financing activities for the six months ended June 30, 2025 was higher when compared to the same period in 2024, due to the net payment on the RCF, increased returns to shareholders through an increased dividend, and repurchase of shares through the NCIB during the first half of 2025.


img109187306_4.jpg

M-17 img109187306_2.jpg


Capital Expenditures and Expenditures for Finance Leases

Enerflex distinguishes CAPEX invested in EI assets - operating leases as either maintenance or growth. Maintenance expenditures are necessary costs to continue utilizing existing EI assets - operating leases, while growth expenditures are intended to expand the Company’s EI assets - operating leases. The Company may also incur costs related to the construction of EI assets determined to be finance leases. These costs are accounted for as work-in-progress related to finance leases, and once the project is completed and enters service, it is reclassified to cost of goods sold.

CAPEX and expenditures for finance leases are shown in the table below:


Three months ended June 30,


Six months ended June 30,


($ millions)


2025


2024


2025


2024


Maintenance and PP&E


$

11


$

9


$

19


$

18


Growth


23


1


29


9


Total CAPEX


34


10


48


27


Expenditures for finance leases


37


2


56


3


Total CAPEX and expenditures for finance leases


$

71


$

12


$

104


$

30


Selling, General and Administrative Expenses

SG&A expenses comprise of costs incurred by the Company to support business operations that are not directly attributable to the production of goods or services.


Three months ended June 30,


Six months ended June 30,


($ millions)


2025


2024


2025


2024


Core SG&A1


$

52


$

62


$

106


$

120


Share-based compensation


3


2


-


8


Depreciation and amortization


6


11


12


23


Bad debt expense


-


-


-


2


Total SG&A


$

61


$

75


$

118


$

153


1 Core SG&A is primarily comprised of compensation, third-party services, and information technology expenses.

SG&A was $61 million for the three months ended June 30, 2025, a decrease of $14 million compared to the same period in 2024. The reduction was primarily driven by completion of integration and restructuring activities in 2024 that have resulted in cost reductions and improved operational efficiencies, and lower amortization of intangible assets in the current period. SG&A was $118 million for the six months ended June 30, 2025, a decrease of $35 million from the same period in 2024. The decrease reflects lower share-based compensation expense resulting from share price volatility, lower amortization of intangible assets, and sustained cost reductions and operational efficiencies, partially offset by executive transition costs incurred during the first half of 2025.

Income Taxes

The Company reported income tax expense of $14 million and $33 million for the three and six months ended June 30, 2025, compared to $27 million and $22 million for the same periods in 2024. The change is primarily attributable to the effect of foreign exchange rates on the tax basis of non-monetary assets, partially offset by earnings taxed in foreign jurisdictions.


img109187306_3.jpg M-18Q2 2025 Report 2025


Financial Position

The following table outlines significant changes in the consolidated statements of financial position as at June 30, 2025, compared to December 31, 2024:


($ millions)


Increase
(Decrease)


Explanation

Current assets


107


Increase in current assets is primarily due to advancement of ES projects which resulted in increased accounts receivables and unbilled revenue, strategic investment in inventories, and progression of the EI expansion project in EH increasing the inventories - work-in-progress related to EI assets - finance leases receivable, partially offset by lower cash and cash equivalents and prepayments.

EI assets - operating leases


(18)


Decrease in EI assets - operating lease is primarily due to depreciation and sale of certain EI assets in LATAM segment, partially offset by capital expenditures.

EI assets - finance leases receivable


(15)


Decrease in EI assets - finance leases receivable is due to principal payments received.

Other assets


16


Increase in other assets is primarily due to unrealized gains recognized on the redemption options associated with the Notes.

Current liabilities


53


Increase in current liabilities is largely attributable to increased deferred revenue in NAM, driven by timing of collections on ES projects, and increased AP and accrued liabilities to support the elevated operational activity of the ES business.

Long-term debt


(29)


Long-term debt has decreased due to net repayment of the RCF partially offset by amortization of deferred transaction costs and the Notes discount.

Total shareholders' equity


78


Total shareholders' equity increased primarily due to net earnings for the first half of 2025, partially offset by repurchase of the Company's own shares through the NCIB in the second quarter of 2025.


Quarterly Summary


($ millions, except per share amounts)

Q2 2025


Q1 2025


Q4 2024


Q3 2024


Q2 2024


Q1 2024


Q4 2023


Q3 2023


ES backlog

$

1,227


$

1,206


$

1,280


$

1,271


$

1,251


$

1,266


$

1,134


$

1,158


ES bookings


365


205


301


349


331


420


265


394


EI contract backlog


1,462


1,497


1,545


1,601


1,604


1,639


1,700


1,881


Revenue


615


552


561


601


614


638


574


580


GM


139


128


140


141


136


87


119


110


GM before D&A


175


161


174


176


173


119


158


150


SG&A


61


57


92


82


75


78


74


75


EBIT


92


66


47


74


55


3


(51

)


24


EBITDA


134


105


92


122


103


47


-


77


Adjusted EBITDA


130


113


121


120


122


69


91


90


Net earnings (loss)


60


24


15


30


5


(18

)


(95

)


4


Earnings (loss) per share – basic


0.49


0.19


0.12


0.24


0.04


(0.15

)


(0.77

)


0.03


Earnings (loss) per share – diluted


0.49


0.19


0.12


0.24


0.04


(0.15

)


(0.77

)


0.03


FFO1


89


62


74


63


63


18


46


44


CFO2


(4

)


96


113


98


12


101


158


51


Free cash flow


(39

)


85


76


78


(4

)


72


139


21


Cash dividends declared per share (CAD $)


0.0375


0.0375


0.0375


0.0250


0.0250


0.0250


0.0250


0.0250


CAPEX – Maintenance & PP&E


11


8


21


14


9


9


13


10


CAPEX – Growth


23


6


11


2


1


8


4


10


1 FFO or “Funds from Operations” is also referred to by Enerflex as “Cash provided by operating activities before changes in working capital and other”.

2 CFO or “Cashflow from Operations” is also referred to by Enerflex as “Cash provided by (used in) operating activities”.


img109187306_4.jpg

M-19 img109187306_2.jpg


Capital Resources

On July 31, 2025, Enerflex had 122,247,228 common shares outstanding. Enerflex has not established a formal dividend policy, and the Board anticipates setting the quarterly dividends based on the availability of cash flow, anticipated market conditions, and the general needs of the business. Subsequent to the second quarter of 2025, the Board declared a quarterly dividend of CAD $0.0375 per share.

At June 30, 2025, the Company had drawings of $154 million against the RCF (December 31, 2024 – $191 million). The weighted average interest rate on the RCF at June 30, 2025, was 6.0% (December 31, 2024 – 7.4%).

The composition of the borrowings on the Notes and RCF were as follows:


Maturity Date


June 30, 2025


December 31, 2024


Notes


October 15, 2027


$

563


$

563


Drawings on the RCF


October 13, 2026


154


191


717


754


Deferred transaction costs and Notes discount


(38

)


(46

)

Long-term debt


$

679


$

708


Non-current portion of long-term debt


679


708


Long-term debt


$

679


$

708


At June 30, 2025, without considering renewal at similar terms, the USD equivalent principal payments due over the next five years are $717 million, and nil thereafter.

Subsequent to June 30, 2025, Enerflex entered into an agreement to extend the maturity date of its RCF by three years to July 11, 2028 and the availability remained unchanged at $800 million.


img109187306_3.jpg M-20Q2 2025 Report 2025


Legal Proceedings

The Company or certain of its subsidiaries are involved in or subject to, in the normal course of business, lawsuits, claims and other legal proceedings that seek, among other things, compensation for alleged personal injury, breach of contract, property damage or other losses, punitive damages, civil penalties, or injunctive or declaratory relief. Some lawsuits, claims and legal proceedings involve acquired or disposed assets with respect to which a third party, the Company, or its subsidiary retains liability or indemnifies the other party for conditions that existed prior to the transaction. In accordance with applicable accounting guidance, Enerflex and its subsidiaries accrue reserves for outstanding lawsuits, claims and proceedings when it is probable that a liability has been incurred and the liability can be reasonably estimated. The Company does not currently expect that any of the outstanding lawsuits, claims or legal proceedings will have a material adverse effect on Enerflex, including its consolidated financial position, results of operations or cash flows. Although Enerflex’s expectations and estimates are based on information known about the legal matters and its experience in contesting, litigating and settling similar matters, the results of any outstanding lawsuits, claims and other legal proceedings are inherently uncertain, and there can be no assurance that monetary damages, fines, penalties or injunctive relief resulting from adverse judgments or settlements in some or all of these outstanding lawsuits, claims or legal proceedings will not have a material adverse effect on Enerflex, including its consolidated financial position, results of operations or cash flows. The Company will reassess the probability and estimability of contingent losses as new information becomes available in these proceedings or otherwise.

As previously disclosed, in response to a fatal attack at an adjacent site in the second quarter of 2024, Enerflex declared Force Majeure on the EH project, suspended activity at the project site, and demobilized its personnel. Enerflex subsequently received notice from its customer purporting to terminate the project contract and commencing arbitration proceedings against Enerflex alleging breach of the project contract. Pursuant to the rules for arbitration agreed between Enerflex and its customer, the content of the proceedings is confidential and not otherwise publicly available. In Q4 2024, Enerflex delivered notice to the customer terminating the project contract, citing contractual rights relating to the continuing Force Majeure situation and circumstances that made it impossible for Enerflex to fulfill its obligations. Enerflex has brought a counterclaim against the customer to recover amounts owing to Enerflex following Enerflex’s termination of the project contract. As at June 30, 2025, the carrying value of the remaining assets associated with the project on the Company’s consolidated statement of financial position was $161 million. Notwithstanding its termination of the project contract, Enerflex maintains a $31 million Letter of Credit in support of its obligation under the project contract. Enerflex would view any drawing of the financial security in the prevailing circumstances as improper and would be considered as an additional amount owed by the customer.

In Q2 2025, the customer filed its Statement of Case in the arbitration alleging claims against Enerflex. Enerflex disputes these allegations and asserts that it acted in accordance with the project contract. Given the preliminary stage of the proceedings and the inherent uncertainty of arbitration, the final resolution of the arbitration is unknown and there can be no assurance that the outcome will not have a material adverse effect on Enerflex, including its consolidated financial position, results of operations or cash flows. Enerflex intends to vigorously defend itself against the customer’s claims while pursuing its own counterclaims against the customer as part of the arbitration.

Seasonality of Operations

The energy sector in Canada and in some parts of the U.S. has a distinct seasonal trend in activity levels which results from well-site access and drilling pattern adjustments to take advantage of weather conditions. Generally, the Company has experienced higher revenue in the fourth quarter of each year related to these seasonal trends. Revenue is also impacted by both the Company’s and its customer’s capital investment decisions. The LATAM and EH segments are not significantly impacted by seasonal variations, while certain parts of the U.S. can be impacted by seasonal trends depending on customer activity, demand, and location.


img109187306_4.jpg

M-21 img109187306_2.jpg


Variations from these trends usually occur when hydrocarbon energy fundamentals are either improving or deteriorating.

Internal Control Over Financial Reporting and Disclosure Controls and Procedures

Management is responsible for the information disclosed in this MD&A and the accompanying Financial Statements, and has in place appropriate information systems, procedures, and controls to ensure that information used internally by Management and disclosed externally is materially complete and reliable. In addition, the Company’s Audit Committee, on behalf of the Board, provides an oversight role with respect to all public financial disclosures made by the Company, and has reviewed and the Board has approved, this MD&A and the Financial Statements. The Audit Committee is also responsible for determining that Management fulfills its responsibilities in the financial control of operations, including Internal Control Over Financial Reporting (“ICFR”) and Disclosure Controls and Procedures (“DC&P”).

Management is responsible for establishing and maintaining adequate ICFR and DC&P. ICFR is a framework designed to provide reasonable assurance regarding the reliability and preparation of the unaudited interim condensed consolidated financial statements for external reporting in accordance with IFRS.

DC&P refer to controls and other procedures designed to ensure that information required to be disclosed in Enerflex’s financial reports is recorded, processed, summarized and reported to the Company’s Management, including its Chief Executive Officer and Chief Financial Officer, as appropriate, to allow timely decisions regarding required disclosure.

Together, the ICFR and DC&P frameworks provide internal control over financial reporting and disclosure. Management recognizes that any system of controls and procedures, no matter how well designed and operated, can provide only reasonable assurance of achieving the desired control objectives. Due to the inherent limitations of control systems, not all misstatements may be detected. For example, there may be faulty judgments in decision-making or breakdowns can occur because of a simple error or mistake. Additionally, controls can be circumvented by the acts of individuals, by collusion of two or more people, or by Management override of the control. Controls and procedures can only provide reasonable, not absolute, assurance that the desired control objectives have been met.

Under the supervision, and with the participation, of Enerflex’s Management, including the Chief Executive Officer (Interim) and Chief Financial Officer (Interim), the Company conducted an evaluation of the effectiveness of its ICFR and DC&P as of June 30, 2025, the end of the period covered by this MD&A. In conducting this evaluation, Management used the criteria described in Internal Control—Integrated Framework (2013) issued by the Committee of Sponsoring Organizations of the Treadway Commission (the “COSO 2013 Framework”).

Based on the Company’s evaluation, Management concluded that its ICFR and DC&P were effective as of June 30, 2025.

Changes in Internal Control Over Financial Reporting:

Management regularly reviews its system of ICFR and makes changes to the Company’s processes and systems to improve controls and increase efficiency. There have been no significant additional changes in the design of the Company’s ICFR during the three and six months ended June 30, 2025, that would materially affect, or is reasonably likely to materially affect, the Company’s ICFR.


img109187306_3.jpg M-22Q2 2025 Report 2025


Subsequent Events

Subsequent to June 30, 2025, Enerflex declared a quarterly dividend of CAD $0.0375 per share, payable on September 2, 2025 to shareholders of record on August 18, 2025. The Board will continue to evaluate dividend payments on a quarterly basis, based on availability of cash flow, anticipated market conditions, and the general needs of the business.

Forward-Looking Statements

This MD&A contains “forward-looking information” within the meaning of applicable Canadian securities laws and “forward-looking statements” (and together with “forward-looking information”, “FLI”) within the meaning of the safe harbor provisions of the US Private Securities Litigation Reform Act of 1995. These statements relate to Management expectations about future events, results of operations, and the future performance (both financial and operational) and business prospects of Enerflex. All statements other than statements of historical fact are FLI. The use of any of the words "anticipate", "future", "plan", "contemplate", "continue", "estimate", "expect", "intend", "propose", "might", "may", "will", "shall", "project", "should", "could", "would", "believe", "predict", "forecast", "pursue", "potential", "objective", "capable", and similar expressions, are intended to identify FLI. In particular, this MD&A includes (without limitation) FLI pertaining to:

disclosures under the heading “Outlook” including:
o
Enerflex’s ability to deliver on its near-term priorities, including (1) enhancing the profitability of its core operations; (2) leveraging the Company’s leading position in core operating countries to capitalize on expected increases in natural gas and produced water volumes; and (3) maximizing free cash flow to further strengthen Enerflex’s financial position, provide direct shareholder returns, and invest in selective customer supported growth opportunities, and the time required in connection therewith, if at all;
o
the highly contracted EI product line and the recurring nature of AMS will, together, account for approximately 65% of Enerflex’s gross margin before depreciation and amortization during 2025;
o
customer contracts within Enerflex’s EI product line will generate approximately $1.5 billion of revenue over their remaining terms;
o
ES gross margins are expected to align more closely with historical averages while ES revenue will remain steady in the near term;
o
supply of natural gas and associated liquids and produced water volumes are anticipated to grow, especially within Enerflex’s North American footprint, supporting an attractive medium-term outlook for each of Enerflex’s product lines;
o
total capital expenditures in 2025 will be approximately $120 million, including approximately $60 million allocated to growth opportunities and $60 million for maintenance and PP&E expenditures;
o
continued strength in the market fundamentals for U.S. contract compression, underpinned by expected increases in natural gas production in the Permian Basin and continued capital discipline from industry participants;
o
considerations to further reduce debt which will strengthen Enerflex’s balance sheet and lower net financing costs and that doing so will position the Company to respond to evolving market conditions and capitalize on opportunities to optimize its debt stack;
the Company’s backlog and the ability to secure future bookings;
the ability of the Company to capitalize on opportunities should they proceed, if at all;


img109187306_4.jpg

M-23 img109187306_2.jpg


expectations that expansion of an EI project that was commissioned in the EH region early in the third quarter of 2025 will result in a reduction of ES backlog by approximately $116 million;
expectations that cash flows from operations in 2025, together with cash and cash equivalents on hand and currently available credit facilities, will be sufficient to fund Enerflex’s requirements for investments in working capital and capital assets;
using free cash generated to fund other non-operating activities including dividend payments, share repurchases, and non-mandatory debt repayments, if at all;
the ability of the Company to continue to meet its covenant requirements of its funded debt, including the secured RCF and Notes;
the potential for the Company to incur costs related to the construction of EI assets determined to be finance leases;
that the Board will set the Company’s quarterly dividends based on the availability of cash flow, anticipated market conditions, and the general needs of the business and that this will support expectations regarding the ability of the Company to continue to pay a quarterly dividend;
expectations that potential liabilities that may arise in connection with outstanding lawsuits, claims, or legal proceedings will not have a material adverse effect on Enerflex, including its consolidated financial position, results of operations or cash flows; and
the impact of seasonal trends on the business of the Company.

This FLI is based on assumptions, estimates, and analysis made by Enerflex and its perception of trends, current conditions, and expected developments, as well as other factors that are believed by Enerflex to be reasonable and relevant in the circumstances. All FLI in this MD&A is subject to important risks, uncertainties, and assumptions, which are difficult to predict and which may affect Enerflex's operations, including, without limitation:

the ability of the Company to navigate evolving market conditions and to adjust its business as needed to support long-term resilience and performance in response to increased near-term risks and uncertainties, including the impact of tariffs and commodity price volatility;
industry conditions including supply and demand fundamentals for crude oil and natural gas;
natural gas and associated liquids and produced water volumes across Enerflex’s global footprint will increase in line with expectations;
the impact of economic conditions including commodity price volatility;
market conditions, customer activity, and industry fundamentals will support stable demand across Enerflex’s product lines and geographic regions throughout 2025;
the high level of contractual commitments within the EI product line and the predictable, recurring revenue from AMS will continue;
existing customer contracts within the EI product line will remain in effect and with no material cancellations or renegotiations over their remaining terms;
the execution of projects within the ES product line will proceed as scheduled and the conversion to revenue will proceed without significant delays or cancellations;
no significant unforeseen cost overruns or project delays;
market conditions continuing to support the NCIB within the anticipated timeframe;
supply chain interruptions leading to delays in receiving materials and parts to produce equipment and/or the impact of tariffs and/or retaliatory tariffs on the supply chain;
interest rates and foreign exchange rates;
new environmental, taxation, and other laws and regulations;


img109187306_3.jpg M-24Q2 2025 Report 2025


continued capital spending discipline from market participants;
the fulfillment by our customer partners of the terms of their contracts;
the ability to continue to build and improve on proven manufacturing capabilities and innovate into new product lines and new and emerging markets;
increased competition across all business lines;
sufficiency of funds to support capital investments required to grow the business;
availability of qualified personnel or management and difficulties in retaining qualified personnel;
political unrest; and
other factors, many of which are beyond the control of Enerflex.

Readers are cautioned that the foregoing list of assumptions and risk factors should not be construed as exhaustive. While Enerflex believes that there is a reasonable basis for the FLI included in this MD&A, as a result of such known and unknown risks, uncertainties, and other factors, actual results, performance, or achievements could differ and such differences could be material from those expressed in, or implied by, these statements. The FLI included in this MD&A should not be unduly relied upon as a number of factors could cause actual results to differ materially from the results discussed in these forward-looking statements, including but not limited to: the ability to maintain desirable financial ratios; the ability to access various sources of debt and equity capital, generally, and on acceptable terms, if at all; the ability to utilize tax losses in the future; the ability to maintain relationships with partners and to successfully manage and operate the business; risks associated with technology and equipment, including potential cyberattacks; the occurrence of unexpected events such as pandemics, war, terrorist threats, and the instability resulting therefrom; risks associated with existing and potential future lawsuits, shareholder proposals, and regulatory actions; and those factors referred to under the heading "Risk Factors" in Enerflex's AIF for the year ended December 31, 2024 and Enerflex’s Annual Report dated February 26, 2025, as well as other filings with Canadian securities regulators and the SEC, copies of which are available under the electronic profile of the Company on SEDAR+ and EDGAR at www.sedarplus.ca and www.sec.gov/edgar, respectively.

This MD&A contains information that may constitute future-oriented financial information or financial outlook information ("FOFI") about Enerflex and its prospective financial performance, financial position, or cash flows, all of which is subject to the same assumptions, risk factors, limitations, and qualifications as set forth above. Except as otherwise stated herein, the FOFI included in this MD&A was made and approved by Management and the Board as of the date hereof. Readers are cautioned that the assumptions used in the preparation of such information, although considered reasonable at the time of preparation, may prove to be imprecise or inaccurate and, as such, undue reliance should not be placed on FOFI. The Company’s actual results, performance and achievements could differ materially from those expressed in, or implied by, FOFI. The inclusion of FOFI in this MD&A is to provide readers with a more complete perspective on the Company’s future operations and Management's current expectations regarding the Company’s future performance. Readers are cautioned that such information may not be appropriate for other purposes.

The FLI and FOFI contained herein is expressly qualified in its entirety by the above cautionary statement. The FLI and FOFI included in this MD&A are made as of the date of this MD&A and, other than as required by law, the Company disclaims any intention or obligation to update or revise any FLI or FOFI, whether as a result of new information, future events or otherwise.


img109187306_4.jpg

M-25 img109187306_2.jpg