Pay vs Performance Disclosure - USD ($)
|
5 Months Ended |
7 Months Ended |
12 Months Ended |
May 25, 2025 |
Jan. 02, 2025 |
May 25, 2025 |
May 26, 2024 |
May 28, 2023 |
May 29, 2022 |
May 30, 2021 |
| Pay vs Performance Disclosure |
|
|
|
|
|
|
|
| Pay vs Performance Disclosure, Table |
|
|
| | | | | | | | | | | | | | | | | | | | | | | | | | | | | | | | | | Summary Comp. Table for Current PEO(2) | Summary Comp. Table Total for Former PEO(2) | Comp. Actually Paid to Current CEO(3) | Comp. Actually Paid to Former PEO(3) | Average Summary Compensation Table Total for Non-PEO NEOs(2) | Average Compensation Actually Paid to Non-PEO NEOs(3) | Value of Initial Fixed $100 Investment Based on:(4) | GAAP Net Income ($mil.) | | Year(1) | Lamb Weston Total Shareholder Return | Peer Group Total Shareholder Return(5) |
Adjusted EBITDA ($mil.)(6) | | FY2025 | $ | 2,688,616 | | $ | 5,919,862 | | $ | (1,974,061) | | $ | (10,590,201) | | $ | 1,976,646 | | $ | (826,328) | | $ | 91 | | $ | 113 | | $ | 357 | | $ | 1,221 | | | FY2024 | | $ | 7,037,026 | | | $ | (5,774,697) | | $ | 2,739,197 | | $ | 1,046,363 | | $ | 157 | | $ | 124 | | $ | 726 | | $ | 1,417 | | | FY2023 | | $ | 20,352,276 | | | $ | 40,007,566 | | $ | 5,456,807 | | $ | 9,221,443 | | $ | 190 | | $ | 137 | | $ | 1,009 | | $ | 1,249 | | | FY2022 | | $ | 7,858,113 | | | $ | 4,612,617 | | $ | 1,984,243 | | $ | 1,404,350 | | $ | 116 | | $ | 124 | | $ | 201 | | $ | 742 | | | FY2021 | | $ | 6,407,381 | | | $ | 10,872,178 | | $ | 1,901,071 | | $ | 2,841,274 | | $ | 139 | | $ | 119 | | $ | 357 | | $ | 748 | |
|
|
|
|
|
| Company Selected Measure Name |
|
|
Adjusted EBITDA
|
|
|
|
|
| Named Executive Officers, Footnote |
|
|
Michael J. Smith (current PEO) was appointed as the PEO effective January 3, 2025. Thomas P. Werner (former PEO) served as the PEO in fiscal 2025 through January 2, 2025 and served as the PEO for the entirety of fiscal 2024, 2023, 2022, and 2021. Our Non-PEO NEOs for the applicable fiscal years were as follows: •FY2025: Bernadette M. Madarieta, Marc J.P.H. Schroeder, Sylvia J. Wilks, Eryk J. Spytek and Sharon L. Miller •FY2024: Bernadette M. Madarieta, Michael J. Smith, Sukshma A. Rajagopalan and Marc J.P.H. Schroeder •FY2023: Bernadette M. Madarieta, Michael J. Smith, Sharon L. Miller and Steven J. Younes •FY2022: Bernadette M. Madarieta, Michael J. Smith, Sharon L. Miller, Eryk J. Spytek and Robert M. McNutt
|
|
|
|
|
| Peer Group Issuers, Footnote |
|
|
“Peer Group” represents the S&P 500 Packaged Foods Index, which is used by the Company for purposes of compliance with Item 201(e) of Regulation S-K.
|
|
|
|
|
| Adjustment To PEO Compensation, Footnote |
|
|
| | | | | | | | | | | | | | | | | | | Fiscal Year 2025 | | Current PEO
(Mr. Smith) | | Former PEO
(Mr. Werner) | | Average Non-PEO NEOs | | Summary Compensation Table Total | $ | 2,688,616 | | | $ | 5,919,862 | | | $ | 1,976,646 | | Minus Change in Pension Value Reported in SCT for the Fiscal Year | — | | | 2,437 | | | — | | Plus Pension Value Service Cost for the Fiscal Year | — | | | — | | | — | | Minus Stock Award Value & Option Award Value Reported in SCT for the Fiscal Year | 1,764,006 | | | 4,939,381 | | | 1,188,958 | | Plus Year End Fair Value of Equity Awards Granted During the Covered Year that Remain Outstanding and Unvested as of Last Day of the Fiscal Year | 1,446,483 | | | 4,050,204 | | | 978,365 | | Plus Year over Year Change in Fair Value as of the Last Day of the Fiscal Year of Outstanding and Unvested Equity Awards Granted in Prior Fiscal Years | (1,348,209) | | | (4,235,041) | | | (762,231) | | Plus Fair Value as of Vesting Date of Equity Awards Granted and Vested in the Fiscal Year | — | | | — | | | — | | | Plus Year over Year Change in Fair Value as of the Vesting Date of Equity Awards Granted in Prior Fiscal Years that Vested During the Fiscal Year | (2,996,945) | | | (11,383,408) | | | (1,830,151) | | Minus Fair Value at the End of the Prior Year of Equity Awards that Failed to Meet Vesting Conditions in the Fiscal Year | — | | | — | | | — | | Plus Value of Dividends or other Earnings Paid on Stock or Option Awards Not Otherwise Reflected in Fair Value or Total Compensation for the Fiscal Year | — | | | — | | | — | | | Compensation Actually Paid | $ | (1,974,061) | | | $ | (10,590,201) | | | $ | (826,328) | |
In the table above, the unvested equity values are computed in accordance with the methodology used for financial reporting purposes, and for unvested awards subject to performance-based vesting conditions, based on the probable outcome of such performance-based vesting conditions as of the last day of the year.
|
|
|
|
|
| Non-PEO NEO Average Total Compensation Amount |
|
|
$ 1,976,646
|
$ 2,739,197
|
$ 5,456,807
|
$ 1,984,243
|
$ 1,901,071
|
| Non-PEO NEO Average Compensation Actually Paid Amount |
|
|
$ (826,328)
|
1,046,363
|
9,221,443
|
1,404,350
|
2,841,274
|
| Adjustment to Non-PEO NEO Compensation Footnote |
|
|
| | | | | | | | | | | | | | | | | | | Fiscal Year 2025 | | Current PEO
(Mr. Smith) | | Former PEO
(Mr. Werner) | | Average Non-PEO NEOs | | Summary Compensation Table Total | $ | 2,688,616 | | | $ | 5,919,862 | | | $ | 1,976,646 | | Minus Change in Pension Value Reported in SCT for the Fiscal Year | — | | | 2,437 | | | — | | Plus Pension Value Service Cost for the Fiscal Year | — | | | — | | | — | | Minus Stock Award Value & Option Award Value Reported in SCT for the Fiscal Year | 1,764,006 | | | 4,939,381 | | | 1,188,958 | | Plus Year End Fair Value of Equity Awards Granted During the Covered Year that Remain Outstanding and Unvested as of Last Day of the Fiscal Year | 1,446,483 | | | 4,050,204 | | | 978,365 | | Plus Year over Year Change in Fair Value as of the Last Day of the Fiscal Year of Outstanding and Unvested Equity Awards Granted in Prior Fiscal Years | (1,348,209) | | | (4,235,041) | | | (762,231) | | Plus Fair Value as of Vesting Date of Equity Awards Granted and Vested in the Fiscal Year | — | | | — | | | — | | | Plus Year over Year Change in Fair Value as of the Vesting Date of Equity Awards Granted in Prior Fiscal Years that Vested During the Fiscal Year | (2,996,945) | | | (11,383,408) | | | (1,830,151) | | Minus Fair Value at the End of the Prior Year of Equity Awards that Failed to Meet Vesting Conditions in the Fiscal Year | — | | | — | | | — | | Plus Value of Dividends or other Earnings Paid on Stock or Option Awards Not Otherwise Reflected in Fair Value or Total Compensation for the Fiscal Year | — | | | — | | | — | | | Compensation Actually Paid | $ | (1,974,061) | | | $ | (10,590,201) | | | $ | (826,328) | |
In the table above, the unvested equity values are computed in accordance with the methodology used for financial reporting purposes, and for unvested awards subject to performance-based vesting conditions, based on the probable outcome of such performance-based vesting conditions as of the last day of the year.
|
|
|
|
|
| Compensation Actually Paid vs. Total Shareholder Return |
|
|
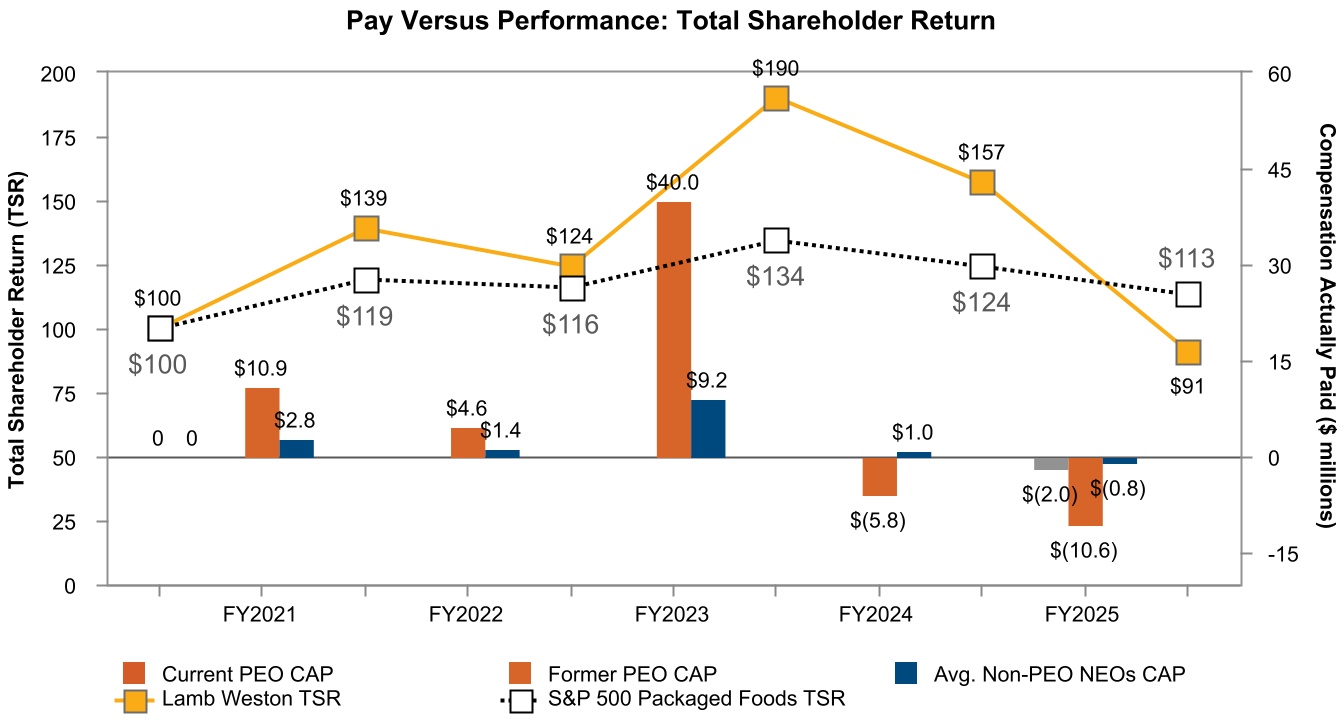
The graph below illustrates the relationship between our TSR and the Peer Group TSR over the four fiscal years ending May 25, 2025 based on a hypothetical investment of $100 on May 31, 2020, as well as the relationship between TSR and CAP for the PEO and Non-PEO NEOs.
|
|
|
|
|
| Compensation Actually Paid vs. Net Income |
|
|
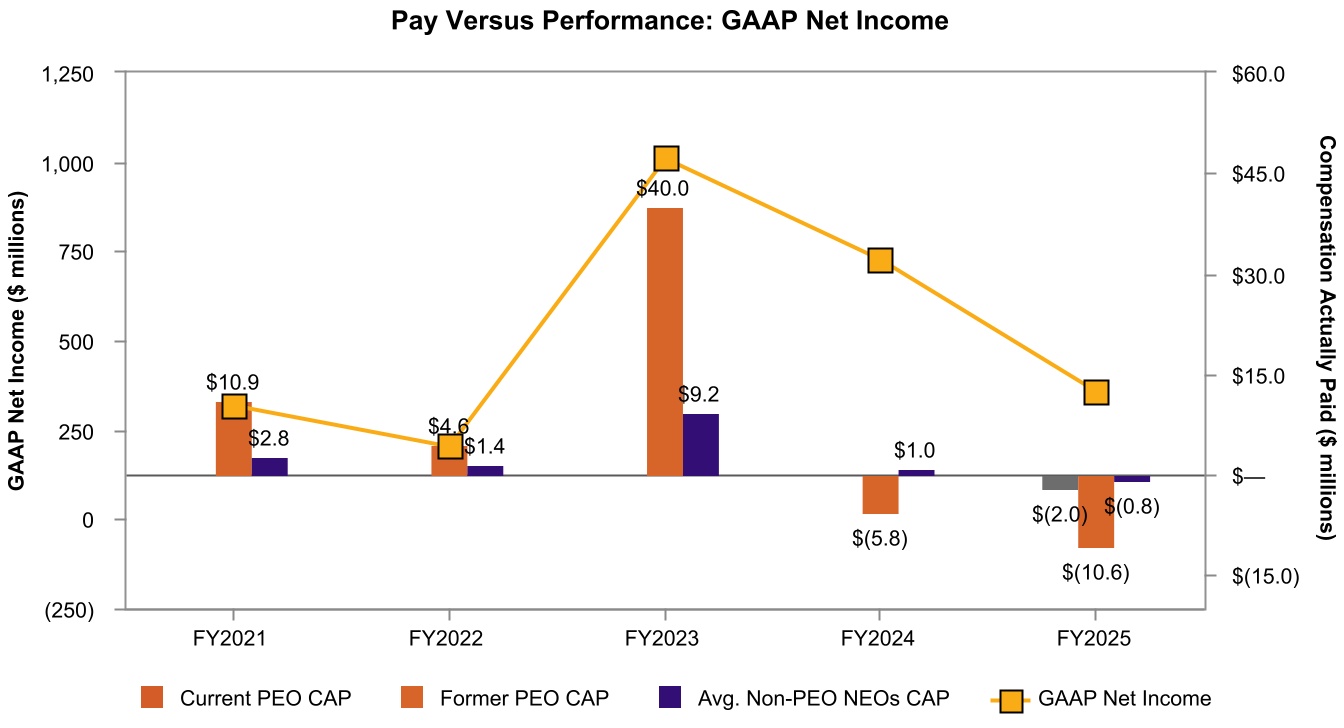
The graph below reflects the relationship between the PEO CAP and Average Non-PEO NEOs CAP and our GAAP Net Income.
|
|
|
|
|
| Compensation Actually Paid vs. Company Selected Measure |
|
|
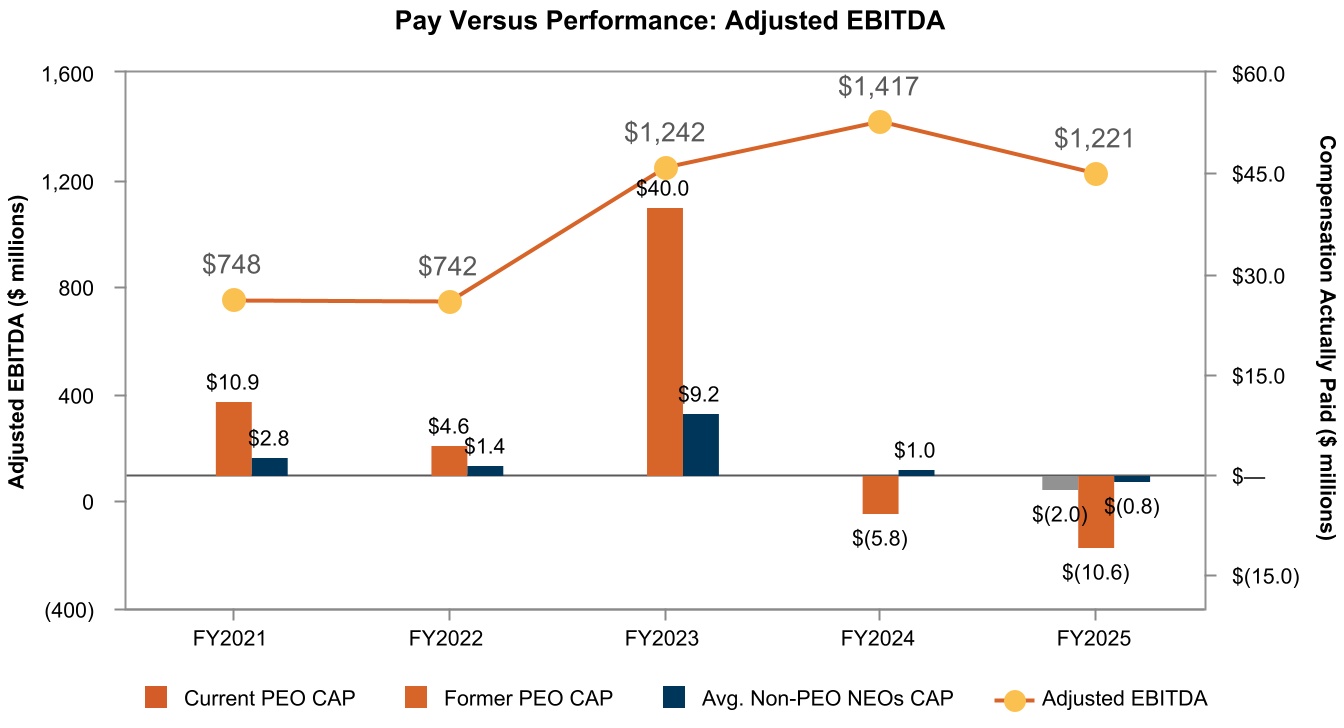
The graph below reflects the relationship between the PEO CAP and Average Non-PEO NEOs CAP and the Company’s Adjusted EBITDA.
|
|
|
|
|
| Total Shareholder Return Vs Peer Group |
|
|
The graph below illustrates the relationship between our TSR and the Peer Group TSR over the four fiscal years ending May 25, 2025 based on a hypothetical investment of $100 on May 31, 2020, as well as the relationship between TSR and CAP for the PEO and Non-PEO NEOs.
|
|
|
|
|
| Total Shareholder Return Amount |
|
|
$ 91
|
157
|
190
|
116
|
139
|
| Peer Group Total Shareholder Return Amount |
|
|
113
|
124
|
137
|
124
|
119
|
| Net Income (Loss) |
|
|
$ 357,000,000
|
$ 726,000,000
|
$ 1,009,000,000
|
$ 201,000,000
|
$ 357,000,000
|
| Company Selected Measure Amount |
|
|
1,221,000,000
|
1,417,000,000
|
1,249,000,000
|
742,000,000
|
748,000,000
|
| PEO Name |
Michael J. Smith
|
Thomas P. Werner
|
|
Thomas P. Werner
|
Thomas P. Werner
|
Thomas P. Werner
|
Thomas P. Werner
|
| Additional 402(v) Disclosure |
|
|
Amounts reported in these columns represent (i) the total compensation reported in the Summary Compensation Table (“SCT”) for the applicable year in the case of our current PEO, Mr. Smith and our former PEO, Mr. Werner, and (ii) the average of the total compensation reported in the SCT for the applicable year for our Non-PEO NEOs reported for the applicable year.Amounts reported in these columns represent compensation actually paid; adjustments were made to the amounts reported in the SCT for the applicable year. A reconciliation of the adjustments for our current PEO, Mr. Smith, our former PEO, Mr. Werner, and for the average of the Non-PEO NEOs is set forth in the following table, which describes the adjustments, each of which is prescribed by the SEC rules, to calculate the CAP Amounts from SCT amounts.Total Shareholder Return (TSR) is cumulative for the measurement periods beginning on May 31, 2020 and ending on each of our 2021, 2022, 2023, 2024, and 2025 fiscal year ends, respectively, calculated in accordance with Item 201(e) of Regulation S-K.Adjusted EBITDA is the company-selected measure. Values shown reflect Adjusted EBITDA as calculated for purposes of our executive compensation program for the applicable reporting fiscal year (a non-GAAP financial measure). See Appendix A in this Proxy Statement for a reconciliation from GAAP reported results. Total Shareholder Return (TSR) is cumulative for the measurement periods beginning on May 31, 2020 and ending on each of our 2021, 2022, 2023, 2024, and 2025 fiscal year ends, respectively, calculated in accordance with Item 201(e) of Regulation S-K.
|
|
|
|
|
| Measure:: 1 |
|
|
|
|
|
|
|
| Pay vs Performance Disclosure |
|
|
|
|
|
|
|
| Name |
|
|
Adjusted EBITDA
|
|
|
|
|
| Measure:: 2 |
|
|
|
|
|
|
|
| Pay vs Performance Disclosure |
|
|
|
|
|
|
|
| Name |
|
|
Net Sales
|
|
|
|
|
| Measure:: 3 |
|
|
|
|
|
|
|
| Pay vs Performance Disclosure |
|
|
|
|
|
|
|
| Name |
|
|
Adjusted Gross Margin
|
|
|
|
|
| Measure:: 4 |
|
|
|
|
|
|
|
| Pay vs Performance Disclosure |
|
|
|
|
|
|
|
| Name |
|
|
Relative Shareholder Return
|
|
|
|
|
| Measure:: 5 |
|
|
|
|
|
|
|
| Pay vs Performance Disclosure |
|
|
|
|
|
|
|
| Name |
|
|
Absolute Shareholder Return
|
|
|
|
|
| Mr. Smith [Member] |
|
|
|
|
|
|
|
| Pay vs Performance Disclosure |
|
|
|
|
|
|
|
| PEO Total Compensation Amount |
|
|
$ 2,688,616
|
|
|
|
|
| PEO Actually Paid Compensation Amount |
|
|
(1,974,061)
|
|
|
|
|
| Mr. Werner [Member] |
|
|
|
|
|
|
|
| Pay vs Performance Disclosure |
|
|
|
|
|
|
|
| PEO Total Compensation Amount |
|
|
5,919,862
|
$ 7,037,026
|
$ 20,352,276
|
$ 7,858,113
|
$ 6,407,381
|
| PEO Actually Paid Compensation Amount |
|
|
(10,590,201)
|
$ (5,774,697)
|
$ 40,007,566
|
$ 4,612,617
|
$ 10,872,178
|
| PEO | Mr. Smith [Member] | Aggregate Change in Present Value of Accumulated Benefit for All Pension Plans Reported in Summary Compensation Table |
|
|
|
|
|
|
|
| Pay vs Performance Disclosure |
|
|
|
|
|
|
|
| Adjustment to Compensation, Amount |
|
|
0
|
|
|
|
|
| PEO | Mr. Smith [Member] | Pension Adjustments Service Cost |
|
|
|
|
|
|
|
| Pay vs Performance Disclosure |
|
|
|
|
|
|
|
| Adjustment to Compensation, Amount |
|
|
0
|
|
|
|
|
| PEO | Mr. Smith [Member] | Aggregate Grant Date Fair Value of Equity Award Amounts Reported in Summary Compensation Table |
|
|
|
|
|
|
|
| Pay vs Performance Disclosure |
|
|
|
|
|
|
|
| Adjustment to Compensation, Amount |
|
|
(1,764,006)
|
|
|
|
|
| PEO | Mr. Smith [Member] | Year-end Fair Value of Equity Awards Granted in Covered Year that are Outstanding and Unvested |
|
|
|
|
|
|
|
| Pay vs Performance Disclosure |
|
|
|
|
|
|
|
| Adjustment to Compensation, Amount |
|
|
1,446,483
|
|
|
|
|
| PEO | Mr. Smith [Member] | Year-over-Year Change in Fair Value of Equity Awards Granted in Prior Years That are Outstanding and Unvested |
|
|
|
|
|
|
|
| Pay vs Performance Disclosure |
|
|
|
|
|
|
|
| Adjustment to Compensation, Amount |
|
|
(1,348,209)
|
|
|
|
|
| PEO | Mr. Smith [Member] | Vesting Date Fair Value of Equity Awards Granted and Vested in Covered Year |
|
|
|
|
|
|
|
| Pay vs Performance Disclosure |
|
|
|
|
|
|
|
| Adjustment to Compensation, Amount |
|
|
0
|
|
|
|
|
| PEO | Mr. Smith [Member] | Change in Fair Value as of Vesting Date of Prior Year Equity Awards Vested in Covered Year |
|
|
|
|
|
|
|
| Pay vs Performance Disclosure |
|
|
|
|
|
|
|
| Adjustment to Compensation, Amount |
|
|
(2,996,945)
|
|
|
|
|
| PEO | Mr. Smith [Member] | Prior Year End Fair Value of Equity Awards Granted in Any Prior Year that Fail to Meet Applicable Vesting Conditions During Covered Year |
|
|
|
|
|
|
|
| Pay vs Performance Disclosure |
|
|
|
|
|
|
|
| Adjustment to Compensation, Amount |
|
|
0
|
|
|
|
|
| PEO | Mr. Smith [Member] | Dividends or Other Earnings Paid on Equity Awards not Otherwise Reflected in Total Compensation for Covered Year |
|
|
|
|
|
|
|
| Pay vs Performance Disclosure |
|
|
|
|
|
|
|
| Adjustment to Compensation, Amount |
|
|
0
|
|
|
|
|
| PEO | Mr. Werner [Member] | Aggregate Change in Present Value of Accumulated Benefit for All Pension Plans Reported in Summary Compensation Table |
|
|
|
|
|
|
|
| Pay vs Performance Disclosure |
|
|
|
|
|
|
|
| Adjustment to Compensation, Amount |
|
|
(2,437)
|
|
|
|
|
| PEO | Mr. Werner [Member] | Pension Adjustments Service Cost |
|
|
|
|
|
|
|
| Pay vs Performance Disclosure |
|
|
|
|
|
|
|
| Adjustment to Compensation, Amount |
|
|
0
|
|
|
|
|
| PEO | Mr. Werner [Member] | Aggregate Grant Date Fair Value of Equity Award Amounts Reported in Summary Compensation Table |
|
|
|
|
|
|
|
| Pay vs Performance Disclosure |
|
|
|
|
|
|
|
| Adjustment to Compensation, Amount |
|
|
(4,939,381)
|
|
|
|
|
| PEO | Mr. Werner [Member] | Year-end Fair Value of Equity Awards Granted in Covered Year that are Outstanding and Unvested |
|
|
|
|
|
|
|
| Pay vs Performance Disclosure |
|
|
|
|
|
|
|
| Adjustment to Compensation, Amount |
|
|
4,050,204
|
|
|
|
|
| PEO | Mr. Werner [Member] | Year-over-Year Change in Fair Value of Equity Awards Granted in Prior Years That are Outstanding and Unvested |
|
|
|
|
|
|
|
| Pay vs Performance Disclosure |
|
|
|
|
|
|
|
| Adjustment to Compensation, Amount |
|
|
(4,235,041)
|
|
|
|
|
| PEO | Mr. Werner [Member] | Vesting Date Fair Value of Equity Awards Granted and Vested in Covered Year |
|
|
|
|
|
|
|
| Pay vs Performance Disclosure |
|
|
|
|
|
|
|
| Adjustment to Compensation, Amount |
|
|
0
|
|
|
|
|
| PEO | Mr. Werner [Member] | Change in Fair Value as of Vesting Date of Prior Year Equity Awards Vested in Covered Year |
|
|
|
|
|
|
|
| Pay vs Performance Disclosure |
|
|
|
|
|
|
|
| Adjustment to Compensation, Amount |
|
|
(11,383,408)
|
|
|
|
|
| PEO | Mr. Werner [Member] | Prior Year End Fair Value of Equity Awards Granted in Any Prior Year that Fail to Meet Applicable Vesting Conditions During Covered Year |
|
|
|
|
|
|
|
| Pay vs Performance Disclosure |
|
|
|
|
|
|
|
| Adjustment to Compensation, Amount |
|
|
0
|
|
|
|
|
| PEO | Mr. Werner [Member] | Dividends or Other Earnings Paid on Equity Awards not Otherwise Reflected in Total Compensation for Covered Year |
|
|
|
|
|
|
|
| Pay vs Performance Disclosure |
|
|
|
|
|
|
|
| Adjustment to Compensation, Amount |
|
|
0
|
|
|
|
|
| Non-PEO NEO | Aggregate Change in Present Value of Accumulated Benefit for All Pension Plans Reported in Summary Compensation Table |
|
|
|
|
|
|
|
| Pay vs Performance Disclosure |
|
|
|
|
|
|
|
| Adjustment to Compensation, Amount |
|
|
0
|
|
|
|
|
| Non-PEO NEO | Pension Adjustments Service Cost |
|
|
|
|
|
|
|
| Pay vs Performance Disclosure |
|
|
|
|
|
|
|
| Adjustment to Compensation, Amount |
|
|
0
|
|
|
|
|
| Non-PEO NEO | Aggregate Grant Date Fair Value of Equity Award Amounts Reported in Summary Compensation Table |
|
|
|
|
|
|
|
| Pay vs Performance Disclosure |
|
|
|
|
|
|
|
| Adjustment to Compensation, Amount |
|
|
(1,188,958)
|
|
|
|
|
| Non-PEO NEO | Year-end Fair Value of Equity Awards Granted in Covered Year that are Outstanding and Unvested |
|
|
|
|
|
|
|
| Pay vs Performance Disclosure |
|
|
|
|
|
|
|
| Adjustment to Compensation, Amount |
|
|
978,365
|
|
|
|
|
| Non-PEO NEO | Year-over-Year Change in Fair Value of Equity Awards Granted in Prior Years That are Outstanding and Unvested |
|
|
|
|
|
|
|
| Pay vs Performance Disclosure |
|
|
|
|
|
|
|
| Adjustment to Compensation, Amount |
|
|
(762,231)
|
|
|
|
|
| Non-PEO NEO | Vesting Date Fair Value of Equity Awards Granted and Vested in Covered Year |
|
|
|
|
|
|
|
| Pay vs Performance Disclosure |
|
|
|
|
|
|
|
| Adjustment to Compensation, Amount |
|
|
0
|
|
|
|
|
| Non-PEO NEO | Change in Fair Value as of Vesting Date of Prior Year Equity Awards Vested in Covered Year |
|
|
|
|
|
|
|
| Pay vs Performance Disclosure |
|
|
|
|
|
|
|
| Adjustment to Compensation, Amount |
|
|
(1,830,151)
|
|
|
|
|
| Non-PEO NEO | Prior Year End Fair Value of Equity Awards Granted in Any Prior Year that Fail to Meet Applicable Vesting Conditions During Covered Year |
|
|
|
|
|
|
|
| Pay vs Performance Disclosure |
|
|
|
|
|
|
|
| Adjustment to Compensation, Amount |
|
|
0
|
|
|
|
|
| Non-PEO NEO | Dividends or Other Earnings Paid on Equity Awards not Otherwise Reflected in Total Compensation for Covered Year |
|
|
|
|
|
|
|
| Pay vs Performance Disclosure |
|
|
|
|
|
|
|
| Adjustment to Compensation, Amount |
|
|
$ 0
|
|
|
|
|