What were the Fund costs for the past period?
(based on a hypothetical $10,000 investment)
|
Class
Name |
Costs
of a $10,000 investment |
Costs
paid as a percentage of a $10,000 investment |
|---|---|---|
|
REX
AI
Equity
Premium
Income
ETF |
$69¹ |
0.65%² |
| ¹ | Costs are for the period of June 3, 2024 to May 31, 2025. Costs for a full annual period would be higher. |
| ² | Annualized. |
How did the Fund perform?
• For the period of June 3, 2024 to May 31, 2025, the REX AI Equity Premium Income ETF (the “Fund”) returned 13.68%.• In comparison, the S&P 500 Index returned 13.38% for the same period.
What affected the Fund’s performance?
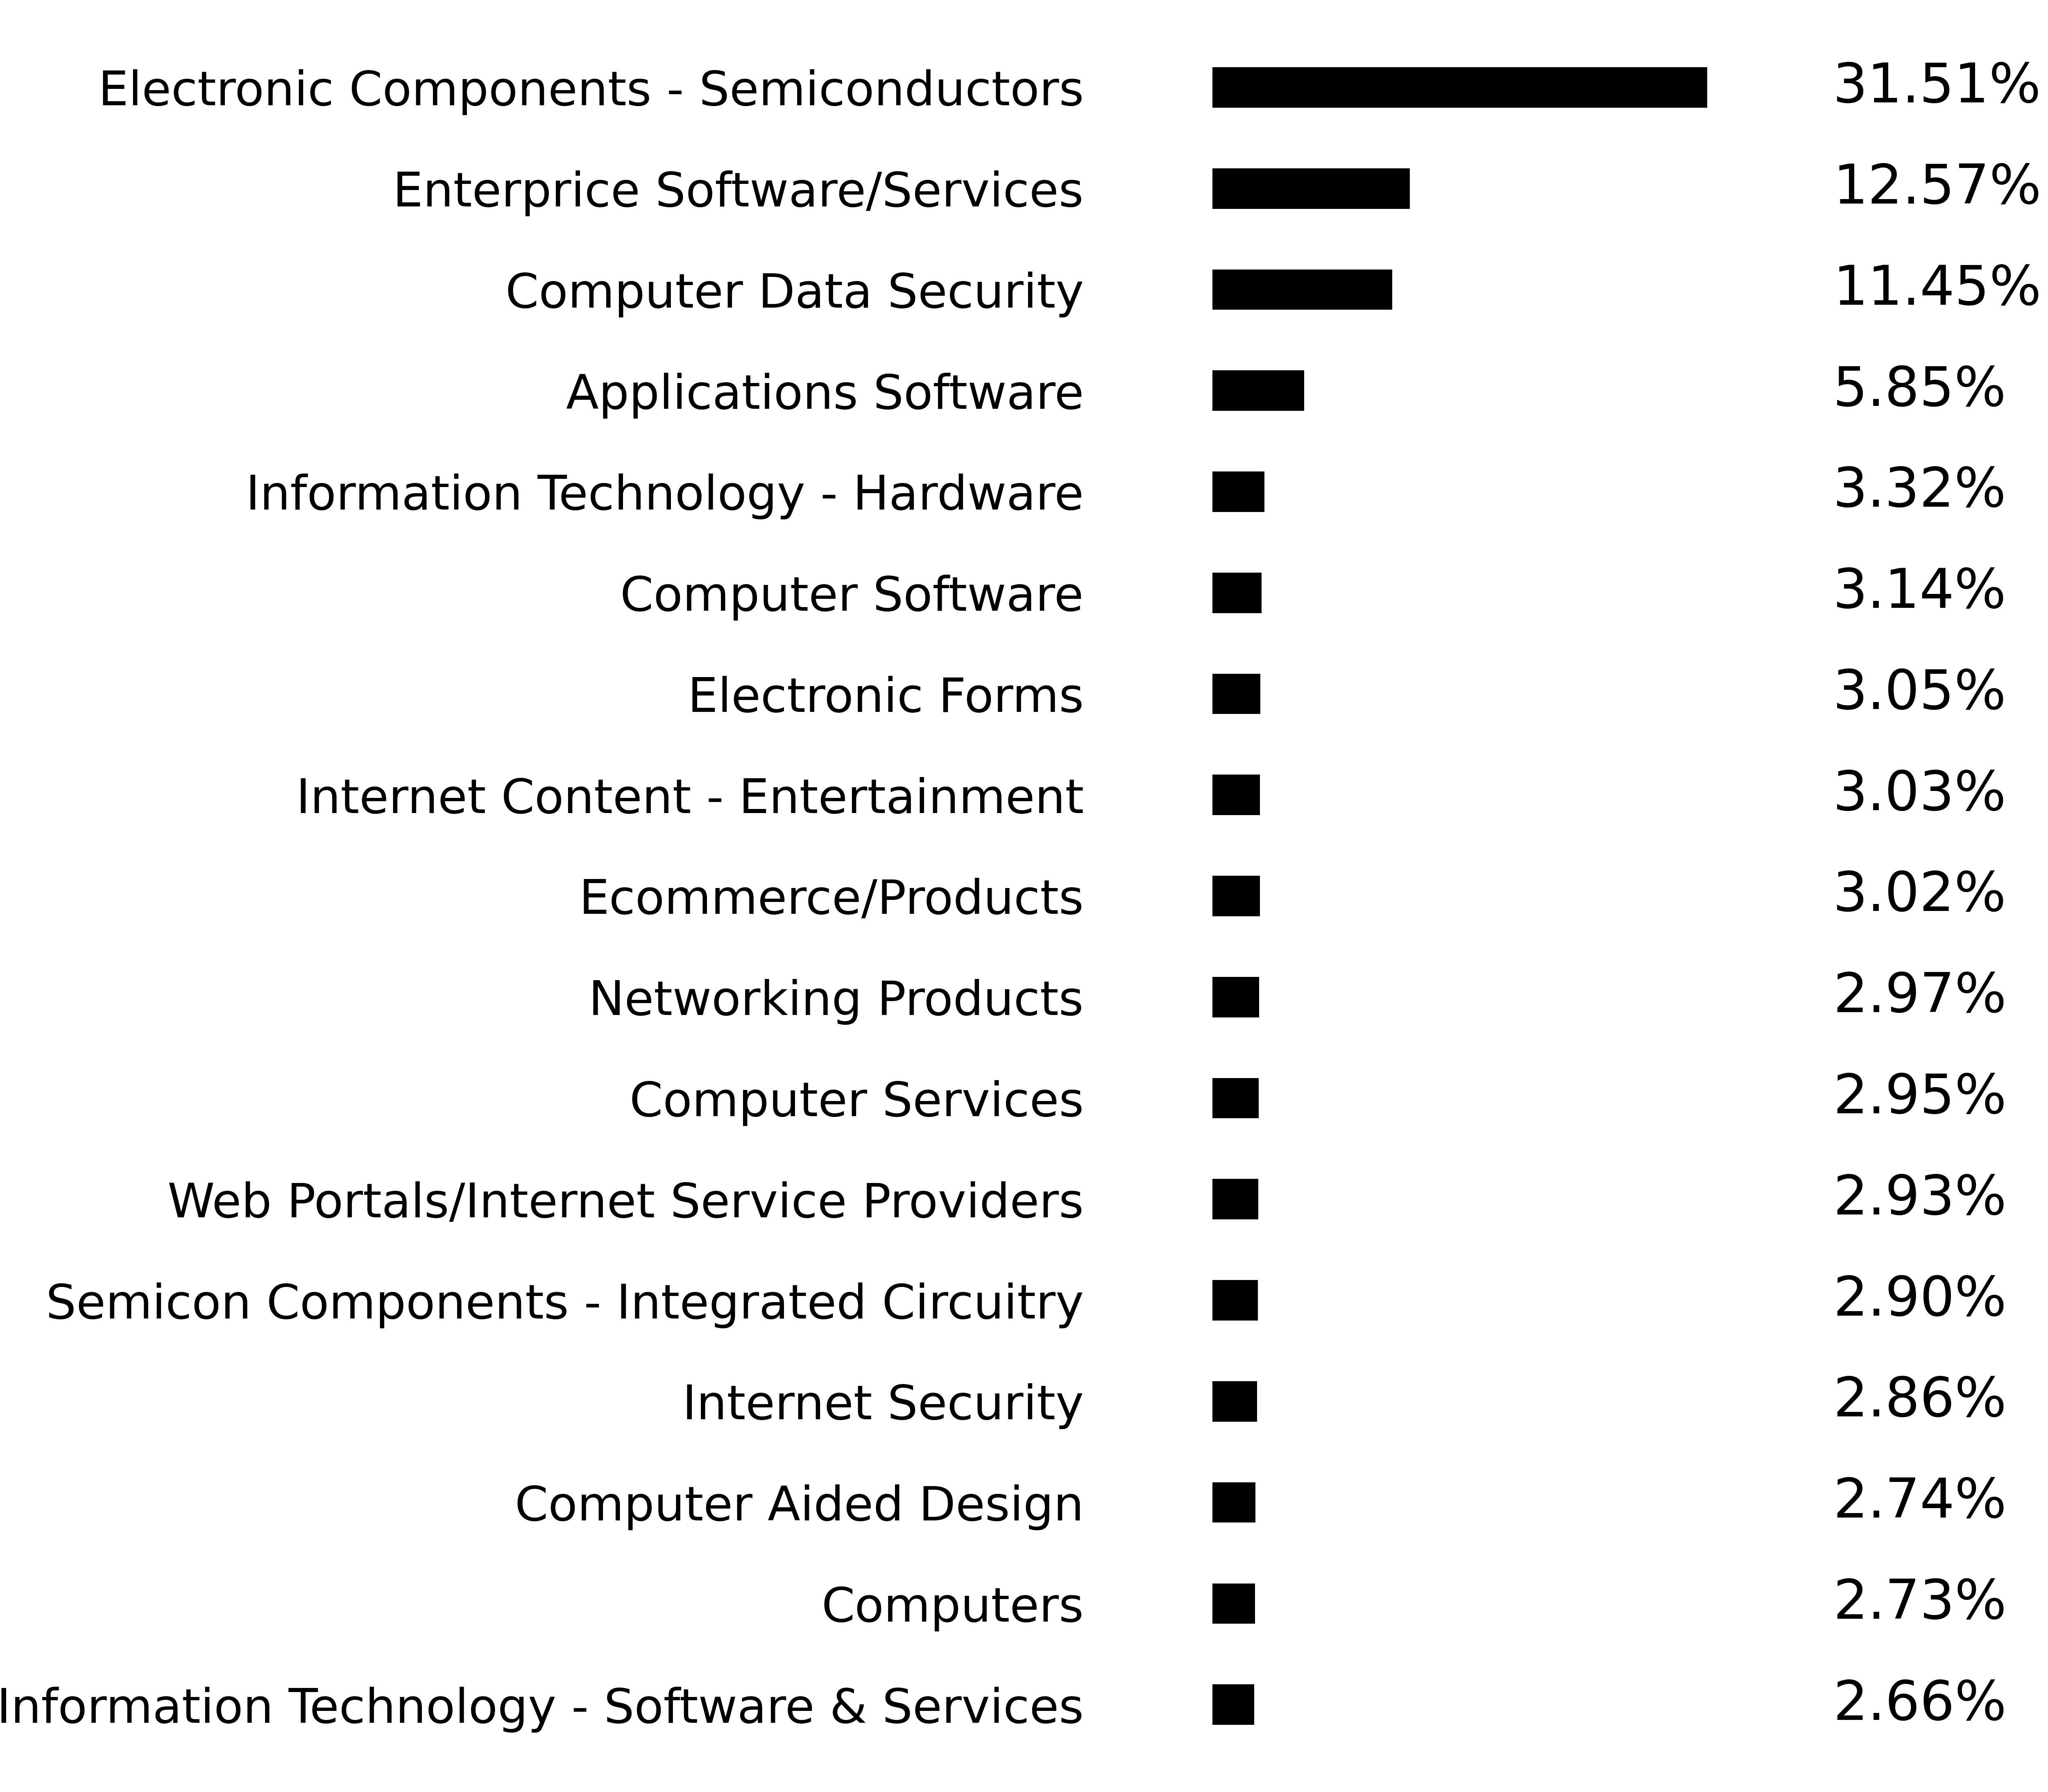
• Stocks in the S&P 500® Index generally rose during the period, particularly those of companies in the technology sector, which comprise a significant portion of the index.
• The Fund is actively managed and invests in leading companies involved in artificial intelligence and innovation. The Fund’s stock portfolio is selected from the BITA AI Leaders Select Index, an index tracking U.S.-listed companies at the forefront of AI technology, which returned 35.95% for the period.
• As of May 31, 2025, the Fund’s largest positions included NVIDIA Corp. (11.00% of the portfolio), Palantir Technologies (9.88%), and ARM Holdings (8.14%). This concentrated basket underscores that the Fund is essentially a tech-focused Fund, with a heavy tilt toward companies driving AI innovation.
• The Fund’s strategy of selling covered calls caused performance to depend not only on the price returns of the individual equity holdings, but also on the paths that the prices of the individual stocks took over time. In some cases, significant upside volatility during the period led to reduced participation in equity price gains for the Fund versus the S&P 500® Index.
Cumulative Performance
(based on a hypothetical $10,000 investment)
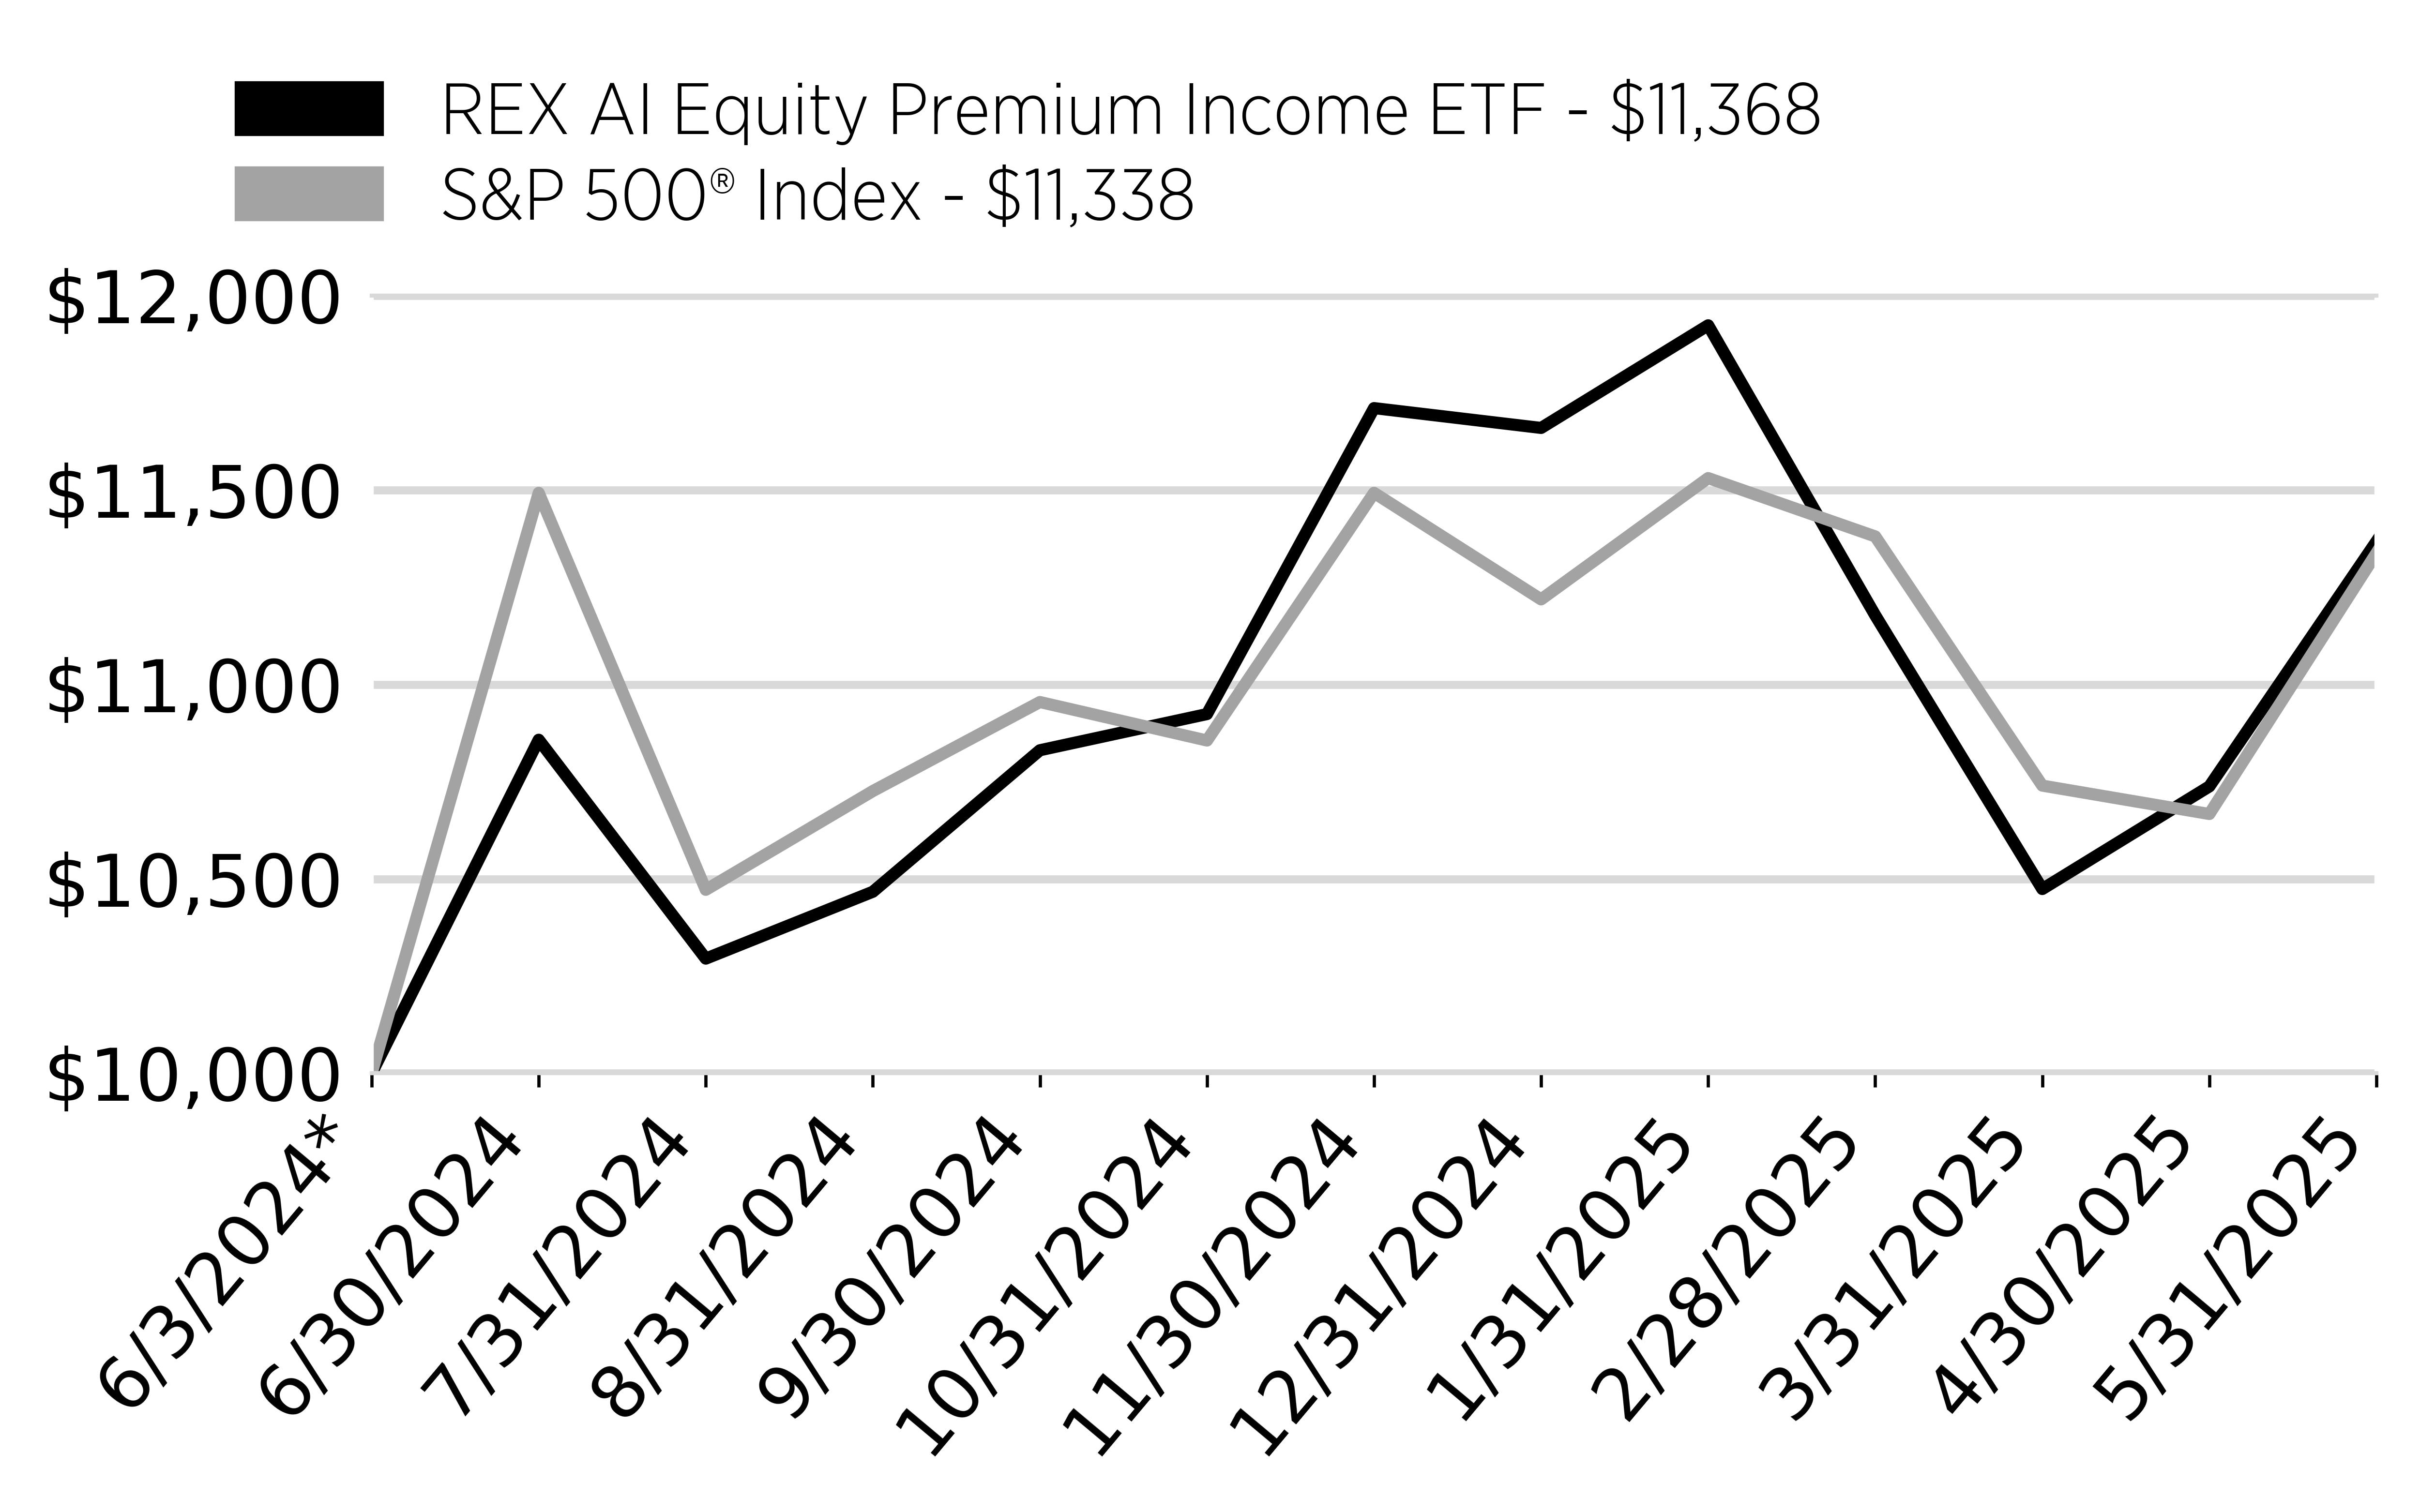
| * | Inception |
Annual Performance
|
|
Total
Return
Since
Inception |
|---|---|
|
REX
AI Equity Premium Income ETF |
13.68% |
|
S&P
500 Index |
13.38% |
The S&P 500 Index is a broad-based unmanaged index of 500 stocks, which is widely recognized as representative of the equity market in general.
Key Fund Statistics
(as of May 31, 2025)
|
Fund
Net Assets |
$295,290,247 |
|
Number
of Holdings |
104 |
|
Total
Advisory Fee Paid |
$943,722 |
|
Portfolio
Turnover Rate |
62.79% |
Sector Breakdown
|
Top
Ten Holdings |
|
|---|---|
|
Nvidia
Corp. |
|
|
CrowdStrike
Holdings, Inc. |
|
|
Palantir
Technologies Inc. |
|
|
Arm
Holdings plc |
|
|
Broadcom,
Inc. |
|
|
Super
Micro Computer, Inc. |
|
|
Micron
Technology, Inc. |
|
|
Datadog,
Inc. Class A |
|
|
Advanced
Micro Devices |
|
|
Adobe,
Inc. |
| [1] | Costs are for the period of June 3, 2024 to May 31, 2025. Costs for a full annual period would be higher. |
| [2] | Annualized. |