Shareholder Report
|
12 Months Ended |
|
May 31, 2025
USD ($)
Holding
|
|---|
| Shareholder Report [Line Items] |
|
| Document Type |
N-CSR
|
| Amendment Flag |
false
|
| Registrant Name |
COMMUNITY CAPITAL TRUST
|
| Entity Central Index Key |
0001078195
|
| Entity Investment Company Type |
N-1A
|
| Document Period End Date |
May 31, 2025
|
| C000005044 |
|
| Shareholder Report [Line Items] |
|
| Fund Name |
CCM Community Impact Bond Fund
|
| Class Name |
CRA Shares
|
| Trading Symbol |
CRAIX
|
| Annual or Semi-Annual Statement [Text Block] |
This annual shareholder report contains important information about CRA Shares of the CCM Community Impact Bond Fund (the "Fund") for the period from June 1, 2024 to May 31, 2025.
|
| Shareholder Report Annual or Semi-Annual |
Annual Shareholder Report
|
| Additional Information [Text Block] |
You can find additional information about the Fund at https://funddocs.filepoint.com/ccmcib/. You can also request this information by contacting us at 1-877-272-1977.
|
| Additional Information Phone Number |
1-877-272-1977
|
| Additional Information Website |
https://funddocs.filepoint.com/ccmcib/
|
| Expenses [Text Block] |
What were the Fund costs for the last year?(based on a hypothetical $10,000 investment) Fund Name | Costs of a $10,000 investment | Costs paid as a percentage of a $10,000 investment |
|---|
CCM Community Impact Bond Fund, CRA Shares | $89 | 0.87% |
|---|
|
| Expenses Paid, Amount |
$ 89
|
| Expense Ratio, Percent |
0.87%
|
| Factors Affecting Performance [Text Block] |
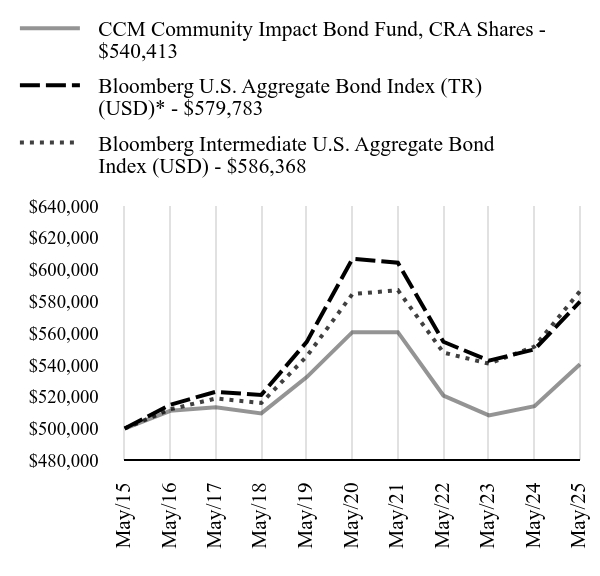
How did the Fund perform in the last year?During the fiscal year ended May 31, 2025, the CRA Share Class of the Fund returned 5.13%. The Fund’s benchmark, the Bloomberg U.S. Aggregate Bond Index (TR) (USD) (the "Primary Benchmark") returned 5.46%. The Fund’s secondary benchmark, the Bloomberg Intermediate U.S. Aggregate Bond Index (USD) returned 6.31% (the "Secondary Benchmark," and together with the Primary Benchmark, the "Benchmarks"). Real gross domestic product growth in the U.S. during the Fund’s fiscal year ended May 31, 2025, was above the Federal Open Market Committee’s long run expectations. Inflation levels in the U.S. were above the Federal Reserve’s 2% target during the fiscal year. Compared to the prior year, interest rates at the long end of the curve were higher while interest rates at the front end and middle part of the curve were lower. The decrease in U.S. Treasury rates positively impacted the return of the Fund’s Primary Benchmark. Additionally, returns generated by coupon payments and paydowns on securitized bonds added to the Primary Benchmark’s positive price return. The portfolio management team employs an active management strategy, meaning that the team makes specific investment decisions in seeking to provide a high level of current income consistent with the preservation of capital through investments that Community Capital Management, LLC believes will have a positive impact. As of May 31, 2025, the Fund had an overall duration of 4.44 years, which was shorter than that of its Primary Benchmark and in-line with its Secondary Benchmark. The Fund’s yield-to-worst was 5.11 percent, which was higher than both its Benchmarks. During the fiscal year ended May 31, 2025, the CRA Share Class underperformed the Fund’s Primary Benchmark. The Fund’s key rate duration positioning relative to its Primary Benchmark was a significant source of outperformance. This benefit was more than offset by the Fund’s underweight allocation to corporate bonds, an allocation to a subsector of Agency CMBS that underperformed during the year and fees. The CRA Share Class underperformed relative to its Secondary Benchmark, due to the previously mentioned factors related to sector allocation and fees and because of the Fund’s key rate duration positioning relative to its Secondary Benchmark. |
| Performance Past Does Not Indicate Future [Text] |
Past performance is not indicative of future performance.
|
| Line Graph [Table Text Block] |
| CCM Community Impact Bond Fund, CRA Shares - $540413 | Bloomberg U.S. Aggregate Bond Index (TR) (USD)* - $579783 | Bloomberg Intermediate U.S. Aggregate Bond Index (USD) - $586368 |
|---|
May/15 | $500000 | $500000 | $500000 |
|---|
May/16 | $511114 | $514974 | $512091 |
|---|
May/17 | $513379 | $523104 | $518887 |
|---|
May/18 | $509515 | $521144 | $516029 |
|---|
May/19 | $532350 | $554499 | $545411 |
|---|
May/20 | $560621 | $606708 | $584570 |
|---|
May/21 | $560574 | $604252 | $587003 |
|---|
May/22 | $520752 | $554570 | $547757 |
|---|
May/23 | $508220 | $542687 | $540788 |
|---|
May/24 | $514048 | $549772 | $551579 |
|---|
May/25 | $540413 | $579783 | $586368 |
|---|
|
| Average Annual Return [Table Text Block] |
Fund/Index Name | 1 Year | 5 Years | 10 Years |
|---|
CCM Community Impact Bond Fund, CRA Shares | 5.13% | -0.73% | 0.78% |
|---|
Bloomberg U.S. Aggregate Bond Index (TR) (USD)* | 5.46% | -0.90% | 1.49% |
|---|
Bloomberg Intermediate U.S. Aggregate Bond Index (USD) | 6.31% | 0.06% | 1.61% |
|---|
|
| No Deduction of Taxes [Text Block] |
The table and graph presented above do not reflect the deduction of taxes a shareholder would pay on Fund distributions or the redemption of Fund shares.
|
| AssetsNet |
$ 3,691,194,333
|
| Holdings Count | Holding |
2,483
|
| Advisory Fees Paid, Amount |
$ 10,815,514
|
| InvestmentCompanyPortfolioTurnover |
28.00%
|
| Additional Fund Statistics [Text Block] |
Key Fund Statistics as of May 31, 2025 | Total Net Assets | Number of Holdings | Total Advisory Fees Paid | Portfolio Turnover Rate |
|---|
| $3,691,194,333 | 2,483 | $10,815,514 | 28% |
|---|
|
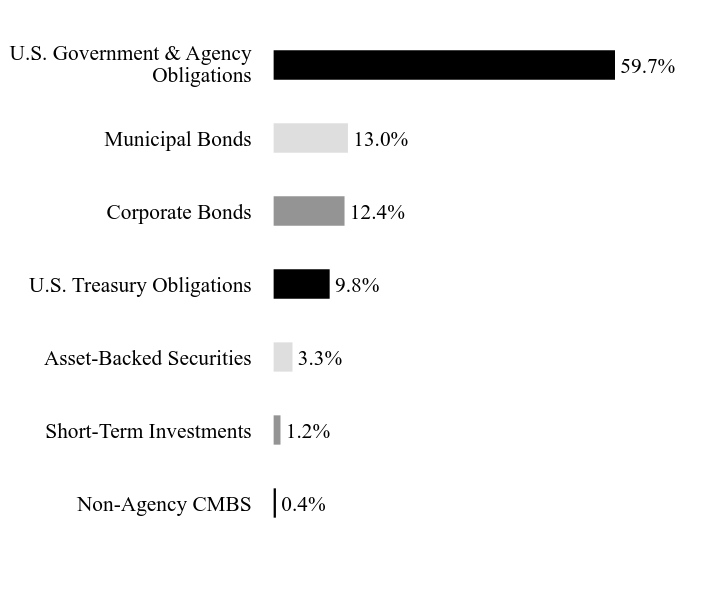
| Holdings [Text Block] |
Asset WeightingsFootnote Reference*Value | Value |
|---|
Non-Agency CMBS | 0.4% | Short-Term Investments | 1.2% | Asset-Backed Securities | 3.3% | U.S. Treasury Obligations | 9.8% | Corporate Bonds | 12.4% | Municipal Bonds | 13.0% | U.S. Government & Agency Obligations | 59.7% |
| Footnote | Description | Footnote* | Percentages are calculated based on total net assets. |
|
| Largest Holdings [Text Block] |
Holding Name | Coupon Rate | Maturity Date | Percentage of Total
Net AssetsFootnote Reference(A) |
|---|
U.S. Treasury Notes | 3.875%
| 04/30/30
| 2.2% | Comcast Corp. | 4.650%
| 02/15/33
| 2.2% | U.S. Treasury Notes | 4.625%
| 02/15/35
| 1.6% | U.S. Treasury Notes | 4.125%
| 11/15/27
| 1.4% | Bank of America Corp., SOFRRATE + 1.990% | 6.204%
| 11/10/28
| 1.3% | Prologis | 1.250%
| 10/15/30
| 1.2% | American Express | 4.050%
| 05/03/29
| 1.2% | Prologis | 4.625%
| 01/15/33
| 1.1% | Citibank, SOFRRATE + 0.712% | 4.876%
| 11/19/27
| 0.6% | FNMA | 5.000%
| 11/01/52
| 0.6% |
| Footnote | Description | Footnote(A) | Short-Term Investments are not shown in the top ten chart. |
|
| Material Fund Change [Text Block] |
There were no material changes during the reporting period. |
| Updated Prospectus Phone Number |
1-877-272-1977
|
| Updated Prospectus Web Address |
https://funddocs.filepoint.com/ccmcib/
|
| C000048038 |
|
| Shareholder Report [Line Items] |
|
| Fund Name |
CCM Community Impact Bond Fund
|
| Class Name |
Institutional Shares
|
| Trading Symbol |
CRANX
|
| Annual or Semi-Annual Statement [Text Block] |
This annual shareholder report contains important information about Institutional Shares of the CCM Community Impact Bond Fund (the "Fund") for the period from June 1, 2024 to May 31, 2025.
|
| Shareholder Report Annual or Semi-Annual |
Annual Shareholder Report
|
| Additional Information [Text Block] |
You can find additional information about the Fund at https://funddocs.filepoint.com/ccmcib/. You can also request this information by contacting us at 1-877-272-1977.
|
| Additional Information Phone Number |
1-877-272-1977
|
| Additional Information Website |
https://funddocs.filepoint.com/ccmcib/
|
| Expenses [Text Block] |
What were the Fund costs for the last year?(based on a hypothetical $10,000 investment) Fund Name | Costs of a $10,000 investment | Costs paid as a percentage of a $10,000 investment |
|---|
CCM Community Impact Bond Fund, Institutional Shares | $43 | 0.42% |
|---|
|
| Expenses Paid, Amount |
$ 43
|
| Expense Ratio, Percent |
0.42%
|
| Factors Affecting Performance [Text Block] |
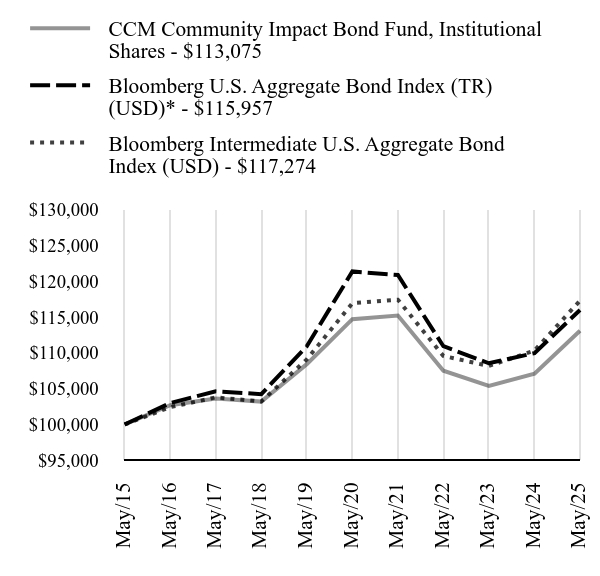
How did the Fund perform in the last year?During the fiscal year ended May 31, 2025, the Institutional Share Class of the Fund returned 5.61%. The Fund’s benchmark, the Bloomberg U.S. Aggregate Bond Index (TR) (USD) (the "Primary Benchmark") returned 5.46%. The Fund’s secondary benchmark, the Bloomberg Intermediate U.S. Aggregate Bond Index (USD) returned 6.31% (the "Secondary Benchmark," and together with the Primary Benchmark, the "Benchmarks"). Real gross domestic product growth in the U.S. during the Fund’s fiscal year ended May 31, 2025, was above the Federal Open Market Committee’s long run expectations. Inflation levels in the U.S. were above the Federal Reserve’s 2% target during the fiscal year. Compared to the prior year, interest rates at the long end of the curve were higher while interest rates at the front end and middle part of the curve were lower. The decrease in U.S. Treasury rates positively impacted the return of the Fund’s Primary Benchmark. Additionally, returns generated by coupon payments and paydowns on securitized bonds added to the Primary Benchmark’s positive price return. The portfolio management team employs an active management strategy, meaning that the team makes specific investment decisions in seeking to provide a high level of current income consistent with the preservation of capital through investments that Community Capital Management, LLC believes will have a positive impact. As of May 31, 2025, the Fund had an overall duration of 4.44 years, which was shorter than that of its Primary Benchmark and in-line with its Secondary Benchmark. The Fund’s yield-to-worst was 5.11 percent, which was higher than both its Benchmarks. During the fiscal year ended May 31, 2025, the Institutional Share Class outperformed the Fund’s Primary Benchmark. The outperformance was largely driven by Fund’s key rate duration positioning relative to its Primary Benchmark. This benefit was partially offset by the Fund’s underweight allocation to corporate bonds, an allocation to a subsector of Agency CMBS that underperformed during the year and fees. The Institutional Share Class underperformed relative to its Secondary Benchmark, due to the previously mentioned factors related to sector allocation and because of the Fund’s key rate duration positioning relative to its Secondary Benchmark. |
| Performance Past Does Not Indicate Future [Text] |
Past performance is not indicative of future performance.
|
| Line Graph [Table Text Block] |
| CCM Community Impact Bond Fund, Institutional Shares - $113075 | Bloomberg U.S. Aggregate Bond Index (TR) (USD)* - $115957 | Bloomberg Intermediate U.S. Aggregate Bond Index (USD) - $117274 |
|---|
May/15 | $100000 | $100000 | $100000 |
|---|
May/16 | $102686 | $102995 | $102418 |
|---|
May/17 | $103605 | $104621 | $103777 |
|---|
May/18 | $103192 | $104229 | $103206 |
|---|
May/19 | $108414 | $110900 | $109082 |
|---|
May/20 | $114692 | $121342 | $116914 |
|---|
May/21 | $115203 | $120850 | $117401 |
|---|
May/22 | $107497 | $110914 | $109551 |
|---|
May/23 | $105381 | $108537 | $108158 |
|---|
May/24 | $107074 | $109954 | $110316 |
|---|
May/25 | $113075 | $115957 | $117274 |
|---|
|
| Average Annual Return [Table Text Block] |
Fund/Index Name | 1 Year | 5 Years | 10 Years |
|---|
CCM Community Impact Bond Fund, Institutional Shares | 5.61% | -0.28% | 1.24% |
|---|
Bloomberg U.S. Aggregate Bond Index (TR) (USD)* | 5.46% | -0.90% | 1.49% |
|---|
Bloomberg Intermediate U.S. Aggregate Bond Index (USD) | 6.31% | 0.06% | 1.61% |
|---|
|
| No Deduction of Taxes [Text Block] |
The table and graph presented above do not reflect the deduction of taxes a shareholder would pay on Fund distributions or the redemption of Fund shares.
|
| AssetsNet |
$ 3,691,194,333
|
| Holdings Count | Holding |
2,483
|
| Advisory Fees Paid, Amount |
$ 10,815,514
|
| InvestmentCompanyPortfolioTurnover |
28.00%
|
| Additional Fund Statistics [Text Block] |
Key Fund Statistics as of May 31, 2025 | Total Net Assets | Number of Holdings | Total Advisory Fees Paid | Portfolio Turnover Rate |
|---|
| $3,691,194,333 | 2,483 | $10,815,514 | 28% |
|---|
|
| Holdings [Text Block] |
Asset WeightingsFootnote Reference*Value | Value |
|---|
Non-Agency CMBS | 0.4% | Short-Term Investments | 1.2% | Asset-Backed Securities | 3.3% | U.S. Treasury Obligations | 9.8% | Corporate Bonds | 12.4% | Municipal Bonds | 13.0% | U.S. Government & Agency Obligations | 59.7% |
| Footnote | Description | Footnote* | Percentages are calculated based on total net assets. |
|
| Largest Holdings [Text Block] |
Holding Name | Coupon Rate | Maturity Date | Percentage of Total
Net AssetsFootnote Reference(A) |
|---|
U.S. Treasury Notes | 3.875%
| 04/30/30
| 2.2% | Comcast Corp. | 4.650%
| 02/15/33
| 2.2% | U.S. Treasury Notes | 4.625%
| 02/15/35
| 1.6% | U.S. Treasury Notes | 4.125%
| 11/15/27
| 1.4% | Bank of America Corp., SOFRRATE + 1.990% | 6.204%
| 11/10/28
| 1.3% | Prologis | 1.250%
| 10/15/30
| 1.2% | American Express | 4.050%
| 05/03/29
| 1.2% | Prologis | 4.625%
| 01/15/33
| 1.1% | Citibank, SOFRRATE + 0.712% | 4.876%
| 11/19/27
| 0.6% | FNMA | 5.000%
| 11/01/52
| 0.6% |
| Footnote | Description | Footnote(A) | Short-Term Investments are not shown in the top ten chart. |
|
| Material Fund Change [Text Block] |
There were no material changes during the reporting period. |
| Updated Prospectus Phone Number |
1-877-272-1977
|
| Updated Prospectus Web Address |
https://funddocs.filepoint.com/ccmcib/
|
| C000048039 |
|
| Shareholder Report [Line Items] |
|
| Fund Name |
CCM Community Impact Bond Fund
|
| Class Name |
Retail Shares
|
| Trading Symbol |
CRATX
|
| Annual or Semi-Annual Statement [Text Block] |
This annual shareholder report contains important information about Retail Shares of the CCM Community Impact Bond Fund (the "Fund") for the period from June 1, 2024 to May 31, 2025.
|
| Shareholder Report Annual or Semi-Annual |
Annual Shareholder Report
|
| Additional Information [Text Block] |
You can find additional information about the Fund at https://funddocs.filepoint.com/ccmcib/. You can also request this information by contacting us at 1-877-272-1977.
|
| Additional Information Phone Number |
1-877-272-1977
|
| Additional Information Website |
https://funddocs.filepoint.com/ccmcib/
|
| Expenses [Text Block] |
What were the Fund costs for the last year?(based on a hypothetical $10,000 investment) Fund Name | Costs of a $10,000 investment | Costs paid as a percentage of a $10,000 investment |
|---|
CCM Community Impact Bond Fund, Retail Shares | $79 | 0.77% |
|---|
|
| Expenses Paid, Amount |
$ 79
|
| Expense Ratio, Percent |
0.77%
|
| Factors Affecting Performance [Text Block] |
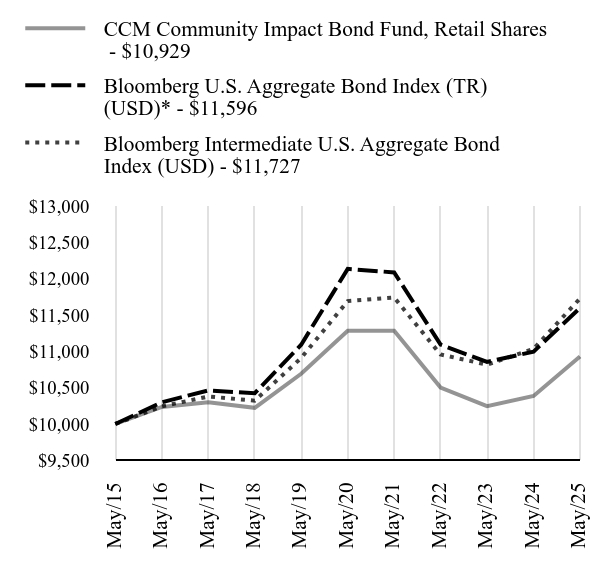
How did the Fund perform in the last year?During the fiscal year ended May 31, 2025, the Retail Share Class of the Fund returned 5.24%. The Fund’s benchmark, the Bloomberg U.S. Aggregate Bond Index (TR) (USD) returned 5.46% (the "Primary Benchmark"). The Fund’s secondary benchmark, the Bloomberg Intermediate U.S. Aggregate Bond Index (USD) returned 6.31% (the "Secondary Benchmark," and together with the Primary Benchmark, the "Benchmarks"). Real gross domestic product growth in the U.S. during the Fund’s fiscal year ended May 31, 2025, was above the Federal Open Market Committee’s long run expectations. Inflation levels in the U.S. were above the Federal Reserve’s 2% target during the fiscal year. Compared to the prior year, interest rates at the long end of the curve were higher while interest rates at the front end and middle part of the curve were lower. The decrease in U.S. Treasury rates positively impacted the return of the Fund’s Primary Benchmark. Additionally, returns generated by coupon payments and paydowns on securitized bonds added to the Primary Benchmark’s positive price return. The portfolio management team employs an active management strategy, meaning that the team makes specific investment decisions in seeking to provide a high level of current income consistent with the preservation of capital through investments that Community Capital Management, LLC believes will have a positive impact. As of May 31, 2025, the Fund had an overall duration of 4.44 years, which was shorter than that of its Primary Benchmark and in-line with its Secondary Benchmark. The Fund’s yield-to-worst was 5.11 percent, which was higher than both its Benchmarks. During the fiscal year ended May 31, 2025, the Retail Share Class underperformed the Fund’s Primary Benchmark. The Fund’s key rate duration positioning relative to its benchmark was a significant source of outperformance. This benefit was more than offset by the Fund’s underweight allocation to corporate bonds, an allocation to a subsector of Agency CMBS that underperformed during the year and fees. The Retail Share Class underperformed relative to its Secondary Benchmark, due to the previously mentioned factors related to sector allocation and fees and because of the Fund’s key rate duration positioning relative to its Secondary Benchmark. |
| Performance Past Does Not Indicate Future [Text] |
Past performance is not indicative of future performance.
|
| Line Graph [Table Text Block] |
| CCM Community Impact Bond Fund, Retail Shares - $10929 | Bloomberg U.S. Aggregate Bond Index (TR) (USD)* - $11596 | Bloomberg Intermediate U.S. Aggregate Bond Index (USD) - $11727 |
|---|
May/15 | $10000 | $10000 | $10000 |
|---|
May/16 | $10234 | $10299 | $10242 |
|---|
May/17 | $10299 | $10462 | $10378 |
|---|
May/18 | $10222 | $10423 | $10321 |
|---|
May/19 | $10691 | $11090 | $10908 |
|---|
May/20 | $11282 | $12134 | $11691 |
|---|
May/21 | $11282 | $12085 | $11740 |
|---|
May/22 | $10500 | $11091 | $10955 |
|---|
May/23 | $10246 | $10854 | $10816 |
|---|
May/24 | $10386 | $10995 | $11032 |
|---|
May/25 | $10929 | $11596 | $11727 |
|---|
|
| Average Annual Return [Table Text Block] |
Fund/Index Name | 1 Year | 5 Years | 10 Years |
|---|
CCM Community Impact Bond Fund, Retail Shares | 5.24% | -0.63% | 0.89% |
|---|
Bloomberg U.S. Aggregate Bond Index (TR) (USD)* | 5.46% | -0.90% | 1.49% |
|---|
Bloomberg Intermediate U.S. Aggregate Bond Index (USD) | 6.31% | 0.06% | 1.61% |
|---|
|
| No Deduction of Taxes [Text Block] |
The table and graph presented above do not reflect the deduction of taxes a shareholder would pay on Fund distributions or the redemption of Fund shares.
|
| AssetsNet |
$ 3,691,194,333
|
| Holdings Count | Holding |
2,483
|
| Advisory Fees Paid, Amount |
$ 10,815,514
|
| InvestmentCompanyPortfolioTurnover |
28.00%
|
| Additional Fund Statistics [Text Block] |
Key Fund Statistics as of May 31, 2025 | Total Net Assets | Number of Holdings | Total Advisory Fees Paid | Portfolio Turnover Rate |
|---|
| $3,691,194,333 | 2,483 | $10,815,514 | 28% |
|---|
|
| Holdings [Text Block] |
Asset WeightingsFootnote Reference*Value | Value |
|---|
Non-Agency CMBS | 0.4% | Short-Term Investments | 1.2% | Asset-Backed Securities | 3.3% | U.S. Treasury Obligations | 9.8% | Corporate Bonds | 12.4% | Municipal Bonds | 13.0% | U.S. Government & Agency Obligations | 59.7% |
| Footnote | Description | Footnote* | Percentages are calculated based on total net assets. |
|
| Largest Holdings [Text Block] |
Holding Name | Coupon Rate | Maturity Date | Percentage of Total
Net AssetsFootnote Reference(A) |
|---|
U.S. Treasury Notes | 3.875%
| 04/30/30
| 2.2% | Comcast Corp. | 4.650%
| 02/15/33
| 2.2% | U.S. Treasury Notes | 4.625%
| 02/15/35
| 1.6% | U.S. Treasury Notes | 4.125%
| 11/15/27
| 1.4% | Bank of America Corp., SOFRRATE + 1.990% | 6.204%
| 11/10/28
| 1.3% | Prologis | 1.250%
| 10/15/30
| 1.2% | American Express | 4.050%
| 05/03/29
| 1.2% | Prologis | 4.625%
| 01/15/33
| 1.1% | Citibank, SOFRRATE + 0.712% | 4.876%
| 11/19/27
| 0.6% | FNMA | 5.000%
| 11/01/52
| 0.6% |
| Footnote | Description | Footnote(A) | Short-Term Investments are not shown in the top ten chart. |
|
| Material Fund Change [Text Block] |
There were no material changes during the reporting period. |
| Updated Prospectus Phone Number |
1-877-272-1977
|
| Updated Prospectus Web Address |
https://funddocs.filepoint.com/ccmcib/
|