Shareholder Report
May 31, 2025
USD ($)
$ / shares
WHAT WERE THE FUND COSTS FOR THE PAST YEAR? (based on a hypothetical $10,000 investment)
|
Fund Name
|
Costs of a $10,000 investment*
|
Costs paid as a percentage of a $10,000 investment**
|
|
NEOS Bitcoin High Income ETF
|
$74
|
0.98%
|
HOW DID THE FUND PERFORM LAST YEAR AND WHAT AFFECTED ITS PERFORMANCE?
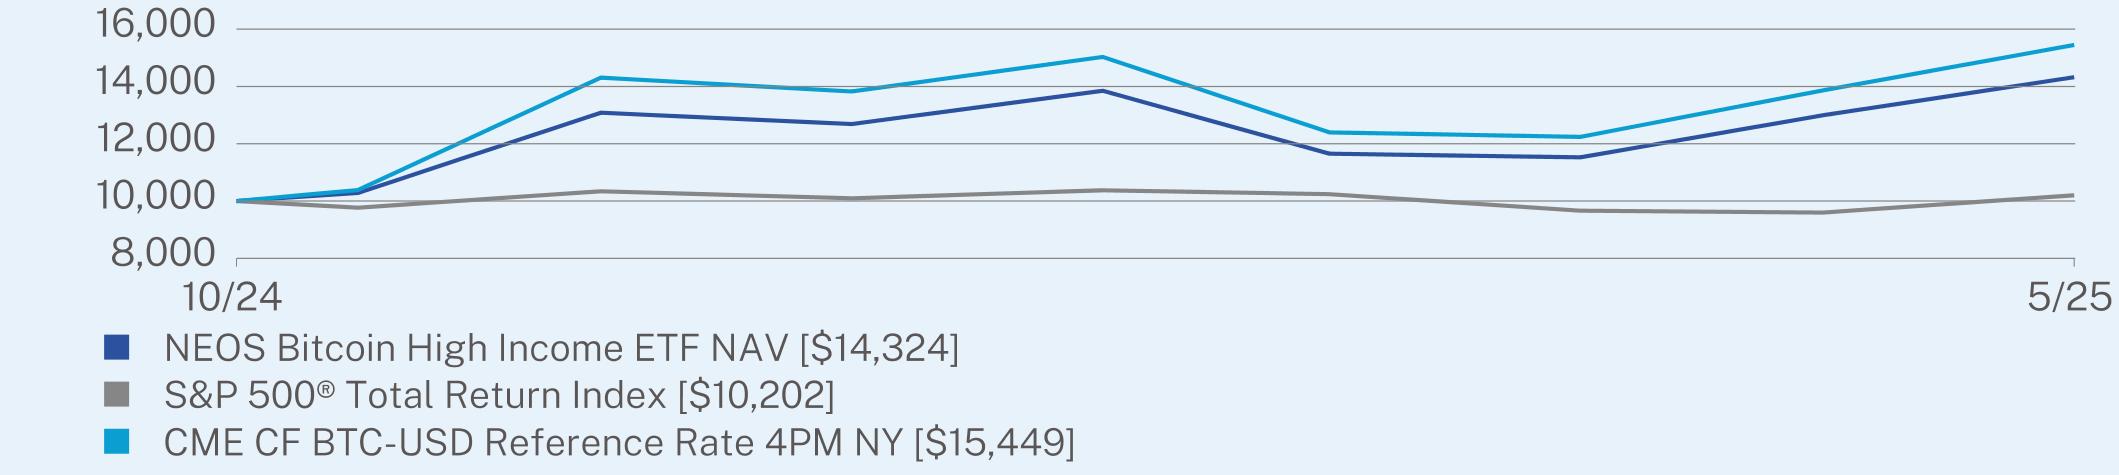
From October 17, 2024, the Fund’s inception date, through May 31, 2025 (the “reporting period”), the Fund’s net asset value (“NAV”) return was 43.24% compared to the CME CF BTC-USD Reference Rate 4pm NY, which returned 54.49%. The Fund’s relative underperformance during the reporting period is attributable to the active laddered call strategy which limited the underlying long Bitcoin exposure to participate with more of the upside in Bitcoin.
CUMULATIVE TOTAL RETURN (%)
|
|
Since Inception
(10/17/2024) |
|
NEOS Bitcoin High Income ETF NAV
|
43.24
|
|
S&P 500® Total Return Index
|
2.02
|
|
CME CF BTC-USD Reference Rate 4PM NY
|
54.49
|
Visit www.neosfunds.com/btci/ for more recent performance information.
Visit www.neosfunds.com/btci/ for more recent performance information.
MANAGED DISTRIBUTIONS
While the Fund does not have a specified level of distribution, the Fund seeks to generate high monthly income in a tax efficient manner with the potential for equity appreciation. During the reporting period, 85.6% of the Fund’s distributions were treated as return of capital and 0% were treated as long-term capital gains. Distributions in excess of the Fund’s current and accumulated earnings and profits are treated as a tax-free return of a shareholder’s investment to the extent of the shareholders basis in the Funds shares, and generally as capital gain thereafter. A return of capital, which for tax purposes is treated as a return of a shareholder’s investment, reduces a shareholder’s basis in the Fund’s shares, thus reducing any loss or increasing any gain on a subsequent taxable disposition of Fund shares.
KEY FUND STATISTICS (as of May 31, 2025)
|
Net Assets
|
$246,421,074
|
|
Number of Holdings
|
9
|
|
Net Advisory Fee
|
$530,609
|
|
Portfolio Turnover
|
1%
|
|
30-Day SEC Yield
|
2.10%
|
|
30-Day SEC Yield Unsubsidized
|
2.10%
|
|
Distribution Yield
|
30.25%
|
|
Top 10 Issuers
|
|
|
United States Treasury Bill
|
69.5%
|
|
VanEck Bitcoin ETF
|
23.8%
|
|
Cboe Mini Bitcoin U.S. ETF Index Purchased/Written Options
|
5.9%
|
|
First American Treasury Obligations Fund
|
1.3%
|
|
Northern U.S. Government Select Money Market Fund
|
0.0%*
|
WHAT WERE THE FUND COSTS FOR THE PAST YEAR? (based on a hypothetical $10,000 investment)
|
Fund Name
|
Costs of a $10,000 investment
|
Costs paid as a percentage of a $10,000 investment
|
|
NEOS Enhanced Income 1-3 Month T-Bill ETF
|
$39
|
0.38%
|
HOW DID THE FUND PERFORM LAST YEAR AND WHAT AFFECTED ITS PERFORMANCE?
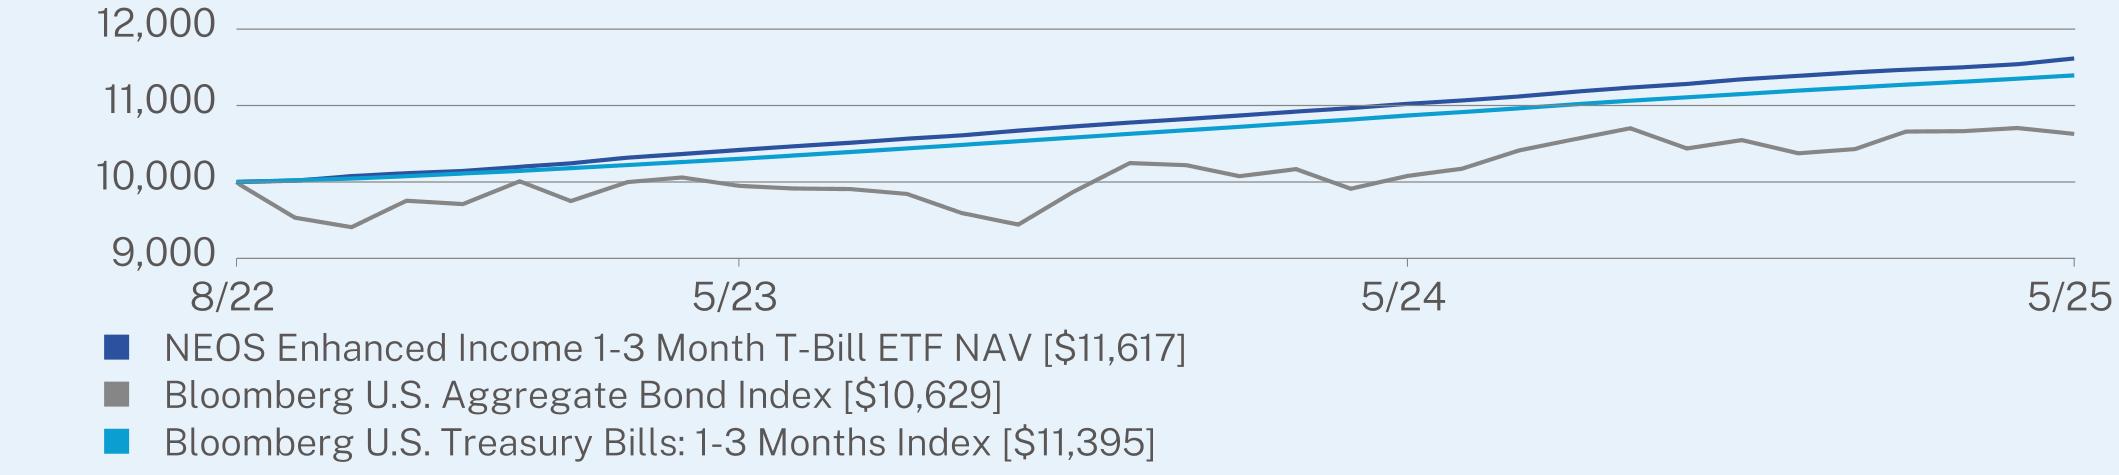
For the fiscal year ended May 31, 2025 (the “reporting period”), the Fund’s net asset value (“NAV”) return was 5.39% compared to its benchmark index, the Bloomberg U.S. Treasury Bills: 1-3 Months Index, which returned 4.83%. The Fund’s outperformance relative to its reference index for the reporting period is attributable to the put options overlay, which generated additional monthly income for the Fund while maintaining tax efficiency.
ANNUAL AVERAGE TOTAL RETURN (%)
|
|
1 Year
|
Since Inception
(08/30/2022) |
|
NEOS Enhanced Income 1-3 Month T-Bill ETF NAV
|
5.39
|
5.59
|
|
Bloomberg U.S. Aggregate Bond Index
|
5.46
|
2.24
|
|
Bloomberg U.S. Treasury Bills: 1-3 Months Index
|
4.83
|
4.86
|
Visit www.neosfunds.com/cshi/ for more recent performance information.
Visit www.neosfunds.com/cshi/ for more recent performance information.
MANAGED DISTRIBUTIONS
While the Fund does not have a specific level of distribution, the Fund seeks to generate monthly income in a tax efficient manner. During the reporting period, 4.2% of the Fund’s distributions were treated as return of capital and 9.3% were treated as long-term capital gains. Distributions in excess of the Fund’s current and accumulated earnings and profits are treated as a tax-free return of a shareholder’s investment to the extent of the shareholders basis in the Funds shares, and generally as capital gain thereafter. A return of capital, which for tax purposes is treated as a return of a shareholder’s investment, reduces a shareholder’s basis in the Fund’s shares, thus reducing any loss or increasing any gain on a subsequent taxable disposition of Fund shares.
KEY FUND STATISTICS (as of May 31, 2025)
|
Net Assets
|
$504,177,262
|
|
Number of Holdings
|
23
|
|
Net Advisory Fee
|
$1,890,743
|
|
Portfolio Turnover
|
0%
|
|
30-Day SEC Yield
|
3.91%
|
|
30-Day SEC Yield Unsubsidized
|
3.91%
|
|
Distribution Yield
|
5.18%
|
|
Top 10 Issuers
|
|
|
United States Treasury Bill
|
99.1%
|
|
First American Treasury Obligations Fund
|
0.6%
|
|
Northern U.S. Government Select Money Market Fund
|
0.4%
|
|
S&P 500 Index Purchased/Written Options
|
0.0%*
|
WHAT WERE THE FUND COSTS FOR THE PAST YEAR? (based on a hypothetical $10,000 investment)
|
Fund Name
|
Costs of a $10,000 investment*
|
Costs paid as a percentage of a $10,000 investment**
|
|
NEOS Enhanced Income 20+ Year Treasury Bond ETF
|
$31
|
0.58%
|
HOW DID THE FUND PERFORM LAST YEAR AND WHAT AFFECTED ITS PERFORMANCE?
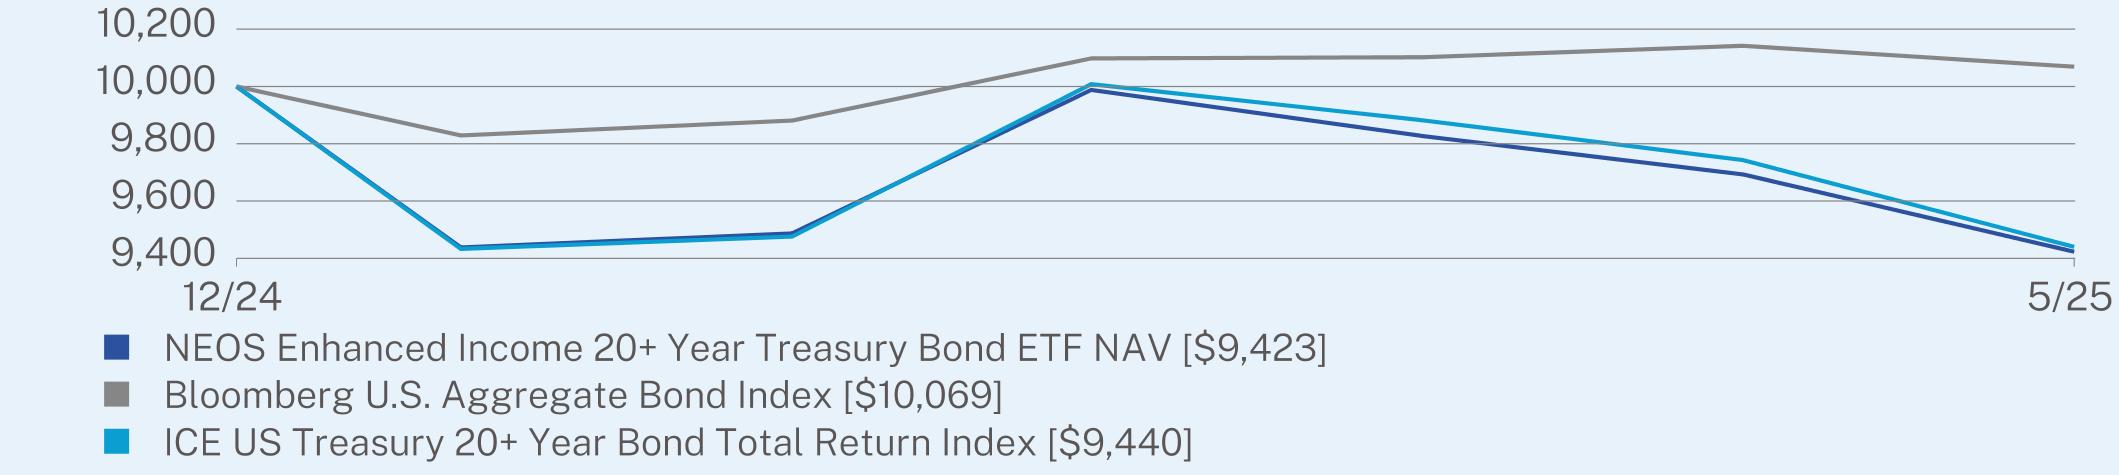
From December 11, 2024, the Fund’s inception date, through May 31, 2025 (the “reporting period”), the Fund’s net asset value (“NAV”) return was -5.77% compared to its benchmark index, the ICE US Treasury 20+ Year Bond Total Return Index, which returned -5.60%. The Fund’s relative underperformance during the reporting period is attributable to the active put spread strategy.
CUMULATIVE TOTAL RETURN (%)
|
|
Since Inception
(12/11/2024) |
|
NEOS Enhanced Income 20+ Year Treasury Bond ETF NAV
|
-5.77
|
|
Bloomberg U.S. Aggregate Bond Index
|
0.69
|
|
ICE US Treasury 20+ Year Bond Total Return Index
|
-5.60
|
Visit https://neosfunds.com/tlti/ for more recent performance information.
Visit https://neosfunds.com/tlti/ for more recent performance information.
MANAGED DISTRIBUTIONS
While the Fund does not have a specified level of distribution, the Fund seeks to generate high monthly income in a tax efficient manner with the potential for equity appreciation. During the reporting period, 35.5% of the Fund’s distributions were treated as return of capital and 1.4% were treated as long-term capital gains. Distributions in excess of the Fund’s current and accumulated earnings and profits are treated as a tax-free return of a shareholder’s investment to the extent of the shareholders basis in the Funds shares, and generally as capital gain thereafter. A return of capital, which for tax purposes is treated as a return of a shareholder’s investment, reduces a shareholder’s basis in the Fund’s shares, thus reducing any loss or increasing any gain on a subsequent taxable disposition of Fund shares.
KEY FUND STATISTICS (as of May 31, 2025)
|
Net Assets
|
$2,738,911
|
|
Number of Holdings
|
9
|
|
Net Advisory Fee
|
$4,839
|
|
Portfolio Turnover
|
0%*
|
|
30-Day SEC Yield
|
4.42%
|
|
30-Day SEC Yield Unsubsidized
|
4.42%
|
|
Distribution Yield
|
6.43%
|
|
Top 10 Issuers
|
|
|
United States Treasury Bond
|
98.0%
|
|
Northern US Government Money Market Fund
|
0.6%
|
|
First American Treasury Obligations Fund
|
0.2%
|
|
S&P 500 Index Purchased/Written Options
|
0.0%*
|
WHAT WERE THE FUND COSTS FOR THE PAST YEAR? (based on a hypothetical $10,000 investment)
|
Fund Name
|
Costs of a $10,000 investment
|
Costs paid as a percentage of a $10,000 investment
|
|
NEOS Enhanced Income Aggregate Bond ETF
|
$57
|
0.55%
|
HOW DID THE FUND PERFORM LAST YEAR AND WHAT AFFECTED ITS PERFORMANCE?
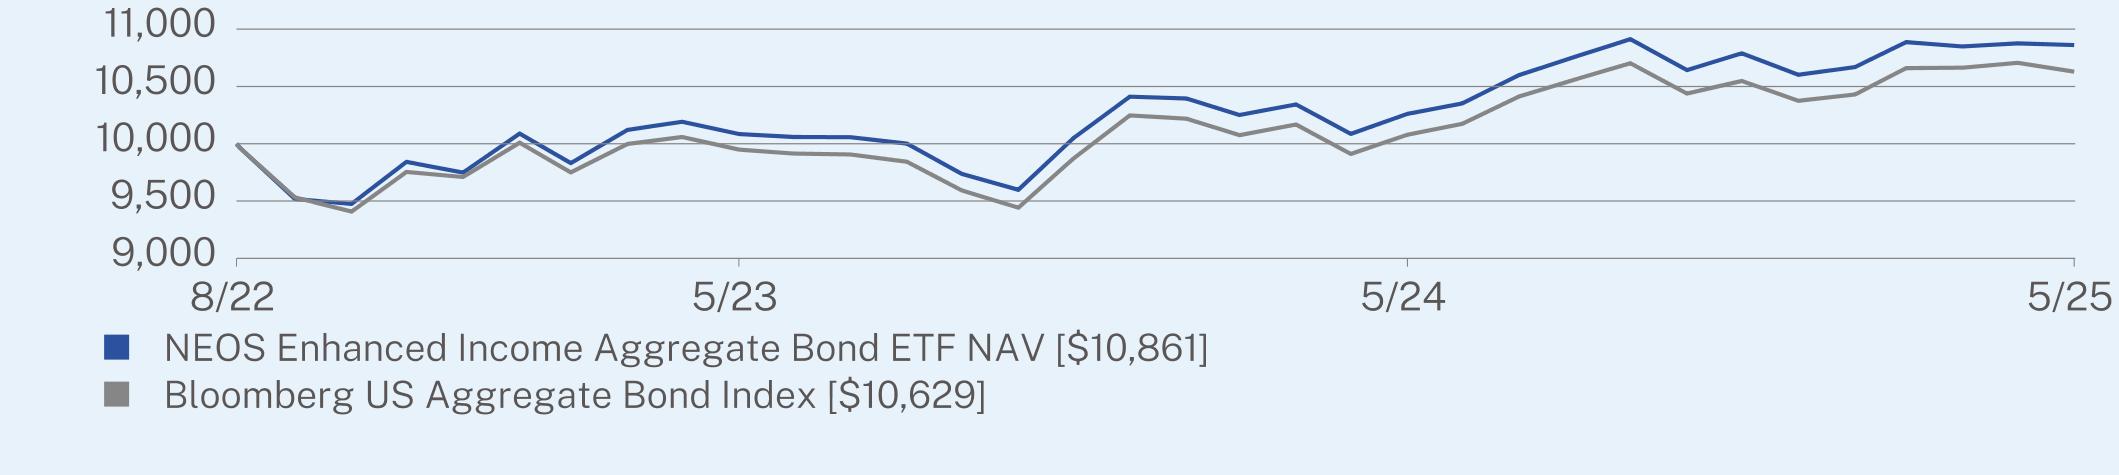
For the fiscal year ended May 31, 2025 (the “reporting period”), the Fund’s net asset value (“NAV”) return was 5.85% compared to its benchmark index, the Bloomberg U.S. Aggregate Bond Index, which returned 5.46%. The Fund’s relative outperformance during the reporting period is attributable to its put options overlay, which generated additional monthly income for the Fund while maintaining tax efficiency
ANNUAL AVERAGE TOTAL RETURN (%)
|
|
1 Year
|
Since Inception
(08/30/2022) |
|
NEOS Enhanced Income Aggregate Bond ETF NAV
|
5.85
|
3.05
|
|
Bloomberg US Aggregate Bond Index
|
5.46
|
2.24
|
Visit www.neosfunds.com/bndi/ for more recent performance information.
Visit www.neosfunds.com/bndi/ for more recent performance information.
MANAGED DISTRIBUTIONS
While the Fund does not have a specific level of distribution, the Fund seeks to generate monthly income in a tax efficient manner. During the reporting period, 35.3% of the Fund’s distributions were treated as return of capital and 7.3% were treated as long-term capital gains. Distributions in excess of the Fund’s current and accumulated earnings and profits are treated as a tax-free return of a shareholder’s investment to the extent of the shareholders basis in the Funds shares, and generally as capital gain thereafter. A return of capital, which for tax purposes is treated as a return of a shareholder’s investment, reduces a shareholder’s basis in the Fund’s shares, thus reducing any loss or increasing any gain on a subsequent taxable disposition of Fund shares.
KEY FUND STATISTICS (as of May 31, 2025)
|
Net Assets
|
$86,727,258
|
|
Number of Holdings
|
10
|
|
Net Advisory Fee
|
$278,067
|
|
Portfolio Turnover
|
1%
|
|
30-Day SEC Yield
|
3.27%
|
|
30-Day SEC Yield Unsubsidized
|
3.24%
|
|
Distribution Yield
|
5.72%
|
|
Top 10 Issuers
|
|
|
Vanguard Total Bond Market ETF
|
49.5%
|
|
iShares Core U.S. Aggregate Bond ETF
|
49.5%
|
|
Northern U.S. Government Select Money Market Fund
|
1.0%
|
|
First American Treasury Obligations Fund
|
0.1%
|
|
S&P 500 Index Purchased/Written Options
|
-0.1%
|
This report describes changes to the Fund that occurred during the reporting period.
WHAT WERE THE FUND COSTS FOR THE PAST YEAR? (based on a hypothetical $10,000 investment)
|
Fund Name
|
Costs of a $10,000 investment**
|
Costs paid as a percentage of a $10,000 investment*
|
|
NEOS Enhanced Income Credit Select ETF†
|
$51
|
0.68%
|
HOW DID THE FUND PERFORM LAST YEAR AND WHAT AFFECTED ITS PERFORMANCE?
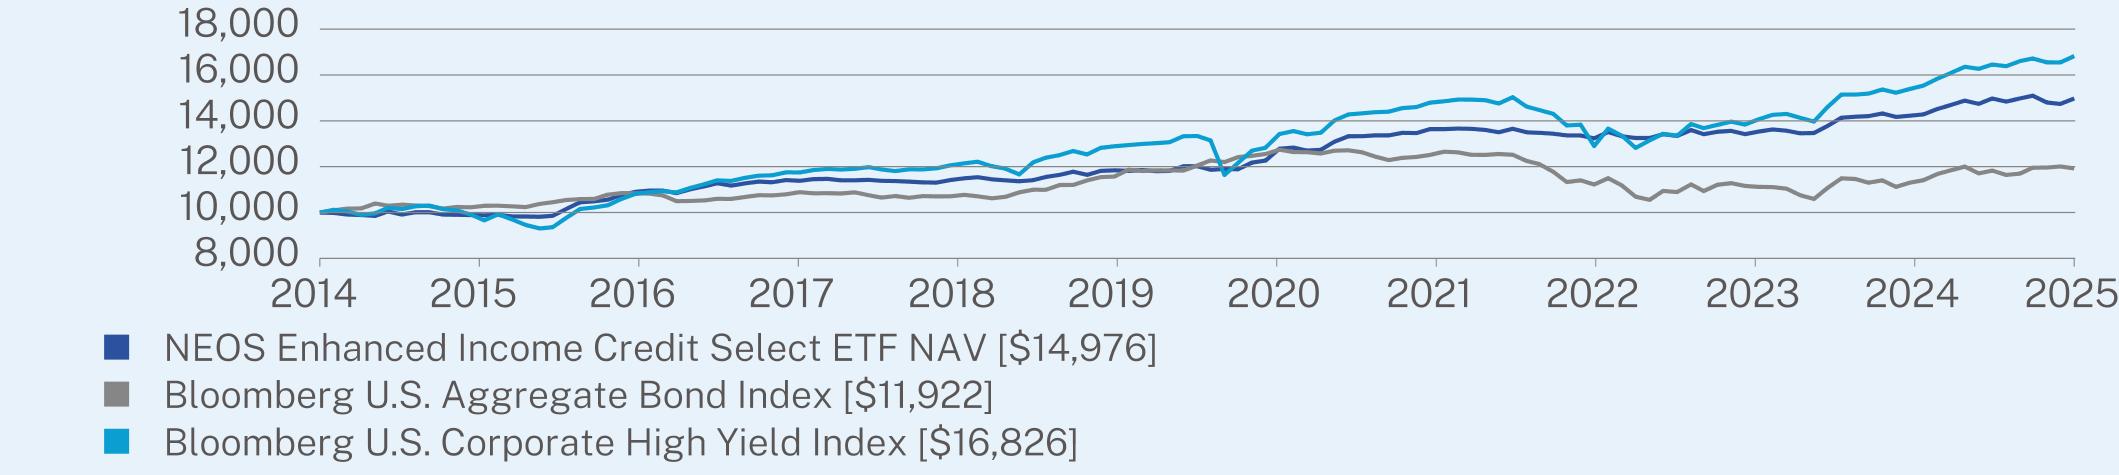
For the period from September 1, 2024 to May 31, 2025 (the “reporting period”), the Fund’s net asset value (“NAV”) return was 1.89% compared to its benchmark index, the Bloomberg U.S. Aggregate Bond Index, which returned 0.64% and the Bloomberg U.S. Corporate High Yield Index, which returned 4.52%. The Fund’s relative under performance during the reporting period is attributable to the higher management fee and total expense ratio borne by the fund prior to reorganization as well as differences in the portfolio construction before and after reorganization.
ANNUAL AVERAGE TOTAL RETURN (%)
|
|
09/01/2024 to 05/31/2025
|
1 Year
|
5 Year
|
10 Year
|
|
NEOS Enhanced Income Credit Select ETF NAV
|
1.89
|
5.27
|
4.22
|
4.11
|
|
Bloomberg U.S. Aggregate Bond Index
|
0.64
|
5.46
|
-0.90
|
1.49
|
|
Bloomberg U.S. Corporate High Yield Index
|
4.52
|
9.32
|
5.79
|
5.03
|
Visit www.neosfunds.com/hybi/ for more recent performance information.
Visit www.neosfunds.com/hybi/ for more recent performance information.
MANAGED DISTRIBUTIONS
While the Fund does not have a specified level of distribution, the Fund seeks to generate high monthly income in a tax efficient manner with the potential for equity appreciation. During the reporting period, 22.3% of the Fund’s distributions were treated as return of capital and 0.0% were treated as long-term capital gains. Distributions in excess of the Fund’s current and accumulated earnings and profits are treated as a tax-free return of a shareholder’s investment to the extent of the shareholders basis in the Funds shares, and generally as capital gain thereafter. A return of capital, which for tax purposes is treated as a return of a shareholder’s investment, reduces a shareholder’s basis in the Fund’s shares, thus reducing any loss or increasing any gain on a subsequent taxable disposition of Fund shares.
KEY FUND STATISTICS (as of May 31, 2025)
|
Net Assets
|
$139,801,341
|
|
Number of Holdings
|
12
|
|
Net Advisory Fee
|
$602,886
|
|
Portfolio Turnover
|
348%
|
|
30-Day SEC Yield
|
5.51%
|
|
30-Day SEC Yield Unsubsidized
|
5.52%
|
|
Distribution Yield
|
8.51%
|
|
Top 10 Issuers
|
|
|
Xtrackers USD High Yield Corporate Bond ETF
|
32.0%
|
|
iShares Broad USD High Yield Corporate Bond ETF
|
32.0%
|
|
SPDR Portfolio High Yield Bond ETF
|
31.0%
|
|
First American Treasury Obligations Fund
|
2.2%
|
|
United States Treasury Bill
|
1.9%
|
|
Northern US Government Money Market Fund
|
1.0%
|
|
S&P 500 Index Purchased/Written Options
|
-0.1%
|
HOW HAS THE FUND CHANGED?
Fund Name Change:
The Fund acquired all Assets and Liabilities of the WSTCM Credit Select Risk-Managed Fund (Predecessor Fund) in a reorganization on September 27, 2024. (the Reorganization). Effective September 30, 2024 the fund is known as the NEOS Enhanced Income Credit Select Fund ETF.
Changes to the Fund’s Principal Investment Strategy:
In connection with the Reorganization, the Principle Investment Strategy was amended to include index options.
Changes to Fund’s Principal Risks:
In connection with the Reorganization, the risk of investing in options was amended to include index options.
Changes to Shareholder Fees (fees paid directly from your investment).
Prior to the Reorganization, for the period September 30, 2014 to September 27, 2024, shareholders paid certain expenses of the Predecessor Fund that are now paid by the Adviser for the Fund under its unitary fee arrangement. Prior to the Reorganization, for the period September 30, 2014 to September 27, 2024, the Predecessor Fund’s adviser limited
the operating expenses of the Predecessor Fund to 1.15% of its average daily net assets. The Predecessor Fund paid the advisor a monthly management fee at the annual rate of 0.60% of its average daily net assets. Under a unitary fee arrangement, the Fund pays the Adviser a monthly management fee at an annual rate of 0.65% of the Fund’s average daily net assets. The Adviser has contractually agreed to waive its management fee and/or reimburse expenses so that the aggregate acquired fund fees and expenses and total annual Fund operating expenses do not exceed 0.68% through December 20, 2025. Further information about the Fund’s fee arrangements, such as which fees and expenses are included or excluded from such arrangements, is available in the Fund’s prospectus dated December 24, 2024.
New Investment Adviser:
Wilbanks, Smith & Thomas Asset Management, LLC d/b/a WST Capital Management served as investment adviser to the Predecessor Fund and NEOS Investment Management, LLC serves as investment adviser to the Fund.
Other Material Fund Changes:
After the closing of trading on December 26, 2024, the Fund affected a 1 for 5 reverse stock split, resulting in an approximate decrease in outstanding shares of 80%.
This report describes changes to the Fund that occurred during the reporting period.
WHAT WERE THE FUND COSTS FOR THE PAST YEAR? (based on a hypothetical $10,000 investment)
|
Fund Name
|
Costs of a $10,000 investment**
|
Costs paid as a percentage of a $10,000 investment*
|
|
NEOS Nasdaq-100® Hedged Equity Income ETF†
|
$53
|
0.68%
|
HOW DID THE FUND PERFORM LAST YEAR AND WHAT AFFECTED ITS PERFORMANCE?
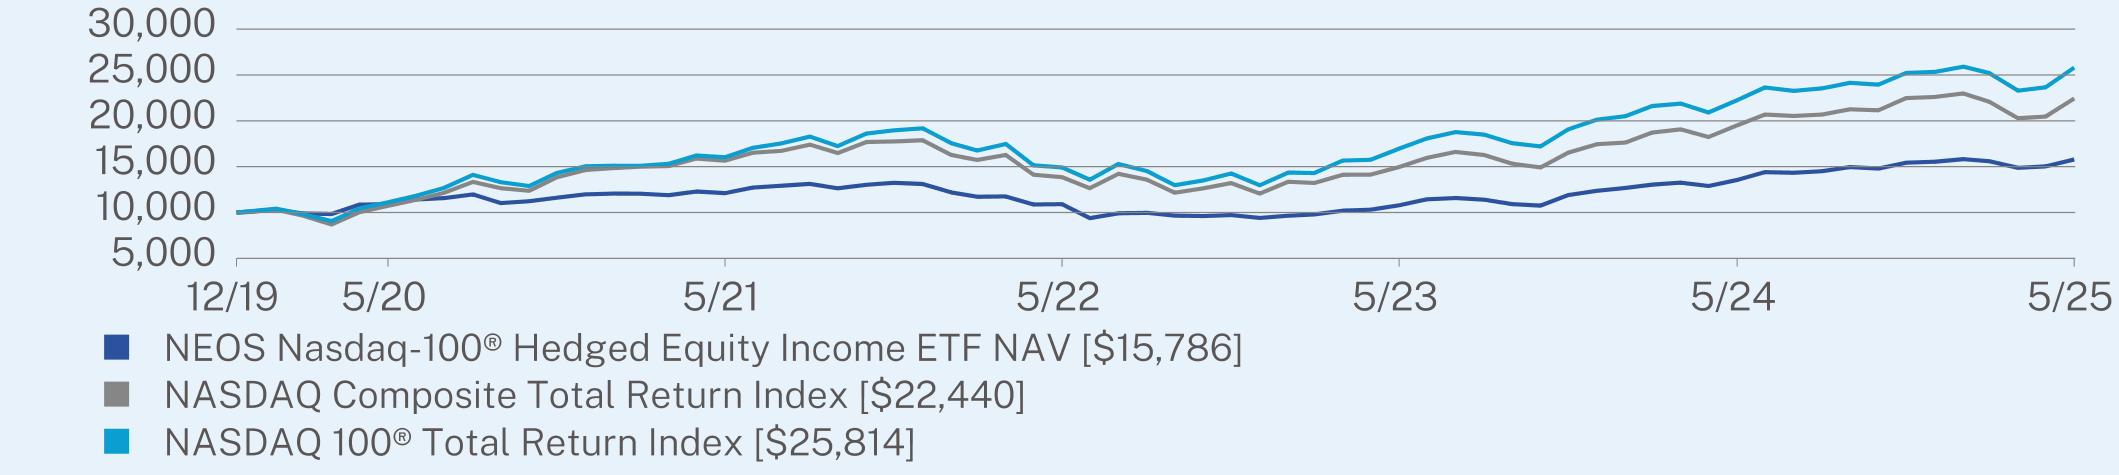
For the period from September 1, 2024 to May 31, 2025 (the “reporting period”), the Fund’s net asset value (“NAV”) return was 8.84% compared to its benchmark index, the NASDAQ 100® Total Return Index, which returned 9.65%. The Fund’s relative outperformance during the reporting period is attributable to the active put spread collar strategy utilizing NDX Index options which helped provide the Fund with a measure of downside protection during a market selloff and also allowed for upside market participation due to the short call being out of the money when written.
ANNUAL AVERAGE TOTAL RETURN (%)
|
|
09/01/2024 to 05/31/2025
|
1 Year
|
5 Year
|
Since Inception
(12/20/2019) |
|
NEOS Nasdaq-100® Hedged Equity Income ETF NAV
|
8.84
|
16.48
|
7.65
|
8.74
|
|
NASDAQ Composite Total Return Index
|
8.47
|
15.02
|
15.91
|
15.99
|
|
NASDAQ 100® Total Return Index
|
9.65
|
16.02
|
18.37
|
19.01
|
Visit https://neosfunds.com/qqqh/ for more recent performance information.
Visit https://neosfunds.com/qqqh/ for more recent performance information.
MANAGED DISTRIBUTIONS
While the Fund does not have a specified level of distribution, the Fund seeks to generate high monthly income in a tax efficient manner with the potential for equity appreciation. During the reporting period, 98.1% of the Fund’s distributions were treated as return of capital and 0.0% were treated as long-term capital gains. Distributions in excess of the Fund’s current and accumulated earnings and profits are treated as a tax-free return of a shareholder’s investment to the extent of the shareholders basis in the Funds shares, and generally as capital gain thereafter. A return of capital, which for tax purposes is treated as a return of a shareholder’s investment, reduces a shareholder’s basis in the Fund’s shares, thus reducing any loss or increasing any gain on a subsequent taxable disposition of Fund shares.
KEY FUND STATISTICS (as of May 31, 2025)
|
Net Assets
|
$305,930,069
|
|
Number of Holdings
|
105
|
|
Net Advisory Fee
|
$1,621,505
|
|
Portfolio Turnover
|
18%
|
|
30-Day SEC Yield
|
0.16%
|
|
30-Day SEC Yield Unsubsidized
|
0.16%
|
|
Distribution Yield
|
9.74%
|
|
Top 10 Issuers
|
|
|
Microsoft Corp.
|
8.6%
|
|
NVIDIA Corp.
|
8.3%
|
|
Apple, Inc.
|
7.6%
|
|
Alphabet, Inc.
|
5.0%
|
|
Amazon.com, Inc.
|
4.9%
|
|
Broadcom, Inc.
|
4.7%
|
|
Meta Platforms, Inc.
|
3.6%
|
|
Netflix, Inc.
|
3.2%
|
|
Tesla, Inc.
|
3.2%
|
|
Costco Wholesale Corp.
|
2.9%
|
Fund Name Change:
The Fund acquired all Assets and Liabilities of the Nationwide Nasdaq-100® Risk Managed ETF, as series of the ETF Series Solutions in a reorganization on November 11, 2024. (the Reorganization). Effective November 11, 2024 the fund is known as the NEOS Hedged Equity Enhanced Income ETF.
Changes to Fund’s Investment Adviser or Sub Adviser:
Effective with the Reorganization, the Advisor of the Fund is NEOS Investment Management LLC. Prior to the Reorganization, Nationwide Fund Advisors was the Adviser to the Fund and NEOS Investment Management LLC was the Sub-Adviser.
Other Material Fund Changes:
After the close of trading on February 20, 2025, the Fund effected a 1 for 2 reverse stock split, resulting in an approximate decrease in share outstanding of 50%.
WHAT WERE THE FUND COSTS FOR THE PAST YEAR? (based on a hypothetical $10,000 investment)
|
Fund Name
|
Costs of a $10,000 investment
|
Costs paid as a percentage of a $10,000 investment
|
|
NEOS Nasdaq 100® High Income ETF
|
$73
|
0.68%
|
HOW DID THE FUND PERFORM LAST YEAR AND WHAT AFFECTED ITS PERFORMANCE?
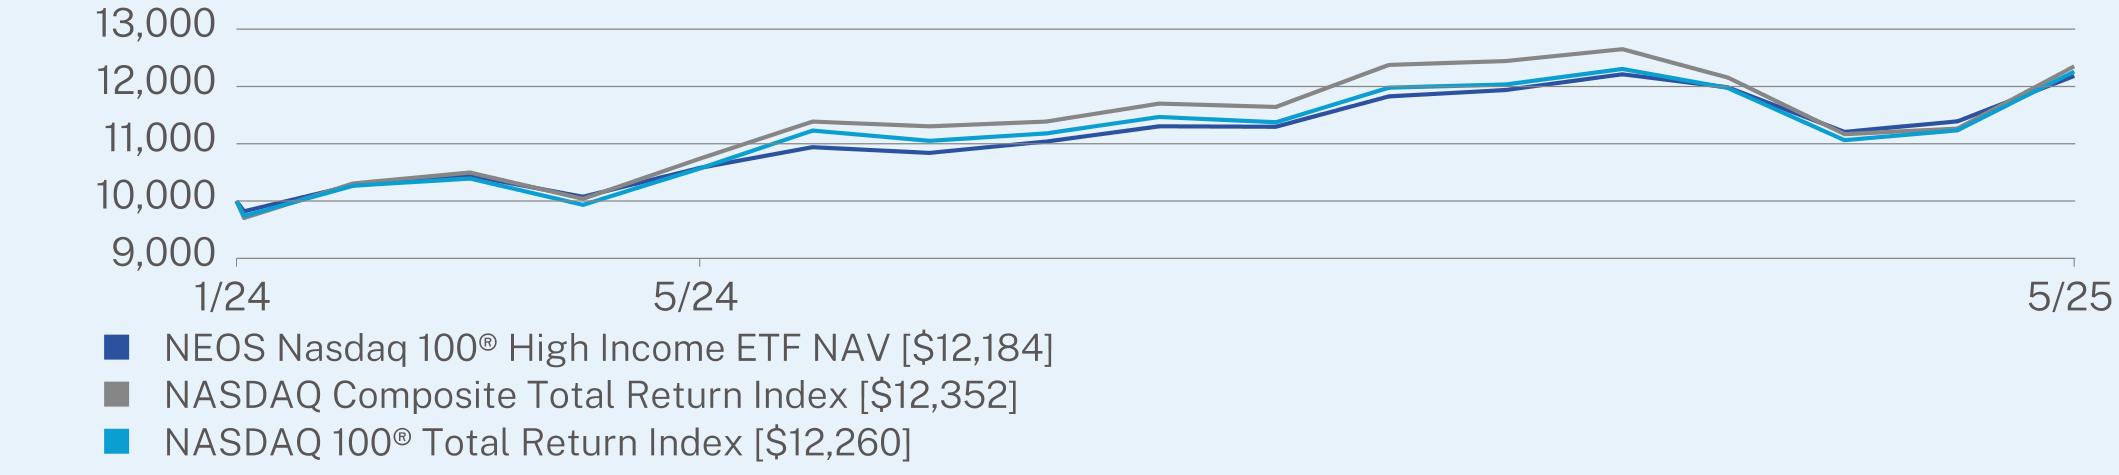
For the fiscal year ended May 31, 2025 (the “reporting period”), the Fund’s net asset value (“NAV”) return was 15.18% compared to its benchmark index, the NASDAQ 100® Total Return Index, which returned 16.02%. The Fund’s relative underperformance during the reporting period is attributable to the active laddered call strategy utilizing NDX Index options which prevented the underlying equities to participate with more of the upside during market moves higher.
ANNUAL AVERAGE TOTAL RETURN (%)
|
|
1 Year
|
Since Inception
(01/30/2024) |
|
NEOS Nasdaq 100® High Income ETF NAV
|
15.18
|
15.92
|
|
NASDAQ Composite Total Return Index
|
15.02
|
17.11
|
|
NASDAQ 100® Total Return Index
|
16.02
|
16.47
|
Visit www.neosfunds.com/qqqi/ for more recent performance information.
Visit www.neosfunds.com/qqqi/ for more recent performance information.
MANAGED DISTRIBUTIONS
While the Fund does not have a specified level of distribution, the Fund seeks to generate high monthly income in a tax efficient manner with the potential for equity appreciation. During the reporting period, 97.2% of the Fund’s distributions were treated as return of capital and 1.0% were treated as long-term capital gains. Distributions in excess of the Fund’s current and accumulated earnings and profits are treated as a tax-free return of a shareholder’s investment to the extent of the shareholders basis in the Funds shares, and generally as capital gain thereafter. A return of capital, which for tax purposes is treated as a return of a shareholder’s investment, reduces a shareholder’s basis in the Fund’s shares, thus reducing any loss or increasing any gain on a subsequent taxable disposition of Fund shares.
KEY FUND STATISTICS (as of May 31, 2025)
|
Net Assets
|
$1,778,335,111
|
|
Number of Holdings
|
104
|
|
Net Advisory Fee
|
$4,980,272
|
|
Portfolio Turnover
|
22%
|
|
30-Day SEC Yield
|
0.17%
|
|
30-Day SEC Yield Unsubsidized
|
0.17%
|
|
Distribution Yield
|
15.35%
|
|
Top 10 Issuers
|
|
|
Microsoft Corp.
|
8.6%
|
|
NVIDIA Corp.
|
8.3%
|
|
Apple, Inc.
|
7.6%
|
|
Alphabet, Inc.
|
4.9%
|
|
Amazon.com, Inc.
|
4.9%
|
|
Broadcom, Inc.
|
4.7%
|
|
Meta Platforms, Inc.
|
3.6%
|
|
Netflix, Inc.
|
3.2%
|
|
Tesla, Inc.
|
3.2%
|
|
Costco Wholesale Corp.
|
2.9%
|
WHAT WERE THE FUND COSTS FOR THE PAST YEAR? (based on a hypothetical $10,000 investment)
|
Fund Name
|
Costs of a $10,000 investment*
|
Costs paid as a percentage of a $10,000 investment**
|
|
NEOS Real Estate High Income ETF
|
$22
|
0.68%
|
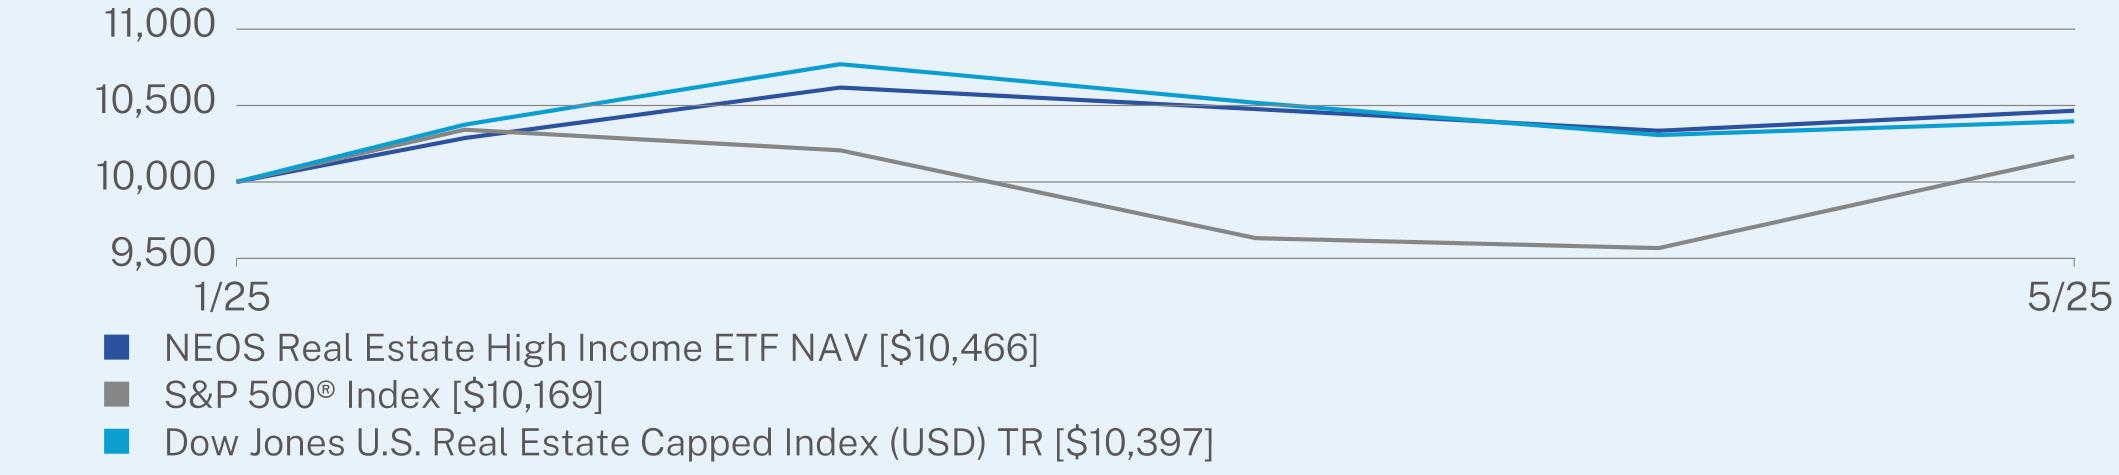
HOW DID THE FUND PERFORM LAST YEAR AND WHAT AFFECTED ITS PERFORMANCE?
From January 15, 2025, the Fund’s inception date, through May 31, 2025 (the “reporting period”), the Fund’s net asset value (“NAV”) return was 4.66% compared to its benchmark index, the Dow Jones U.S. Real Estate Capped Index (USD) TR, which returned 3.97%. The Fund’s relative outperformance during the reporting period is attributable to the active laddered call strategy which allowed the underlying equities to move higher since the short calls were written further out of the money.
CUMULATIVE TOTAL RETURN (%)
|
|
Since Inception
(01/15/2025) |
|
NEOS Real Estate High Income ETF NAV
|
4.66
|
|
S&P 500® Index
|
1.69
|
|
Dow Jones U.S. Real Estate Capped Index (USD) TR
|
3.97
|
Visit https://neosfunds.com/iyri/ for more recent performance information.
Visit https://neosfunds.com/iyri/ for more recent performance information.
MANAGED DISTRIBUTIONS
While the Fund does not have a specified level of distribution, the Fund seeks to generate high monthly income in a tax efficient manner with the potential for equity appreciation. During the reporting period, 38.9% of the Fund’s distributions were treated as return of capital and 2.8% were treated as long-term capital gains. Distributions in excess of the Fund’s current and accumulated earnings and profits are treated as a tax-free return of a shareholder’s investment to the extent of the shareholders basis in the Funds shares, and generally as capital gain thereafter. A return of capital, which for tax purposes is treated as a return of a shareholder’s investment, reduces a shareholder’s basis in the Fund’s shares, thus reducing any loss or increasing any gain on a subsequent taxable disposition of Fund shares.
KEY FUND STATISTICS (as of May 31, 2025)
|
Net Assets
|
$48,312,424
|
|
Number of Holdings
|
69
|
|
Net Advisory Fee
|
$63,298
|
|
Portfolio Turnover
|
2%
|
|
30-Day SEC Yield
|
3.22%
|
|
30-Day SEC Yield Unsubsidized
|
3.22%
|
|
Distribution Yield
|
11.84%
|
|
Top 10 Issuers
|
|
|
Prologis, Inc.
|
7.6%
|
|
American Tower Corp.
|
7.6%
|
|
Welltower, Inc.
|
7.0%
|
|
Equinix, Inc.
|
4.7%
|
|
Digital Realty Trust, Inc.
|
4.2%
|
|
Simon Property Group, Inc.
|
3.8%
|
|
Realty Income Corp.
|
3.8%
|
|
Public Storage
|
3.7%
|
|
Crown Castle, Inc.
|
3.4%
|
|
CBRE Group, Inc.
|
2.8%
|
WHAT WERE THE FUND COSTS FOR THE PAST YEAR? (based on a hypothetical $10,000 investment)
|
Fund Name
|
Costs of a $10,000 investment*
|
Costs paid as a percentage of a $10,000 investment**
|
|
NEOS Russell 2000® High Income ETF
|
$55
|
0.58%
|
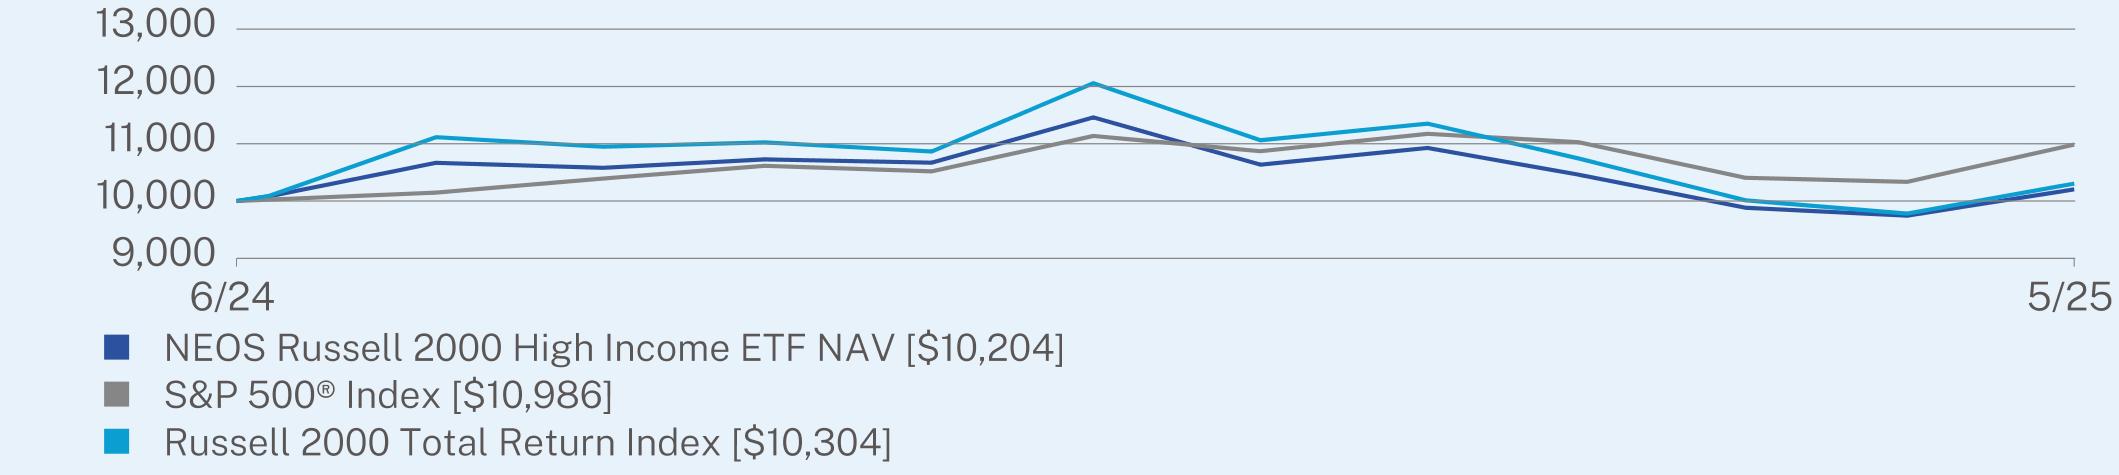
HOW DID THE FUND PERFORM LAST YEAR AND WHAT AFFECTED ITS PERFORMANCE?
From June 25, 2024, the Fund’s inception date, through May 31, 2025 (the “reporting period”), the Fund’s net asset value (“NAV”) return was 2.04% compared to its benchmark index, the Russell 2000 Total Return Index, which returned 3.04%. The Fund’s relative underperformance during the reporting period is attributable to the active laddered call strategy which prevented the underlying long Russell 2000 exposure to participate with more of the upside in the Russell 2000.
CUMULATIVE TOTAL RETURN (%)
|
|
Since Inception
(06/25/2024) |
|
NEOS Russell 2000 High Income ETF NAV
|
2.04
|
|
S&P 500® Index
|
9.86
|
|
Russell 2000 Total Return Index
|
3.04
|
Visit www.neosfunds.com/iwmi/ for more recent performance information.
Visit www.neosfunds.com/iwmi/ for more recent performance information.
MANAGED DISTRIBUTIONS
While the Fund does not have a specified level of distribution, the Fund seeks to generate high monthly income in a tax efficient manner with the potential for equity appreciation. During the reporting period, 71.7% of the Fund’s distributions were treated as return of capital and 14.5% were treated as long-term capital gains. Distributions in excess of the Fund’s current and accumulated earnings and profits are treated as a tax-free return of a shareholder’s investment to the extent of the shareholders basis in the Funds shares, and generally as capital gain thereafter. A return of capital, which for tax purposes is treated as a return of a shareholder’s investment, reduces a shareholder’s basis in the Fund’s shares, thus reducing any loss or increasing any gain on a subsequent taxable disposition of Fund shares.
KEY FUND STATISTICS (as of May 31, 2025)
|
Net Assets
|
$177,647,049
|
|
Number of Holdings
|
4
|
|
Net Advisory Fee
|
$572,284
|
|
Portfolio Turnover
|
2%
|
|
30-Day SEC Yield
|
0.90%
|
|
30-Day SEC Yield Unsubsidized
|
0.81%
|
|
Distribution Yield
|
15.22%
|
|
Top 10 Issuers
|
|
|
Vanguard Russell 2000 ETF
|
100.0%
|
|
First American Treasury Obligations Fund
|
0.3%
|
|
Russell 2000 Index Written Options
|
-1.1%
|
WHAT WERE THE FUND COSTS FOR THE PAST YEAR? (based on a hypothetical $10,000 investment)
|
Fund Name
|
Costs of a $10,000 investment*
|
Costs paid as a percentage of a $10,000 investment**
|
|
NEOS S&P 500® Hedged Equity Income ETF
|
$11
|
0.68%
|
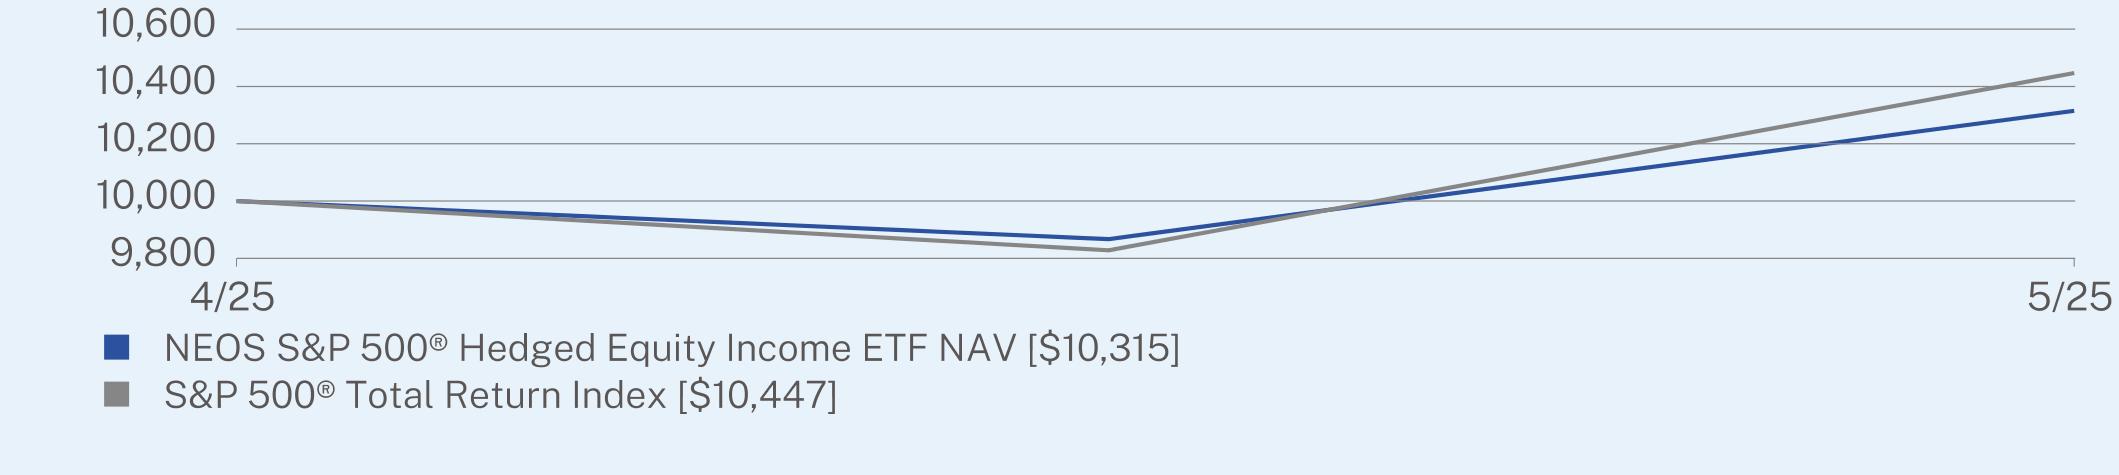
HOW DID THE FUND PERFORM LAST YEAR AND WHAT AFFECTED ITS PERFORMANCE?
From April 3, 2025, the Fund’s inception date, through May 31, 2025 (the “reporting period”), the Fund’s net asset value (“NAV”) return was 3.15% compared to its benchmark index, the S&P 500® Total Return Index, which returned 4.47%. The Fund’s relative underperformance during the reporting period is attributable to the active put spread collar strategy which was able to provide a measure of downside protection during the market selloff, but not able to fully participate in the market rally during the quick recovery off the lows in April.
CUMULATIVE TOTAL RETURN (%)
|
|
Since Inception
(04/03/2025) |
|
NEOS S&P 500® Hedged Equity Income ETF NAV
|
3.15
|
|
S&P 500® Total Return Index
|
4.47
|
Visit https://neosfunds.com/spyh/ for more recent performance information.
Visit https://neosfunds.com/spyh/ for more recent performance information.
MANAGED DISTRIBUTIONS
While the Fund does not have a specified level of distribution, the Fund seeks to generate high monthly income in a tax efficient manner with the potential for equity appreciation. During the reporting period, 93.1% of the Fund’s distributions were treated as return of capital and 0.0% were treated as long-term capital gains. Distributions in excess of the Fund’s current and accumulated earnings and profits are treated as a tax-free return of a shareholder’s investment to the extent of the shareholders basis in the Funds shares, and generally as capital gain thereafter. A return of capital, which for tax purposes is treated as a return of a shareholder’s investment, reduces a shareholder’s basis in the Fund’s shares, thus reducing any loss or increasing any gain on a subsequent taxable disposition of Fund shares.
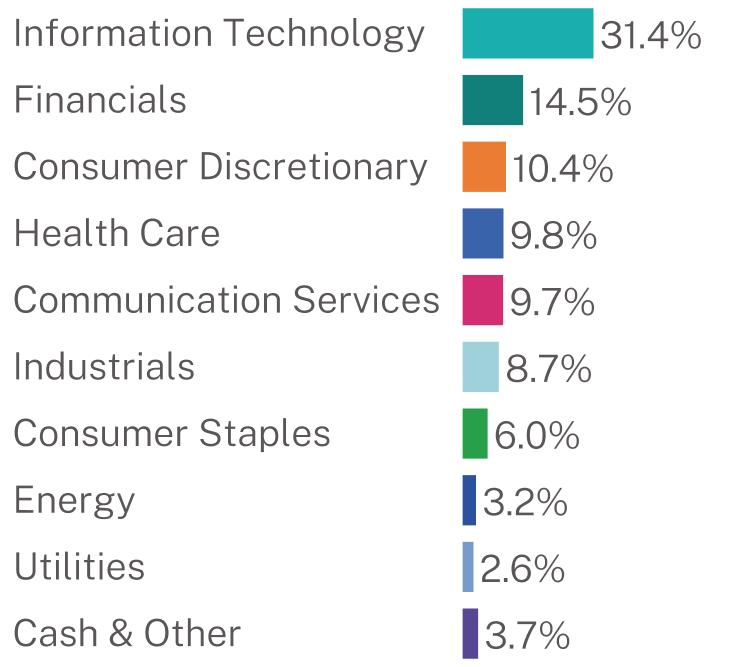
KEY FUND STATISTICS (as of May 31, 2025)
|
Net Assets
|
$2,038,503
|
|
Number of Holdings
|
485
|
|
Net Advisory Fee
|
$1,250
|
|
Portfolio Turnover
|
0%*
|
|
30-Day SEC Yield
|
0.75%
|
|
30-Day SEC Yield Unsubsidized
|
0.75%
|
|
Distribution Yield
|
7.94%
|
|
Top 10 Issuers
|
|
|
Microsoft Corp.
|
6.9%
|
|
NVIDIA Corp.
|
6.6%
|
|
Apple, Inc.
|
6.0%
|
|
Amazon.com, Inc.
|
3.9%
|
|
Alphabet, Inc.
|
3.7%
|
|
Meta Platforms, Inc.
|
2.8%
|
|
Broadcom, Inc.
|
2.3%
|
|
Berkshire Hathaway, Inc.
|
1.9%
|
|
Tesla, Inc.
|
1.8%
|
|
JPMorgan Chase & Co.
|
1.5%
|
WHAT WERE THE FUND COSTS FOR THE PAST YEAR? (based on a hypothetical $10,000 investment)
|
Fund Name
|
Costs of a $10,000 investment
|
Costs paid as a percentage of a $10,000 investment
|
|
NEOS S&P 500® High Income ETF
|
$72
|
0.68%
|
HOW DID THE FUND PERFORM LAST YEAR AND WHAT AFFECTED ITS PERFORMANCE?
For the fiscal year ended May 31, 2025 (the “reporting period”), the Fund’s net asset value (“NAV”) return was 12.01% compared to its benchmark index, the S&P 500® Total Return Index, which returned 13.52%. The Fund’s relative underperformance during the reporting period is attributable to the active short SPX Index laddered call strategy which prevented the underlying equity portfolio from fully participating with the market upside during the sharp rally in the S&P 500 Index for specific months.
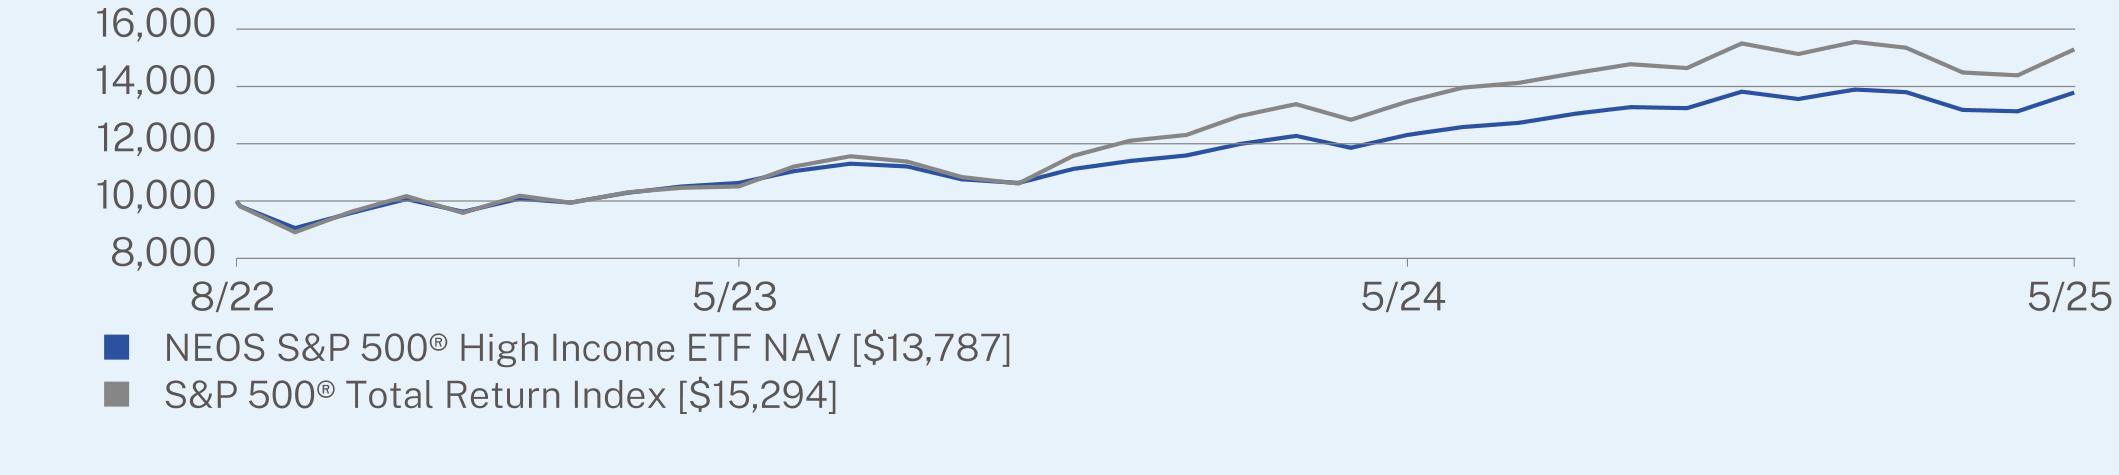
ANNUAL AVERAGE TOTAL RETURN (%)
|
|
1 Year
|
Since Inception
(08/30/2022) |
|
NEOS S&P 500® High Income ETF NAV
|
12.01
|
12.37
|
|
S&P 500® Total Return Index
|
13.52
|
16.69
|
Visit www.neosfunds.com/spyi/ for more recent performance information.
Visit www.neosfunds.com/spyi/ for more recent performance information.
MANAGED DISTRIBUTIONS
While the Fund does not have a specific level of distribution, the Fund seeks to generate high monthly income in a tax efficient manner with the potential for equity appreciation in rising markets. During the reporting period, 94.2% of the Fund’s distributions were treated as return of capital and 0.0% were treated as long-term capital gains. Distributions in excess of the Fund’s current and accumulated earnings and profits are treated as a tax-free return of a shareholder’s investment to the extent of the shareholders basis in the Funds shares, and generally as capital gain thereafter. A return of capital, which for tax purposes is treated as a return of a shareholder’s investment, reduces a shareholder’s basis in the Fund’s shares, thus reducing any loss or increasing any gain on a subsequent taxable disposition of Fund shares.
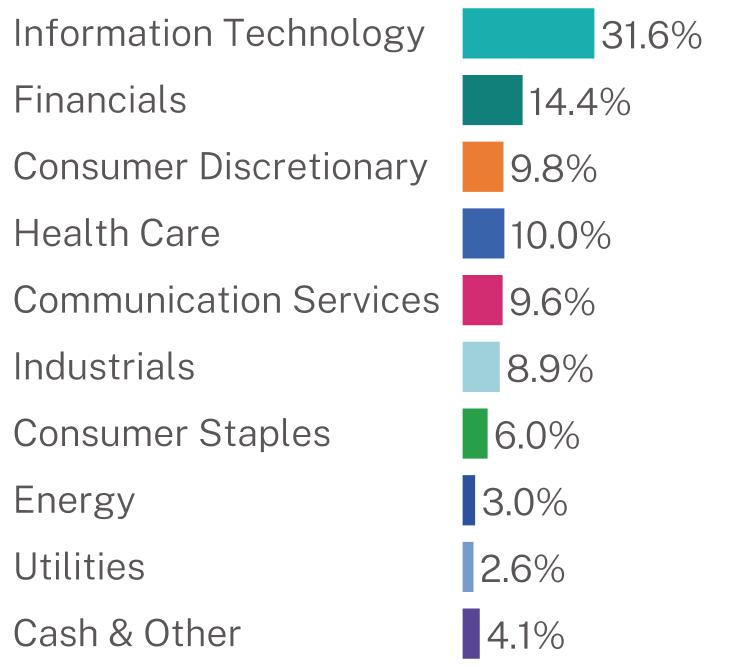
KEY FUND STATISTICS (as of May 31, 2025)
|
Net Assets
|
$3,696,859,069
|
|
Number of Holdings
|
509
|
|
Net Advisory Fee
|
$16,361,817
|
|
Portfolio Turnover
|
2%
|
|
30-Day SEC Yield
|
0.75%
|
|
30-Day SEC Yield Unsubsidized
|
0.75%
|
|
Distribution Yield
|
12.50%
|
|
Top 10 Issuers
|
|
|
Microsoft Corp.
|
6.8%
|
|
NVIDIA Corp.
|
6.6%
|
|
Apple, Inc.
|
6.0%
|
|
Amazon.com, Inc.
|
3.9%
|
|
Alphabet, Inc.
|
3.6%
|
|
Meta Platforms, Inc.
|
2.8%
|
|
Broadcom, Inc.
|
2.2%
|
|
Tesla, Inc.
|
1.9%
|
|
Berkshire Hathaway, Inc.
|
1.9%
|
|
JPMorgan Chase & Co.
|
1.5%
|
| [1] |
|
||
| [2] |
|
||
| [3] |
|
||
| [4] |
|
||
| [5] |
|
||
| [6] |
|
||
| [7] |
|
||
| [8] |
|
||
| [9] |
|
||
| [10] |
|
||
| [11] |
|
||
| [12] |
|
||
| [13] |
|
||
| [14] |
|
||
| [15] |
|
||
| [16] |
|
||
| [17] |
|
||
| [18] |
|
||
| [19] |
|
||
| [20] |
|
||
| [21] |
|