FY2025 Highlights
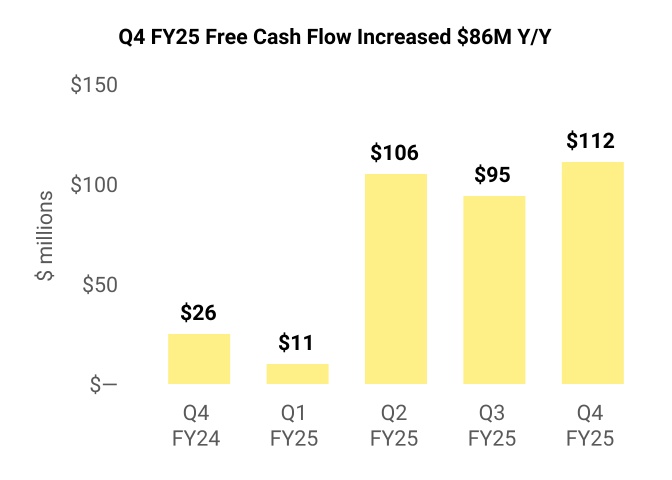
•Peloton performed above the high end of full-year FY25 guidance on all key metrics. We generated over $320 million of GAAP Net Cash Provided by Operating Activities and non-GAAP Free Cash Flow* in FY25, aided by a decrease in operating expenses of 25% year-over-year.
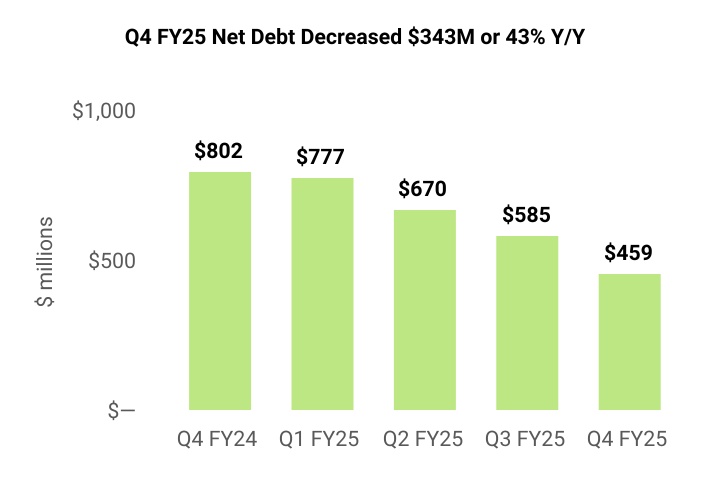
•Our balance sheet is deleveraging quickly, with Total Debt of $1,499 million, Cash and Cash Equivalents of $1,040 million, and Net Debt* of $459 million, a decrease in Net Debt of $343 million or 43% year-over-year.
•Connected Fitness Products Gross Margin was 13.6% in FY25, an improvement of 870 bps year-over-year.
•Engagement levels are healthy, with average monthly workout time per Paid Connected Fitness Subscription increasing 4% year-over-year in Q4.
* For a reconciliation of all non-GAAP financial measures to their most directly comparable GAAP financial measure, and rationale for why we rely on these measures, see the reconciliation tables below.
FY2025 Shareholder Letter
August 7, 2025
Dear Shareholders,
When I started at Peloton, I promised to share our strategy during our fiscal year-end earnings. So here it is–simple and short, with the assurance that we will bring this strategy to life throughout the year, including through a reveal of our innovations before our next earnings call.
A profound shift is underway in how we define a life well-lived. The ultimate goal is no longer just a long lifespan, but a healthier, more fulfilling one–referred to as "healthspan." People are taking control of their health and wellness like never before, and they are looking for a trusted partner to help them on that journey.
Peloton was built for this moment. Our combination of premium hardware, intuitive software, world-class Instructors, and a deeply engaged community is unmatched. In our next chapter, we will build upon our leadership in cardio to support our Members’ entire wellness journey, accelerating our progress in strength and mobility and exploring new frontiers in mental wellbeing, sleep and recovery, nutrition and hydration. And with Peloton, these will not simply be means to an end–they will be joyful ends unto themselves.
Our path to delivering exceptional value is clear. We will focus relentlessly on our human impact—improving our Members' fitness, strength, longevity, and happiness. Human impact drives our business. It is the engine for Member growth and retention. By delivering this for our Members, we will deliver outstanding financial results for you, our shareholders.
Improve Member Outcomes
We will empower our Members by:
1.Delivering even more differentiated Cardio experiences. We aim to be #1 in every category in which we compete—especially in-home cycling, running, walking, and rowing—by innovating across our magic formula of equipment plus software plus human coaching. We’ll have more to share soon, and with a steady march of progress in the years to follow.
2.Providing a full array of fitness and wellness experiences. In Q4, 2 million of our Members engaged in Strength, 1.2 million in Sleep & Recovery, and 400,000 in Mental Wellbeing. At these levels, we believe we are the #1 Strength subscription service already and a strong contender in the other categories. In FY26 and beyond, we will provide even more compelling experiences in each of them.
3.Personalizing our offerings for every Member. By using AI and other advanced technologies, and by integrating our platform with our Members’ personal health tracking devices, we will deliver increasingly personal insights, plans, and recommendations, along with measures that enable Members to quantify their progress.
Meet Members Everywhere
To return to Member and hardware unit sales growth, we are:
1.Targeting an increase in our now cost-effective physical and online presence. This year, we will expand from one microstore to 10, grow our third-party physical retail presence to enable people everywhere to try Peloton firsthand, and scale our trustworthy secondary marketplace for previously-loved Peloton equipment ("Peloton Repowered") from three cities to nationwide. We will also increase the presence of our Instructors at in-person events by 3x this year, on the way to an expected 10x increase in FY27, with a proportional increase in our online presence.
2.Creating a unified commercial business unit (CBU). Our new CBU will meet the exacting demands of gym operators by combining the best of Precor, which delivered solid revenue growth in FY25 and serves more than 60 countries and 80,000 facilities thanks to its industry-leading equipment and support, with Peloton’s software, human coaching, and community.
3.Laying the groundwork for future international expansion. Internationally, we plan to deliver local, in-language experiences using a mix of native instruction, AI dubbing, and more flexible approaches to music for thousands of classes. Through partnerships, we aim to introduce the Peloton brand and experiences to millions of people around the world. Together, we believe these actions lay the groundwork for future, cost-effective launches of the full Peloton offering in new geographies.
Members for Life
The biggest challenge in any wellness regimen isn’t getting started–it’s staying with it–and while Peloton is distinguished by the commitment from our Members, we can always do better. We will play our part by:
1.Elevating the Member experience with Peloton. We will do onboarding right, for example, by gamifying the first few weeks to ensure every Member embraces the “golden behaviors” (frequency, breadth, and depth of engagement) that maximize the likelihood of sustaining their commitment. And we will respond in helpful ways if our Members experience a lull in their motivation.
2.Deepening our Members’ connection to Peloton. We will recognize and reward healthy habits and loyalty to our community with a new program that we will announce soon, which will continue to evolve and grow over time.
3.Creating even more supportive connections among our Members. We’ll deliver more social features through Teams, increasingly guided by our Instructors, so that our community can become even more engaged and encouraging.
Business Excellence
In FY25, we made remarkable progress in growing Free Cash Flow and deleveraging our balance sheet. From here, we will increase the yield on our human impact by:
1.Improving monetization. We will become more sophisticated in our use of promotions and will adjust prices to reflect our costs—including shipping, returns, tariffs, and other fees we pay—along with the value we provide to our Members. For example, we will introduce optional expert assembly fees to reflect the real costs of installing our equipment, while extending free self-install to include our Tread and Row, thereby preserving Member choice and control. And I’m proud of our new Special Pricing program, which makes Peloton equipment more affordable for the teachers, military personnel, first responders, and medical professionals we all count on.
2.Minimizing costs. Our operating expenses remain too high, which hinders our ability to invest in our future. Today, we are launching a cost restructuring plan intended to achieve at least $100 million of run-rate savings by the end of FY26 by reducing the size of our global team, paring back indirect spend, and relocating some of our work. This is not a decision we came to lightly, as it impacts many talented team members, but we believe it is necessary for the long-term health of our business.
Measures of Success
Our outlook for FY26 includes $2.4 - $2.5 billion of Total Revenue, 51.0% Total Gross Margin, and $400 - 450 million of Adjusted EBITDA. We intend to provide quarterly and annual guidance for these figures. Our goals in FY26 include generating strong Free Cash Flow, achieving our first-ever positive Operating Income on a full-year basis, and making significant progress toward Revenue growth.
It is a great honor to lead this remarkable company that empowers millions of people to become their best selves. I thank every one of our Members and Team Members for their continued dedication, and commit to all, including you, our shareholders, that even brighter days lie ahead.
Peter Stern
CEO & President
FY 2025 Q4 Operating Metrics and Financial Summary
| | | | | | | | | | | | | | | | | | | | | | | | | | | | | |
| | | | | | | % Change |
| User Metrics | Q4 FY24 | | Q3 FY25 | | Q4 FY25 | | Y/Y | | Q/Q |
| Members (in millions) | 6.4 | | 6.1 | | 6.0 | | (6) | % | | (1) | % |
Ending Paid Connected Fitness Subscriptions (in millions) (1) | 2.976 | | 2.880 | | 2.800 | | (6) | % | | (3) | % |
Average Net Monthly Paid Connected Fitness Subscription Churn (1) | 1.9 | % | | 1.2 | % | | 1.8 | % | | (10) bps | | 60 bps |
Ending Paid App Subscriptions (in millions) (1) | 0.621 | | 0.573 | | 0.552 | | (11) | % | | (4) | % |
Average Monthly Paid App Subscription Churn (1) | 8.5 | % | | 8.1 | % | | 6.4 | % | | (210) bps | | (170) bps |
| | | | | | | | | |
| Financial Results (dollars in millions) | | | | | | | | | |
| Connected Fitness Products Revenue | $ | 212.1 | | | $ | 205.5 | | | $ | 198.6 | | | (6) | % | | (3) | % |
| Subscription Revenue | 431.4 | | | 418.5 | | | 408.3 | | | (5) | % | | (2) | % |
| Total Revenue | $ | 643.6 | | | $ | 624.0 | | | $ | 606.9 | | | (6) | % | | (3) | % |
| | | | | | | | | |
| Connected Fitness Products Gross Profit | $ | 17.6 | | | $ | 29.3 | | | $ | 34.4 | | | 96 | % | | 18 | % |
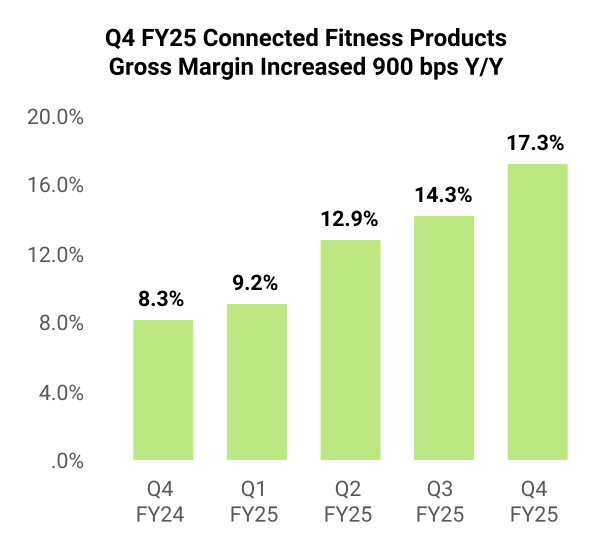
| Connected Fitness Products Gross Margin | 8.3 | % | | 14.3 | % | | 17.3 | % | | 900 bps | | 310 bps |
| | | | | | | | | |
| Subscription Gross Profit | $ | 294.4 | | | $ | 288.8 | | | $ | 293.7 | | | 0 | % | | 2 | % |
| Subscription Gross Margin | 68.2 | % | | 69.0 | % | | 71.9 | % | | 370 bps | | 290 bps |
Subscription Contribution Margin (2) | 72.4 | % | | 72.9 | % | | 75.4 | % | | 310 bps | | 260 bps |
| | | | | | | | | |
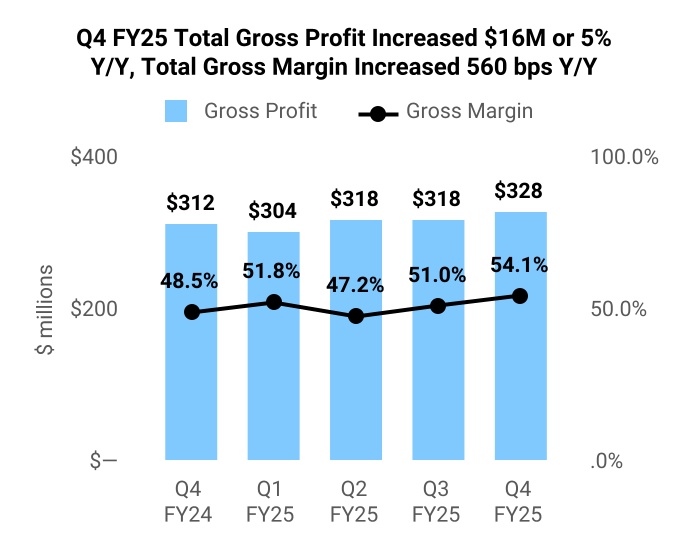
| Total Gross Profit | $ | 312.0 | | | $ | 318.1 | | | $ | 328.1 | | | 5 | % | | 3 | % |
| Total Gross Margin | 48.5 | % | | 51.0 | % | | 54.1 | % | | 560 bps | | 310 bps |
| | | | | | | | | |
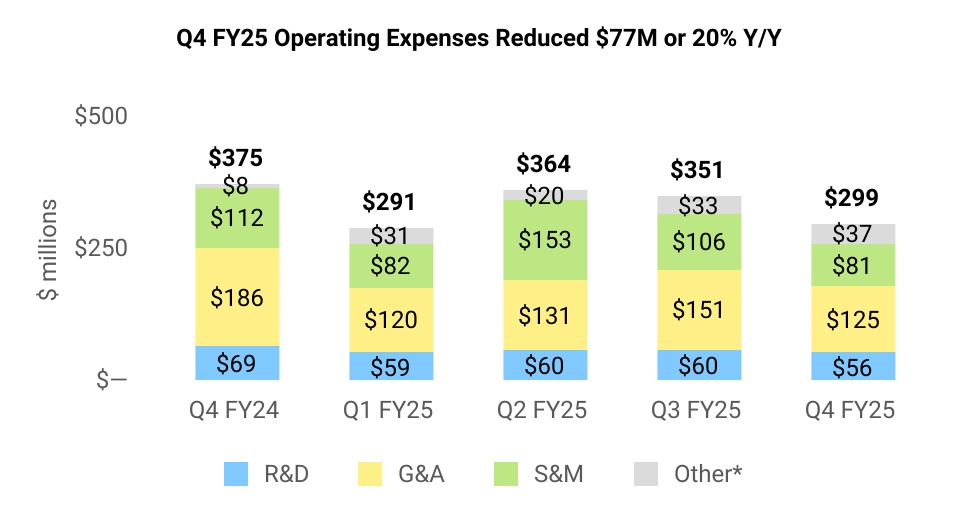
| Total Operating Expenses | $ | 375.3 | | | $ | 350.5 | | | $ | 298.5 | | | (20) | % | | (15) | % |
| | | | | | | | | |
Net (Loss) Income | $ | (30.5) | | | $ | (47.7) | | | $ | 21.6 | | | 171 | % | | 145 | % |
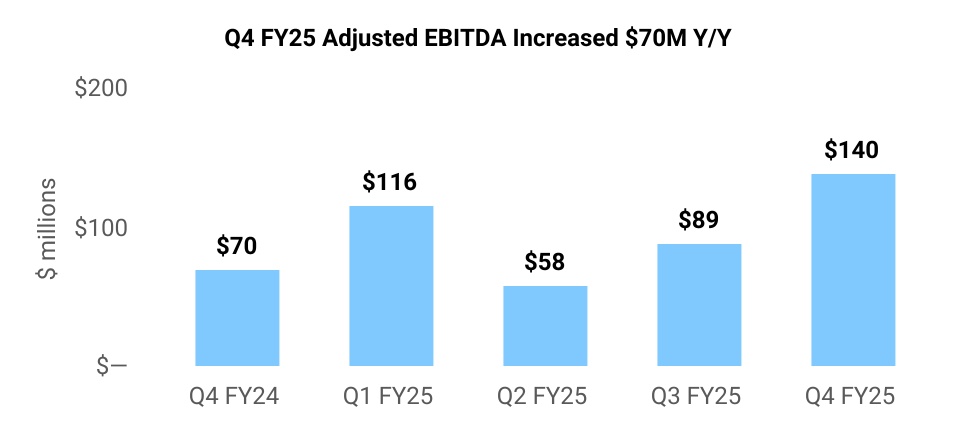
Adjusted EBITDA (2) | $ | 70.3 | | | $ | 89.4 | | | $ | 140.0 | | | 99 | % | | 57 | % |
| | | | | | | | | |
| Net Cash Provided by Operating Activities | $ | 32.7 | | | $ | 96.7 | | | $ | 117.1 | | | 258 | % | | 21 | % |
Free Cash Flow (2) | $ | 26.0 | | | $ | 94.7 | | | $ | 112.4 | | | 332 | % | | 19 | % |
____________________________________
(1) Beginning January 1, 2025, the Company migrated its subscription data model for reporting Ending Paid Connected Fitness Subscriptions, Average Net Monthly Paid Connected Fitness Subscription Churn, Ending Paid App Subscriptions, and Average Monthly Paid App Subscription Churn to a new data model that provides greater visibility to changes to a subscription's payment status when they occur. The new model gives the Company more precise and timely data on subscription pause and churn behavior. Q4 FY24 information has been revised to conform with current period presentation. The impact of this change for the three months ended June 30, 2025 and 2024 and March 31, 2025 is immaterial.
(2) For a reconciliation of each non-GAAP financial measure to the most directly comparable GAAP financial measure, please refer to the reconciliation tables in the section titled “Non-GAAP Financial Measures.”
OPERATING METRICS AND FINANCIAL SUMMARY
Subscriptions
We ended Q4 with 2.80 million Ending Paid Connected Fitness Subscriptions, reflecting a net decrease of 80 thousand in the quarter due to seasonally lower hardware sales and seasonally higher churn. Ending Paid Connected Fitness Subscriptions decreased 6% year-over-year, and exceeded the high end of our guidance range by 10 thousand driven by both higher additions and favorable net churn.
•Gross additions outperformance relative to guidance was driven by stronger hardware unit sales in both first-party and third-party retail channels, while secondary market additions were in-line with expectations.
•Average Net Monthly Paid Connected Fitness Subscription churn was 1.8%, an improvement of 10 bps year-over-year and an increase of 60 bps quarter-over-quarter, in-line with our seasonality expectations for a sequential increase in Q4.
We ended Q4 with 552 thousand Ending Paid App Subscriptions.
Revenue
Total Revenue was $606.9 million in Q4, comprising $198.6 million of Connected Fitness Products Revenue and $408.3 million of Subscription Revenue, outperforming our $571 million to $586 million implied guidance range. Outperformance relative to guidance was primarily driven by Connected Fitness Products Revenue from higher-than-expected hardware sales of both Peloton and Precor products.
•Connected Fitness Products Revenue decreased $13.5 million, or 6% year-over-year, driven by lower sales and deliveries, partially offset by a mix shift toward higher-priced products.
•Subscription Revenue decreased $23.2 million, or 5% year-over-year, driven by lower Paid Connected Fitness Subscriptions and lower Paid App Subscriptions, partly offset by Used Equipment Activation Fee Revenue, which was introduced in Q1 FY25.
Gross Profit and Margin
Total Gross Profit was $328.1 million in Q4, an increase of $16.1 million or 5% year-over-year. Total Gross Margin was 54.1%, an increase of 560 bps year-over-year and 380 bps above our implied guidance of 50.3%, driven by outperformance in both segments.
•Connected Fitness Products Gross Margin was 17.3%, an increase of 900 bps year-over-year, driven by inventory write-downs recorded in Q4 of last year, a mix shift toward higher margin products, and decreases in service and repair, warehousing and transportation costs.
•Subscription Gross Margin was 71.9%, an increase of 370 bps year-over-year driven by decreases in music licensing royalties, personnel-related expenses, inclusive of stock-based compensation, and depreciation & amortization. Subscription Gross Margin benefited from $11.0 million of one-time balance sheet adjustments for accrued music royalties associated with renewing a music licensing agreement. Excluding these one-time benefits, Subscription Gross Margin would have been 69.2%.
Operating Expenses
Total operating expenses, including restructuring and impairment expenses, were $298.5 million in Q4, a $76.8 million or 20% decrease year-over-year, reflecting the continued progress we've made in right-sizing our cost structure. We exceeded our target to achieve at least $200 million of run-rate cost savings in FY25.
Sales and marketing expenses were $80.6 million in Q4, a decrease of $31.7 million or 28% year-over-year, driven by decreases of $20.9 million in advertising and marketing spend, $5.6 million in personnel-related expenses, inclusive of stock-based compensation, and $2.8 million in retail showroom expenses. We exited 24 retail showroom locations in FY25, reducing our retail footprint from 37 to 13 showrooms at the end of Q4, excluding microstore locations.
Research and development expenses were $55.8 million in Q4, a decrease of $13.5 million or 20% year-over-year, driven by decreases of $8.4 million in personnel-related expenses, inclusive of stock-based compensation, and $4.4 million in product development costs.
General and administrative expenses were $125.1 million in Q4, a decrease of $61.1 million or 33% year-over-year, driven by decreases of $47.4 million in stock-based compensation primarily associated with executive departures in Q4 of last year, $6.2 million in personnel-related expenses, partially offset by a $3.6 million increase in professional fees.
This quarter, we recognized $37.0 million of restructuring and impairment expenses, primarily consisting of severance and personnel-related charges as a result of today's announced restructuring plan, as well as other non-cash impairment charges.
*Other includes restructuring expense, impairment expense and supplier settlements
Adjusted EBITDA*
Our GAAP Net Income for Q4 was $21.6 million, an improvement of $52.1 million year-over-year, and our GAAP Operating Income was $29.6 million, an improvement of $92.9 million year-over-year. Adjusted EBITDA was $140.0 million in Q4, a $69.7 million or 99% improvement year-over-year and $53.6 million above the high end of our implied guidance range.
* For a reconciliation of all non-GAAP financial measures to their most directly comparable GAAP financial measure, and rationale for why we rely on these measures, see the reconciliation tables below.
Free Cash Flow*, Cash Balance & Net Debt*
Net cash provided by operating activities was $117.1 million in Q4, an increase of $84.4 million year-over-year. We generated $112.4 million of Free Cash Flow in Q4, an increase of $86.4 million year-over-year.
We ended Q4 with $1,039.5 million in unrestricted cash and cash equivalents, an increase of $125.3 million quarter-over-quarter. We continue to make progress toward deleveraging our balance sheet, as Net Debt reduced $343.0 million or 43% year-over-year to $459.4 million. We also have access to a $100.0 million revolving credit facility, which remains undrawn to date.
* For a reconciliation of all non-GAAP financial measures to their most directly comparable GAAP financial measure, and rationale for why we rely on these measures, see the reconciliation tables below.
Q1 FY26 OUTLOOK
| | | | | | | | | | | | | | | | | | | | | | | | | | | | | | | | | | | |
| As Reported | | Q1 FY26 Range | | % Change (Midpoint) |
| User Metrics (in millions) | Q1 FY25 | | Q4 FY25 | | Low | | High | | Y/Y | | Q/Q |
| Ending Paid Connected Fitness Subscriptions | 2.90 | | 2.80 | | 2.72 | | 2.73 | | (6)% | | (3)% |
| | | | | | | | | | | |
| | | | | | | | | | | |
| | | | | | | | | | | |
| Financial Results (dollars in millions) | | | | | | | | | | | |
| Total Revenue | $586.0 | | $606.9 | | $525.0 | | $545.0 | | (9)% | | (12)% |
| | | | | | | | | | | |
Total Gross Margin(1) | 51.8% | | 54.1% | | 52.0% | | 20 bps | | (210) bps |
| | | | | | | | | | | |
Adjusted EBITDA(2) | $115.8 | | $140.0 | | $90.0 | | $100.0 | | (18)% | | (32)% |
____________________________________
(1) Beginning in the first quarter of 2026, the Company is changing its measure of segment profitability to segment gross profit inclusive of allocated overhead costs. As a result, Q1 FY26 guidance on Total Gross Margin is inclusive of allocated overhead costs. Adjusting for the impact of these cost allocations in Q1 FY25, our Q1 Total Gross Margin guidance would reflect an improvement of 120 bps year-over-year. For a reconciliation of Total Gross Margin for Q1 FY25 and Q4 FY25 to the revised amounts inclusive of allocated overhead costs, refer to the reconciliation tables in the section titled "Change in Segment Measure of Profitability."
(2) Please see the section titled “Non-GAAP Financial Measures—Adjusted EBITDA” for a reconciliation of Net (loss) income to Adjusted EBITDA for Q1 FY25 and Q4 FY25 and an explanation of why we consider Adjusted EBITDA to be a helpful measure for investors.
FY26 OUTLOOK
| | | | | | | | | | | | | | | | | | | | | | | |
| As Reported | | FY26 Range | | % Change (Midpoint) |
| Financial Results (dollars in millions) | FY25 | | Low | | High | | Y/Y |
| Total Revenue | $2,490.8 | | $2,400.0 | | $2,500.0 | | (2)% |
| | | | | | | |
Total Gross Margin(1) | 50.9% | | 51.0% | | 10 bps |
| | | | | | | |
Adjusted EBITDA(2) | $403.6 | | $400.0 | | $450.0 | | 5% |
____________________________________
(1) Beginning in the first quarter of 2026, the Company is changing its measure of segment profitability to segment gross profit inclusive of allocated overhead costs. As a result, FY26 guidance on Total Gross Margin is inclusive of allocated overhead costs. Adjusting for the impact of these cost allocations in FY25, our Full Year Total Gross Margin guidance would reflect an improvement of 140 bps year-over-year. For a reconciliation of FY25 Total Gross Margin to the revised amount inclusive of allocated overhead costs, refer to the reconciliation tables in the section titled "Change in Segment Measure of Profitability".
(2) Please see the section titled “Non-GAAP Financial Measures—Adjusted EBITDA” for a reconciliation of Net loss to Adjusted EBITDA for FY25 and an explanation of why we consider Adjusted EBITDA to be a helpful measure for investors.
Q1 and FY26 OUTLOOK
For Full Year FY26 and on a quarterly basis, we are providing a guidance range for Total Revenue, Total Gross Margin, and Adjusted EBITDA, our key priorities for financial performance. We will continue to provide an annual target for minimum Free Cash Flow and a quarterly guidance range for Ending Paid Connected Fitness Subscriptions.
Our Full Year FY26 Total Revenue outlook of $2.4 - $2.5 billion reflects a 2% revenue decrease year-over-year at the midpoint, driven by our expectations for a continued decrease in Peloton hardware sales and Ending Paid Connected Fitness Subscriptions year-over-year, partly offset by sales growth in Precor products. Q1 Total Revenue is expected to be $525.0 - $545.0 million and reflects a decrease of 9% year-over-year at the midpoint as a result of anticipated year-over-year decline in hardware sales and Paid Connected Fitness Subscriptions.
Starting in FY26, we will assign executive and other corporate overhead associated with our New York headquarters and other corporate facilities, as we focus on driving more accountability for costs at a functional level. Historically, these costs were all recorded in G&A, but going forward will be assigned across COGS, S&M, G&A, and R&D. Our Guidance for Total Gross Margin reflects these assignments, which we expect to drive a 70 bps headwind to Total Gross Margin in FY26. Full Year FY26 Total Gross Margin is expected to be ~51.0% and our Q1 Total Gross Margin outlook is ~52.0%.
Our FY26 Adjusted EBITDA guidance range of $400 - 450 million reflects an increase of $21 million or 5% year-over-year at the midpoint primarily driven by operating expense savings connected to today’s announced restructuring plan. Q1 Adjusted EBITDA is expected to be within the range of $90 million to $100 million, reflecting a decrease of $21 million or 18% year-over-year at the midpoint primarily driven by the expected decline in Total Revenue year-over-year.
Q1 Ending Paid Connected Fitness Subscriptions guidance of 2.72 - 2.73 million reflects a year-over-year decrease of 171 thousand or 6% at the midpoint. We expect gross additions to decrease year-over-year as a result of an expected year-over-year decrease in Peloton hardware unit sales. Average Net Monthly Paid Connected Fitness Subscription Churn is expected to follow our historical seasonal pattern, with higher churn in Q1, but still slightly lower than Q1 of last year.
We remain committed to generating meaningful Free Cash Flow, with a target to achieve at least $200 million in FY26. This target reflects our current expectations for a roughly $65 million impact to Free Cash Flow as a result of tariff exposure, which is a dynamic situation and may change over time. In FY25, we reduced our Inventory position, creating a significant net working capital benefit to Free Cash Flow. While we do expect a small cash benefit from Inventory in FY26, overall, we expect changes in net working capital to be a Free Cash Flow headwind in FY26. We also expect greater one-time cash restructuring charges as a result of today's announced restructuring plan, which we expect to result in $100 million of run-rate cost savings by the end of FY26. We expect these headwinds to be partially offset by improvements in Gross Margin and Operating Expenses as a result of our focus on improving monetization and optimizing costs.
Webcast
We will host a live call at 8:30 a.m. ET on Thursday, August 7, 2025 to discuss our financial results. To avoid delays, we encourage participants to register at a minimum 15 minutes before the start of the call. A live webcast of the call will be available at https://investor.onepeloton.com/news-and-events/events and a replay will be available on the investor relations page of the Company's website for 30 days.
Safe Harbor Statement
This shareholder letter contains forward-looking statements within the meaning of the Private Securities Litigation Reform Act of 1995. We intend such forward-looking statements to be covered by the safe harbor provisions for forward-looking statements contained in Section 27A of the Securities Act of 1933, as amended and Section 21E of the Securities Exchange Act of 1934, as amended. All statements contained in this shareholder letter other than statements of historical fact, including, without limitation, statements regarding our expected financial results for the first quarter of and the full fiscal year 2026; our execution of and timing of and the expected benefits from our restructuring initiatives and cost-saving measures; the cost savings and other efficiencies of expanding relationships with our third-party partners; details regarding and the timing of the launch of new products and services; our new initiatives with retailer partners and our efforts to optimize our retail showroom footprint, the prices of our products and services in the future; our future operating results and financial position, including our ability to achieve and maintain our Free Cash Flow, revenue, gross margin, adjusted EBITDA and subscription targets; our profitability; our business strategy and plans and our ability to achieve them, market growth, and our objectives for future operations, are forward-looking statements. The words “believe,” “may,” “will,” “estimate,” “potential,” “continue,” “anticipate,” “intend,” “expect,” “could,” “would,” “project,” “plan,” “target,” and similar expressions are intended to identify forward-looking statements, though not all forward-looking statements use these words or expressions.
We have based these forward-looking statements on our current expectations and projections about future events and trends that we believe may affect our financial condition, results of operations, business strategy, short-term and long-term business operations and objectives, and financial needs. These forward-looking statements are subject to a number of risks, uncertainties, and assumptions and other important factors that could cause actual results to differ materially from those stated, including, without limitation: our ability to achieve and maintain future profitability and positive free cash flow; our ability to attract and maintain Subscriptions; our ability to accurately forecast consumer demand of our products and services and adequately manage our inventory; our ability to execute and achieve the expected benefits of our restructuring initiatives and other cost-saving measures and whether our efforts will result in further actions or additional asset impairment charges that adversely affect our business; our ability to anticipate consumer preferences and successfully develop and offer new products and services in a timely manner, and effectively manage the introduction of new or enhanced products and services; demand for our products and services and growth of the Connected Fitness Products Market; our ability to maintain the value and reputation of the Peloton brand; disruptions or failures of our information technology systems or websites, or those of third parties on whom we rely; our reliance on a limited number of suppliers, contract manufacturers, and logistics partners for our Connected Fitness Products; our lack of control over suppliers, contract manufacturers, and logistics partners for our Connected Fitness Products; our ability to predict our long-term performance and changes to our revenue as our business matures; any declines in sales of our Connected Fitness Products; the effects of increased competition in our markets and our ability to compete effectively; our dependence on third-party licenses for use of music in our content; actual or perceived defects in, or safety of, our products, including any impact of product recalls or legal or regulatory claims, proceedings or investigations involving our products; increases in component costs, long lead times, supply shortages or other supply chain disruptions; accidents, safety incidents or workforce disruptions; seasonality or other fluctuations in our quarterly results; our ability to generate class content; risks related to acquisitions or dispositions and our ability to integrate any such acquired companies into our operations and control environment, including Precor; risks related to expansion into international markets; risks related to payment processing, cybersecurity, or data privacy; risks related to the Peloton App and its ability to work with a range of mobile and streaming technologies, systems, networks, and standards; our ability to effectively price and market our Connected Fitness Products and subscriptions and our limited operating history with which to predict the profitability of our subscription model; any inaccuracies in, or failure to achieve, operational and business metrics or forecasts of market growth; our ability to maintain effective internal control over financial and management systems; impacts from warranty claims or product returns; our ability to maintain, protect, and enhance our intellectual property; our ability to comply with laws and regulations that currently apply or become applicable to our business both in the United States and internationally; risks related to changes in global trade policies, including our ability to mitigate the effects of tariffs and other non-tariff restrictions, such as taxes, quotas, local content rules, customs detentions and other protectionist measures; our reliance on third parties for computing, storage, processing and similar services and delivery and installation of our products; our ability to attract and retain highly skilled personnel and maintain our culture; risks related to our common stock and indebtedness; and those risks and uncertainties described in the Company’s Annual Report on Form 10-K, Quarterly Reports on Form 10-Q and Current Reports on Form 8-K filed with the Securities and Exchange Commission, as such risks and uncertainties may be updated in our filings with the Securities and Exchange Commission, which are available on the Investor Relations page of our website at https://investor.onepeloton.com/investor-relations and on the SEC website at www.sec.gov. You should not rely upon forward-looking statements as predictions of future events. The events and circumstances reflected in the forward-looking statements may not be achieved or occur. Although we believe that the expectations reflected in the forward-looking statements are reasonable, we cannot guarantee future results, performance, or achievements. Our forward-looking statements speak only as of the date of this shareholder letter, and we undertake no obligation to update any of these forward-looking statements for any reason after the date of this shareholder letter or to conform these statements to actual results or revised expectations, except as required by law.
FINANCIAL TABLES
CONSOLIDATED BALANCE SHEETS
(in millions, except share and per share amounts)
| | | | | | | | | | | |
| June 30, | | June 30, |
| 2025 | | 2024 |
| | | |
| ASSETS | | | |
| Current assets: | | | |
| Cash and cash equivalents | $ | 1,039.5 | | | $ | 697.6 | |
| Accounts receivable, net | 101.2 | | | 103.6 | |
| Inventories, net | 205.6 | | | 329.7 | |
| Prepaid expenses and other current assets | 91.3 | | | 135.1 | |
| Total current assets | 1,437.6 | | | 1,266.0 | |
| Property and equipment, net | 239.0 | | | 353.7 | |
| Intangible assets, net | 5.6 | | | 15.0 | |
| Goodwill | 41.2 | | | 41.2 | |
| Restricted cash | 46.2 | | | 53.2 | |
| Operating lease right-of-use assets, net | 338.9 | | | 435.0 | |
| Other assets | 16.8 | | | 21.0 | |
| Total assets | $ | 2,125.3 | | | $ | 2,185.2 | |
| LIABILITIES AND STOCKHOLDERS’ DEFICIT | | | |
| Current liabilities: | | | |
| Accounts payable and accrued expenses | $ | 372.7 | | | $ | 432.3 | |
| Deferred revenue and customer deposits | 150.7 | | | 163.7 | |
| Current portion of debt | 208.5 | | | 10.0 | |
| Operating lease liabilities, current | 70.1 | | | 75.3 | |
| Other current liabilities | 2.0 | | | 3.9 | |
| Total current liabilities | 803.9 | | | 685.2 | |
| Convertible senior notes, net of current portion | 343.6 | | | 540.0 | |
| Term loan, net of current portion | 946.9 | | | 950.1 | |
| Operating lease liabilities, non-current | 407.5 | | | 503.3 | |
| Other non-current liabilities | 37.2 | | | 25.7 | |
| Total liabilities | 2,539.1 | | | 2,704.3 | |
| Commitments and contingencies | | | |
| Stockholders’ deficit | | | |
Common stock, $0.000025 par value; 2,500,000,000 and 2,500,000,000 Class A shares authorized, 390,579,270 and 358,120,105 shares issued and outstanding as of June 30, 2025 and June 30, 2024, respectively; 2,500,000,000 and 2,500,000,000 Class B shares authorized, 15,837,270 and 18,141,608 shares issued and outstanding as of June 30, 2025 and June 30, 2024, respectively. | — | | | — | |
| Additional paid-in capital | 5,183.8 | | | 4,948.6 | |
| Accumulated other comprehensive income | 5.1 | | | 15.9 | |
| Accumulated deficit | (5,602.6) | | | (5,483.7) | |
| Total Stockholders’ deficit | (413.8) | | | (519.1) | |
| Total liabilities and stockholders’ deficit | $ | 2,125.3 | | | $ | 2,185.2 | |
| | | |
CONSOLIDATED STATEMENTS OF OPERATIONS AND COMPREHENSIVE INCOME (LOSS)
(in millions, except share and per share amounts)
| | | | | | | | | | | | | | | | | | | | | | | |
| Three Months Ended June 30, | | Fiscal Year Ended June 30, |
| 2025 | | 2024 | | 2025 | | 2024 |
| Revenue: | | | | | | | |
| Connected Fitness Products | $ | 198.6 | | | $ | 212.1 | | | $ | 817.1 | | | $ | 991.7 | |
| Subscription | 408.3 | | | 431.4 | | | 1,673.7 | | | 1,708.7 | |
| | | | | | | |
| Total revenue | 606.9 | | | 643.6 | | | 2,490.8 | | | 2,700.5 | |
| Cost of revenue: | | | | | | | |
| Connected Fitness Products | 164.2 | | | 194.5 | | | 705.9 | | | 943.0 | |
| Subscription | 114.6 | | | 137.0 | | | 516.6 | | | 551.0 | |
| | | | | | | |
| Total cost of revenue | 278.8 | | | 331.6 | | | 1,222.5 | | | 1,494.0 | |
| Gross profit | 328.1 | | | 312.0 | | | 1,268.3 | | | 1,206.5 | |
| Operating expenses: | | | | | | | |
| Sales and marketing | 80.6 | | | 112.3 | | | 421.6 | | | 658.9 | |
| General and administrative | 125.1 | | | 186.2 | | | 527.3 | | | 651.0 | |
| Research and development | 55.8 | | | 69.4 | | | 234.2 | | | 304.8 | |
| | | | | | | |
| Impairment expense | 11.8 | | | 10.6 | | | 64.1 | | | 57.3 | |
| Restructuring expense | 25.2 | | | (2.8) | | | 33.8 | | | 66.1 | |
| Supplier settlements | — | | | (0.3) | | | 23.5 | | | (2.6) | |
| Total operating expenses | 298.5 | | | 375.3 | | | 1,304.5 | | | 1,735.5 | |
Income (loss) from operations | 29.6 | | | (63.3) | | | (36.2) | | | (529.0) | |
| Other (expense) income, net: | | | | | | | |
| Interest expense | (31.9) | | | (29.9) | | | (134.5) | | | (112.5) | |
| Interest income | 9.0 | | | 8.9 | | | 32.7 | | | 35.1 | |
| Foreign exchange gain (loss) | 15.9 | | | 0.2 | | | 22.4 | | | — | |
Other income, net | 0.1 | | | 0.2 | | | 0.1 | | | 0.7 | |
| Net gain on debt refinancing | — | | | 53.6 | | | — | | | 53.6 | |
| Total other (expense) income, net | (7.0) | | | 33.0 | | | (79.3) | | | (23.2) | |
Income (loss) before provision for income taxes | 22.6 | | | (30.3) | | | (115.6) | | | (552.1) | |
| Income tax expense (benefit) | 1.0 | | | 0.1 | | | 3.4 | | | (0.2) | |
Net income (loss) | $ | 21.6 | | | $ | (30.5) | | | $ | (118.9) | | | $ | (551.9) | |
Net income (loss) attributable to Class A and Class B common stockholders | $ | 21.6 | | | $ | (30.5) | | | $ | (118.9) | | | $ | (551.9) | |
Net income (loss) per share attributable to common stockholders, basic | $ | 0.05 | | | $ | (0.08) | | | $ | (0.30) | | | $ | (1.51) | |
Net income (loss) per share attributable to common stockholders, diluted | $ | 0.05 | | | $ | (0.08) | | | $ | (0.30) | | | $ | (1.51) | |
Weighted-average Class A and Class B common shares outstanding, basic | 402,356,586 | | | 373,539,781 | | | 390,037,997 | | | 365,546,334 | |
Weighted-average Class A and Class B common shares outstanding, diluted | 500,858,306 | | | 373,539,781 | | | 390,037,997 | | | 365,546,334 | |
| Other comprehensive income (loss): | | | | | | | |
| | | | | | | |
| Change in foreign currency translation adjustment | 1.8 | | | (1.4) | | | (10.9) | | | (0.9) | |
| | | | | | | |
| | | | | | | |
| | | | | | | |
Total other comprehensive income (loss) | 1.8 | | | (1.4) | | | (10.9) | | | (0.9) | |
Comprehensive income (loss) | $ | 23.4 | | | $ | (31.9) | | | $ | (129.8) | | | $ | (552.8) | |
CONSOLIDATED STATEMENTS OF CASH FLOWS
(in millions)
| | | | | | | | | | | | | | | | | | | |
| Fiscal Year Ended June 30, | | |
| 2025 | | 2024 | | 2023 | | |
| Cash Flows from Operating Activities: | | | | | | | |
| Net loss | $ | (118.9) | | | $ | (551.9) | | | $ | (1,261.7) | | | |
| Adjustments to reconcile net loss to net cash used in operating activities: | | | | | | | |
| Depreciation and amortization expense | 89.7 | | | 108.8 | | | 124.3 | | | |
| Stock-based compensation expense | 229.6 | | | 311.7 | | | 405.0 | | | |
| Non-cash operating lease expense | 54.5 | | | 66.2 | | | 79.8 | | | |
| | | | | | | |
| Amortization of debt discount and issuance costs | 9.1 | | | 14.2 | | | 13.6 | | | |
| | | | | | | |
| Impairment expense | 64.1 | | | 57.3 | | | 144.5 | | | |
| Loss on sale of subsidiary | — | | | 3.8 | | | — | | | |
| Net foreign currency adjustments | (22.4) | | | — | | | (7.0) | | | |
| Gain on debt extinguishment of convertible notes | — | | | (69.8) | | | — | | | |
| Loss on debt extinguishment of term loan | — | | | 7.5 | | | — | | | |
| Changes in operating assets and liabilities: | | | | | | | |
| Accounts receivable | 2.8 | | | (7.0) | | | (13.8) | | | |
| Inventories | 136.5 | | | 163.0 | | | 537.5 | | | |
| Prepaid expenses and other current assets | 66.6 | | | 42.6 | | | 61.2 | | | |
| Other assets | 4.4 | | | 1.7 | | | 7.1 | | | |
| Accounts payable and accrued expenses | (94.0) | | | (95.5) | | | (347.2) | | | |
| Deferred revenue and customer deposits | (13.5) | | | (23.6) | | | (13.9) | | | |
| Operating lease liabilities, net | (82.3) | | | (90.8) | | | (89.9) | | | |
| Other liabilities | 6.8 | | | (4.4) | | | (27.3) | | | |
| Net cash provided by (used in) operating activities | 333.0 | | | (66.1) | | | (387.6) | | | |
| Cash Flows from Investing Activities: | | | | | | | |
| Proceeds from sale of Peloton Output Park | 4.2 | | | 31.9 | | | — | | | |
| | | | | | | |
| | | | | | | |
| Capital expenditures | (9.3) | | | (19.7) | | | (82.4) | | | |
| | | | | | | |
| | | | | | | |
| Proceeds from sales of subsidiary and net assets | — | | | 14.6 | | | 12.4 | | | |
| | | | | | | |
| Net cash (used in) provided by investing activities | (5.1) | | | 26.8 | | | (69.9) | | | |
| Cash Flows from Financing Activities: | | | | | | | |
| | | | | | | |
| Principal repayment of Term Loan | (10.0) | | | (742.5) | | | (7.5) | | | |
| Payment of principal on convertible notes | — | | | (724.9) | | | — | | | |
| Proceeds from issuance of convertible notes, net of issuance costs | — | | | 342.3 | | | — | | | |
| Proceeds from issuance of term loan, net of issuance costs | — | | | 986.9 | | | — | | | |
| | | | | | | |
| Proceeds from employee stock purchase plan withholdings | 4.1 | | | 3.1 | | | 6.9 | | | |
| Proceeds from employee stock plans | 7.7 | | | 41.2 | | | 79.8 | | | |
| Principal repayments of finance leases | (0.1) | | | (0.5) | | | (2.3) | | | |
| Net cash provided by (used in) financing activities | 1.7 | | | (94.4) | | | 76.8 | | | |
| Effect of exchange rate changes | 5.3 | | | (1.0) | | | 8.6 | | | |
| Net change in cash, cash equivalents, and restricted cash | 334.9 | | | (134.6) | | | (372.2) | | | |
| Cash, cash equivalents, and restricted cash — Beginning of period | 750.9 | | | 885.5 | | | 1,257.6 | | | |
| Cash, cash equivalents, and restricted cash — End of period | $ | 1,085.8 | | | $ | 750.9 | | | $ | 885.5 | | | |
| Supplemental Disclosures of Cash Flow Information: | | | | | | | |
| Cash paid for interest | $ | 127.2 | | | $ | 95.6 | | | $ | 79.0 | | | |
| Cash paid for income taxes | $ | 2.6 | | | $ | — | | | $ | 14.9 | | | |
| | | | | | | | | | | | | | | | | | | |
| Term Loan issuance costs recorded within Net Loss | $ | — | | | $ | 8.7 | | | $ | — | | | |
| Supplemental Disclosures of Non-Cash Investing and Financing Information: | | | | | | | |
| Accrued and unpaid capital expenditures, including software | $ | 0.3 | | | $ | 0.1 | | | $ | 2.4 | | | |
| Stock-based compensation capitalized for software development costs | $ | — | | | $ | — | | | $ | 12.1 | | | |
| | | | | | | |
NON-GAAP FINANCIAL MEASURES
In addition to our results determined in accordance with accounting principles generally accepted in the United States, or GAAP, we believe the following non-GAAP financial measures are useful in evaluating our operating performance. These non-GAAP financial measures have limitations as analytical tools in that they do not reflect all of the amounts associated with our results of operations as determined in accordance with GAAP. Because of these limitations, Adjusted EBITDA, Subscription Contribution, Subscription Contribution Margin, Free Cash Flow, and Net Debt should be considered along with other operating and financial performance measures presented in accordance with GAAP.
The presentation of these non-GAAP financial measures is not intended to be considered in isolation or as a substitute for, or superior to, financial information prepared and presented in accordance with GAAP. Investors are encouraged to review the reconciliation of these non-GAAP financial measures to their most directly comparable GAAP financial measures. A reconciliation of the non-GAAP financial measures to such GAAP measures can be found below.
A reconciliation of the Company’s Adjusted EBITDA and Free Cash Flow guidance to the most directly comparable GAAP financial measures cannot be provided without unreasonable efforts and is not provided herein because of the inherent difficulty in forecasting and quantifying certain amounts that are necessary for such reconciliations, including net income/loss and adjustments that are made for other expense/income, net, income tax expense/benefit, depreciation and amortization expense, stock-based compensation expense, restructuring expense, impairment expense, supplier settlements, product recall related matters, litigation and settlement expenses, and other adjustments reflected in our reconciliation of historical Adjusted EBITDA, the amounts of which could be material.
Adjusted EBITDA
We calculate Adjusted EBITDA as net income/loss adjusted to exclude: other expense/income, net; net gains/losses on debt refinancing; income tax expense/benefit; depreciation and amortization expense; stock-based compensation expense; impairment expense; restructuring expense; product recall related matters; certain litigation and settlement expenses; supplier settlements; and other adjustment items that arise outside the ordinary course of our business.
We use Adjusted EBITDA as a measure of operating performance and the operating leverage in our business. We believe that this non-GAAP financial measure is useful to investors for period-to-period comparisons of our business and in understanding and evaluating our operating results for the following reasons:
•Adjusted EBITDA is widely used by investors and securities analysts to measure a company’s operating performance without regard to items such as stock-based compensation expense, depreciation and amortization expense, other expense/income, net, and provision for income taxes that can vary substantially from company to company depending upon their financing, capital structures, and the method by which assets were acquired;
•Our management uses Adjusted EBITDA in conjunction with financial measures prepared in accordance with GAAP for planning purposes, including the preparation of our annual operating budget, as a measure of our core operating results and the effectiveness of our business strategy, and in evaluating our financial performance; and
•Adjusted EBITDA provides consistency and comparability with our past financial performance, facilitates period-to-period comparisons of our core operating results, and may also facilitate comparisons with other peer companies, many of which use a similar non-GAAP financial measure to supplement their GAAP results.
Our use of Adjusted EBITDA has limitations as an analytical tool, and you should not consider this measure in isolation or as a substitute for analysis of our financial results as reported under GAAP. Some of these limitations are, or may in the future be, as follows:
•Although depreciation and amortization expense are non-cash charges, the assets being depreciated and amortized may have to be replaced in the future, and Adjusted EBITDA does not reflect cash capital expenditure requirements for such replacements or for new capital expenditure requirements;
•Adjusted EBITDA excludes stock-based compensation expense, which has recently been, and will continue to be for the foreseeable future, a significant recurring expense for our business and an important part of our compensation strategy;
•Adjusted EBITDA does not reflect: (1) changes in, or cash requirements for, our working capital needs; (2) interest and other income (expense), or the cash requirements necessary to service interest or principal payments on our debt, which reduces cash available to us; or (3) income taxes, which may represent a reduction in cash available to us;
•Adjusted EBITDA does not reflect gains (losses) associated with refinancing efforts that we have determined are outside of the ordinary course of business and are nonrecurring, infrequent or unusual based on factors such as the nature and strategy of the refinancing, as well as our frequency and past practice of performing refinancing activities;
•Adjusted EBITDA does not reflect certain litigation expenses, consisting of legal settlements and related fees for specific proceedings that we have determined arise outside of the ordinary course of business and are nonrecurring, infrequent or unusual based on the following considerations which we assess regularly: (1) the frequency of similar cases that have been brought to date, or are expected to be brought within two years; (2) the complexity of the case; (3) the nature of the remedy(ies) sought, including the size of any monetary damages sought; (4) offensive versus defensive posture of us; (5) the counterparty involved; and (6) our overall litigation strategy. Following a change in practice beginning during the fiscal year ended June 30, 2022, we no longer adjust Adjusted EBITDA for costs from new patent litigation or consumer arbitration claims, unless we consider the matter to be nonrecurring, infrequent or unusual. We continue to adjust Adjusted EBITDA for historical patent infringement and consumer arbitration claims that were determined, prior to our change in practice, to be nonrecurring, infrequent, or unusual;
•Adjusted EBITDA does not reflect acquisition-related costs, including transaction and integration costs;
•Adjusted EBITDA does not reflect impairment charges and gains (losses) on disposals of fixed assets;
•Adjusted EBITDA does not reflect costs associated with certain product recall related matters including adjustments to the return reserves, inventory write-downs, logistics costs associated with Member requests, the cost to move the recalled product for those that elect the option, subscription waiver costs of service, and recall-related hardware development and repair costs. We make adjustments for product recall related matters that we have determined arise outside of the ordinary course of business and are nonrecurring, infrequent or unusual based on factors including the nature of the product recall, our experience with similar product recalls at the time of such assessment, the impacts on us of the recall remedy and associated logistics, supply chain, and other externalities, as well as the expected consumer demand for such a remedy, and operational complexities in the design, regulatory approval and deployment of a remedy;
•Adjusted EBITDA does not reflect costs associated with restructuring plans;
•Adjusted EBITDA does not reflect supplier settlements that are outside of the ordinary course of business and are nonrecurring, infrequent or unusual based on factors such as the nature of the settlements, as well as our frequency and past practice of performing refinancing activities; and
•The expenses and other items that we exclude in our calculation of Adjusted EBITDA may differ from the expenses and other items, if any, that other companies may exclude from Adjusted EBITDA when they report their operating results and we may, in the future, exclude other significant, unusual expenses or other items from this financial measure. Because companies in our industry may calculate this measure differently than we do, its usefulness as a comparative measure can be limited.
Because of these limitations, Adjusted EBITDA should be considered along with other operating and financial performance measures presented in accordance with GAAP.
Adjusted EBITDA
| | | | | | | | | | | | | | | | | | | | | | | | | | | | | | | | | | | | | | | |
| Three Months and Fiscal Year Ended | | Three Months Ended |
| June 30, 2025 | | March 31, 2025 | | | | | | December 31, 2024 | | September 30, 2024 | | June 30, 2024 |
| (in millions) |
Net income (loss) | $ | 21.6 | | | $ | (118.9) | | | $ | (47.7) | | | | | | | $ | (92.0) | | | $ | (0.9) | | | $ | (30.5) | |
| Adjusted to exclude the following: | | | | | | | | | | | | | | | |
| Total other expense, net | 7.0 | | | 79.3 | | | 14.5 | | | | | | | 45.3 | | | 12.6 | | | 20.7 | |
| Net gain on debt refinancing | — | | | — | | | — | | | | | | | — | | | — | | | (53.6) | |
Income tax expense | 1.0 | | | 3.4 | | | 0.8 | | | | | | | 0.7 | | | 0.8 | | | 0.1 | |
| Depreciation and amortization expense | 20.8 | | | 89.7 | | | 21.2 | | | | | | | 22.8 | | | 24.8 | | | 25.8 | |
| Stock-based compensation expense | 52.5 | | | 228.8 | | | 67.6 | | | | | | | 61.5 | | | 47.2 | | | 105.4 | |
| Impairment expense | 11.8 | | | 64.1 | | | 30.7 | | | | | | | 16.7 | | | 4.9 | | | 10.6 | |
| Restructuring expense | 25.2 | | | 33.8 | | | 2.4 | | | | | | | 3.3 | | | 2.9 | | | (2.8) | |
| Supplier settlements | — | | | 23.5 | | | — | | | | | | | — | | | 23.5 | | | (0.3) | |
| Product recall related matters | — | | | — | | | — | | | | | | | — | | | — | | | (5.8) | |
| Litigation and settlement expenses | — | | | — | | | — | | | | | | | — | | | — | | | 0.6 | |
| Adjusted EBITDA | $ | 140.0 | | | $ | 403.6 | | | $ | 89.4 | | | | | | | $ | 58.4 | | | $ | 115.8 | | | $ | 70.3 | |
Subscription Contribution and Subscription Contribution Margin
We define “Subscription Contribution” as Subscription Revenue less Subscription Cost of revenue, adjusted to exclude depreciation and amortization and stock-based compensation expenses included within Subscription Cost of revenue. Subscription Contribution Margin is calculated by dividing Subscription Contribution by Subscription Revenue.
We use Subscription Contribution and Subscription Contribution Margin to measure our ability to scale and leverage the costs of our Connected Fitness Subscriptions. We believe that these non-GAAP financial measures are useful to investors for period-to-period comparisons of our business and in understanding and evaluating our operating results because our management uses Subscription Contribution and Subscription Contribution Margin in conjunction with financial measures prepared in accordance with GAAP for planning purposes, including the preparation of our annual operating budget, as a measure of our core operating results and the effectiveness of our business strategy, and in evaluating our financial performance.
The use of Subscription Contribution and Subscription Contribution Margin as analytical tools has limitations, and you should not consider these in isolation or as substitutes for analysis of our financial results as reported under GAAP. Some of these limitations are as follows:
•Although depreciation and amortization expense are non-cash charges, the assets being depreciated and amortized may have to be replaced in the future, and Subscription Contribution and Subscription Contribution Margin do not reflect cash capital expenditure requirements for such replacements or for new capital expenditure requirements; and
•Subscription Contribution and Subscription Contribution Margin exclude stock-based compensation expense, which has recently been, and will continue to be for the foreseeable future, a significant recurring expense for our business and an important part of our compensation strategy.
Because of these limitations, Subscription Contribution and Subscription Contribution Margin should be considered along with other operating and financial performance measures presented in accordance with GAAP.
The following table presents a reconciliation of Subscription Contribution and Subscription Contribution Margin to Subscription Gross Profit and Subscription Gross Margin, respectively, which are the most directly comparable financial measures prepared in accordance with GAAP, for each of the periods indicated:
| | | | | | | | | | | | | | | | | |
| Three Months Ended June 30, | | Three Months Ended March 31, |
| 2025 | | 2024 | | 2025 |
| (dollars in millions) |
| Subscription Revenue | $ | 408.3 | | | $ | 431.4 | | | $ | 418.5 | |
| Less: Subscription Cost of revenue | 114.6 | | | 137.0 | | | 129.8 | |
| Subscription Gross Profit | $ | 293.7 | | | $ | 294.4 | | | $ | 288.8 | |
| Subscription Gross Margin | 71.9 | % | | 68.2 | % | | 69.0 | % |
| Add back: | | | | | |
| Depreciation and amortization expense | $ | 6.2 | | | $ | 8.1 | | | $ | 7.0 | |
| Stock-based compensation expense | 8.1 | | | 9.7 | | | 9.2 | |
| Subscription Contribution | $ | 307.9 | | | $ | 312.3 | | | $ | 304.9 | |
| Subscription Contribution Margin | 75.4 | % | | 72.4 | % | | 72.9 | % |
Free Cash Flow
We define Free Cash Flow as Net cash provided by (used in) operating activities less Capital expenditures. Free Cash Flow reflects an additional way of viewing our liquidity that, we believe, when viewed with our GAAP results, provides management, investors, and other users of our financial information with a more complete understanding of factors and trends affecting our cash flows.
The use of Free Cash Flow as an analytical tool has limitations due to the fact that it does not represent the residual cash flow available for discretionary expenditures. For example, Free Cash Flow does not incorporate payments made for purchases of marketable securities or principal repayments on our debt, which reduces cash available to us. Because of these limitations, Free Cash Flow should be considered along with other operating and financial performance measures presented in accordance with GAAP.
The following table presents a reconciliation of Free Cash Flow to Net cash provided by (used in) operating activities, the most directly comparable financial measure prepared in accordance with GAAP, for each of the periods indicated:
| | | | | | | | | | | | | | | | | | | | | | | | | | | | | |
| Three Months Ended June 30, | | Three Months Ended March 31, | | Three Months Ended December 31, | | Three Months Ended September 30, |
| 2025 | | 2024 | | 2025 | | 2024 | | 2024 |
| (in millions) |
| Net cash provided by operating activities | $ | 117.1 | | | $ | 32.7 | | | $ | 96.7 | | | $ | 106.7 | | | $ | 12.5 | |
| Capital expenditures | (4.7) | | | (6.7) | | | (2.1) | | | (0.7) | | | (1.8) | |
| Free Cash Flow | $ | 112.4 | | | $ | 26.0 | | | $ | 94.7 | | | $ | 106.0 | | | $ | 10.7 | |
Net Debt
We define Net Debt as Total debt less Cash and cash equivalents. Total debt consists of Current portion of debt, Convertible senior notes, net of current portion, and Term loan, net of current portion. Net debt reflects an additional way of viewing our liquidity that, we believe, when viewed with our GAAP results, provides management, investors, and other users of our financial information with a more complete understanding of factors and trends affecting our capital structure and balance sheet leverage.
Net debt has limitations as an analytical tool and may vary from similarly titled measures used by other companies. Because of this, Net debt should not be considered in isolation or as a substitute for an analysis of our financial measures prepared and presented in accordance with GAAP.
The following table presents a reconciliation of Net Debt to Total Debt, the most comparable financial measure prepared in accordance with GAAP, for each of the periods indicated:
| | | | | | | | | | | | | | | | | | | | | | | | | | | | | |
| June 30, 2025 | | March 31, 2025 | | December 31, 2024 | | September 30, 2024 | | June 30, 2024 |
| (in millions) |
| Current portion of debt | $ | 208.5 | | | $ | 208.2 | | | $ | 10.0 | | | $ | 10.0 | | | $ | 10.0 | |
| Convertible senior notes, net of current portion | 343.6 | | | 343.3 | | | 541.0 | | | 540.5 | | | 540.0 | |
| Term loan, net of current portion | 946.9 | | | 947.6 | | | 948.3 | | | 949.1 | | | 950.1 | |
| Total debt | 1,498.9 | | | 1,499.2 | | | 1,499.3 | | | 1,499.6 | | | 1,500.0 | |
| Less: Cash and cash equivalents | 1,039.5 | | | 914.3 | | | 829.0 | | | 722.3 | | | 697.6 | |
| Net Debt | $ | 459.4 | | | $ | 584.9 | | | $ | 670.3 | | | $ | 777.3 | | | $ | 802.4 | |
Change in Segment Measure of Profitability
Beginning in the first quarter of 2026, the Company is changing its measure of segment profitability to segment gross profit inclusive of allocated overhead costs. Allocated overhead costs include certain corporate overhead costs that support the Connected Fitness Products and Subscription segments, including a portion of depreciation, rent and occupancy charges related to the Company’s New York Headquarters, and personnel-related expenses for certain executives and departments. This change better aligns with the manner in which our chief operating decision maker expects to evaluate segment performance and make resource allocation decisions going forward.
For comparability purposes, the Company is providing supplemental historical segment financial information to reflect the new segment measure of profitability, which will be used going forward, and is reflected within the Company’s Q1 FY26 and Full Year FY26 outlook:
| | | | | | | | | | | | | | | | | |
| Q1 FY25 |
| As Reported | | Allocated Overhead Costs | | As Allocated |
| (in millions) |
| Gross Profit: | | | | | |
| Connected Fitness Products | $ | 14.6 | | | $ | (2.0) | | | $ | 12.6 | |
| Subscription | 289.1 | | | (3.8) | | | 285.3 | |
| Total Gross profit | $ | 303.8 | | | $ | (5.9) | | | $ | 297.9 | |
| Total Gross Margin | 51.8 | % | | | | 50.8 | % |
| | | | | | | | | | | | | | | | | |
| Q4 FY25 |
| As Reported | | Allocated Overhead Costs | | As Allocated |
| (in millions) |
| Gross Profit: | | | | | |
| Connected Fitness Products | $ | 34.4 | | | $ | (2.2) | | | $ | 32.3 | |
| Subscription | 293.7 | | | (4.5) | | | 289.2 | |
| Total Gross profit | $ | 328.1 | | | $ | (6.6) | | | $ | 321.5 | |
| Total Gross Margin | 54.1 | % | | | | 53.0 | % |
| | | | | | | | | | | | | | | | | |
| FY25 |
| As Reported | | Allocated Overhead Costs | | As Allocated |
| (in millions) |
| Gross Profit: | | | | | |
| Connected Fitness Products | $ | 111.2 | | | $ | (14.8) | | | $ | 96.4 | |
| Subscription | 1,157.1 | | | (17.4) | | | 1,139.7 | |
| Total Gross profit | $ | 1,268.3 | | | $ | (32.2) | | | $ | 1,236.1 | |
| Total Gross Margin | 50.9 | % | | | | 49.6 | % |
A reconciliation between reportable Total Gross Profit to consolidated (loss) income before provision for income tax is as follows:
| | | | | | | | | | | | | | | | | |
| |
| Q1 FY25 | | Q4 FY25 | | FY25 |
| (in millions) |
Total Gross Profit (As Allocated) | $ | 297.9 | | | $ | 321.5 | | | $ | 1,236.1 | |
| Allocated overhead costs | (5.9) | | | (6.6) | | | (32.2) | |
Total Gross Profit (As Reported) | $ | 303.8 | | | $ | 328.1 | | | $ | 1,268.3 | |
| Sales and marketing | (81.9) | | | (80.6) | | | (421.6) | |
| General and administrative | (119.5) | | | (125.1) | | | (527.3) | |
| Research and development | (58.5) | | | (55.8) | | | (234.2) | |
| | | | | |
| Impairment expense | (4.9) | | | (11.8) | | | (64.1) | |
| Restructuring expense | (2.9) | | | (25.2) | | | (33.8) | |
| Supplier settlements | (23.5) | | | — | | | (23.5) | |
| Total other expense, net | (12.6) | | | (7.0) | | | (79.3) | |
(Loss) income before income taxes | $ | — | | | $ | 22.6 | | | $ | (115.6) | |