| 1 Trademark of Trinseo PLC or its affiliates Second Quarter 2025 Financial Results & Full Year 2025 Outlook August 6, 2025 |
| 2 Introductions & Disclosure Rules Introductions • Frank Bozich, President & CEO • David Stasse, Executive Vice President & CFO • Bee van Kessel, Senior Vice President, Corporate Finance & Investor Relations Disclosure Rules This presentation may contain forward-looking statements including, without limitation, statements concerning plans, objectives, goals, projections, forecasts, strategies, future events or performance, and underlying assumptions and other statements, which are not statements of historical facts or guarantees or assurances of future performance. Forward-looking statements may be identified by the use of words like “expect,” “anticipate,” “believe,” “intend,” “forecast,” ”estimate,” “see,” “outlook,” “will,” “may,” “might,” “potential,” “likely,” “target,” “plan,” “contemplate,” “seek,” “attempt,” “should,” “could,” “would,” or expressions of similar meaning. Forward-looking statements reflect management’s evaluation of information currently available and are based on our current expectations and assumptions regarding our business, the economy, our current indebtedness, and other future conditions. Because forward-looking statements relate to the future, they are subject to inherent uncertainties, risks and changes in circumstances that are difficult to predict. Factors that might cause future results to differ from those expressed by the forward-looking statements include, but are not limited to, conditions in the global economy and capital markets, including recessionary conditions and the impact of tariffs on global trade relations; our ability to successfully generate cost savings through restructuring and cost reduction initiatives; our ability to successfully execute our business and transformation strategy; increased costs or disruption in the supply of raw materials; deterioration of our credit profile limiting our access to commercial credit; increased energy costs; the timing of, and our ability to complete, a sale of our interest in Americas Styrenics; compliance with laws and regulations impacting our business; any disruptions in production at our chemical manufacturing facilities, including those resulting from accidental spills or discharges; our current and future levels of indebtedness and our ability to service, repay or refinance our indebtedness; our ability to meet the covenants under our existing indebtedness; our ability to generate cash flows from operations and achieve our forecasted cash flows; and those discussed in our Annual Report on Form 10-K, under Part I, Item 1A —"Risk Factors" and elsewhere in our other reports, filings and furnishings made with the U.S. Securities and Exchange Commission from time to time. As a result of these or other factors, our actual results, performance or achievements may differ materially from those contemplated by the forward-looking statements. Therefore, we caution you against relying on any of these forward-looking statements. The forward-looking statements included in this presentation are made only as of the date hereof. We undertake no obligation to publicly update or revise any forward-looking statement as a result of new information, future events or otherwise, except as otherwise required by law. This presentation contains financial measures that are not in accordance with generally accepted accounting principles in the US (“GAAP”) including EBITDA, Adjusted EBITDA, Adjusted Net Income, Adjusted EPS and Free Cash Flow. We believe these measures provide relevant and meaningful information to investors and lenders about the ongoing operating results and liquidity position of the Company. Such measures when referenced herein should not be viewed as an alternative to GAAP measures of performance or liquidity, as applicable. We have provided a reconciliation of these measures to the most comparable GAAP metric alongside of the respective measure or otherwise in the Appendix section and in the accompanying press release. |
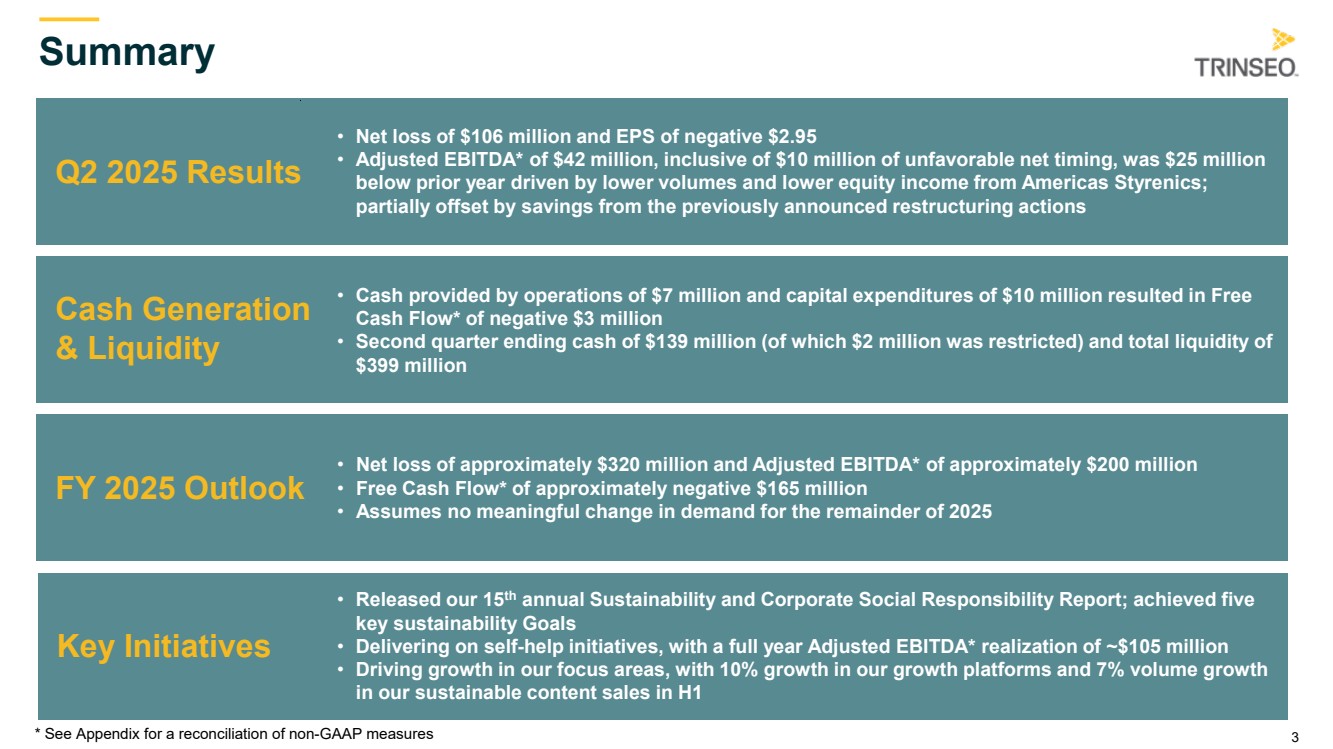
| 3 Summary Q2 2025 Results • Net loss of $106 million and EPS of negative $2.95 • Adjusted EBITDA* of $42 million, inclusive of $10 million of unfavorable net timing, was $25 million below prior year driven by lower volumes and lower equity income from Americas Styrenics; partially offset by savings from the previously announced restructuring actions * See Appendix for a reconciliation of non-GAAP measures Cash Generation & Liquidity • Cash provided by operations of $7 million and capital expenditures of $10 million resulted in Free Cash Flow* of negative $3 million • Second quarter ending cash of $139 million (of which $2 million was restricted) and total liquidity of $399 million FY 2025 Outlook • Net loss of approximately $320 million and Adjusted EBITDA* of approximately $200 million • Free Cash Flow* of approximately negative $165 million • Assumes no meaningful change in demand for the remainder of 2025 Key Initiatives • Released our 15th annual Sustainability and Corporate Social Responsibility Report; achieved five key sustainability Goals • Delivering on self-help initiatives, with a full year Adjusted EBITDA* realization of ~$105 million • Driving growth in our focus areas, with 10% growth in our growth platforms and 7% volume growth in our sustainable content sales in H1 |
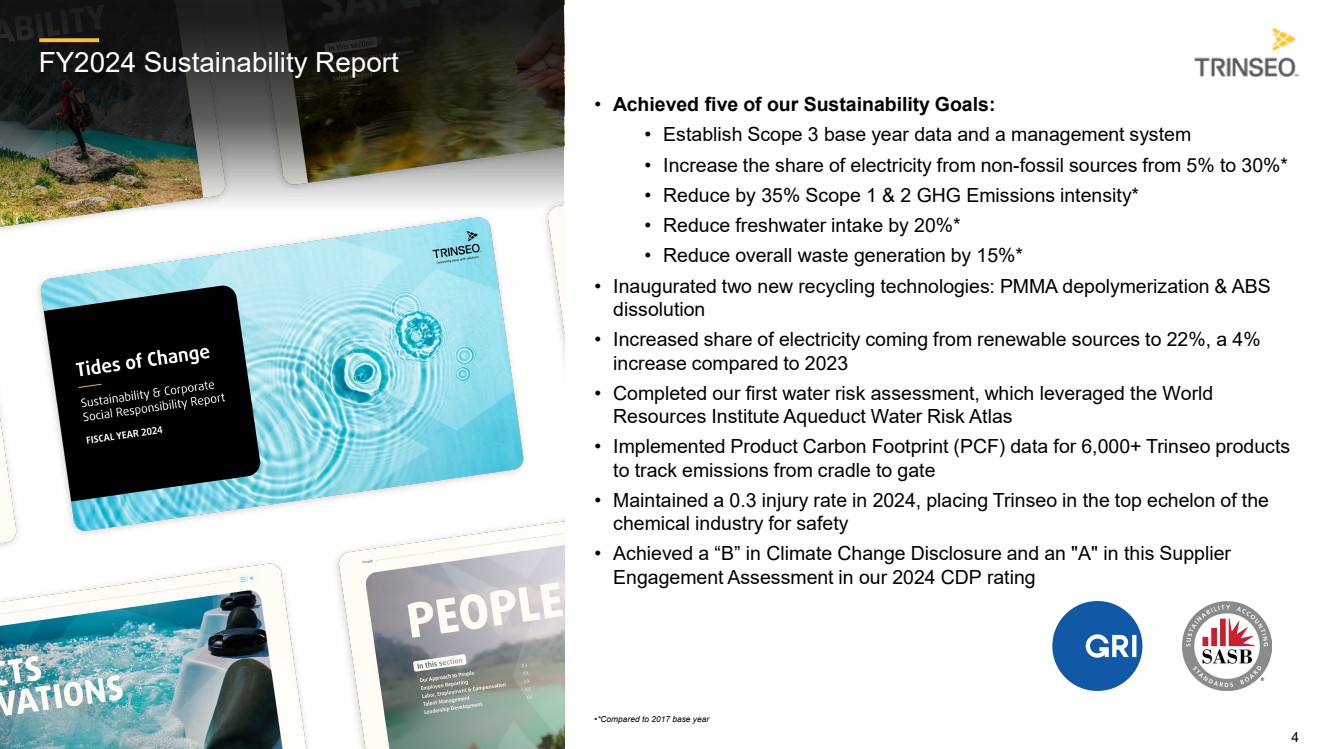
| 4 FY2024 Sustainability Report • Achieved five of our Sustainability Goals: • Establish Scope 3 base year data and a management system • Increase the share of electricity from non-fossil sources from 5% to 30%* • Reduce by 35% Scope 1 & 2 GHG Emissions intensity* • Reduce freshwater intake by 20%* • Reduce overall waste generation by 15%* • Inaugurated two new recycling technologies: PMMA depolymerization & ABS dissolution • Increased share of electricity coming from renewable sources to 22%, a 4% increase compared to 2023 • Completed our first water risk assessment, which leveraged the World Resources Institute Aqueduct Water Risk Atlas • Implemented Product Carbon Footprint (PCF) data for 6,000+ Trinseo products to track emissions from cradle to gate • Maintained a 0.3 injury rate in 2024, placing Trinseo in the top echelon of the chemical industry for safety • Achieved a “B” in Climate Change Disclosure and an "A" in this Supplier Engagement Assessment in our 2024 CDP rating •*Compared to 2017 base year |
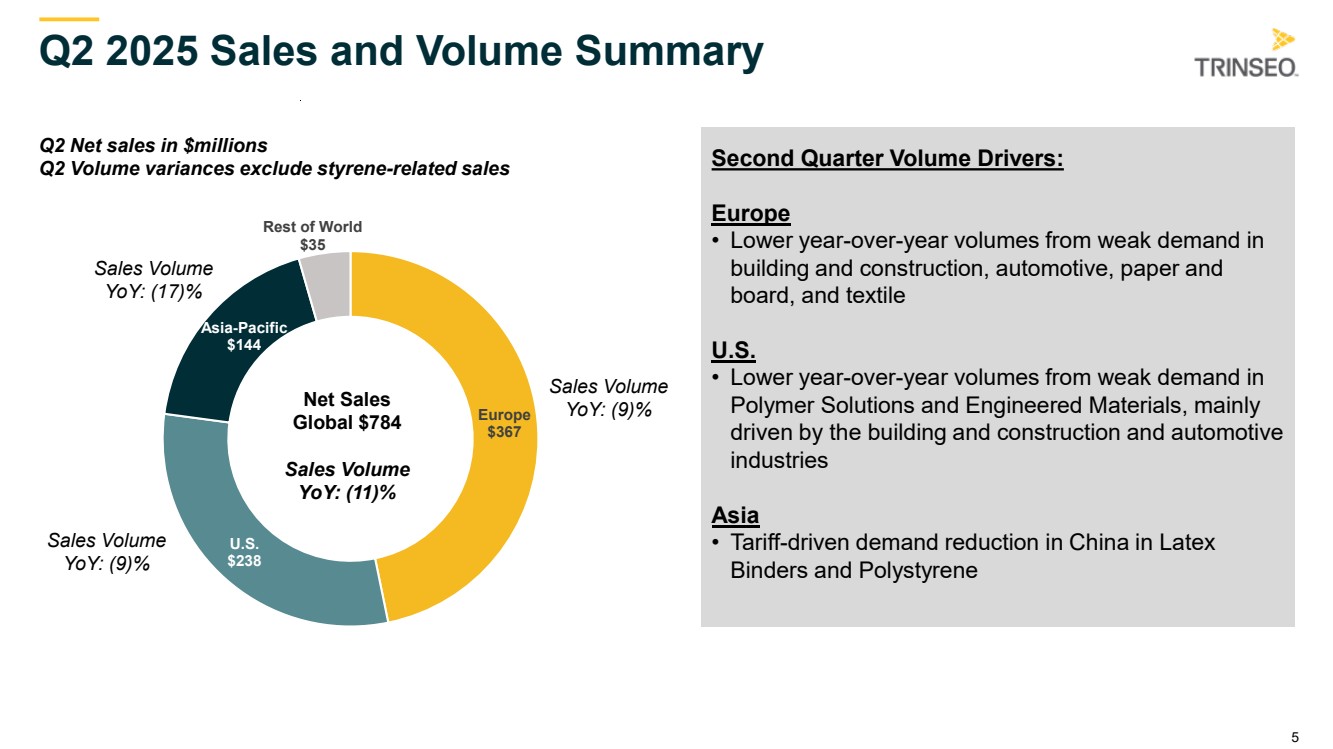
| 5 Europe $367 U.S. $238 Asia-Pacific $144 Rest of World $35 Q2 2025 Sales and Volume Summary Q2 Net sales in $millions Q2 Volume variances exclude styrene-related sales Second Quarter Volume Drivers: Europe • Lower year-over-year volumes from weak demand in building and construction, automotive, paper and board, and textile U.S. • Lower year-over-year volumes from weak demand in Polymer Solutions and Engineered Materials, mainly driven by the building and construction and automotive industries Asia • Tariff-driven demand reduction in China in Latex Binders and Polystyrene Net Sales Global $784 Sales Volume YoY: (11)% Sales Volume YoY: (9)% Sales Volume YoY: (17)% Sales Volume YoY: (9)% |
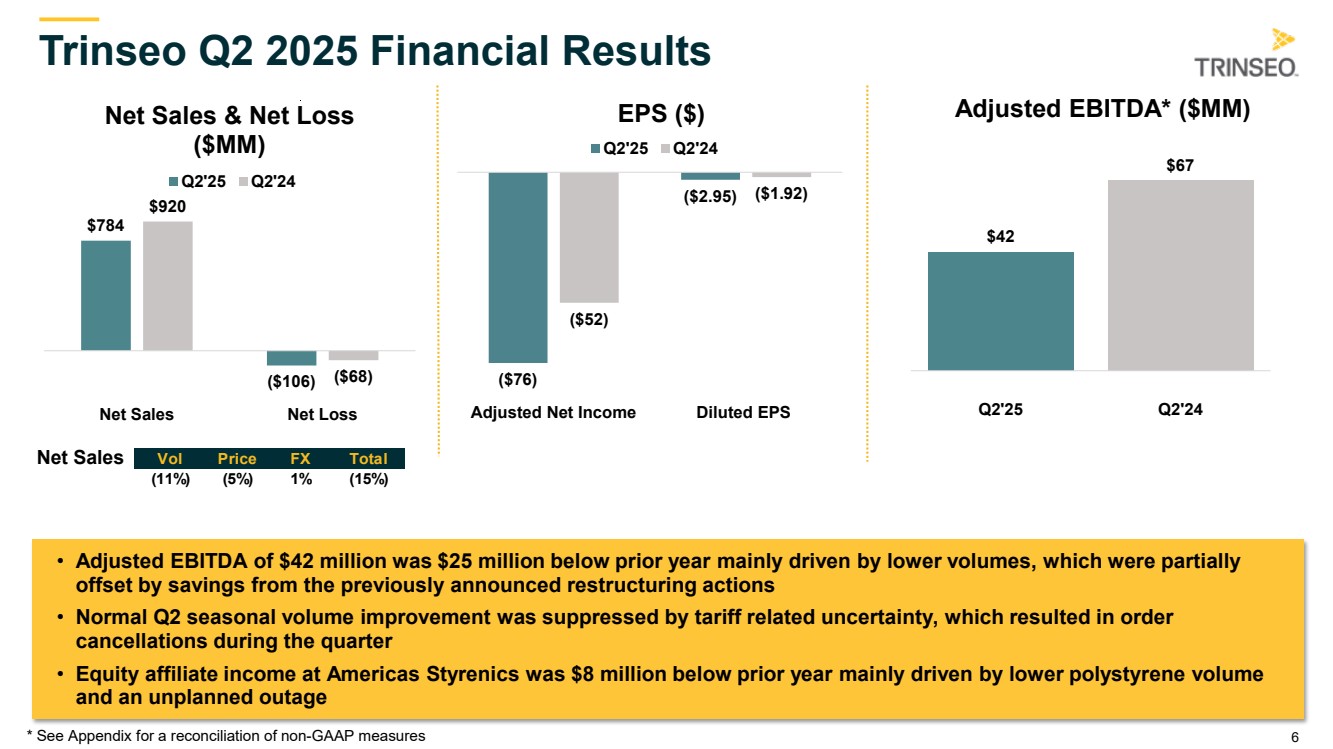
| 6 Trinseo Q2 2025 Financial Results $784 ($106) $920 ($68) Net Sales Net Loss Net Sales & Net Loss ($MM) Q2'25 Q2'24 ($76) ($2.95) ($52) ($1.92) Adjusted Net Income Diluted EPS EPS ($) Q2'25 Q2'24 $42 $67 Q2'25 Q2'24 Adjusted EBITDA* ($MM) Net Sales • Adjusted EBITDA of $42 million was $25 million below prior year mainly driven by lower volumes, which were partially offset by savings from the previously announced restructuring actions • Normal Q2 seasonal volume improvement was suppressed by tariff related uncertainty, which resulted in order cancellations during the quarter • Equity affiliate income at Americas Styrenics was $8 million below prior year mainly driven by lower polystyrene volume and an unplanned outage * See Appendix for a reconciliation of non-GAAP measures Vol Price FX Total (11%) (5%) 1% (15%) |
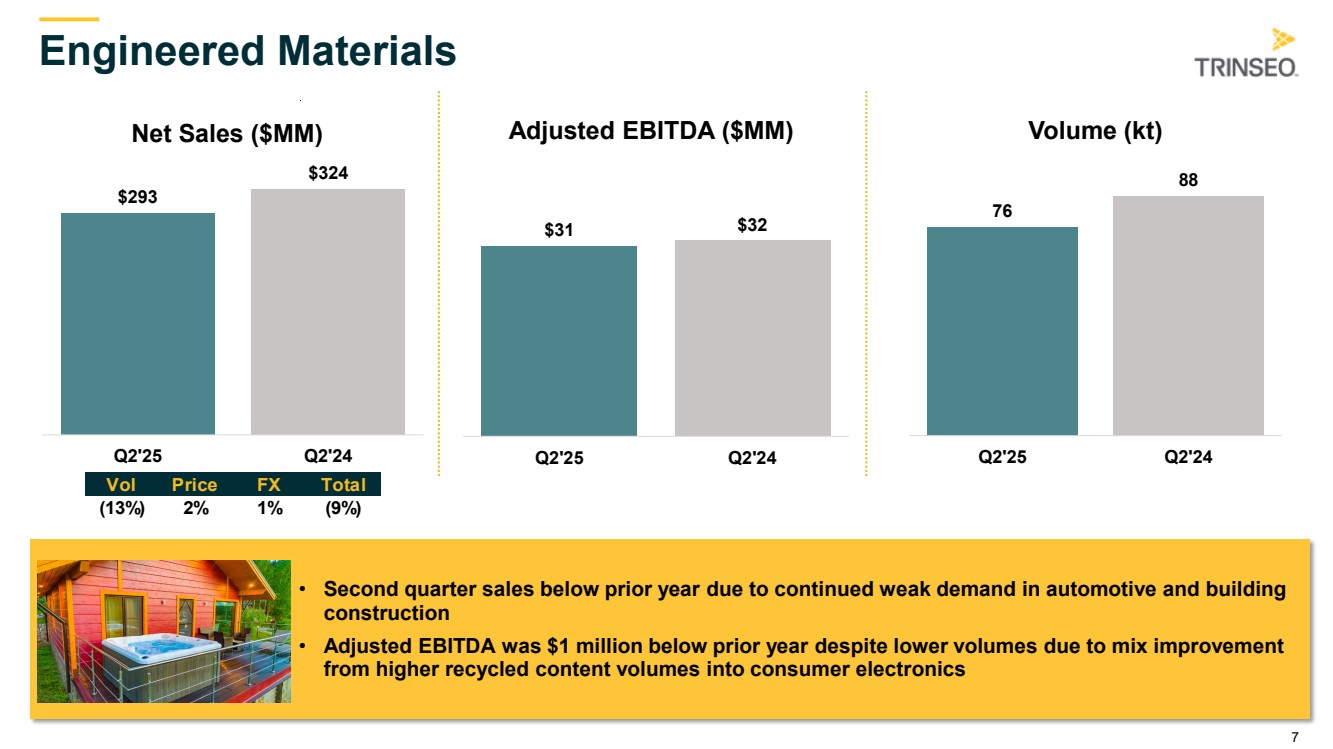
| 7 Engineered Materials • Second quarter sales below prior year due to continued weak demand in automotive and building construction • Adjusted EBITDA was $1 million below prior year despite lower volumes due to mix improvement from higher recycled content volumes into consumer electronics $293 $324 Q2'25 Q2'24 Net Sales ($MM) $31 $32 Q2'25 Q2'24 Adjusted EBITDA ($MM) 76 88 Q2'25 Q2'24 Volume (kt) Vol Price FX Total (13%) 2% 1% (9%) |
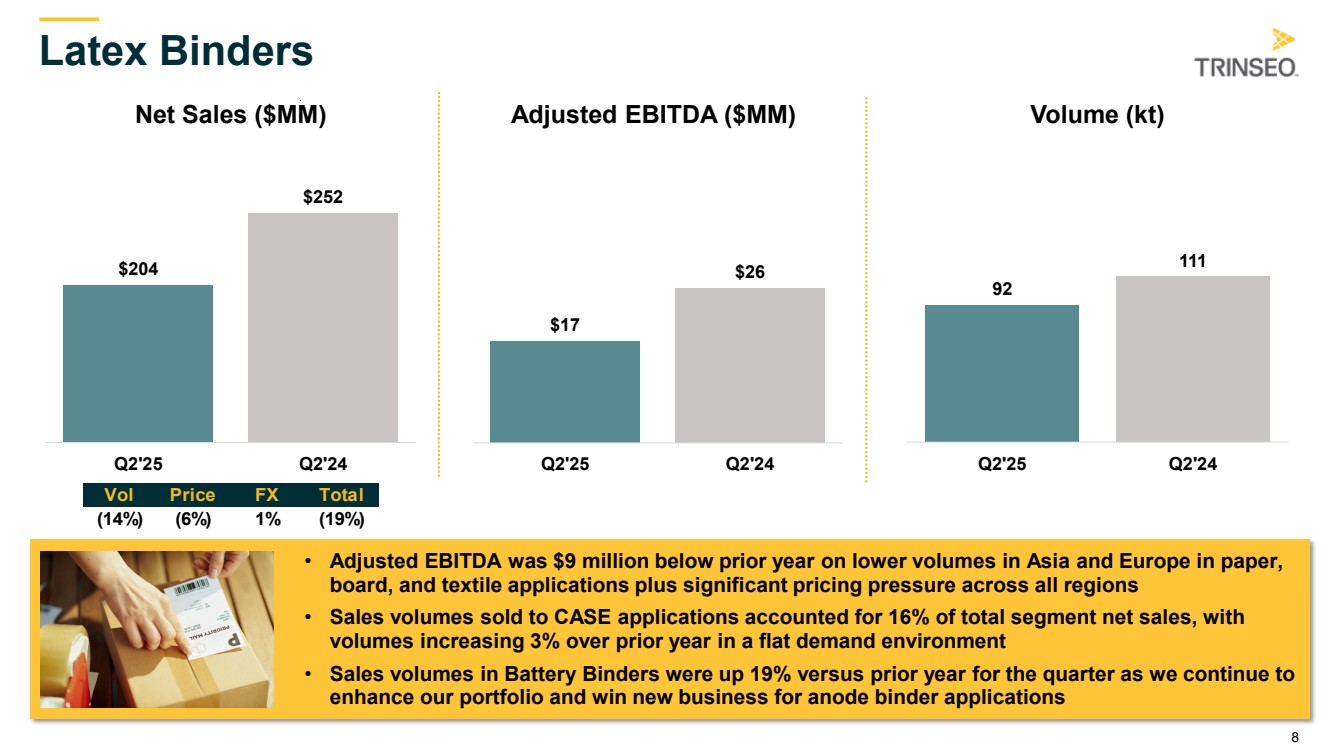
| 8 • Adjusted EBITDA was $9 million below prior year on lower volumes in Asia and Europe in paper, board, and textile applications plus significant pricing pressure across all regions • Sales volumes sold to CASE applications accounted for 16% of total segment net sales, with volumes increasing 3% over prior year in a flat demand environment • Sales volumes in Battery Binders were up 19% versus prior year for the quarter as we continue to enhance our portfolio and win new business for anode binder applications Latex Binders $204 $252 Q2'25 Q2'24 Net Sales ($MM) $17 $26 Q2'25 Q2'24 Adjusted EBITDA ($MM) 92 111 Q2'25 Q2'24 Volume (kt) Vol Price FX Total (14%) (6%) 1% (19%) |
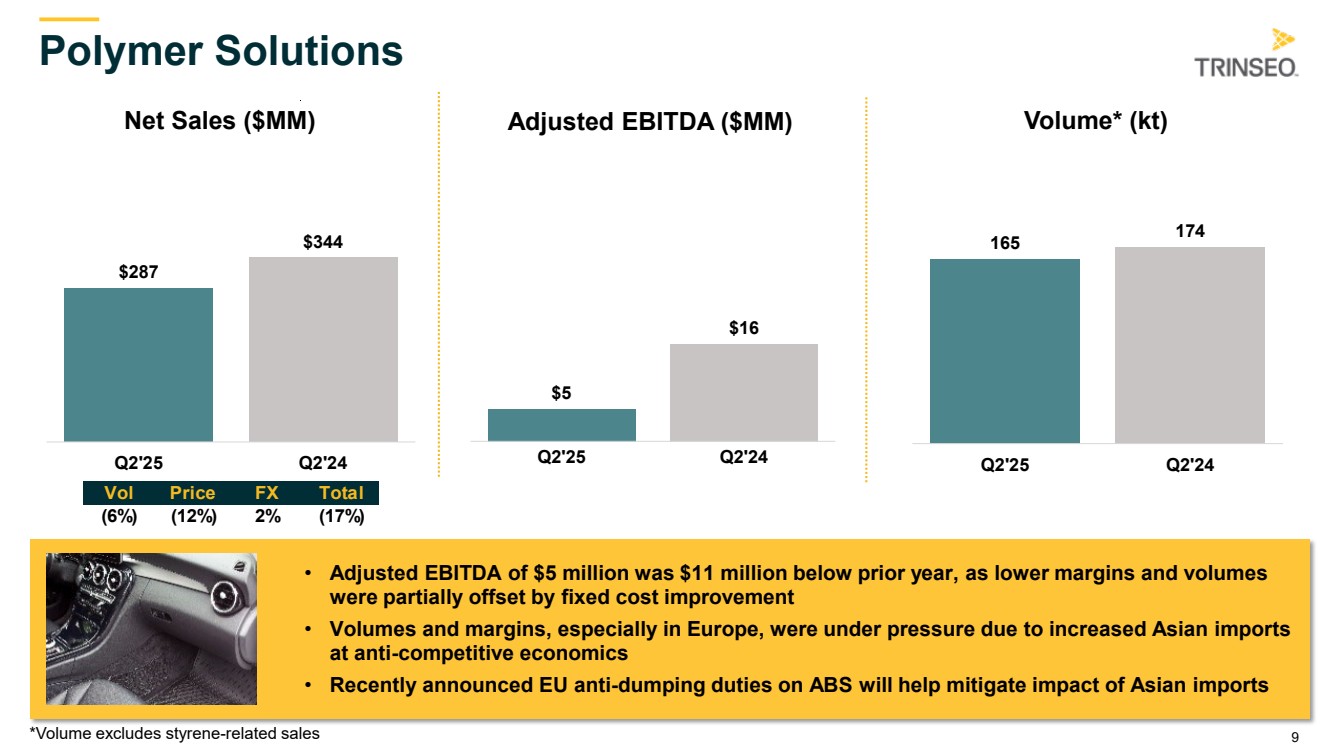
| 9 Polymer Solutions • Adjusted EBITDA of $5 million was $11 million below prior year, as lower margins and volumes were partially offset by fixed cost improvement • Volumes and margins, especially in Europe, were under pressure due to increased Asian imports at anti-competitive economics • Recently announced EU anti-dumping duties on ABS will help mitigate impact of Asian imports $287 $344 Q2'25 Q2'24 Net Sales ($MM) $5 $16 Q2'25 Q2'24 Adjusted EBITDA ($MM) 165 174 Q2'25 Q2'24 Volume* (kt) *Volume excludes styrene-related sales Vol Price FX Total (6%) (12%) 2% (17%) |
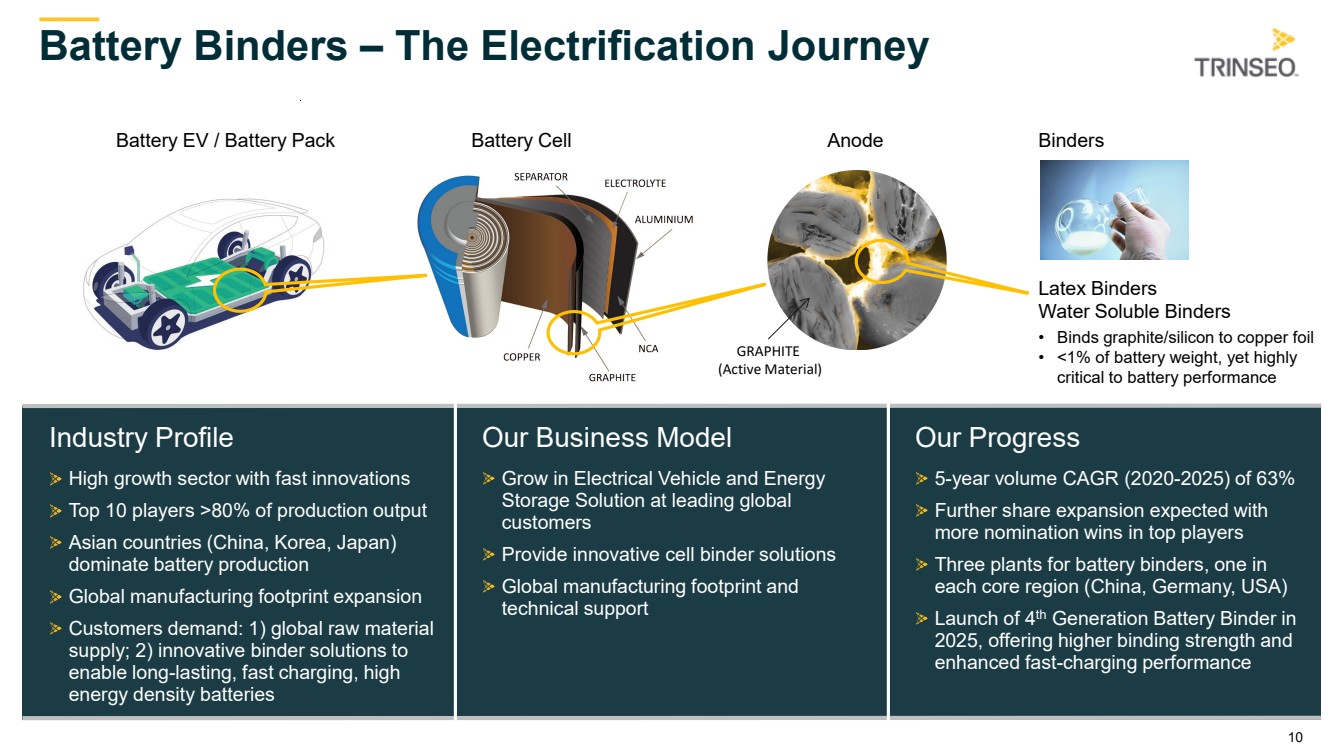
| 10 GRAPHITE (Active Material) Battery EV / Battery Pack Battery Cell Anode Binders Latex Binders Water Soluble Binders • Binds graphite/silicon to copper foil • <1% of battery weight, yet highly critical to battery performance Battery Binders – The Electrification Journey Our Progress 5-year volume CAGR (2020-2025) of 63% Further share expansion expected with more nomination wins in top players Three plants for battery binders, one in each core region (China, Germany, USA) Launch of 4th Generation Battery Binder in 2025, offering higher binding strength and enhanced fast-charging performance Industry Profile High growth sector with fast innovations Top 10 players >80% of production output Asian countries (China, Korea, Japan) dominate battery production Global manufacturing footprint expansion Customers demand: 1) global raw material supply; 2) innovative binder solutions to enable long-lasting, fast charging, high energy density batteries Our Business Model Grow in Electrical Vehicle and Energy Storage Solution at leading global customers Provide innovative cell binder solutions Global manufacturing footprint and technical support |
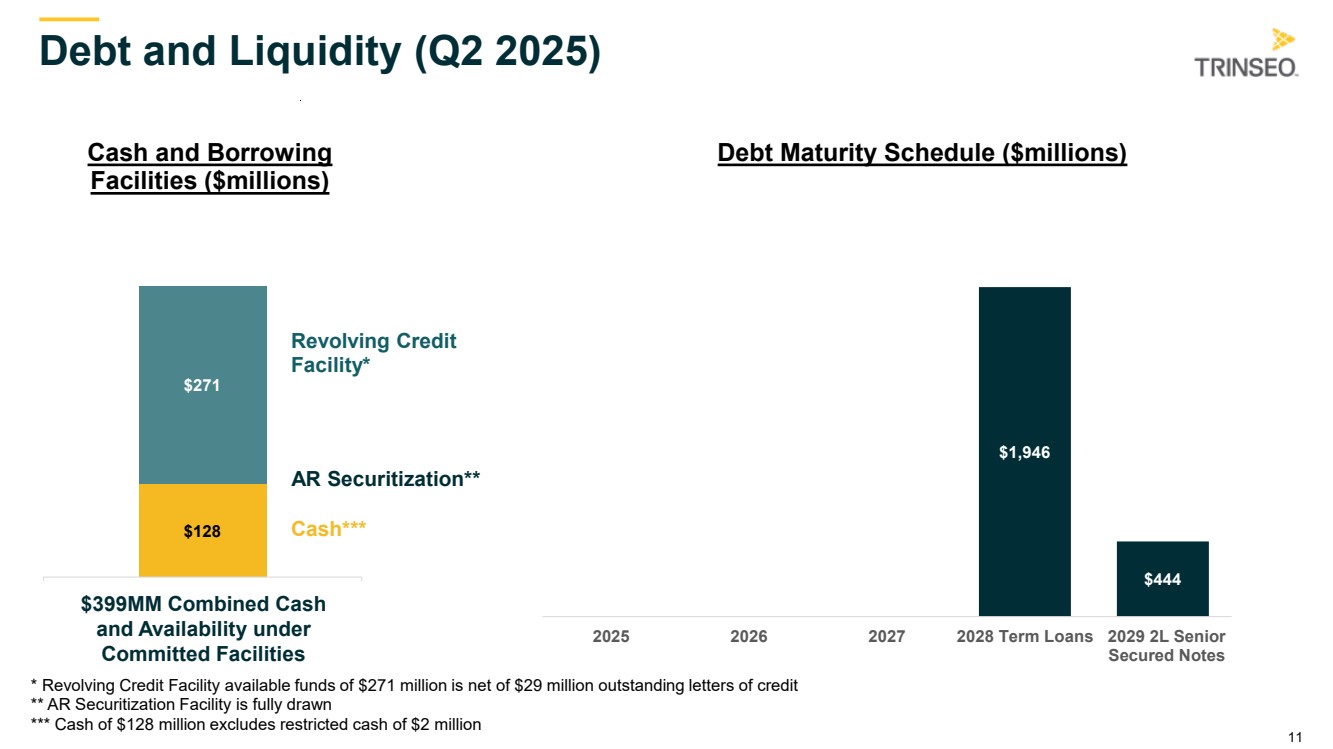
| 11 Debt and Liquidity (Q2 2025) Cash and Borrowing Debt Maturity Schedule ($millions) Facilities ($millions) Revolving Credit Facility* AR Securitization** Cash*** $399MM Combined Cash and Availability under Committed Facilities * Revolving Credit Facility available funds of $271 million is net of $29 million outstanding letters of credit ** AR Securitization Facility is fully drawn *** Cash of $128 million excludes restricted cash of $2 million $128 $271 $1,946 $444 2025 2026 2027 2028 Term Loans 2029 2L Senior Secured Notes |
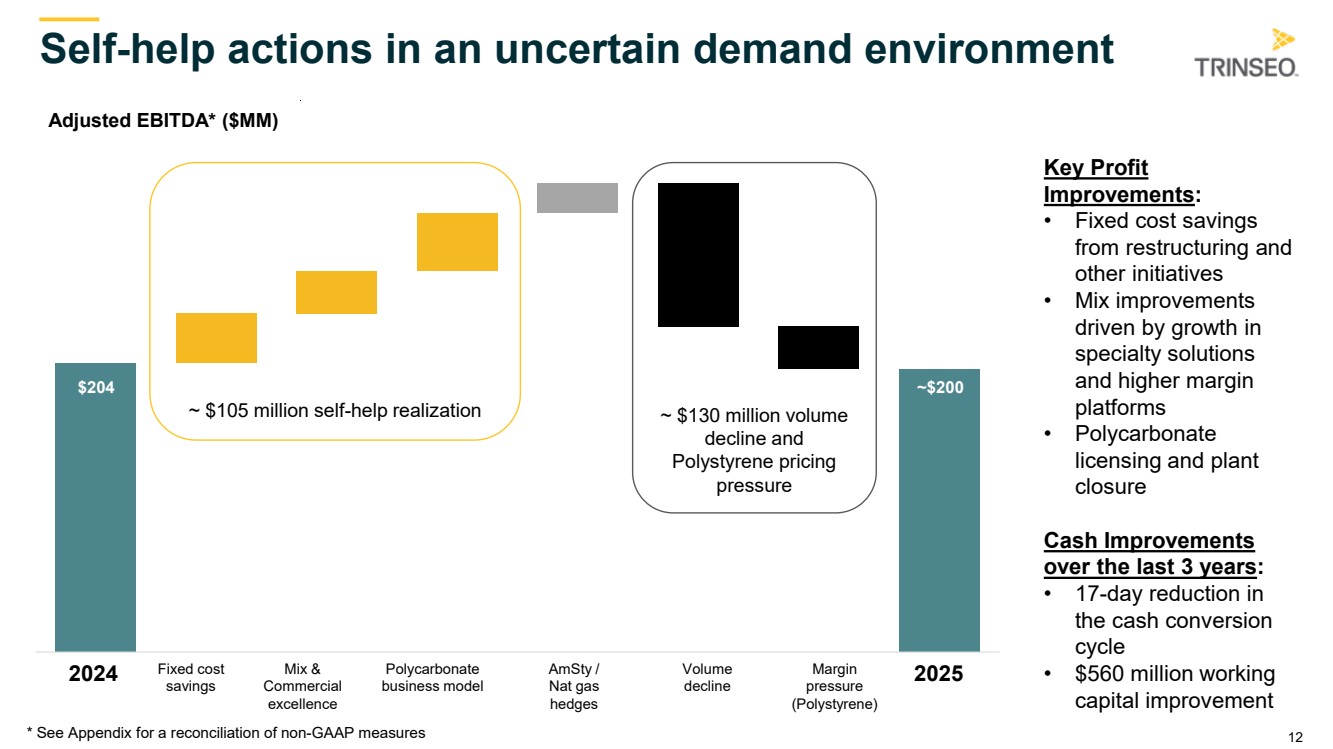
| 12 Adjusted EBITDA* ($MM) 2024 Fixed cost savings Mix & Commercial Excellence Polycarbonate Other Volume decline Margin pressure (Polystyrene) 2025 Self-help actions in an uncertain demand environment * See Appendix for a reconciliation of non-GAAP measures ~ $105 million self-help realization ~ $130 million volume decline and Polystyrene pricing pressure Key Profit Improvements: • Fixed cost savings from restructuring and other initiatives • Mix improvements driven by growth in specialty solutions and higher margin platforms • Polycarbonate licensing and plant closure Cash Improvements over the last 3 years: • 17-day reduction in the cash conversion cycle • $560 million working capital improvement $204 2024 2025 Fixed cost savings Mix & Commercial excellence Polycarbonate business model AmSty / Nat gas hedges Volume decline Margin pressure (Polystyrene) ~$200 |
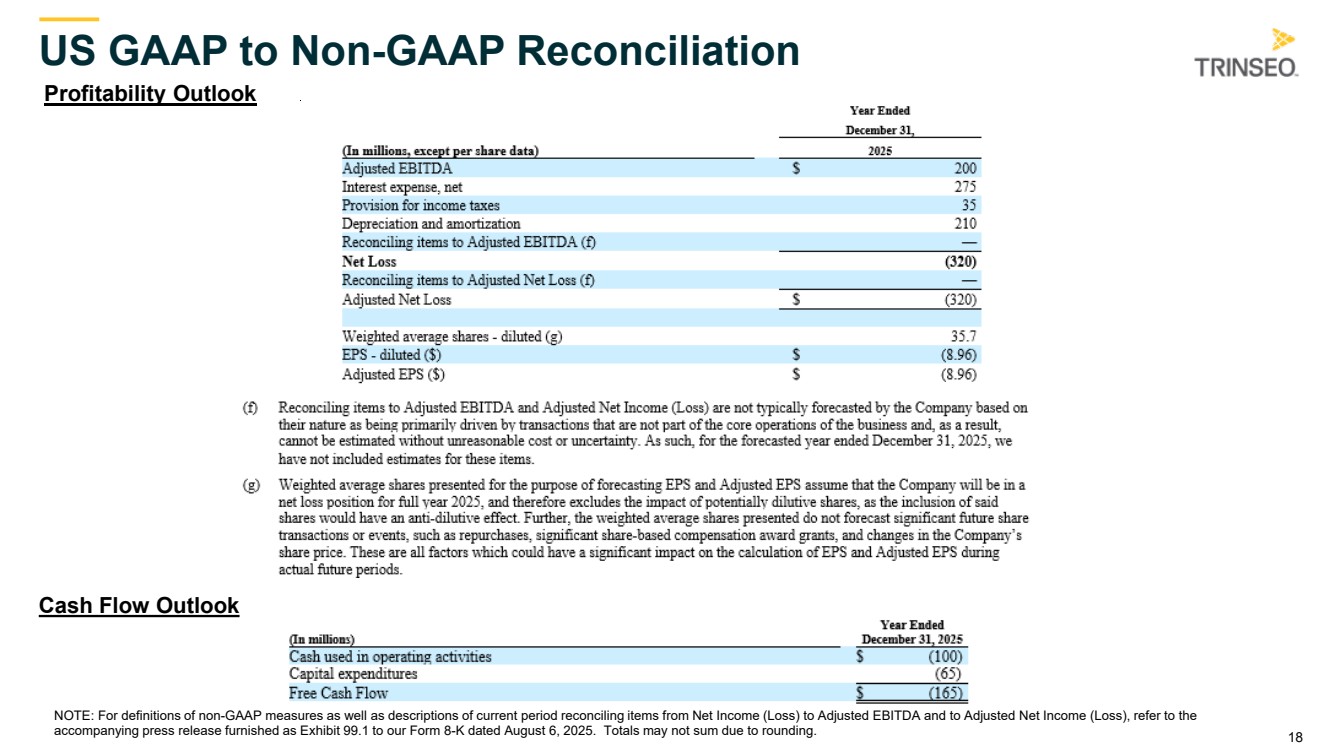
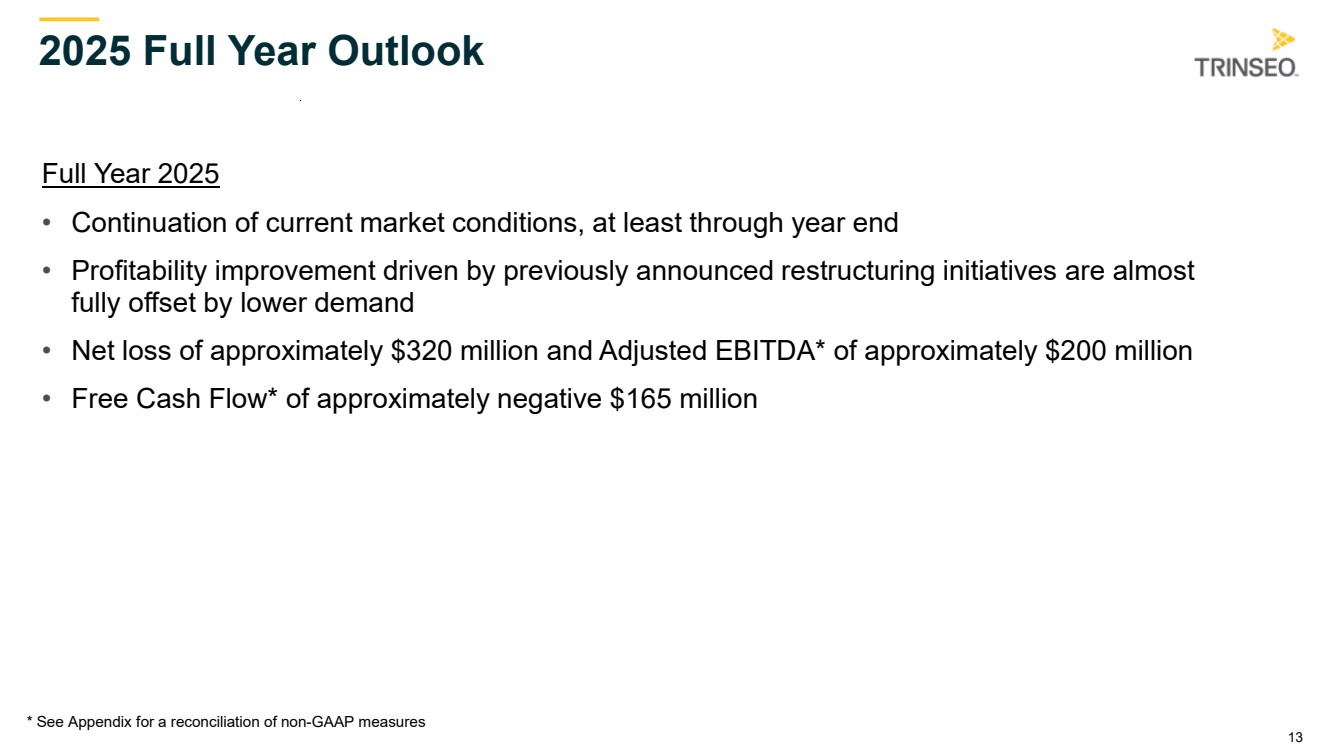
| 13 2025 Full Year Outlook Full Year 2025 • Continuation of current market conditions, at least through year end • Profitability improvement driven by previously announced restructuring initiatives are almost fully offset by lower demand • Net loss of approximately $320 million and Adjusted EBITDA* of approximately $200 million • Free Cash Flow* of approximately negative $165 million * See Appendix for a reconciliation of non-GAAP measures |
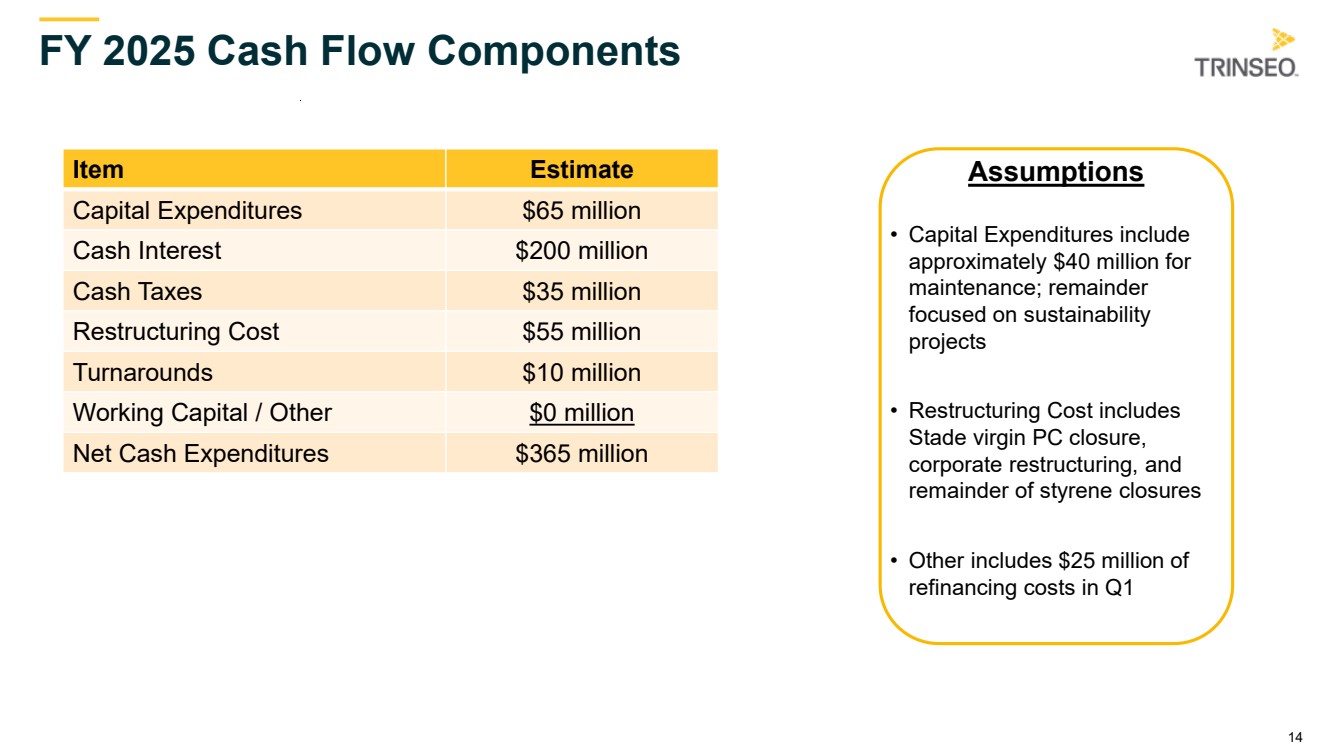
| 14 FY 2025 Cash Flow Components Item Estimate Capital Expenditures $65 million Cash Interest $200 million Cash Taxes $35 million Restructuring Cost $55 million Turnarounds $10 million Working Capital / Other $0 million Net Cash Expenditures $365 million Assumptions • Capital Expenditures include approximately $40 million for maintenance; remainder focused on sustainability projects • Restructuring Cost includes Stade virgin PC closure, corporate restructuring, and remainder of styrene closures • Other includes $25 million of refinancing costs in Q1 |
| 15 Appendix |

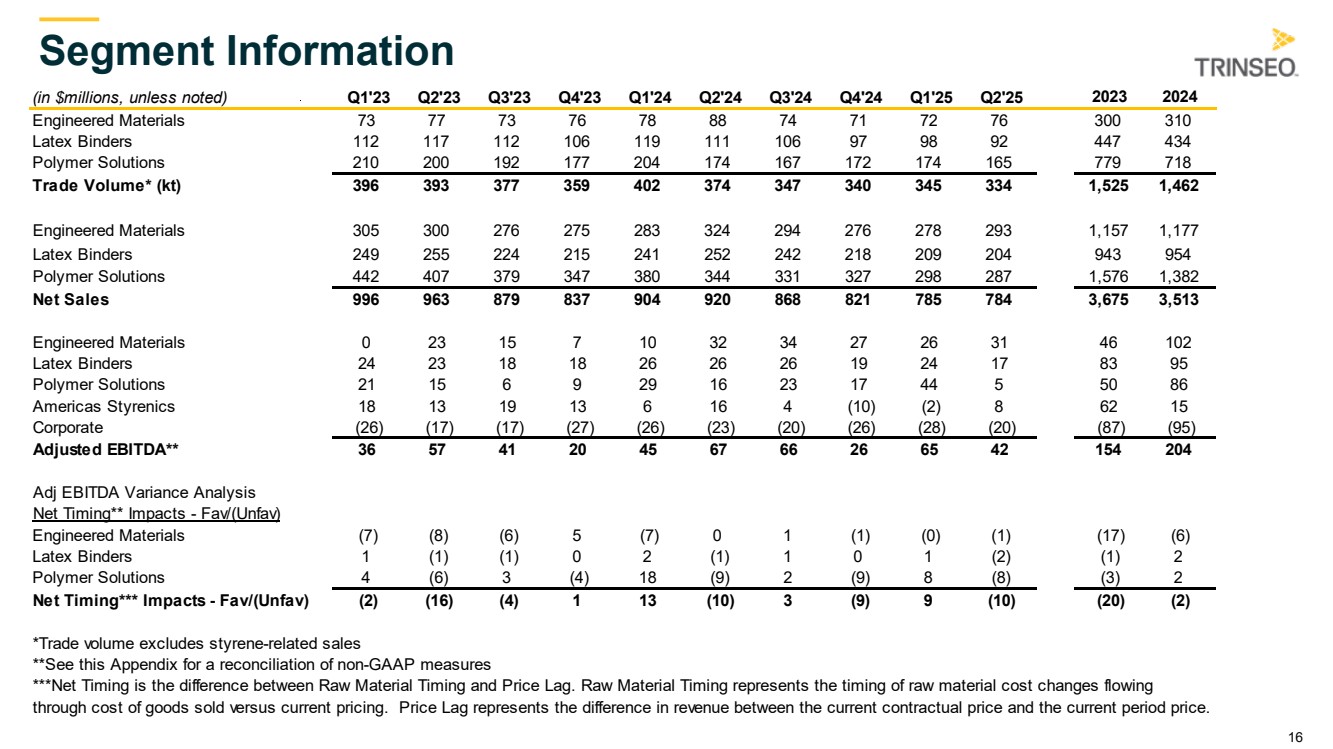
| 16 Segment Information (in $millions, unless noted) Q1'23 Q2'23 Q3'23 Q4'23 Q1'24 Q2'24 Q3'24 Q4'24 Q1'25 Q2'25 2023 2024 Engineered Materials 73 77 73 76 78 88 74 71 72 76 300 310 Latex Binders 112 117 112 106 119 111 106 97 98 92 447 434 Polymer Solutions 210 200 192 177 204 174 167 172 174 165 779 718 Trade Volume* (kt) 396 393 377 359 402 374 347 340 345 334 1,525 1,462 Engineered Materials 305 300 276 275 283 324 294 276 278 293 1,157 1,177 Latex Binders 249 255 224 215 241 252 242 218 209 204 943 954 Polymer Solutions 442 407 379 347 380 344 331 327 298 287 1,576 1,382 Net Sales 996 963 879 837 904 920 868 821 785 784 3,675 3,513 Engineered Materials 0 23 15 7 10 32 34 27 26 31 46 102 Latex Binders 24 23 18 18 26 26 26 19 24 17 83 95 Polymer Solutions 21 15 6 9 29 16 23 17 44 5 50 86 Americas Styrenics 18 13 19 13 6 16 4 (10) (2) 8 62 15 Corporate (26) (17) (17) (27) (26) (23) (20) (26) (28) (20) (87) (95) Adjusted EBITDA** 36 57 41 20 45 67 66 26 65 42 154 204 Adj EBITDA Variance Analysis Net Timing** Impacts - Fav/(Unfav) Engineered Materials (7) (8) (6) 5 (7) 0 1 (1) (0) (1) (17) (6) Latex Binders 1 (1) (1) 0 2 (1) 1 0 1 (2) (1) 2 Polymer Solutions 4 (6) 3 (4) 18 (9) 2 (9) 8 (8) (3) 2 Net Timing*** Impacts - Fav/(Unfav) (2) (16) (4) 1 13 (10) 3 (9) 9 (10) (20) (2) *Trade volume excludes styrene-related sales **See this Appendix for a reconciliation of non-GAAP measures ***Net Timing is the difference between Raw Material Timing and Price Lag. Raw Material Timing represents the timing of raw material cost changes flowing through cost of goods sold versus current pricing. Price Lag represents the difference in revenue between the current contractual price and the current period price. |
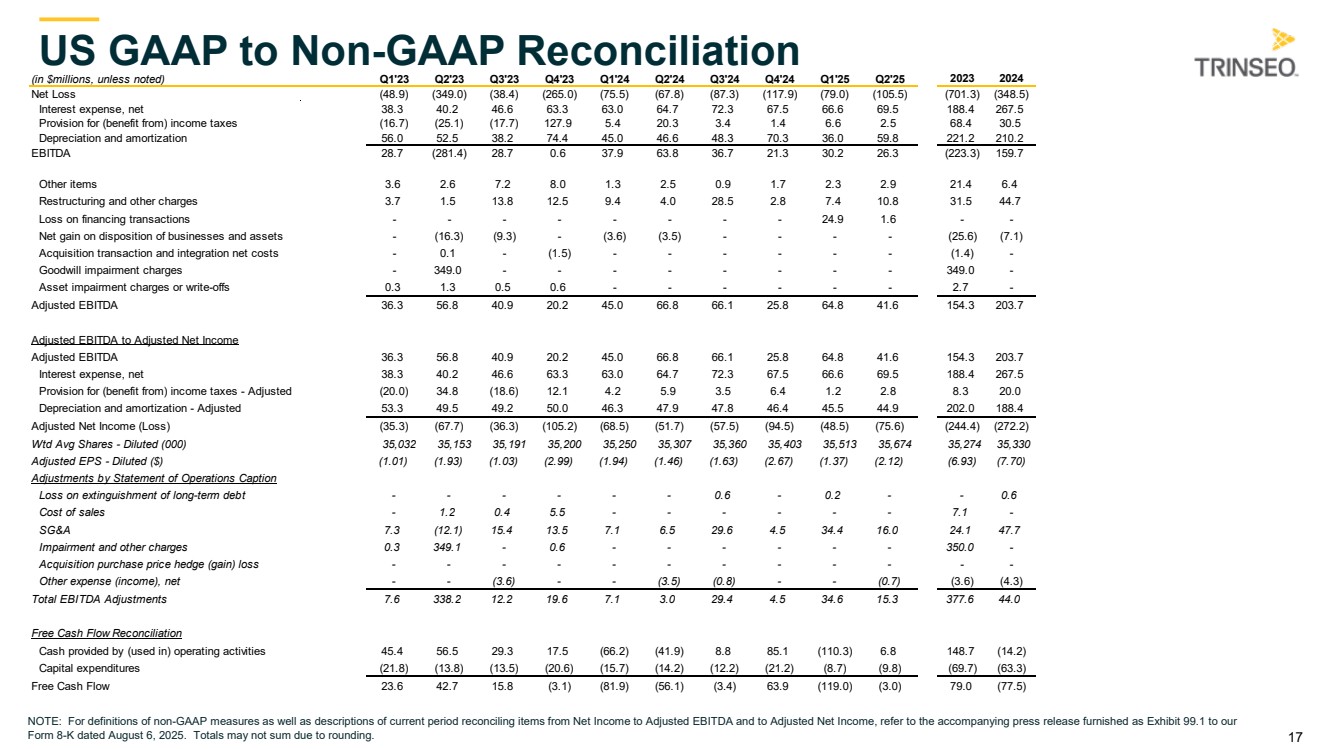
| 17 (in $millions, unless noted) Q1'23 Q2'23 Q3'23 Q4'23 Q1'24 Q2'24 Q3'24 Q4'24 Q1'25 Q2'25 2023 2024 Net Loss (48.9) (349.0) (38.4) (265.0) (75.5) (67.8) (87.3) (117.9) (79.0) (105.5) (701.3) (348.5) Interest expense, net 38.3 40.2 46.6 63.3 63.0 64.7 72.3 67.5 66.6 69.5 188.4 267.5 Provision for (benefit from) income taxes (16.7) (25.1) (17.7) 127.9 5.4 20.3 3.4 1.4 6.6 2.5 68.4 30.5 Depreciation and amortization 56.0 52.5 38.2 74.4 45.0 46.6 48.3 70.3 36.0 59.8 221.2 210.2 EBITDA 28.7 (281.4) 28.7 0.6 37.9 63.8 36.7 21.3 30.2 26.3 (223.3) 159.7 Other items 3.6 2.6 7.2 8.0 1.3 2.5 0.9 1.7 2.3 2.9 21.4 6.4 Restructuring and other charges 3.7 1.5 13.8 12.5 9.4 4.0 28.5 2.8 7.4 10.8 31.5 44.7 Loss on financing transactions - - - - - - - - 24.9 1.6 - - Net gain on disposition of businesses and assets - (16.3) (9.3) - (3.6) (3.5) - - - - (25.6) (7.1) Acquisition transaction and integration net costs - 0.1 - (1.5) - - - - - - (1.4) - Goodwill impairment charges - 349.0 - - - - - - - - 349.0 - Asset impairment charges or write-offs 0.3 1.3 0.5 0.6 - - - - - - 2.7 - Adjusted EBITDA 36.3 56.8 40.9 20.2 45.0 66.8 66.1 25.8 64.8 41.6 154.3 203.7 Adjusted EBITDA to Adjusted Net Income Adjusted EBITDA 36.3 56.8 40.9 20.2 45.0 66.8 66.1 25.8 64.8 41.6 154.3 203.7 Interest expense, net 38.3 40.2 46.6 63.3 63.0 64.7 72.3 67.5 66.6 69.5 188.4 267.5 Provision for (benefit from) income taxes - Adjusted (20.0) 34.8 (18.6) 12.1 4.2 5.9 3.5 6.4 1.2 2.8 8.3 20.0 Depreciation and amortization - Adjusted 53.3 49.5 49.2 50.0 46.3 47.9 47.8 46.4 45.5 44.9 202.0 188.4 Adjusted Net Income (Loss) (35.3) (67.7) (36.3) (105.2) (68.5) (51.7) (57.5) (94.5) (48.5) (75.6) (244.4) (272.2) Wtd Avg Shares - Diluted (000) 35,032 35,153 35,191 35,200 35,250 35,307 35,360 35,403 35,513 35,674 35,274 35,330 Adjusted EPS - Diluted ($) (1.01) (1.93) (1.03) (2.99) (1.94) (1.46) (1.63) (2.67) (1.37) (2.12) (6.93) (7.70) Adjustments by Statement of Operations Caption Loss on extinguishment of long-term debt - - - - - - 0.6 - 0.2 - - 0.6 Cost of sales - 1.2 0.4 5.5 - - - - - - 7.1 - SG&A 7.3 (12.1) 15.4 13.5 7.1 6.5 29.6 4.5 34.4 16.0 24.1 47.7 Impairment and other charges 0.3 349.1 - 0.6 - - - - - - 350.0 - Acquisition purchase price hedge (gain) loss - - - - - - - - - - - - Other expense (income), net - - (3.6) - - (3.5) (0.8) - - (0.7) (3.6) (4.3) Total EBITDA Adjustments 7.6 338.2 12.2 19.6 7.1 3.0 29.4 4.5 34.6 15.3 377.6 44.0 Free Cash Flow Reconciliation Cash provided by (used in) operating activities 45.4 56.5 29.3 17.5 (66.2) (41.9) 8.8 85.1 (110.3) 6.8 148.7 (14.2) Capital expenditures (21.8) (13.8) (13.5) (20.6) (15.7) (14.2) (12.2) (21.2) (8.7) (9.8) (69.7) (63.3) Free Cash Flow 23.6 42.7 15.8 (3.1) (81.9) (56.1) (3.4) 63.9 (119.0) (3.0) 79.0 (77.5) US GAAP to Non-GAAP Reconciliation NOTE: For definitions of non-GAAP measures as well as descriptions of current period reconciling items from Net Income to Adjusted EBITDA and to Adjusted Net Income, refer to the accompanying press release furnished as Exhibit 99.1 to our Form 8-K dated August 6, 2025. Totals may not sum due to rounding. |
| 18 US GAAP to Non-GAAP Reconciliation NOTE: For definitions of non-GAAP measures as well as descriptions of current period reconciling items from Net Income (Loss) to Adjusted EBITDA and to Adjusted Net Income (Loss), refer to the accompanying press release furnished as Exhibit 99.1 to our Form 8-K dated August 6, 2025. Totals may not sum due to rounding. Profitability Outlook Cash Flow Outlook |