The PEO and NEOs included in the below compensation columns reflect the following:
Fiscal Year |
| PEO |
| NEOs |
2025 |
| Sean Connolly |
| Dave Marberger, Noelle O’Mara, Tom McGough, Alexandre Eboli |
2024 |
| Sean Connolly |
| Dave Marberger, Tom McGough, Darren Serrao, Alexandre Eboli |
2023 |
| Sean Connolly |
| Dave Marberger, Tom McGough, Darren Serrao, Charisse Brock |
2022 |
| Sean Connolly |
| Dave Marberger, Tom McGough, Darren Serrao, Alexandre Eboli |
2021 |
| Sean Connolly |
| Dave Marberger, Tom McGough, Darren Serrao, Colleen Batcheler |
|
|
|
|
|
|
|
| |||||||||
Average | Average | Value of Initial Fixed $100 | ||||||||||||||
Summary | Summary | Compensation | Investment Based On: | Company | ||||||||||||
Compensation | Compensation | Compensation | Actually Paid | Total Shareholder | TSR (S&P 500 | Net | Selected | |||||||||
Table Total for | Actually Paid | Table Total for | to Non-PEO | Return (TSR), | Packaged | Income | Measure: | |||||||||
Fiscal | PEO(1) | to PEO(2) |
| Non-PEO NEOs(3) |
| NEOs(4) | Conagra | Foods Index) | ($in |
| Adj. EPS(5) | |||||
Year | ($) | ($) |
| ($) | ($) | ($) | ($) | millions) |
| ($) | ||||||
2025 |
| 13,140,480 | (2,249,801) | 4,351,113 | 1,208,320 | 78.60 | 113.33 | 1,152.5 | 2.02 | |||||||
2024 |
| 24,030,226 | 7,319,776 | 4,304,712 | 1,400,454 | 100.95 | 123.88 | 347.7 | 2.67 | |||||||
2023 | 18,720,100 | 31,185,315 | 4,441,115 | 6,840,948 | 110.86 | 137.44 | 683.2 | 2.77 | ||||||||
2022 | 11,947,054 | (896,941) | 3,114,508 | 635,033 | 101.71 | 124.42 | 888.2 | 2.41 | ||||||||
2021 |
| 11,770,023 | 24,526,984 | 3,160,545 | 5,554,173 | 112.71 | 118.79 | 1,300.9 | 2.66 | |||||||
(1) | The amounts reported in this column reflect the total compensation reported for Conagra Brands’ principal executive officer (PEO), Mr. Connolly, for each corresponding year in the “Total” column of the Summary Compensation Table (Total compensation). Refer to “Executive Compensation—Summary Compensation Table—Fiscal 2025” above. |
(2) | The amounts reported in this column represent the compensation actually paid (or CAP) to Mr. Connolly in accordance with Item 402(v) of Regulation S-K. The amounts do not reflect the actual amount of compensation earned or paid to Mr. Connolly during the applicable year. In accordance with the requirements of Item 402(v) of Regulation S-K, the adjustments shown in the first table following footnote 4 below were made to Mr. Connolly’s Total compensation for each year to determine the CAP. |
(3) | The amounts reported in this column reflect the average Total compensation reported for the non-PEO NEOs for each corresponding year in the “Total” column of the Summary Compensation Table. “Executive Compensation—Summary Compensation Table—Fiscal 2025” above. |
(4) | The amounts reported in this column represent the average of CAP for the non-PEO NEOs in accordance with Item 402(v) of Regulation S-K. The amounts do not reflect the actual amount of compensation earned or paid to such non-PEO NEOs during the applicable year. In accordance with the requirements of Item 402(v) of Regulation S-K, the adjustments shown in the second table below were made to the average Total compensation for the non-PEO NEOs for each year to determine the CAP. |
(5) | Adjusted EPS, our Company-Selected Measure, has been selected by the Committee to be the 70% weighted metric for our fiscal 2025 to 2027 Performance Shares as a financial metric that is aligned with the Company’s strategic plan. EPS is our earnings per share, adjusted pursuant to pre-established guidelines approved by the Committee as described in “Other Compensation Policies, Programs, and Practices—Use of Adjustments in Incentive Programs” in the “Compensation Discussion and Analysis” above. |
Adjustments for PEO:
| Summary |
|
|
| ||||
Compensation Table | Value of Equity | Equity Award | Compensation | |||||
Fiscal | Total(1) | Stock Awards(a) | Adjustments(b) | Actually Paid | ||||
Year | ($) | ($) | ($) | ($) | ||||
2025 | 13,140,480 | (9,274,089) | (6,116,192) | (2,249,801) | ||||
2024 |
| 24,030,226 | (18,854,433) | 2,143,983 | 7,319,776 | |||
2023 | 18,720,100 | (14,444,447) | 26,909,662 | 31,185,315 | ||||
2022 | 11,947,054 | (7,976,396) | (4,867,599) | (896,941) | ||||
2021 |
| 11,770,023 | (7,722,276) | 20,479,237 | 24,526,984 |
(a) | The reported value of equity awards represents the grant date fair value of equity awards as reported in the Stock Awards column in the Summary Compensation Table for the applicable year. The Company has not granted option awards since 2016. |
(b) | The equity award adjustments for each applicable year include the addition (or subtraction) of the amount of change in fair value as of the end of the applicable year (from the end of the prior fiscal year) of any awards granted in prior years that are outstanding and unvested as of the end of the applicable year. For awards granted in prior years that vest in the applicable year, the amount of change in fair value as of the vesting date (from the end of the prior fiscal year) is included. The dollar value of any dividends paid on stock awards in the applicable year of the vesting date that are not otherwise reflected in the fair value or included in any other component of total compensation for the applicable year is included. The RSU fair value was estimated by discounting the fair value of the RSUs based on the dividend yield. These adjustments are listed in the tables below. |
Equity Award Adjustments for PEO:
|
|
| + Fair Value as |
| +/- Year Over Year |
| - Fair Value at the |
| + Value of Dividends |
| ||||
of Vesting | Change in Fair | End of Prior | or Other Earnings | |||||||||||
+ Year End | +/- Year Over | Date of | Value of Equity | Year of Equity | Paid on Stock or | |||||||||
Fair Value of | Year Change | Equity | Awards | Awards that | Option Awards Not | |||||||||
Equity | in Fair Value | Awards | Granted in | Failed to Meet | Otherwise | |||||||||
Awards | of Outstanding | Granted and | Prior Years that | Vesting | Reflected in Fair | Total Equity | ||||||||
Granted in | and Unvested | Vested in | Vested in | Conditions in | Value or Total | Award | ||||||||
Fiscal | the Year | Equity Awards | the Year | the Year | the Year | Compensation | Adjustments | |||||||
Year | ($) | ($) | ($) | ($) | ($) | ($) | ($) | |||||||
2025 |
| 3,633,642 | (10,871,004) | 0 | 323,371 | 0 | 797,799 | (6,116,192) | ||||||
2024 |
| 14,078,130 | (12,174,855) | 0 | (608,262) | 0 | 848,970 | 2,143,983 | ||||||
2023 | 17,612,830 | 9,236,755 | 0 | 60,077 | 0 | 0 | 26,909,662 | |||||||
2022 | 7,782,827 | (12,567,296) | 0 | (887,971) | 0 | 804,841 | (4,867,599) | |||||||
2021 |
| 10,009,874 | 8,842,267 | 0 | 727,186 | 0 | 899,910 | 20,479,237 |
Average Adjustments for Non-PEO NEOs:
|
|
|
| |||||||||
Summary | Change in Actuarial | Aggregate Service | ||||||||||
Compensation Table | Value of Equity | Equity Award | Present Value | Cost for Pension | Compensation | |||||||
Total(1) | Stock Awards(a) | Adjustments(b) | of Pension Benefits | Benefits | Actually Paid | |||||||
Fiscal Year | ($) | ($) | ($) | ($) | ($) | ($) | ||||||
2025 |
| 4,351,113 | (2,943,547) | (198,449) | (797) | 0 | 1,208,320 | |||||
2024 |
| 4,304,712 | (2,545,927) | (355,104) | (3,227) | 0 | 1,400,454 | |||||
2023 | 4,441,115 | (2,994,018) | 5,393,851 | 0 | 0 | 6,840,948 | ||||||
2022 | 3,114,508 | (1,641,750) | (837,725) | 0 | 0 | 635,033 | ||||||
2021 |
| 3,160,545 | (1,594,274) | 3,987,902 | 0 | 0 | 5,554,173 |
(a) | The reported value of equity awards represents the grant date fair value of equity awards as reported in the Stock Awards column in the Summary Compensation Table for the applicable year. The Company has not granted option awards since 2016. |
(b) | The equity award adjustments for each applicable year include the addition (or subtraction) of the amount of change in fair value as of the end of the applicable year (from the end of the prior fiscal year) of any awards granted in prior years that are outstanding and unvested as of the end of the applicable year. For awards granted in prior years that vest in the applicable year, the amount of change in fair value as of the vesting date (from the end of the prior fiscal year) is included. The dollar value of any dividends paid on stock awards in the applicable year of the vesting date that are not otherwise reflected in the fair value or included in any other component of total compensation for the applicable year is included. The RSU fair value was estimated by discounting the fair value of the RSUs based on the dividend yield. These adjustments are listed in the tables below. |
Average Equity Award Adjustments for Non-PEO NEOs:
|
|
|
| +/- Year Over |
|
|
| |||||||
+ Fair Value as | Year Change | - Fair Value at the | + Value of Dividends | |||||||||||
of Vesting | in Fair | End of Prior | or Other Earnings | |||||||||||
+/- Year Over | Date of | Value of Equity | Year of Equity | Paid on Stock or | ||||||||||
+ Year End | Year Change | Equity | Awards | Awards that | Option Awards | |||||||||
Fair Value of | in Fair Value | Awards | Granted in | Failed to Meet | Not Otherwise | |||||||||
Equity Awards | of Outstanding | Granted and | Prior Years that | Vesting | Reflected in Fair | Total Equity | ||||||||
Granted in | and Unvested | Vested in | Vested in | Conditions in | Value or Total | Award | ||||||||
Fiscal | the Year | Equity Awards | the Year | the Year | the Year | Compensation | Adjustments | |||||||
Year | ($) | ($) | ($) | ($) | ($) | ($) | ($) | |||||||
2025 | 1,332,089 | (1,752,025) | 0 | 63,597 | 0 | 157,890 | (198,449) | |||||||
2024 |
| 1,972,698 | (2,378,717) | 0 | (124,344) | 0 | 175,259 | (355,104) | ||||||
2023 | 3,650,755 | 1,731,832 | 0 | 11,264 | 0 | 0 | 5,393,851 | |||||||
2022 | 1,607,110 | (2,428,521) | 0 | (174,172) | 0 | 157,858 | (837,725) | |||||||
2021 |
| 2,066,549 | 1,556,684 | 0 | 165,328 | 0 | 199,341 | 3,987,902 |
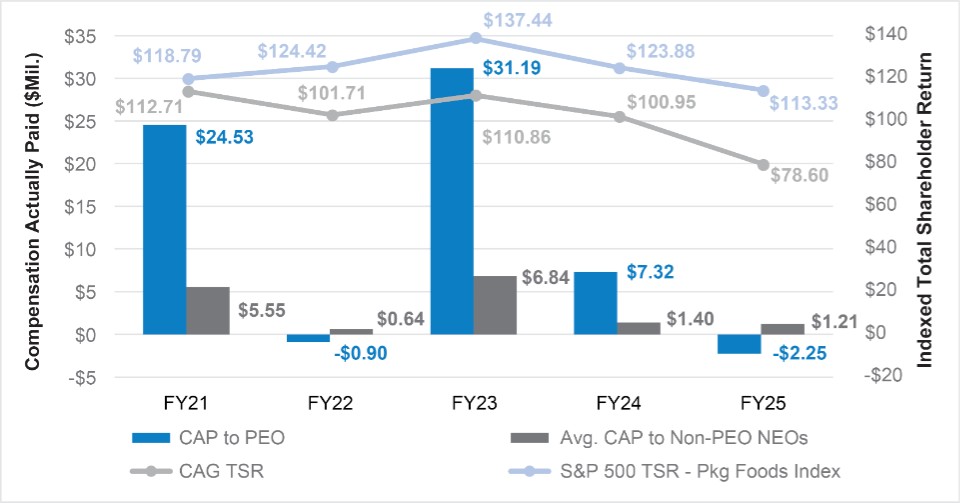
COMPENSATION ACTUALLY PAID VS TSR
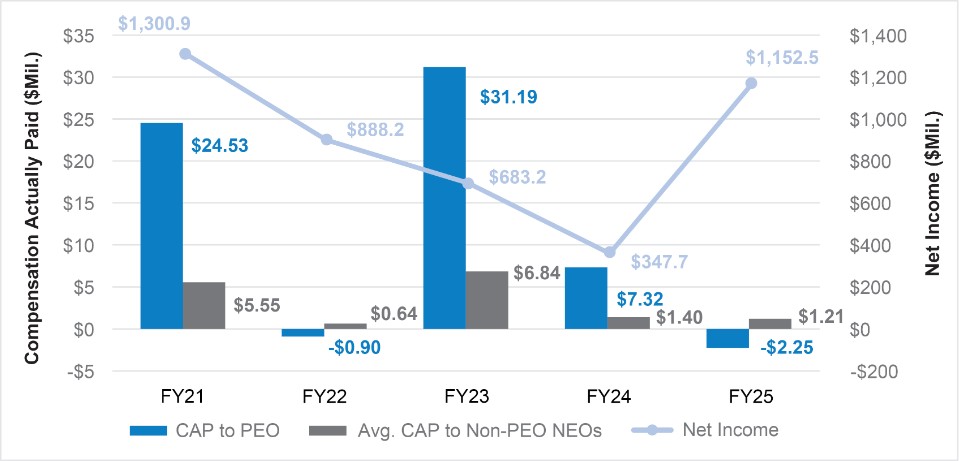
COMPENSATION ACTUALLY PAID VS NET INCOME
COMPENSATION ACTUALLY PAID VS ADJ. EPS1
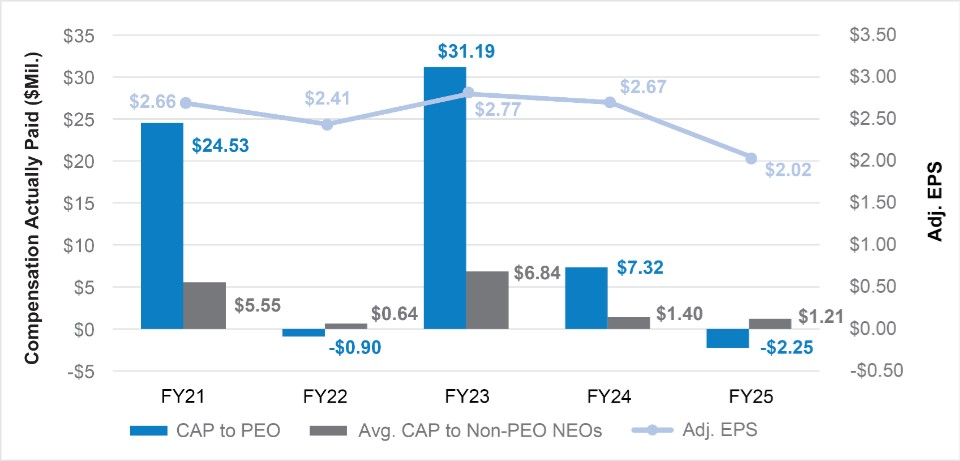
| (1) | Adjusted EPS is an adjusted metric used for compensation purposes and calculated as described in “Other Compensation Policies, Programs, and Practices—Use of Adjustments in Incentive Programs” in the “Compensation Discussion and Analysis” above. |
COMPENSATION ACTUALLY PAID VS TSR
As described in greater detail in “Compensation Discussion and Analysis,” our executive compensation program reflects our pay-for-performance philosophy. The metrics that we use for our executive awards are selected based on an objective of incentivizing our NEOs to increase the value for our shareholders. The most important financial performance measures we used to link executive compensation actually paid to our NEOs, for the most recently completed fiscal year, to our performance are as follows:
Financial Performance Measures | ||
Adjusted EPS | ||
Adjusted Net Sales | ||
Adjusted Operating Profit | ||
Adjusted Free Cash Flow | ||
Total Shareholder Return |
Equity Award Adjustments for PEO:
|
|
| + Fair Value as |
| +/- Year Over Year |
| - Fair Value at the |
| + Value of Dividends |
| ||||
of Vesting | Change in Fair | End of Prior | or Other Earnings | |||||||||||
+ Year End | +/- Year Over | Date of | Value of Equity | Year of Equity | Paid on Stock or | |||||||||
Fair Value of | Year Change | Equity | Awards | Awards that | Option Awards Not | |||||||||
Equity | in Fair Value | Awards | Granted in | Failed to Meet | Otherwise | |||||||||
Awards | of Outstanding | Granted and | Prior Years that | Vesting | Reflected in Fair | Total Equity | ||||||||
Granted in | and Unvested | Vested in | Vested in | Conditions in | Value or Total | Award | ||||||||
Fiscal | the Year | Equity Awards | the Year | the Year | the Year | Compensation | Adjustments | |||||||
Year | ($) | ($) | ($) | ($) | ($) | ($) | ($) | |||||||
2025 |
| 3,633,642 | (10,871,004) | 0 | 323,371 | 0 | 797,799 | (6,116,192) | ||||||
2024 |
| 14,078,130 | (12,174,855) | 0 | (608,262) | 0 | 848,970 | 2,143,983 | ||||||
2023 | 17,612,830 | 9,236,755 | 0 | 60,077 | 0 | 0 | 26,909,662 | |||||||
2022 | 7,782,827 | (12,567,296) | 0 | (887,971) | 0 | 804,841 | (4,867,599) | |||||||
2021 |
| 10,009,874 | 8,842,267 | 0 | 727,186 | 0 | 899,910 | 20,479,237 |
Average Equity Award Adjustments for Non-PEO NEOs:
|
|
|
| +/- Year Over |
|
|
| |||||||
+ Fair Value as | Year Change | - Fair Value at the | + Value of Dividends | |||||||||||
of Vesting | in Fair | End of Prior | or Other Earnings | |||||||||||
+/- Year Over | Date of | Value of Equity | Year of Equity | Paid on Stock or | ||||||||||
+ Year End | Year Change | Equity | Awards | Awards that | Option Awards | |||||||||
Fair Value of | in Fair Value | Awards | Granted in | Failed to Meet | Not Otherwise | |||||||||
Equity Awards | of Outstanding | Granted and | Prior Years that | Vesting | Reflected in Fair | Total Equity | ||||||||
Granted in | and Unvested | Vested in | Vested in | Conditions in | Value or Total | Award | ||||||||
Fiscal | the Year | Equity Awards | the Year | the Year | the Year | Compensation | Adjustments | |||||||
Year | ($) | ($) | ($) | ($) | ($) | ($) | ($) | |||||||
2025 | 1,332,089 | (1,752,025) | 0 | 63,597 | 0 | 157,890 | (198,449) | |||||||
2024 |
| 1,972,698 | (2,378,717) | 0 | (124,344) | 0 | 175,259 | (355,104) | ||||||
2023 | 3,650,755 | 1,731,832 | 0 | 11,264 | 0 | 0 | 5,393,851 | |||||||
2022 | 1,607,110 | (2,428,521) | 0 | (174,172) | 0 | 157,858 | (837,725) | |||||||
2021 |
| 2,066,549 | 1,556,684 | 0 | 165,328 | 0 | 199,341 | 3,987,902 |
COMPENSATION ACTUALLY PAID VS ADJ. OPERATING PROFIT1
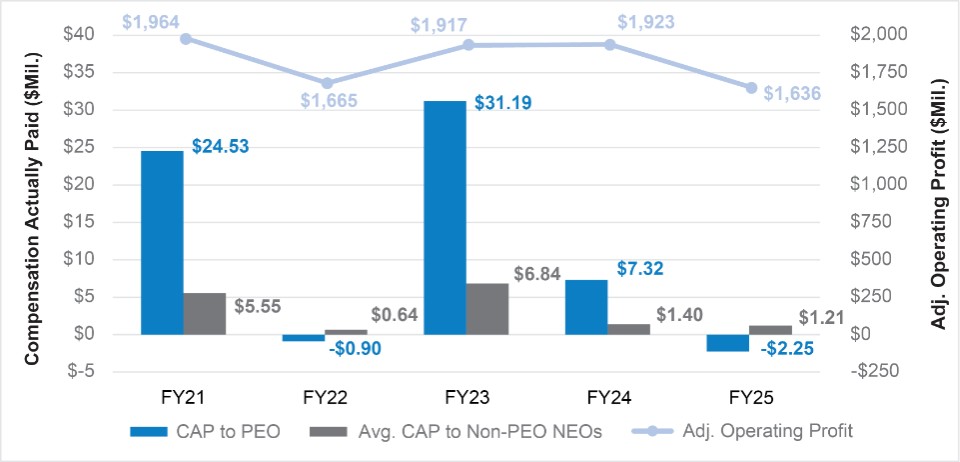
| (1) | Adjusted Operating Profit is an adjusted metric used for compensation purposes and calculated as described in “Other Compensation Policies, Programs, and Practices—Use of Adjustments in Incentive Programs” in the “Compensation Discussion and Analysis” above. |