Exhibit 99.2
Second Quarter 2025 Earnings Presentation
This presentation contains forward-looking statements within the meaning of the
U.S. Private Securities Litigation Reform Act of 1995. We intend such forward-looking statements to be covered by the safe harbor provisions for forward-looking statements as contained in Section 27A of the Securities Act of 1933, as amended,
and Section 21E of the Securities Exchange Act of 1934, as amended (the “Exchange Act”). All statements contained in this presentation other than statements of historical fact, including, without limitation, statements regarding Enlight
Renewable Energy's (the "Company") business strategy and plans, capabilities of the Company’s project portfolio and achievement of operational objectives, market opportunity and potential growth, discussions with commercial counterparties and
financing sources, pricing trends, progress of Company projects, including anticipated timing of related approvals and project completion, the Company’s future financial results, expected impact from various regulatory developments, including
the IRA, Revenue and Income, EBITDA, and Adjusted EBITDA guidance, the expected timing of completion of our ongoing projects, macroeconomic trends, and the Company’s anticipated cash requirements and financing plans, are forward-looking
statements. The words “may,” “might,” “will,” “could,” “would,” “should,” “expect,” “plan,” “anticipate,” “intend,” “target,” “seek,” “believe,” “estimate,” “predict,” “potential,” “continue,” “contemplate,” “possible,” “forecasts,” “aims” or
the negative of these terms and similar expressions are intended to identify forward-looking statements, though not all forward-looking statements use these words or expressions. These statements are neither promises nor guarantees, but
involve known and unknown risks, uncertainties and other important factors that may cause our actual results, performance or achievements to be materially different from any future results, performance or achievements expressed or implied by
the forward-looking statements, including, but not limited to, the following: our ability to site suitable land for, and otherwise source, renewable energy projects and to successfully develop and convert them into Operational Projects;
availability of, and access to, interconnection facilities and transmission systems; our ability to obtain and maintain governmental and other regulatory approvals and permits, including environmental approvals and permits; construction
delays, operational delays and supply chain disruptions leading to increased cost of materials required for the construction of our projects, as well as cost overruns and delays related to disputes with contractors; disruptions in trade
caused by political, social or economic instability in regions where our components and materials are made; our suppliers’ ability and willingness to perform both existing and future obligations; competition from traditional and renewable
energy companies in developing renewable energy projects; potential slowed demand for renewable energy projects and our ability to enter into new offtake contracts on acceptable terms and prices as current offtake contracts expire; offtakers’
ability to terminate contracts or seek other remedies resulting from failure of our projects to meet development, operational or performance benchmarks; exposure to market prices in some of our offtake contracts; various technical and
operational challenges leading to unplanned outages, reduced output, interconnection or termination issues; the dependence of our production and revenue on suitable meteorological and environmental conditions, and our ability to accurately
predict such conditions; our ability to enforce warranties provided by our counterparties in the event that our projects do not perform as expected; government curtailment, energy price caps and other government actions that restrict or
reduce the profitability of renewable energy production; electricity price volatility, unusual weather conditions (including the effects of climate change, could adversely affect wind and solar conditions), catastrophic weather-related or
other damage to facilities, unscheduled generation outages, maintenance or repairs, unanticipated changes to availability due to higher demand, shortages, transportation problems or other developments, environmental incidents, or electric
transmission system constraints and the possibility that we may not have adequate insurance to cover losses as a result of such hazards; our dependence on certain operational projects for a substantial portion of our cash flows; our ability
to continue to grow our portfolio of projects through successful acquisitions; changes and advances in technology that impair or eliminate the competitive advantage of our projects or upsets the expectations underlying investments in our
technologies; our ability to effectively anticipate and manage cost inflation, interest rate risk, currency exchange fluctuations and other macroeconomic conditions that impact our business; our ability to retain and attract key personnel;
our ability to manage legal and regulatory compliance and litigation risk across our global corporate structure; our ability to protect our business from, and manage the impact of, cyber-attacks, disruptions and security incidents, as well as
acts of terrorism or war; changes to existing renewable energy industry policies and regulations that present technical, regulatory and economic barriers to renewable energy projects; the reduction, elimination or expiration of government
incentives or benefits for, or regulations mandating the use of, renewable energy; our ability to effectively manage the global expansion of the scale of our business operations; our ability to perform to expectations in our new line of
business involving the construction of PV systems for municipalities in Israel; our ability to effectively manage our supply chain and comply with applicable regulations with respect to international trade relations, tariffs and our ability
to mitigate their impacts, sanctions, export controls and anti-bribery and anti-corruption laws; our ability to effectively comply with Environmental Health and Safety and other laws and regulations and receive and maintain all necessary
licenses, permits and authorizations; our performance of various obligations under the terms of our indebtedness (and the indebtedness of our subsidiaries that we guarantee) and our ability to continue to secure project financing on
attractive terms for our projects; limitations on our management rights and operational flexibility due to our use of tax equity arrangements; potential claims and disagreements with partners, investors and other counterparties that could
reduce our right to cash flows generated by our projects; our ability to comply with increasingly complex tax laws of various jurisdictions in which we currently operate as well as the tax laws in jurisdictions in which we intend to operate
in the future; the unknown effect of the dual listing of our ordinary shares on the price of our ordinary shares; various risks related to our incorporation and location in Israel, including the ongoing war in Israel, where our headquarters
and some of our wind energy and solar energy projects are located; the costs and requirements of being a public company, including the diversion of management’s attention with respect to such requirements; certain provisions in our Articles
of Association and certain applicable regulations that may delay or prevent a change of control; and the other risk factors set forth in the section titled “Risk factors” in our Annual Report on Form 20-F for the fiscal year ended December
31, 2024 filed with the Securities and Exchange Commission (the “SEC”), as may be updated in our other documents filed with or furnished to the SEC. These statements reflect management’s current expectations regarding future events and
operating performance and speak only as of the date of this presentation. You should not put undue reliance on any forward-looking statements. Although we believe that the expectations reflected in the forward-looking statements are
reasonable, we cannot guarantee that future results, levels of activity, performance and events and circumstances reflected in the forward-looking statements will be achieved or will occur. Except as required by applicable law, we undertake
no obligation to update or revise publicly any forward-looking statements, whether as a result of new information, future events or otherwise, after the date on which the statements are made or to reflect the occurrence of unanticipated
events. Unless otherwise indicated, information contained in this presentation concerning the industry, competitive position and the markets in which the Company operates is based on information from independent industry and research
organizations, other third- party sources and management estimates. Management estimates are derived from publicly available information released by independent industry analysts and other third-party sources, as well as data from the
Company's internal research, and are based on assumptions made by the Company upon reviewing such data, and the Company's experience in, and knowledge of, such industry and markets, which the Company believes to be reasonable. In addition,
projections, assumptions and estimates of the future performance of the industry in which the Company operates, and the Company's future performance are necessarily subject to uncertainty and risk due to a variety of factors, including those
described above. These and other factors could cause results to differ materially from those expressed in the estimates made by independent parties and by the Company. Industry publications, research, surveys and studies generally state that
the information they contain has been obtained from sources believed to be reliable, but that the accuracy and completeness of such information is not guaranteed. Forecasts and other forward-looking information obtained from these sources are
subject to the same qualifications and uncertainties as the other forward-looking statements in this presentation. Non-IFRS Financial Metrics This presentation presents Adjusted EBITDA, a non-IFRS financial metric, which is provided as a
complement to the results provided in accordance with the International Financial Reporting Standards as issued by the International Accounting Standards Board (“IFRS”). A reconciliation between Adjusted EBITDA and Net Income, its most
directly comparable IFRS financial measure, is contained in the tables below. The Company is unable to provide a reconciliation of Adjusted EBITDA to Net Income on a forward-looking basis without unreasonable effort because items that impact
this IFRS financial measure are not within the Company’s control and/or cannot be reasonably predicted. These items may include, but are not limited to, forward-looking depreciation and amortization, share based compensation, other income,
finance income, finance expenses, share of losses of equity accounted investees and taxes on income. Such information may have a significant, and potentially unpredictable, impact on the Company’s future financial results. The trademarks
included herein are the property of the owners thereof and are used for reference purposes only. Such use should not be construed as an endorsement of the products or services of the Company or the proposed offering. Legal disclaimer
1 Adjusted EBITDA is a non-IFRS measure. Please see the appendix of this
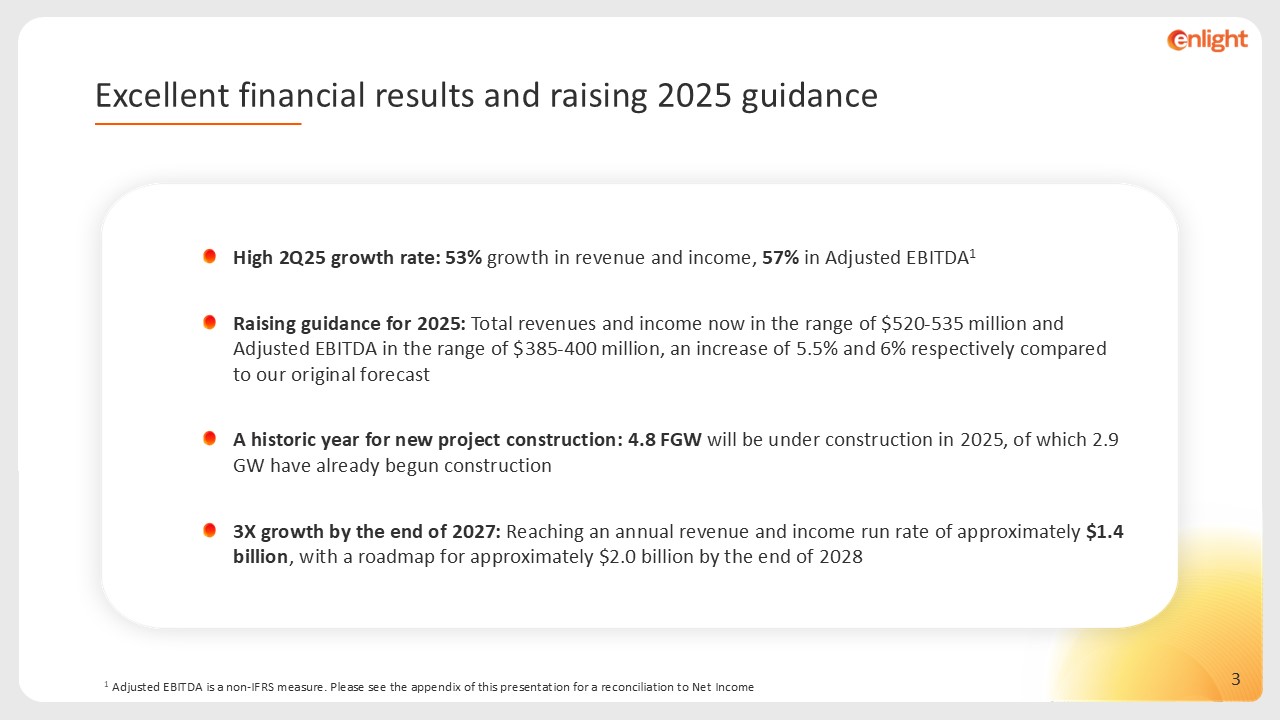
presentation for a reconciliation to Net Income High 2Q25 growth rate: 53% growth in revenue and income, 57% in Adjusted EBITDA1 Raising guidance for 2025: Total revenues and income now in the range of $520-535 million and Adjusted EBITDA
in the range of $385-400 million, an increase of 5.5% and 6% respectively compared to our original forecast A historic year for new project construction: 4.8 FGW will be under construction in 2025, of which 2.9 GW have already begun
construction 3X growth by the end of 2027: Reaching an annual revenue and income run rate of approximately $1.4 billion, with a roadmap for approximately $2.0 billion by the end of 2028 Excellent financial results and raising 2025
guidance
Continued and consistent growth in financial results
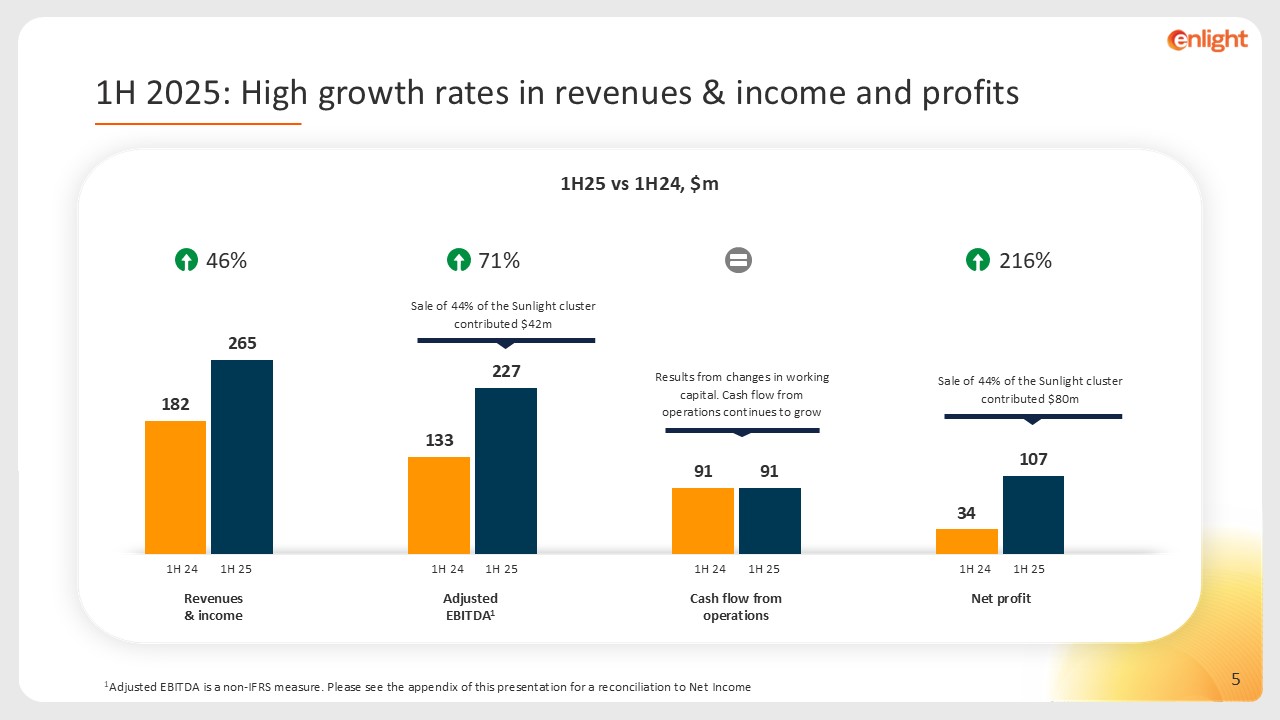
Sale of 44% of the Sunlight cluster contributed $80m Sale of 44% of the
Sunlight cluster contributed $42m 46% 71% 216% 1H 2025: High growth rates in revenues & income and profits 1H25 vs 1H24, $m Adjusted EBITDA1 Revenues & income Cash flow from operations Net profit 1Adjusted EBITDA is a
non-IFRS measure. Please see the appendix of this presentation for a reconciliation to Net Income 1H 25 1H 24 1H 25 1H 24 1H 25 1H 24 1H 25 1H 24 Results from changes in working capital. Cash flow from operations continues to grow
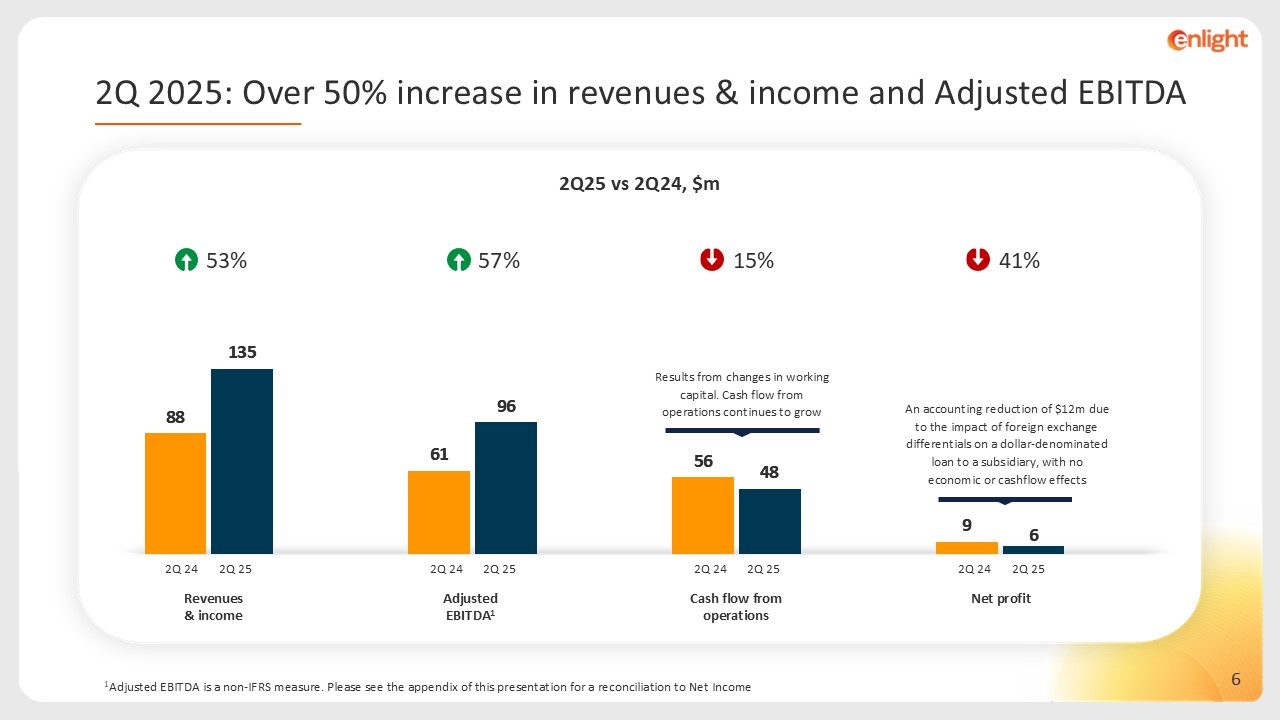
Adjusted EBITDA1 An accounting reduction of $12m due to the impact of foreign
exchange differentials on a dollar-denominated loan to a subsidiary, with no economic or cashflow effects 53% 57% 41% 15% 2Q 25 2Q 24 2Q 25 2Q 24 2Q 25 2Q 24 2Q 25 2Q 24 2Q 2025: Over 50% increase in revenues & income and
Adjusted EBITDA 2Q25 vs 2Q24, $m Revenues & income Cash flow from operations Net profit 1Adjusted EBITDA is a non-IFRS measure. Please see the appendix of this presentation for a reconciliation to Net Income Results from changes in
working capital. Cash flow from operations continues to grow
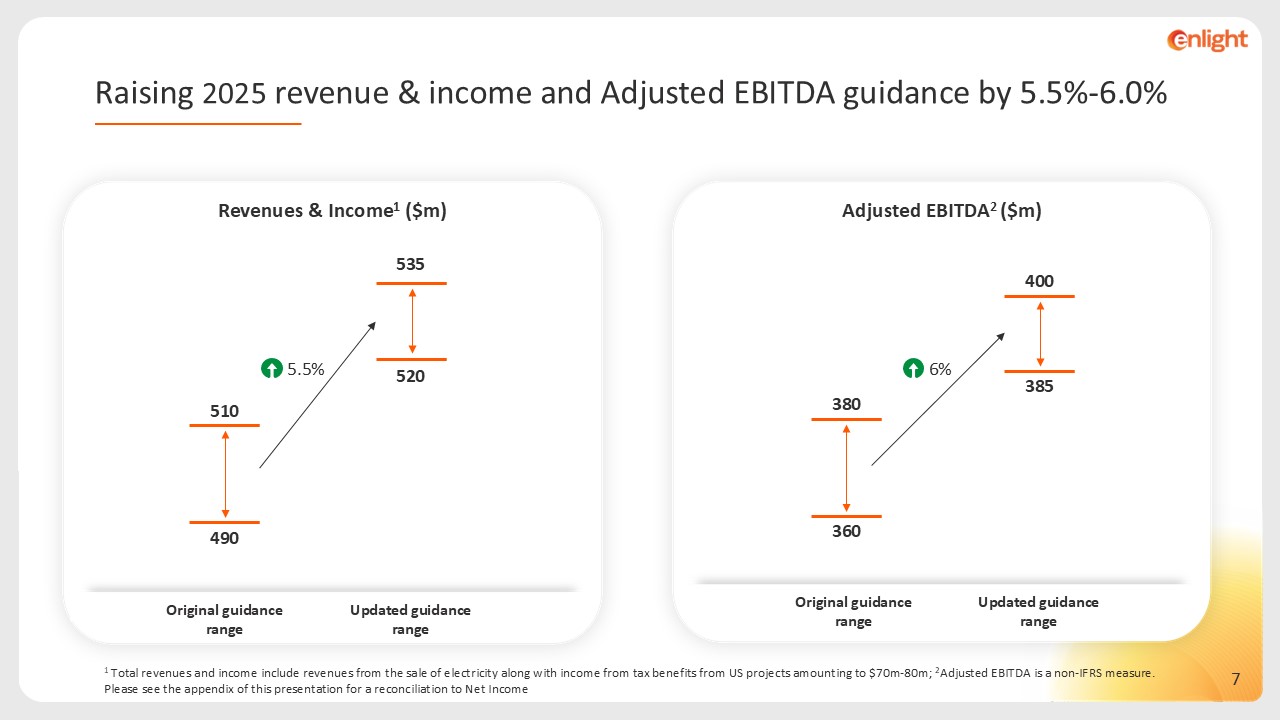
1 Total revenues and income include revenues from the sale of electricity along
with income from tax benefits from US projects amounting to $70m-80m; 2Adjusted EBITDA is a non-IFRS measure. Please see the appendix of this presentation for a reconciliation to Net Income Updated guidance range Revenues & Income1
($m) Original guidance range 510 490 535 520 Adjusted EBITDA2 ($m) Updated guidance range Original guidance range 400 385 380 360 5.5% 6% Raising 2025 revenue & income and Adjusted EBITDA guidance by 5.5%-6.0%
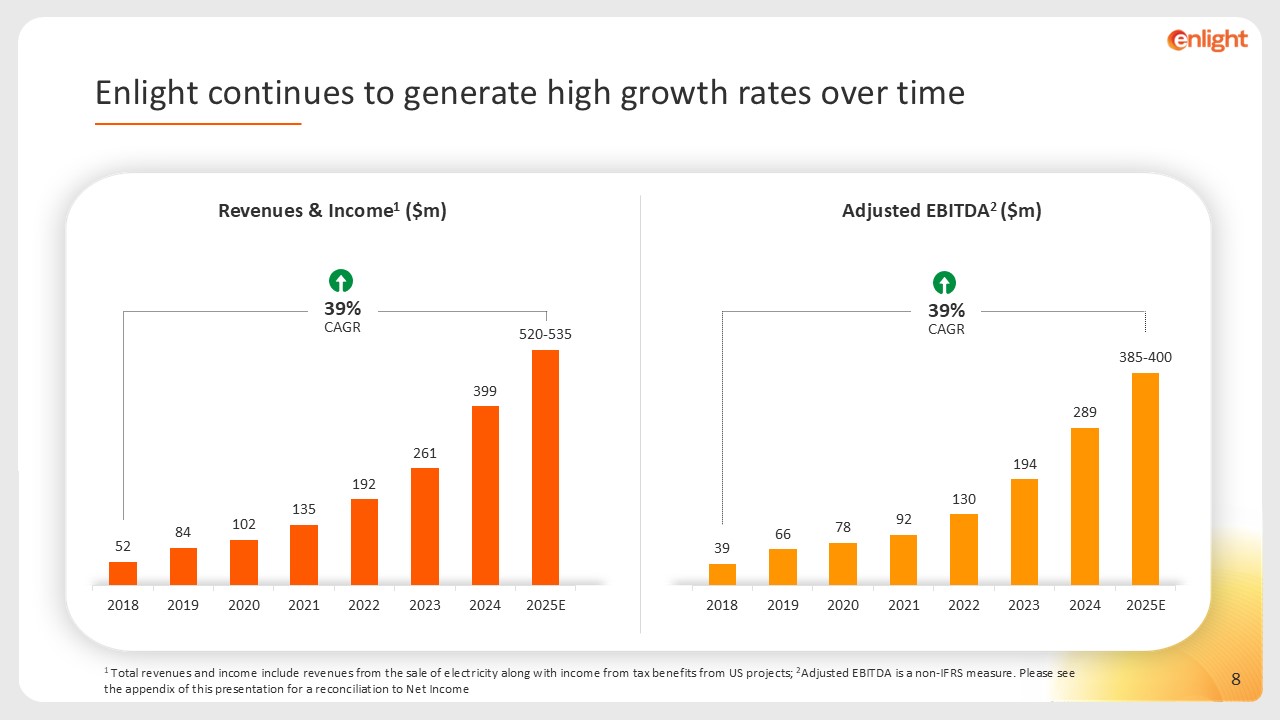
39% CAGR 39% CAGR 1 Total revenues and income include revenues from the sale
of electricity along with income from tax benefits from US projects; 2Adjusted EBITDA is a non-IFRS measure. Please see the appendix of this presentation for a reconciliation to Net Income Enlight continues to generate high growth rates over
time Revenues & Income1 ($m) Adjusted EBITDA2 ($m)
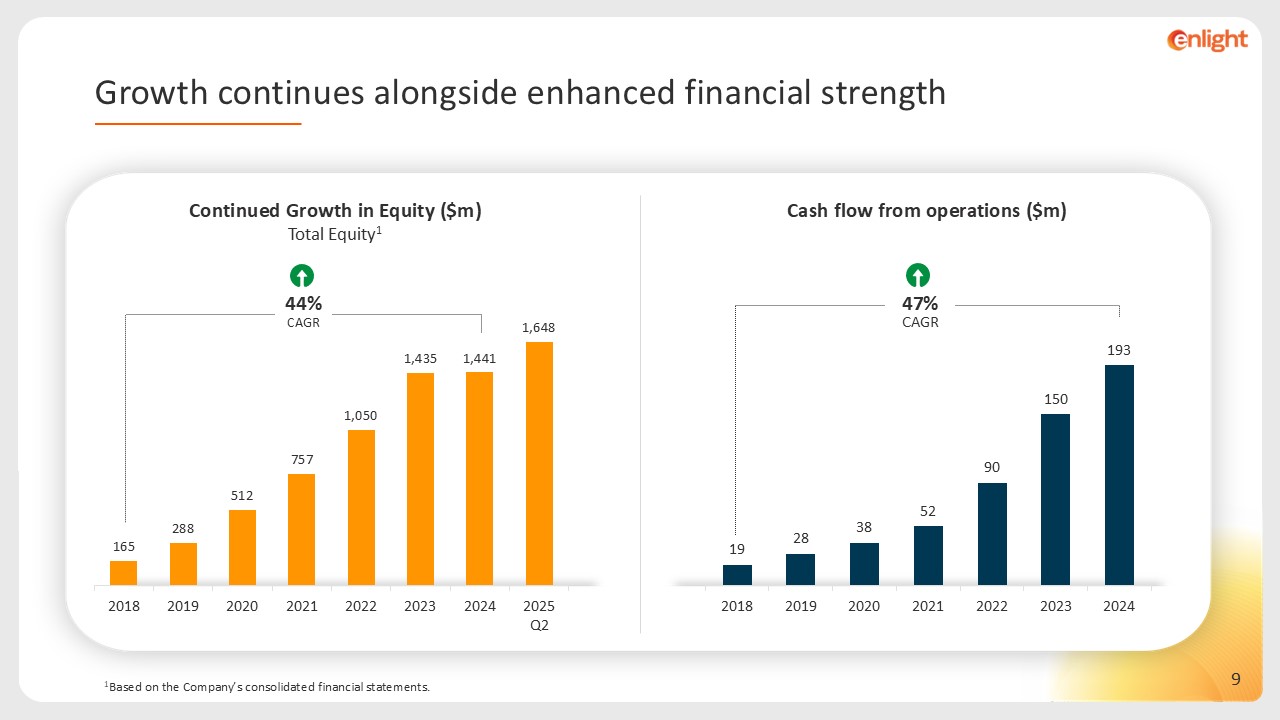
Cash flow from operations ($m) 1Based on the Company’s consolidated financial
statements. 47% CAGR 44% CAGR Growth continues alongside enhanced financial strength Continued Growth in Equity ($m)Total Equity1
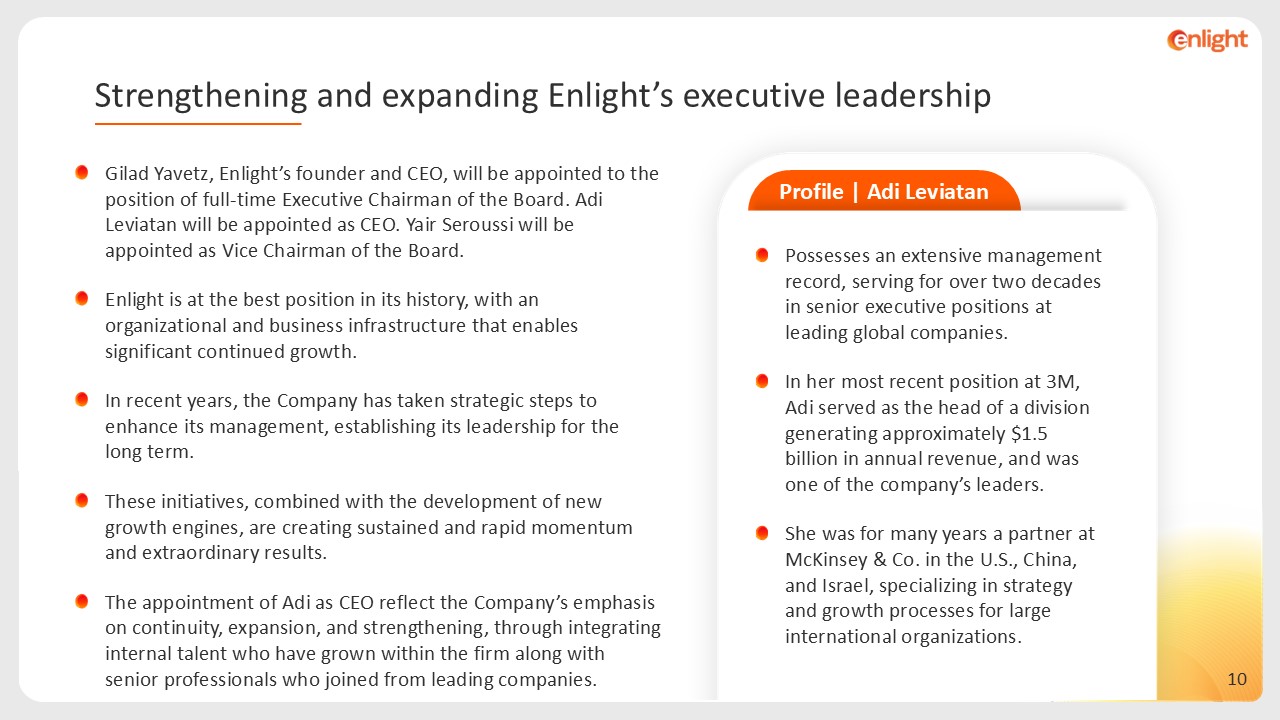
Gilad Yavetz, Enlight’s founder and CEO, will be appointed to the position of
full-time Executive Chairman of the Board. Adi Leviatan will be appointed as CEO. Yair Seroussi will be appointed as Vice Chairman of the Board. Enlight is at the best position in its history, with an organizational and business
infrastructure that enables significant continued growth. In recent years, the Company has taken strategic steps to enhance its management, establishing its leadership for the long term. These initiatives, combined with the development of
new growth engines, are creating sustained and rapid momentum and extraordinary results. The appointment of Adi as CEO reflect the Company’s emphasis on continuity, expansion, and strengthening, through integrating internal talent who have
grown within the firm along with senior professionals who joined from leading companies. Possesses an extensive management record, serving for over two decades in senior executive positions at leading global companies. In her most recent
position at 3M, Adi served as the head of a division generating approximately $1.5 billion in annual revenue, and was one of the company’s leaders. She was for many years a partner at McKinsey & Co. in the U.S., China, and Israel,
specializing in strategy and growth processes for large international organizations. Profile | Adi Leviatan Strengthening and expanding Enlight’s executive leadership
Portfolio - Value creation through project initiations and progression in 2Q25
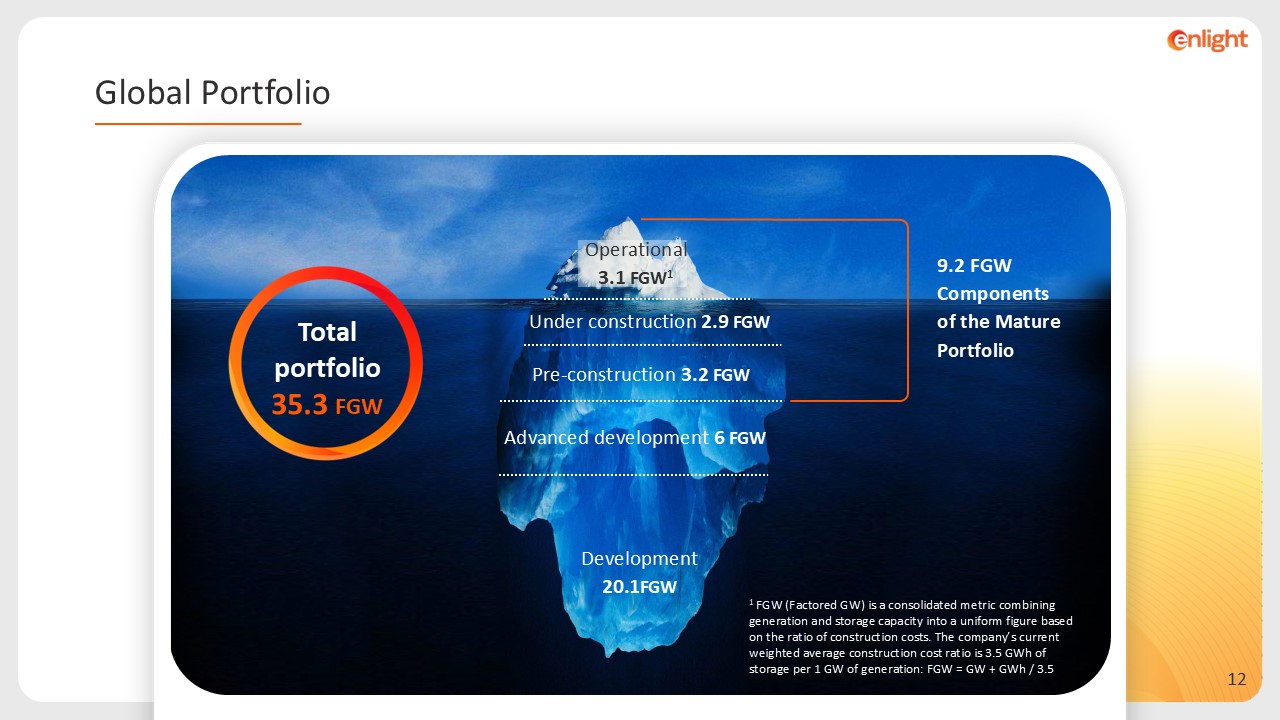
9.2 FGW Components of the Mature Portfolio Under construction 2.9 FGW
Pre-construction 3.2 FGW Advanced development 6 FGW Development 20.1FGW Operational 3.1 FGW1 1 FGW (Factored GW) is a consolidated metric combining generation and storage capacity into a uniform figure based on the ratio of
construction costs. The company’s current weighted average construction cost ratio is 3.5 GWh of storage per 1 GW of generation: FGW = GW + GWh / 3.5 Total portfolio FGW 35.3 Global Portfolio
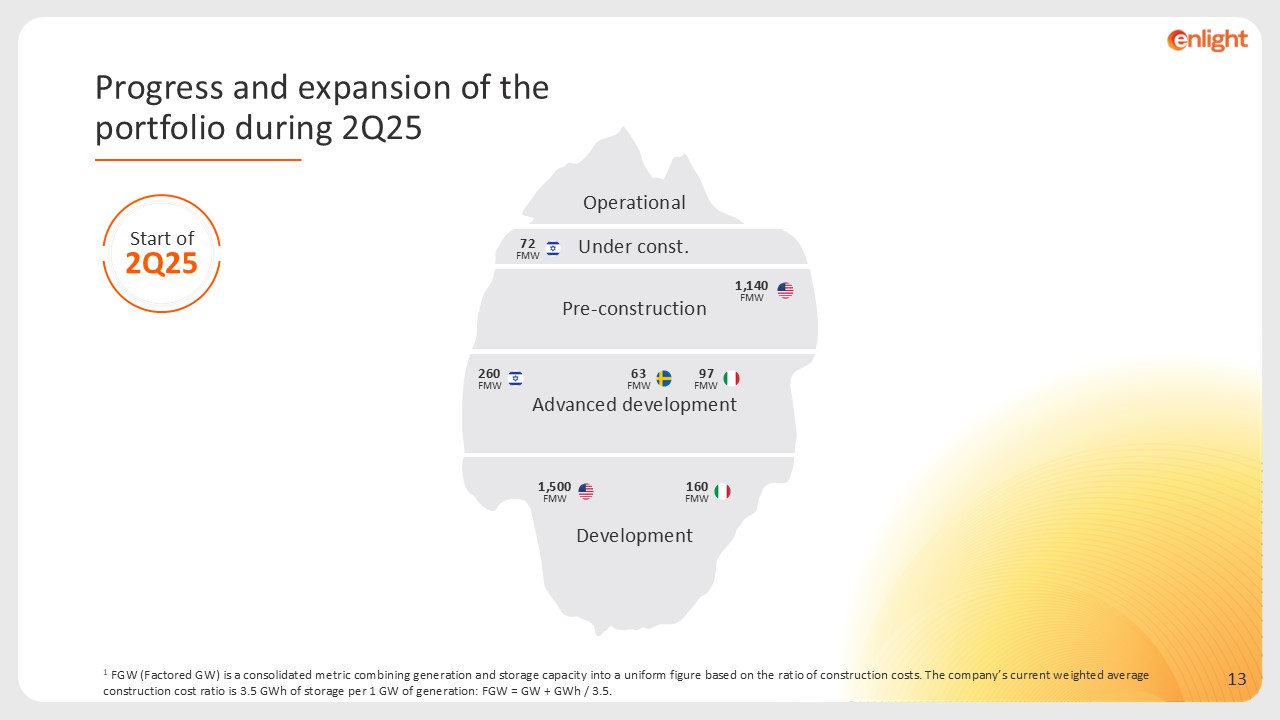
72 FMW 1,140FMW Start of 2Q25 63 FMW 260 FMW 97 FMW 1,500FMW 160
FMW Operational Pre-construction Advanced development Development Under const. 1 FGW (Factored GW) is a consolidated metric combining generation and storage capacity into a uniform figure based on the ratio of construction costs. The
company’s current weighted average construction cost ratio is 3.5 GWh of storage per 1 GW of generation: FGW = GW + GWh / 3.5. Progress and expansion of the portfolio during 2Q25
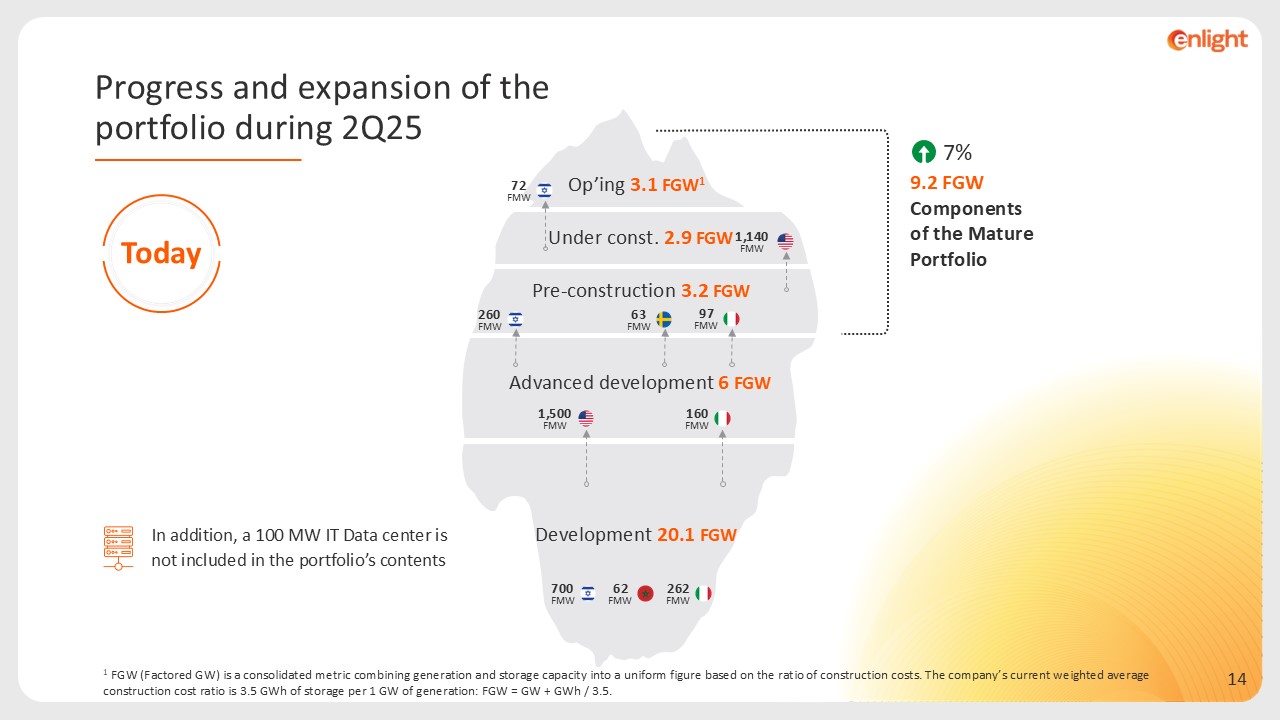
9.2 FGW Components of the Mature Portfolio In addition, a 100 MW IT Data
center is not included in the portfolio’s contents 7% Op’ing 3.1 FGW1 Under const. 2.9 FGW Pre-construction 3.2 FGW Advanced development 6 FGW Development 20.1FGW 1 FGW (Factored GW) is a consolidated metric combining generation
and storage capacity into a uniform figure based on the ratio of construction costs. The company’s current weighted average construction cost ratio is 3.5 GWh of storage per 1 GW of generation: FGW = GW + GWh / 3.5. 1,500FMW 160
FMW 1,140FMW 72 FMW 63 FMW 260 FMW 97 FMW 700 FMW 62 FMW 262 FMW Progress and expansion of the portfolio during 2Q25 Today
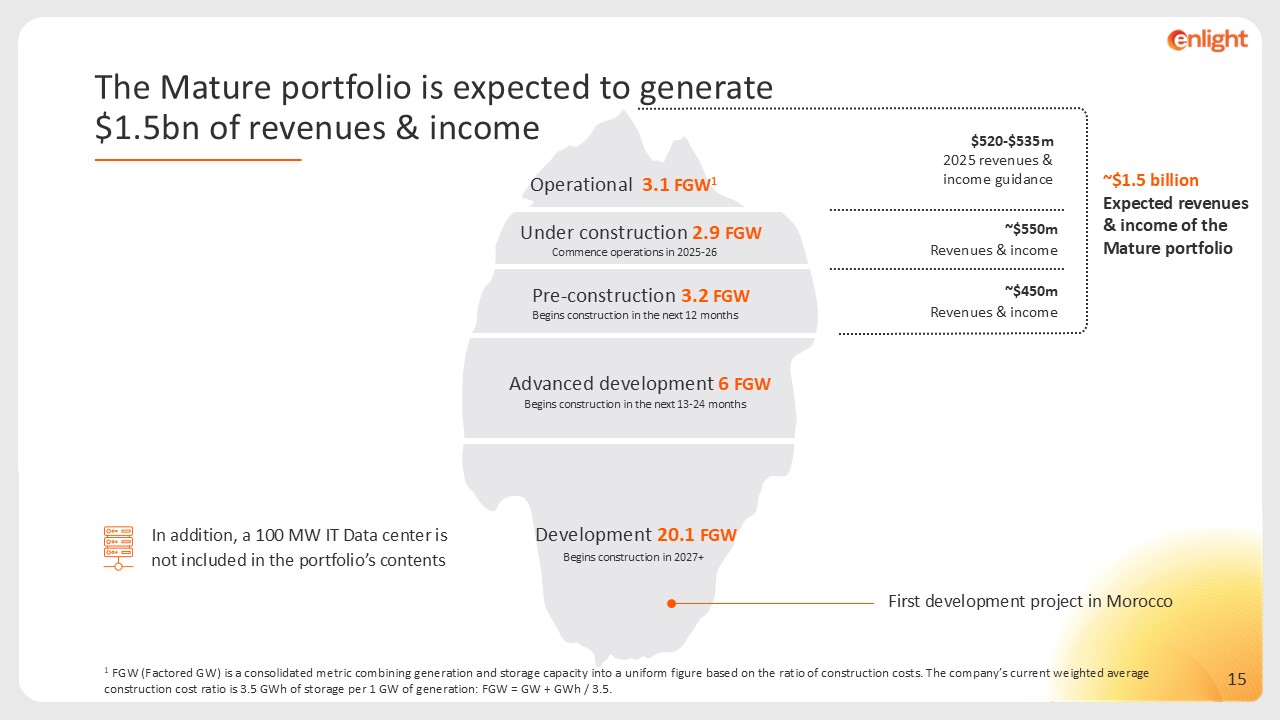
~$1.5 billion Expected revenues & income of the Mature portfolio
$520-$535m 2025 revenues & income guidance Begins construction in 2027+ In addition, a 100 MW IT Data center is not included in the portfolio’s contents First development project in Morocco 1 FGW (Factored GW) is a consolidated
metric combining generation and storage capacity into a uniform figure based on the ratio of construction costs. The company’s current weighted average construction cost ratio is 3.5 GWh of storage per 1 GW of generation: FGW = GW + GWh /
3.5. Commence operations in 2025-26 Begins construction in the next 12 months Begins construction in the next 13-24 months ~$550m Revenues & income ~$450m Revenues & income Operational 3.1 FGW1 Under construction 2.9 FGW
Pre-construction 3.2 FGW Advanced development 6 FGW Development 20.1FGW The Mature portfolio is expected to generate $1.5bn of revenues & income
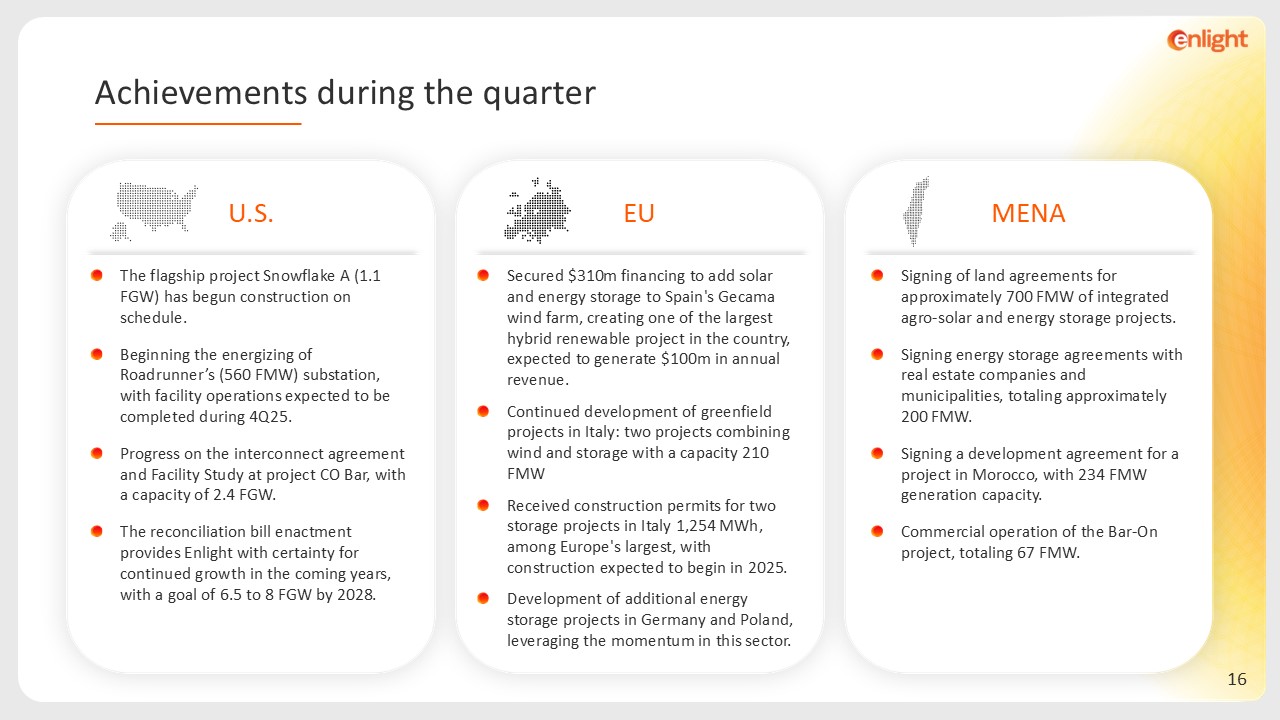
EU Secured $310m financing to add solar and energy storage to Spain's Gecama
wind farm, creating one of the largest hybrid renewable project in the country, expected to generate $100m in annual revenue. Continued development of greenfield projects in Italy: two projects combining wind and storage with a capacity 210
FMW Received construction permits for two storage projects in Italy 1,254 MWh, among Europe's largest, with construction expected to begin in 2025. Development of additional energy storage projects in Germany and Poland, leveraging the
momentum in this sector. MENA Signing of land agreements for approximately 700 FMW of integrated agro-solar and energy storage projects. Signing energy storage agreements with real estate companies and municipalities, totaling
approximately 200 FMW. Signing a development agreement for a project in Morocco, with 234 FMW generation capacity. Commercial operation of the Bar-On project, totaling 67 FMW. Achievements during the quarter U.S. The flagship project
Snowflake A (1.1 FGW) has begun construction on schedule. Beginning the energizing of Roadrunner’s (560 FMW) substation, with facility operations expected to be completed during 4Q25. Progress on the interconnect agreement and Facility
Study at project CO Bar, with a capacity of 2.4 FGW. The reconciliation bill enactment provides Enlight with certainty for continued growth in the coming years, with a goal of 6.5 to 8 FGW by 2028.
1 Based on 2025 guidance added to revenues & income (sale of electricity,
tax benefits) of projects in the under construction and pre-construction portions of the Mature portfolio Business Plan - 3X growth in 3 years, reaching a revenue run-rate of ~$1.4 billion1
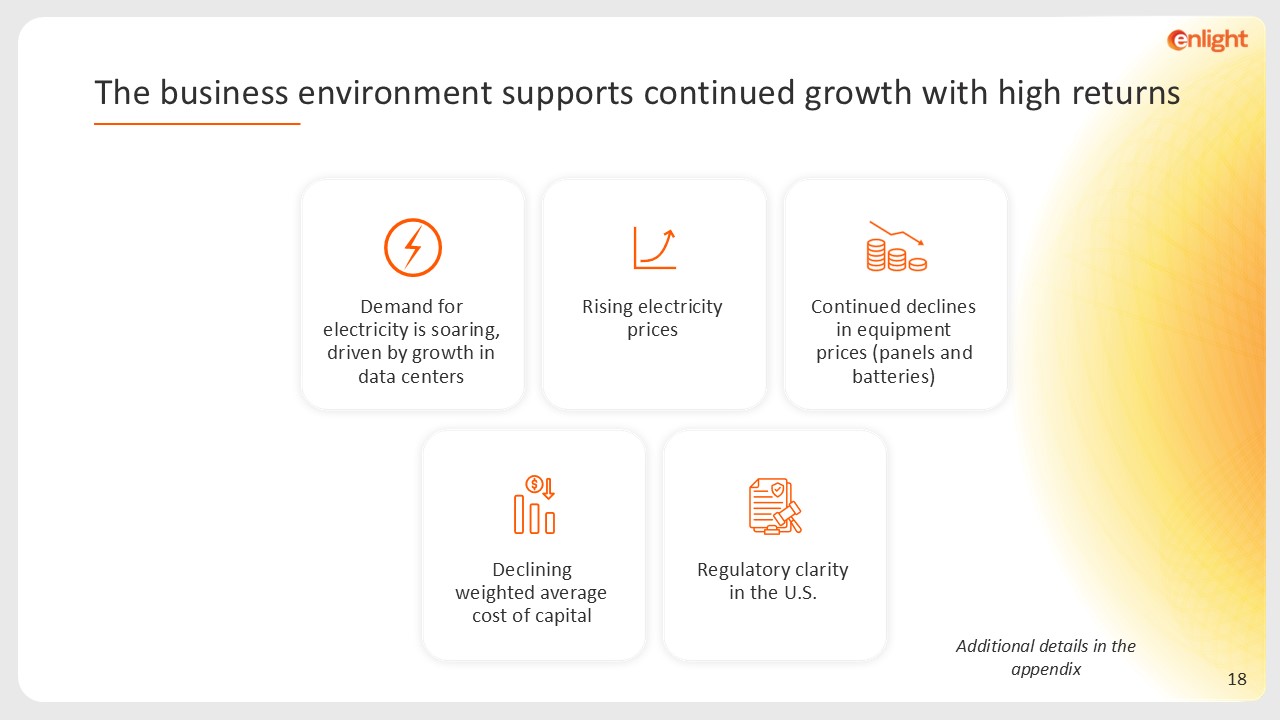
Additional details in the appendix Declining weighted average cost of
capital Rising electricity prices Demand for electricity is soaring, driven by growth in data centers Continued declines in equipment prices (panels and batteries) Regulatory clarity in the U.S. The business environment supports
continued growth with high returns
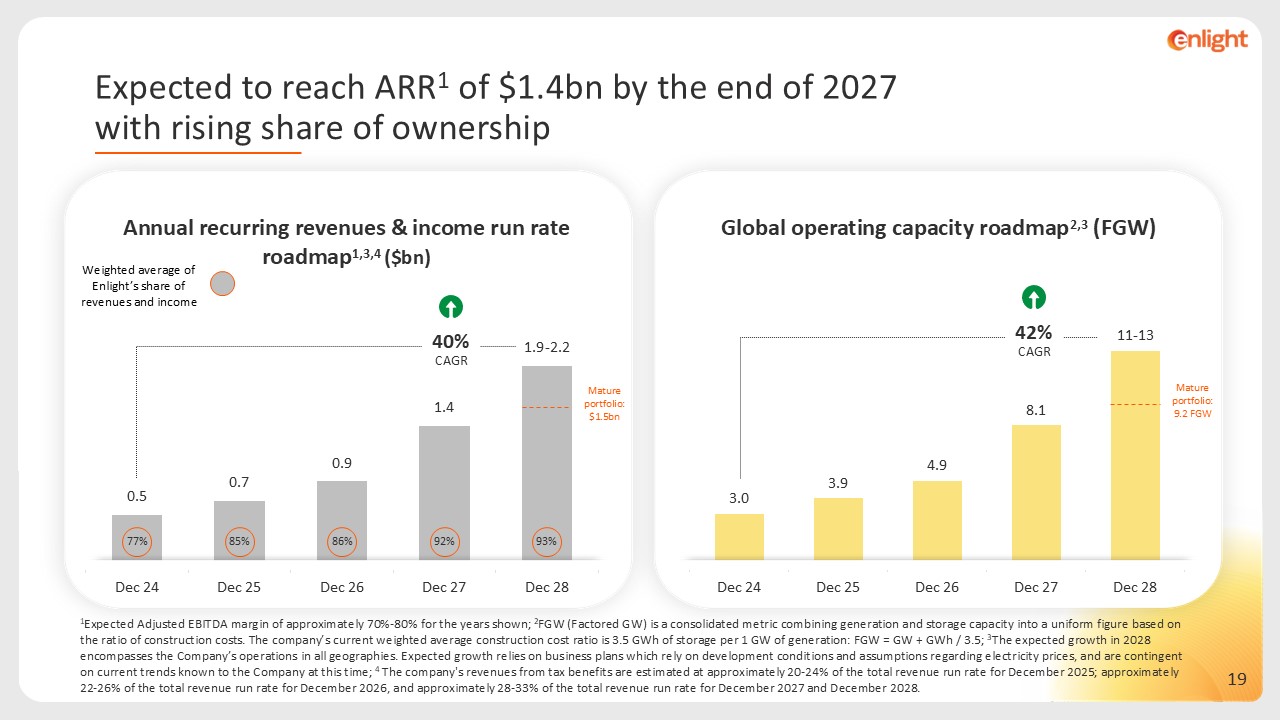
1Expected Adjusted EBITDA margin of approximately 70%-80% for the years shown;
2FGW (Factored GW) is a consolidated metric combining generation and storage capacity into a uniform figure based on the ratio of construction costs. The company’s current weighted average construction cost ratio is 3.5 GWh of storage per 1
GW of generation: FGW = GW + GWh / 3.5; 3The expected growth in 2028 encompasses the Company’s operations in all geographies. Expected growth relies on business plans which rely on development conditions and assumptions regarding electricity
prices, and are contingent on current trends known to the Company at this time; 4 The company's revenues from tax benefits are estimated at approximately 20-24% of the total revenue run rate for December 2025; approximately 22-26% of the
total revenue run rate for December 2026, and approximately 28-33% of the total revenue run rate for December 2027 and December 2028. 42% CAGR 40% CAGR Mature portfolio: 9.2 FGW Mature portfolio: $1.5bn Weighted average of Enlight’s
share of revenues and income 77% 93% 85% 86% 92% Annual recurring revenues & income run rate roadmap1,3,4 ($bn) Global operating capacity roadmap2,3 (FGW) Expected to reach ARR1 of $1.4bn by the end of 2027 with rising share of
ownership
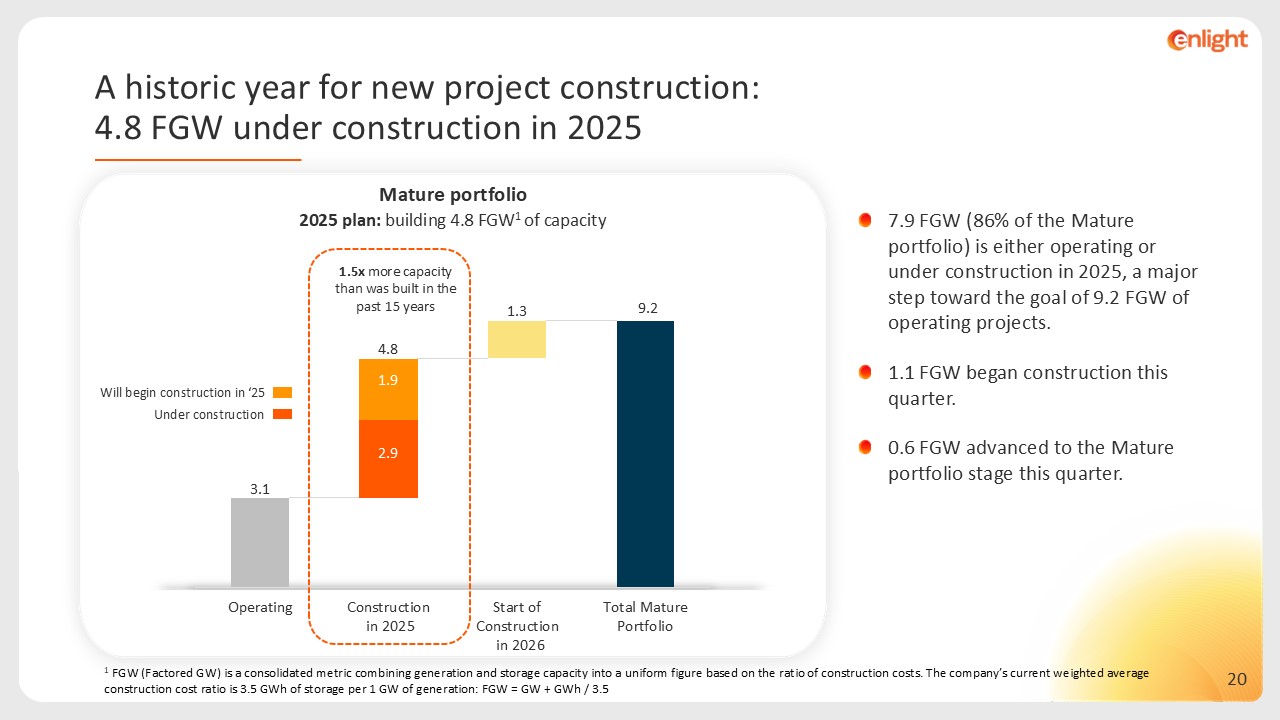
2025 plan: building 4.8 FGW1 of capacity 9.2 Mature portfolio 1.5x more
capacity than was built in the past 15 years 1.9 2.9 Under construction Will begin construction in ‘25 7.9 FGW (86% of the Mature portfolio) is either operating or under construction in 2025, a major step toward the goal of 9.2 FGW of
operating projects. 1.1 FGW began construction this quarter. 0.6 FGW advanced to the Mature portfolio stage this quarter. 1 FGW (Factored GW) is a consolidated metric combining generation and storage capacity into a uniform figure based on
the ratio of construction costs. The company’s current weighted average construction cost ratio is 3.5 GWh of storage per 1 GW of generation: FGW = GW + GWh / 3.5 A historic year for new project construction: 4.8 FGW under construction in
2025
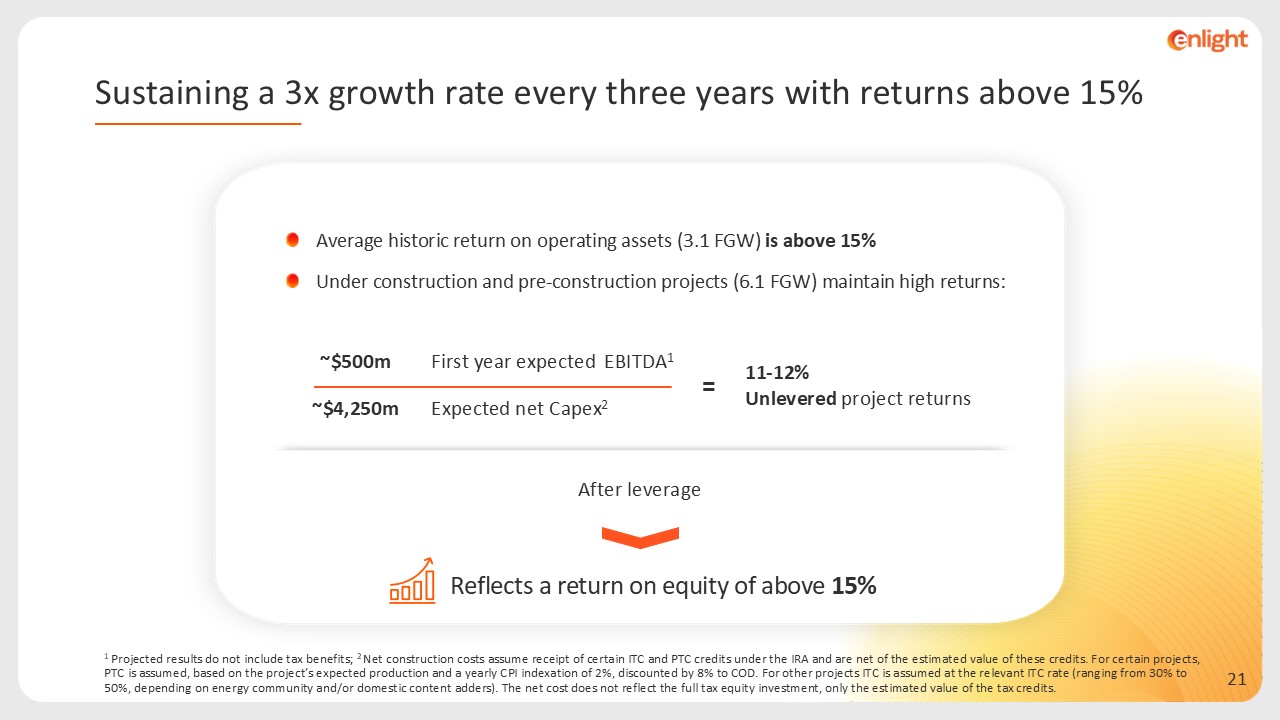
Average historic return on operating assets (3.1 FGW) is above 15% Under
construction and pre-construction projects (6.1 FGW) maintain high returns: Sustaining a 3x growth rate every three years with returns above 15% 11-12% Unlevered project returns EBITDA1 First year expected ~$500m Expected net
Capex2 ~$4,250m = Reflects a return on equity of above 15% After leverage 1 Projected results do not include tax benefits; 2 Net construction costs assume receipt of certain ITC and PTC credits under the IRA and are net of the estimated
value of these credits. For certain projects, PTC is assumed, based on the project’s expected production and a yearly CPI indexation of 2%, discounted by 8% to COD. For other projects ITC is assumed at the relevant ITC rate (ranging from 30%
to 50%, depending on energy community and/or domestic content adders). The net cost does not reflect the full tax equity investment, only the estimated value of the tax credits.
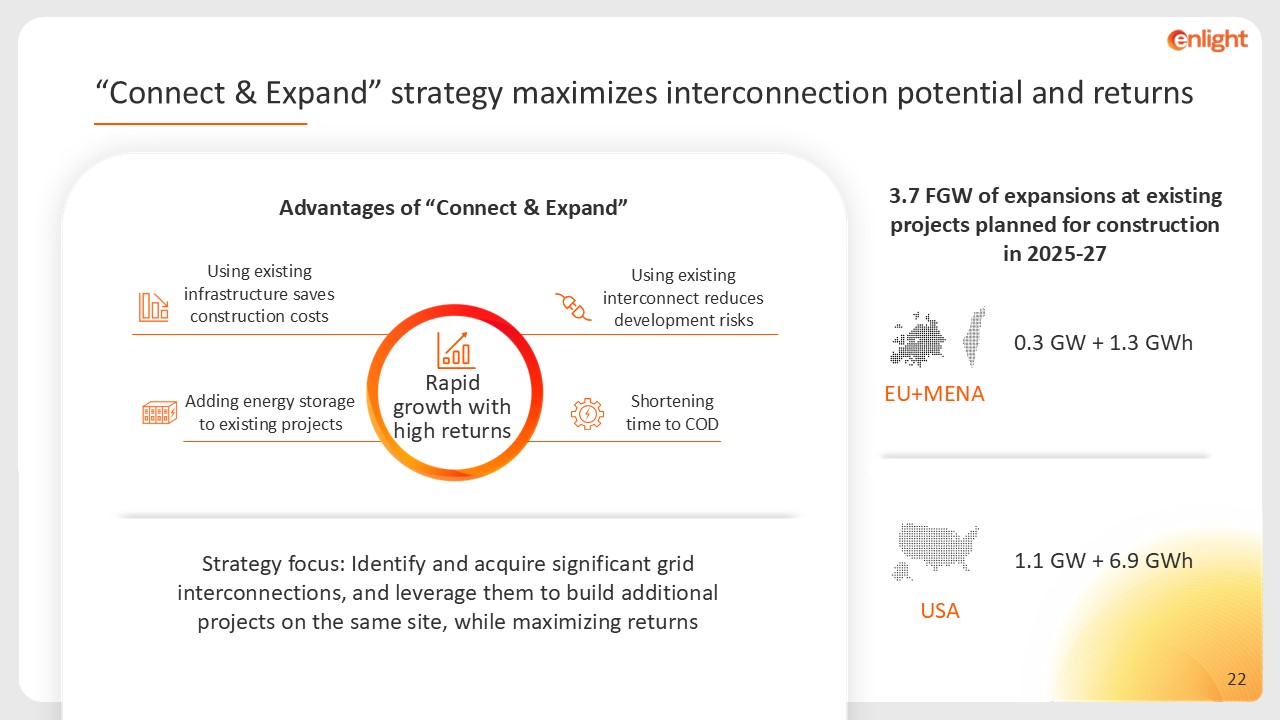
“Connect & Expand” strategy maximizes interconnection potential and
returns Advantages of “Connect & Expand” Using existing infrastructure saves construction costs Using existing interconnect reduces development risks Adding energy storage to existing projects Rapid growth with high returns Strategy
focus: Identify and acquire significant grid interconnections, and leverage them to build additional projects on the same site, while maximizing returns EU+MENA 1.1 GW + 6.9 GWh USA 0.3 GW + 1.3 GWh 3.7 FGW of expansions at existing
projects planned for construction in 2025-27 Shortening time to COD


Appendix
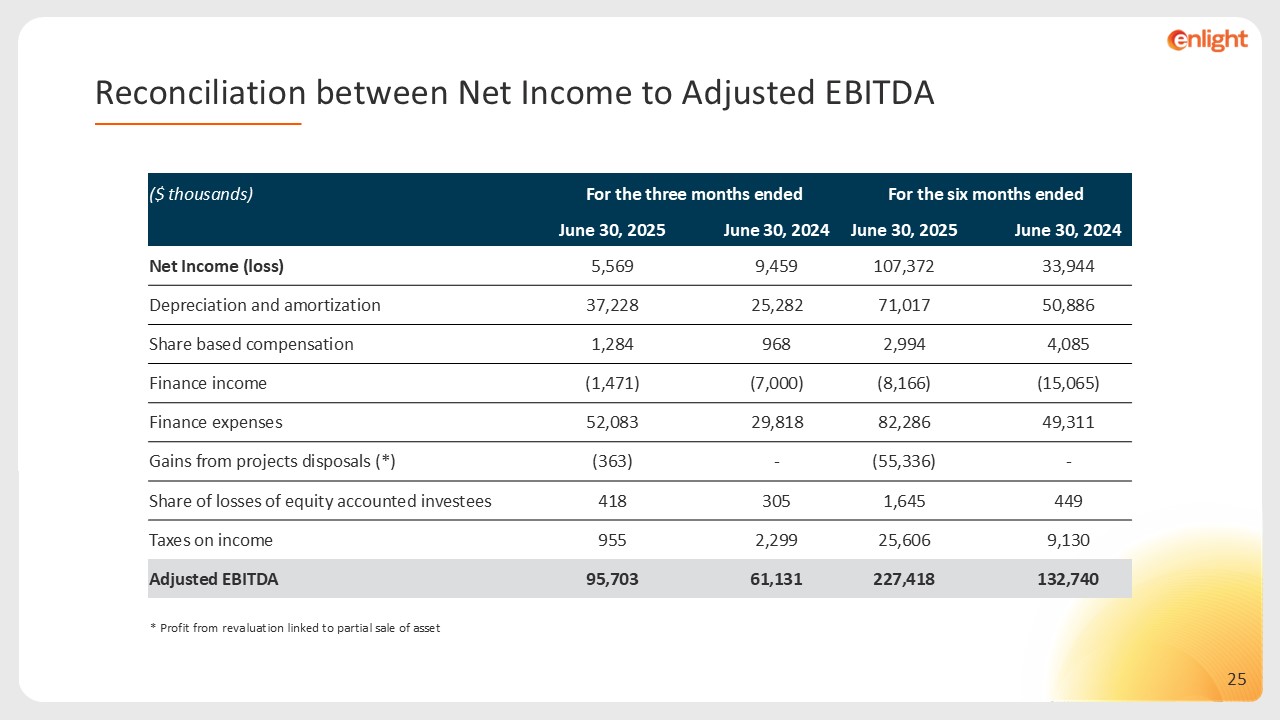
* Profit from revaluation linked to partial sale of asset Reconciliation
between Net Income to Adjusted EBITDA ($ thousands) For the three months ended For the six months ended June 30, 2025 June 30, 2024 June 30, 2025 June 30, 2024 Net Income
(loss) 5,569 9,459 107,372 33,944 Depreciation and amortization 37,228 25,282 71,017 50,886 Share based compensation 1,284 968 2,994 4,085 Finance income (1,471) (7,000) (8,166) (15,065) Finance
expenses 52,083 29,818 82,286 49,311 Gains from projects disposals (*) (363) - (55,336) - Share of losses of equity accounted investees 418 305 1,645 449 Taxes on
income 955 2,299 25,606 9,130 Adjusted EBITDA 95,703 61,131 227,418 132,740
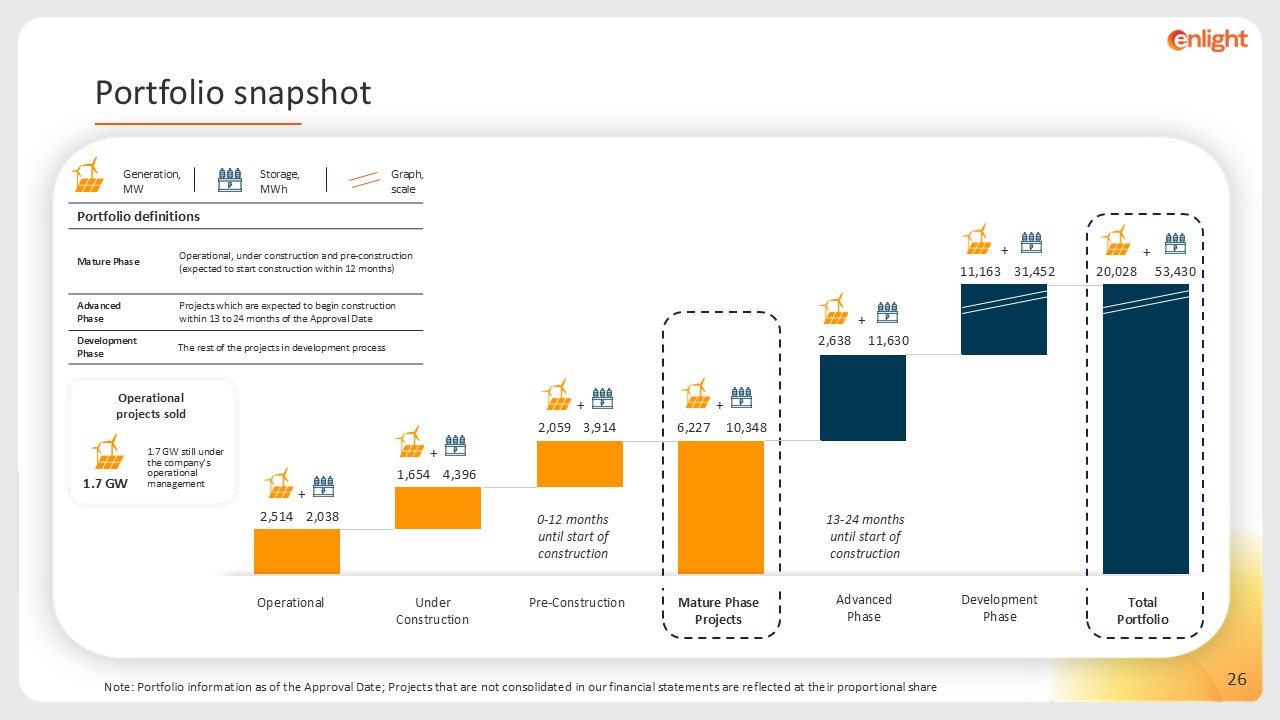
Graph, scale Generation, MW Storage, MWh Portfolio definitions Operational,
under construction and pre-construction (expected to start construction within 12 months) Mature Phase Projects which are expected to begin construction within 13 to 24 months of the Approval Date Advanced Phase The rest of the projects
in development process Development Phase Operational projects sold 1.7 GW still under the company’s operational management 1.7 GW Portfolio snapshot Note: Portfolio information as of the Approval Date; Projects that are not consolidated
in our financial statements are reflected at their proportional share 2,514 6,227 2,059 3,914 1,654 31,452 11,630 53,430 10,348 4,396 11,163 2,638 20,028 2,038 + + + + + + + Advanced Phase Under
Construction Operational Pre-Construction Mature Phase Projects Development Phase Total Portfolio 0-12 months until start of construction 13-24 months until start of construction
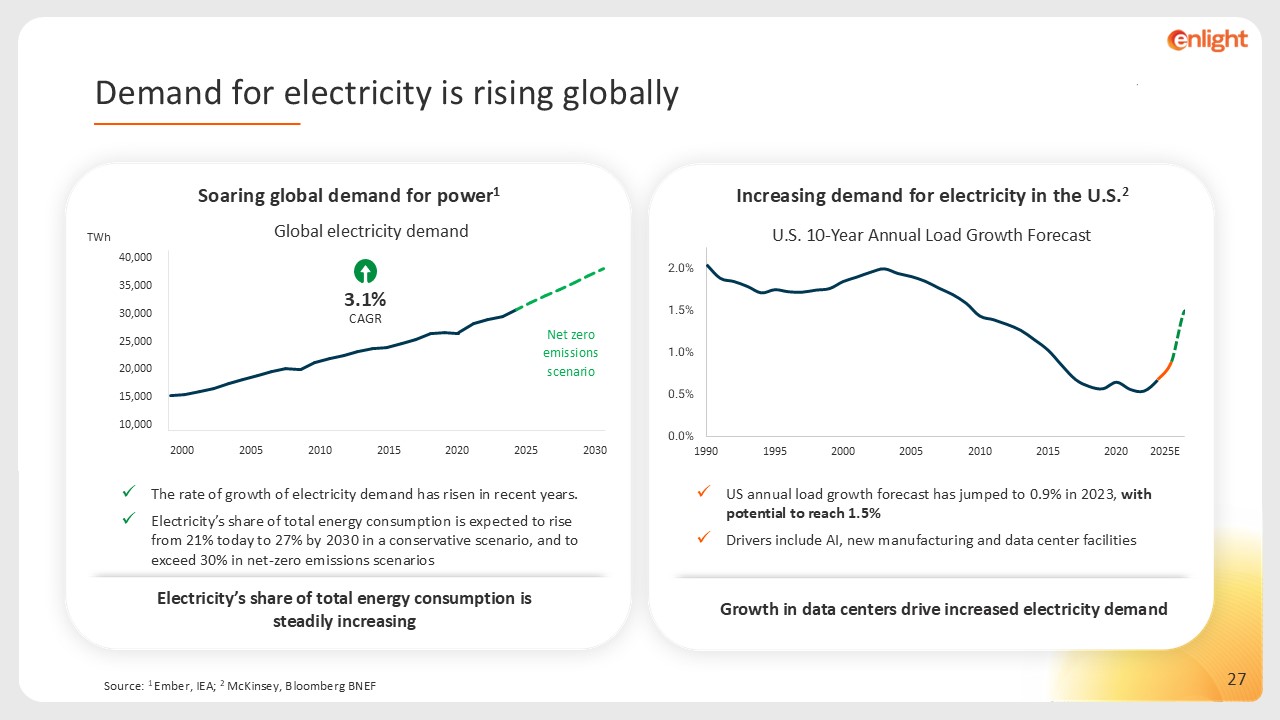
Source: 1 Ember, IEA; 2 McKinsey, Bloomberg BNEF Increasing demand for
electricity in the U.S.2 2025E US annual load growth forecast has jumped to 0.9% in 2023, with potential to reach 1.5% Drivers include AI, new manufacturing and data center facilities Electricity’s share of total energy consumption is
steadily increasing Soaring global demand for power1 The rate of growth of electricity demand has risen in recent years. Electricity’s share of total energy consumption is expected to rise from 21% today to 27% by 2030 in a conservative
scenario, and to exceed 30% in net-zero emissions scenarios TWh Net zero emissions scenario 3.1% CAGR 2000 2010 2020 2030 2005 2015 2025 Growth in data centers drive increased electricity demand Demand for electricity is rising
globally
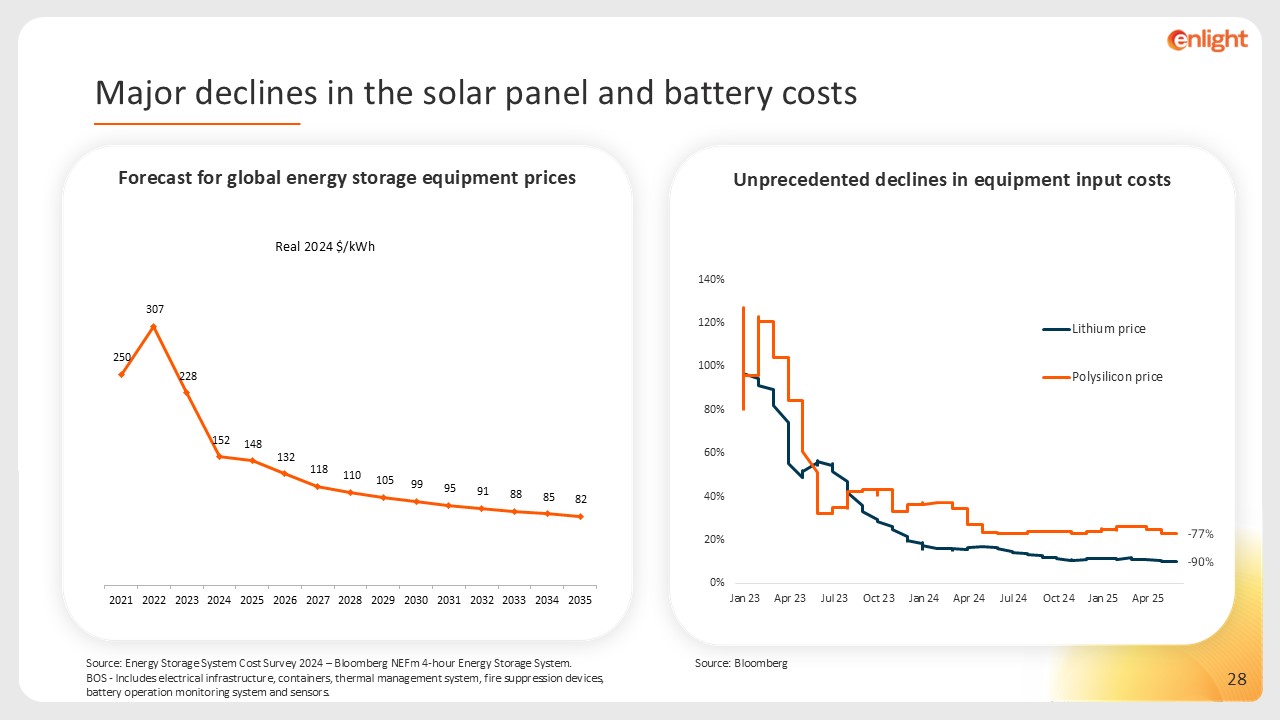
Forecast for global energy storage equipment prices Source: Energy Storage
System Cost Survey 2024 – Bloomberg NEFm 4-hour Energy Storage System. BOS - Includes electrical infrastructure, containers, thermal management system, fire suppression devices, battery operation monitoring system and sensors. Unprecedented
declines in equipment input costs Major declines in the solar panel and battery costs Source: Bloomberg
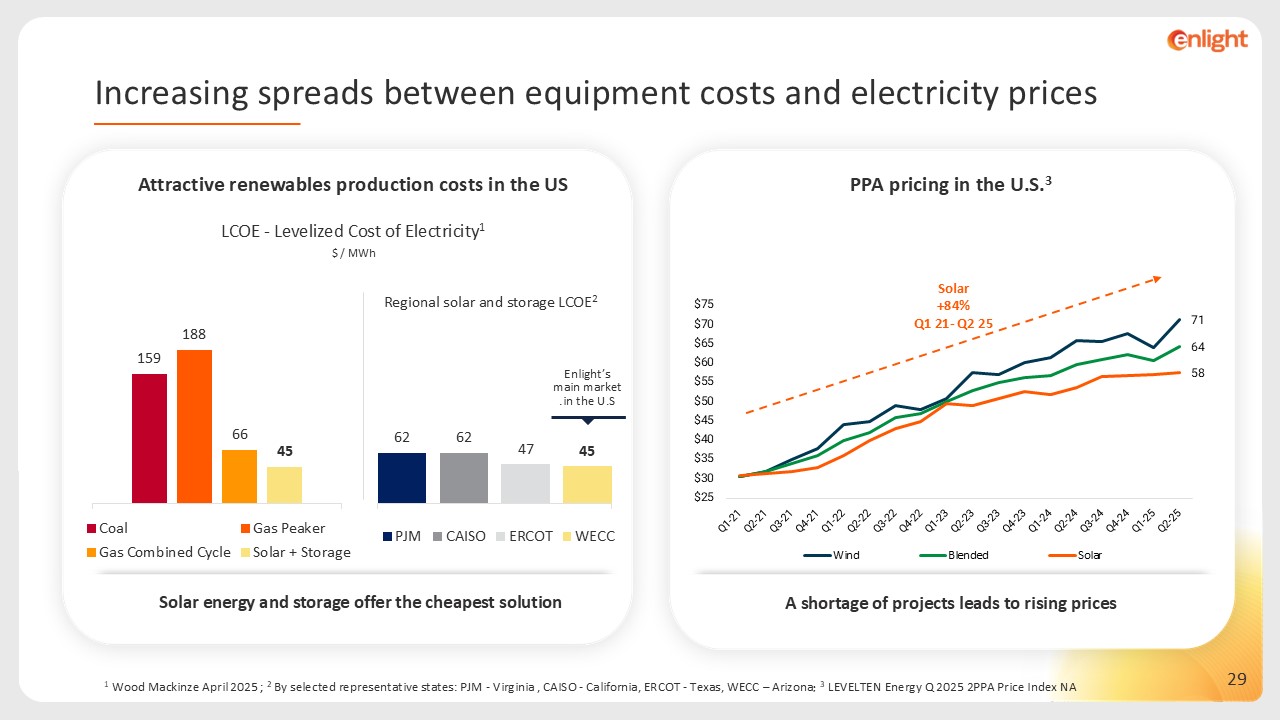
LCOE - Levelized Cost of Electricity1 Attractive renewables production costs in
the US $ / MWh 2Regional solar and storage LCOE Enlight’s main market in the U.S. 1 Wood Mackinze April 2025 ; 2 By selected representative states: PJM - Virginia , CAISO - California, ERCOT - Texas, WECC – Arizona; 3 LEVELTEN Energy Q2
2025 PPA Price Index NA Solar energy and storage offer the cheapest solution Increasing spreads between equipment costs and electricity prices PPA pricing in the U.S.3 A shortage of projects leads to rising prices Solar +84%Q1 21- Q2
25
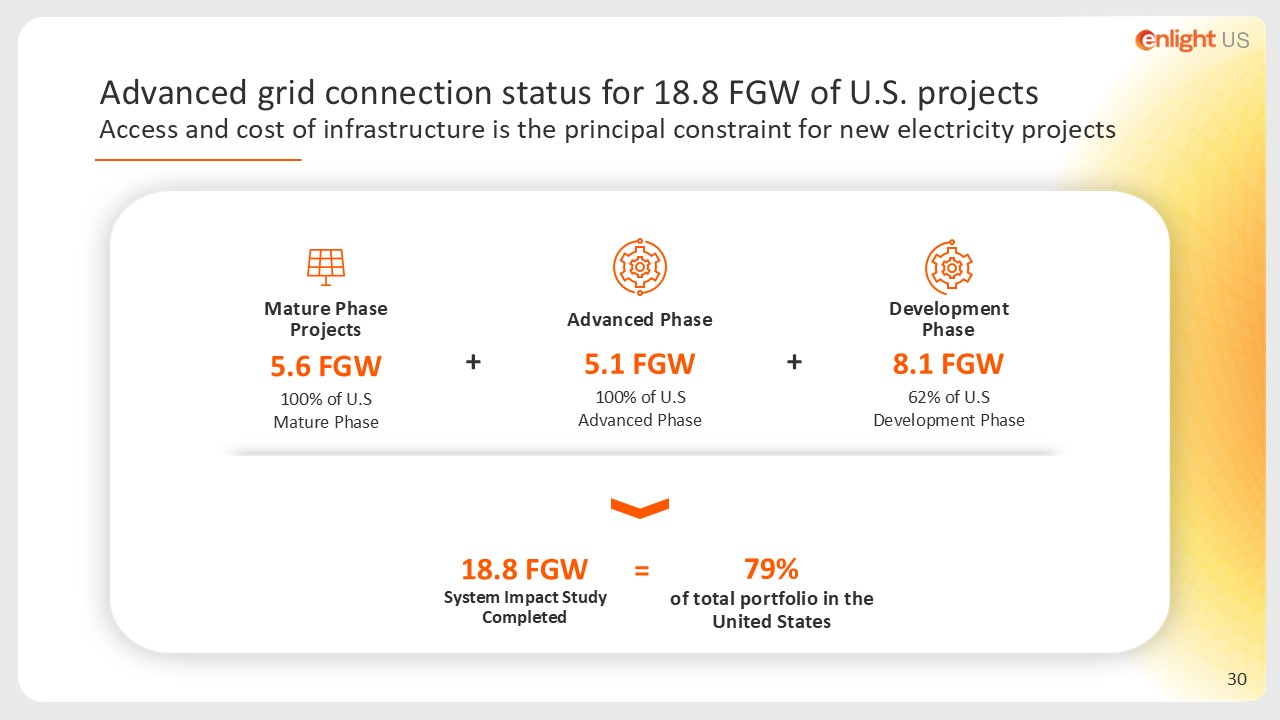
8.1 FGW 62% of U.S Development Phase Development Phase Advanced Phase 5.1
FGW 100% of U.S Advanced Phase Mature Phase Projects 5.6 FGW 100% of U.S Mature Phase 18.8 FGW System Impact Study Completed + + = Advanced grid connection status for 18.8 FGW of U.S. projects Access and cost of infrastructure
is the principal constraint for new electricity projects 79% of total portfolio in the United States