Exhibit 99.1
|
Earnings Release
|
 |
ENLIGHT RENEWABLE ENERGY REPORTS
SECOND QUARTER 2025 FINANCIAL RESULTS
All of the amounts disclosed in this press release are in U.S. dollars unless otherwise noted
TEL AVIV, ISRAEL, August 6, 2025 – Enlight Renewable Energy (NASDAQ: ENLT, TASE: ENLT) today reported financial
results for the second quarter of 2025 ending June 30, 2025. Registration links for the Company’s earnings English and Hebrew conference call and webcasts can be found at the end of this earnings release.
|
The entire suite of the Company’s 2Q25 financial results can be found on our IR website at https://enlightenergy.co.il/data/financial-reports/
|
Financial Highlights
6 months ending June 30, 2025
| • |
Revenue and income of $265m, up 46% year over year
|
| • |
Net income of $107m, up 216% year over year
|
| • |
Adjusted EBITDA2 of $227, up 71% year over year
|
| • |
Cash flow from operations of $91m, unchanged year over year
|
3 months ending June 30, 2025
| • |
Revenues and income of $135m, up 53% year over year
|
| • |
Net Income of $6m, down 41% year over year1
|
| • |
Adjusted EBITDA2 of $96m, up 57% year over year
|
| • |
Cash flow from operations of $48m, down 15% year over year
|
1 An accounting reduction of $12m due to the impact of foreign exchange differentials on a dollar-denominated loan to a subsidiary, with no economic or cashflow effects on the
Company.
2 The Company is unable to provide a reconciliation of Adjusted EBITDA to Net Income on a forward-looking basis without unreasonable effort because items that impact this IFRS financial measure are not within the Company’s control and/or cannot be reasonably predicted. Please refer to the reconciliation table in Appendix
Summary of key financial results for 2Q25 and 1H25
|
For the three months ended
|
|
For the six months ended
|
||||
|
($ millions)
|
30/06/2025
|
30/06/2024
|
% change
|
30/06/2025
|
30/06/2024
|
% change
|
|
Revenues and Income
|
135
|
88
|
53%
|
265
|
182
|
46%
|
|
Net Income
|
6
|
9
|
(41)%
|
107
|
34
|
216%
|
|
Adjusted EBITDA
|
96
|
61
|
57%
|
227
|
133
|
71%
|
|
Cash Flow from Operating Activities
|
48
|
56
|
(15)%
|
91
|
91
|
0%
|
Raising full year guidance ranges
| • |
On the back of strong 1H25 results, we are increasing full year 2025 guidance ranges. Revenue guidance rises to $520-535 million from $490-510 million previously, and Adjusted EBITDA guidance rises to
$385-400 million from $360-380 million previously. This represents a 5.5% and 6.0% increase at the midpoint for both metrics, respectively.
|
| • |
A detailed analysis of financial results appears below.
|
Executive Leadership Changes
On October 1, 2025, Adi Leviatan will become the Company’s Chief Executive Officer, succeeding Gilad Yavetz who was appointed as Enlight’s full-time Executive Chairman of
the Board. Yair Seroussi, our current Chairman of the Board, will serve as Vice Chairman of the Board.
Positive and more certain environment across all geographies
We believe that the terms of the recently passed reconciliation bill are favorable for the utility scale solar and storage segments, providing the large companies such as
Enlight a window of significant growth opportunities. This is especially significant for our extensive portfolio of energy storage projects, which received longer eligibility for tax credits in the new bill. Europe and MENA markets continue to
grow, with strong demand to both renewable energy generation and energy storage.
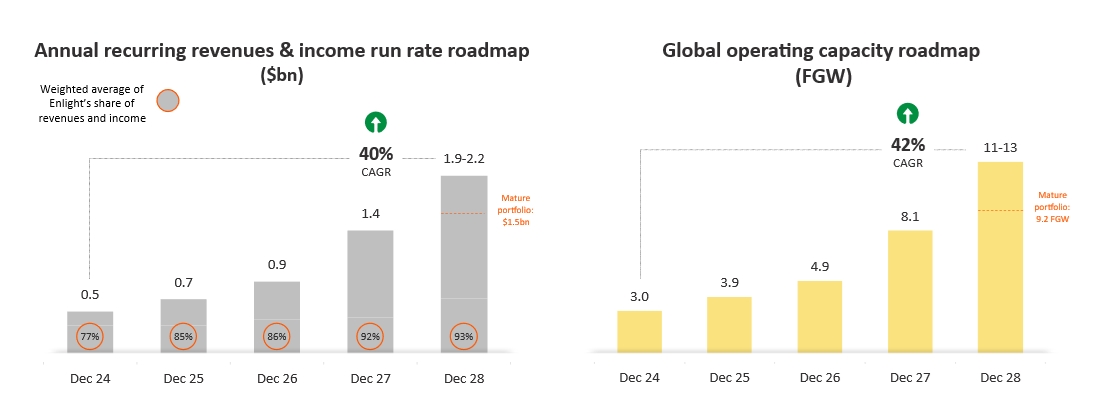
The roadmap which we first presented in May has begun to take shape, and the Company is advancing toward the start of construction of an additional 2 to 4 FGW for COD by
the end of 2028. These projects are not currently included in our mature portfolio. Of these, between 1 to 2 FGW are expected to be built in the U.S. By the end of 2028, the total annual revenue run rate is expected to reach $1.9-2.2 billion.
“We are very pleased with another quarter of extremely strong results in our financial and operational results,” said Gilad Yavetz, CEO of Enlight Renewable Energy. “The
combination of strong execution, coupled with un-compromised business innovation, continues to bear fruit. In parallel we keep on strengthening our management infrastructure. We welcome Adi Leviatan to our strong and well-balanced leadership team.
I’m honored and excited to take the role of executive chairman of the board as of October 1st. I’m confident that with Adi as the new CEO, Enlight will continue to break new grounds.”
Portfolio Review
This quarter we continued substantial advancement of projects through the various phases of our portfolio. Enlight’s total portfolio is comprised of 20.0 GW of generation
capacity and 53.4 GWh energy storage (totaling 35.3 FGW3), an increase of 17% from the total portfolio of 30.2 FGW at the end of 2024. Of this, the Mature portfolio component (including operating projects,
projects under construction or pre-construction) contains 6.2 GW generation capacity and 10.3 GWh of storage (9.2 FGW), an increase of 7% from the Mature portfolio of 8.6 FGW at the end of 2024. The full composition of the portfolio appears in the
following table:
|
Component
|
Status
|
FGW1
|
Annual revenues & income run rate ($m)
|
|
Operating
|
Commercial operation
|
3.1
|
~5274
|
|
Under Construction
|
Under construction
|
2.9
|
~550
|
|
Pre-Construction
|
0-12 months to start of construction
|
3.2
|
~450
|
|
Total Mature Portfolio
|
Mature
|
9.2
|
~1,500
|
|
Advanced Development
|
13-24 months to start of construction
|
6.0
|
-
|
|
Development
|
2+ years to start of construction
|
20.1
|
-
|
|
Total Portfolio
|
|
35.3
|
-
|
| • |
Operating component of the portfolio: 3.1 FGW
|
| o |
During the second quarter, Bar-On floating PV and storage (67 FMW), located in Israel, entered into operation.
|
| o |
The operational portfolio generates annualized revenues and income of approximately $527 million, based on the midpoint rage of the 2025 guidance.
|
| • |
Under Construction component of the portfolio: 2.9 FGW
|
| o |
Consists mostly of four projects in the U.S. with a total capacity of 2.5 FGW.
|
| o |
During the second quarter, Snowflake A (1.1 FGW), located in Arizona, entered into under construction status.
|
| o |
Projects under construction are expected to contribute ~$550m to the annual revenues and income run rate during their first full year of operation.
|
3 FGW (Factored GW) is a consolidated metric combining generation and storage capacity into a uniform figure based on the ratio of construction costs. The company’s current weighted
average construction cost ratio is 3.5 GWh of storage per 1 GW of generation: FGW = GW + GWh / 3.5
4 Based on the midpoint of 2025 guidance.
| • |
Pre-construction component of the portfolio: 3.2 FGW
|
| o |
Significant new additions include Iftah HV (184 FMW), a stand alone storage project in Israel, and the expansion of the solar generation as well as the battery capacity at Nardo in Italy (192 FMW).
|
| o |
Pre-construction projects are expected to contribute ~$450m in revenues and income in their first full year of operations.
|
With the completion of the current Mature portfolio’s pre-construction and under construction projects,
Enlight’s Mature portfolio operating capacity is expected to rise to 9.2 FGW and to generate an annualized revenue and income run rate of $1.5bn by 2028.
| • |
Advanced Development component of the portfolio component: 6.0 FGW
|
| o |
5.1 FGW in the U.S., with 100% of the capacity having passed completion of the System Impact Study. The advanced development portfolio also includes 0.5 FGW in Europe and 0.4 FGW in
MENA.
|
| • |
Development component of the portfolio: 20.1 FGW
|
| o |
13.0 FGW in the U.S. with broad geographic presence, including the PJM, WECC, SPP and MISO regions. The development portfolio also includes 3.4 FGW in Europe and 3.7 FGW in MENA.
|
Roadmap to Revenues and Income Run-Rate of ~$2.0bn by 20285
Project and Corporate Finance
| • |
During the quarter, the Company secured $310m in financial closings for the Gecama hybridization project in Spain, which will add 225 MW solar generation and 220 MWh of energy storage capacity to the
existing 329 MW wind farm.
|
| • |
As at the balance sheet date, the Company maintained $525m of credit facilities, of which $9m have been drawn. Cash and cash equivalents on our balance sheet rose to $480m from $387m at the end of 2024.
In addition, we have approximately $1bn of LC and surety bond facilities supporting our global expansion, of which half was available for use at end of the quarter.
|
2025 Guidance
Construction and commissioning
| • |
Commencing construction on 4.8 FGW of capacity during 2025, (of which 2.9 FGW has already begun), and is expected to add approximately $827-869m in revenues
and income run rate and approximately $726-763m in annualized EBITDA gradually through 2025-2028.
|
5 Expected Adjusted EBITDA margin of approximately 70%-80% for the years shown. FGW (Factored GW) is a consolidated metric combining generation and storage capacity into a uniform
figure based on the ratio of construction costs. The company’s current weighted average construction cost ratio is 3.5 GWh of storage per 1 GW of generation: FGW = GW + GWh / 3.5. The expected growth in 2028 encompasses the Company’s operations in
all geographies. Expected growth relies on business plans which rely on development conditions and assumptions regarding electricity prices, and are contingent on current trends known to the Company at this time. The company's revenues from tax
benefits are estimated at approximately 20-24% of the total revenue run rate for December 2025; approximately 22-26% of the total revenue run rate for December 2026, and approximately 28-33% of the total revenue run rate for December 2027 and
December 2028.
| • |
Out of the 4.8 FGW, we expect commissioning of 0.8 FGW toward the end of 2025, which is expected to add approximately $142-150m to annualized revenues and income and $123-129m to annualized EBITDA.
|
Raising financial guidance ranges
| • |
Total revenues and income6 for 2025 are now expected to range between $520m and $535m, up 5.5% at the midpoint from the previous range of $490m to $510m.
|
| • |
Adjusted EBITDA7 for 2025 is expected to range between $385m and $400m, up 6% at the midpoint from the previous range of $360m to $380m.
|
| • |
Approximately 90% of the electricity volumes expected to be generated in 2025 will be sold at fixed prices through PPAs or hedges.
|
Financial Results Analysis
|
Revenues & Income by Segment
|
|||||||
|
($ millions)
|
For the three months ended
|
For the six months ended
|
|||||
|
Segment
|
30/06/2025
|
30/06/2024
|
% change
|
30/06/2025
|
30/06/2024
|
% change
|
|
|
MENA
|
53
|
38
|
40%
|
96
|
66
|
45%
|
|
|
Europe
|
48
|
42
|
14%
|
99
|
101
|
(2)%
|
|
|
U.S.
|
34
|
5
|
526%
|
69
|
10
|
593%
|
|
|
Other
|
0
|
3
|
(93)%
|
1
|
5
|
(77)%
|
|
|
Total Revenues & Income
|
135
|
88
|
53%
|
265
|
182
|
46%
|
|
Revenues & Income
In the second quarter of 2025, the Company’s total revenues and income increased to $135m, up from $88m last year, a growth rate of 53% year over year. This was composed
of revenues from the sale of electricity, which rose 37% to $116m compared to $85m in the same period of 2024, as well as recognition of $19m in income from tax benefits, up 478% compared to $3m in 2Q24.
The Company benefited from the revenues and income contribution of newly operational projects. Since the second quarter of last year, 525 MW and 1,604 MWh of new
projects were connected to the grid and began selling electricity, including three of the Israel Solar and Storage Cluster units in Israel, Atrisco in the U.S, Pupin in Serbia, and Tapolca in Hungary. The most important increases in revenue from
the sale of electricity originated at Atrisco, which added $13m, followed by the Israel Solar and Storage Cluster, with $12m, while Pupin contributed $4m. In total, new projects contributed $30m to revenues from the sale of electricity.
Recognition of tax benefit income increased by $16m due to the initial commissioning of Atrisco. Revenues and income for the quarter were distributed between MENA (40%); Europe (35%); and the US (25%).
6 Total revenues and income include revenues from the sale of electricity along with income from tax benefits from US projects amounting to $70m-$80m.
7 EBITDA is a non-IFRS financial measure. The Company is unable to provide a reconciliation of EBITDA to Net Income on a forward-looking basis without unreasonable effort because
items that impact this IFRS financial measure are not within the Company’s control and/or cannot be reasonably predicted. Please refer to the reconciliation table in Appendix 2.
Net Income
In the second quarter of 2025, the Company reported net income of $6 million, representing a 41% decrease from $9 million in the same period last year. This was primarily
attributable to several factors: new projects contributed $15 million to net income, while a non-cash accounting reduction due to the impact of foreign exchange differentials on a dollar-denominated loan to a subsidiary resulted in a year-on-year
decrease of $12 million. Additionally, other financial expenses increased by $8 million (all amounts stated after tax). Adjusting for the effects of foreign currency accounting reduction, net income amounted to $16m compared to $7m the same quarter
last year, an increase of 110% year over year.
Adjusted EBITDA8
The Company’s Adjusted EBITDA grew by 57% to $96m in the second quarter of 2025, compared to $61m for the same period in 2024. Of this increase, $50m was driven by the factors described above
paragraphs. This was offset by an increase of $13m in COGS linked to the addition of new projects, and an increase of $3m in operating expenses.
8 Adjusted EBITDA is a non-IFRS measure. Please see the appendix of this presentation for a reconciliation to Net Income
Conference Call Information
Enlight plans to hold its Second Quarter 2025 Conference Call and Webcasts on Wednesday, August 6, 2025 to review its financial results and business outlook in both
English and Hebrew. Management will deliver prepared remarks followed by a question-and-answer session. Participants can join by dial-in or webcast:
| • |
English Conference Call at 8:00am ET / 3:00pm Israel:
|
Please pre-register to join by conference call using the following link:
https://register-conf.media-server.com/register/BI46289c60b7164253aa692c51490ef8ad
Upon registering, you will be emailed a dial-in number, direct passcode and unique PIN.
| • |
English Webcast at 8:00am ET / 3:00pm Israel:
|
Please register and join by webcast at the following link:
https://edge.media-server.com/mmc/p/8u3xaw6u
| • |
Hebrew Webcast at 6:00am ET / 1:00pm Israel:
|
Please join the webcast at the following link:
https://enlightenergy-co-il.zoom.us/webinar/register/WN_Fz0XzgWkRBKz4OA0OO7cnQ
The press release with the financial results as well as the investor
presentation materials will be accessible from the Company’s website prior to the conference call. An archived version of the webcast will be available on the Company’s investor relations website at https://enlightenergy.co.il/info/investors/.
Supplemental Financial and Other Information
We intend to announce material information to the public through the Enlight investor relations
website at https://enlightenergy.co.il/info/investors, SEC
filings, press releases, public conference calls, and public webcasts. We use these channels to communicate with our investors, customers, and the public about our company, our offerings, and other issues. As such, we encourage investors, the
media, and others to follow the channels listed above, and to review the information disclosed through such channels. Any updates to the list of disclosure channels through which we will announce information will be posted on the investor
relations page of our website.
Non-IFRS Financial Measures
This release presents Adjusted EBITDA, a financial metric, which is provided as a complement to the results provided in accordance with the International Financial
Reporting Standards as issued by the International Accounting Standards Board (“IFRS”). A reconciliation of the non-IFRS financial information to the most directly comparable IFRS financial measure is provided in the accompanying tables found at
the end of this release.
We define Adjusted EBITDA as net income (loss) plus depreciation and amortization, share based compensation, finance expenses, taxes on income and share in losses of
equity accounted investees and minus finance income and non-recurring portions of other income, net. For the purposes of calculating Adjusted EBITDA, compensation for inadequate performance of goods and services procured by the Company are included
in other income, net. Compensation for inadequate performance of goods and services reflects the profits the Company would have generated under regular operating conditions and is therefore included in Adjusted EBITDA. With respect to gains
(losses) from asset disposals, as part of Enlight’s strategy to accelerate growth and reduce the need for equity financing, the Company sells parts of or the entirety of selected renewable project assets from time to time, and therefore includes
realized gains or losses from these asset disposals in Adjusted EBITDA. In the case of partial assets disposals, Adjusted EBITDA includes only the actual consideration less the book value of the assets sold. Our management believes Adjusted EBITDA
is indicative of operational performance and ongoing profitability and uses Adjusted EBITDA to evaluate the operating performance and for planning and forecasting purposes.
Non-IFRS financial measures have limitations as analytical tools and should not be considered in isolation or as substitutes for financial information presented under
IFRS. There are a number of limitations related to the use of non-IFRS financial measures versus comparable financial measures determined under IFRS. For example, other companies in our industry may calculate the non-IFRS financial measures that we
use differently or may use other measures to evaluate their performance. All of these limitations could reduce the usefulness of our non-IFRS financial measures as analytical tools. Investors are encouraged to review the related IFRS financial
measure, Net Income, and the reconciliations of Adjusted EBITDA provided below to Net Income and to not rely on any single financial measure to evaluate our business.
Special Note Regarding Forward-Looking Statements
This press release contains forward-looking statements within the meaning of the U.S. Private Securities Litigation Reform Act of 1995. We intend such forward-looking
statements to be covered by the safe harbor provisions for forward-looking statements as contained in Section 27A of the Securities Act of 1933, as amended, and Section 21E of the Securities Exchange Act of 1934, as amended. All statements
contained in this press release other than statements of historical fact, including, without limitation, statements regarding the Company’s business strategy and plans, capabilities of the Company’s project portfolio and achievement of operational
objectives, market opportunity, utility demand and potential growth, discussions with commercial counterparties and financing sources, pricing trends for materials, progress of Company projects, including anticipated timing of related approvals and
project completion and anticipated production delays, the Company’s future financial results, expected impact from various regulatory developments and anticipated trade sanctions, expectations regarding wind production, electricity prices and
windfall taxes, and Revenues and Income and Adjusted EBITDA guidance, the expected timing of completion of our ongoing projects, and the Company’s anticipated cash requirements and financing plans , are forward-looking statements. The words “may,”
“might,” “will,” “could,” “would,” “should,” “expect,” “plan,” “anticipate,” “intend,” “target,” “seek,” “believe,” “estimate,” “predict,” “potential,” “continue,” “contemplate,” “possible,” “forecasts,” “aims” or the negative of these terms and
similar expressions are intended to identify forward-looking statements, though not all forward-looking statements use these words or expressions.
These statements are neither promises nor guarantees, but involve known and unknown risks, uncertainties and other important factors that may cause our actual results,
performance or achievements to be materially different from any future results, performance or achievements expressed or implied by the forward-looking statements, including, but not limited to, the following: our ability to site suitable land
for, and otherwise source, renewable energy projects and to successfully develop and convert them into Operational Projects; availability of, and access to, interconnection facilities and transmission systems; our ability to obtain and maintain
governmental and other regulatory approvals and permits, including environmental approvals and permits; construction delays, operational delays and supply chain disruptions leading to increased cost of materials required for the construction of our
projects, as well as cost overruns and delays related to disputes with contractors; disruptions in trade caused by political, social or economic instability in regions where our components and materials are made; our suppliers’ ability and
willingness to perform both existing and future obligations; competition from traditional and renewable energy companies in developing renewable energy projects; potential slowed demand for renewable energy projects and our ability to enter into
new offtake contracts on acceptable terms and prices as current offtake contracts expire; offtakers’ ability to terminate contracts or seek other remedies resulting from failure of our projects to meet development, operational or performance
benchmarks; exposure to market prices in some of our offtake contracts; various technical and operational challenges leading to unplanned outages, reduced output, interconnection or termination issues; the dependence of our production and revenue
on suitable meteorological and environmental conditions, and our ability to accurately predict such conditions; our ability to enforce warranties provided by our counterparties in the event that our projects do not perform as expected; government
curtailment, energy price caps and other government actions that restrict or reduce the profitability of renewable energy production; electricity price volatility, unusual weather conditions (including the effects of climate change, could adversely
affect wind and solar conditions), catastrophic weather-related or other damage to facilities, unscheduled generation outages, maintenance or repairs, unanticipated changes to availability due to higher demand, shortages, transportation problems or
other developments, environmental incidents, or electric transmission system constraints and the possibility that we may not have adequate insurance to cover losses as a result of such hazards; our dependence on certain operational projects for a
substantial portion of our cash flows; our ability to continue to grow our portfolio of projects through successful acquisitions; changes and advances in technology that impair or eliminate the competitive advantage of our projects or upsets the
expectations underlying investments in our technologies; our ability to effectively anticipate and manage cost inflation, interest rate risk, currency exchange fluctuations and other macroeconomic conditions that impact our business; our ability to
retain and attract key personnel; our ability to manage legal and regulatory compliance and litigation risk across our global corporate structure; our ability to protect our business from, and manage the impact of, cyber-attacks, disruptions and
security incidents, as well as acts of terrorism or war; changes to existing renewable energy industry policies and regulations that present technical, regulatory and economic barriers to renewable energy projects; the reduction, elimination or
expiration of government incentives or benefits for, or regulations mandating the use of, renewable energy; our ability to effectively manage the global expansion of the scale of our business operations; our ability to perform to expectations in
our new line of business involving the construction of PV systems for municipalities in Israel; our ability to effectively manage our supply chain and comply with applicable regulations with respect to international trade relations, the impact of
tariffs on the cost of construction and our ability to mitigate such impact, sanctions, export controls and anti-bribery and anti-corruption laws; our ability to effectively comply with Environmental Health and Safety and other laws and regulations
and receive and maintain all necessary licenses, permits and authorizations; our performance of various obligations under the terms of our indebtedness (and the indebtedness of our subsidiaries that we guarantee) and our ability to continue to
secure project financing on attractive terms for our projects; limitations on our management rights and operational flexibility due to our use of tax equity arrangements; potential claims and disagreements with partners, investors and other
counterparties that could reduce our right to cash flows generated by our projects; our ability to comply with increasingly complex tax laws of various jurisdictions in which we currently operate as well as the tax laws in jurisdictions in which we
intend to operate in the future; the unknown effect of the dual listing of our ordinary shares on the price of our ordinary shares; various risks related to our incorporation and location in Israel, including the ongoing war in Israel, where our
headquarters and some of our wind energy and solar energy projects are located; the costs and requirements of being a public company, including the diversion of management’s attention with respect to such requirements; certain provisions in our
Articles of Association and certain applicable regulations that may delay or prevent a change of control; and other risk factors set forth in the section titled “Risk factors” in our Annual Report on Form 20-F for the fiscal year ended December 31,
2024, filed with the Securities and Exchange Commission (the “SEC”), as may be updated in our other documents filed with or furnished to the SEC.
These statements reflect management’s current expectations regarding future events and operating performance and speak only as of the date of this
press release. You should not put undue reliance on any forward-looking statements. Although we believe that the expectations reflected in the forward-looking statements are reasonable, we cannot guarantee that future results, levels of activity,
performance and events and circumstances reflected in the forward-looking statements will be achieved or will occur. Except as required by applicable law, we undertake no obligation to update or revise publicly any forward-looking statements,
whether as a result of new information, future events or otherwise, after the date on which the statements are made or to reflect the occurrence of unanticipated events.
About Enlight
Founded in 2008, Enlight develops, finances, constructs, owns, and operates utility-scale renewable energy projects. Enlight operates across the three largest renewable
segments today: solar, wind and energy storage. A global platform, Enlight operates in the United States, Israel and 10 European countries. Enlight has been traded on the Tel Aviv Stock Exchange since 2010 (TASE: ENLT) and completed its U.S. IPO
(Nasdaq: ENLT) in 2023.
Company Contacts
Yonah Weisz
Director IR
investors@enlightenergy.co.il
Erica Mannion or Mike Funari
Sapphire Investor Relations, LLC
+1 617 542 6180
investors@enlightenergy.co.il
Appendix 1 – Financial information
Consolidated Statements of Income
|
For the six months ended June 30
|
For the three months ended June 30
|
|||||||||||||||
|
2025
|
2024(*)
|
2025
|
2024(*)
|
|||||||||||||
|
USD in
|
USD in
|
USD in
|
USD in
|
|||||||||||||
|
thousands
|
thousands
|
thousands
|
thousands
|
|||||||||||||
|
Revenues
|
225,875
|
175,095
|
116,117
|
84,698
|
||||||||||||
|
Tax benefits
|
38,972
|
6,526
|
18,861
|
3,262
|
||||||||||||
|
Total revenues and income
|
264,847
|
181,621
|
134,978
|
87,960
|
||||||||||||
|
Cost of sales (**)
|
(56,484
|
)
|
(32,421
|
)
|
(29,846
|
)
|
(16,985
|
)
|
||||||||
|
Depreciation and amortization
|
(71,017
|
)
|
(50,886
|
)
|
(37,228
|
)
|
(25,282
|
)
|
||||||||
|
General and administrative expenses
|
(23,336
|
)
|
(18,142
|
)
|
(11,490
|
)
|
(9,283
|
)
|
||||||||
|
Development expenses
|
(5,469
|
)
|
(4,542
|
)
|
(2,905
|
)
|
(2,124
|
)
|
||||||||
|
Total operating expenses
|
(156,306
|
)
|
(105,991
|
)
|
(81,469
|
)
|
(53,674
|
)
|
||||||||
|
Gains from projects disposals
|
97,828
|
611
|
566
|
584
|
||||||||||||
|
Other income (expenses), net
|
2,374
|
1,528
|
3,479
|
11
|
||||||||||||
|
Operating profit
|
208,743
|
77,769
|
57,554
|
34,881
|
||||||||||||
|
Finance income
|
8,166
|
15,065
|
1,471
|
7,000
|
||||||||||||
|
Finance expenses
|
(82,286
|
)
|
(49,311
|
)
|
(52,083
|
)
|
(29,818
|
)
|
||||||||
|
Total finance expenses, net
|
(74,120
|
)
|
(34,246
|
)
|
(50,612
|
)
|
(22,818
|
)
|
||||||||
|
Profit before tax and equity loss
|
134,623
|
43,523
|
6,942
|
12,063
|
||||||||||||
|
Share of loss of equity accounted investees
|
(1,645
|
)
|
(449
|
)
|
(418
|
)
|
(305
|
)
|
||||||||
|
Profit before income taxes
|
132,978
|
43,074
|
6,524
|
11,758
|
||||||||||||
|
Taxes on income
|
(25,606
|
)
|
(9,130
|
)
|
(955
|
)
|
(2,299
|
)
|
||||||||
|
Profit for the period
|
107,372
|
33,944
|
5,569
|
9,459
|
||||||||||||
|
Profit for the period attributed to:
|
||||||||||||||||
|
Owners of the Company
|
95,815
|
24,806
|
1,357
|
8,043
|
||||||||||||
|
Non-controlling interests
|
11,557
|
9,138
|
4,212
|
1,416
|
||||||||||||
|
107,372
|
33,944
|
5,569
|
9,459
|
|||||||||||||
|
Earnings per ordinary share (in USD) with a par
|
||||||||||||||||
|
value of NIS 0.1, attributable to owners of the
|
||||||||||||||||
|
parent Company:
|
||||||||||||||||
|
Basic earnings per share
|
0.80
|
0.21
|
0.75
|
0.07
|
||||||||||||
|
Diluted earnings per share
|
0.01
|
0.20
|
0.01
|
0.06
|
||||||||||||
|
Weighted average of share capital used in the
|
||||||||||||||||
|
calculation of earnings:
|
||||||||||||||||
|
Basic per share
|
119,107,985
|
118,104,228
|
119,421,246
|
117,825,464
|
||||||||||||
|
Diluted per share
|
127,192,179
|
123,092,306
|
129,204,402
|
125,866,004
|
||||||||||||
(*) The Consolidated Statements of Income have been adjusted to present comparable information for the previous period. For additional details please see Appendix 9.
(**) Excluding depreciation and amortization.
|
Consolidated Statements of Financial Position as of
|
||||||||
|
June 30
|
December 31
|
|||||||
|
2025
|
2024
|
|||||||
|
USD in
|
USD in
|
|||||||
|
Thousands
|
Thousands
|
|||||||
|
Assets
|
||||||||
|
Current assets
|
||||||||
|
Cash and cash equivalents
|
480,459
|
387,427
|
||||||
|
Restricted cash
|
86,164
|
87,539
|
||||||
|
Trade receivables
|
78,329
|
50,692
|
||||||
|
Other receivables
|
66,244
|
99,651
|
||||||
|
Other financial assets
|
693
|
975
|
||||||
|
Assets of disposal groups classified as held for sale
|
-
|
81,661
|
||||||
|
Total current assets
|
711,889
|
707,945
|
||||||
|
Non-current assets
|
||||||||
|
Restricted cash
|
64,489
|
60,802
|
||||||
|
Other long-term receivables
|
65,046
|
61,045
|
||||||
|
Deferred costs in respect of projects
|
448,096
|
357,358
|
||||||
|
Deferred borrowing costs
|
280
|
276
|
||||||
|
Loans to investee entities
|
57,561
|
18,112
|
||||||
|
Investments in equity accounted investees
|
54,145
|
-
|
||||||
|
Fixed assets, net
|
4,747,284
|
3,699,192
|
||||||
|
Intangible assets, net
|
303,895
|
291,442
|
||||||
|
Deferred taxes assets
|
9,195
|
10,744
|
||||||
|
Right-of-use asset, net
|
217,783
|
210,941
|
||||||
|
Financial assets at fair value through profit or loss
|
79,043
|
69,216
|
||||||
|
Other financial assets
|
64,989
|
59,812
|
||||||
|
Total non-current assets
|
6,111,806
|
4,838,940
|
||||||
|
Total assets
|
6,823,695
|
5,546,885
|
||||||
|
Consolidated Statements of Financial Position as of (Cont.)
|
||||||||
|
June 30
|
December 31
|
|||||||
|
2025
|
2024
|
|||||||
|
USD in
|
USD in
|
|||||||
|
Thousands
|
Thousands
|
|||||||
|
Liabilities and equity
|
||||||||
|
Current liabilities
|
||||||||
|
Credit and current maturities of loans from banks and other financial institutions
|
504,684
|
212,246
|
||||||
|
Trade payables
|
126,956
|
161,991
|
||||||
|
Other payables
|
338,492
|
107,825
|
||||||
|
Current maturities of debentures
|
25,414
|
44,962
|
||||||
|
Current maturities of lease liability
|
11,158
|
10,240
|
||||||
|
Other financial liabilities
|
12,935
|
8,141
|
||||||
|
Liabilities of disposal groups classified as held for sale
|
-
|
46,635
|
||||||
|
Total current liabilities
|
1,019,639
|
592,040
|
||||||
|
Non-current liabilities
|
||||||||
|
Debentures
|
609,172
|
433,994
|
||||||
|
Other financial liabilities
|
122,657
|
107,865
|
||||||
|
Convertible debentures
|
257,647
|
133,056
|
||||||
|
Loans from banks and other financial institutions
|
2,294,910
|
1,996,137
|
||||||
|
Loans from non-controlling interests
|
86,623
|
75,598
|
||||||
|
Financial liabilities through profit or loss
|
26,427
|
25,844
|
||||||
|
Deferred taxes liabilities
|
69,492
|
41,792
|
||||||
|
Employee benefits
|
1,495
|
1,215
|
||||||
|
Lease liability
|
220,938
|
211,941
|
||||||
|
Deferred income related to tax equity
|
372,446
|
403,384
|
||||||
|
Asset retirement obligation
|
93,806
|
83,085
|
||||||
|
Total non-current liabilities
|
4,155,613
|
3,513,911
|
||||||
|
Total liabilities
|
5,175,252
|
4,105,951
|
||||||
|
Equity
|
||||||||
|
Ordinary share capital
|
3,344
|
3,308
|
||||||
|
Share premium
|
1,028,526
|
1,028,532
|
||||||
|
Capital reserves
|
81,575
|
25,273
|
||||||
|
Proceeds on account of convertible options
|
25,083
|
15,494
|
||||||
|
Accumulated profit
|
203,734
|
107,919
|
||||||
|
Equity attributable to shareholders of the Company
|
1,342,262
|
1,180,526
|
||||||
|
Non-controlling interests
|
306,181
|
260,408
|
||||||
|
Total equity
|
1,648,443
|
1,440,934
|
||||||
|
Total liabilities and equity
|
6,823,695
|
5,546,885
|
||||||
|
Consolidated Statements of Cash Flows
|
||||||||||||||||
|
For the six months ended June 30
|
For the three months ended June 30
|
|||||||||||||||
|
2025
|
2024
|
2025
|
2024
|
|||||||||||||
|
USD in
|
USD in
|
USD in
|
USD in
|
|||||||||||||
|
Thousands
|
Thousands
|
Thousands
|
Thousands
|
|||||||||||||
|
Cash flows for operating activities
|
||||||||||||||||
|
Profit for the period
|
107,372
|
33,944
|
5,569
|
9,459
|
||||||||||||
|
Income and expenses not associated with cash flows:
|
||||||||||||||||
|
Depreciation and amortization
|
71,017
|
50,886
|
37,228
|
25,282
|
||||||||||||
|
Finance expenses, net
|
71,073
|
33,766
|
48,685
|
22,280
|
||||||||||||
|
Share-based compensation
|
2,994
|
4,085
|
1,284
|
968
|
||||||||||||
|
Taxes on income
|
25,606
|
9,130
|
955
|
2,299
|
||||||||||||
|
Tax benefits
|
(38,972
|
)
|
(6,526
|
)
|
(18,861
|
)
|
(3,262
|
)
|
||||||||
|
Other income (expenses), net
|
(2,374
|
)
|
432
|
(3,479
|
)
|
566
|
||||||||||
|
Company’s share in losses of investee partnerships
|
1,645
|
449
|
418
|
305
|
||||||||||||
|
Gains from projects disposals
|
(97,828
|
)
|
(611
|
)
|
(566
|
)
|
(584
|
)
|
||||||||
|
33,161
|
91,611
|
65,664
|
47,854
|
|||||||||||||
|
Changes in assets and liabilities items:
|
||||||||||||||||
|
Change in other receivables
|
(4,593
|
)
|
(4,352
|
)
|
(3,737
|
)
|
(2,210
|
)
|
||||||||
|
Change in trade receivables
|
(20,885
|
)
|
3,072
|
(509
|
)
|
19,981
|
||||||||||
|
Change in other payables
|
21,470
|
860
|
12,866
|
1,399
|
||||||||||||
|
Change in trade payables
|
(2,650
|
)
|
(856
|
)
|
(10,452
|
)
|
(927
|
)
|
||||||||
|
(6,658
|
)
|
(1,276
|
)
|
(1,832
|
)
|
18,243
|
||||||||||
|
Interest receipts
|
6,334
|
5,366
|
3,822
|
2,438
|
||||||||||||
|
Interest paid
|
(40,387
|
)
|
(33,793
|
)
|
(18,089
|
)
|
(18,169
|
)
|
||||||||
|
Income Tax paid
|
(8,673
|
)
|
(4,783
|
)
|
(7,598
|
)
|
(3,985
|
)
|
||||||||
|
Net cash from operating activities
|
91,149
|
91,069
|
47,536
|
55,840
|
||||||||||||
|
Cash flows for investing activities
|
||||||||||||||||
|
Sale (Acquisition) of consolidated entities, net
|
33,018
|
(1,388
|
)
|
(3,205
|
)
|
-
|
||||||||||
|
Changes in restricted cash and bank deposits, net
|
8,186
|
(15,370
|
)
|
10
|
(10,382
|
)
|
||||||||||
|
Purchase, development, and construction in respect of projects
|
(658,022
|
)
|
(461,801
|
)
|
(402,160
|
)
|
(262,068
|
)
|
||||||||
|
Loans provided and Investment in investees
|
(26,324
|
)
|
(14,216
|
)
|
(18,894
|
)
|
(2,932
|
)
|
||||||||
|
Repayment of loans to investees
|
30,815
|
-
|
-
|
-
|
||||||||||||
|
Payments on account of acquisition of consolidated company
|
(7,447
|
)
|
(10,851
|
)
|
-
|
-
|
||||||||||
|
Purchase of long-term financial assets measured at fair value through profit or loss, net
|
(3,247
|
)
|
(11,340
|
)
|
(207
|
)
|
(2,931
|
)
|
||||||||
|
Net cash used in investing activities
|
(623,021
|
)
|
(514,966
|
)
|
(424,456
|
)
|
(278,313
|
)
|
||||||||
|
Consolidated Statements of Cash Flows (Cont.)
|
||||||||||||||||
|
For the six months ended June 30
|
For the three months ended June 30
|
|||||||||||||||
|
2025
|
2024
|
2025
|
2024
|
|||||||||||||
|
USD in
|
USD in
|
USD in
|
USD in
|
|||||||||||||
|
Thousands
|
Thousands
|
Thousands
|
Thousands
|
|||||||||||||
|
Cash flows from financing activities
|
||||||||||||||||
|
Receipt of loans from banks and other financial institutions
|
674,684
|
330,449
|
531,106
|
259,078
|
||||||||||||
|
Repayment of loans from banks and other financial institutions
|
(223,361
|
)
|
(77,197
|
)
|
(114,439
|
)
|
(66,749
|
)
|
||||||||
|
Issuance of debentures
|
125,838
|
-
|
-
|
-
|
||||||||||||
|
Issuance of convertible debentures
|
114,685
|
-
|
-
|
-
|
||||||||||||
|
Repayment of debentures
|
(21,994
|
)
|
(1,284
|
)
|
-
|
-
|
||||||||||
|
Dividends and distributions by subsidiaries to non-controlling interests
|
(8,682
|
)
|
(3,450
|
)
|
(8,682
|
)
|
(3,342
|
)
|
||||||||
|
Deferred borrowing costs
|
(46,618
|
)
|
(5,378
|
)
|
(11,419
|
)
|
(2,696
|
)
|
||||||||
|
Repayment of loans from non-controlling interests
|
-
|
(1,000
|
)
|
-
|
(45
|
)
|
||||||||||
|
Increase in holding rights of consolidated entity
|
(1,392
|
)
|
(167
|
)
|
-
|
(167
|
)
|
|||||||||
|
Repayment of tax-equity investment
|
(10,952
|
)
|
-
|
(10,952
|
)
|
-
|
||||||||||
|
Receipt of loans from non-controlling interests
|
182
|
-
|
182
|
-
|
||||||||||||
|
Exercise of share options
|
30
|
13
|
19
|
13
|
||||||||||||
|
Repayment of lease liability
|
(5,803
|
)
|
(4,117
|
)
|
(1,745
|
)
|
(446
|
)
|
||||||||
|
Proceeds from investment in entities by non-controlling interest
|
12,799
|
179
|
5,067
|
27
|
||||||||||||
|
Net cash from financing activities
|
609,416
|
238,048
|
389,137
|
185,673
|
||||||||||||
|
Increase (Decrease) in cash and cash equivalents
|
77,544
|
(185,849
|
)
|
12,217
|
(36,800
|
)
|
||||||||||
|
Balance of cash and cash equivalents at beginning of period
|
387,427
|
403,805
|
449,530
|
249,851
|
||||||||||||
|
Effect of exchange rate fluctuations on cash and cash equivalents
|
15,488
|
(9,165
|
)
|
18,712
|
(4,260
|
)
|
||||||||||
|
Cash and cash equivalents at end of period
|
480,459
|
208,791
|
480,459
|
208,791
|
||||||||||||
Information related to Segmental Reporting
|
For the six months ended June 30, 2025
|
||||||||||||||||||||||||
|
MENA
|
Europe
|
USA
|
Total reportable segments(**)
|
Others
|
Total
|
|||||||||||||||||||
|
USD in thousands
|
||||||||||||||||||||||||
|
Revenues
|
95,637
|
99,184
|
30,008
|
224,829
|
1,046
|
225,875
|
||||||||||||||||||
|
Tax benefits
|
-
|
-
|
38,972
|
38,972
|
-
|
38,972
|
||||||||||||||||||
|
Total revenues and income
|
95,637
|
99,184
|
68,980
|
263,801
|
1,046
|
264,847
|
||||||||||||||||||
|
Segment adjusted EBITDA
|
107,031
|
82,226
|
59,913
|
249,170
|
1,079
|
250,249
|
||||||||||||||||||
|
Reconciliations of unallocated amounts:
|
||||||||||||||||||||||||
|
Headquarter costs (*)
|
(22,958
|
)
|
||||||||||||||||||||||
|
Intersegment profit
|
127
|
|||||||||||||||||||||||
|
Gains from projects disposals
|
55,336
|
|||||||||||||||||||||||
|
Depreciation and amortization and share-based compensation
|
(74,011
|
)
|
||||||||||||||||||||||
|
Operating profit
|
208,743
|
|||||||||||||||||||||||
|
Finance income
|
8,166
|
|||||||||||||||||||||||
|
Finance expenses
|
(82,286
|
)
|
||||||||||||||||||||||
|
Share in the losses of equity accounted investees
|
(1,645
|
)
|
||||||||||||||||||||||
|
Profit before income taxes
|
132,978
|
|||||||||||||||||||||||
| (*) |
Including general and administrative and development expenses (excluding depreciation and amortization and share based compensation).
|
| (**) |
Due to the Company's organizational restructuring, the Chief Operation Decision Maker (CODM) now reviews the group’s results by segmenting them into three business units: MENA (Middle East and North
Africa), Europe, and the US. Consequently, the Management and Construction segment has been excluded. The comparative figures for the six-month and three-month periods ending June 30,
2024, have been updated accordingly.
|
Information related to Segmental Reporting
|
For the six months ended June 30, 2024
|
||||||||||||||||||||||||
|
MENA
|
Europe
|
USA
|
Total reportable segments
|
Others
|
Total
|
|||||||||||||||||||
|
USD in thousands
|
||||||||||||||||||||||||
|
Revenues
|
66,041
|
101,123
|
3,431
|
170,595
|
4,500
|
175,095
|
||||||||||||||||||
|
Tax benefits
|
-
|
-
|
6,526
|
6,526
|
-
|
6,526
|
||||||||||||||||||
|
Total revenues and income
|
66,041
|
101,123
|
9,957
|
177,121
|
4,500
|
181,621
|
||||||||||||||||||
|
Segment adjusted EBITDA
|
54,873
|
83,253
|
7,831
|
145,957
|
2,291
|
148,248
|
||||||||||||||||||
|
Reconciliations of unallocated amounts:
|
||||||||||||||||||||||||
|
Headquarter costs (*)
|
(15,629
|
)
|
||||||||||||||||||||||
|
Intersegment profit
|
121
|
|||||||||||||||||||||||
|
Depreciation and amortization and share-based compensation
|
(54,971
|
)
|
||||||||||||||||||||||
|
Operating profit
|
77,769
|
|||||||||||||||||||||||
|
Finance income
|
15,065
|
|||||||||||||||||||||||
|
Finance expenses
|
(49,311
|
)
|
||||||||||||||||||||||
|
Share in the losses of equity accounted investees
|
(449
|
)
|
||||||||||||||||||||||
|
Profit before income taxes
|
43,074
|
|||||||||||||||||||||||
| (*) |
Including general and administrative and development expenses (excluding depreciation and amortization and share based compensation).
|
Information related to Segmental Reporting
|
For the three months ended June 30, 2025
|
||||||||||||||||||||||||
|
MENA
|
Europe
|
USA
|
Total reportable segments
|
Others
|
Total
|
|||||||||||||||||||
|
USD in thousands
|
||||||||||||||||||||||||
|
Revenues
|
52,770
|
47,800
|
15,330
|
115,900
|
217
|
116,117
|
||||||||||||||||||
|
Tax benefits
|
-
|
-
|
18,861
|
18,861
|
-
|
18,861
|
||||||||||||||||||
|
Total revenues and income
|
52,770
|
47,800
|
34,191
|
134,761
|
217
|
134,978
|
||||||||||||||||||
|
Segment adjusted EBITDA
|
39,014
|
37,563
|
29,364
|
105,941
|
998
|
106,939
|
||||||||||||||||||
|
Reconciliations of unallocated amounts:
|
||||||||||||||||||||||||
|
Headquarter costs (*)
|
(11,257
|
)
|
||||||||||||||||||||||
|
Intersegment profit
|
21
|
|||||||||||||||||||||||
|
Gains from projects disposals
|
363
|
|||||||||||||||||||||||
|
Depreciation and amortization and share-based compensation
|
(38,512
|
)
|
||||||||||||||||||||||
|
Operating profit
|
57,554
|
|||||||||||||||||||||||
|
Finance income
|
1,471
|
|||||||||||||||||||||||
|
Finance expenses
|
(52,083
|
)
|
||||||||||||||||||||||
|
Share in the losses of equity accounted investees
|
(418
|
)
|
||||||||||||||||||||||
|
Profit before income taxes
|
6,524
|
|||||||||||||||||||||||
| (*) |
Including general and administrative and development expenses (excluding depreciation and amortization and share based compensation).
|
Information related to Segmental Reporting
|
For the three months ended June 30, 2024
|
||||||||||||||||||||||||
|
MENA
|
Europe
|
USA
|
Total reportable segments
|
Others
|
Total
|
|||||||||||||||||||
|
USD in thousands
|
||||||||||||||||||||||||
|
Revenues
|
37,567
|
41,963
|
2,200
|
81,730
|
2,968
|
84,698
|
||||||||||||||||||
|
Tax benefits
|
-
|
-
|
3,262
|
3,262
|
-
|
3,262
|
||||||||||||||||||
|
Total revenues and income
|
37,567
|
41,963
|
5,462
|
84,992
|
2,968
|
87,960
|
||||||||||||||||||
|
Segment adjusted EBITDA
|
30,345
|
32,546
|
4,709
|
67,600
|
1,623
|
69,223
|
||||||||||||||||||
|
Reconciliations of unallocated amounts:
|
||||||||||||||||||||||||
|
Headquarter costs (*)
|
(8,023
|
)
|
||||||||||||||||||||||
|
Intersegment loss
|
(69
|
)
|
||||||||||||||||||||||
|
Depreciation and amortization and share-based compensation
|
(26,250
|
)
|
||||||||||||||||||||||
|
Operating profit
|
34,881
|
|||||||||||||||||||||||
|
Finance income
|
7,000
|
|||||||||||||||||||||||
|
Finance expenses
|
(29,818
|
)
|
||||||||||||||||||||||
|
Share in the losses of equity accounted investees
|
(305
|
)
|
||||||||||||||||||||||
|
Profit before income taxes
|
11,758
|
|||||||||||||||||||||||
| (*) |
Including general and administrative and development expenses (excluding depreciation and amortization and share based compensation).
|
|
Appendix 2 - Reconciliations between Net Income to Adjusted EBITDA
|
|
($ thousands)
|
|
For the six months
|
|
For the three months
|
||||
|
ended June 30
|
ended June 30
|
|||||||
|
|
|
2025
|
|
2024
|
|
2025
|
|
2024
|
|
Net Income (loss)
|
|
107,372
|
33,944
|
5,569
|
9,459
|
|||
|
Depreciation and amortization
|
|
71,017
|
50,886
|
37,228
|
25,282
|
|||
|
Share based compensation
|
|
2,994
|
4,085
|
1,284
|
968
|
|||
|
Finance income
|
|
(8,166)
|
(15,065)
|
(1,471)
|
(7,000)
|
|||
|
Finance expenses
|
|
82,286
|
49,311
|
52,083
|
29,818
|
|||
|
Gains from projects disposals (*)
|
(55,336)
|
-
|
(363)
|
-
|
||||
|
Share of losses of equity accounted investees
|
|
1,645
|
449
|
418
|
305
|
|||
|
Taxes on income
|
|
25,606
|
9,130
|
955
|
2,299
|
|||
|
Adjusted EBITDA
|
|
227,418
|
132,740
|
95,703
|
61,131
|
|||
|
* Profit from revaluation linked to partial sale of asset.
|
Appendix 3 – Debentures Covenants
Debentures Covenants
As of June 30, 2025, the Company was in compliance with all of its financial covenants under the indenture for the Series C, D, F, G and H Debentures, based on having
achieved the following in its consolidated financial results:
Minimum equity
The company's equity shall be maintained at no less than NIS 375 million so long as debentures F remain outstanding, NIS 1,250 million so long as debentures C and D remain outstanding, and
USD 600 million so long as debentures G and H remain outstanding.
As of June 30, 2025, the company’s equity amounted to NIS 5,559 million (USD 1,648 million).
Net financial debt to net CAP
The ratio of standalone net financial debt to net CAP shall not exceed 70% for two consecutive financial periods so long as debentures F remain outstanding and shall not exceed 65% for two
consecutive financial periods so long as debentures C, D, G and H remain outstanding.
As of June 30, 2025, the net financial debt to net CAP ratio, as defined above, stands at 40%.
Net financial debt to EBITDA
So long as debentures F remain outstanding, standalone financial debt shall not exceed NIS 10 million, and the consolidated financial debt to EBITDA ratio shall not exceed 18 for more than
two consecutive financial periods.
For as long as debentures C and D remain outstanding, the consolidated financial debt to EBITDA ratio shall not exceed 15 for more than two consecutive financial periods.
For as long as debentures G and H remain outstanding, the consolidated financial debt to EBITDA ratio shall not exceed 17 for more than two consecutive financial periods.
As of June 30, 2025, the net financial debt to EBITDA ratio, as defined above, stands at 7.
Equity to balance sheet
The standalone equity to total balance sheet ratio shall be maintained at no less than 20% ,25% and 28%, respectively, for two consecutive financial periods for as long as debentures F,
debentures C and D and debentures G and H remain outstanding.
As of June 30, 2025, the equity to balance sheet ratio, as defined above, stands at 53%.
Appendix 4 – Foreign exchange rate sensitivities
Enlight operates generation facilities in Israel, Europe, and the US, and records revenues and income in multiple currencies. As of the end of 2Q25, the Company’s
revenues and income sensitivity to fluctuations in foreign exchange rates for FY25 is as follows:
| o |
A 5% change in the USD/ILS exchange rate would result in a ~$5m change in revenues
|
| o |
A 5% change in the USD/EUR exchange rate would result in a ~$5m change in revenues
|
| o |
A 5% change in the USD/EUR and the USD/ILS exchange rate would result in a ~$11m change in revenues
|
Appendix 5
a) Segment information: Operational projects
|
($ thousands)
|
6 Months ended June 30
|
3 Months ended June 30
|
||||||||||||
|
Operational Project Segments
|
Installed Capacity (MW)
|
Installed Storage (MWh)
|
Generation
(GWh) |
Revenues and
income
|
Segment Adjusted
EBITDA* |
Generation
(GWh) |
Reported Revenue
|
Segment Adjusted
EBITDA* |
||||||
|
2025
|
2024
|
2025
|
2024
|
2025
|
2024
|
2025
|
2024
|
2025
|
2024
|
2025
|
2024
|
|||
|
MENA
|
675
|
797
|
695
|
580
|
95,636
|
66,041
|
64,387
|
54,873
|
378
|
329
|
52,769
|
37,567
|
38,637
|
30,345
|
|
Europe
|
1,327
|
-
|
1,353
|
1,396
|
99,184
|
101,123
|
82,226
|
83,253
|
649
|
573
|
47,800
|
41,963
|
37,563
|
32,546
|
|
USA
|
470
|
1,200
|
519
|
73
|
68,980
|
9,957
|
59,913
|
7,831
|
310
|
47
|
34,191
|
5,463
|
29,364
|
4,710
|
|
Total Consolidated
|
2,472
|
1,997
|
2,567
|
2,049
|
263,800
|
177,121
|
206,526
|
145,957
|
1,337
|
949
|
134,760
|
84,993
|
105,564
|
67,601
|
|
Unconsolidated at Share
|
42
|
41
|
||||||||||||
|
Total
|
2,514
|
2,038
|
||||||||||||
| b) |
Operational Projects Further Detail
|
|
($ thousands)
|
|
6 Months ended June 30, 2025
|
3 Months ended June 30, 2025
|
||||||
|
Operational Project
|
Segment
|
Installed Capacity (MW)
|
Installed Storage (MWh)
|
Revenues and
income
|
Segment Adjusted
EBITDA*
|
Reported Revenue
|
Segment Adjusted EBITDA*
|
Debt balance as of June 30, 2025
|
Ownership %**
|
|
MENA Wind
|
MENA
|
316
|
-
|
41,966
|
|
21,400
|
|
495,619
|
49%
|
|
MENA PV
|
MENA
|
359
|
797
|
53,670
|
|
31,369
|
|
541,779
|
85%
|
|
Total MENA
|
675
|
797
|
95,636
|
64,387
|
52,769
|
38,637
|
1,037,398
|
|
|
|
Europe Wind
|
Europe
|
1,184
|
-
|
91,672
|
|
42,878
|
|
759,547
|
65%
|
|
Europe PV
|
Europe
|
143
|
-
|
7,512
|
|
4,922
|
|
74,018
|
71%
|
|
Total Europe
|
|
1,327
|
-
|
99,184
|
82,226
|
47,800
|
37,563
|
833,565
|
|
|
USA PV
|
USA
|
470
|
1,200
|
68,980
|
|
34,191
|
|
279,642
|
100%
|
|
Total USA
|
470
|
1,200
|
68,980
|
59,913
|
34,191
|
29,634
|
279,642
|
||
|
Total Consolidated Projects
|
2,472
|
1,997
|
263,800
|
206,526
|
134,760
|
105,564
|
2,150,605
|
||
|
Uncons. Projects at share
|
42
|
41
|
50%
|
||||||
|
Total
|
2,514
|
2,038
|
263,800
|
206,526
|
134,760
|
105,564
|
2,150,605
|
||
* EBITDA results included
$7m in the 6 months ended June 25 and $3m in the 3 months ended June 25, of compensation recognized from Björnberget project
** Ownership % is calculated based on the project's share of total revenues
| c) |
Projects under construction
|
|
($ millions)
Consolidated Projects
|
Country
|
Generation and energy storage Capacity (MW/MWh)
|
Est.
COD |
Est. Total
Project Cost |
Tax credit benefit- Qualifying category
|
Tax credit benefit- Adders*****
|
Discounted Value of Tax Benefit***
|
Est. Total
Project Cost net of tax benefit
|
Capital Invested as of June 30, 2025
|
Est. Equity Required (%)
|
Equity Invested as of June 30, 2025
|
Est. First Full Year Revenue
|
Est. First Full Year EBITDA****
|
Ownership %*
|
|
Country Acres
|
USA
|
403/688
|
H2 2026
|
793-834
|
ITC
|
DC (10%)
|
369-388
|
424-446
|
245
|
10%-11%
|
91
|
61-63
|
44-46
|
100%
|
|
Quail Ranch BESS
|
USA
|
0/400
|
H2 2025
|
126-132
|
ITC
|
EC (10%)
|
58-61
|
68-71
|
157
|
12%-15%
|
48
|
23-24
|
16-17
|
100%
|
|
Quail Ranch Solar
|
USA
|
128/0
|
145-152
|
PTC
|
EC (10%)
|
69-73
|
76-79
|
100%
|
||||||
|
Roadrunner BESS
|
USA
|
0/940
|
H2 2025
|
332-350
|
ITC
|
EC (10%)
|
157-165
|
175-185
|
284
|
0%-10%********
|
61
|
52-55
|
39-40
|
100%
|
|
Roadrunner Solar
|
USA
|
290/0
|
284-298
|
PTC
|
EC (10%)
|
169-177
|
115-121
|
100%
|
||||||
|
Snowflake A
|
USA
|
600/
1,900
|
2027
|
1,476-
1,552
|
ITC
|
EC (10%) +
DC (10%
BESS only)
|
647-681
|
829-871
|
29
|
10%
|
29
|
124-130
|
100-105
|
100%
|
|
Gecama Solar
|
Spain
|
225/220
|
H2 2026
|
215-225
|
-
|
-
|
-
|
215-225
|
42
|
23%-28%
|
42
|
43-45
|
35-37
|
72%
|
|
Bjornberget – BESS
|
Sweden
|
0/100
|
2026
|
28-30
|
-
|
-
|
-
|
28-30
|
3
|
100%
|
3
|
10-11
|
9
|
55%
|
|
Israel Construction
|
Israel
|
4/69
|
H2 2025-
H2 2026
|
20-22
|
-
|
-
|
-
|
20-22
|
9
|
15%-25%
|
9
|
2
|
2
|
82%
|
|
Total Consolidated Projects
|
|
1,650/
4,317
|
3,419-
3,595
|
|
|
1,469-
1,545
|
1,950-
2,050
|
769
|
|
283
|
315-330
|
246-257
|
||
|
Unconsolidated Projects at share*******
|
Israel
|
4/79
|
H2 2025-
H2 2026
|
20-22
|
-
|
-
|
-
|
-
|
24
|
15%-25%
|
24
|
3
|
2
|
64%
|
|
Total
|
|
1,654/
4,396
|
3,439-
3,617
|
|
|
1,469-
1,545
|
1,950-
2,050
|
793
|
|
307
|
318-333
|
248-259
|
d) Pre-Construction Projects (due to commence construction
within 12 months of the Approval Date)
|
($ millions)
Consolidated Projects |
Country
|
Generation and energy storage Capacity (MW/MWh)
|
Est.
COD |
Est. Total
Project Cost |
Tax Credit Benefit
|
Est. Total
Project Cost net of tax benefit |
Capital Invested as of June 30, 2025
|
Est. Equity Required (%)
|
Equity Invested as of June 30, 2025
|
Est. First Full Year Revenue
|
Est. First Full Year EBITDA****
|
Ownership %*
|
||
|
Qualifying Category
|
Adders*****
|
Discounted Value of Tax Benefit***
|
||||||||||||
|
CoBar ITC
|
United States
|
258/824
|
H2 2027
|
612-644
|
ITC
|
EC (10%)
|
247-259
|
365-385
|
40
|
13%-16%
|
40
|
126-132
|
99-104
|
100%
|
|
CoBar PTC
|
United States
|
953/0
|
1,115-
1,173
|
PTC
|
EC (10%)
|
551-579
|
564-594
|
|||||||
|
Picasso BESS
|
Sweden
|
0/221
|
H1 2027
|
40-42
|
-
|
-
|
-
|
40-42
|
0
|
100%
|
0
|
7-8
|
5-6
|
69%
|
|
Nardo
|
Italy
|
97/1,254
|
H1 2028
|
235-247
|
-
|
-
|
-
|
235-247
|
3
|
38%-42%
|
3
|
42-44
|
36-37
|
100%
|
|
($ millions)
Additional Pre-Construction Projects |
MW Deployment
MW/MWh
|
Est. Total
Project Cost |
Tax Credit Benefit
|
Discounted Value of Tax Benefit***
|
Est. Total
Project Cost net of tax benefit |
Capital Invested as of June 30, 2025
|
Est. Equity Required (%)
|
Equity Invested as of June 30, 2025
|
Est. First Full Year Revenue
|
Est. First Full Year EBITDA****
|
Ownership %*
|
|||
|
2026
|
2027
|
2028
|
Qualifying Category
|
Adders*****
|
||||||||||
|
United States
|
-
|
248/400
|
453/0
|
1,214-
1,276
|
ITC
|
DC (10%) &
EC (10%)**
|
555-583
|
659-693
|
45
|
6%-16%
|
45
|
93-98
|
73-77
|
100%
|
|
Europe
|
-
|
0/140
|
-
|
32-34
|
-
|
-
|
-
|
32-34
|
0
|
100%
|
0
|
10
|
7
|
100%
|
|
MENA
|
4/134
|
0/72
|
38/645
|
227-239
|
-
|
-
|
-
|
227-239
|
11
|
20%-30%
|
11
|
23-24******
|
15-16
|
92%
|
|
Total Consolidated Projects
|
4/134
|
248/612
|
491/645
|
1,473-
1,549
|
555-583
|
918-966
|
56
|
|
56
|
126-132
|
95-100
|
|||
|
Unconsolidated Projects at share*******
|
8/42
|
0/182
|
-
|
45-46
|
-
|
-
|
-
|
45-46
|
2
|
15%-25%
|
2
|
10-11
|
5-6
|
54%
|
|
Total Pre-Construction
|
2,059MW +3,914MWh
|
3,520-
3,701
|
1,353-
1,421
|
2,167-
2,280
|
101
|
|
101
|
311-327
|
240-253
|
|||||
* The legal ownership share for all U.S. projects is 90%, but Enlight invests 100% of the equity in the project and entitled to 100% of the project distributions until full repayment of
Enlight's capital plus a preferred return
** ** Rustic hills 1+2 - DC(10%)+EC (10%); Coggon - DC (10%); Gemston - DC (10%); Crimson - DC (10% BESS only) + EC (10%)
***Tax benefits under the IRA. PTC is assumed, based on the project’s expected production and a yearly CPI indexation of 2%, discounted by 8% to COD. For the ITC, a step-up adjustment was
made to reflect the eligible higher tax credit rates, enhancing the valuation and return of the project by considering the increased project value.
**** EBITDA is a non-IFRS financial measure. This figure represents consolidated EBITDA for the project and excludes the share of project distributions to tax equity partners, as well as ITC
and PTC proceeds. These components of the tax equity transaction may differ from project to project, are subject to market conditions and commercial terms agreed upon reaching financial close
****The Energy Community (EC) Adder provides extra credits for renewable energy projects in areas impacted by fossil fuel reliance or economic
transition. The Domestic Content (DC) Adder rewards projects using U.S.-manufactured components, promoting local job creation and supply chain growth
******645MWh in 2028 attributed to Iftach, estimated revenue for the first 5 years is $6 million per year. From year 6, it will move to a
deregulated market, with revenue expected to be $25 million per year
****** All numbers, beside equity invested, reflects Enlight share only
******** The required equity during construction is estimated at 10% and is expected to
decrease to 0% at COD
| e) |
Additional information on tax equity investments
|
|
Tax equity investment
|
Tax equity partner’s share in cash flows
|
||||
|
($ millions)
Projects* |
Est. Total
Project Cost |
Upfront tax equity investment
|
Tax credit proceeds during the project's operation ("pay-go")
|
Share in project cash flow initial period (second period)
|
Duration of initial period for share in project cash flow (years)
|
|
Atrisco PV
|
369
|
198
|
55
|
17.5% (5)%
|
10
|
|
Atrisco BESS
|
458
|
222
|
-
|
19.0% (5)%
|
5
|
* Apex financing was structured as a sale and leaseback and therefore not included in the table above
Appendix 6 – cash and cash equivalents
|
($ thousands)
|
June 30, 2025
|
|
Cash and Cash Equivalents:
|
|
|
Enlight Renewable Energy Ltd, Enlight EU Energies Kft and Enlight Renewable LLC excluding subsidiaries (“Topco”)
|
123,464
|
|
Subsidiaries
|
356,995
|
|
Deposits:
|
|
|
Short term deposits
|
-
|
|
Restricted Cash:
|
|
|
Projects under construction
|
86,164
|
|
Reserves, including debt service, performance obligations and others
|
64,488
|
|
Total Cash
|
631,111
|
Appendix 7 – Corporate level (TopCo) debt
|
($ thousands)
|
June 30, 2025
|
|
Debentures:
|
|
|
Debentures
|
634,586*
|
|
Convertible debentures
|
257,647
|
|
Loans from banks and other financial institutions:
|
|
|
Credit and short-term loans from banks and other financial institutions
|
-
|
|
Loans from banks and other financial institutions
|
116,426
|
|
Total corporate level debt
|
1,008,659
|
* Including current maturities of debentures in the amount of 25,414
Appendix 8 – Functional Currency Conversion Rates:
The financial statements of each of the Company’s subsidiaries were prepared in the currency of the main economic environment in which it operates (hereinafter: the
“Functional Currency”). For the purpose of consolidating the financial statements, results and financial position of each of the Group’s member companies are translated into the Israeli shekel (“NIS”), which is the Company’s Functional Currency.
The Group’s consolidated financial statements are presented in U.S. dollars (“USD”).
FX Rates to USD:
|
Date of the financial statements:
|
Euro
|
NIS
|
|
As of 30th June 2025
|
1.13
|
0.28
|
|
As of 30th June 2024
|
1.07
|
0.27
|
|
Average for the 3 months period ended:
|
||
|
June 2025
|
1.17
|
0.30
|
|
June 2024
|
1.08
|
0.27
|
Appendix 9 – Structural changes to the Consolidated Statements of Income:
The Company has changed its Income Statement presentation starting with the 2024 full-year financial statements, which includes the presentation of specified items that have been previously
included within other income (i.e. tax equity). In addition, the Company has decided to remove the Gross Profit line item.
The Company believes that such presentation provides a more relevant information and better reflects the measurement of its financial performance. The Company applied such a change
retrospectively.