| are registered trademarks of MaxCyte, Inc. in the U.S.A. Driving the Next Generation of Cell-Based Therapies MaxCyte Corporate Presentation NASDAQ: MXCT August 2025 © 2025 MaxCyte, Inc. All Rights Reserved |
| Disclaimer 2 © 2025 MaxCyte, Inc. All Rights Reserved The content of this document (the “Presentation”) has not been approved by an authorized person within the meaning of the Financial Services and Markets Act 2000 (“FSMA”), as amended. Reliance on this document for the purpose of engaging in any investment activity may expose an individual or organization to a significant risk of losing all of their investment. If you are in any doubt about the investment to which this Presentation relates, you should consult a person authorized by the Financial Conduct Authority who specializes in advising on securities of the kind described in this Presentation or your stockbroker, bank manager, solicitor, accountant or other financial adviser. This Presentation has been issued by MaxCyte Inc (the “Company”) and does not constitute or form part of, and should not be construed as, an offer or invitation to sell or issue or any solicitation of any offer to purchase or subscribe for any securities in the Company in any jurisdiction. Neither this Presentation, nor any part of it nor anything contained or referred to in it, nor the fact of its distribution, should form the basis of or be relied on in any connection with or act as an inducement in relation to a decision to purchase or subscribe for or enter into any contract or make any other commitment whatsoever in relation to any such securities. This Presentation does not constitute a recommendation regarding the securities of the Company. This Presentation is only addressed to and directed at (i) persons who are outside the United Kingdom, (ii) persons who have professional experience in matters relating to investments falling within Article 19(5) of the Financial Services and Markets Act 2000 (Financial Promotion) Order 2005, as amended (the "Order"), (iii) persons who are high net worth entities falling within Article 49(2)(a) to (d) of the Order, and/or (iv) any other persons to whom this Presentation may otherwise lawfully be communicated without contravention of section 21 of the Financial Services and Markets Act 2000 or to whom it may otherwise lawfully be distributed (all such persons together being referred to as "relevant persons"). This Presentation may not be acted on or relied on by persons who are not relevant persons. Any investment or investment activity to which this Presentation relates is available only to relevant persons. Certain statements in this Presentation are, or may be deemed to be, forward-looking statements within the meaning of the “safe harbor” provisions of the Private Securities Litigation Reform Act of 1995, including but not limited to statements regarding our expected potential future revenue. The words "may," "might," "will," "could," "would," "should," "expect," "plan," "anticipate," "intend," "believe," "expect," "estimate," "seek," "predict," "future," "project," "potential," "continue," "target" and similar words or expressions are intended to identify forward-looking statements, although not all forward-looking statements contain these identifying words. Any forward-looking statements in this Presentation are based on management's current expectations and beliefs and are subject to a number of risks, uncertainties and important factors that may cause actual events or results to differ materially from those expressed or implied by any forward-looking statements contained in this Presentation, including, without limitation, statements regarding the Company's future growth, results of operations, performance, future capital and other expenditures (including the amount, nature and sources of funding thereof), competitive advantages, business prospects and opportunities. These and other risks and uncertainties are described in greater detail in the section entitled "Risk Factors" in our Annual Report on Form 10-K for the year ended December 31, 2023, our quarterly reports for the periods ended March 31, 2024, June 30, 2024, and September 30, 2024, as well as discussions of potential risks, uncertainties, and other important factors in the other filings that we make with the Securities and Exchange Commission from time to time. These documents are available on the Securities and Exchange Commission website and through the Investor Menu, Financials section under "SEC filings" on the Investors page of our website at http://investors.maxcyte.com. No statement in this Presentation is intended to be, or intended to be construed as, a profit forecast or profit estimate or to be interpreted to mean that earnings per Company share for the current or future financial years will necessarily match or exceed the historical earnings per Company share. As a result, no undue reliance should be placed on such statements. Any forward-looking statements represent our views only as of the date of this Presentation and should not be relied upon as representing our views as of any subsequent date. We explicitly disclaim any obligation to update any forward-looking statements, whether as a result of new information, future events or otherwise. No representations or warranties (expressed or implied) are made about the accuracy of any such forward-looking statements. This Presentation also contains Non-GAAP Gross Margin, which we define as Gross Margin when excluding SPL program related revenue and reserves for excess and obsolete inventory. The Company believes that the use of Non-GAAP Gross Margin provides an additional tool to investors because it provides consistency and comparability with past financial performance, as Non-GAAP Gross Margin excludes non-core revenues and inventory reserves, which can vary significantly between periods and thus affect comparability. Management does not consider these Non-GAAP financial measures in isolation or as an alternative to financial measures determined in accordance with GAAP. The principal limitation of these Non-GAAP financial measures is that they exclude significant revenues and expenses that are required by GAAP to be recorded in the Company’s financial statements. Non-GAAP measures should be considered in addition to results prepared in accordance with GAAP, but should not be considered a substitute for, or superior to, GAAP results. A reconciliation table of Gross Margin, the most comparable GAAP financial measure, to Non-GAAP Gross Margin is included in the appendix of this release. |
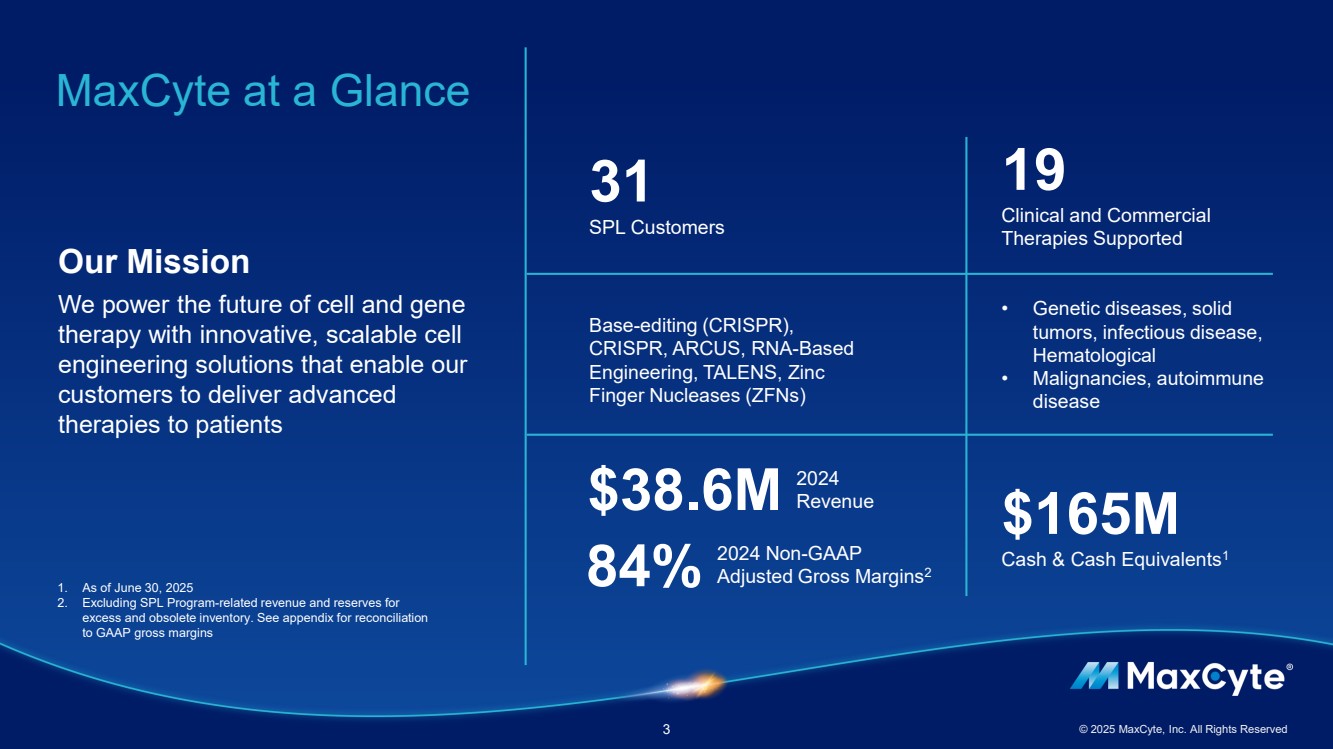
| MaxCyte at a Glance 3 © 2025 MaxCyte, Inc. All Rights Reserved Our Mission We power the future of cell and gene therapy with innovative, scalable cell engineering solutions that enable our customers to deliver advanced therapies to patients Base-editing (CRISPR), CRISPR, ARCUS, RNA-Based Engineering, TALENS, Zinc Finger Nucleases (ZFNs) 19 Clinical and Commercial Therapies Supported 2024 Revenue • Genetic diseases, solid tumors, infectious disease, Hematological • Malignancies, autoimmune disease 31 SPL Customers $165M Cash & Cash Equivalents1 $38.6M 2024 Non-GAAP Adjusted Gross Margins 84% 2 1. As of June 30, 2025 2. Excluding SPL Program-related revenue and reserves for excess and obsolete inventory. See appendix for reconciliation to GAAP gross margins |
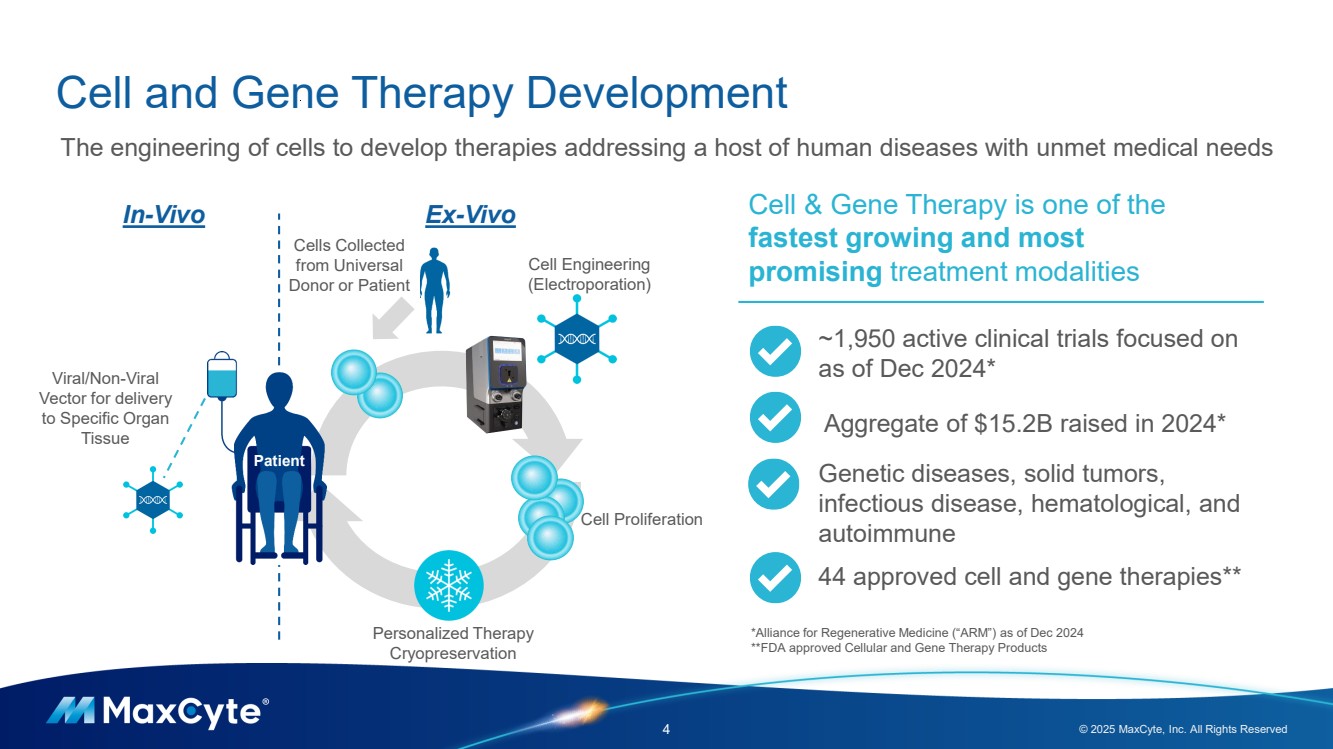
| Cell and Gene Therapy Development 4 © 2025 MaxCyte, Inc. All Rights Reserved Cell Engineering (Electroporation) Cell Proliferation In-Vivo Ex-Vivo Viral/Non-Viral Vector for delivery to Specific Organ Tissue The engineering of cells to develop therapies addressing a host of human diseases with unmet medical needs Cells Collected from Universal Donor or Patient Personalized Therapy Cryopreservation Patient Cell & Gene Therapy is one of the fastest growing and most promising treatment modalities ~1,950 active clinical trials focused on as of Dec 2024* Aggregate of $15.2B raised in 2024* Genetic diseases, solid tumors, infectious disease, hematological, and autoimmune 44 approved cell and gene therapies** *Alliance for Regenerative Medicine (“ARM”) as of Dec 2024 **FDA approved Cellular and Gene Therapy Products |
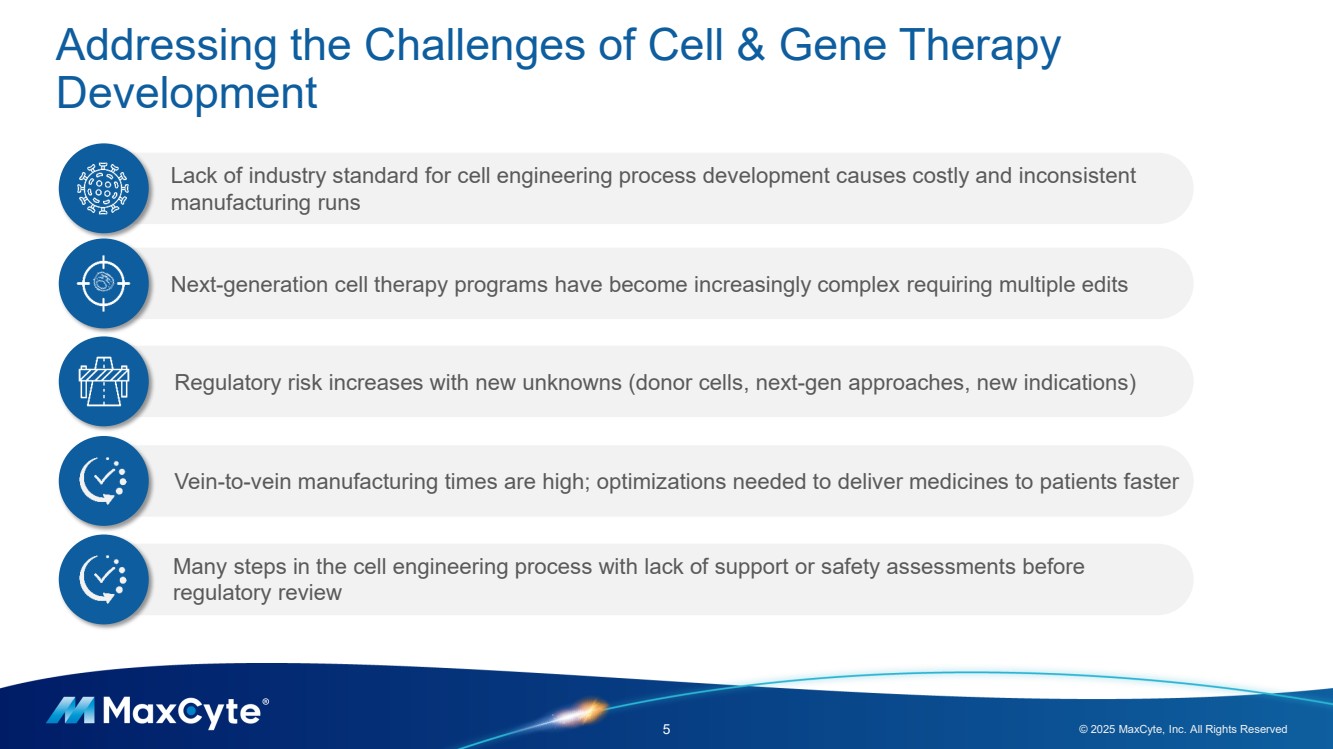
| Addressing the Challenges of Cell & Gene Therapy Development 5 © 2025 MaxCyte, Inc. All Rights Reserved Next-generation cell therapy programs have become increasingly complex requiring multiple edits Regulatory risk increases with new unknowns (donor cells, next-gen approaches, new indications) Vein-to-vein manufacturing times are high; optimizations needed to deliver medicines to patients faster Lack of industry standard for cell engineering process development causes costly and inconsistent manufacturing runs Many steps in the cell engineering process with lack of support or safety assessments before regulatory review |
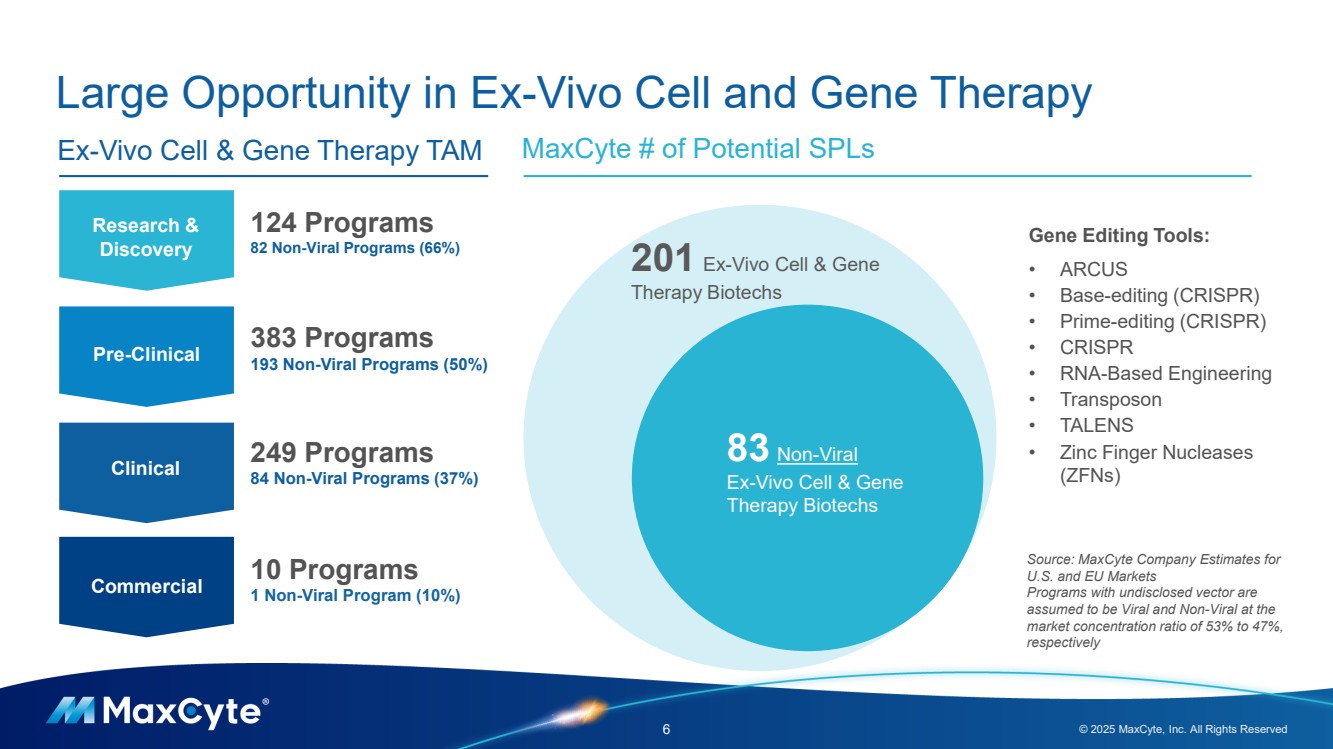
| Large Opportunity in Ex-Vivo Cell and Gene Therapy 6 © 2025 MaxCyte, Inc. All Rights Reserved MaxCyte # of Potential SPLs Research & Discovery Pre-Clinical Clinical Commercial 124 Programs 82 Non-Viral Programs (66%) 383 Programs 193 Non-Viral Programs (50%) 249 Programs 84 Non-Viral Programs (37%) 10 Programs 1 Non-Viral Program (10%) Ex-Vivo Cell & Gene Therapy TAM 201 Ex-Vivo Cell & Gene Therapy Biotechs 83 Non-Viral Ex-Vivo Cell & Gene Therapy Biotechs Gene Editing Tools: • ARCUS • Base-editing (CRISPR) • Prime-editing (CRISPR) • CRISPR • RNA-Based Engineering • Transposon • TALENS • Zinc Finger Nucleases (ZFNs) Source: MaxCyte Company Estimates for U.S. and EU Markets Programs with undisclosed vector are assumed to be Viral and Non-Viral at the market concentration ratio of 53% to 47%, respectively |
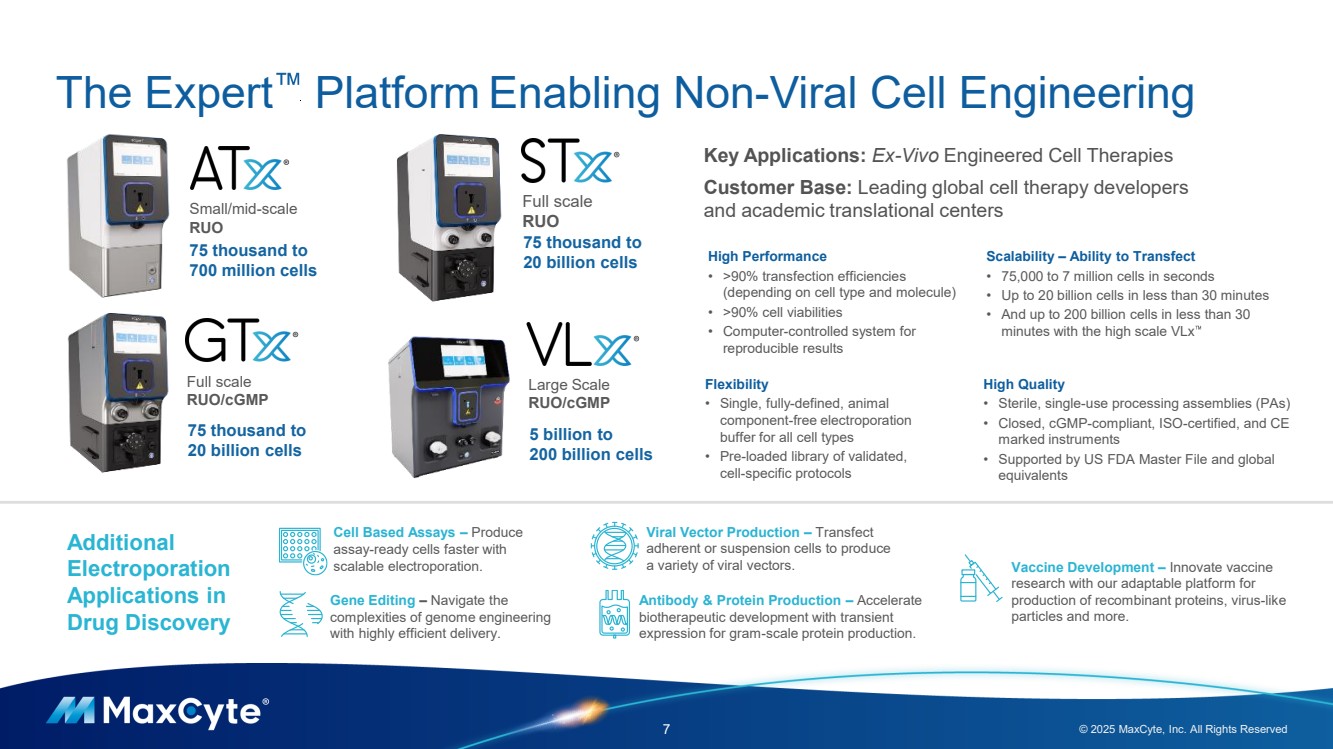
| The Expert Platform Enabling Non-Viral Cell Engineering 7 © 2025 MaxCyte, Inc. All Rights Reserved Full scale RUO Small/mid-scale RUO Large Scale RUO/cGMP Full scale RUO/cGMP 75 thousand to 700 million cells 75 thousand to 20 billion cells 5 billion to 200 billion cells 75 thousand to 20 billion cells High Performance • >90% transfection efficiencies (depending on cell type and molecule) • >90% cell viabilities • Computer-controlled system for reproducible results Flexibility • Single, fully-defined, animal component-free electroporation buffer for all cell types • Pre-loaded library of validated, cell-specific protocols Scalability – Ability to Transfect • 75,000 to 7 million cells in seconds • Up to 20 billion cells in less than 30 minutes • And up to 200 billion cells in less than 30 minutes with the high scale VLx High Quality • Sterile, single-use processing assemblies (PAs) • Closed, cGMP-compliant, ISO-certified, and CE marked instruments • Supported by US FDA Master File and global equivalents Key Applications: Ex-Vivo Engineered Cell Therapies Customer Base: Leading global cell therapy developers and academic translational centers Additional Electroporation Applications in Drug Discovery Viral Vector Production – Transfect adherent or suspension cells to produce a variety of viral vectors. Cell Based Assays – Produce assay-ready cells faster with scalable electroporation. Gene Editing – Navigate the complexities of genome engineering with highly efficient delivery. Antibody & Protein Production – Accelerate biotherapeutic development with transient expression for gram-scale protein production. Vaccine Development – Innovate vaccine research with our adaptable platform for production of recombinant proteins, virus-like particles and more. |
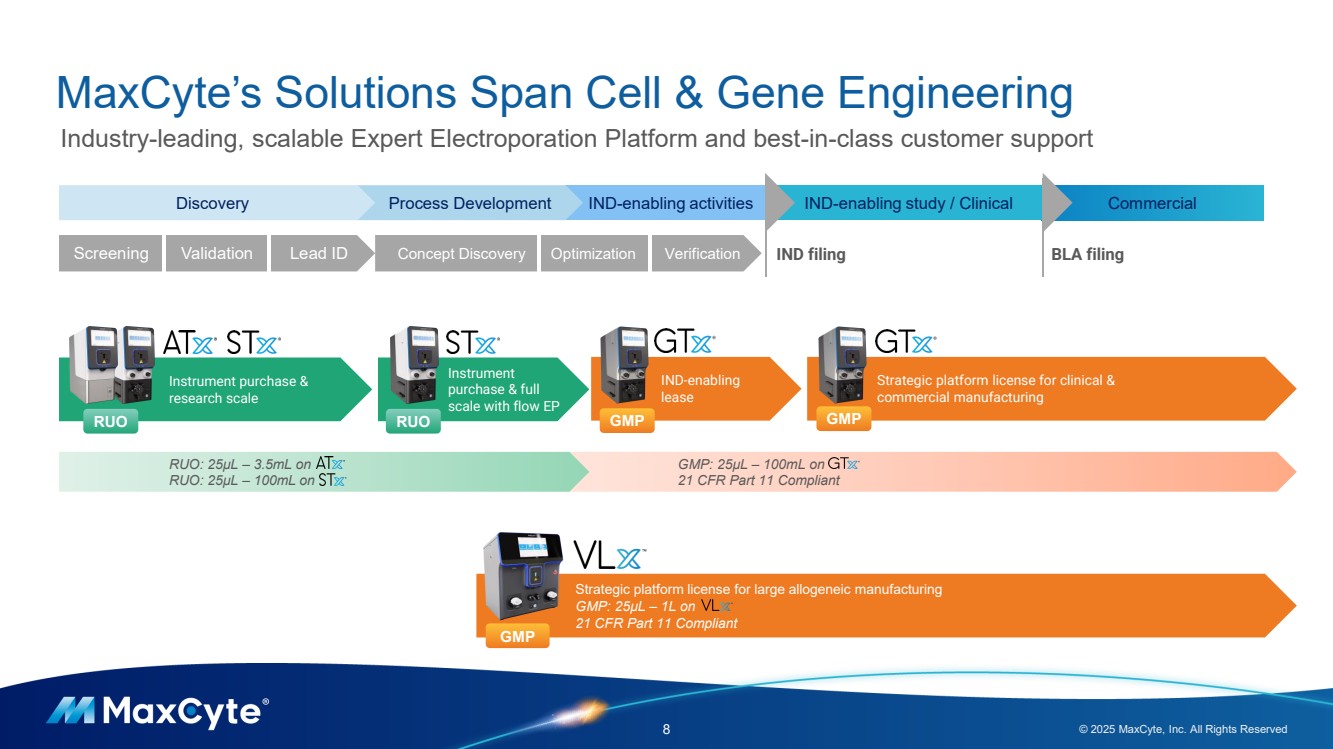
| GMP: 25µL – 100mL on 21 CFR Part 11 Compliant MaxCyte’s Solutions Span Cell & Gene Engineering 8 © 2025 MaxCyte, Inc. All Rights Reserved Industry-leading, scalable Expert Electroporation Platform and best-in-class customer support Commercial Strategic platform license for clinical & commercial manufacturing IND-enabling lease Discovery Process Development IND-enabling activities IND-enabling study / Clinical IND filing BLA filing Instrument purchase & research scale Instrument purchase & full scale with flow EP RUO RUO GMP GMP Screening Validation Lead ID Concept Discovery Optimization Verification RUO: 25µL – 3.5mL on RUO: 25µL – 100mL on Strategic platform license for large allogeneic manufacturing GMP: 25µL – 1L on 21 CFR Part 11 Compliant GMP |
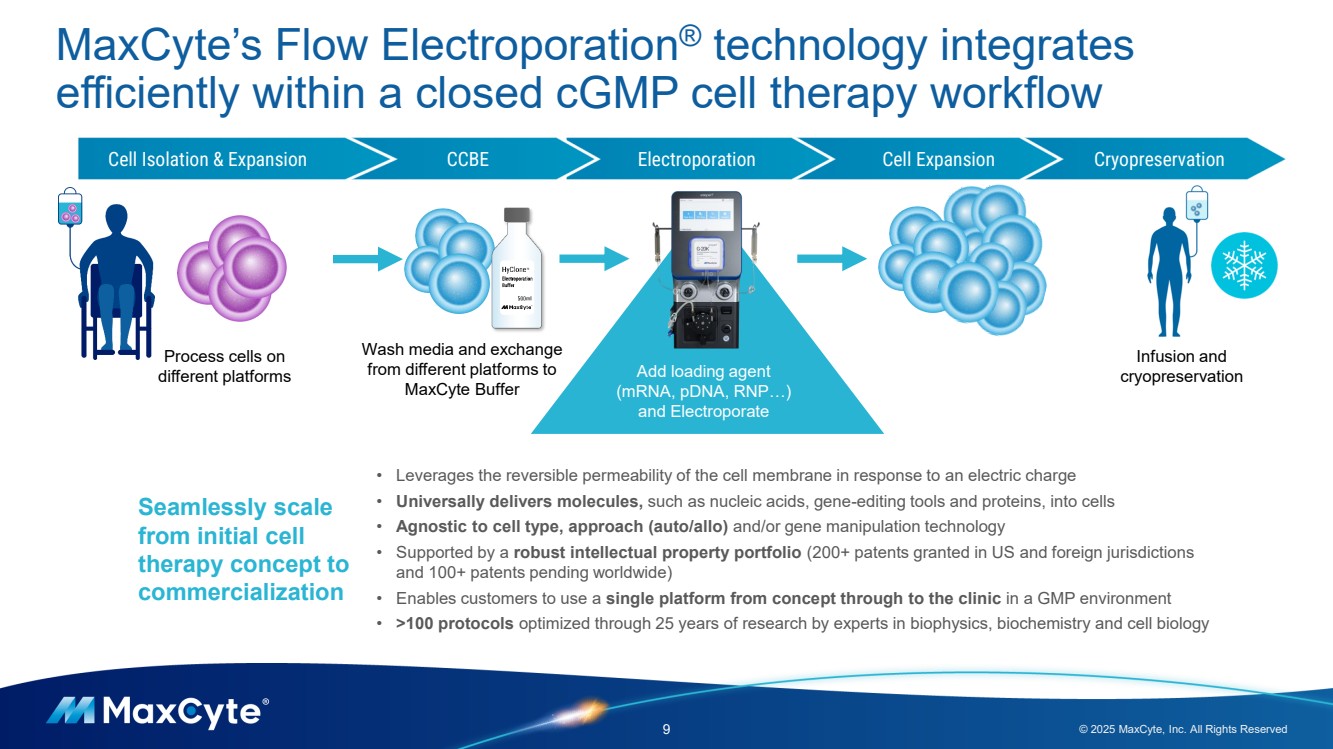
| MaxCyte’s Flow Electroporation® technology integrates efficiently within a closed cGMP cell therapy workflow 9 © 2025 MaxCyte, Inc. All Rights Reserved Cell Isolation & Expansion CCBE Electroporation Cell Expansion Cryopreservation Add loading agent (mRNA, pDNA, RNP…) and Electroporate Process cells on different platforms Wash media and exchange from different platforms to MaxCyte Buffer Infusion and cryopreservation Seamlessly scale from initial cell therapy concept to commercialization • Leverages the reversible permeability of the cell membrane in response to an electric charge • Universally delivers molecules, such as nucleic acids, gene-editing tools and proteins, into cells • Agnostic to cell type, approach (auto/allo) and/or gene manipulation technology • Supported by a robust intellectual property portfolio (200+ patents granted in US and foreign jurisdictions and 100+ patents pending worldwide) • Enables customers to use a single platform from concept through to the clinic in a GMP environment • >100 protocols optimized through 25 years of research by experts in biophysics, biochemistry and cell biology |
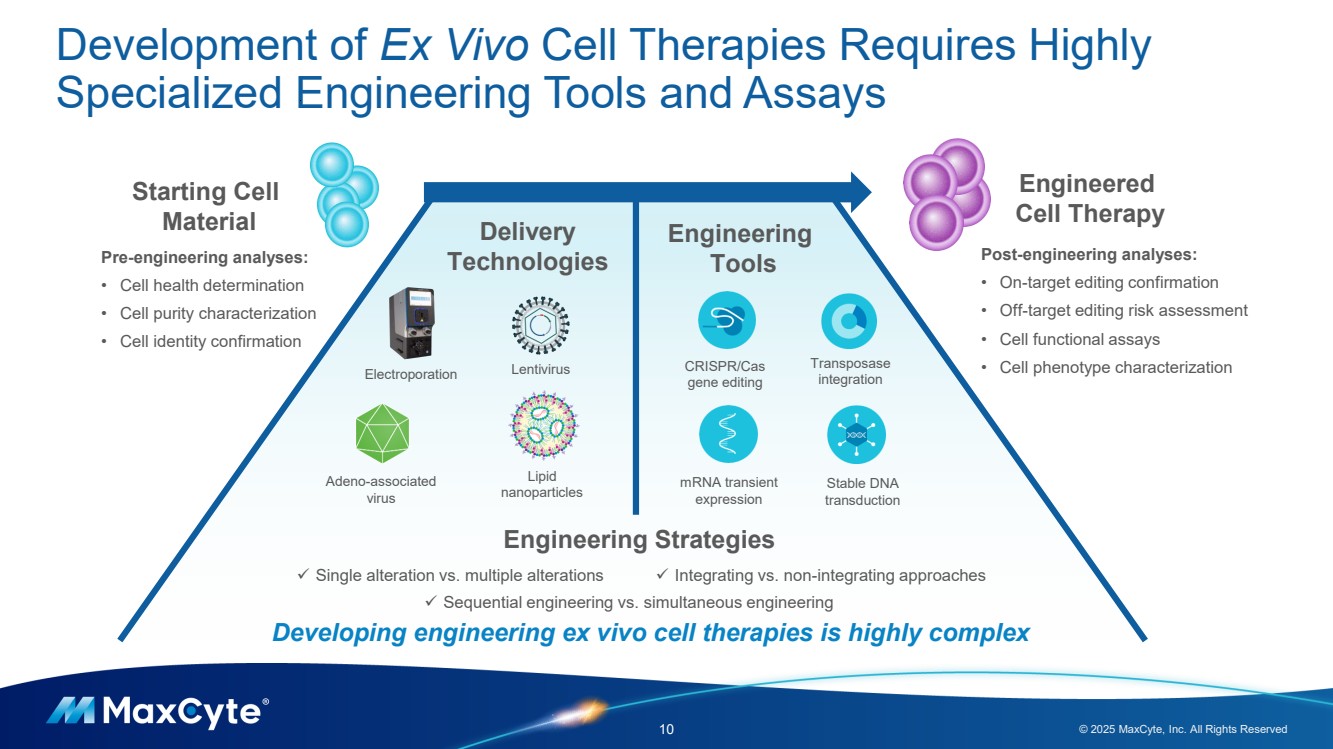
| Development of Ex Vivo Cell Therapies Requires Highly Specialized Engineering Tools and Assays 10 © 2025 MaxCyte, Inc. All Rights Reserved Lentivirus Adeno-associated virus Lipid nanoparticles Electroporation Engineering Tools Delivery Technologies CRISPR/Cas gene editing Transposase integration mRNA transient expression Stable DNA transduction Engineered Cell Therapy Starting Cell Material Post-engineering analyses: • On-target editing confirmation • Off-target editing risk assessment • Cell functional assays • Cell phenotype characterization Engineering Strategies Pre-engineering analyses: • Cell health determination • Cell purity characterization • Cell identity confirmation ✓ Single alteration vs. multiple alterations ✓ Sequential engineering vs. simultaneous engineering ✓ Integrating vs. non-integrating approaches Developing engineering ex vivo cell therapies is highly complex |
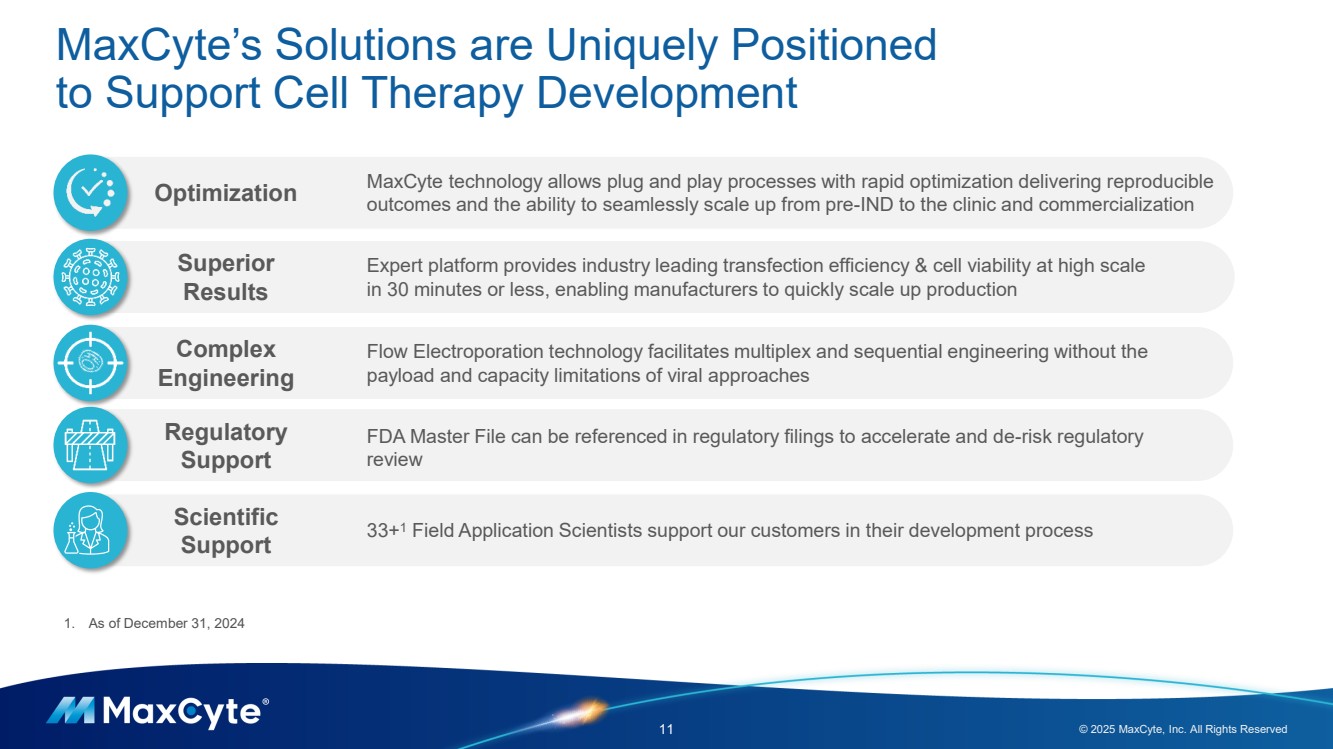
| MaxCyte’s Solutions are Uniquely Positioned to Support Cell Therapy Development 11 © 2025 MaxCyte, Inc. All Rights Reserved Flow Electroporation technology facilitates multiplex and sequential engineering without the payload and capacity limitations of viral approaches 33+1 Field Application Scientists support our customers in their development process Expert platform provides industry leading transfection efficiency & cell viability at high scale in 30 minutes or less, enabling manufacturers to quickly scale up production Regulatory Support Superior Results Complex Engineering Optimization Scientific Support FDA Master File can be referenced in regulatory filings to accelerate and de-risk regulatory review MaxCyte technology allows plug and play processes with rapid optimization delivering reproducible outcomes and the ability to seamlessly scale up from pre-IND to the clinic and commercialization 1. As of December 31, 2024 |
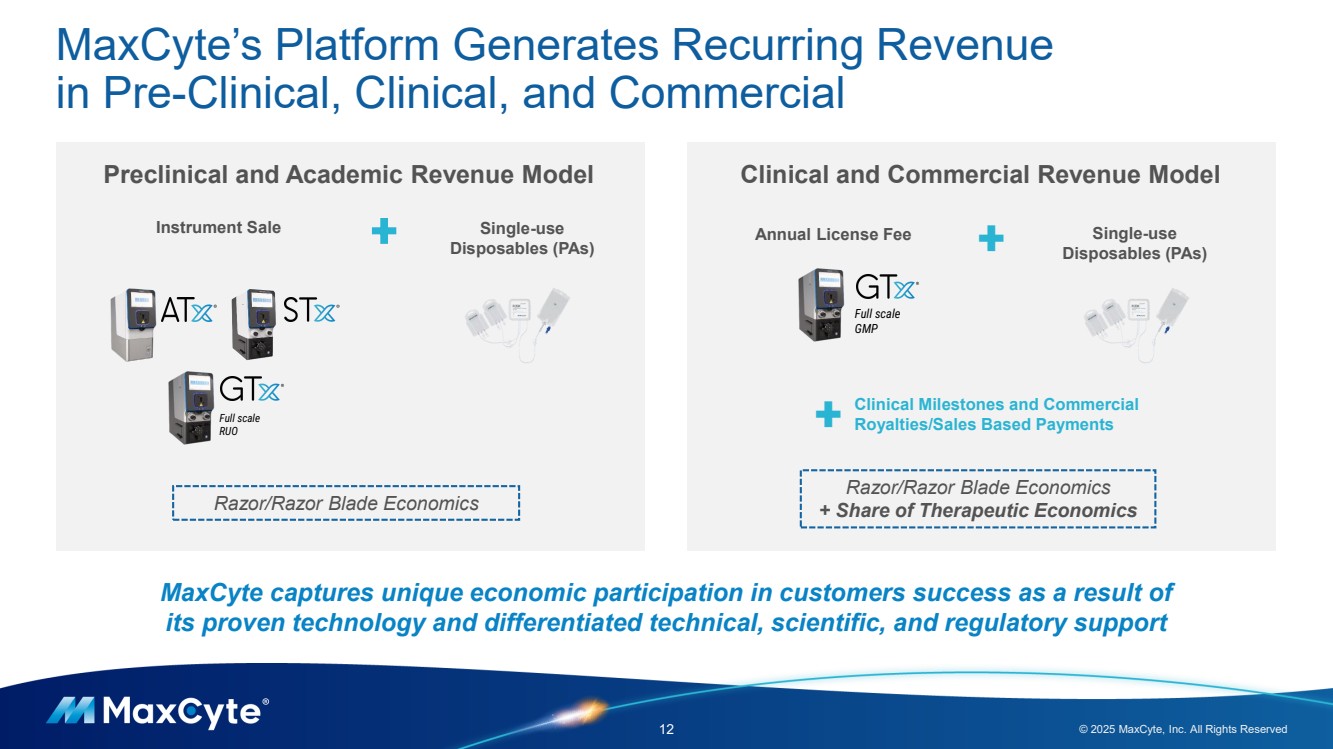
| MaxCyte’s Platform Generates Recurring Revenue in Pre-Clinical, Clinical, and Commercial 12 © 2025 MaxCyte, Inc. All Rights Reserved Razor/Razor Blade Economics Full scale RUO Preclinical and Academic Revenue Model Instrument Sale Clinical and Commercial Revenue Model Annual License Fee Razor/Razor Blade Economics + Share of Therapeutic Economics Clinical Milestones and Commercial Royalties/Sales Based Payments Single-use Disposables (PAs) Full scale GMP Single-use Disposables (PAs) + + + MaxCyte captures unique economic participation in customers success as a result of its proven technology and differentiated technical, scientific, and regulatory support |
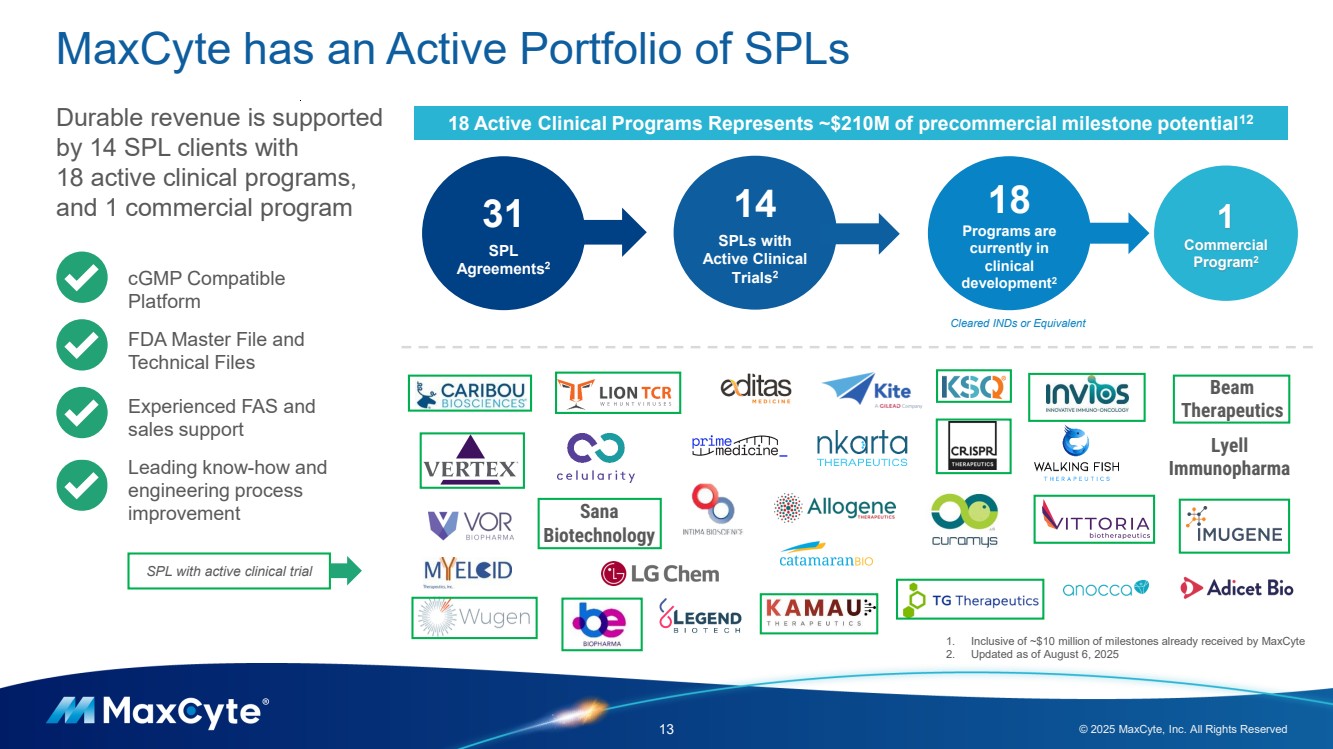
| MaxCyte has an Active Portfolio of SPLs 13 © 2025 MaxCyte, Inc. All Rights Reserved 1 Commercial Program2 31 SPL Agreements2 18 Programs are currently in clinical development2 Cleared INDs or Equivalent Durable revenue is supported by 14 SPL clients with 18 active clinical programs, and 1 commercial program Sana Biotechnology Beam Therapeutics Lyell Immunopharma cGMP Compatible Platform FDA Master File and Technical Files Experienced FAS and sales support Leading know-how and engineering process improvement 18 Active Clinical Programs Represents ~$210M of precommercial milestone potential12 1. Inclusive of ~$10 million of milestones already received by MaxCyte 2. Updated as of August 6, 2025 14 SPLs with Active Clinical Trials2 SPL with active clinical trial |
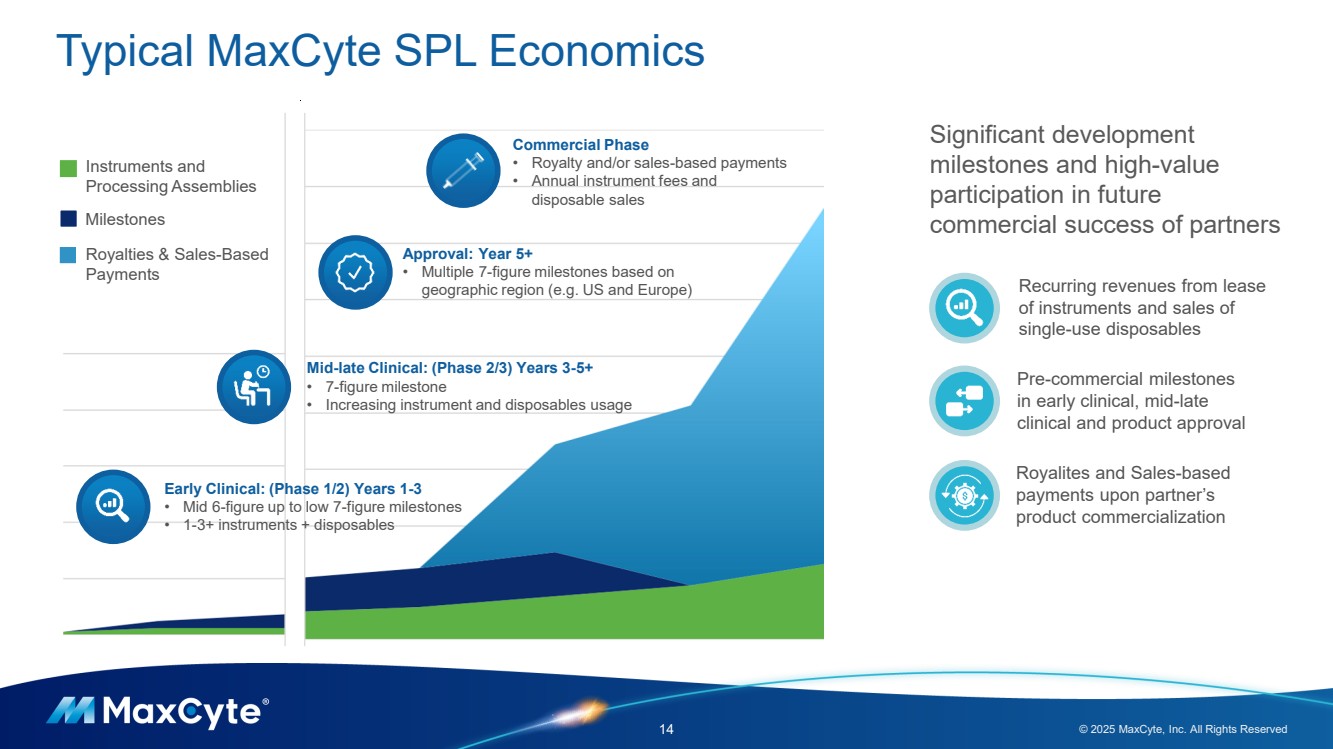
| Typical MaxCyte SPL Economics 14 © 2025 MaxCyte, Inc. All Rights Reserved Early Clinical: (Phase 1/2) Years 1-3 • Mid 6-figure up to low 7-figure milestones • 1-3+ instruments + disposables Mid-late Clinical: (Phase 2/3) Years 3-5+ • 7-figure milestone • Increasing instrument and disposables usage Approval: Year 5+ • Multiple 7-figure milestones based on geographic region (e.g. US and Europe) Commercial Phase • Royalty and/or sales-based payments • Annual instrument fees and disposable sales Instruments and Processing Assemblies Milestones Royalties & Sales-Based Payments Pre-commercial milestones in early clinical, mid-late clinical and product approval Significant development milestones and high-value participation in future commercial success of partners Recurring revenues from lease of instruments and sales of single-use disposables Royalites and Sales-based payments upon partner’s product commercialization |
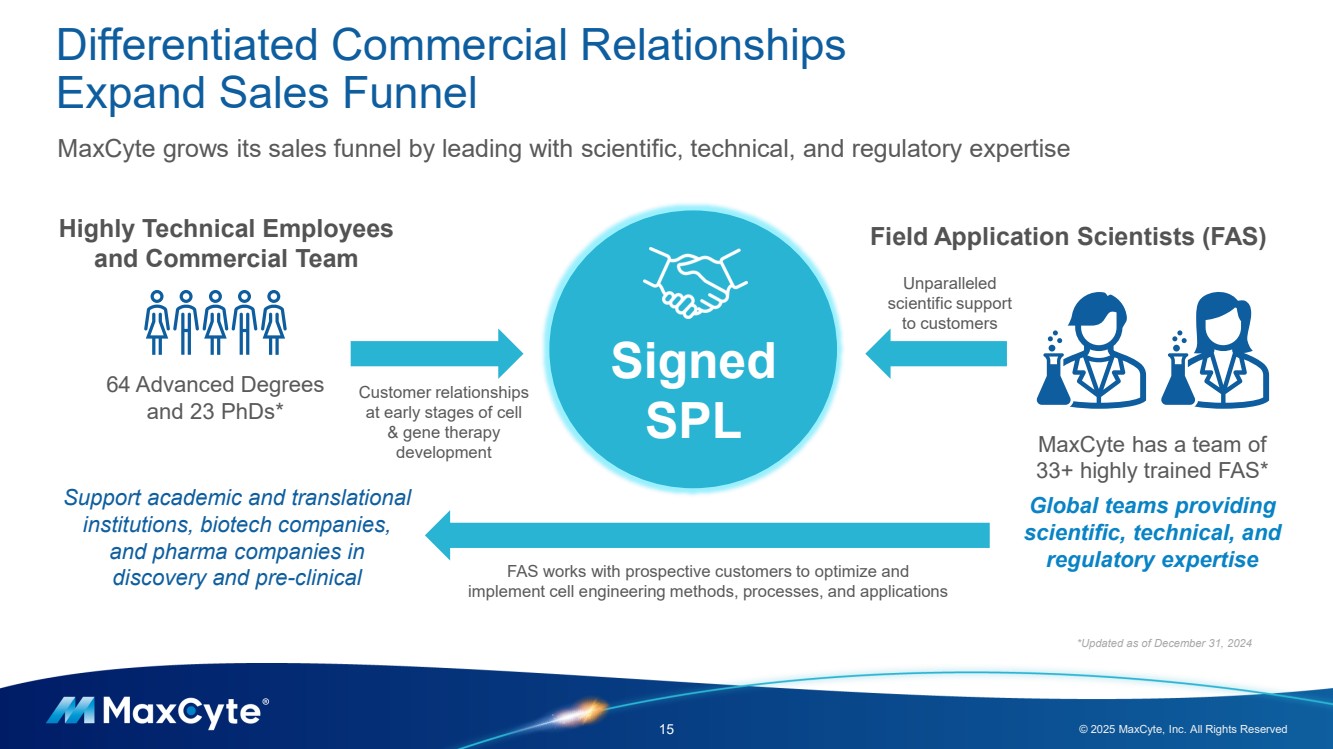
| Differentiated Commercial Relationships Expand Sales Funnel 15 © 2025 MaxCyte, Inc. All Rights Reserved Highly Technical Employees Field Application Scientists (FAS) and Commercial Team Unparalleled scientific support to customers Customer relationships at early stages of cell & gene therapy development Signed SPL *Updated as of December 31, 2024 MaxCyte has a team of 33+ highly trained FAS* Global teams providing scientific, technical, and regulatory expertise FAS works with prospective customers to optimize and implement cell engineering methods, processes, and applications MaxCyte grows its sales funnel by leading with scientific, technical, and regulatory expertise 64 Advanced Degrees and 23 PhDs* Support academic and translational institutions, biotech companies, and pharma companies in discovery and pre-clinical |
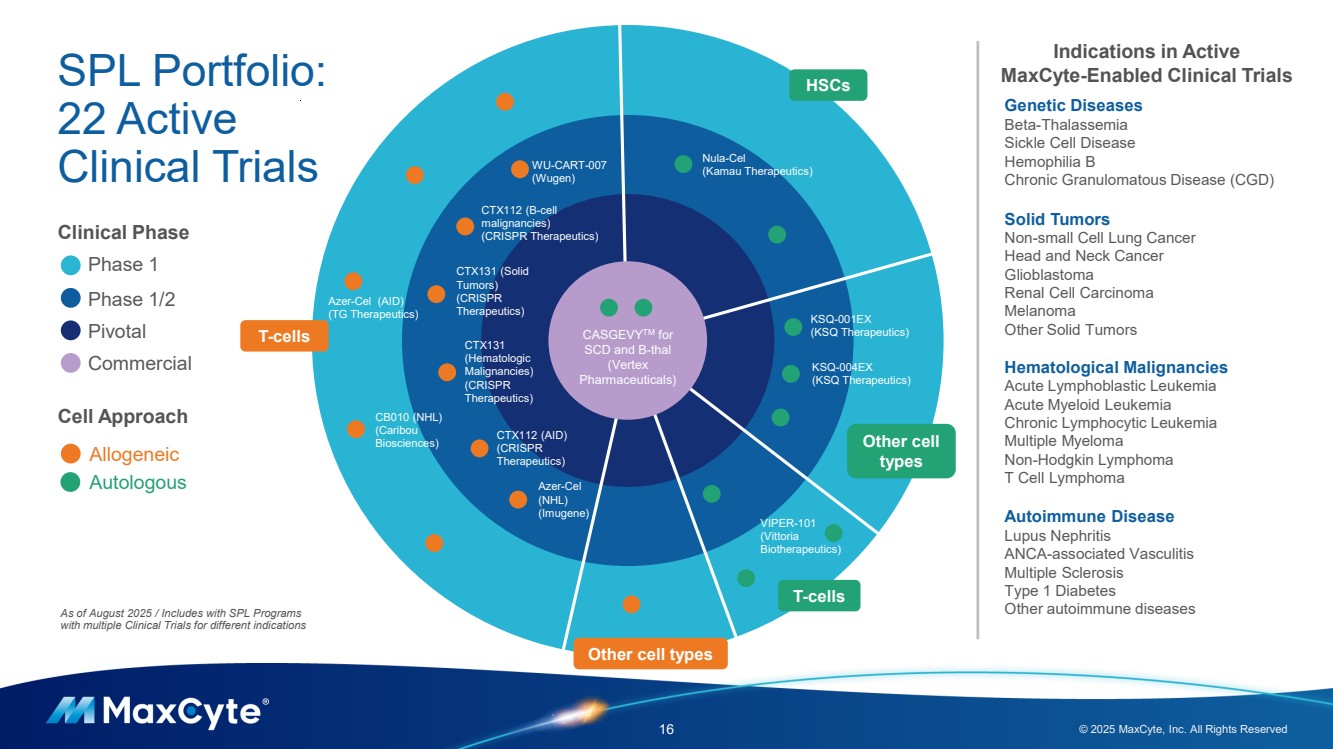
| 16 © 2025 MaxCyte, Inc. All Rights Reserved As of August 2025 / Includes with SPL Programs with multiple Clinical Trials for different indications Allogeneic Autologous Cell Approach Phase 1 Phase 1/2 Pivotal Commercial Clinical Phase HSCs Other cell types T-cells T-cells Nula-Cel (Kamau Therapeutics) CB010 (NHL) (Caribou Biosciences) Azer-Cel (NHL) (Imugene) Azer-Cel (AID) (TG Therapeutics) KSQ-001EX (KSQ Therapeutics) KSQ-004EX (KSQ Therapeutics) VIPER-101 (Vittoria Biotherapeutics) Other cell types CASGEVYTM for SCD and B-thal (Vertex Pharmaceuticals) CTX112 (B-cell malignancies) (CRISPR Therapeutics) CTX131 (Solid Tumors) (CRISPR Therapeutics) CTX131 (Hematologic Malignancies) (CRISPR Therapeutics) CTX112 (AID) (CRISPR Therapeutics) Indications in Active MaxCyte-Enabled Clinical Trials Genetic Diseases Beta-Thalassemia Sickle Cell Disease Hemophilia B Chronic Granulomatous Disease (CGD) Solid Tumors Non-small Cell Lung Cancer Head and Neck Cancer Glioblastoma Renal Cell Carcinoma Melanoma Other Solid Tumors Hematological Malignancies Acute Lymphoblastic Leukemia Acute Myeloid Leukemia Chronic Lymphocytic Leukemia Multiple Myeloma Non-Hodgkin Lymphoma T Cell Lymphoma Autoimmune Disease Lupus Nephritis ANCA-associated Vasculitis Multiple Sclerosis Type 1 Diabetes Other autoimmune diseases SPL Portfolio: 22 Active Clinical Trials WU-CART-007 (Wugen) |
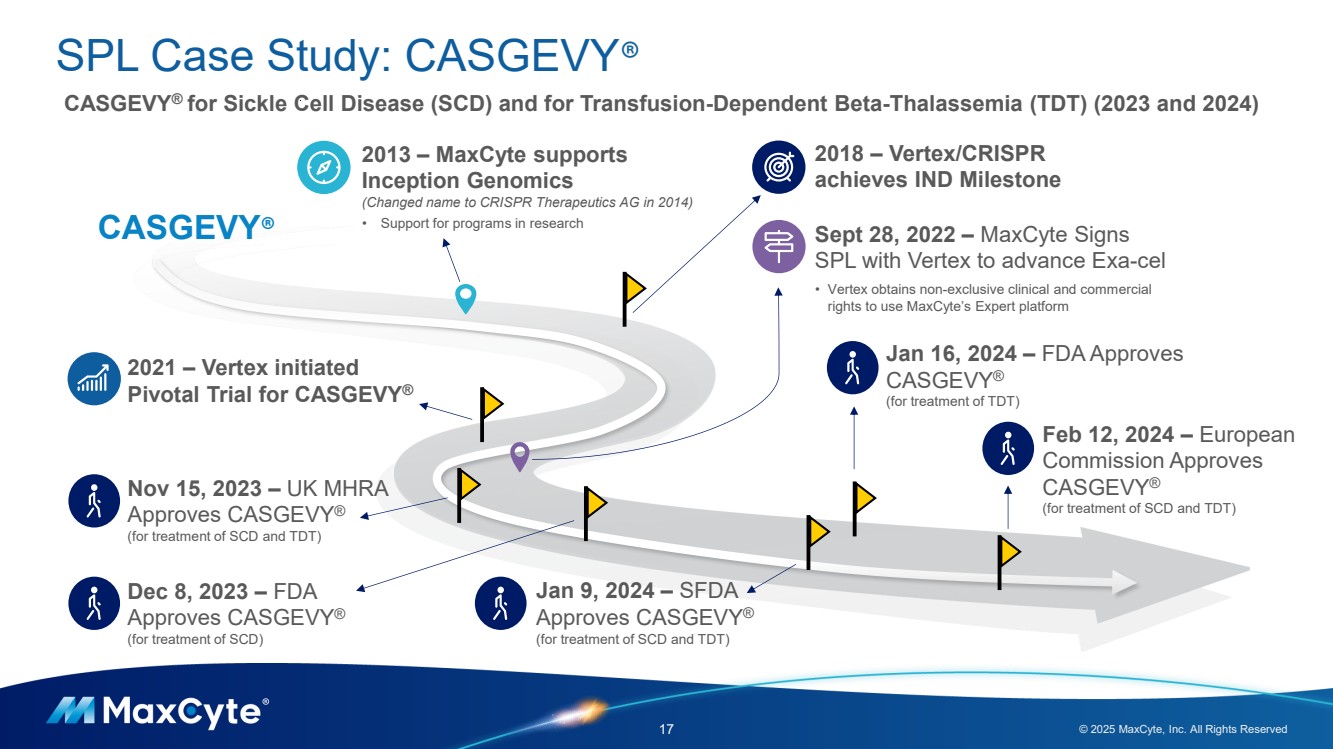
| SPL Case Study: CASGEVY® 17 © 2025 MaxCyte, Inc. All Rights Reserved CASGEVY® for Sickle Cell Disease (SCD) and for Transfusion-Dependent Beta-Thalassemia (TDT) (2023 and 2024) 2013 – MaxCyte supports Inception Genomics (Changed name to CRISPR Therapeutics AG in 2014) • Support for programs in research 2018 – Vertex/CRISPR achieves IND Milestone Sept 28, 2022 – MaxCyte Signs SPL with Vertex to advance Exa-cel • Vertex obtains non-exclusive clinical and commercial rights to use MaxCyte’s Expert platform Dec 8, 2023 – FDA Approves CASGEVY® (for treatment of SCD) 2021 – Vertex initiated Pivotal Trial for CASGEVY® Jan 16, 2024 – FDA Approves CASGEVY® (for treatment of TDT) Feb 12, 2024 – European Commission Approves CASGEVY® (for treatment of SCD and TDT) Nov 15, 2023 – UK MHRA Approves CASGEVY® (for treatment of SCD and TDT) CASGEVY® Jan 9, 2024 – SFDA Approves CASGEVY® (for treatment of SCD and TDT) |
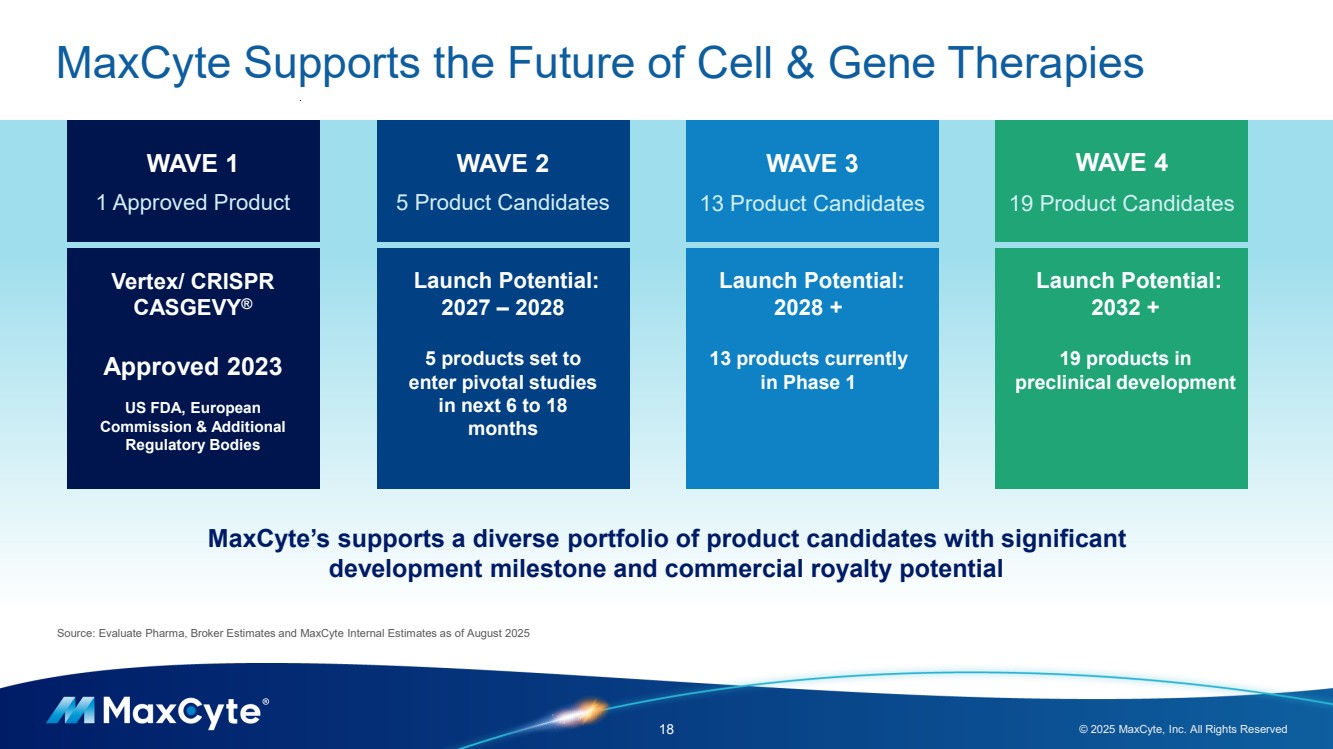
| MaxCyte Supports the Future of Cell & Gene Therapies 18 © 2025 MaxCyte, Inc. All Rights Reserved WAVE 1 1 Approved Product WAVE 2 5 Product Candidates WAVE 3 13 Product Candidates WAVE 4 19 Product Candidates Vertex/ CRISPR CASGEVY® Approved 2023 US FDA, European Commission & Additional Regulatory Bodies Launch Potential: 2027 – 2028 5 products set to enter pivotal studies in next 6 to 18 months Launch Potential: 2028 + 13 products currently in Phase 1 Launch Potential: 2032 + 19 products in preclinical development Source: Evaluate Pharma, Broker Estimates and MaxCyte Internal Estimates as of August 2025 MaxCyte’s supports a diverse portfolio of product candidates with significant development milestone and commercial royalty potential |
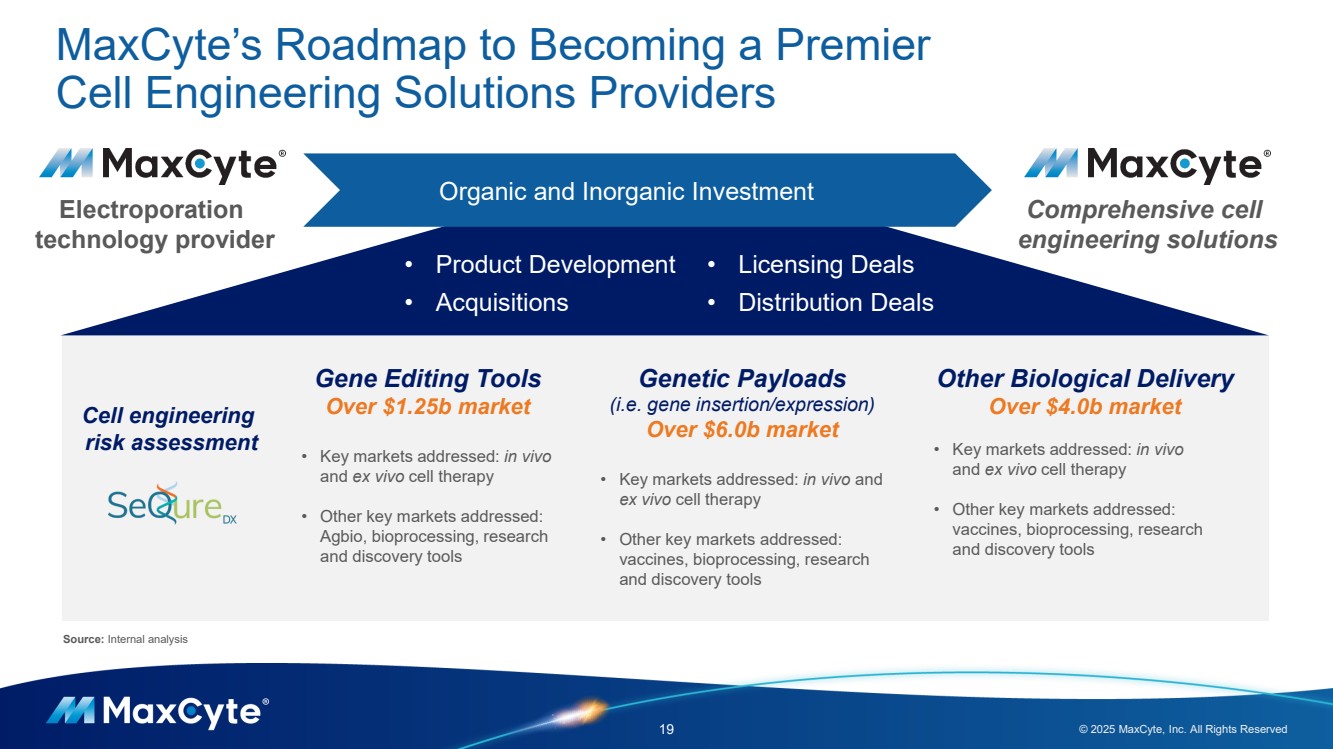
| MaxCyte’s Roadmap to Becoming a Premier Cell Engineering Solutions Providers 19 © 2025 MaxCyte, Inc. All Rights Reserved Electroporation technology provider Comprehensive cell engineering solutions Gene Editing Tools Over $1.25b market • Key markets addressed: in vivo and ex vivo cell therapy • Other key markets addressed: Agbio, bioprocessing, research and discovery tools Genetic Payloads (i.e. gene insertion/expression) Over $6.0b market • Key markets addressed: in vivo and ex vivo cell therapy • Other key markets addressed: vaccines, bioprocessing, research and discovery tools Other Biological Delivery Over $4.0b market • Key markets addressed: in vivo and ex vivo cell therapy • Other key markets addressed: vaccines, bioprocessing, research and discovery tools Cell engineering risk assessment Organic and Inorganic Investment • Product Development • Acquisitions • Licensing Deals • Distribution Deals Source: Internal analysis |
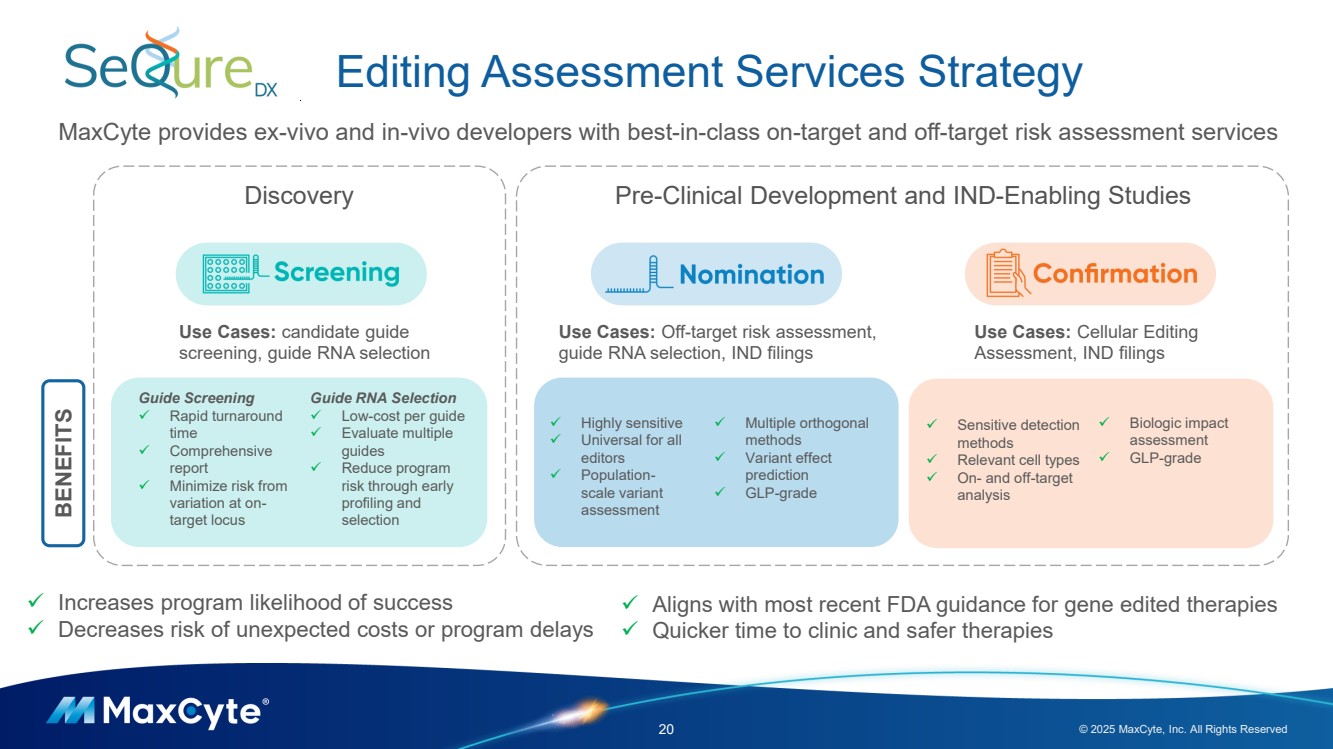
| Editing Assessment Services Strategy 20 © 2025 MaxCyte, Inc. All Rights Reserved MaxCyte provides ex-vivo and in-vivo developers with best-in-class on-target and off-target risk assessment services Use Cases: candidate guide screening, guide RNA selection Use Cases: Off-target risk assessment, guide RNA selection, IND filings ✓ Highly sensitive ✓ Universal for all editors ✓ Population-scale variant assessment ✓ Multiple orthogonal methods ✓ Variant effect prediction ✓ GLP-grade Guide Screening ✓ Rapid turnaround time ✓ Comprehensive report ✓ Minimize risk from variation at on-target locus Guide RNA Selection ✓ Low-cost per guide ✓ Evaluate multiple guides ✓ Reduce program risk through early profiling and selection Use Cases: Cellular Editing Assessment, IND filings ✓ Sensitive detection methods ✓ Relevant cell types ✓ On- and off-target analysis ✓ Biologic impact assessment ✓ GLP-grade ✓ Increases program likelihood of success ✓ Decreases risk of unexpected costs or program delays ✓ Aligns with most recent FDA guidance for gene edited therapies ✓ Quicker time to clinic and safer therapies Discovery Pre-Clinical Development and IND-Enabling Studies BENEFITS |
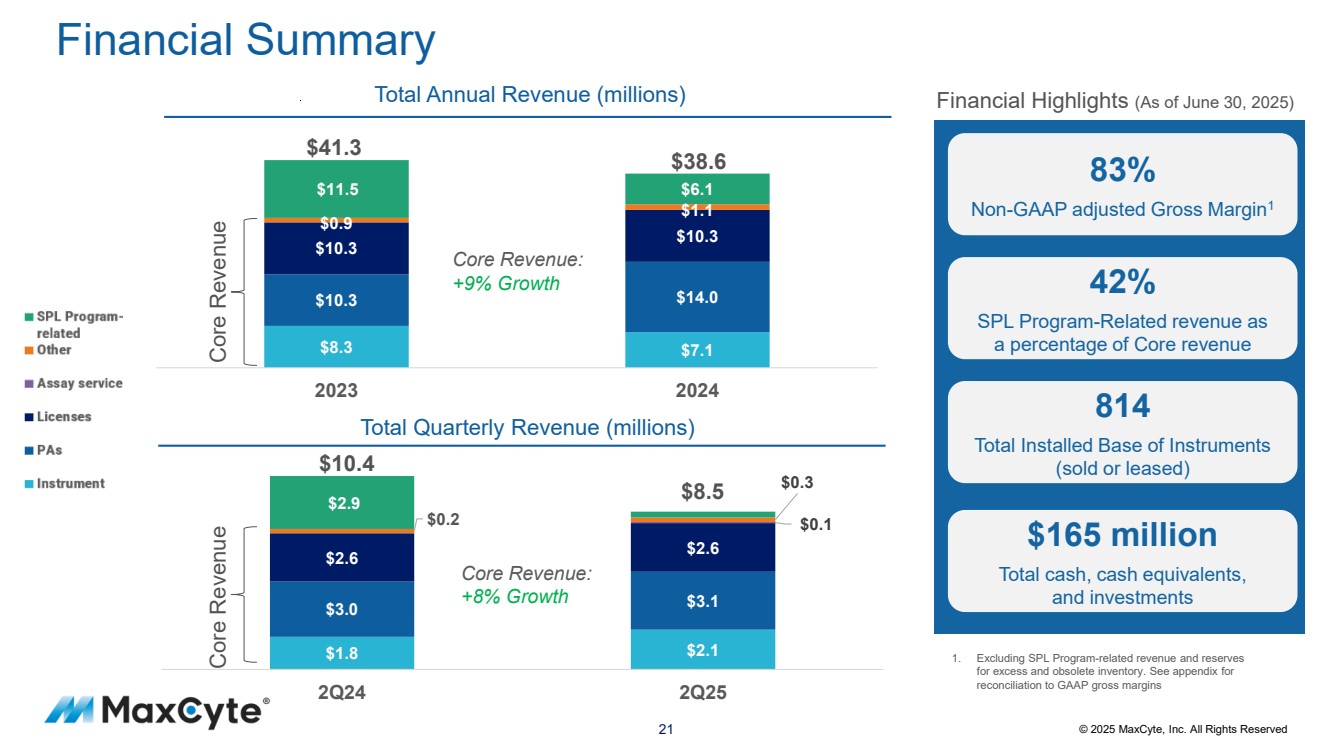
| 21 © 2025 MaxCyte, Inc. All Rights Reserved Financial Summary $1.8 $2.1 $3.0 $3.1 $2.6 $2.6 $0.1 $0.2 $0.3 $2.9 2Q24 2Q25 Core Revenue: +8% Growth $8.3 $7.1 $10.3 $14.0 $10.3 $10.3 $0.9 $1.1 $11.5 $6.1 2023 2024 Core Revenue: +9% Growth 1. Excluding SPL Program-related revenue and reserves for excess and obsolete inventory. See appendix for reconciliation to GAAP gross margins Financial Highlights (As of June 30, 2025) 83% Non-GAAP adjusted Gross Margin1 42% SPL Program-Related revenue as a percentage of Core revenue 814 Total Installed Base of Instruments (sold or leased) $165 million Total cash, cash equivalents, and investments Total Annual Revenue (millions) Core Revenue Total Quarterly Revenue (millions) Core Revenue $41.3 $38.6 $10.4 $8.5 |
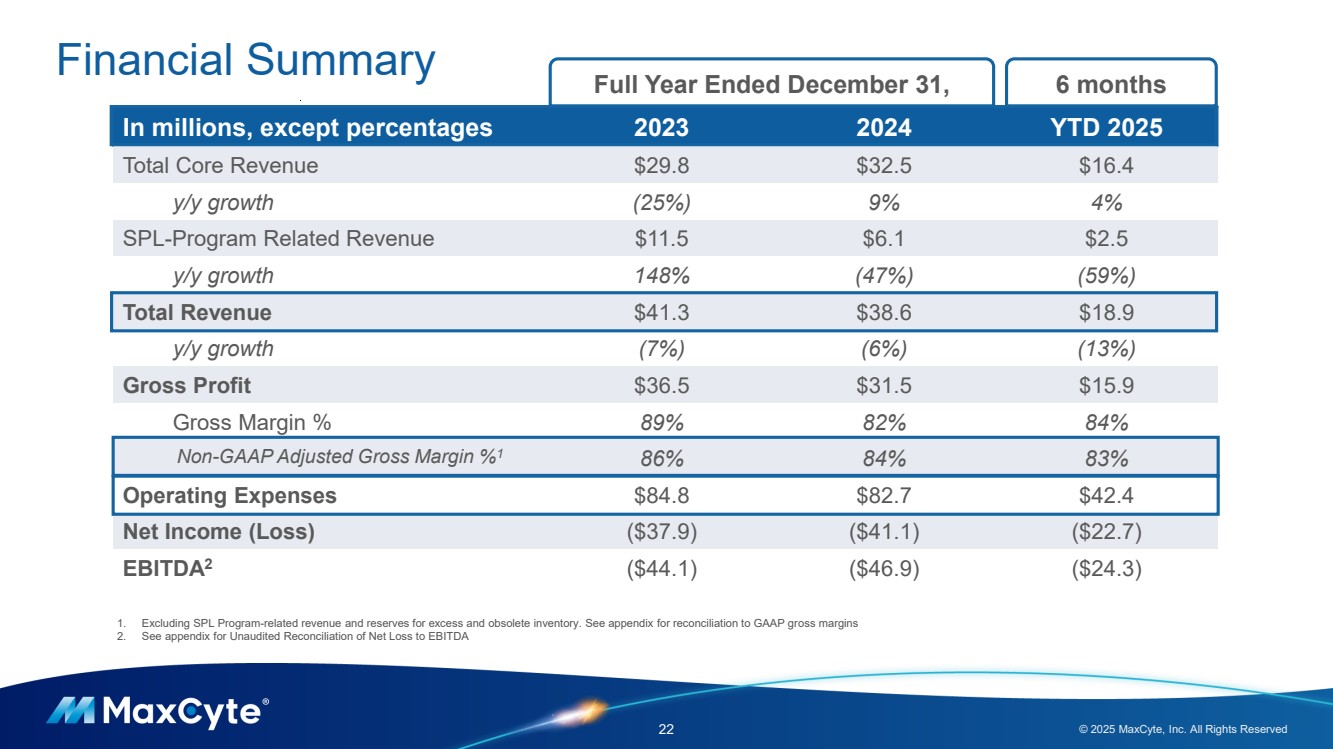
| Financial Summary 22 © 2025 MaxCyte, Inc. All Rights Reserved In millions, except percentages 2023 2024 YTD 2025 Total Core Revenue $29.8 $32.5 $16.4 y/y growth (25%) 9% 4% SPL-Program Related Revenue $11.5 $6.1 $2.5 y/y growth 148% (47%) (59%) Total Revenue $41.3 $38.6 $18.9 y/y growth (7%) (6%) (13%) Gross Profit $36.5 $31.5 $15.9 Gross Margin % 89% 82% 84% Non-GAAP Adjusted Gross Margin %1 86% 84% 83% Operating Expenses $84.8 $82.7 $42.4 Net Income (Loss) ($37.9) ($41.1) ($22.7) EBITDA2 ($44.1) ($46.9) ($24.3) Full Year Ended December 31, 1. Excluding SPL Program-related revenue and reserves for excess and obsolete inventory. See appendix for reconciliation to GAAP gross margins 2. See appendix for Unaudited Reconciliation of Net Loss to EBITDA 6 months |
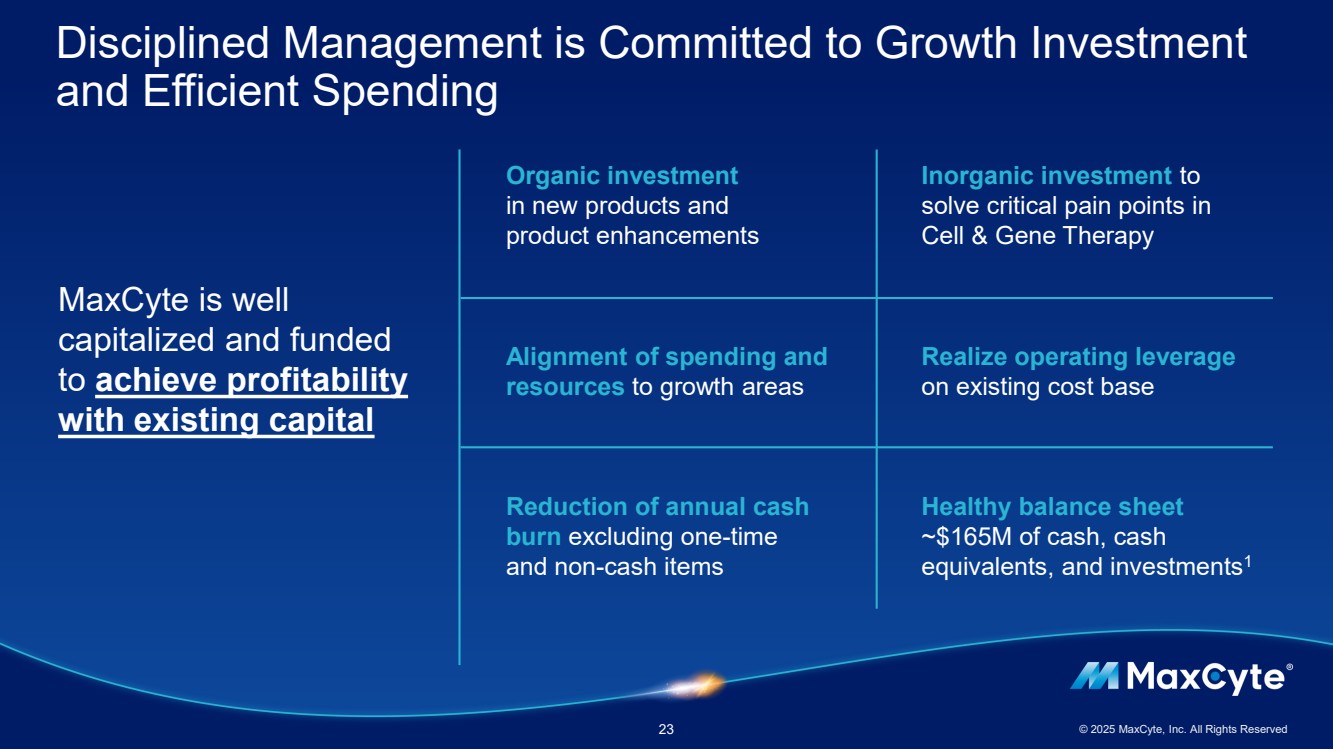
| Disciplined Management is Committed to Growth Investment and Efficient Spending 23 © 2025 MaxCyte, Inc. All Rights Reserved MaxCyte is well capitalized and funded to achieve profitability with existing capital Alignment of spending and resources to growth areas Organic investment in new products and product enhancements Reduction of annual cash burn excluding one-time and non-cash items Realize operating leverage on existing cost base Inorganic investment to solve critical pain points in Cell & Gene Therapy Healthy balance sheet ~$165M of cash, cash equivalents, and investments1 |
| All other trademarks are the property of their respective owners. ©2025 MaxCyte, Inc. All rights reserved. For a complete list of MaxCyte trademarks in the United States and other countries, please visit maxcyte.com/trademarks. Thank you! Any questions? ir@maxcyte.com 24 © 2025 MaxCyte, Inc. All Rights Reserved |
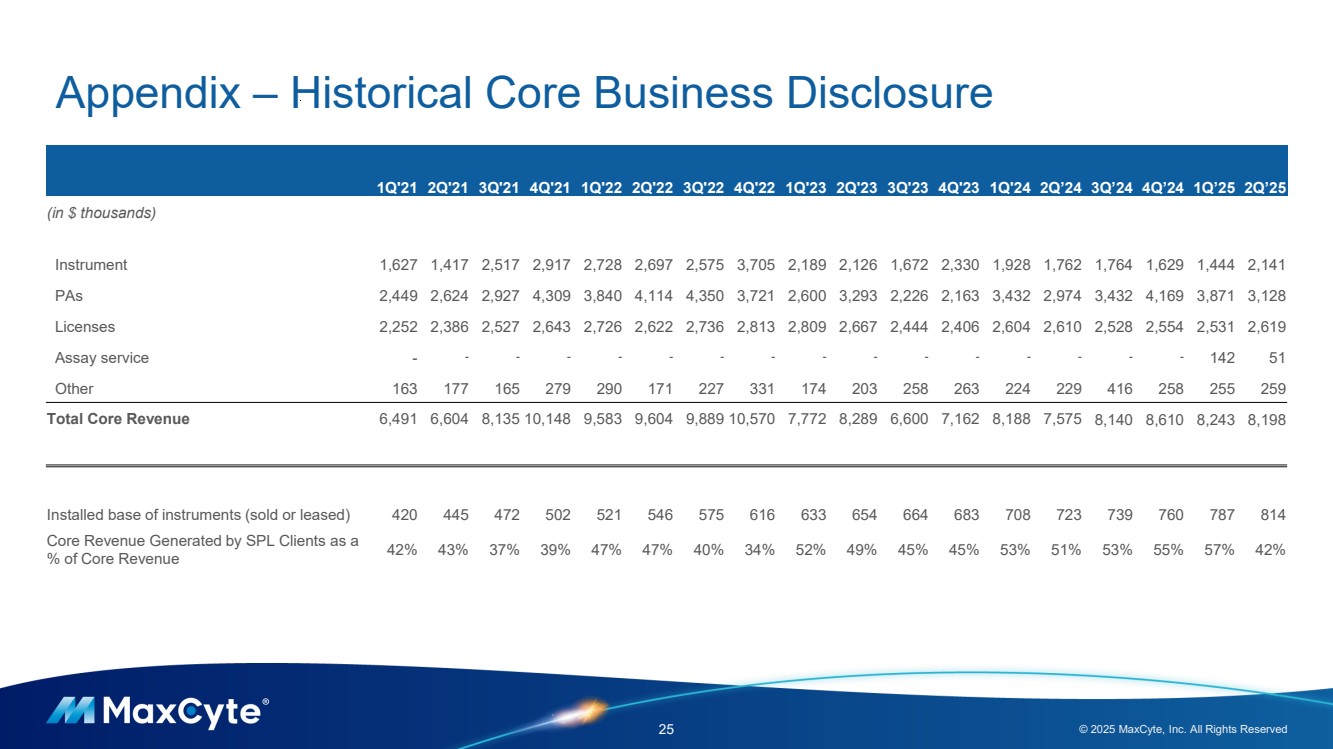
| Appendix – Historical Core Business Disclosure 25 © 2025 MaxCyte, Inc. All Rights Reserved 1Q'21 2Q'21 3Q'21 4Q'21 1Q'22 2Q'22 3Q'22 4Q'22 1Q'23 2Q'23 3Q'23 4Q'23 1Q'24 2Q’24 3Q’24 4Q’24 1Q’25 2Q’25 (in $ thousands) Instrument 1,627 1,417 2,517 2,917 2,728 2,697 2,575 3,705 2,189 2,126 1,672 2,330 1,928 1,762 1,764 1,629 1,444 2,141 PAs 2,449 2,624 2,927 4,309 3,840 4,114 4,350 3,721 2,600 3,293 2,226 2,163 3,432 2,974 3,432 4,169 3,871 3,128 Licenses 2,252 2,386 2,527 2,643 2,726 2,622 2,736 2,813 2,809 2,667 2,444 2,406 2,604 2,610 2,528 2,554 2,531 2,619 Assay service - - - - - - - - - - - - - - - - 142 51 Other 163 177 165 279 290 171 227 331 174 203 258 263 224 229 416 258 255 259 Total Core Revenue 6,491 6,604 8,135 10,148 9,583 9,604 9,889 10,570 7,772 8,289 6,600 7,162 8,188 7,575 8,140 8,610 8,243 8,198 Installed base of instruments (sold or leased) 420 445 472 502 521 546 575 616 633 654 664 683 708 723 739 760 787 814 Core Revenue Generated by SPL Clients as a % of Core Revenue 42% 43% 37% 39% 47% 47% 40% 34% 52% 49% 45% 45% 53% 51% 53% 55% 57% 42% |
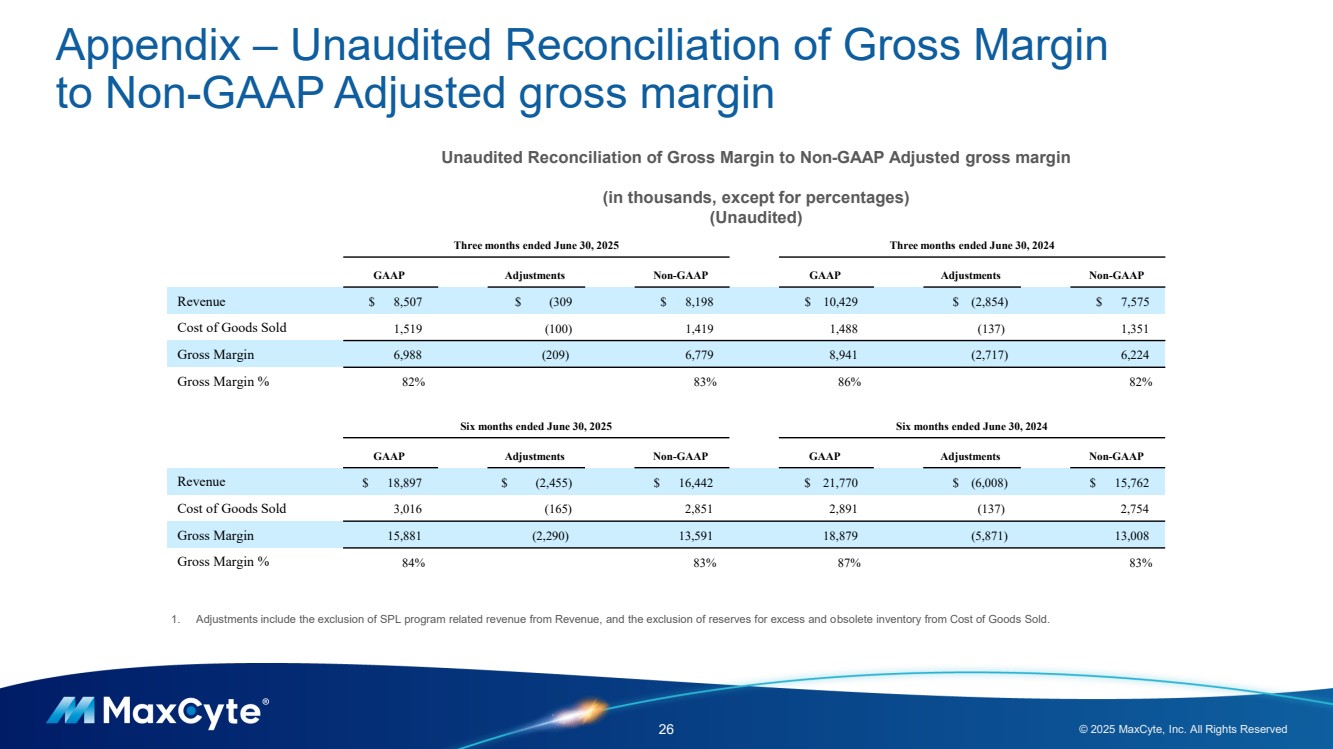
| Appendix – Unaudited Reconciliation of Gross Margin to Non-GAAP Adjusted gross margin 26 © 2025 MaxCyte, Inc. All Rights Reserved 1. Adjustments include the exclusion of SPL program related revenue from Revenue, and the exclusion of reserves for excess and obsolete inventory from Cost of Goods Sold. Unaudited Reconciliation of Gross Margin to Non-GAAP Adjusted gross margin (in thousands, except for percentages) (Unaudited) Three months ended June 30, 2025 Three months ended June 30, 2024 GAAP Adjustments Non-GAAP GAAP Adjustments Non-GAAP Revenue $ 8,507 $ (309 $ 8,198 $ 10,429 $ (2,854) $ 7,575 Cost of Goods Sold 1,519 (100) 1,419 1,488 (137) 1,351 Gross Margin 6,988 (209) 6,779 8,941 (2,717) 6,224 Gross Margin % 82% 83% 86% 82% Six months ended June 30, 2025 Six months ended June 30, 2024 GAAP Adjustments Non-GAAP GAAP Adjustments Non-GAAP Revenue $ 18,897 $ (2,455) $ 16,442 $ 21,770 $ (6,008) $ 15,762 Cost of Goods Sold 3,016 (165) 2,851 2,891 (137) 2,754 Gross Margin 15,881 (2,290) 13,591 18,879 (5,871) 13,008 Gross Margin % 84% 83% 87% 83% |
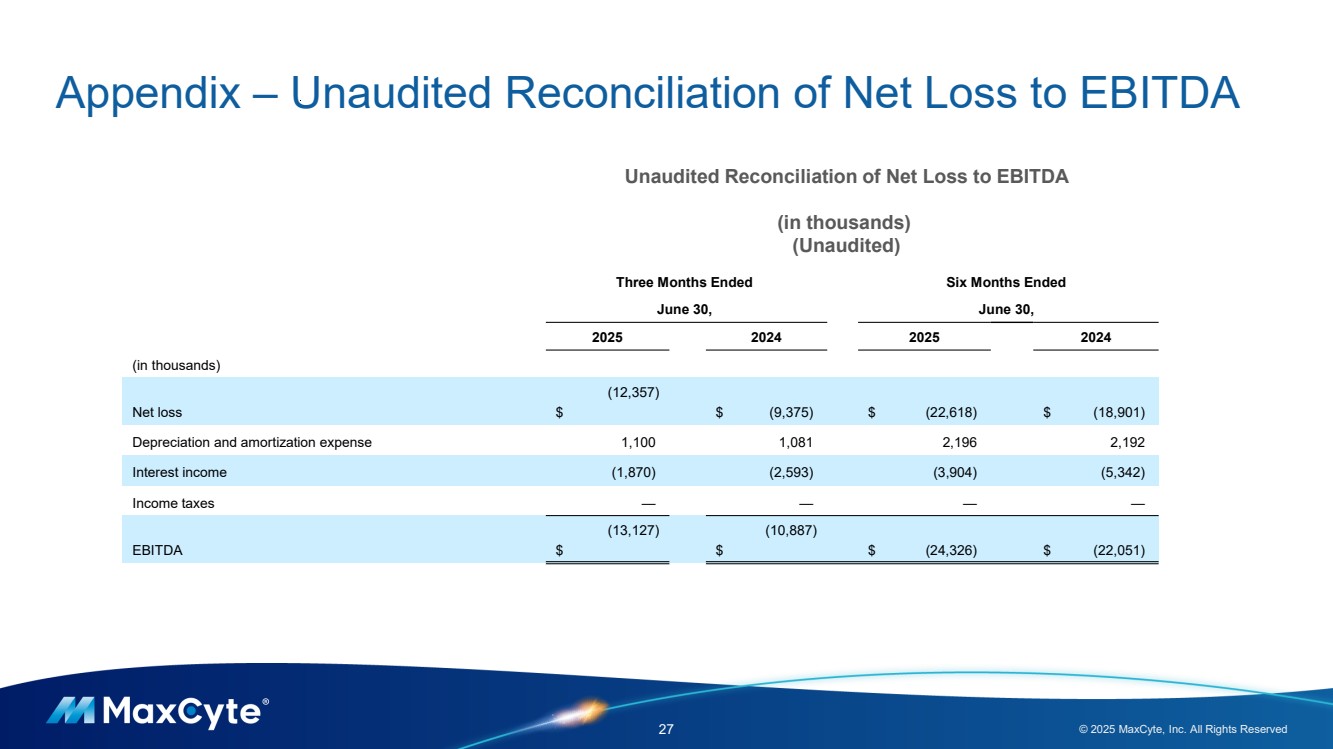
| Appendix – Unaudited Reconciliation of Net Loss to EBITDA 27 © 2025 MaxCyte, Inc. All Rights Reserved Unaudited Reconciliation of Net Loss to EBITDA (in thousands) (Unaudited) Three Months Ended Six Months Ended June 30, June 30, 2025 2024 2025 2024 (in thousands) Net loss $ (12,357) $ (9,375) $ (22,618) $ (18,901) Depreciation and amortization expense 1,100 1,081 2,196 2,192 Interest income (1,870) (2,593) (3,904) (5,342) Income taxes — — — — EBITDA $ (13,127) $ (10,887) $ (24,326) $ (22,051) |