Management’s
Discussion and
Analysis
For the Three and Six Months Ended June 30, 2025 and 2024

This Management’s Discussion and Analysis (“MD&A”) has been prepared as of August 6, 2025 and is intended to provide a review of the financial position and results of operations of Centerra Gold Inc. (“Centerra” or the “Company”) for the three and six months ended June 30, 2025 in comparison with the corresponding periods ended June 30, 2024. This discussion should be read in conjunction with the Company’s unaudited condensed consolidated interim financial statements and the notes thereto for the three and six months ended June 30, 2025 and consolidated financial statements and notes thereto for the year ended December 31, 2024 prepared in accordance with International Financial Reporting Standards (“IFRS”) as issued by the International Accounting Standards Board (“IASB”) available at www.centerragold.com and on SEDAR+ (“SEDAR”) at www.sedarplus.ca and EDGAR at www.sec.gov/edgar. In addition, this discussion contains forward-looking information regarding Centerra’s business and operations. Such forward-looking statements involve risks, uncertainties and other factors that could cause actual results to differ materially from those expressed or implied by such forward-looking statements. See “Cautionary Statement on Forward- Looking Information” below. All dollar amounts are expressed in United States dollars (“USD”), except as otherwise indicated. All references in this document denoted with NG indicate a “specified financial measure” within the meaning of National Instrument 52-112 Non-GAAP and Other Financial Measures Disclosure of the Canadian Securities Administrators. None of these measures are standardized financial measures under IFRS and these measures may not be comparable to similar financial measures disclosed by other issuers. See section “Non-GAAP and Other Financial Measures” below for a discussion of the specified financial measures used in this document and a reconciliation to the most directly comparable IFRS measures.
Cautionary Statement on Forward-Looking Information
All statements, other than statements of historical fact contained or incorporated by reference in this document, which address events, results, outcomes or developments that the Company expects to occur are, or may be deemed to be, forward-looking information or forward-looking statements within the meaning of certain securities laws, including the provisions of the Securities Act (Ontario) and the provisions for “safe harbor” under the United States Private Securities Litigation Reform Act of 1995 and are based on expectations, estimates and projections as of the date of this document. Such forward-looking information involves risks, uncertainties and other factors that could cause actual results, performance, prospects and opportunities to differ materially from those expressed or implied by such forward-looking information. Forward-looking statements are generally, but not always, identified by the use of forward-looking terminology such as “aimed”, “anticipate”, “believe”, “beyond”, “commenced”, “continue”, “expect”, “extend”, “evaluate”, “finalizing”, “focused”, “forecast”, “goal”, “intend”, “in line”, “ongoing”, “optimistic”, “on track”, “plan”, “potential”, “preliminary”, “project”, “pursuing”, “target”, or “update”, or variations of such words and phrases and similar expressions or statements that certain actions, events or results “may”, “could”, “would” or “will” be taken, occur or be achieved or the negative connotation of such terms.
Such statements include, but may not be limited to: statements regarding 2025 guidance, outlook and expectations, including, but not limited to, production, costs, capital expenditures, grade profiles, cash flow, care and maintenance, PP&E and reclamation costs, recoveries, processing, inflation, depreciation, depletion and amortization, taxes and annual royalty payments; the ability of the Company to finance the majority of 2025 expenditures from the cash flows provided by the Mount Milligan Mine and Öksüt Mine; exploration potential, budgets, focuses, programs, targets and projected exploration results; gold, copper and molybdenum prices; market conditions; the declaration, payment and sustainability of the Company’s dividends; the continuation of the Company’s normal course issuer bid (“NCIB”) and automatic share purchase plan and the timing, methods and quantity of any purchases of Shares under the NCIB; compliance with applicable laws and regulations pertaining to the NCIB; the availability of cash for repurchases of Common Shares under the NCIB; achieving emission reductions economically and operationally; the development and construction of Goldfield and the ability of the Company to enhance its value proposition including delivering strong returns; Goldfield Project’s life of mine, average annual production and costs including its initial capital costs and the expectation to fund this from the Company’s existing liquidity; the timing of first production at Goldfield and the impact it would have on Centerra’s production profile, cash flow and value to shareholders; the results of a technical study on the Goldfield Project including the economics for the project and the ability of financial hedges to lock in strong margins, safeguard project economics and expedite the capital payback period; the capital investment required at the Goldfield Project and any benefits realized from its short timeline to first production and its flowsheet; the timing and content of a pre-feasibility
study (“PFS”) at the Mount Milligan Mine and any related evaluation of resources or reserves or a life of mine beyond 2036, options for additional tailings capacity, any increased mill throughput, additional downstream flowsheet improvements and their costs and any impact on metal recovery; the future success of the Kemess Project, the timing and content of a preliminary economic assessment (“PEA”) and accompanying update on its technical concept including mining methods; any potential synergies between the Kemess Project and Thesis Gold Inc’s properties; the timing and amount of future benefits and obligations in connection with the Additional Royal Gold Agreement; the ability of the existing infrastructure at the Kemess Project to lower execution risk for the project and the possibility that any additional infrastructure will complement it; the success of an infill and grade control drilling program at the Mount Milligan Mine and its ability to enhance geological confidence and provide an improved and more robust mine plan; the expectation that production and sales at the Mount Milligan and Öksüt Mines will be weighted towards the second half of 2025; the timing and capital required for the restart of Thompson Creek Mine; the integrated business plan of the Molybdenum Business Unit including the restart of the Thompson Creek Mine and commercial optimization of the Langeloth Facility; the commercial success of the Molybdenum Business Unit and the Langeloth Facili; the commissioning of equipment at the Thompson Creek Mine and the development of site infrastructure and housing; the Company’s strategic plan; the impact of any trade tariffs being consistent with the Company’s current expectations; royalty rates and taxes in Türkiye including withholding taxes related to repatriation of earnings; the site-wide optimization program at the Mount Milligan Mine; financial hedges; and other statements that express management’s expectations or estimates of future plans and performance, operational, geological or financial results, estimates or amounts not yet determinable and assumptions of management.
The Company cautions that forward-looking statements are necessarily based upon a number of factors and assumptions that, while considered reasonable by the Company at the time of making such statements, are inherently subject to significant business, economic, technical, legal, geopolitical and competitive uncertainties and contingencies, which may prove to be incorrect. Known and unknown factors could cause actual results to differ materially from those projected in the forward-looking statements and undue reliance should not be placed on such statements and information.
Risk factors that may affect the Company’s ability to achieve the expectations set forth in the forward-looking statements in this document include, but are not limited to: (A) strategic, legal, planning and other risks, including: political risks associated with the Company’s operations in Türkiye, the USA and Canada; resource nationalism including the management of external stakeholder expectations; the impact of changes in, or to the more aggressive enforcement of, laws, government royalties, tariffs, regulations and government practices, including unjustified civil or criminal action against the Company, its affiliates, or its current or former employees; risks that community activism may result in increased contributory demands or business interruptions; the risks related to outstanding litigation affecting the Company; the impact of any sanctions or tariffs imposed by Canada, the United States or other jurisdictions; potential defects of title in the Company’s properties that are not known as of the date hereof; permitting and development of our projects, including tailings facilities, being consistent with the Company’s expectations; the inability of the Company and its subsidiaries to enforce their legal rights in certain circumstances; risks related to anti-corruption legislation; Centerra not being able to replace mineral reserves; Indigenous claims and consultative issues relating to the Company’s properties which are in proximity to Indigenous communities; and potential risks related to kidnapping or acts of terrorism; (B) risks relating to financial matters, including: sensitivity of the Company’s business to the volatility of gold, copper, molybdenum and other mineral prices; the use of provisionally-priced sales contracts for production at the Mount Milligan Mine; reliance on a few key customers for the gold-copper concentrate at the Mount Milligan Mine; use of commodity derivatives; the imprecision of the Company’s mineral reserves and resources estimates and the assumptions they rely on; the accuracy of the Company’s production and cost estimates; persistent inflationary pressures on key input prices; the impact of restrictive covenants in the Company’s credit facilities and in the Royal Gold Streaming Agreement which may, among other things, restrict the Company from pursuing certain business activities. including paying dividends or repurchasing shares under its NCIB, or making distributions from its subsidiaries; the Company’s ability to obtain future financing; sensitivity to fuel price volatility; the impact of global financial conditions; the impact of currency fluctuations; the effect of market conditions on the Company’s short-term investments; the Company’s ability to make payments, including any payments of principal and interest on the Company’s debt facilities, which depends on the cash flow of its subsidiaries; the ability to obtain adequate insurance
coverage; changes to taxation laws or royalty structures in the jurisdictions where the Company operates, and (C) risks related to operational matters and geotechnical issues and the Company’s continued ability to successfully manage such matters, including: unanticipated ground and water conditions; the stability of the pit walls at the Company’s operations leading to structural cave-ins, wall failures or rock-slides; the integrity of tailings storage facilities and the management thereof, including as to stability, compliance with laws, regulations, licenses and permits, controlling seepages and storage of water, where applicable; there being no significant disruptions affecting the activities of the Company whether due to extreme weather events or other related natural disasters, labour disruptions, supply disruptions, power disruptions, damage to equipment or other force majeure events; the risk of having sufficient water to continue operations at the Mount Milligan Mine and achieve expected mill throughput; changes to, or delays in the Company’s supply chain and transportation routes, including cessation or disruption in rail and shipping networks, whether caused by decisions of third-party providers or force majeure events (including, but not limited to: labour action, flooding, landslides, seismic activity, wildfires, earthquakes, pandemics, or other global events such as wars); lower than expected ore grades or recovery rates; the success of the Company’s future exploration and development activities, including the financial and political risks inherent in carrying out exploration activities; inherent risks associated with the use of sodium cyanide in the mining operations; the adequacy of the Company’s insurance to mitigate operational and corporate risks; mechanical breakdowns; the occurrence of any labour unrest or disturbance and the ability of the Company to successfully renegotiate collective agreements when required; the risk that Centerra’s workforce and operations may be exposed to widespread epidemic or pandemic; seismic activity, including earthquakes; wildfires; long lead-times required for equipment and supplies given the remote location of some of the Company’s operating properties and disruptions caused by global events; reliance on a limited number of suppliers for certain consumables, equipment and components; the ability of the Company to address physical and transition risks from climate change and sufficiently manage stakeholder expectations on climate-related issues; regulations regarding greenhouse gas emissions and climate change; significant volatility of molybdenum prices resulting in material working capital changes and unfavourable pressure on viability of the molybdenum business; the Company’s ability to accurately predict decommissioning and reclamation costs and the assumptions they rely upon; the Company’s ability to attract and retain qualified personnel; competition for mineral acquisition opportunities; risks associated with the conduct of joint ventures/partnerships; risk of cyber incidents such as cybercrime, malware or ransomware, data breaches, fines and penalties; and, the Company’s ability to manage its projects effectively and to mitigate the potential lack of availability of contractors, budget and timing overruns, and project resources.
There can be no assurance that forward-looking statements will prove to be accurate, as actual results and future events could differ materially from those anticipated in such statements. Forward-looking statements are provided for the purpose of providing information about management’s expectations and plans relating to the future. All of the forward-looking statements made in this document are qualified by these cautionary statements and those made in our other filings with the securities regulators of Canada and the United States including, but not limited to, those set out in the Company’s latest Annual Report on Form 40-F/Annual Information Form and Management’s Discussion and Analysis, each under the heading “Risk Factors”, which are available on SEDAR+ (www.sedarplus.ca) or on EDGAR (www.sec.gov/edgar). The foregoing should be reviewed in conjunction with the information, risk factors and assumptions found in this document.
The Company disclaims any intention or obligation to update or revise any forward-looking statements, whether written or oral, or whether as a result of new information, future events or otherwise, except as required by applicable law.
TABLE OF CONTENTS
| | | | | |
| |
| |
| |
| |
| |
| |
| |
| |
| |
| |
| |
| |
| |
| |
| |
| |
| |
| |
| |
| |
| |
| |
| |
Qualified Person & QA/QC | 47 |
| |
Overview
Centerra’s Business
Centerra is a Canada-based mining company focused on operating, developing, exploring and acquiring gold and copper properties in North America, Türkiye, and other markets worldwide. Centerra’s principal operations are the Mount Milligan gold-copper mine located in British Columbia, Canada (the “Mount Milligan Mine”), and the Öksüt gold mine located in Türkiye (the “Öksüt Mine”). The Company also owns the Kemess project (the “Kemess Project”) in British Columbia, Canada, the Goldfield Project in Nevada, United States, as well as exploration properties in Canada, the United States of America (“USA”) and Türkiye. The Company also owns and operates a Molybdenum Business Unit (“Molybdenum BU”), which includes the Langeloth metallurgical processing facility, operating in Pennsylvania, USA (the “Langeloth”), and two primary molybdenum properties: the Thompson Creek Mine in Idaho, USA, and the Endako Mine (75% ownership) in British Columbia, Canada.
As at June 30, 2025, Centerra’s significant subsidiaries were as follows:
| | | | | | | | | | | |
| Entity | Property - Location | Current Status | Ownership |
Thompson Creek Metals Company Inc. | Mount Milligan Mine - Canada | Operation | 100% |
| Endako Mine - Canada | Care and maintenance | 75% |
Öksüt Madencilik A.S. | Öksüt Mine - Türkiye | Operation | 100% |
Thompson Creek Mining Co. | Thompson Creek Mine - USA | Development | 100% |
Langeloth Metallurgical Company LLC | Langeloth Facility - USA | Operation | 100% |
| Gemfield Resources LLC | Goldfield Project - USA | Development (1) | 100% |
| AuRico Metals Inc. | Kemess Project - Canada | Exploration and evaluation | 100% |
(1)On August 6, 2025, the Board of Directors approved the construction of the Goldfield Project.
The Company’s common shares are listed on the Toronto Stock Exchange and the New York Stock Exchange and trade under the symbols “CG” and “CGAU”, respectively.
As at August 6, 2025, there are 203,306,950 common shares issued and outstanding, options to acquire 2,706,082 common shares outstanding under the Company’s stock option plan, and 1,117,536 restricted share units redeemable for common shares outstanding under the Company’s restricted share unit plan (redeemable on a 1:1 basis for common shares).
Overview of Consolidated Financial and Operating Highlights
| | | | | | | | | | | | | | | | | | | | |
| ($millions, except as noted) | Three months ended June 30, | Six months ended June 30, |
| 2025 | 2024 | % Change | 2025 | 2024 | % Change |
| Financial Highlights | | | | | |
| Revenue | 288.3 | | 282.3 | | 2 | % | 587.8 | | 588.2 | | — | % |
| Production costs | 174.9 | | 162.5 | | 8 | % | 373.7 | | 336.3 | | 11 | % |
| Depreciation, depletion, and amortization ("DDA") | 26.0 | | 27.5 | | (5) | % | 50.1 | | 60.8 | | (18) | % |
| Earnings from mine operations | 87.4 | | 92.3 | | (5) | % | 164.0 | | 191.0 | | (14) | % |
Net earnings | 68.6 | | 37.7 | | 82 | % | 99.0 | | 104.1 | | 5 | % |
Adjusted net earnings(1) | 52.7 | | 46.4 | 14 | % | 79.0 | | 77.7 | | 2 | % |
Adjusted EBITDA(1) | 86.8 | | 87.2 | | 0 | % | 162.5 | | 185.1 | | (12) | % |
| Cash provided by operating activities | 25.3 | | 2.6 | | 873 | % | 83.9 | | 102.0 | | (18) | % |
Free cash flow (deficit)(1) | (25.6) | | (27.0) | | 5 | % | (15.5) | | 54.1 | | (129) | % |
| | | | | | |
| Additions to property, plant and equipment (“PP&E”) | 55.6 | | 37.9 | | 47 | % | 123.7 | | 53.2 | | 133 | % |
Capital expenditures - total(1) | 53.9 | | 36.3 | | 48 | % | 100.8 | | 53.1 | | 90 | % |
Sustaining capital expenditures(1) | 25.8 | | 30.6 | | (16) | % | 43.8 | | 46.8 | | (6) | % |
Non-sustaining capital expenditures(1) | 28.1 | | 5.7 | | 393 | % | 57.0 | | 6.3 | | 805 | % |
| | | | | | |
Net earnings per common share - $/share basic(2) | 0.33 | | 0.18 | | 83 | % | 0.48 | | 0.49 | | 1 | % |
| | | | | | |
Adjusted net earnings per common share - $/share basic(1)(2) | 0.26 | | 0.23 | | 13 | % | 0.38 | | 0.36 | | 6 | % |
| Operating highlights | | | | | | |
| Gold produced (oz) | 63,311 | | 89,828 | | (30) | % | 122,690 | | 201,169 | | (39) | % |
| | | | | | |
| Gold sold (oz) | 61,335 | | 83,258 | | (26) | % | 122,466 | | 187,571 | | (35) | % |
| Average market gold price ($/oz) | 3,280 | | 2,238 | | 47 | % | 3,070 | | 2,203 | | 39 | % |
Average realized gold price ($/oz )(3) | 2,793 | | 2,097 | | 33 | % | 2,674 | | 1,955 | | 37 | % |
| Copper produced (000s lbs) | 12,437 | | 13,549 | | (8) | % | 24,084 | | 27,880 | | (14) | % |
| Copper sold (000s lbs) | 12,103 | | 11,705 | | 3 | % | 24,244 | | 27,327 | | (11) | % |
| Average market copper price ($/lb) | 4.32 | | 4.42 | | (2) | % | 4.28 | | 4.12 | | 4 | % |
Average realized copper price ($/lb)(3) | 3.62 | | 3.79 | | (4) | % | 3.71 | | 3.41 | | 9 | % |
Molybdenum roasted (000 lbs)(5) | 3,165 | | 1,948 | | 62 | % | 6,199 | | 4,839 | | 28 | % |
| Molybdenum sold (000s lbs) | 3,076 | | 2,675 | | 15 | % | 7,320 | | 5,623 | | 30 | % |
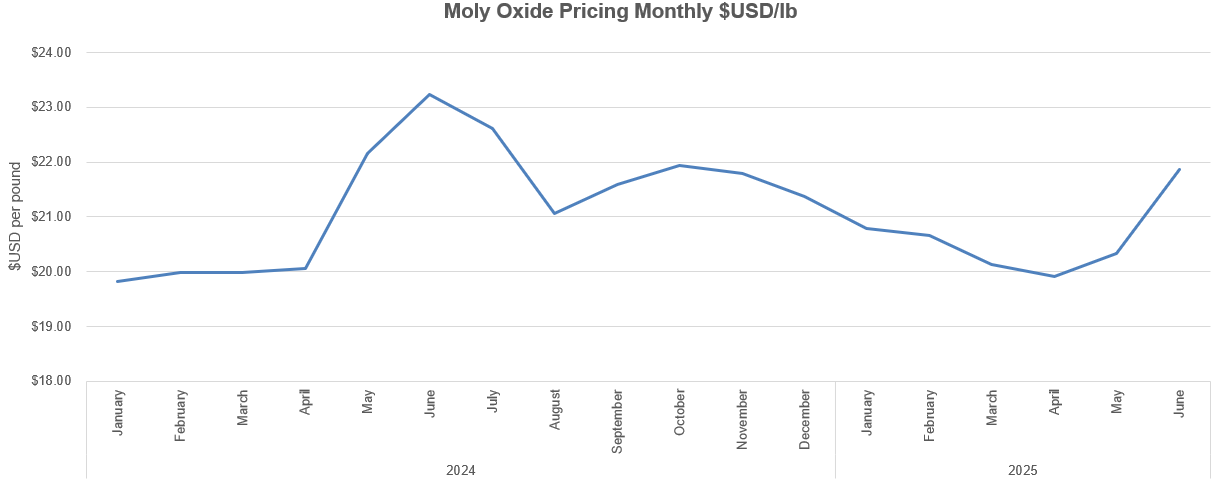
| Average market molybdenum price ($/lb) | 20.72 | 21.79 | | (5) | % | 20.62 | 19.93 | | 3 | % |
Average realized molybdenum price ($/lb)(3) | 21.43 | 22.10 | (3) | % | 21.52 | 21.25 | 1 | % |
| Unit costs | | | | | | |
Gold production costs ($/oz)(4) | 1,308 | | 870 | | 50 | % | 1,290 | | 802 | | 61 | % |
All-in sustaining costs on a by-product basis ($/oz)(1)(4) | 1,652 | | 1,179 | | 40 | % | 1,572 | | 1,001 | | 57 | % |
| | | | | | |
Gold - All-in sustaining costs on a co-product basis ($/oz)(1)(4) | 1,866 | | 1,260 | | 48 | % | 1,804 | | 1,125 | | 60 | % |
Copper production costs ($/lb)(4) | 2.06 | | 2.46 | | (16) | % | 2.15 | | 2.14 | | — | % |
Copper - All-in sustaining costs on a co-product basis ($/lb)(1)(4) | 2.53 | | 3.21 | | (21) | % | 2.54 | | 2.55 | | — | % |
(1)Non-GAAP financial measure. See discussion under “Non-GAAP and Other Financial Measures”.
(2)As at June 30, 2025, the Company had 204,325,992 common shares issued and outstanding.
(3)This supplementary financial measure within the meaning of National Instrument 52-112 - Non-GAAP and Other Financial Measures Disclosure (“NI 51-112”) is calculated as a ratio of revenue from the consolidated financial statements and units of metal sold and includes the impact from the Mount Milligan Streaming Agreement (defined below), copper hedges and mark-to-market adjustments on metal sold not yet finally settled.
(4)All per unit costs metrics are expressed on a metal sold basis.
(5)Amount does not include 0.2 million pounds of molybdenum roasted of toll material for the three and six months ended June 30, 2025 (nil in 2024).
Overview of Consolidated Results
Second Quarter 2025 compared to Second Quarter 2024
Net earnings of $68.6 million were recognized in the second quarter of 2025, compared to net earnings of $37.7 million in the second quarter of 2024. The increase in net earnings was primarily due to:
•an unrealized gain of $15.0 million that was recognized in the second quarter of 2025 on the re-measurement of the amount due from Equinox Gold Corp. (“Equinox Gold”) in relation to the sale of Centerra’s 50% interest in the Greenstone Partnership in 2021, reflecting updated gold price assumptions related to the final portion of contingent consideration owing to the Company from Equinox Gold;
•lower expensed exploration and evaluation expenditures of $9.7 million recognized in the second quarter of 2025 compared to $20.7 million in the second quarter of 2024. The decrease in expensed exploration and evaluation expenditures was primarily due to a $6.8 million decrease in project evaluation costs at the Thompson Creek Mine and a $4.3 million decrease in drilling and related costs at the Goldfield Project; and
•income tax recovery of $2.2 million recognized in the second quarter of 2025 compared to an income tax expense of $17.8 million in the second quarter of 2024. The decrease in income tax expense was primarily related to a $7.6 million lower income tax expense at the Öksüt Mine, resulting from lower income generated at the Öksüt Mine due to a decrease in gold ounces sold and the impact of foreign currency translation on deferred income taxes at the Mount Milligan Mine, amounting to $19.8 million, partially offset by a $10.7 million drawdown on the deferred tax asset related to the Mount Milligan Mine and withholding tax expense on the repatriation of Öksüt Mine’s earnings.
The increase in net earnings was partially offset by other non-operating expense of $1.0 million recognized in the second quarter of 2025 compared to other non-operating income of $11.6 million in the second quarter of 2024 primarily attributable to an $8.3 million higher foreign exchange loss due to movement in foreign currency exchange rates and lower interest income earned on the Company’s cash balance.
Adjusted net earningsNG of $52.7 million were recognized in the second quarter of 2025, compared to adjusted net earningsNG of $46.4 million in the second quarter of 2024. The increase in adjusted net earningsNG was primarily due to lower expensed exploration and evaluation expenditures and lower income tax expense partially offset by higher other non-operating expense as outlined above.
The main adjusting items to net earnings in the second quarter of 2025 were:
•$15.0 million of unrealized gain on the re-measurement of the amount due related to the sale of the Company’s interest in the Greenstone Partnership;
•$12.1 million of unrealized loss on the financial asset related to the additional agreement with Royal Gold dated February 13, 2024 to increase cash payments for the Mount Milligan Mine’s gold and copper delivered to Royal Gold based on the achievement of certain threshold amounts of gold and copper delivered to Royal Gold from shipments occurring after January 1, 2024 (“Additional Royal Gold Agreement”);
•$11.0 million of deferred income tax adjustments reflecting primarily the impact of foreign exchange rate movement on deferred income taxes at the Mount Milligan Mine;
•$7.7 million of reclamation provision revaluation recovery primarily attributable to changes in the risk-free interest rates applied to discount the estimated provision for future reclamation cash outflows at the Endako Mine and the Kemess Project; and
•$6.2 million of unrealized loss on foreign exchange mainly from the effect of movement in foreign currency exchange rates on the reclamation provision at the Endako Mine and Kemess Project.
The main adjusting items to net earnings in the second quarter of 2024 were:
•$7.4 million of unrealized loss on the financial asset related to the Additional Royal Gold Agreement;
•$5.5 million of unrealized gain on foreign exchange from the movement in foreign currency exchange rates on the reclamation provision at the Endako Mine and Kemess Project and on the income tax payable and royalty payable at the Öksüt Mine;
•$5.1 million of reclamation provision revaluation recovery resulting from the increase in the risk-free interest rates applied to discount the estimated provision for future reclamation cash outflows at the Thompson Creek Mine, Endako Mine and Kemess Project; and
•$1.9 million of deferred income tax adjustments mainly resulting from the foreign exchange rate movement on the deferred income tax expense at the Öksüt Mine and the Mount Milligan Mine.
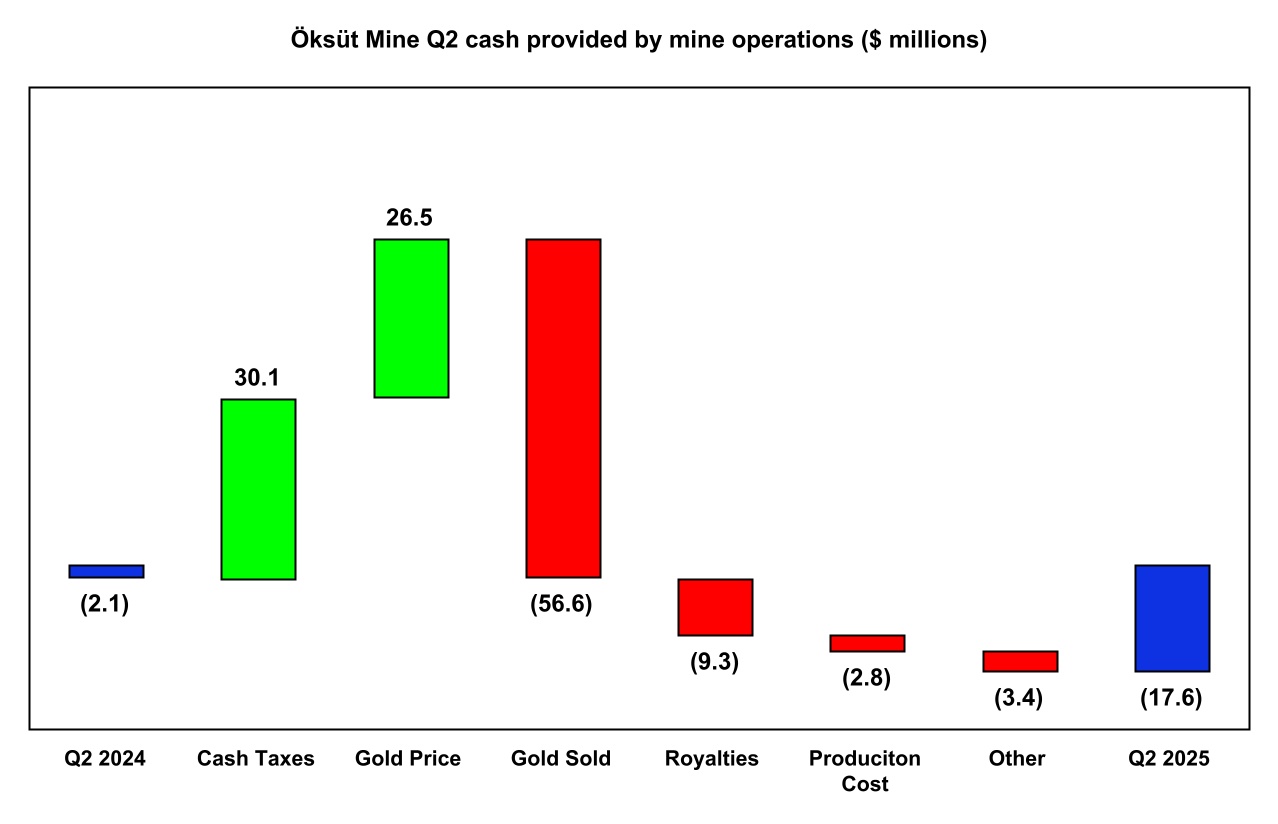
Cash provided by operating activities was $25.3 million in the second quarter of 2025, compared to $2.6 million in the second quarter of 2024. The increase was primarily attributable to $30.1 million lower tax payments at the Öksüt Mine and a $7.0 million decrease in cash used in operating activities at the Thompson Creek Mine due to the commencement of capitalization of certain costs after the restart decision, partially offset by $9.3 million higher royalty payments at the Öksüt Mine.
Free cash flow deficitNG of $25.6 million was recognized in the second quarter of 2025, compared to free cash flow deficitNG of $27.0 million in the second quarter of 2024. The slight decrease in free cash flow deficitNG was primarily due to higher cash provided by operating activities as outlined above partially offset by $23.7 million higher capital spending at the Thompson Creek Mine.
Six months ended June 30, 2025 compared to June 30, 2024
Net earnings of $99.0 million were recognized in 2025, compared to net earnings of $104.1 million in 2024. The slight decrease in net earnings was primarily due to:
•lower earnings from mine operations of $164.0 million in 2025 compared to $191.0 million in 2024. The decrease in earnings from mine operations was primarily due to lower ounces of gold produced and sold at the Öksüt Mine mainly attributable to higher production levels in 2024 from processing the built-up heap leach inventory following the resumption of operations in June 2023 and lower gold ounces and copper pounds sold at the Mount Milligan Mine. The decrease was partially offset by higher average realized gold and copper prices and lower production costs and DDA at the Öksüt Mine;
•a lower reclamation recovery of $2.8 million recognized in 2025 compared to a reclamation recovery of $30.1 million in 2024 primarily attributable to changes in the risk-free interest rates applied to discount the estimated provision for future reclamation cash outflows at the Endako Mine and Kemess Project and an increase in the estimate of future reclamation cash outflows at the Endako Mine in 2025. In addition, there was a reclamation recovery of $15.1 million recognized in 2024 at the Thompson Creek Mine from the increase in the risk-free interest rates applied to discount the estimated provision for future reclamation cash outflows. No reclamation expense or recovery was recognized at the Thompson Creek Mine in 2025 due to the commencement of development; and
•lower other non-operating income of $8.7 million recognized in 2025 compared to $27.6 million in 2024 primarily due to a $14.8 million higher unrealized foreign exchange loss attributable to a movement in foreign currency exchange rates and a $4.9 million decrease in interest income earned on the Company’s cash balance.
The decrease in net earnings was partially offset by:
•lower income tax expense of $22.7 million recognized in 2025 compared to income tax expense of $47.6 million in 2024. The decrease in income tax expense was mainly due to a $20.1 million lower income tax expense at the Öksüt Mine, resulting from lower income generated at the Öksüt Mine due to lower gold ounces sold;
•an unrealized gain of $21.6 million was recognized in 2025 on the re-measurement of the amount due from Equinox Gold in relation to the sale of Centerra’s 50% interest in the Greenstone Partnership in
2021, reflecting updated gold price assumptions related to the final portion of contingent consideration owing to the Company from Equinox Gold; and
•lower expensed exploration and evaluation costs of $16.8 million recognized in 2025, compared to $35.6 million in 2024. The decrease was primarily attributable to a $13.7 million decrease in project evaluation costs at the Thompson Creek Mine and a $5.3 million decrease in drilling and related costs at the Goldfield Project.
Adjusted net earningsNG of $79.0 million were recognized in 2025, compared to adjusted net earningsNG of $77.7 million in 2024. The increase in adjusted net earningsNG was due to lower tax expense and lower expensed exploration and evaluation costs as outlined above, partially offset by lower earnings from mine operations and lower non-operating income.
The main adjusting items to net earnings in 2025 were:
•$21.6 million of an unrealized gain on the re-measurement of the amount due related to the sale of the Company’s interest in the Greenstone Partnership;
•$13.5 million of unrealized loss on the financial asset related to the Additional Royal Gold Agreement;
•$12.2 million of deferred income tax adjustments mainly resulting from the foreign exchange rate movement on deferred income taxes at the Mount Milligan Mine;
•$2.9 million of unrealized loss on foreign exchange mainly from the effect of movement in foreign currency exchange rates on the reclamation provision at the Endako Mine and Kemess Project; and
•$2.9 million of reclamation provision revaluation recovery, as noted above.
The main adjusting items to net earnings in 2024 were:
•$30.1 million reclamation provision revaluation recovery, as noted above;
•$8.9 million of unrealized loss on the financial asset related to the Additional Royal Gold Agreement;
•$4.9 million of deferred income tax adjustments mainly resulting from the foreign exchange rate movement on the deferred income tax expense at the Öksüt Mine and the Mount Milligan Mine;
•$3.4 million of unrealized gain on foreign exchange from the effect of movement in foreign currency exchange rates on the reclamation provision at the Endako Mine and Kemess Project and on the income tax payable and royalty payable at the Öksüt Mine; and
•$2.5 million of transaction costs related to the Additional Royal Gold Agreement.
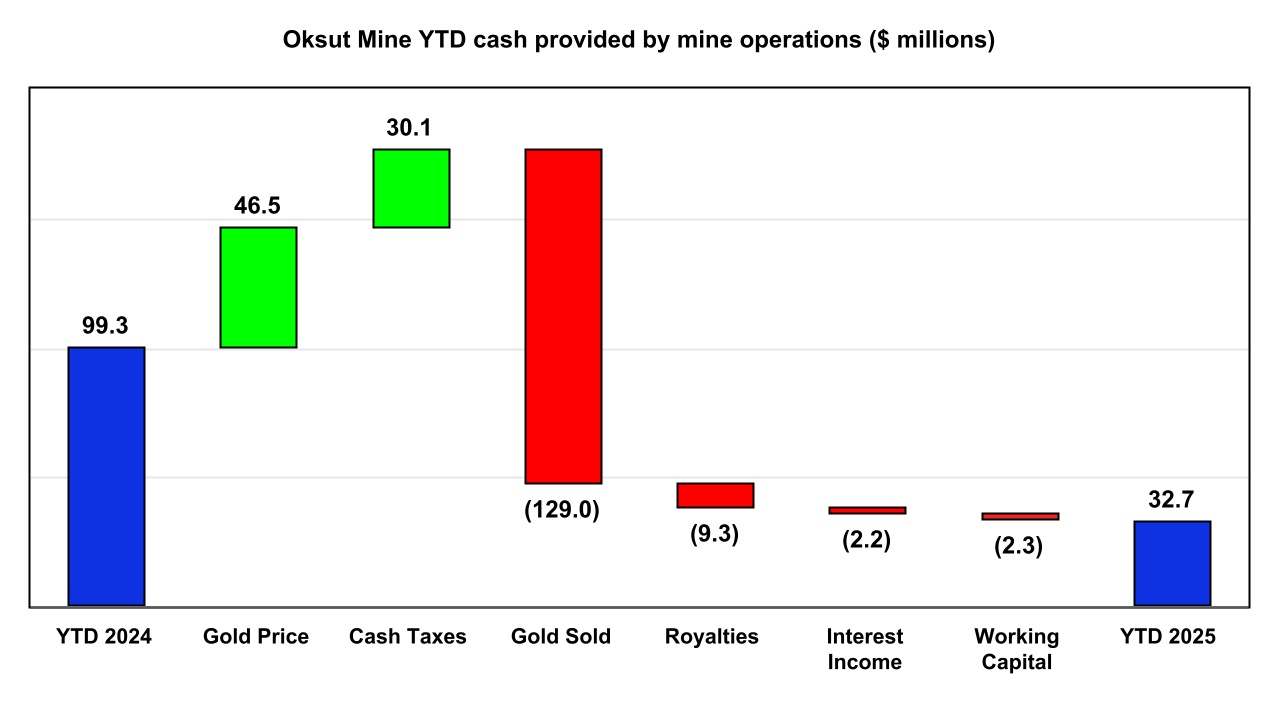
Cash provided by operating activities was $83.9 million in 2025 compared to $102.0 million in 2024. The decrease in cash provided by operating activities was primarily due to $27.0 million lower earnings from mine operations as discussed above, $9.3 million in higher royalty payments at the Öksüt Mine, a $31.9 million unfavourable change in working capital at the Langeloth Facility. The decrease was partially offset by $30.1 million in lower tax payments at the Öksüt Mine and a $14.2 million decrease in cash used in operating activities at the Thompson Creek Mine due to the commencement of capitalization of certain costs after the restart decision.
Free cash flow deficitNG of $15.5 million was recognized in 2025 compared to free cash flowNG of $54.1 million in 2024. The decrease in free cash flowNG was primarily due to lower cash provided by operating activities as outlined above and $51.2 million higher capital spending at the Thompson Creek Mine.
Recent Events and Developments
Goldfield Project’s Construction Decision
The Company has completed a technical study of the Goldfield Project, which outlined attractive economics of an after-tax net present value (5%) (“NPV5%”) of $245 million and an after-tax internal rate of return (“IRR”) of 30%, using a long-term gold price of $2,500 per ounce and includes the impact of gold hedges on a portion of production in 2029 and 2030. The technical study forecasts a mine life of approximately seven years, average annual gold production of 100,000 ounces between 2029 and 2032, and a life of mine AISC of $1,392 per ounce. First production is expected by the end of 2028 and the production profile indicates a total of 533,000
ounces of gold production at head grade of 0.66 g/t and production costs of $1,077 per ounce over the life of mine.
Since the initial resource estimate published for the Goldfield Project in February 2025, the gold price has significantly risen, supporting an updated long-term price assumption of $2,500 per ounce for the Goldfield Project’s economics. The Company has implemented a gold hedging strategy covering 50% of gold production in 2029 and 2030, with a gold price floor of $3,200 per ounce and an average gold price cap of $4,435 per ounce in 2029 and $4,705 per ounce in 2030 set to protect margins while preserving upside potential. This approach is designed to ensure predictable cash flow during the ramp-up phase, with almost 80% of life-of-mine production remaining unhedged and fully exposed to market prices.
Over the last several months, Centerra has undertaken additional technical work and project optimizations that have significantly enhanced Goldfield Project’s value proposition. Favorable gold prices combined with these recent developments have improved the Goldfield Project’s economics, enabling Centerra to move forward with the execution. The Goldfield Project is expected to enhance Centerra’s near-term gold production and play a strategic role in supporting the company’s optimization and growth of its longer-life gold-copper projects in British Columbia.
Following the completion of the technical study in July 2025, the Centerra’s board of directors (the “Board”) approved the construction of the Goldfield Project in August 2025. The initial capital investment is estimated to be $252 million, to be funded by the Company’s existing liquidity, and the project is expected to benefit from a short timeline to first production by the end of 2028 and low execution risk given its relatively simple process flow sheet. Nevada, as a historic mining district, offers a stable regulatory environment, skilled workforce, and strong support for resource development.
The Company will perform an impairment reversal test in the third quarter of 2025 as prescribed in the requirements of IFRS 6.
Change to the Turkish Government State Royalty
The Öksüt Mine is subject to the Turkish Government State Royalty (“Turkish royalty”) which is a sliding scale royalty, applicable to gold and other metals. The Turkish royalty rates for gold were last increased in 2020 and tend to be reviewed by the government of Türkiye every few years. On July 24, 2025, the Turkish parliament passed certain amendments to the mining law, which included an updated Turkish royalty table reflecting elevated gold price environment. Under this new amendment, the maximum gold price threshold which might apply to the Turkish royalty was updated from $2,100 per ounce to $5,100 per ounce, among other things. The Turkish Mining Law continues to provide a reduction of 40% of the royalty amount payable for gold processed at refining facilities within Türkiye, which is the case for the Öksüt Mine.
The Company’s updated guidance for the Öksüt Mine’s full-year costs per unit reflects the updated Turkish royalty rates. See Outlook section in this MD&A.
Mount Milligan Mine Pre-Feasibility Study
Early in 2024, the Company initiated a preliminary economic assessment (“PEA”) as part of a strategic process to evaluate the total potential of the Mount Milligan Mine with a goal to unlock additional value beyond its current stated mine life. As a result of significant technical study progress to date and positive drill results, the Company made the decision in late 2024 to advance directly to a Pre-feasibility Study Technical Report (“PFS”). The results of the PFS are expected to be announced in the third quarter of 2025.
Work on the PFS is ongoing with the goal that the mine life can be further extended beyond the current mine life of approximately 2036. Centerra is progressing with the engineering solution for additional tailings capacity. The PFS will seek to incorporate an increased annual mill throughput in the range of 10% through ball mill motor upgrades and additional downstream flowsheet improvements at a modest overall capital expenditure, which may also provide the benefit of improved overall metal recovery. During the first half of 2025, a majority of the in-fill drilling program to support the forthcoming PFS was completed and assay results were incorporated into the resource model as they were received and validated. In addition, the development of an updated resource model, pit design and optimized mine plan have been completed. The final tailings storage facility (“TSF”) design for the technical report, engineering and execution planning of ball mill motor upgrades and preparation of the technical report have been progressing as planned.
Kemess Project Resource Update and PEA
The Kemess property has substantial gold and copper resources in a highly prospective Toodoggone district with significant infrastructure already in place, including a 300 kilometer 230 kilovolt power line to site, a 50,000 tonnes per day nameplate processing plant in need of some refurbishment; site infrastructure including a camp, administration facilities, truck shop and warehouse which will require some refurbishment; and tailings storage using the previously mined pit as well as an existing facility which is capable of expansion. Complementing this existing infrastructure, it is anticipated that new crushing, conveying, and mine infrastructure will be required for the open pit and underground operations.
During 2024, Centerra commenced evaluation of technical concepts and engineering trade-off studies for potential restart options at the Kemess Project. In the first half of 2025, the Company published an updated resource estimate. Gold mineral resources at the Kemess Project are estimated to contain 2.7 million ounces of measured and indicated resources and 2.2 million ounces of inferred resources. Copper mineral resources are estimated to contain 971 million pounds of measured and indicated resources and 821 million pounds of inferred resources. The updated resource is generally consistent with the Company’s previous understanding of the resource estimate. The Company is currently advancing a PEA which is expected to be completed by the end of 2025. The current operating concept is a combined open pit which is expected to be a traditional truck and shovel operation and long-hole stoping underground mining operation, which is expected to utilize paste backfill of the stopes for stability and be less capital intensive and have a better cash flow profile than the previously permitted underground block cave concept. In addition, the Company is continuing to advance technical studies that include metallurgical testing for flowsheet optimization, mine plan optimization, materials handling infrastructure engineering, tailings design optimization, as well as initiation of environmental baseline studies. Early indications show potential for a long-life operation that takes advantage of the significant existing infrastructure and has lower execution risk compared with a typical greenfield project of this scale. Complementing this existing infrastructure, it is anticipated that new crushing, conveying, and mine infrastructure will be required for the operations. The PEA is targeting a future operation with a potential annual production of approximately 250,000 gold equivalent ounces which combined with the Mount Milligan Mine would provide the Company with two long life gold-copper assets in British Columbia.
Restart of the Thompson Creek Mine and Strategic Plan for the Molybdenum BU
On September 12, 2024, Centerra announced the results of the Thompson Creek Mine feasibility study, including a strategic, integrated business plan for its Molybdenum BU consisting of a restart of the Thompson Creek Mine and a commercially optimized plan for the Langeloth Facility.
At significantly increased production capacity, integrated with Thompson Creek Mine, the Langeloth Facility has the potential to generate higher returns and higher cash flows from operations. Following the completion of a feasibility study and commercial optimization plan, the Board approved the full restart of operations at the Thompson Creek Mine and a progressive ramp-up of production at the Langeloth Facility.
The initial capital investment to restart the Thompson Creek Mine is approximately $397 million. The capital required is significantly de-risked due to an existing pit, advanced equipment rebuilds and purchases, and an existing process plant that requires modest upgrades and refurbishments. A majority of the anticipated capital
expenditures is expected to be focused on capitalized stripping, plant refurbishments and mine mobile fleet upgrades. At current metal prices, the capital investment to restart the Thompson Creek Mine is expected to be internally funded largely from the cash flows provided by the Mount Milligan Mine and the Öksüt Mine.
Second Quarter 2025 Highlights of Restart Activities
Since the restart decision in September 2024, the site achieved approximately 20% cost completion status with advancements in pre-stripping activities and mine equipment refurbishments and purchases, engineering studies, early mill works and other site infrastructure. In the first half of 2025, the Thompson Creek Mine continued pre-stripping operations, detailed engineering work for the plant refurbishment with an engineering consulting firm, early mill refurbishment activities with the Thompson Creek Mine maintenance workforce and advanced basic engineering work for the TSF.
The key milestones completed in the second quarter of 2025 include:
•Pre-stripping operations continued with 6.8 million tons moved;
•Detailed engineering work for the plant refurbishment continued with an engineering consulting firm, with a focus on full hazard and operability analysis of the plant process, review of the engineering design for the tailing distribution system and the advancement of long lead procurement packages and contracts;
•Mill refurbishment activities continued, with demolition of the combined ball mill sump and copper cementation plant, the painting work at the thickener and flotation area completed and draw hole liners and apron feeders re-installed;
•Mobile fleet refurbishment and purchases are on track, with the majority of the work on trucks, shovels, dozers and road graders completed;
•Basic engineering work for the TSF has been completed and detailed engineering work for the TSF commenced and continued as planned, with work on the three-dimensional model and civil pipe take-off currently in progress;
•Advanced construction of housing units in the neighboring communities to increase housing capacity; and
•The project schedule continues to target first production in the second half of 2027, consistent with the feasibility study.
In the second quarter of 2025, the Company incurred non-sustaining capital expendituresNG of $26.5 million at the Thompson Creek Mine. Since the restart decision, non-sustaining capital expendituresNG incurred have totaled $81.9 million. The project remains in line with the total initial capital expendituresNG estimate of $397 million as outlined in the feasibility study.
| | | | | |
| ($millions, except as noted) | As of June 30, 2025 |
Initial capital expendituresNG estimate | $ | 397.0 | |
Non-sustaining capital expendituresNG since the restart decision | 81.9 |
Remaining spend | 315.1 |
Centerra maintains a strong cash position of $522.3 million, ensuring sufficient liquidity to finance ongoing project activities and internal growth projects. The Company continues to expect to finance the majority of 2025 expenditures from the cash flows generated by the Mount Milligan Mine and the Öksüt Mine.
Normal Course Issuer Bid
On November 5, 2024, Centerra announced that the Toronto Stock Exchange had accepted the renewal of a NCIB to purchase for cancellation up to an aggregate of 18,800,929 common shares in the capital of the Company during the twelve-month period commencing on November 7, 2024 and ending on November 6, 2025. Any tendered common shares taken up and paid for by Centerra under the NCIB will be cancelled.
During the first half of 2025, the Company repurchased 6,355,433 common shares for total consideration of $42.0 million (C$58.7 million) under its NCIB program, which included $27.0 million (C$37.2 million) during the second quarter of 2025. The Board has authorized the Company to repurchase up to $75 million of Centerra’s common shares in 2025.
Exploration and Project Evaluation Update
Exploration activities during the quarter included drilling, surface rock and soil sampling, geological mapping and geophysical surveying at the Company’s various projects and earn-in properties, targeting gold and copper mineralization in Canada, Türkiye, and the USA. The activities were primarily focused on drilling programs at the Mount Milligan Mine and the Kemess Project in British Columbia, and greenfield projects in Canada, USA and Türkiye. Project evaluation expenditures were primarily focused on the Goldfield Project in Nevada and the Kemess Project in British Columbia.
Mount Milligan Mine
For the six months ended June 30, 2025, 166 drill holes with a total of 46,664 metres of diamond drilling were completed at the Mount Milligan Mine, representing approximately 87% of the 2025 planned program. The drilling campaign is part of an in-fill drilling program to upgrade resource classification to support the forthcoming PFS at the Mount Milligan Mine. In-fill drilling occurred within the current open pit including the MBX and Great Eastern zones, as well as to the west of the ultimate pit boundary in the South Boundary and Southern Star West zones. In-fill drilling also occurred to test the western extension of the current resource pit including Saddle, Goldmark and North Slope. Assay results from the in-fill drilling program were incorporated into the resource model as they were received and validated to support and update resource model as part of the PFS.
2025 Outlook
The Company’s initial 2025 outlook was disclosed in the MD&A for the year ended December 31, 2024 filed on SEDAR+ at www.sedarplus.ca and EDGAR at www.sec.gov/edgar followed by a revised outlook disclosed in the MD&A for the three months ended March 31, 2025 as a result of additional planned drilling at the Kemess Project and increased cash tax payments for the Öksüt Mine due to higher gold prices resulting in higher income tax payments.
The Company has updated its 2025 outlook for the Mount Milligan Mine based on lower estimate for metal production which had a corresponding increase in unit costs. Estimates for the sustaining capital expendituresNG and non-Sustaining capital expendituresNG have also been updated at the Mount Milligan Mine as spending has been reallocated between categories, with no change in total capital expendituresNG..
The Company has also updated its 2025 outlook for the Öksüt Mine based on updated estimates upwards for the unit costs and cash taxes due to the impact of higher gold prices and royalties.
Except for the changes highlighted above, the rest of the Company’s outlook remains unchanged. The Company notes that the ongoing shifts and uncertainty around tariff policies may have an impact on the results of the Company’s operations in 2025, but at present the impact from the current tariffs are not expected to be material at the consolidated level.
The Company’s updated full year 2025 outlook and comparative actual results for the six months ended June 30, 2025 are set out in the following table:
Gold and copper producing assets
| | | | | | | | | | | | | | | |
| Units | 2025
Guidance -
updated | Six Months Ended June 30, 2025 | 2025
Guidance -
previous | |
| Production | | | | | |
Total gold production(1) | (koz) | 250 - 290 | 123 | 270 - 310 | |
Mount Milligan Mine(2)(3)(4) | (koz) | 145 - 165 | 71 | 165 - 185 | |
| Öksüt Mine | (koz) | 105 - 125 | 52 | 105 - 125 | |
Total copper production(2)(3)(4) | (Mlb) | 50 - 60 | 24 | 50 - 60 | |
Unit Costs(5) | | | | | |
Gold production costs(1) | ($/oz) | 1,300 - 1,400 | 1,290 | 1,100 - 1,200 | |
Mount Milligan Mine(2) | ($/oz) | 1,350 - 1,450 | 1,371 | 1,075 - 1,175 | |
| Öksüt Mine | ($/oz) | 1,200 - 1,300 | 1,181 | 1,100 - 1,200 | |
All-in sustaining costs on a by-product basisNG(1)(4) | ($/oz) | 1,650 - 1,750 | 1,572 | 1,400 - 1,500 | |
Mount Milligan Mine(4) | ($/oz) | 1,350 - 1,450 | 1,224 | 1,100 - 1,200 | |
| Öksüt Mine | ($/oz) | 1,675 - 1,775 | 1,665 | 1,475 - 1,575 | |
| | | | | |
| | | | | |
| | | | | |
| | | | | |
| | | | | |
| | | | | |
| | | | | |
| | | | | |
| | | | | |
| Capital Expenditures | | | | | |
Additions to PP&E(1) | ($M) | 105 - 130 | 64.2 | 105 - 130 | |
| Mount Milligan Mine | ($M) | 75 - 90 | 40.3 | 75 - 90 | |
| Öksüt Mine | ($M) | 30 - 40 | 23.9 | 30 - 40 | |
Total Capital ExpendituresNG(1) | ($M) | 105 - 130 | 47.9 | 105 - 130 | |
Sustaining Capital ExpendituresNG(1) | ($M) | 90 - 110 | 43.2 | 95 - 115 | |
| Mount Milligan Mine | ($M) | 60 - 70 | 23.9 | 65 - 75 | |
| Öksüt Mine | ($M) | 30 - 40 | 19.3 | 30 - 40 | |
Non-sustaining Capital ExpendituresNG(1) | ($M) | 15 - 20 | 4.7 | 10 - 15 | |
| Mount Milligan Mine | ($M) | 15 - 20 | 4.7 | 10 - 15 | |
Other Items | | | | | |
Depreciation, depletion and amortization(1) | ($M) | 95 - 115 | 47.8 | 95 - 115 | |
| Mount Milligan Mine | ($M) | 60 - 70 | 30.8 | 60 - 70 | |
| Öksüt Mine | ($M) | 35 - 45 | 17.0 | 35 - 45 | |
Current income tax and BC mineral tax expense(1) | ($M) | 48 - 55 | 34.4 | 35 - 42 | |
| Mount Milligan Mine | ($M) | 3 - 5 | 2.2 | 3 - 5 | |
| Öksüt Mine | ($M) | 40 - 50 | 32.2 | 32 - 37 | |
1.Consolidated Centerra figures.
2.The Mount Milligan Mine is subject to an arrangement with RGLD Gold AG and Royal Gold Inc. (together, “Royal Gold”) which entitles Royal Gold to purchase 35% and 18.75% of gold and copper produced, respectively, and requires Royal Gold to pay $435 per ounce of gold and 15% of the spot price per metric tonne of copper delivered (“Mount Milligan Mine Streaming Agreement”). Using assumed market prices of $3,300 per ounce of gold and $4.00 per pound of copper for the remaining two quarters of 2025, the Mount Milligan Mine’s average realized gold and copper price for that period would be $2,297 per ounce and $3.36 per pound, respectively, compared to average realized prices of $2,371 per ounce and $3.71 per pound in the six months ended June 30, 2025, when factoring in the Mount Milligan Streaming Agreement and concentrate refining and treatment costs.
3.Gold and copper production for 2025 at the Mount Milligan Mine assumes estimated recoveries of 63% to 65% for gold and 77% to 79% for copper, consistent with the previous guidance, and compared to the actual recoveries for gold of 62.0% and for copper of 77.3% achieved in the six months ended June 30, 2025.
4.Unit costs include a credit for forecasted copper sales treated as by-product for all-in sustaining costsNG. Production for copper and gold reflects estimated metallurgical losses resulting from handling of the concentrate and metal deductions levied by smelters.
5.Units noted as ($/oz) relate to gold ounces.
Production Profile
In the six months ended June 30, 2025, the Company reported consolidated gold and copper production of 122,690 ounces of gold and 24.1 million pounds of copper, respectively. Centerra’s estimate for the full year 2025 consolidated gold production has been updated and is now projected to be between 250,000 and 290,000 ounces including an updated estimate of 145,000 to 165,000 ounces from the Mount Milligan Mine and 105,000 to 125,000 ounces from the Öksüt Mine, which is unchanged from the previous guidance. Copper production is expected to be 50 to 60 million pounds for the full year of 2025 and is unchanged from the previous guidance.
Mount Milligan Mine
In the six months ended June 30, 2025, the Mount Milligan Mine produced 70,938 ounces of gold and 24.1 million pounds of copper. Gold and copper production in the six months ended June 30, 2025, was lower than expected due to lower mill throughput and lower than anticipated gold grades. The mill throughput was lower due to processing harder than expected ore and unscheduled mill downtime due to operational issues experienced in the six months ended June 30, 2025. The plant completed a major scheduled shutdown in the first quarter of 2025, which included shell relining for both ball mills and the SAG mill. The plant is scheduled for another shutdown in the third quarter of 2025. In the first half of 2025, mining operations have encountered zones with more challenging mineralization, resulting in lower than anticipated gold grades from these areas of the pit. While gold grades remain above the average grade of the reserve, the Company believes that the variability is primarily attributed to certain zones being drilled with wider spacing, which has impacted the reconciliation. Centerra has commenced an infill and grade control drilling program in the second quarter of 2025. This initiative is expected to improve geological and mine plan confidence and will be integrated into the upcoming Mount Milligan PFS, contributing to a mine plan with greater visibility on grades moving forward. The Company expects gold and copper production for the Mount Milligan Mine to be weighted to the second half of the year. As a result of items noted above, the Company is revising downwards its 2025 gold production guidance to the range of 145,000 to 165,000 ounces, from the previous range of 165,000 to 185,000 ounces. Sales and monetization of gold ounces and copper pounds are dependent on the timing of ocean vessels and may result in timing differences between produced and sold ounces.
Öksüt Mine
In the six months ended June 30, 2025, the Öksüt Mine produced 51,752 ounces of gold. For the full year of 2025, the Öksüt Mine is expected to produce between 105,000 and 125,000 ounces of gold, which is unchanged from the previous guidance. In the six months ended June 30, 2025, gold production was in line with expectations due to a higher than expected gold grade that was slightly offset by lower recoveries in the period. In the second half of the year, gold production is expected to increase as the mine plan anticipates a transition to a higher-grade phase of the Keltepe pit. Gold sales are expected to closely follow the gold production and are expected to be weighted towards the second half of 2025.
Cost Profile
In the six months ended June 30, 2025, the Company’s consolidated gold production costs amounted to $1,290 per ounce. For the full year of 2025, the Company has updated its consolidated gold production costs guidance to the range of $1,300 to $1,400 per ounce, up from the previous guidance range of $1,100 to $1,200 per ounce. The increase in the guidance range for gold production costs per ounce is due to lower gold production at the Mount Milligan Mine, increased royalty costs at the Öksüt Mine, and relative changes in metal prices for gold and copper.
Consolidated all-in sustaining costs on a by-product basisNG were $1,572 per ounce in the six months ended June 30, 2025. In 2025, the Company expects its consolidated all-in sustaining costs on a by-product basisNG to be in the range of $1,650 to $1,750 per ounce, which is increased from the previous guidance range of $1,400 to $1,500 per ounce due to increased production costs per ounce.
Mount Milligan Mine
In the six months ended June 30, 2025, the Mount Milligan Mine reported gold production costs of $1,371 per ounce, driven by lower gold production and a higher allocation of production costs to gold due to changes in the relative market prices of gold and copper. For the full year 2025, the Company anticipates the Mount Milligan Mine’s gold production costs to be in the range of $1,350 to $1,450 per ounce, which is higher from the previous guidance range of $1,075 to $1,175 per ounce mainly due to lower than expected 2025 gold production. Production costs per ounce for the remainder of the year are expected to be similar to the six months ended June 30, 2025. As part of the ongoing full asset optimization program, the Mount Milligan Mine has reduced operational costs and is actively pursuing opportunities to further reduce costs. These efforts are focused on several key areas including downtime minimization through equipment availability improvements, optimizing costs relating to grinding media, tires, major consumables, and spare parts through improvement of procurement strategies and consumption optimization. Approximately 90% of the Mount Milligan Mine’s costs are sourced from Canadian vendors and the Company is continuously evaluating implications from the current tariff environment but does not expect significant impact from tariffs levied on imported goods.
Copper production costs at the Mount Milligan Mine were $2.15 per pound in the six months ended June 30, 2025. For the full year of 2025, copper production costs are projected to be in the range of $2.00 to $2.50 per pound, which is unchanged from the previous guidance. Copper production costs in 2025 are expected to reflect a lower allocation of costs to copper production due to relative changes in the market price of gold and copper as noted above.
At the Mount Milligan Mine, all-in sustaining costs on a by-product basisNG were $1,224 per ounce in the six months ended June 30, 2025. For the full year of 2025, all-in sustaining costs on a by-product basisNG are expected to range from $1,350 to $1,450 per ounce, which increased from the previous guidance range of $1,100 to $1,200 per ounce due to anticipated increase in gold production costs per ounce for the full year as outlined above. The Company expects all-in sustaining costs on a by-product basisNG to be highest in the third quarter of 2025, primarily due to planned capital expendituresNG targeting further optimizations including a purchase of larger truck boxes to optimize payload and reduce future truck purchases. All-in sustaining costs on a by-product basisNG per ounce are expected to decline in the fourth quarter driven by higher gold and copper production and lower capital expendituresNG.
Öksüt Mine
In the six months ended June 30, 2025, the Öksüt Mine reported gold production costs of $1,181 per ounce due to higher royalty costs driven by elevated gold prices. Considering the impact of the increasing gold prices and the recent changes to the royalty rates as outlined in the Recent Events section in this MD&A, the Company has increased the Öksüt Mine’s full year 2025 gold production costs guidance to the range of $1,200 to $1,300 per ounce from the previous guidance range of $1,100 to $1,200 per ounce. Gold production costs per ounce are expected to trend higher in the second half of the year driven by higher royalty costs but are expected to be partially offset by higher production.
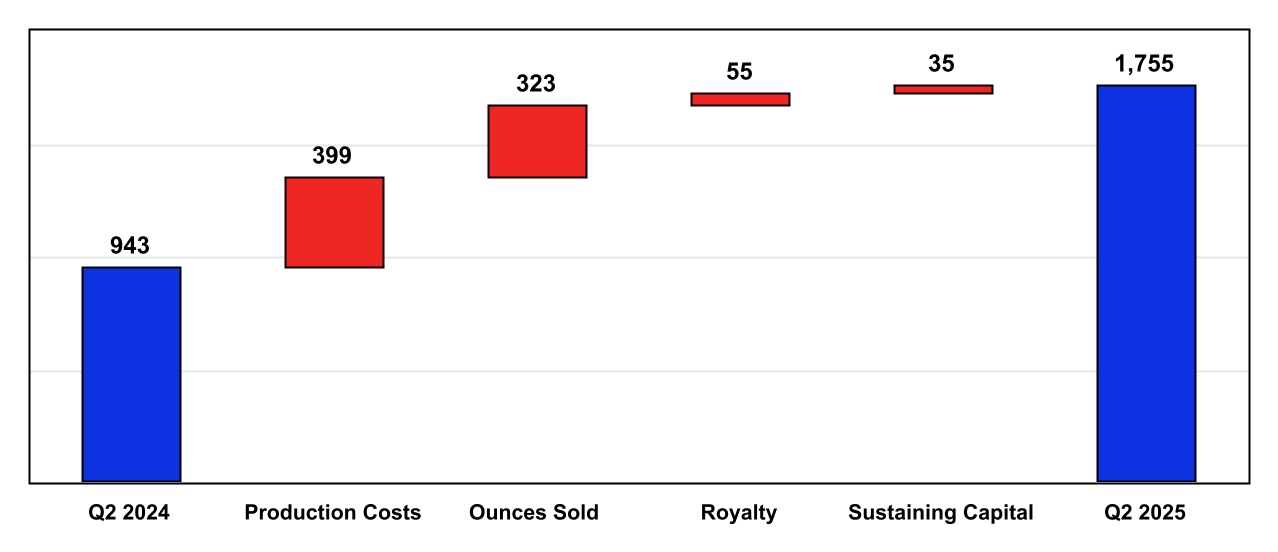
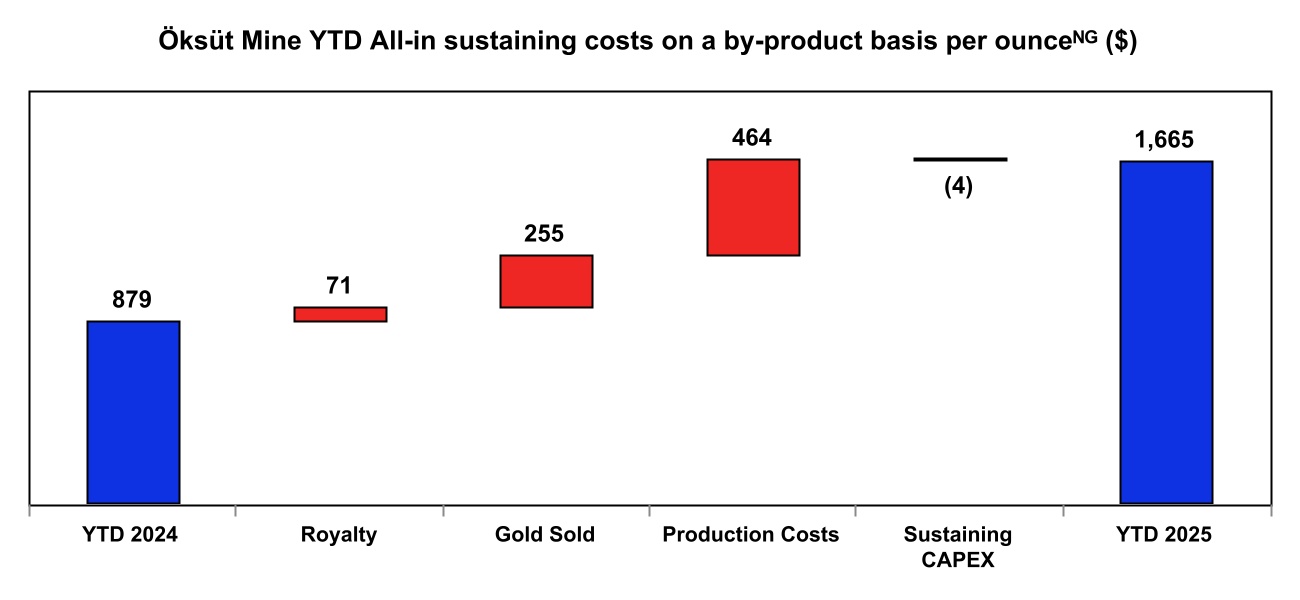
The Öksüt Mine’s all-in sustaining costs on a by-product basisNG were $1,665 per ounce in the six months ended June 30, 2025. The Company expects the Öksüt Mine’s full year all-in sustaining costs on a by-product basisNG to be in the range of $1,675 to $1,775 per ounce, which is increased from the previous guidance range of $1,475 to $1,575 due to anticipated increase in gold production costs per ounce for the full year as outlined above. The Company expects all-in sustaining costs on a by product basisNG per ounce to be highest in the third quarter of 2025, primarily due to planned capital expendituresNG associated with the expansion of the heap leach facility and capitalized stripping. All-in sustaining costs on a by-product basisNG per ounce are expected to decline in the fourth quarter helped by higher gold production and lower capital expendituresNG.
Capital Expenditures
Additions to Property, Plant and Equipment (“PP&E”) for IFRS accounting purposes include certain non-cash additions to PP&E such as changes in future reclamation costs and capitalization of leases. Capital expendituresNG, which comprise of sustaining capital expendituresNG and non-sustaining capital
expendituresNG, exclude such non-cash additions to PP&E. The reconciliation of additions to PP&E and capital expendituresNG is included in the Non-GAAP and Other Financial Measures section of this MD&A.
In the six months ended June 30, 2025, consolidated additions to PP&E for gold and copper producing assets were $64.2 million and total capital expendituresNG for these assets were $47.9 million. For the full year of 2025, both consolidated additions to PP&E and total capital expendituresNG are planned to be in the range of $105 to $130 million, which is unchanged from previous guidance. Total capital expendituresNG are expected to be elevated in the third quarter of 2025, primarily due to the timing of planned capital expendituresNG at both the Mount Milligan Mine and the Öksüt Mine.
The Mount Milligan Mine’s additions to PP&E in the six months ended June 30, 2025 were $40.3 million and total capital expendituresNG were $28.6 million. The difference between additions to PP&E and capital expendituresNG was mainly due to a change to future reclamation costs of $10.3 million. For the full year of 2025, the Mount Milligan Mine is expecting additions to PP&E and total capital expendituresNG to be in the range from $75 to $90 million, which is unchanged from the previous guidance. Total capital expendituresNG include sustaining capital expendituresNG in the range from $60 to $ 70 million, which is down from the range of $65 to $75 million in the previous guidance and non-sustaining capital expendituresNG in the range from $15 to $ 20 million, which is up from the range of $10 to $15 million in the previous guidance. The changes in the guidance ranges for sustaining capital expendituresNG and non-sustaining capital expendituresNG reflect revised capital allocations between these two categories of total capital expendituresNG. A significant portion of the sustaining capital expendituresNG for the full year of 2025 relates to capitalized TSF construction costs amounting to the range of $25 to $30 million with the remaining sustaining capital expendituresNG largely related to equipment rebuilds and a purchase of large truck boxes to optimize payload and reduce future truck purchases. Non-sustaining capital expendituresNG planned for the full year of 2025 include purchases of additional mining equipment to meet the increased tonnage movement requirements in the future years of the Mount Milligan Mine’s life of mine, and additional exploration costs for in-fill drilling in areas outside of the existing reserves that underpin the planned PFS and could form the basis of the extension to the current life of mine plan.
The Öksüt Mine’s additions to PP&E in the six months ended June 30, 2025 were $23.9 million and total capital expendituresNG were $19.3 million. The difference between additions to PP&E and capital expendituresNG was mainly due to a change to future reclamation costs of $3.3 million and the costs capitalized into right of use assets of $1.2 million. For the full year of 2025, the Öksüt Mine is expecting sustaining capital expendituresNG in the range of $30 to $ 40 million, which is unchanged from previous guidance. Most of 2025 sustaining capital expendituresNG relate to capitalized stripping costs amounting to $20 to $25 million, phase 3 of the heap leach pad expansion, and a barren solution distribution system to improve the heap leach irrigation system.
Depreciation, Depletion and Amortization
In the six months ended June 30, 2025, the Company’s DDA expense included in the cost of sales for gold and copper producing assets was $47.8 million. The Mount Milligan Mine’s DDA expense in the six months ended June 30, 2025 was $30.8 million and the Öksüt Mine’s DDA expense was $17.0 million. For the full year of 2025, the Company estimates DDA expense to be in the range of $95 to $115 million, including $60 to $70 million at the Mount Milligan Mine and $35 to $45 million at the Öksüt Mine, which are all unchanged from the previous guidance.
Current Taxes and Tax Payments
The Mount Milligan Mine’s current British Columbia mineral tax expense in the six months ended June 30, 2025 was $2.2 million and the cash taxes paid were $2.7 million. The difference between current tax expense and cash taxes paid is due to timing of tax payments. For the full year of 2025, Mount Milligan Mine’s current British Columbia mineral tax expense and tax payments are each expected to be in the range of $3 to $5 million, which is unchanged from the prior guidance.
The Öksüt Mine’s current income tax expense in the six months ended June 30, 2025 was $32.2 million, including a withholding tax of $19.0 million on the repatriation of Öksüt Mine’s earnings. Total cash taxes paid by the Öksüt Mine in the six months ended June 30, 2025 were $46.2 million, including a withholding tax of $15.8 million on the repatriation of Öksüt Mine’s earnings. The difference between current tax expense and cash taxes paid is due to timing of tax payments. For the full year of 2025, the Öksüt Mine income tax expense is expected to be in the range of $40 to $50 million, which is an increase from the previous guidance of $32 to $37 million, and is primarily driven by elevated gold prices. The income tax reflects a 25% income tax rate on taxable income. The Öksüt Mine is expected to pay approximately $60 to $70 million in cash taxes in 2025. This is an increase from the previous guidance of $45 to $50 million, reflecting a higher income tax expense for the fourth quarter of 2024, based on finalized 2024 tax filings and higher income tax expense in 2025, primarily driven by elevated gold prices. A large portion of the 2025 cash taxes were paid during the second quarter of 2025 as the second quarter payments included income tax for the fourth quarter of 2024, income tax for the first quarter of 2025, and a withholding tax of $15.8 million related to the repatriation of the Öksüt Mine’s earnings.
Molybdenum Business Unit
| | | | | | | | | | | |
| Units | 2025 Guidance | Six Months Ended June 30, 2025 |
Production - Langeloth Facility | | | |
Total molybdenum roasted(1) | Mlbs | 13 - 15 | 6.2 |
Total molybdenum sold | Mlbs | 13 - 15 | 7.3 |
Costs and Profitability - Langeloth Facility | | | |
Earnings (loss) from operations | ($M) | (3) - 5 | (2.0) |
Adjusted Earnings before Interest, Taxes, Depreciation and Amortization (“Adjusted EBITDA”)NG | ($M) | 2 - 8 | 0.3 |
| | | |
| | | |
| | | |
| | | |
| | | |
| | | |
| | | |
| | | |
| | | |
| | | |
| | | |
| | | |
| | | |
| | | |
| | | |
| | | |
| | | |
Capital Expenditures | ($M) | | |
| Additions to PP&E | ($M) | 132 - 150 | 59.2 |
| Thompson Creek Mine | ($M) | 130 - 145 | 58.6 |
Langeloth Facility | ($M) | 2 - 4 | 0.6 |
Total capital expendituresNG | ($M) | 132 - 150 | 52.9 |
| | | |
Sustaining capital expendituresNG - Langeloth Facility | ($M) | 2 - 4 | 0.6 |
| | | |
Non-sustaining capital expendituresNG - Thompson Creek Mine | ($M) | 130 - 145 | 52.3 |
Other Items | ($M) | | |
Depreciation, depletion and amortization | ($M) | 3 - 5 | 2.2 |
Langeloth Facility | ($M) | 3 - 5 | 2.2 |
| | | |
Care and Maintenance Cash Expenditures - Endako Mine | ($M) | 6 - 8 | 2.9 |
Reclamation Costs - Endako Mine | ($M) | 4 - 7 | 3.8 |
| | | |
| | | |
| | | |
| | | |
1.2025 guidance and actual figures do not include any toll material roasted.
Thompson Creek Mine
Since the restart decision in September 2024, significant progress has been made in advancing the project. The Thompson Creek Mine’s additions to PP&E and total capital expendituresNG in the six months ended June 30, 2025 were $58.6 million and $52.3 million, respectively. The difference between additions to PP&E and capital expendituresNG was mainly due to a change to future reclamation costs of $0.4 million and capitalized portion of DDA of $4.5 million. Since the restart decision in September 2024, non-sustaining capital expendituresNG have been $81.9 million including capitalized stripping costs of $40.8 million, equipment refurbishments and capital equipment purchases of $23.9 million, engineering studies of $5.4 million and other capitalized costs of $17.2 million. For the full year of 2025, the Thompson Creek Mine’s
additions to PP&E and total capital expendituresNG are expected to be in the range of $130 to $145 million, which is unchanged from the previous guidance. Major activities contributing to the planned total capital expendituresNG for 2025 include:
•Progressive ramp-up of tons moved per month through the balance of 2025;
•Completion of remaining mine fleet refurbishments by the end of 2025;
•Completion of detailed engineering and procurement of long-lead mill equipment by the end of the third quarter of 2025;
•Procurement and construction of housing units in the neighboring communities to facilitate increased mining workforce levels;
•Site infrastructure development and other costs; and
•Completion of basic engineering and detailed engineering for the TSF by the end of the year.
The Company expects the total project spending to be within the total initial capital expenditure estimate of $397 million as outlined in the feasibility study. The Company estimates that the majority of costs at the Thompson Creek Mine will relate to goods and services sourced domestically within the United States and, as such, does not anticipate a material impact from U.S. import tariffs.
Langeloth Facility
In the six months ended June 30, 2025, the Langeloth Facility roasted and sold 6.2 and 7.3 million pounds of molybdenum, respectively. The Langeloth Facility has continued the previously disclosed ramp-up of operations and is planning to increase roasting volumes to the range of 13 to 15 million pounds for the full year of 2025. A significant portion of the concentrate processed at the Langeloth Facility is sourced from countries other than the United States, which may be subject to U.S. import tariffs. The majority of the molybdenum products made at the Langeloth Facility are sold to large steel mills within the United States. The Company is continuing to assess the impact of incremental tariff policies on the Langeloth Facility and has put plans in place to address adverse impacts from the currently implemented tariffs. Based on the existing state of U.S. tariffs, the Company does not anticipate any material impact on current year financial results.
In the six months ended June 30, 2025, Langeloth Facility’s loss from operations was $2.0 million, including DDA of $2.2 million, and adjusted EBITDANG was $0.3 million. For the full year of 2025, the Company expects the Langeloth Facility’s results to range from $3 million loss from operations to $5 million earnings from operations, which is unchanged from previous guidance. The Company expects the current production cost structure to remain relatively stable for the full year of 2025, allowing for further improvements in profitability as operations ramp up. Based on these estimates, the Company targets to achieve a positive adjusted EBITDANG in the range of $2 to $8 million for the full year of 2025, which is unchanged from the previous guidance. The Company is continuing to assess the impact of evolving U.S. import tariffs, which may adversely affect the Langeloth Facility’s profitability.
The Company expects that the cash provided by operations at the Langeloth Facility for the full year of 2025 will primarily be driven by adjusted EBITDANG and changes in working capital. The working capital requirements at the Langeloth Facility are highly dependent on market molybdenum prices. In the six months ended June 30, 2025, average molybdenum market price was $20.62 per pound and the Langeloth Facility reported $2.1 million in incremental working capital investment. A $5 per pound increase in molybdenum price has an approximate $20 million impact on working capital invested.
In the six months ended June 30, 2025, the Langeloth Facility’s additions to PP&E and total capital expendituresNG were $0.6 million. For the full year of 2025, the Langeloth Facility is projecting sustaining capital expendituresNG to be in the range of $2 to $4 million, which is unchanged from the previous guidance.
Endako Mine
In the six months ended June 30, 2025, the Company's share of cash expenditures at the Endako Mine totaled $5.4 million, including $2.9 million for care and maintenance. $3.8 million for reclamation, partially offset by cash inflow released from working capital movement of $1.3 million. For the full year of 2025, the
Company’s share of care and maintenance expenditures at the Endako Mine are expected to be between $6 and $8 million and reclamation expenditures are expected to be $4 to $7 million, which is unchanged from the previous guidance. Reclamation costs planned for the full year of 2025 have been included in the reclamation provision as at June 30, 2025 and relate primarily to the closure works on the spillway for the Tailings Pond 2 that started in 2024.
Global Exploration and Evaluation Projects
| | | | | | | | | | | |
| (Expressed in millions of United States dollars) | | 2025 Guidance | Six months ended June 30, 2025 | | |
Project Exploration and Evaluation Costs | | | | | |
Exploration Costs(1) | | 40 - 50 | 19.9 | | |
Brownfield Exploration(1) | | 25 - 30 | 12.7 | | |
| Greenfield and Generative Exploration | | 15 - 20 | 7.2 | | |
Evaluation Costs | | 8 - 12 | 2.9 | | |
| | | | | |
| | | | | |
Other Kemess Costs | | | | | |
Care & Maintenance | | 13 - 15 | 6.4 | | |
| | | | | |
| | | | | |
| | | | | |
1.Total and brownfield exploration costs include capitalized exploration costs at the Mount Milligan Mine of $6.9 million spent in the six months ended June 30, 2025, and $7 to $9 million projected for the full year of 2025.
Exploration Expenditures (excluding Project Evaluation costs)
In the six months ended June 30, 2025, total exploration expenditures were 19.9 million, including $13.0 million related to expensed exploration, and capitalized exploration costs of $6.9 million at the Mount Milligan Mine. For the full year of 2025, exploration expenditures are expected to be $40 to $50 million, which is unchanged from the previous guidance. The exploration expenditures include $25 to $30 million of brownfield exploration and $15 to $20 million of greenfield and generative exploration programs, which is unchanged from the previous guidance. Over 85% of exploration expenditures are expected to be expensed. The exploration targets for brownfield projects include further drilling and test work at the Mount Milligan Mine, as well as the Kemess Project. At the Mount Milligan Mine, a significant portion of the exploration work is focused on in-fill drilling below the current ultimate open-pit including the Southern Star, Oliver, 66, and Great Eastern zones, as well as west of the ultimate pit boundary in the Goldmark, North Slope, Boundary and Saddle West Zones. Targets with potential for shallower porphyry-style gold-copper mineralization and high gold and low copper style mineralization peripheral to the current pits are also being tested with drilling.
Kemess Project
The work program at the Kemess Project continues to be focused on project evaluation activities including resource in-fill and exploration drilling as well as technical studies.
In the six months ended June 30, 2025, the Kemess Project’s expenditures amounted to $9.2 million, comprised of $6.4 million for care and maintenance costs, and $1.6 million related to exploration, and $1.2 million related to technical studies.
For the full year of 2025, the Kemess Project’s expenditures are projected to be in the range of $13 to $15 million on care and maintenance, $10 to $12 million on exploration drilling, and $4 to $6 million on technical studies (included in the Evaluation Costs in the table above), which is unchanged from the previous guidance. The Company continues to evaluate concepts for the property as outlined in the Recent Events and Developments section of this MD&A and expects to publish the results of a PEA by the end of 2025.
Goldfield Project
Subsequent to the quarter-end, on August 6, 2025, the Board authorized the Goldfield Project for construction. See Recent Events section in this MD&A. Following the approval of the project, the work program for the remainder of 2025 at the Goldfield Project is focused on study costs and field campaigns to advance upcoming feasibility study and detailed engineering. The Goldfield Project’s expenditures are projected to be in the range of $2 to $5 million for the remainder of 2025.
Other Items
In the six months ended June 30, 2025, corporate and administration expenses were 16.7 million, excluding stock-based compensation expense of $2.9 million and corporate depreciation of $0.4 million. Corporate and administration expenses excluding stock-based compensation expense are expected to be in the range from $28 to $32 million for the full year of 2025, which is unchanged from the previous guidance.
As a result of the ramp-up of the Greenstone Mine, the Company is entitled to receive 33,333 additional contingent gold ounces of which 11,111 ounces are anticipated in the second half of 2025 from Equinox Gold in relation to the sale of Centerra’s 50% interest in the Greenstone Partnership. Once received, the equivalent ounces will be delivered by the Company to Royal Gold as part of the Additional Royal Gold Agreement.
2025 Material Assumptions
Other material assumptions or factors not mentioned above but used to estimate production and costs for the remaining six months of 2025 after giving effect to the hedges in place as at June 30, 2025, include the following:
•market gold price of $3,300 per ounce ($2,700 per ounce in the previous guidance), and an average realized gold price at the Mount Milligan Mine of $2,297 per ounce ($1,902 per ounce in the previous guidance) after reflecting the Mount Milligan Streaming Agreement (i.e., 35% of the Mount Milligan Mine’s gold is sold to Royal Gold for $435 per ounce) and gold refining costs;
•market price of $4.00 per pound for copper (consistent with the previous guidance). Realized copper price at the Mount Milligan Mine is estimated to average $3.36 per pound (consistent with the previous guidance) after reflecting the Mount Milligan Streaming Agreement (18.75% of the Mount Milligan Mine’s copper is sold to Royal Gold at 15% of the spot price per metric tonne), and copper treatment and refining costs;
•molybdenum price of $21.00 per pound ($20.00 per pound in the previous guidance);
•exchange rates are as follows: $1USD:$1.36 CAD ($1USD:$1.38 CAD in the previous guidance), and $1USD:38 Turkish lira ($1USD:36 Turkish lira in the previous guidance); and
•diesel fuel price of $1.02 / litre or CAD$1.39 / litre at the Mount Milligan Mine ($1.05 / litre or CAD$1.45 / litre in the previous guidance) and $2.85/gallon ($2.90/gallon in the previous guidance) at the Thompson Creek Mine.
The Additional Royal Gold Agreement is not expected to have a significant impact on these assumptions in 2025 as the increases in payments received by the Company for gold ounces and copper pounds delivered to Royal Gold are not expected to commence until later. See Recent Events and Developments section in this MD&A.
Mount Milligan Streaming Agreement
Production at the Mount Milligan Mine is subject to the Mount Milligan Streaming Agreement. To satisfy its obligations under the Mount Milligan Streaming Agreement, the Company purchases refined gold and copper warrants and arranges for their delivery to Royal Gold. The difference between the cost of the purchases of refined gold and copper warrants, and the corresponding amounts payable to the Company under the Mount Milligan Streaming Agreement is recorded as a reduction of revenue and not a cost of operating the mine.
Other Material Assumptions
Production, cost, and capital expenditure forecasts for the year 2025 are forward-looking information and are based on key assumptions and subject to material risk factors that could cause actual results to differ materially from those estimated. Material assumptions used in forecasting production and costs for 2025 and related risk factors can be found under the heading “Cautionary Statement on Forward-Looking Information” in this document and under the heading “Risks That Can Affect Centerra’s Business” in the Company’s most recent Annual Information Form (“AIF”).
2025 Sensitivities
Centerra’s costs and cash flows for the remaining six months of 2025 are sensitive to changes in certain key inputs. The Company has estimated the impact of any such changes on its net income, capital costs and cash flows as follows:
| | | | | | | | | | | | | | | | | | | | | |
| | Impact on
($ millions) | |
| | Production Costs & Taxes | Capital
Costs | Revenues | Cash flows | | All-in sustaining costs on a by-product basis per ounceNG |
Gold price(1) | $100/oz | 2.5 - 3.0 | — | 10.0 - 13.5 | 9.0 - 12.0 | | 8 - 10 |
Copper price(1) | 10% | 0.5 - 1.0 | — | 8.5 - 12.5 | 8.5 - 11.5 | | 55 - 70 |
Diesel fuel(2) | 10% | 0.4 - 1.2 | 0.1 - 0.5 | — | 0.5 - 1.8 | | 2 - 9 |
Canadian dollar(2),(3) | 10 cents | 10.0 - 11.0 | 0.1 - 0.5 | — | 10.1 - 11.5 | | 65 - 70 |
Turkish lira(3) | 5 liras | 1.0 - 1.5 | 1.0 - 1.5 | — | 2.0 - 3.0 | | 16 - 18 |
(1)Excludes the impact of gold hedges and the effect of 27,994 ounces of gold with an average mark-to-market price of $3,309 per ounce and 13.8 million pounds of copper with an average mark-to-market price of $4.49 per pound outstanding under the Mount Milligan Mine’s contracts awaiting final settlement in future months as of June 30, 2025.
(2)Includes the effect of the Company’s diesel fuel and Canadian dollar hedging programs, with current exposure coverage as of June 30, 2025 of approximately 42% and 54%, respectively.
(3)Appreciation of the currency against the US dollar results in higher costs and lower cash flow and earnings. Depreciation of the currency against the US dollar results in decreased costs and increased cash flow and earnings.
Liquidity and Capital Resources
As of June 30, 2025, the Company’s total liquidity position was $0.9 billion, representing a cash balance of $522.3 million and no amounts drawn under its $400.0 million corporate credit facility.
Second Quarter 2025 compared to Second Quarter 2024
See the Overview of Consolidated Results section in this MD&A for the discussion of cash provided by operating activities.
Cash used in investing activities of $72.6 million was recognized in the second quarter of 2025 compared to $35.6 million in the second quarter of 2024. The increase is primarily related to $23.7 million higher capital spending at the Thompson Creek Mine in the second quarter of 2025 and a cash payment of $22.0 million to purchase marketable security investments in the second quarter of 2025, including the investment in Thesis Gold Inc. ("Thesis").
Cash used in financing activities in the second quarter of 2025 was $38.5 million compared to $22.2 million in the second quarter of 2024. The increase is primarily due to higher consideration paid to repurchase and cancel Centerra common shares. Consideration paid for the repurchase and cancellation of 3,889,507 Centerra common shares under the Company’s NCIB program was $27.0 million in the second quarter of
2025 compared to consideration of $9.8 million paid for the repurchase and cancellation of 1,439,700 Centerra common shares under the Company’s NCIB program in the second quarter of 2024.
Six months ended June 30, 2025 compared to June 30, 2024
See the Overview of Consolidated Results section in this MD&A for the discussion of cash provided by operating activities.
Cash used in investing activities of $121.2 million was recognized in 2025 compared to $78.3 million in 2024. The increase is primarily related to $51.2 million higher capital spending at the Thompson Creek Mine in 2025 and $22.0 million purchase of marketable security investments in 2025, partially offset by a cash payment of $24.5 million related to the Additional Royal Gold Agreement executed in 2024.
Cash used in financing activities of $65.1 million was recognized in 2025 compared to $44.2 million in 2024. The increase was primarily due to higher consideration paid to repurchase and cancel Centerra common shares. Consideration paid for the repurchase and cancellation of 6,355,433 Centerra common shares under the Company’s NCIB program was $42.0 million in 2025 compared to consideration of $19.8 million paid for the repurchase and cancellation of 3,223,500 Centerra common shares under the Company’s NCIB program in 2024.
Financial Performance
Second Quarter 2025 compared to Second Quarter 2024
Revenue of $288.3 million was recognized in the second quarter of 2025 compared to $282.3 million in the second quarter of 2024. The increase in revenue was primarily due to higher average realized gold prices and higher gold ounces sold at the Mount Milligan Mine, and higher molybdenum pounds roasted and sold at the Langeloth Facility. The increase was partially offset by lower ounces of gold produced and sold at Öksüt Mine.
Gold production was 63,311 ounces in the second quarter of 2025 compared to 89,828 ounces in the second quarter of 2024. Gold production in the second quarter of 2025 included 28,253 ounces of gold produced at the Öksüt Mine compared to 51,219 ounces produced in the second quarter of 2024. The decrease was primarily due to higher production level during the second quarter of 2024 from processing the built-up heap leach inventory following the resumption of operations in June 2023. There were 35,058 ounces of gold produced from the Mount Milligan Mine in the second quarter of 2025 compared to 38,609 ounces in the second quarter of 2024. The decrease was primarily driven by lower head grades and lower gold recoveries.
Copper production at the Mount Milligan Mine was 12.4 million pounds in the second quarter of 2025 compared to 13.5 million pounds in the second quarter of 2024. The decrease in copper production was primarily due to lower copper head grades.
The Langeloth Facility roasted and sold 3.2 million pounds and 3.1 million pounds of molybdenum, respectively, in the second quarter of 2025, compared to 1.9 million pounds roasted and 2.7 million pounds sold in the second quarter of 2024. The increase in molybdenum roasted and sold in the second quarter of 2025, compared to the second quarter of 2024, was primarily due to strong demand from its main contract customers during the second quarter of 2025 and a planned acid plant shut down in the second quarter of 2024. The Langeloth Facility has commenced a ramp-up of capacity utilization with the goal to increase roasting volumes to the range of 13 to 15 million pounds in 2025.
Cost of sales of $200.9 million was recognized in the second quarter of 2025 compared to $190.0 million in the second quarter of 2024. The increase was primarily due to $8.4 million higher production costs at the Langeloth Facility resulting from higher pounds of molybdenum sold and $7.3 million higher production costs at the Mount Milligan Mine. The increase in cost of sales was partially offset by combined $6.6 million lower production costs and lower DDA at the Öksüt Mine.
Gold production costs were $1,308 per ounce in the second quarter of 2025 compared to $870 per ounce in the second quarter of 2024. The increase was primarily due to a higher allocation of costs to gold production costs due to relative changes in the market price of gold and copper at the Mount Milligan Mine, and $6.8 million higher royalty costs and lower ounces of gold sold at the Öksüt Mine.
DDA of $26.0 million was recognized in the second quarter of 2025 compared to $27.5 million in the second quarter of 2024. The slight decrease in DDA was primarily attributable to lower gold ounces sold at the Öksüt Mine.
All-in sustaining costs on a by-product basisNG were $1,652 per ounce in the second quarter of 2025 compared to $1,179 per ounce in the second quarter of 2024. The increase in all-in sustaining costs on a by-product basisNG was primarily due to higher gold production costs per ounce as noted above.
An unrealized gain of $15.0 million was recognized in the second quarter of 2025 on the re-measurement of the amount due from Equinox Gold, reflecting the updated gold price assumptions related to the contingent consideration owing to the Company from Equinox Gold.
Expensed exploration and evaluation expenditures of $9.7 million were recognized in the second quarter of 2025 compared to $20.7 million in the second quarter of 2024. The total expenditures of $9.7 million recognized in the second quarter 2025 comprised:
•$1.5 million of drilling and related costs at the Kemess Project (Nil in 2024);
•$1.3 million of drilling and related costs at the Mount Milligan Mine ($2.5 million in 2024);
•$1.2 million of project evaluation costs at the Goldfield Project ($1.4 million in 2024);
•$0.7 million of project evaluation costs at the Kemess Project (Nil in 2024);
•$0.5 million of drilling and related costs at the Öksüt Mine ($0.2 million in 2024);
•$0.5 million of drilling and related costs at the Goldfield Project ($4.8 million in 2024);
•Nil project evaluation costs at the Thompson Creek Mine ($6.8 million in 2024); and
•$4.0 million of drilling and related costs across the Company’s other exploration projects ($5.0 million in 2024).
Other non-operating loss of $1.0 million was recognized in the second quarter of 2025 compared to other non-operating income of $11.6 million in the second quarter of 2024. The decrease in other non-operating income is primarily attributable to an $8.3 million higher foreign exchange loss driven by the effect of foreign exchange movements on the reclamation provision at the Endako Mine and Kemess Project and a decrease in interest income earned on the Company’s cash balance.
The Company recognized income tax recovery of $2.2 million in the second quarter of 2025, comprising current income tax expense of $5.2 million and deferred income tax recovery of $7.3 million, compared to income tax expense of $17.8 million in the second quarter of 2024, comprising current income tax expense of $9.1 million and deferred income tax expense of $8.7 million. The increase in income tax recovery in the second quarter of 2025 was primarily due to a $7.6 million lower current income tax expense at the Öksüt Mine, resulting from lower income generated at the Öksüt Mine due to lower gold ounces sold and the impact of foreign currency translation on deferred income taxes at the Mount Milligan Mine, amounting to $19.8 million, partially offset by a $10.7 million drawdown on the deferred income tax asset related to earnings generated at the Mount Milligan Mine.
Six months ended June 30, 2025 compared to June 30, 2024
Revenue of $587.8 million was recognized in 2025 compared to $588.2 million in 2024. Lower ounces of gold produced and sold at the Öksüt Mine and lower ounces of gold sold and pounds of copper sold at the Mount Milligan Mine were partially offset by higher average realized gold and copper prices and higher molybdenum revenue.
Gold production was 122,690 ounces in 2025 compared to 201,169 ounces in 2024. Gold production in 2025 included 70,938 ounces of gold from the Mount Milligan Mine compared to 86,926 ounces in 2024. The decrease was primarily due to lower mill throughput, lower gold grades and lower gold recoveries. The Öksüt
Mine produced 51,752 ounces of gold in 2025 compared to 114,243 ounces of gold in 2024. The decrease was primarily due to a higher production level in 2024 from processing the built-up heap leach inventory following the resumption of operations in June 2023.
Copper production at the Mount Milligan Mine was 24.1 million pounds in 2025 compared to 27.9 million pounds in 2024. The decrease in copper production was primarily attributed to lower mill throughput and lower copper grades, partially offset by slightly higher copper recoveries.
The Langeloth Facility roasted 6.2 million pounds and sold 7.3 million pounds of molybdenum in 2025 compared to 4.8 million pounds roasted and 5.6 million pounds sold in 2024. This increase was primarily due to strong demand from its main contract customers in 2025 and a planned acid plant shut down in 2024.
Cost of sales of $423.9 million was recognized in 2025 compared to $397.2 million recognized in 2024. The increase was primarily due to $36.4 million higher production costs at the Langeloth Facility resulting from higher pounds of molybdenum roasted and sold and $12.0 million higher production costs at the Mount Milligan Mine. The increase in cost of sales was partially offset by combined $20.8 million lower production costs and lower DDA at the Öksüt Mine.
Gold production costs were $1,290 per ounce in 2025 compared to $802 per ounce in 2024. The increase in gold production costs per ounce was primarily due to lower ounces sold and higher royalty cost per ounce at the Öksüt Mine, as well as higher processing costs due to additional planned liner replacements, lower ounces sold and a higher allocation of costs to gold production costs due to relative changes in the market price of gold and copper at the Mount Milligan Mine.
All-in sustaining costs on a by-product basisNG were $1,572 per ounce in 2025 compared to $1,001 per ounce in 2024. The increase was primarily due to higher production costs per ounce as discussed above.
Reclamation recovery was $2.8 million in 2025 compared to the reclamation recovery of $30.1 million in 2024. The difference was primarily attributable to an increase in an estimate of future reclamation cash outflows at the Endako Mine and changes in the risk-free interest rates applied to discount the estimated provision for future reclamation cash outflows at the Endako Mine and Kemess Project in 2025. In addition, there was a reclamation recovery of $15.1 million recognized in 2024 at the Thompson Creek Mine from the increase in the risk-free interest rates applied to discount the estimated provision for future reclamation cash outflows. No reclamation expense or recovery was recognized at the Thompson Creek Mine in 2025 due to the commencement of development.
An unrealized gain of $21.6 million was recognized in 2025 on the re-measurement of amount due from Equinox Gold, reflecting updated gold price assumptions related to the final portion of contingent consideration owing to the Company.
Expensed exploration and evaluation costs were $16.8 million in 2025, compared to $35.6 million in 2024. The total expenditures of $16.8 million recognized in 2025 comprised:
•$1.9 million of drilling and related costs at the Mount Milligan Mine ($3.0 million in 2024);
•$1.7 million of project evaluation costs at the Goldfield Project ($3.8 million in 2024);
•$1.5 million of drilling and related costs at the Kemess Project (Nil in 2024);
•$1.3 million of drilling and related costs at the Goldfield Project ($6.6 million in 2024);
•$1.2 million project evaluation costs at the Kemess Project ($0.6 million in 2024);
•$1.1 million of drilling and related costs at the Öksüt Mine ($0.4 million in 2024);
•Nil project evaluation costs at the Thompson Creek Mine ($13.7 million in 2024); and
•$8.1 million of drilling and related costs across the Company’s other exploration projects ($7.5 million in 2024).
Other non-operating income of $8.7 million was recognized in 2025 compared to $27.6 million in 2024. The decrease in other non-operating income is primarily attributable to a $14.8 million higher foreign exchange loss driven by the effect of foreign exchange movements on the reclamation provision at the Endako Mine and Kemess Project, and a decrease in interest income earned on the Company’s cash balance.
The Company recognized income tax expense of $22.7 million in 2025, comprising current income tax expense of $34.5 million and deferred income tax recovery of $11.8 million, compared to income tax expense of $47.6 million in 2024, comprising current income tax expense of $46.5 million and deferred income tax expense of $1.1 million. The decrease in income tax expense was primarily related to a $20.1 million lower income tax expense at the Öksüt Mine, resulting from lower income generated at the Öksüt Mine.
Financial Instruments
The Company seeks to manage its exposure to fluctuations in diesel fuel prices, commodity prices and foreign exchange rates by entering into derivative financial instruments from time-to-time. The hedge positions for each of these programs as at June 30, 2025 are summarized as follows:
| | | | | | | | | | | | | | | | | | | | | | | | | | | | | | | | |
| | | Average Strike Price | Settlements (% of exposure hedged)(1) | As at June 30, 2025 |
| Instrument | Unit | Type | H2 2025 | 2026 | 2027 | H2 2025 | 2026 | 2027 | Total position(2) | Fair value ($'000's) |
| | | | | | | | | | |
| FX Hedges | | | | | | | | | | |
| USD/CAD zero-cost collars | CAD | Fixed | $1.34/$1.39 | $1.34/$1.39 | — | | $96.0M
(28%) | $72.0M | — | | $168.0M | 971 | |
| USD/CAD forward contracts | CAD | Fixed | 1.35 | 1.37 | 1.35 | | $92.0M
(26%) | $121.3M | $78.0M | $291.3M | 2,259 | |
| Total | | | | | | $188.0M
(54%) | $193.3 M | $78.0M | $459.3M | 3,230 | |
| | | | | | | | | | |
Diesel Fuel Hedges(3) | | | | | | | | | |
ULSD zero-cost collars(2) | Litres | Fixed | $0.60/$0.67 | $0.60/$0.67 | $0.50/$0.57 | 2,555
(12%) | 3,339 | | 469 | | 6,363 | (285) |
ULSD swap contracts(2) | Litres | Fixed | $0.65 | $0.60 | $0.58 | 6,222
(30%) | 21,290 | | 13,579 | | 41,091 | (1,125) | |
| Total | | | | | | 8,777
(42%) | 24,629 | | 14,048 | | 47,454 | (1,410) | |
| | | | | | | | | | |
| | | | | | | | | | |
Gold Hedges: | | | | | | | | | |
Gold zero-cost collars | Ounces | Fixed | $2,400/$3,400 | $2,400/$3,696 | — | | 20,750
(14%) | 20,000 | | — | 40,750 | (3,925) |
| | | | | | | | | | |
Gold/Copper Hedges (Royal Gold deliverables)(4): | | | | | | |
| Gold forward contracts | Ounces | Float | N/A | — | | — | | 17,773 | | — | | — | 17,773 | 131 | |
| Copper forward contracts | Pounds | Float | N/A | — | | — | | 4.0M | — | | — | 4.0M | 551 | |
(1)Percentage of exposure hedged is calculated with reference to the expected expenditure to be incurred in Canadian dollars, fuel consumed and gold ounces sold as outlined in the “Outlook” section and is subject to change.
(2)Ultra-low-sulfur diesel. Units are in thousands of litres.
(3)Includes hedges covering exposure of both the Mount Milligan Mine (2025 - 2027) and the Thompson Creek Mine (2026 - 2027).
(4)Royal Gold hedging program with a market price determined on settlement of the contract.
The realized (loss) gain recorded in the interim consolidated statements of earnings was as follows:
| | | | | | | | | | | | | | | | | | | | | | | |
| Three months ended June 30, | | Six months ended June 30, |
| ($ millions) | 2025 | 2024 | % Change | | 2025 | 2024 | % Change |
| Foreign exchange hedges | (949) | | (1,407) | | (33) | % | | (4,145) | (2,192) | | 89 | % |
| Fuel hedges | (206) | | (14) | | 1371 | % | | (263) | | 187 | (241) | % |
| Copper hedges | — | | — | | — | % | | — | | 450 | | (100) | % |
| | | | | | | |
| | | | | | | |
| | | | | | | |
| | | | | | | |
Subsequent the period-end and in conjunction with the decision to proceed with the Goldfield project, the Company entered into zero-cost collar contracts of 57,000 ounces in 2029 and 60,000 ounces in 2030 to protect project economics and support predictable cash flow during the ramp-up period. These zero-cost option collars are settled on a monthly basis, against the London Bullion Market Association (“LBMA”) gold
prices and have a gold price floor of $3,200 per ounce and an average gold price cap of $4,435 per ounce in 2029 and $4,705 per ounce in 2030.
In the first quarter of 2025, the Company initiated a diesel hedging program associated with the restart of operations at the Thompson Creek Mine in order to manage the risk associated with changes in diesel fuel prices. The hedge contracts cover a portion of estimated future diesel fuel purchases as part of the re-start and are expected to settle over time by June 2027.
As at June 30, 2025, Centerra has not entered into any off-balance sheet arrangements with special purpose entities, nor does it have any unconsolidated affiliates.
Balance Sheet Review
| | | | | | | | | |
($ millions) | June 30, 2025 | December 31, 2024 | |
| | | |
| | | |
| | | |
| | | |
| | | |
| Total Assets | 2,317.3 | | 2,265.1 | | |
| | | |
| | | |
| | | |
| Total Liabilities | 613.6 | | 609.2 | | |
| Current Liabilities | 279.7 | | 283.9 | | |
| Non-current Liabilities | 333.9 | | 325.3 | | |
| Total Equity | 1,703.7 | | 1,655.9 | | |
| | | |
Cash as at June 30, 2025 was $522.3 million compared to $624.7 million as at December 31, 2024. The decrease was primarily attributable to the repurchase and cancellation of approximately 6,355,433 Centerra common shares under the Company’s NCIB program amounting to $42.0 million, dividends paid of $20.8 million, $22.0 million paid to purchase marketable security investments and a free cash flow deficitNG of $15.5 million during the six months ended June 30, 2025.
Amounts receivable as at June 30, 2025 were $123.5 million compared to $75.0 million at December 31, 2024. The increase was primarily due to a $26.5 million increase in amounts receivable at the Langeloth Facility from increased sales and a $22.1 million increase in amounts receivable from gold and copper concentrate sales at the Mount Milligan Mine from the timing of shipments outstanding at the end of the period.
Other current assets as at June 30, 2025 were $72.7 million compared to $55.3 as at December 31, 2024. The increase was primarily due to the re-measurement of the current portion of the amount due from Equinox Gold related to the sale of the Company’s interest in the Greenstone Partnership in 2021, amounting to $16.5 million.
The carrying value of PP&E as at June 30, 2025 was $1.17 billion compared to $1.10 billion as at December 31, 2024. The increase was primarily due to the additions of $123.7 million related to ongoing capital projects at the existing mines and projects, including capital equipment purchases, equipment refurbishments and pre-stripping costs and other general costs capitalized at the Thompson Creek Mine and an increase in the reclamation assets mainly due to the revaluation at the Mount Milligan Mine, partially offset by the depreciation and depletion of PP&E of $57.7 million in the normal course of operations during the period.
Non-current financial assets as at June 30, 2025 were $93.7 million compared to $77.0 million as at December 31, 2024. The increase was primarily due to the purchase of marketable security investments amounting to $28.2 million, partially offset by the decrease due to a $13.5 million change in fair value of the financial asset recognized as result of the Additional Royal Gold Agreement.
Accounts payable and accrued liabilities as at June 30, 2025 were $250.5 million compared to $233.1 million at December 31, 2024. The increase was primarily due to the effect of timing of vendor payments of $18.9 million including a higher payable due to Royal Gold at the Mount Milligan Mine and timing of vendor payments at the Langeloth Facility amounting to $21.8 million, partially offset by the a $28.0 million lower royalty payable at the Öksüt Mine due to annual royalty payments made in the second quarter of 2025.
Income tax payable as at June 30, 2025 was $4.5 million compared to $18.7 million as at December 31, 2024. The decrease was primarily related to $17.3 million in tax payments made by the Öksüt Mine during the period.
Deferred income tax liabilities as at June 30, 2025 were $4.3 million compared to $18.4 million as at December 31, 2024. The decrease is primarily related to the reversal of temporary differences between accounting and tax bases of the balances related to the Öksüt Mine and Mount Milligan Mine.
The provision for reclamation as at June 30, 2025 was $288.9 million compared to $266.2 million at December 31, 2024. The increase was primarily due to the effect of the foreign exchange movement on the reclamation provision at the Endako Mine and Kemess Project and an increase in the provision for future reclamation cash flows at the Mount Milligan Mine.
Share capital as at June 30, 2025 was $782.4 million compared to $826.7 million as at December 31, 2024. The decrease was primarily due to the repurchase and cancellation of shares for $42.0 million under NCIB.
Accumulated other comprehensive income as at June 30, 2025 was $2.7 million compared to accumulated other comprehensive loss of $11.2 million as at December 31, 2024. The increase in accumulated other comprehensive income was primarily due to a $13.1 million change in fair value of derivative instruments on the hedging programs at Mount Milligan Mine in 2025.
Operating Mines and Facilities
Mount Milligan Mine
The Mount Milligan Mine is an open-pit mine located in north central British Columbia, Canada producing a gold and copper concentrate. The Mount Milligan Mine is subject to the Mount Milligan Mine Streaming Agreement. To satisfy its current obligations under the Mount Milligan Mine Streaming Agreement, the Company purchases refined gold ounces and copper warrants and arranges for delivery to Royal Gold. The difference between the cost of the purchases of refined gold ounces and copper warrants and the corresponding amounts payable to the Company under the Mount Milligan Streaming Agreement is recorded as a reduction of revenue rather than a cost of operating the mine. On February 13, 2024, the Company entered into the Additional Royal Gold Agreement, relating to the Mount Milligan Mine.
Mount Milligan Mine Financial and Operating Results
| | | | | | | | | | | | | | | | | | | | | | | |
| Three months ended June 30, | | Six months ended June 30, |
| ($millions, except as noted) | 2025 | 2024 | % Change | | 2025 | 2024 | % Change |
| Financial Highlights: | | | | | | | |
| Gold revenue | 80.3 | 53.5 | 50 | % | | 166.8 | 123.5 | 35 | % |
| Copper revenue | 43.8 | 44.4 | (1) | % | | 90.0 | 93.1 | (3) | % |
| Other by-product revenue | 2.7 | 1.9 | 42 | % | | 5.2 | 3.7 | 41 | % |
| Total revenue | 126.8 | 99.8 | 27 | % | | 262.0 | 220.3 | 19 | % |
| Production costs | 70.7 | 63.4 | 12 | % | | 148.4 | 136.4 | 9 | % |
| Depreciation, depletion, and amortization ("DDA") | 15.3 | 14.1 | 9 | % | | 30.8 | 32.4 | (5) | % |
| Earnings from mine operations | 40.8 | 22.3 | 83 | % | | 82.8 | 51.5 | 61 | % |
Earnings from operations(1) | 25.0 | 8.8 | 184 | % | | 61.7 | 32.4 | 90 | % |
| Cash provided by mine operations | 57.2 | 29.0 | 97 | % | | 96.6 | 59.0 | 64 | % |
Free cash flow from mine operations(2) | 42.8 | 13.5 | 217 | % | | 70.2 | 37.6 | 87 | % |
| Additions to property, plant and equipment | 16.7 | 18.8 | (11) | % | | 40.3 | 19.6 | 106 | % |
Capital expenditures - total(2) | 16.3 | 17.4 | (6) | % | | 28.6 | 21.5 | 33 | % |
Sustaining capital expenditures(2) | 14.7 | 17.4 | (16) | % | | 23.9 | 21.5 | 11 | % |
Non-sustaining capital expenditures(2) | 1.6 | — | 100 | % | | 4.7 | — | 100 | % |
| Operating Highlights: | | | | | | | |
| Tonnes mined (000s) | 12,408 | 12,314 | 1 | % | | 23,467 | 24,646 | (5) | % |
| Tonnes ore mined (000s) | 5,613 | 5,605 | — | % | | 11,398 | 11,019 | 3 | % |
| Tonnes processed (000s) | 5,305 | 5,325 | — | % | | 10,037 | 10,488 | (4) | % |
| Process plant head grade gold (g/t) | 0.34 | 0.36 | (6) | % | | 0.36 | 0.41 | (12) | % |
| Process plant head grade copper (%) | 0.15 | % | 0.16 | % | (6) | % | | 0.15 | % | 0.17 | % | (12) | % |
| Gold recovery (%) | 61.8 | % | 64.6 | % | (4) | % | | 62.0 | % | 65.1 | % | (5) | % |
| Copper recovery (%) | 76.9 | % | 76.9 | % | — | % | | 77.3 | % | 76.5 | % | 1 | % |
| Concentrate produced (dmt) | 35,964 | 35,087 | 2 | % | | 70,035 | 70,489 | (1) | % |
Gold produced (oz)(3) | 35,058 | 38,609 | (9) | % | | 70,938 | 86,926 | (18) | % |
Gold sold (oz)(3) | 33,727 | 31,402 | 7 | % | | 70,354 | 76,534 | (8) | % |
Average realized gold price - combined ($/oz)(3)(4) | 2,382 | 1,703 | 40 | % | | 2,371 | 1,614 | 47 | % |
Copper produced (000s lbs)(3) | 12,437 | 13,549 | (8) | % | | 24,084 | 27,880 | (14) | % |
Copper sold (000s lbs)(3) | 12,103 | 11,705 | 3 | % | | 24,244 | 27,327 | (11) | % |
Average realized copper price - combined ($/lb)(3)(4) | 3.62 | 3.79 | (4) | % | | 3.71 | 3.41 | 9 | % |
| Unit Costs: | | | | | | | |
| Gold production costs ($/oz) | 1,356 | 1,102 | 23 | % | | 1,371 | 1,017 | 35 | % |
All-in sustaining costs on a by-product basis ($/oz)(2)(5) | 1,286 | 1,234 | 4 | % | | 1,224 | 912 | 34 | % |
All-in costs on a by-product basis ($/oz)(2)(5) | 1,384 | 1,356 | 2 | % | | 1,336 | 985 | 36 | % |
Gold - All-in sustaining costs on a co-product basis ($/oz)(2)(5) | 1,675 | 1,449 | 16 | % | | 1,629 | 1,216 | 34 | % |
| Copper production costs ($/lb) | 2.06 | 2.46 | (16) | % | | 2.15 | 2.14 | — | % |
Copper - All-in sustaining costs on a co-product basis ($/lb)(2)(5) | 2.53 | 3.21 | (21) | % | | 2.54 | 2.55 | — | % |
Mining costs per tonne mined ($/tonne)(2) | 2.42 | 2.67 | (9) | % | | 2.68 | 2.47 | 9 | % |
Milling costs per tonne processed ($/tonne)(2) | 4.93 | 5.14 | (4) | % | | 6.09 | 5.60 | 9 | % |
Site G&A costs per tonne processed ($/tonne)(2) | 2.62 | 2.72 | (4) | % | | 2.69 | 2.48 | 8 | % |
On site costs per tonne processed ($/tonne)(2) | 13.22 | 14.04 | (6) | % | | 15.05 | 13.89 | 8 | % |
(1)Includes exploration and evaluation costs and other operating costs, including non-cash unrealized loss on the financial asset related to the Additional Royal Gold Agreement.
(2)Non-GAAP financial measure. See discussion under “Non-GAAP and Other Financial Measures”.
(3)Mount Milligan production and sales are presented on a 100%-basis. Under the Mount Milligan Streaming Agreement, Royal Gold is entitled to 35% of gold ounces sold and 18.75% of copper pounds sold. Royal Gold paid $435 per ounce of gold delivered and 15% of the spot price per metric tonne of copper delivered in the periods presented.
(4)This supplementary financial measure, within the meaning of 52-112, is calculated as a ratio of revenue from the consolidated financial statements and units of metal sold includes the impact from the Mount Milligan Streaming Agreement, copper hedges and mark-to-market adjustments on metal sold that had not yet settled under contract.
(5)Includes the impact from the Mount Milligan Streaming Agreement and the impact of copper hedges.
Second Quarter 2025 compared to Second Quarter 2024
Earnings from mine operations of $40.8 million were recognized in the second quarter of 2025 compared to $22.3 million in the second quarter of 2024. The increase in earnings from mine operations was primarily due to higher average realized gold prices, and higher gold ounces and copper pounds sold. This increase in earnings from mine operations was partially offset by lower average realized copper prices and higher production costs.
Cash provided by mine operations of $57.2 million was recognized in the second quarter of 2025 compared to $29.0 million in the second quarter of 2024. The increase was primarily due to higher average realized gold prices.
Free cash flow from mine operationsNG of $42.8 million was recognized in the second quarter of 2025 compared to $13.5 million in the second quarter of 2024. The increase was due to higher cash provided by mine operations as noted above.
During the second quarter of 2025, mining activities were carried out in phases 5, 6, 7 and 10 of the open pit. Total tonnes mined were 12.4 million tonnes in the second quarter of 2025 compared to 12.3 million tonnes in the second quarter of 2024.
Total process plant throughput in the second quarter of 2025 was 5.3 million tonnes, averaging 58,302 tonnes per calendar day compared to 5.3 million tonnes, averaging 58,520 tonnes per calendar day in the second quarter of 2024.
Gold production was 35,058 ounces in the second quarter of 2025 compared to 38,609 ounces in the second quarter of 2024. The decrease in gold production is primarily driven by lower head grade and lower recovery. During the second quarter of 2025, the average gold head grade and recovery were 0.34 g/t and 61.8% compared to 0.36 g/t and 64.6% in the second quarter of 2024. The lower head gold grade was primarily due to mining sequence and lower average grades encountered in these zones. Gold recovery in the second quarter of 2025 was affected by the elevated pyrite to chalcopyrite ratio in mill feed as well as lower head grades compared to the second quarter of 2024.
Copper production was 12.4 million pounds in the second quarter of 2025 compared to 13.5 million pounds in the second quarter of 2024. The decrease in copper production was primarily due to lower copper head grade. During the second quarter of 2025, the average copper head grade and recovery were 0.15% and 76.9% compared to 0.16% and 76.9% in the second quarter of 2024. The lower head copper grade was primarily due to mining sequence and lower average grades encountered in these zones.
Gold production costs were $1,356 per ounce in the second quarter of 2025 compared to $1,102 per ounce in the second quarter of 2024. The increase was primarily driven by a higher allocation of costs to gold production costs due to relative changes in the market price of gold and copper. Gold production costs were partially offset by slightly lower mining costs. Mining costs decreased due to lower equipment maintenance expenses related to the timing of component replacements, as well as lower consumption of diesel fuel and consumables. The decrease in mining costs was also due to higher TSF capitalization in the second quarter of 2025 with more waste tonnes moved to the TSF compared to the second quarter of 2024.
Copper production costs were $2.06 per pound in the second quarter of 2025 compared to $2.46 per pound in the second quarter of 2024. The decrease was primarily due to higher pounds of copper sold and a lower allocation of costs to copper production costs due to relative changes in the market price of gold and copper.
Mount Milligan Q2 All-in sustaining costs on a by-product basis per ounceNG ($/oz)
All-in sustaining costs on a by-product basisNG were $1,286 per ounce in the second quarter of 2025 compared to $1,234 per ounce in the second quarter of 2024. The increase was primarily due to higher production costs per ounce and lower copper credit per ounce from lower average realized copper prices, partially offset by lower sustaining capital expendituresNG, and higher gold ounces sold. Lower capital expendituresNG in the second quarter of 2025 were primarily due to lower spending on mining equipment overhauls and water sourcing projects compared to the second quarter of 2024.
Six months ended June 30, 2025 compared to June 30, 2024
Earnings from mine operations of $82.8 million were recognized in 2025 compared to $51.5 million in 2024. The increase was primarily due to higher average realized gold and copper prices, partially offset by lower gold ounces and copper pounds sold and higher production costs.
Cash provided by mine operations of $96.6 million was recognized in 2025 compared to $59.0 million in 2024. The increase was primarily due to higher average realized gold and copper prices, partially offset by lower gold ounces and copper pounds sold.
Free cash flow from mine operationsNG of $70.2 million was recognized in 2025 compared to $37.6 million in 2024. The increase was primarily due to higher cash provided by mine operations as explained above.
During 2025, mining activities were carried out in phases 5, 6, 7 and 10 of the open pit. Total tonnes mined were 23.5 million tonnes in 2025 compared to 24.6 million tonnes mined in 2024. The decrease in tonnage was primarily due to longer hauling distances from Phase 6 in 2025 compared to Phase 9 in 2024.
The process plant throughput was 10.0 million tonnes in 2025, averaging 55,454 tonnes per calendar day compared to 10.5 million tonnes in 2024, averaging 57,624 tonnes per calendar day. Lower throughput was due to some operational challenges and harder than anticipated ore during the first half of 2025. In addition, a mill maintenance shutdown was executed in the first half of 2025 for liner replacement of both ball mills and SAG mill which typically occurs every 18 months and was last completed in 2023.
Gold production was 70,938 ounces in 2025 compared to 86,926 ounces in 2024. The decrease was primarily due to lower gold grades and lower gold recoveries. During 2025, the average gold grade was 0.36 g/t and recoveries were 62.0% compared to 0.41 g/t and 65.1%, respectively, in 2024. The lower head gold grade was primarily due to mining sequence and lower average grades encountered in these zones. Lower recoveries were lower primarily due to increased pyrite content in the mill feed.
Total copper production was 24.1 million pounds in 2025 compared to 27.9 million pounds in 2024. The decrease in copper production is primarily attributed to lower copper grades. During 2025, the average copper grade was 0.15% and recoveries were 77.3% compared to 0.17% and 76.5%, respectively, in 2024. The lower head gold grade was primarily due to mining sequence and lower average grades encountered in these zones as well as higher proportion of stockpile material being reclaimed and processed through the mill for blending purposes. Higher copper recovery in 2025 was primarily due to the low concentrate grade initiative.
Gold production costs were $1,371 per ounce in 2025 compared to $1,017 per ounce in 2024. The increase was primarily due to lower gold ounces sold and higher allocation of costs to gold production costs due to relative changes in the market price of gold and copper and higher processing costs. Processing costs were
higher due to a planned mill maintenance shutdown in the first half of 2025, including the replacement of both ball and SAG mill liners compared to the replacement of only SAG mill liners during the mill maintenance shutdown in the first half of 2024. The expanded mill shutdown typically occurs every 18 months and as a result, contractor charges and liner costs were higher in the first half of 2025 compared to the first half of 2024.
Copper production costs of $2.15 per pound in 2025 remain consistent with $2.14 per pound in 2024.
Mount Milligan YTD all-in sustaining costs on a by-product basis per ounceNG ($/oz)
All-in sustaining costs on a by-product basisNG were $1,224 per ounce for 2025 compared to $912 per ounce in 2024. The increase was primarily due to higher production costs per ounce as discussed above.
Öksüt Mine
The Öksüt Mine is located in Türkiye approximately 300 kilometres southeast of Ankara and 48 kilometres south of Kayseri, the provincial capital. The nearest administrative centre is at Develi, located approximately 10 kilometres north of the mine site.
Öksüt Mine Financial and Operating Results
| | | | | | | | | | | | | | | | | | | | | | | |
| Three months ended June 30, | | Six months ended June 30, |
| ($millions, except as noted) | 2025 | 2024 | % Change | | 2025 | 2024 | % Change |
| Financial Highlights: | | | | | | | |
| Revenue | 91.0 | | 121.4 | | (25) | % | | 160.6 | | 243.4 | | (34) | % |
Production costs(1) | 34.5 | | 37.8 | | (9) | % | | 61.5 | | 72.5 | | (15) | % |
| Depreciation, depletion, and amortization ("DDA") | 9.6 | | 12.6 | | (24) | % | | 17.0 | | 26.8 | | (37) | % |
| Earnings from mine operations | 46.9 | | 71.1 | | (34) | % | | 82.0 | | 144.1 | | (43) | % |
Earnings from operations(2) | 46.2 | | 70.5 | | (34) | % | | 80.6 | | 143.2 | | (44) | % |
Cash (used in) provided by mine operations | (17.6) | | (2.1) | | (738) | % | | 32.7 | | 99.3 | | (67) | % |
Free cash flow (deficit) from mine operations(3) | (28.2) | | (10.9) | | (159) | % | | 13.4 | | 79.2 | | (83) | % |
| Additions to property, plant and equipment | 11.9 | | 9.0 | | 32 | % | | 23.9 | | 21.6 | | 11 | % |
Capital expenditures - total(3) | 10.6 | | 8.8 | | 20 | % | | 19.3 | | 20.1 | | (4) | % |
Sustaining capital expenditures(3) | 10.6 | | 8.8 | | 20 | % | | 19.3 | | 20.1 | | (4) | % |
| | | | | | | |
| Operating Highlights: | | | | | | | |
| Tonnes mined (000s) | 4,629 | | 3,851 | | 20 | % | | 7,772 | | 7,568 | | 3 | % |
| Tonnes ore mined (000s) | 1,261 | | 1,069 | | 18 | % | | 2,245 | | 1,393 | | 61 | % |
| Ore mined - grade (g/t) | 0.89 | | 1.14 | | (22) | % | | 0.84 | | 1.25 | | (33) | % |
| Ore crushed (000s) | 1,216 | | 905 | | 34 | % | | 2,142 | | 1,812 | | 18 | % |
| Tonnes of ore stacked (000s) | 1,227 | | 1,053 | | 17 | % | | 2,238 | | 2,025 | | 11 | % |
| Heap leach grade (g/t) | 0.90 | | 1.12 | | (20) | % | | 0.82 | | 1.27 | | (35) | % |
| Heap leach contained ounces stacked | 35,462 | | 37,784 | | (6) | % | | 59,130 | | 82,703 | | (29) | % |
| Gold produced (oz) | 28,253 | | 51,219 | | (45) | % | | 51,752 | | 114,243 | | (55) | % |
| | | | | | | |
| Gold sold (oz) | 27,608 | | 51,856 | | (47) | % | | 52,112 | | 111,037 | | (53) | % |
Average realized gold price ($/oz)(4) | 3,295 | | 2,336 | | 41 | % | | 3,082 | | 2,190 | | 41 | % |
| Unit Costs: | | | | | | | |
| Gold production costs ($/oz) | 1,250 | | 729 | | 71 | % | | 1,181 | | 653 | | 81 | % |
All-in sustaining costs on a by-product basis ($/oz)(3) | 1,755 | | 943 | | 86 | % | | 1,665 | | 879 | | 89 | % |
| | | | | | | |
Mining costs per tonne mined ($/tonne)(3) | 3.36 | 3.33 | 1 | % | | 3.35 | 3.31 | 1 | % |
Processing costs per tonne processed ($/tonne)(3) | 6.49 | 5.63 | 15 | % | | 6.29 | 5.59 | 13 | % |
Site G&A costs per tonne processed ($/tonne)(3) | 9.85 | 7.59 | 30 | % | | 9.57 | 8.62 | 11 | % |
On site costs per tonne processed ($/tonne)(3) | 29.01 | 25.39 | 14 | % | | 27.49 | 26.57 | 3 | % |
(1)Includes government royalties of $8.6 million and $15.4 million during three and six months ended June 30, 2025 and $13.4 million and $25.0 million during three and six months ended June 30, 2024, respectively.
(2)Includes exploration and evaluation costs.
(3)Non-GAAP financial measure. See discussion under “Non-GAAP and Other Financial Measures”.
(4)This supplementary financial measure, within the meaning of 52-112, is calculated as a ratio of revenue from the consolidated financial statements and units of metal sold.
Second Quarter 2025 compared to Second Quarter 2024
Earnings from mine operations were $46.9 million in the second quarter of 2025 compared with $71.1 million in the second quarter of 2024. The decrease was primarily due to lower ounces of gold produced and sold mainly attributable to higher production level during the second quarter of 2024 from processing the built-up heap leach inventory following the resumption of operations in June 2023. The decrease in earnings from mine operations was partially offset by higher average realized gold prices in the second quarter of 2025, lower production costs and lower DDA mainly attributable to lower ounces of gold sold.
Cash used in mine operations was $17.6 million in the second quarter of 2025, compared to $2.1 million in the second quarter of 2024. The increase in cash used in mine operations was primarily due to lower ounces of gold sold and higher royalty payments. Partially offsetting these factors were higher average realized gold prices and lower tax payments.
Free cash flow deficit from mine operationsNG was $28.2 million in the second quarter of 2025, compared to $10.9 million in the second quarter of 2024. The increase in free cash flow deficit from mine operationsNG was primarily due to an increase in cash used in mine operations as noted above.
Mining activities in the second quarter of 2025 were carried out in phase 5 and phase 6 of the Keltepe pit and in phase 2 of the Güneytepe pit. Total tonnes mined were 4.6 million tonnes in the second quarter of 2025 compared to 3.9 million tonnes in the second quarter of 2024. The increase was primarily due to higher waste stripping in the phase 6 of the Keltepe pit.
The Öksüt Mine stacked 1.2 million tonnes at an average grade of 0.90 g/t, containing 35,462 ounces of gold in the second quarter of 2025, compared to 1.1 million tonnes stacked at an average grade of 1.12 g/t, containing 37,784 ounces of gold in the second quarter of 2024. The increase in stacked tonnes was primarily due to higher ore tonnes mined and the decrease in heap leach grade was primarily due to lower mining grades in the second quarter of 2025.
Gold production in the second quarter of 2025 was 28,253 ounces compared to 51,219 ounces in the second quarter of 2024. The decrease in gold production was primarily due to lower heap leach grades in the second quarter of 2025 and higher production level in the second quarter of 2024 from processing the built-up heap leach inventory following the resumption of operations in June 2023.
Gold production costs per ounce were $1,250 in the second quarter of 2025 compared to $729 in the second quarter of 2024. The increase was primarily due to higher direct production costs and higher royalty cost per ounce resulting from elevated gold prices. Higher production costs were mainly due to higher weighted average cost per ounce in inventory as a result of lower mining and heap leach grades, higher community and social responsibility costs and the impact of net inflation in Türkiye between the periods, which increased labour and contractor costs.
Öksüt Mine Q2 All-in sustaining costs on a by-product basis per ounceNG ($/oz)
All-in sustaining costs on a by-product basisNG in the second quarter of 2025 were $1,755 per ounce compared to $943 per ounce in the second quarter of 2024. The increase was primarily due to the higher production costs and royalty costs per ounce as noted above, and lower ounces of gold sold.
Six months ended June 30, 2025 compared to June 30, 2024
Earnings from mine operations were $82.0 million in 2025 compared with $144.1 million in 2024. The decrease was primarily due to lower ounces of gold produced and sold mainly attributable to higher production level in 2024 from processing the built-up heap leach inventory following the resumption of operations in June 2023. The decrease in earnings from mine operations was partially offset by higher average realized gold prices, lower production costs and lower DDA mainly attributable to lower ounces of gold sold in 2025.
Cash provided by mine operations was $32.7 million in 2025 compared with $99.3 million in 2024. The decrease in cash provided by mine operations was primarily due to lower ounces of gold sold and higher royalty payments, partially offset by higher average realized gold prices and lower tax payments.
Free cash flow from mine operationsNG was $13.4 million in 2025 compared with $79.2 million in 2024. The decrease in free cash flow from mine operationsNG was due to a decrease in cash provided by mine operations.
Mining activities in 2025 were carried out in phase 5 and phase 6 of the Keltepe pit and in phase 2 of the Güneytepe pit. Total tonnes mined were 7.8 million tonnes in 2025 compared to 7.6 million tonnes in 2024. The increase was primarily due to increased pit stripping and waste removal from the Keltepe pit.
The Öksüt Mine stacked 2.2 million tonnes at an average grade of 0.82 g/t containing 59,130 ounces of gold in 2025, compared with 2.0 million tonnes stacked at an average grade of 1.27 g/t containing 82,703 ounces of gold in 2024. The increase in stacked tonnes was primarily due to higher ore tonnes mined and the decrease in heap leach grade was primarily due to lower mining grades in 2025.
Gold production was 51,752 ounces in 2025 compared to 114,243 ounces in 2024, primarily due to lower heap leach grades in 2025 and higher production level in 2024 from processing the built-up heap leach inventory following the resumption of operations in June 2023.
Gold production costs were $1,181 per ounce in 2025 compared with $653 per ounce in 2024. The increase was primarily due to higher production costs, higher royalty costs per ounce and lower deferred stripping. Higher royalty cost per ounce was primarily due to elevated gold prices. Higher production costs were mainly due to higher weighted average cost per ounce in inventory as a result of lower mining and heap leach
grades, higher community and social responsibility costs and the impact of net inflation in Türkiye between the periods, which increased labour and contractor costs.
All-in sustaining costs on a by-product basisNG were $1,665 per ounce in 2025 compared with $879 per ounce in 2024. The increase was primarily due to the higher production costs per ounce and higher royalty per ounce as noted above and lower ounces of gold sold.
Molybdenum Business Unit
The Molybdenum BU includes the Langeloth Facility in Pennsylvania and two North American molybdenum mines: the Thompson Creek Mine in Idaho and the 75%-owned Endako Mine in British Columbia, which is currently on care and maintenance.
Molybdenum BU Financial Results
| | | | | | | | | | | | | | | | | | | | | | | |
| Three months ended June 30, | Six months ended June 30, |
| ($millions, except as noted) | 2025 | 2024 | % Change | | 2025 | 2024 | % Change |
| Financial Highlights: | | | | | | | |
| | | | | | | |
| | | | | | | |
| Total revenue | 70.5 | | 61.2 | 15 | % | | 165.2 | | 124.5 | | 33 | % |
| Production costs | 69.7 | | 61.3 | 14 | % | | 163.8 | | 127.4 | | 29 | % |
| Depreciation, depletion, and amortization ("DDA") | 1.1 | | 0.8 | 38 | % | | 2.2 | | 1.6 | | 38 | % |
| Loss from mine operations | (0.3) | | (0.9) | | 67 | % | | (0.8) | | (4.5) | | 82 | % |
| Care and maintenance costs - Molybdenum mines | 0.3 | | 2.5 | (88) | % | | 3.2 | | 5.4 | | (41) | % |
Reclamation recovery | (5.3) | | (3.1) | | 71 | % | | (1.0) | | (18.7) | | 95 | % |
| | | | | | | |
| Other operating expenses | 0.5 | | 7.3 | (93) | % | | 1.2 | | 14.5 | | (92) | % |
Earnings (loss) from operations | 4.2 | | (7.6) | | 155 | % | | (4.2) | | (5.7) | | 26 | % |
| | | | | | | |
| | | | | | | |
| | | | | | | |
| | | | | | | |
Cash used in operations | (1.1) | | (8.2) | | 87 | % | | (7.1) | | (14.7) | | 52 | % |
| | | | | | | |
| | | | | | | |
| | | | | | | |
Free cash flow deficit from operations(1) | (26.9) | | (13.1) | | (105) | % | | (60.9) | | (20.5) | | (197) | % |
| | | | | | | |
| | | | | | | |
| | | | | | | |
| Additions to property, plant and equipment | 26.8 | | 9.6 | 179 | % | | 59.2 | | 10.5 | | 463 | % |
| | | | | | | |
| | | | | | | |
| | | | | | | |
Total capital expenditures(1) | 27.0 | | 9.6 | | 181 | % | | 52.9 | | 10.5 | | 404 | % |
| | | | | | | |
| | | | | | | |
| | | | | | | |
| | | | | | | |
| | | | | | | |
| | | | | | | |
| | | | | | | |
| | | | | | | |
| | | | | | | |
| | | | | | | |
(1)Non-GAAP financial measure. See discussion under “Non-GAAP and Other Financial Measures”.
Thompson Creek Mine
| | | | | | | | | | | | | | | | | | | | | | | |
| Three months ended June 30, | Six months ended June 30, |
| ($millions, except as noted) | 2025 | 2024 | % Change | | 2025 | 2024 | % Change |
Financial Highlights: | | | | | | | |
| | | | | | | |
Cash used in operations | — | | (7.0) | | 100 | % | | — | | (14.2) | | 100 | % |
Free cash flow deficit from operations(1) | (25.4) | | (8.7) | | (192) | % | | (53.3) | | (16.3) | | (227) | % |
| Additions to property, plant and equipment | 26.3 | 5.2 | 406 | % | | 58.6 | 5.6 | 946 | % |
Total capital expenditures(1) | 26.5 | | 5.2 | 410 | % | | 52.3 | | 5.6 | 834 | % |
Operating Highlights: | | | | | | | |
Tons mined (000s) | 6,778 | | 1,870 | | 262 | % | | 11,645 | | 3,904 | | 198 | % |
(1)Non-GAAP financial measure. See discussion under “Non-GAAP and Other Financial Measures”.
Second Quarter 2025 compared to Second Quarter 2024
In the second quarter of 2025, the additions to property, plant and equipment were $26.3 million compared to $5.2 million in the second quarter of 2024 and non-sustaining capital expendituresNG were $26.5 million in the second quarter of 2025 compared to $5.2 million in the second quarter of 2024. The increase was due to the higher capital spending on mill detailed engineering, construction of housing units, expenditures related to pre-stripping activities in the main open pit area and other general costs during the second quarter of 2025.
Nil cash used in operations and free cash flow deficit from operationsNG of $25.4 million were recognized in the second quarter of 2025, compared to cash used in operations of $7.0 million and free cash flow deficit from operationsNG of $8.7 million in the second quarter of 2024. The increase in free cash flow deficit from operationsNG was due to higher capital expendituresNG as outlined above.
Since the restart decision in September 2024, Thompson Creek Mine has moved 16.4 million tons of waste, representing 14% of planned tons of waste prior to production commencement. In the second quarter of 2025, the development activities in the Union Gap area continued and new development activities commenced in the Western Pit area. A decision support system has been rolled out on all haul trucks and a fleet management system for trucks and shovels was initiated. The mining rate increased with an average of 2.2 million tons per month during the second quarter of 2025 despite some typical operational challenges experienced during start-up of operations.
By the end of the second quarter of 2025, the majority of the planned mining equipment refurbishments and purchases had been substantially completed and the rebuilding and commissioning of haul trucks progressed as planned. In the third quarter of 2025, activities will be focused on the remaining refurbishment of trucks, shovel preventive maintenance, optimization of mine plans, and implementation of tire services.
During the second quarter of 2025, plant refurbishment, detailed engineering, long lead procurement activities, demolition work, and housing development continued as planned. Mill refurbishment works continued to utilize the Thompson Creek Mine’s own workforce. By the end of the second quarter of 2025, the self-performed demolition tasks were substantially completed, including the removal of the concentrate thickener and walkway, the demolition of combined ball mill sump, copper cementation plant, crusher and crusher compressor as well as the re-installation of draw hole liners and apron feeders. In the third quarter of 2025, activities will be focused on the demolition of thickener overflow tank and conditioner tank, and the installation of new compressor in the warehouse.
The long lead procurement activities progressed with the technical and commercial review. By the end of the second quarter of 2025, 3 packages have been fully finalized with contracts executed and an additional 16 procurement packages are planned for the third quarter of 2025.
In the second quarter of 2025, Thompson Creek Mine continued its effort in recruitment. Most of the key operations management positions have been filled and approximately 92% of the workforce was hired locally or from within the state of Idaho. Construction of the housing lots progressed well during the quarter. Site infrastructure development, including local housing capacity, is underway with work expected to be completed by the end of 2025 to support the long-term needs of the Thompson Creek Mine.
Six months ended June 30, 2025 compared to June 30, 2024
The additions to property, plant and equipment were $58.6 million in 2025 compared to $5.6 million in 2024 and non-sustaining capital expendituresNG were $52.3 million in 2025 compared to $5.6 million in 2024. The increase was due to higher capital spending related to higher capital spending on mining equipment refurbishment and purchases, mill detailed engineering work, construction of housing units, expenditures related to pre-stripping activities in the main open pit area and other general costs in 2025.
Nil cash used in operations and free cash flow deficit from operationsNG of $53.3 million in 2025 compared to cash used in operations of $14.2 million and free cash flow deficit from operationsNG of $16.3 million in 2024. The increase in free cash flow deficit from operationsNG was due to higher additions to PP&E as outlined above.
Langeloth Facility
| | | | | | | | | | | | | | | | | | | | | | | |
| Three months ended June 30, | Six months ended June 30, |
| ($millions, except as noted) | 2025 | 2024 | % Change | | 2025 | 2024 | % Change |
| Financial Highlights: | | | | | | | |
| | | | | | | |
| | | | | | | |
| Total revenue | 70.5 | | 61.2 | | 15 | % | | 165.2 | | 124.5 | | 33 | % |
| Production costs | 69.7 | | 61.3 | | 14 | % | | 163.8 | | 127.4 | | 29 | % |
| Depreciation, depletion, and amortization ("DDA") | 1.1 | | 0.8 | | 38 | % | | 2.2 | | 1.6 | | 38 | % |
| Loss from mine operations | (0.3) | | (0.9) | | 67 | % | | (0.8) | | (4.5) | | 82 | % |
| Other operating expenses | 0.5 | | 0.3 | | 67 | % | | 1.2 | | 0.5 | | 140 | % |
Loss from operations | (0.8) | | (1.2) | | 33 | % | | (2.0) | | (5.0) | | 60 | % |
Adjusted EBITDA(1) | 0.2 | | (0.4) | | 150 | % | | 0.3 | | (3.3) | | 109 | % |
Cash provided by (used in) operations | 0.8 | | (0.1) | | 900 | % | | (1.6) | | 1.7 | | (194) | % |
Free cash flow (deficit) from operations(1) | 0.2 | | (3.1) | | 106 | % | | (2.2) | | (1.9) | | (16) | % |
| Additions to property, plant and equipment | 0.5 | 3.9 | (87) | % | | 0.6 | 4.4 | (86) | % |
Total capital expenditures(1) | 0.5 | | 3.9 | (87) | % | | 0.6 | | 4.4 | (86) | % |
| Operating Highlights: | | | | | | | |
| Mo purchased (000's lbs) | 3,761 | | 2,207 | | 70 | % | | 7,345 | | 5,165 | | 42 | % |
Mo roasted (000’s lbs)(2) | 3,165 | | 1,948 | | 62 | % | | 6,199 | | 4,839 | | 28 | % |
| Mo sold (000’s lbs) | 3,076 | | 2,675 | | 15 | % | | 7,320 | | 5,623 | | 30 | % |
| Average market molybdenum price ($/lb) | 20.72 | 21.79 | (5) | % | | 20.62 | | 19.93 | | 3 | % |
| Average realized molybdenum price ($/lb) | 21.43 | 22.10 | (3) | % | | 21.52 | 21.25 | 1 | % |
(1)Non-GAAP financial measure. See discussion under “Non-GAAP and Other Financial Measures”.
(2)Amount does not include 0.2 million pounds of molybdenum roasted of toll material for the three and six months ended June 30, 2025 (nil in 2024).
Second Quarter 2025 compared to Second Quarter 2024
The Langeloth Facility roasted 3.2 million pounds and sold 3.1 million pounds of molybdenum in the second quarter of 2025, compared to 1.9 million pounds roasted and 2.7 million pounds sold in the second quarter of 2024. The increase in molybdenum roasted and sold in the second quarter of 2025, compared to the second quarter of 2024, was primarily due to strong demand from its main contract customers during the second quarter of 2025 and a planned acid plant shut down in the second quarter of 2024. The Langeloth Facility has commenced a ramp-up of capacity utilization with the goal to increase roasting volumes to the range of 13 to 15 million pounds in 2025.
Loss from operations was $0.8 million in the second quarter of 2025 compared to $1.2 million in the second quarter of 2024. The decrease in loss from operations was primarily due to the increase in the pounds of molybdenum sold during the second quarter of 2025 compared to the second quarter of 2024, higher revenue from by-products, and lower plant operating costs, partially offset by incremental costs related to managing the impacts of U.S. tariffs in the second quarter of 2025.
Adjusted EBITDANG of $0.2 million was recognized in the second quarter of 2025 compared to a negative adjusted EBITDANG of $0.4 million recognized in the second quarter of 2024. The increase in adjusted EBITDANG was primarily due to the decrease in loss from operations as discussed above.
Cash provided by operations was $0.8 million in the second quarter of 2025 compared to cash used in operations of $0.1 million in the second quarter of 2024. The increase in cash provided by operations was primarily due to the higher adjusted EBITDANG in the second quarter of 2025 as discussed above.
Free cash flow from operationsNG was $0.2 million in the second quarter of 2025 compared to a free cash flow deficit from operationsNG of $3.1 million in the second quarter of 2024. The increase in free cash flow from
operationsNG is primarily due to the decrease in cash used in operations in the second quarter of 2025 as discussed above and a higher capital spending related to planned maintenance of the acid plant in the second quarter of 2024.
The financial results at the Langeloth Facility were not significantly impacted by the tariffs during the second quarter of 2025. Based on the current state of U.S. tariffs, the Company does not currently anticipate any material impact on current year financial results.
Molybdenum prices increased during the quarter, with monthly averages increased from $19.91 per pound to $21.87 per pound. At June 30, 2025, there were 1.0 million (December 31, 2024 - 1.3 million) pounds of purchased molybdenum outstanding under contracts awaiting final settlement in the subsequent quarter. All of the purchased molybdenum was adjusted to a fair value price of approximately $20.11 (December 31, 2024 - $20.09) per pound at the end of the quarter. Molybdenum in concentrate is purchased at a discount to market molybdenum prices.
(1) The graph presents monthly average molybdenum prices.
Six months ended June 30, 2025 compared to June 30, 2024
The Langeloth Facility roasted 6.2 million pounds and sold 7.3 million pounds of molybdenum in 2025 compared to 4.8 million pounds roasted and 5.6 million pounds sold in 2024. The increase in the molybdenum roasted and sold was primarily due to strong demand from its main contract customers in 2025 and a planned acid plant shut down in 2024.
Loss from operations was $2.0 million in 2025 compared to $5.0 million in 2024. The decrease in loss from operations was primarily due to higher pounds of molybdenum roasted and sold and higher revenue from by-products in 2025.
Adjusted EBITDANG of $0.3 million was recognized in 2025 compared to negative adjusted EBITDANG of $3.3 million in 2024. The increase in adjusted EBITDANG was primarily due to the decrease in loss from operations as discussed above.
Cash used in operations was $1.6 million in 2025 compared to cash provided by operations of $1.7 million in 2024. The increase in cash used in operations was primarily due to an unfavourable working capital movement due to timing of vendor payments and cash collection on the sales in 2025 compared to a favourable working capital movement from cash collection and vendor payments in 2024, partially offset by a higher adjusted EBITDANG in 2025 as discussed above.
Free cash flow deficit from operationsNG was $2.2 million in 2025 compared to $1.9 million in 2024. The slight increase in free cash flow deficit from operationsNG was primarily due to higher cash used in operations as outlined above, partially offset by higher additions to PP&E related to planned maintenance of acid plant in 2024.
Endako Mine
Second Quarter 2025 compared to Second Quarter 2024
Earnings from operations of $5.0 million were recognized at the Endako Mine in the second quarter of 2025 compared to loss from operations of $0.6 million in the second quarter of 2024. The increase in earnings from operations was primarily due to a higher reclamation recovery recognized in the second quarter of 2025 resulting from an increase in the risk-free interest rates applied to discount the provision for future reclamation cash outflows at the Endako Mine in the second quarter of 2025.
In the second quarter of 2025, cash used in operations and free cash flow deficit from operationsNG at the Endako Mine were both $1.8 million compared to $1.1 million in the second quarter of 2024. The increase in cash used in operations and the free cash flow deficitNG were primarily due to reclamation payments related to the closure of the spillway for Tailings Pond 2. Both closure of the spillway of Tailings Pond 2 and the Denak West dewatering projects are expected to be completed in the third quarter of 2025.
Six months ended June 30, 2025 compared to June 30, 2024
Loss from operations of $2.2 million was recognized in 2025 compared to earnings from operations of $0.8 million in 2024. The increase in loss from operations was primarily attributable to a lower reclamation recovery in 2025 resulting from changes in the discount rates applied to the estimate of future reclamation cash flows.
Cash used in operations and free cash flow deficit from operationsNG were $5.4 million in 2025 compared to $2.2 million in 2024. The increase in cash used in operations was due to reclamation activities related to the closure of the spillway for Tailings Pond 2 project.
Quarterly Results – Previous Eight Quarters
| | | | | | | | | | | | | | | | | | | | | | | | | | | | | | |
| $millions, except per share data | 2025 | 2024 | 2023 | | | | |
Quarterly data unaudited | Q2 | Q1 | Q4 | Q3 | Q2 | Q1 | Q4 | Q3 | | | | |
| Revenue | 288 | | 299 | | 302 | | 324 | | 282 | | 306 | | 340 | | 344 | | | | |
Net earnings (loss) | 69 | | 30 | | (52) | | 29 | | 38 | | 66 | | (29) | | 61 | | | | |
Basic earnings (loss) per share | 0.33 | | 0.15 | | (0.25) | | 0.14 | | 0.18 | | 0.31 | | (0.13) | | 0.28 | | | | |
Adjusted earnings per share - basic | 0.26 | | 0.13 | | 0.17 | | 0.19 | | 0.23 | | 0.15 | | 0.28 | | 0.20 | | | | |
Diluted earnings (loss) per share | 0.32 | | 0.13 | | (0.25) | | 0.13 | | 0.18 | | 0.30 | | (0.13) | | 0.27 | | | | |
Adjusted earnings per share - diluted | 0.25 | | 0.12 | | 0.17 | | 0.19 | | 0.23 | | 0.14 | | 0.28 | | 0.20 | | | | |
| | | | | | | | | | | | |
| | | | | | | | | | | | |
| | | | | | | | | | | | |
Net earnings (loss) have fluctuated since the third quarter of 2023 due to a variety of factors ranging from impairment losses to reclamation expense (recovery) and unrealized losses and gains on financial instruments. The net earnings in the second quarter of 2025 benefited from higher gold and copper prices, along with a non-cash gain on the sale of the Company’s interest in the Greenstone Partnership, partially offset by lower gold ounces and copper pounds sold and an unrealized loss relating to the Additional Royal Gold Agreement. The net loss in the fourth quarter of 2024 was negatively impacted by the non-cash impairment loss at the Goldfield Project. The net loss in the fourth quarter of 2023 was negatively impacted by the non-cash impairment loss at the Kemess Project.
Accounting Estimates, Policies and Changes
Accounting Estimates
The preparation of the Company’s consolidated financial statements in accordance with IFRS requires management to make estimates and judgments that affect the amounts reported in the consolidated financial statements and accompanying notes. The critical estimates and judgments applied in the preparation of the Company’s condensed consolidated interim financial statements for the three and six months ended June 30, 2025 are consistent with those used in the Company’s consolidated financial statements for the year ended December 31, 2024, with the exception of those disclosed in note 3 of the condensed consolidated interim financial statements for the three and six months ended June 30, 2025.
Management’s estimates and underlying assumptions are reviewed on an ongoing basis. Any changes or revisions to estimates and underlying assumptions are recognized in the period in which the estimates are revised and in any future periods affected. Changes to these critical accounting estimates could have a material impact on the consolidated financial statements.
The key sources of estimation uncertainty and judgment used in the preparation of the consolidated financial statements that might have a significant risk of causing a material adjustment to the carrying value of assets and liabilities and earnings are outlined in note 4 of the consolidated financial statements for the year ended December 31, 2024 with the exception of those disclosed in note 3 of the condensed consolidated interim financial statements for the three and six months ended June 30, 2025.
Accounting Policies and Changes
The accounting policies applied in the condensed consolidated interim financial statements for the three and six months ended June 30, 2025 is consistent with those used in the company’s consolidated financial statements for the year ended December 31, 2024.
Disclosure Controls and Procedures and Internal Control Over Financial Reporting
Pursuant to regulations adopted by the U.S. Securities and Exchange Commission, under the U.S. Sarbanes-Oxley Act of 2002 (“SOX”) and those of the Canadian Securities Administrators, the Company’s management evaluates the effectiveness of the design and operation of the Company's disclosure controls and procedures, and internal control over financial reporting. This evaluation is done under the supervision of, and with the participation of, the Chief Executive Officer and the Chief Financial Officer.
As of the end of the period covered by this MD&A and the accompanying financial statements, the Company’s management evaluated the effectiveness of its internal controls over financial reporting. In making this assessment, management used the criteria specified in Internal Control - Integrated Framework (2013) issued by the Committee of Sponsoring Organizations of the Treadway Commission. As at June 30, 2025, based on that evaluation, the Chief Executive Officer and the Chief Financial Officer have concluded that the Company’s disclosure controls and procedures, and internal control over financial reporting are designed to provide reasonable assurance regarding the reliability of information disclosed in its filings, including its interim financial statements prepared in accordance with IFRS.
There has been no change in the Company’s internal control over financial reporting during the three and six months ended June 30, 2025, that has materially affected, or is reasonably likely to materially affect, the Company’s internal control over financial reporting.
The Company’s management, including the Chief Executive Officer and the Chief Financial Officer, believes that any disclosure controls and procedures and internal control over financial reporting, no matter how well designed and operated, can have inherent limitations. Therefore, even those systems determined to be effective can provide only reasonable assurance that the objectives of the control system are met.
Non-GAAP and Other Financial Measures
This MD&A contains “specified financial measures” within the meaning of NI 52-112, specifically the non-GAAP financial measures, non-GAAP ratios and supplementary financial measures described below. Management believes that the use of these measures assists analysts, investors and other stakeholders of the Company in understanding the costs associated with producing gold and copper, understanding the economics of gold and copper mining, assessing operating performance, the Company’s ability to generate free cash flow from current operations and on an overall Company basis, and for planning and forecasting of future periods. However, the measures have limitations as analytical tools as they may be influenced by the point in the life cycle of a specific mine and the level of additional exploration or other expenditures a company has to make to fully develop its properties. The specified financial measures used in this MD&A do not have any standardized meaning prescribed by IFRS and may not be comparable to similar measures presented by other issuers, even as compared to other issuers who may be applying the World Gold Council (“WGC”) guidelines. Accordingly, these specified financial measures should not be considered in isolation, or as a substitute for, analysis of the Company’s recognized measures presented in accordance with IFRS.
Definitions
The following is a description of the non-GAAP financial measures, non-GAAP ratios and supplementary financial measures used in this MD&A:
•All-in sustaining costs on a by-product basis per ounce is a non-GAAP ratio calculated as all-in sustaining costs on a by-product basis divided by ounces of gold sold. All-in sustaining costs on a by-product basis is a non-GAAP financial measure calculated as the aggregate of production costs as recorded in the consolidated statements of earnings, refining and transport costs, the cash component of capitalized stripping and sustaining capital expenditures, lease payments related to sustaining assets, corporate general and administrative expenses, accretion expenses, asset retirement depletion expenses, copper and silver revenue and the associated impact of hedges of by-product sales revenue. When calculating all-in sustaining costs on a by-product basis, all revenue received from the sale of copper from the Mount Milligan Mine, as reduced by the effect of the copper stream, is treated as a reduction of costs incurred. A reconciliation of all-in sustaining costs on a by-product basis to the nearest IFRS measure is set out below. Management uses these measures to monitor the cost management effectiveness of each of its operating mines.
•All-in sustaining costs on a co-product basis per ounce of gold or per pound of copper, is a non-GAAP ratio calculated as all-in sustaining costs on a co-product basis divided by ounces of gold or pounds of copper sold, as applicable. All-in sustaining costs on a co-product basis is a non-GAAP financial measure based on an allocation of production costs between copper and gold based on the conversion of copper production to equivalent ounces of gold. The Company uses a conversion ratio for calculating gold equivalent ounces for its copper sales calculated by multiplying the copper pounds sold by estimated average realized copper price and dividing the resulting figure by estimated average realized gold price. For the three and six months ended June 30, 2025, 658 and 639 pounds of copper were equivalent to one ounce of gold. A reconciliation of all-in sustaining costs on a co-product basis to the nearest IFRS measure is set out below. Management uses these measures to monitor the cost management effectiveness of each of its operating mines.
•Sustaining capital expenditures and Non-sustaining capital expenditures are non-GAAP financial measures. Sustaining capital expenditures are defined as those expenditures required to sustain current operations and exclude all expenditures incurred at new operations or major projects at existing operations where these projects will materially benefit the operation. Non-sustaining capital expenditures are primarily costs incurred at ‘new operations’ and costs related to ‘major projects at existing operations’ where these projects will materially benefit the operation. A material benefit to an existing operation is considered to be at least a 10% increase in annual or life of mine production, net present value, or reserves compared to the remaining life of mine of the operation. A reconciliation of sustaining capital expenditures and non-sustaining capital expenditures to the nearest IFRS measures is set out below. Management uses the distinction of the sustaining and non-sustaining capital expenditures as an input into the calculation of all-in sustaining costs per ounce and all-in costs per ounce.
•Adjusted net earnings is a non-GAAP financial measure calculated by adjusting net earnings as recorded in the consolidated statements of earnings for items not associated with ongoing operations. The Company believes that this generally accepted industry measure allows the evaluation of the results of income-generating capabilities and is useful in making comparisons between periods. This measure adjusts for the impact of items not associated with ongoing operations. A reconciliation of adjusted net earnings to the nearest IFRS measures is set out below. Management uses this measure to monitor and plan for the operating performance of the Company in conjunction with other data prepared in accordance with IFRS.
•Adjusted EBITDA is a non-GAAP financial measure calculated by adjusting net earnings as recorded in the consolidated statements of earnings by depreciation, amortization, interest, taxes and items not associated with ongoing operations. The Company believes that this generally accepted industry measure allows the evaluation of the results of income-generating capabilities and is useful in making comparisons between periods. A reconciliation of adjusted EBITDA to the nearest IFRS measures is set out below. Management uses this measure to monitor and plan for the operating performance of the Company in conjunction with other data prepared in accordance with IFRS.
•Free cash flow (deficit) is a non-GAAP financial measure calculated as cash provided by operating activities less property, plant and equipment additions. A reconciliation of free cash flow to the nearest IFRS measures is set out below. Management uses this measure to monitor the amount of cash available to reinvest in the Company and allocate for shareholder returns.
•Mining costs per tonne mined is a non-GAAP financial measure calculated by dividing the mining costs by the number of tonnes mined. Management uses these measures to monitor the cost management effectiveness of the mining process for each of its operating mines.
•Processing costs per tonne stacked is a non-GAAP financial measure calculated by dividing the processing costs by the number of tonnes milled or stacked. Management uses these measures to monitor the cost management effectiveness of the mine processing for each of its operating mines.
•Site G&A costs per tonne processed is a non-GAAP financial measure calculated by dividing the site G&A costs by the number of tonnes milled or stacked. Management uses these measures to monitor the cost management effectiveness of the site G&A process for each of its operating mines.
•On site costs per tonne processed is a non-GAAP financial measure calculated by dividing the operating expenses less changes in inventories, royalties and other costs by the number of tonnes milled or stacked. Management uses these measures to monitor the cost management effectiveness of the relevant production costs for each of its operating mines.
•Average realized gold price is a supplementary financial measure calculated by dividing the different components of gold sales (including third party sales, mark-to-market adjustments, final pricing adjustments and the fixed amount received under the Mount Milligan Mine Streaming Agreement) by the number of ounces sold. Management uses this measure to monitor its sales of gold ounces against the average market gold price.
•Average realized copper price is a supplementary financial measure calculated by dividing the different components of copper sales (including third party sales, mark-to-market adjustments, final pricing adjustments and the fixed amount received under the Mount Milligan Mine Streaming Agreement) by the number of pounds sold. Management uses this measure to monitor its sales of gold ounces against the average market copper price.
•Average realized molybdenum price is a supplementary financial measure calculated by dividing the different components of molybdenum sales (including third party sales, mark-to-market adjustments and final pricing adjustments) by the number of pounds sold. Management uses this measure to monitor its sales of molybdenum pounds against the average market molybdenum price.
•Total liquidity is a supplementary financial measure calculated as cash and cash equivalents and amount available under the corporate credit facility. Credit facility availability is reduced by outstanding letters of credit. Management uses this measure to determine if the Company can meet all of its commitments, execute on the business plan, and to mitigate the risk of economic downturns.
Certain unit costs, including all-in sustaining costs on a by-product basis (including and excluding revenue-based taxes) per ounce, are non-GAAP ratios which include as a component certain non-GAAP financial measures including all-in sustaining costs on a by-product basis which can be reconciled as follows:
| | | | | | | | | | | | | | | | | | | | |
| Three months ended June 30, |
| Consolidated | Mount Milligan | Öksüt |
| (Unaudited - $millions, unless otherwise specified) | 2025 | 2024 | 2025 | 2024 | 2025 | 2024 |
| Production costs attributable to gold | 80.3 | | 72.4 | | 45.8 | | 34.6 | | 34.5 | | 37.8 | |
| Production costs attributable to copper | 24.9 | | 28.8 | | 24.9 | | 28.8 | | — | | — | |
| Total production costs excluding Molybdenum BU segment, as reported | 105.2 | | 101.2 | | 70.7 | | 63.4 | | 34.5 | | 37.8 | |
| Adjust for: | | | | | | |
| Third party smelting, refining and transport costs | 2.5 | | 2.4 | | 2.3 | | 2.2 | | 0.2 | | 0.2 | |
| By-product and co-product credits | (46.5) | | (46.5) | | (46.5) | | (46.3) | | — | | (0.2) | |
| | | | | | |
| Adjusted production costs | 61.2 | | 57.1 | | 26.5 | | 19.3 | | 34.7 | | 37.8 | |
| Corporate general administrative and other costs | 9.5 | | 10.8 | | (0.2) | | 0.2 | | 0.2 | | 0.2 | |
| Reclamation and remediation - accretion (operating sites) | 3.4 | | 2.3 | | 0.9 | | 0.5 | | 2.5 | | 1.8 | |
| Sustaining capital expenditures | 25.3 | | 26.3 | | 14.7 | | 17.4 | | 10.6 | | 8.8 | |
| Sustaining lease payments | 2.0 | | 1.6 | | 1.5 | | 1.3 | | 0.5 | | 0.3 | |
| All-in sustaining costs on a by-product basis | 101.4 | | 98.1 | | 43.4 | | 38.7 | | 48.5 | | 48.9 | |
| | | | | | |
| | | | | | |
| | | | | | |
| | | | | | |
| | | | | | |
| Ounces sold (000s) | 61.3 | | 83.3 | | 33.7 | | 31.4 | | 27.6 | | 51.9 | |
| Pounds sold (millions) | 12.1 | | 11.7 | | 12.1 | | 11.7 | | — | | — | |
| Gold production costs ($/oz) | 1,308 | | 870 | | 1,356 | | 1,102 | | 1,250 | | 729 | |
| All-in sustaining costs on a by-product basis ($/oz) | 1,652 | | 1,179 | | 1,286 | | 1,234 | | 1,755 | | 943 | |
| | | | | | |
| Gold - All-in sustaining costs on a co-product basis ($/oz) | 1,866 | | 1,260 | | 1,675 | | 1,449 | | 1,755 | | 943 | |
| Copper production costs ($/pound) | 2.06 | | 2.46 | | 2.06 | | 2.46 | | n/a | n/a |
| Copper - All-in sustaining costs on a co-product basis ($/pound) | 2.53 | | 3.21 | | 2.53 | | 3.21 | | n/a | n/a |
Certain unit costs, including all-in sustaining costs on a by-product basis (including and excluding revenue-based taxes) per ounce, are non-GAAP ratios which include as a component certain non-GAAP financial measures including all-in sustaining costs on a by-product basis which can be reconciled as follows:
| | | | | | | | | | | | | | | | | | | | | | | |
| Six months ended June 30, |
| Consolidated | Mount Milligan | Öksüt | | |
| (Unaudited - $millions, unless otherwise specified) | 2025 | 2024 | 2025 | 2024 | 2025 | 2024 | | | |
| Production costs attributable to gold | 157.9 | | 150.4 | | 96.4 | | 77.8 | | 61.5 | | 72.6 | | | | |
| Production costs attributable to copper | 52.0 | | 58.6 | | 52.0 | | 58.6 | | — | | — | | | | |
| Total production costs excluding Molybdenum BU segment, as reported | 209.9 | | 209.0 | | 148.4 | | 136.4 | | 61.5 | | 72.6 | | | | |
| Adjust for: | | | | | | | | | |
| Third party smelting, refining and transport costs | 5.1 | | 5.1 | | 4.8 | | 4.6 | | 0.3 | | 0.5 | | | | |
| By-product and co-product credits | (95.1) | | (97.0) | | (95.1) | | (96.8) | | — | | (0.2) | | | | |
| | | | | | | | | |
| Adjusted production costs | 119.9 | | 117.1 | | 58.1 | | 44.2 | | 61.8 | | 72.9 | | | | |
| Corporate general administrative and other costs | 20.0 | | 20.4 | | — | | 0.2 | | 0.4 | | 0.4 | | | | |
| Reclamation and remediation - accretion (operating sites) | 5.9 | | 4.9 | | 1.5 | | 1.2 | | 4.4 | | 3.7 | | | | |
| Sustaining capital expenditures | 43.2 | | 42.0 | | 23.9 | | 21.5 | | 19.3 | | 20.1 | | | | |
| Sustaining lease payments | 3.5 | | 3.2 | | 2.6 | | 2.7 | | 0.9 | | 0.5 | | | | |
| All-in sustaining costs on a by-product basis | 192.5 | | 187.6 | | 86.1 | | 69.8 | | 86.8 | | 97.6 | | | | |
| | | | | | | | | |
| | | | | | | | | |
| | | | | | | | | |
| | | | | | | | | |
| | | | | | | | | |
| Ounces sold (000s) | 122.5 | | 187.6 | | 70.4 | | 76.5 | | 52.1 | | 111.0 | | | | |
| Pounds sold (millions) | 24.2 | | 27.3 | | 24.2 | | 27.3 | | — | | — | | | | |
| Gold production costs ($/oz) | 1,290 | | 802 | | 1,371 | | 1,017 | | 1,181 | | 653 | | | | |
| All-in sustaining costs on a by-product basis ($/oz) | 1,572 | | 1,001 | | 1,224 | | 912 | | 1,665 | | 879 | | | | |
| | | | | | | | | |
| Gold - All-in sustaining costs on a co-product basis ($/oz) | 1,804 | | 1,125 | | 1,629 | | 1,216 | | 1,665 | | 879 | | | | |
| Copper production costs ($/pound) | 2.15 | | 2.14 | | 2.15 | | 2.14 | | n/a | n/a | | | |
| Copper - All-in sustaining costs on a co-product basis ($/pound) | 2.54 | | 2.55 | | 2.54 | | 2.55 | | n/a | n/a | | | |
Adjusted net earnings are a non-GAAP financial measure and can be reconciled as follows:
| | | | | | | | | | | | | | |
| Three months ended June 30, | Six months ended June 30, |
| ($millions, except as noted) | 2025 | 2024 | 2025 | 2024 |
Net earnings | $ | 68.6 | | $ | 37.7 | | $ | 99.0 | | $ | 104.1 | |
| Adjust for items not associated with ongoing operations: | | | | |
| | | | |
| Unrealized gain on sale of Greenstone Partnership | (15.0) | | — | | (21.6) | | — | |
| Unrealized loss on financial assets relating to the Additional Royal Gold Agreement | 12.1 | | 7.4 | | 13.5 | | 8.9 | |
Deferred income tax adjustments(1) | (11.0) | | 1.9 | | (12.2) | | (4.9) | |
| Reclamation recovery at the Molybdenum BU sites and the Kemess Project | (7.7) | | (5.1) | | (2.9) | | (30.1) | |
Unrealized foreign exchange loss (gain)(2) | 6.2 | | 5.5 | | 2.9 | | (3.4) | |
| Unrealized (gain) loss on marketable securities and other losses | (0.5) | | (1.0) | | 0.3 | | 0.6 | |
| Transaction costs related to the Additional Royal Gold Agreement | — | | — | | — | | 2.5 | |
| | | | |
Adjusted net earnings | $ | 52.7 | | $ | 46.4 | | $ | 79.0 | | $ | 77.7 | |
| | | | |
Net earnings per share - basic | $ | 0.33 | | $ | 0.18 | | $ | 0.48 | | $ | 0.49 | |
Net earnings per share - diluted | $ | 0.32 | | $ | 0.18 | | $ | 0.46 | | $ | 0.47 | |
Adjusted net earnings per share - basic | $ | 0.26 | | $ | 0.23 | | $ | 0.38 | | $ | 0.36 | |
Adjusted net earnings per share - diluted | $ | 0.25 | | $ | 0.23 | | $ | 0.37 | | $ | 0.36 | |
(1)Income tax adjustments reflect primarily the impact of foreign currency translation on deferred income taxes at the Öksüt Mine and the Mount Milligan Mine and a drawdown on the deferred tax asset related to the Mount Milligan Mine.
(2)Relates primarily to the effect of movement in foreign currency exchange rates on the reclamation provision at the Endako Mine and the Kemess Project.
Consolidated Adjusted EBITDA, a non-GAAP performance measure and can be reconciled as follows:
| | | | | | | | | | | | | | |
| Three months ended June 30, | Six months ended June 30, |
| ($millions, except as noted) | 2025 | 2024 | 2025 | 2024 |
Net earnings | $ | 68.6 | | $ | 37.7 | | $ | 99.0 | | $ | 104.1 | |
| Adjustments: | | | | |
| Income tax (recovery) expense | (2.2) | | 17.8 | | 22.7 | | 47.6 | |
Depreciation, depletion and amortization (“DDA”) | 26.9 | | 29.0 | | 51.7 | | 63.7 | |
| Interest income | (5.7) | | (7.9) | | (11.1) | | (16.0) | |
| Finance costs | 4.1 | | 3.8 | | 8.0 | | 7.2 | |
| | | | |
| Unrealized gain on sale of Greenstone Partnership | (15.0) | | — | | (21.6) | | — | |
| Unrealized loss on financial assets relating to the Additional Royal Gold Agreement | 12.1 | | 7.4 | | 13.5 | | 8.9 | |
| Reclamation recovery at the Molybdenum BU sites and the Kemess Project | (7.7) | | (5.1) | | (2.9) | | (30.1) | |
Unrealized foreign exchange loss (gain) | 6.2 | | 5.5 | | 2.9 | | (3.4) | |
| Unrealized (gain) loss on marketable securities and other losses | (0.5) | | (1.0) | | 0.3 | | 0.6 | |
| Transaction costs related to the Additional Royal Gold Agreement | — | | — | | — | | 2.5 | |
| | | | |
| | | | |
| Adjusted EBITDA | $ | 86.8 | | $ | 87.2 | | $ | 162.5 | | $ | 185.1 | |
Adjusted EBITDA at the Langeloth Facility is a non-GAAP measure and can be reconciled as follows:
| | | | | | | | | | | | | | |
| Three months ended June 30, | Six months ended June 30, |
| 2025 | 2024 | 2025 | 2024 |
| Net loss | $ | (0.8) | | $ | (1.2) | | $ | (1.8) | | $ | (4.9) | |
Adjustments: | | | | |
| Depreciation, depletion and amortization ("DDA”) | 1.1 | | 0.8 | | 2.2 | | 1.6 | |
| Interest Income | (0.1) | | — | | (0.2) | | — | |
| Finance costs | — | | — | | 0.1 | | — | |
Adjusted EBITDA | $ | 0.2 | | $ | (0.4) | | $ | 0.3 | | $ | (3.3) | |
Free cash flow (deficit) is a non-GAAP financial measure and can be reconciled as follows:
| | | | | | | | | | | | | | | | | | | | | | | | | | | | | | | | |
| Three months ended June 30, |
| Consolidated | Mount Milligan | Öksüt | Molybdenum | Other |
| 2025 | 2024 | 2025 | 2024 | 2025 | 2024 | 2025 | 2024 | 2025 | 2024 |
Cash provided by (used in) operating activities(1) | $ | 25.3 | | $ | 2.6 | | $ | 57.2 | | $ | 29.0 | | $ | (17.6) | | $ | (2.1) | | $ | (1.1) | | $ | (8.2) | | $ | (13.2) | | $ | (16.1) | |
| Deduct: | | | | | | | | | | |
Property, plant & equipment additions(1) | (50.9) | (29.6) | | (14.4) | | (15.5) | (10.6) | | (8.8) | (25.8) | | (4.9) | | (0.1) | | (0.4) | |
| Free cash flow (deficit) | $ | (25.6) | | $ | (27.0) | | $ | 42.8 | | $ | 13.5 | | $ | (28.2) | | $ | (10.9) | | $ | (26.9) | | $ | (13.1) | | $ | (13.3) | | $ | (16.5) | |
| | | | | | | | | | |
| | | | | | | | | | |
| | | | | | | | | | |
(1)As presented in the Company’s condensed consolidated interim statements of cash flows.
| | | | | | | | | | | | | | | | | | | | | | | | | | | | | | | | |
| Six months ended June 30, |
| Consolidated | Mount Milligan | Öksüt | Molybdenum | Other |
| 2025 | 2024 | 2025 | 2024 | 2025 | 2024 | 2025 | 2024 | 2025 | 2024 |
Cash provided by (used in) operating activities(1) | $ | 83.9 | | $ | 102.0 | | $ | 96.6 | | $ | 59.0 | | $ | 32.7 | | $ | 99.3 | | $ | (7.1) | | $ | (14.7) | | $ | (38.3) | | $ | (41.6) | |
| Deduct: | | | | | | | | | | |
Property, plant & equipment additions(1) | (99.5) | | (47.8) | | (26.4) | (21.4) | (19.3) | (20.1) | (53.8) | | (5.8) | | — | | (0.5) |
| Free cash flow (deficit) | $ | (15.6) | | $ | 54.2 | | $ | 70.2 | | $ | 37.6 | | $ | 13.4 | | $ | 79.2 | | $ | (60.9) | | $ | (20.5) | | $ | (38.3) | | $ | (42.1) | |
(1)As presented in the Company’s condensed consolidated interim statements of cash flows.
Sustaining capital expenditures and non-sustaining capital expenditures are non-GAAP measures and can be reconciled as follows:
| | | | | | | | | | | | | | | | | | | | | | | | | | | | | | | | |
| Three months ended June 30, |
| Consolidated | Mount Milligan | Öksüt | Molybdenum | Other |
| 2025 | 2024 | 2025 | 2024 | 2025 | 2024 | 2025 | 2024 | 2025 | 2024 |
Additions to PP&E(1) | $ | 55.6 | | $ | 37.9 | | $ | 16.6 | | $ | 18.8 | | $ | 12.0 | | $ | 9.0 | | $ | 26.8 | | $ | 9.6 | | $ | 0.2 | | $ | 0.5 | |
| Adjust for: | | | | | | | | | | |
| Costs capitalized to the ARO assets | 2.8 | | 1.1 | | (0.3) | | 0.9 | | (0.5) | | 0.2 | | 3.6 | | — | | — | | — | |
| Costs capitalized to the ROU assets | (1.1) | | (2.0) | | — | | (1.8) | | (0.9) | | (0.1) | | — | | — | | (0.2) | | (0.1) | |
Costs relating to capitalized DDA | (2.5) | — | — | — | — | — | (2.5) | — | — | — |
Other(2) | (0.9) | (0.7) | | — | (0.5) | | — | | (0.3) | | (0.9) | — | | — | 0.1 | |
Capital expenditures | $ | 53.9 | | $ | 36.3 | | $ | 16.3 | | $ | 17.4 | | $ | 10.6 | | $ | 8.8 | | $ | 27.0 | | $ | 9.6 | | $ | — | | $ | 0.5 | |
| Sustaining capital expenditures | 25.8 | | 30.6 | | 14.7 | | 17.4 | | 10.6 | | 8.8 | | 0.5 | | 4.4 | | — | | — | |
| Non-sustaining capital expenditures | 28.1 | | 5.7 | | 1.6 | | — | | — | | — | | 26.5 | 5.2 | | — | | 0.5 | |
(1)As presented in note 16 of the Company’s condensed consolidated interim financial statements.
(2)Primarily includes reclassification of insurance and capital spares from supplies inventory to PP&E.
| | | | | | | | | | | | | | | | | | | | | | | | | | | | | | | | |
| Six months ended June 30, |
| Consolidated | Mount Milligan | Öksüt | Molybdenum | Other |
| 2025 | 2024 | 2025 | 2024 | 2025 | 2024 | 2025 | 2024 | 2025 | 2024 |
Additions to PP&E(1) | $ | 123.7 | | $ | 53.2 | | $ | 40.3 | | $ | 19.6 | | $ | 23.9 | | $ | 21.6 | | $ | 59.2 | | $ | 10.5 | | $ | 0.3 | | $ | 1.5 | |
| Adjust for: | | | | | | | | | | |
| Costs capitalized to the ARO assets | (14.0) | 2.7 | (10.3) | 4.1 | | (3.3) | (0.9) | | (0.4) | | — | | — | | (0.5) | |
| Costs capitalized to the ROU assets | (2.3) | (2.8) | (0.9) | (1.8) | | (1.2) | (0.6) | | — | | — | | (0.2) | (0.4) | |
| | | | | | | | | | |
Costs relating to capitalized DDA | (4.5) | — | — | — | — | — | (4.5) | — | — | — |
Other(2) | (2.1) | — | | (0.5) | | (0.4) | | (0.1) | | — | | (1.4) | — | | (0.1) | 0.4 |
Capital expenditures | $ | 100.8 | | $ | 53.1 | | $ | 28.6 | | $ | 21.5 | | $ | 19.3 | | $ | 20.1 | | $ | 52.9 | | $ | 10.5 | | $ | — | | $ | 1.0 | |
| Sustaining capital expenditures | 43.8 | | 46.8 | | 23.9 | | 21.5 | | 19.3 | | 20.1 | | 0.6 | | 4.9 | | — | | 0.3 | |
| Non-sustaining capital expenditures | 57.0 | | 6.3 | | 4.7 | | — | | — | | — | | 52.3 | | 5.6 | | — | | 0.7 | |
(1)As presented in note 16 of the Company’s condensed consolidated interim financial statements.
(2)Primarily includes reclassification of insurance and capital spares from supplies inventory to PP&E.
Costs per tonne are non-GAAP measures and can be reconciled as follows:
| | | | | | | | | | | | | | | | | | | | | | | | | | |
| Three months ended June 30, | Six months ended June 30, |
| Mount Milligan | Öksüt | Mount Milligan | Öksüt |
| (in millions of US dollars, except where noted) | 2025 | 2024 | 2025 | 2024 | 2025 | 2024 | 2025 | 2024 |
Mining costs | $ | 30.1 | | $ | 32.9 | | $ | 15.6 | | $ | 12.8 | | $ | 63.0 | | $ | 60.9 | | $ | 26.0 | | $ | 25.1 | |
Allocation of mining costs(1) | (5.1) | (4.2) | (6.3) | (5.1) | | (8.7) | (5.6) | (11.1) | (13.6) | |
Milling costs | 26.2 | | 27.4 | | 8.0 | | 5.9 | | 61.1 | | 58.7 | | 14.1 | | 11.3 | |
| Site G&A costs | 13.9 | | 14.5 | | 12.1 | | 8.0 | | 26.9 | | 26.1 | | 21.4 | | 17.5 | |
| Change in inventory, royalties and other | 5.6 | (7.2) | | 5.1 | | 16.2 | 6.1 | | (3.7) | | 11.1 | | 32.2 |
| Production costs | $ | 70.7 | | $ | 63.4 | | $ | 34.5 | | $ | 37.8 | | $ | 148.4 | | $ | 136.4 | | $ | 61.5 | | $ | 72.5 | |
| Ore and waste tonnes mined (000's tonnes) | 12,409 | | 12,314 | | 4,629 | | 3,850 | | 23,467 | | 24,646 | | 7,772 | | 7,567 | |
| Ore processed (000's tonnes) | 5,305 | | 5,325 | | 1,227 | | 1,053 | | 10,037 | | 10,488 | | 2,238 | | 2,025 | |
| Mining costs per tonne mined ($/tonne) | 2.42 | | 2.67 | | 3.36 | | 3.33 | | 2.68 | | 2.47 | | 3.35 | | 3.31 | |
| Processing costs per tonne processed ($/tonne) | 4.93 | | 5.14 | | 6.49 | | 5.63 | | 6.09 | | 5.60 | | 6.29 | | 5.59 | |
| Site G&A costs per tonne processed ($/tonne) | 2.62 | | 2.72 | | 9.85 | | 7.59 | | 2.69 | | 2.48 | | 9.57 | | 8.62 | |
| On site costs per tonne processed ($/tonne) | 13.22 | | 14.04 | | 29.01 | | 25.39 | | 15.05 | | 13.89 | | 27.49 | | 26.57 | |
(1)Allocation of mining costs represents allocation to TSF for the Mount Milligan Mine and capitalized stripping for the Öksüt Mine.
Qualified Person & QA/QC
Christopher Richings, Professional Engineer, member of the Engineers and Geoscientists British Columbia and Centerra’s Vice President, Technical Services, has reviewed and approved all non-exploration scientific and technical information contained in this document. Mr. Richings is a “qualified person” within the meaning of the Canadian Securities Administrator’s NI 43-101 Standards of Disclosure for Mineral Projects (“NI 43-101”).
Richard Adofo, Member of the Association of Professional Geoscientists Ontario and Centerra’s Vice President, Exploration & Resource at Centerra Gold Inc., has reviewed and approved all exploration information and the related scientific and technical information contained in this document. Mr. Adofo is a “qualified person” within the meaning of NI 43-101. Sample preparation, analytical techniques, laboratories used, and quality assurance-quality control protocols used during the exploration drilling programs are done consistent with industry standards while independent certified assay labs are used.
The Mount Milligan Mine is described in the Company’s most recent AIF and in a technical report pursuant to NI 43-101 dated November 7, 2022 (with an effective date of December 31, 2021), and both are filed on SEDAR+ at www.sedarplus.ca and EDGAR at www.sec.gov/edgar. The technical report describes the exploration history, geology, and style of gold mineralization of the Mount Milligan deposit. Sample preparation, analytical techniques, laboratories used, and quality assurance and quality control protocols used during the exploration drilling programs are done consistent with industry standards while independent certified assay labs are used.
The Öksüt Mine is described in the Company’s most recent AIF and in a technical report pursuant to NI 43-101 dated September 3, 2015 (with an effective date of June 30, 2015), and both are filed on SEDAR+ at www.sedarplus.ca and EDGAR at www.sec.gov/edgar. The technical report describes the exploration history, geology, and style of gold mineralization at the Öksüt deposit. Sample preparation, analytical techniques, laboratories used, and quality assurance and quality control protocols used during the exploration drilling programs are done consistent with industry standards while independent certified assay labs are used.