Exhibit 99.2
Q2 2025Investor Presentation August 6, 2025
Forward Looking Statements Certain statements contained in this
presentation, other than purely historical information, including, but not limited to, statements as to the likelihood and anticipated timing of the closing of the proposed transaction, expected cost synergies and other expected
benefits, effects or outcomes relating to the proposed transaction, including financial estimates and projections, MasterBrand’s business plans, objectives and expected operating results, and the assumptions upon which those statements
are based, are forward-looking statements within the meaning of the Private Securities Litigation Reform Act of 1995. Statements preceded by, followed by or that otherwise include the word “believes,” “expects,” “anticipates,”
“intends,” “projects,” “estimates,” “plans,” “may increase,” “may fluctuate,” and similar expressions or future or conditional verbs such as “will,” “should,” “would,” “may,” and “could,” are generally forward-looking in nature and not
historical facts. Where, in any forward-looking statement, an expectation or belief is expressed as to future results or events, such expectation or belief is based on the current plans and expectations of the management of MasterBrand
or American Woodmark, as applicable. Although MasterBrand and American Woodmark, as applicable, believe that these statements are based on reasonable assumptions, they are subject to numerous factors, risks and uncertainties that could
cause actual outcomes and results to be materially different from those indicated or implied in such statements. These factors include a failure by either party or both parties to satisfy one or more of the closing conditions set forth
in the merger agreement, including a failure to obtain any required regulatory or governmental approvals or a failure to obtain the required approvals of either American Woodmark’s shareholders or MasterBrand’s stockholders; the
occurrence of events or changes in circumstances that give rise to the termination of the merger agreement by either party or a delay in the closing of the transaction; potential litigation relating to the transaction; the effect of the
proposed transaction on the ability of either party to retain customers, maintain relationships with suppliers and hire and retain key personnel; the effect of the proposed transaction and the announcement of the proposed transaction on
the parties’ stock prices; disruptions in the ordinary course business of either party resulting from the transaction; the continued availability of capital and financing and any rating agency actions related to the transaction or
otherwise; the risk that certain limitations in the merger agreement may impact either party’s ability to pursue certain business opportunities or strategic transactions; the diversion of the attention and time of management of either
party from ordinary course business operations to the transaction and transaction-related issues; the impact of transaction and/or integration costs and any increases in such costs; the existence of unknown liabilities; the ability of
MasterBrand to successfully integrate American Woodmark into its business and operations; and the risk that any anticipated economic benefits, cost savings or other synergies are not fully realized or take longer to realize than
expected. Other factors include those listed under “Risk Factors” in Part I, Item 1A of MasterBrand Annual Report on Form 10-K for the fiscal year ended December 29, 2024, Part II, Item 1A of MasterBrand’s Quarterly Report on Form 10-Q
for the quarterly period ended March 30, 2025, American Woodmark’s Annual Report on Form 10-K for the fiscal year ended April 30, 2025, and other MasterBrand and American Woodmark filings with the SEC. The forward-looking
statements included in this presentation are made as of the date of this presentation and, unless legally required, neither MasterBrand nor American Woodmark undertakes any obligation to update, amend or clarify any forward-looking
statements to reflect events, new information or circumstances occurring after the date of this presentation. 2
Additional Information and Where to Find It MasterBrand intends to file
with the U.S. Securities and Exchange Commission (“SEC”) a registration statement on Form S-4 (the “Registration Statement”), which will include a joint proxy statement of MasterBrand and American Woodmark that will also constitute a
prospectus of MasterBrand. Each of MasterBrand and American Woodmark may also file other relevant documents with the SEC regarding the transaction. This presentation is not a substitute for the joint proxy statement/prospectus or
Registration Statement or any other document that MasterBrand or American Woodmark may file with the SEC. Any definitive joint proxy statement/prospectus (if and when available) will be mailed to shareholders of MasterBrand and
American Woodmark. INVESTORS AND SHAREHOLDERS OF MASTERBRAND AND AMERICAN WOODMARK ARE URGED TO READ THE REGISTRATION STATEMENT, JOINT PROXY STATEMENT/PROSPECTUS AND ANY OTHER DOCUMENTS FILED OR TO BE FILED WITH THE SEC IN CONNECTION
WITH THE TRANSACTION, AS WELL AS ANY AMENDMENTS OR SUPPLEMENTS TO THESE DOCUMENTS, CAREFULLY AND IN THEIR ENTIRETY IF AND WHEN THEY BECOME AVAILABLE, AS THEY CONTAIN OR WILL CONTAIN IMPORTANT INFORMATION ABOUT MASTERBRAND, AMERICAN
WOODMARK, THE TRANSACTION AND RELATED MATTERS. The Registration Statement and joint proxy statement/prospectus and other documents filed by MasterBrand or American Woodmark with the SEC, when filed, will be available free of charge at
the SEC’s website at www.sec.gov. Alternatively, investors and shareholders may obtain free copies of documents that are filed or will be filed with the SEC by MasterBrand, including the Registration Statement and the joint proxy
statement/prospectus, on Masterbrand’s website at https://masterbrand.com/investors/financials/sec-filings/default.aspx, and may obtain free copies of documents that are filed or will be filed with the SEC by American Woodmark,
including the joint proxy statement/prospectus, on American Woodmark’s website at https://americanwoodmark.com/investors/financial-reporting#secfilings. The information included on, or accessible through, MasterBrand’s or American
Woodmark’s website is not incorporated by reference into this presentation. No Offer or Solicitation This presentation is not intended to be and shall not constitute an offer to sell or the solicitation of an offer to buy any
securities or a solicitation of any vote or approval, nor shall there be any sale of securities in any jurisdiction in which such offer, solicitation or sale would be unlawful prior to appropriate registration or qualification under the
securities laws of such jurisdiction. No offer of securities shall be made except by means of a prospectus meeting the requirements of Section 10 of the Securities Act of 1933, as amended. Participants in the
Solicitation MasterBrand, American Woodmark and certain of their respective directors and executive officers may be deemed to be participants in the solicitation of proxies in respect of the transaction. Information about the
directors and executive officers of MasterBrand is set forth in MasterBrand’s proxy statement for its 2025 annual meeting of shareholders, which was filed with the SEC on April 24, 2025, including under the headings “Proposal No. 1
Election of Directors—Our Director Nominees,” “Non-Employee Director Compensation,” “Executive Officers,” “Compensation Discussion and Analysis,” “Stock Ownership Information” and “Equity Compensation Plan Information.” Additional
information regarding ownership of MasterBrand securities by its directors and executive officers is included in each person’s beneficial ownership reports on Forms 3, 4 and 5, as filed with the SEC. Information about the directors and
executive officers of American Woodmark is set forth in its proxy statement for its 2025 annual meeting of shareholders, which was filed with the SEC on June 25, 2025, including under the headings “Item 1 – Election of
Directors—Information Regarding Nominees,” “Executive Compensation,” “Non-Management Directors’ Compensation,” and “Security Ownership,” and in its Annual Report on Form 10-K for the fiscal year ended April 30, 2025, which was filed
with the SEC on June 25, 2025, including under the heading “Executive Officers of the Registrant.” Additional information regarding ownership of American Woodmark securities by its directors and executive officers is included in each
person’s beneficial ownership reports on Forms 3, 4 and 5, as filed with the SEC. Other information regarding the participants in the proxy solicitations and a description of their direct and indirect interests, by security holdings or
otherwise, will be contained in the definitive joint proxy statement/prospectus included in the Registration Statement, and other relevant materials to be filed with the SEC regarding the transaction when such materials become
available. Investors should read the Registration Statement and the joint proxy statement/prospectus carefully if and when these become available before making any voting or investment decisions. You may obtain free copies of these
documents from MasterBrand or American Woodmark using the sources indicated above. 3
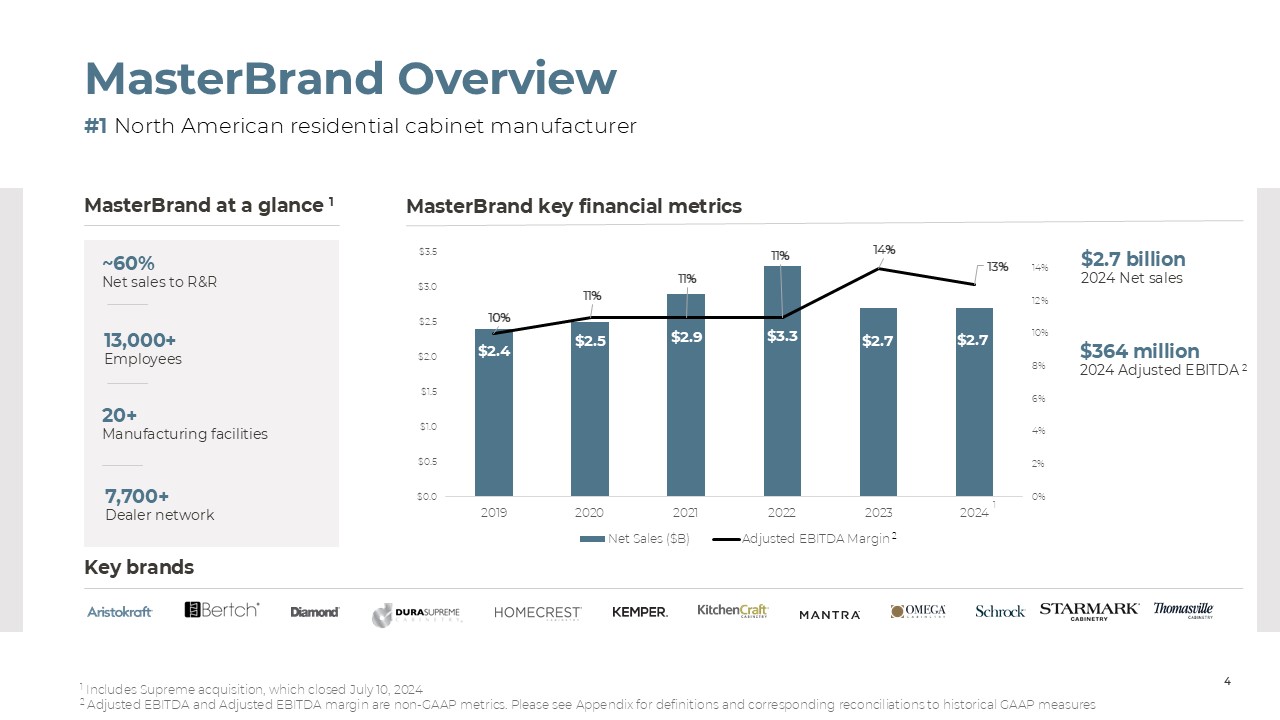
MasterBrand Overview #1 North American residential cabinet manufacturer
Key brands 1 Includes Supreme acquisition, which closed July 10, 2024 2 Adjusted EBITDA and Adjusted EBITDA margin are non-GAAP metrics. Please see Appendix for definitions and corresponding reconciliations to historical GAAP
measures MasterBrand at a glance 1 ~60%Net sales to R&R 7,700+Dealer network $364 million 2024 Adjusted EBITDA 2 13,000+Employees 20+Manufacturing facilities MasterBrand key financial metrics 4 1 $2.7 billion 2024 Net
sales 2
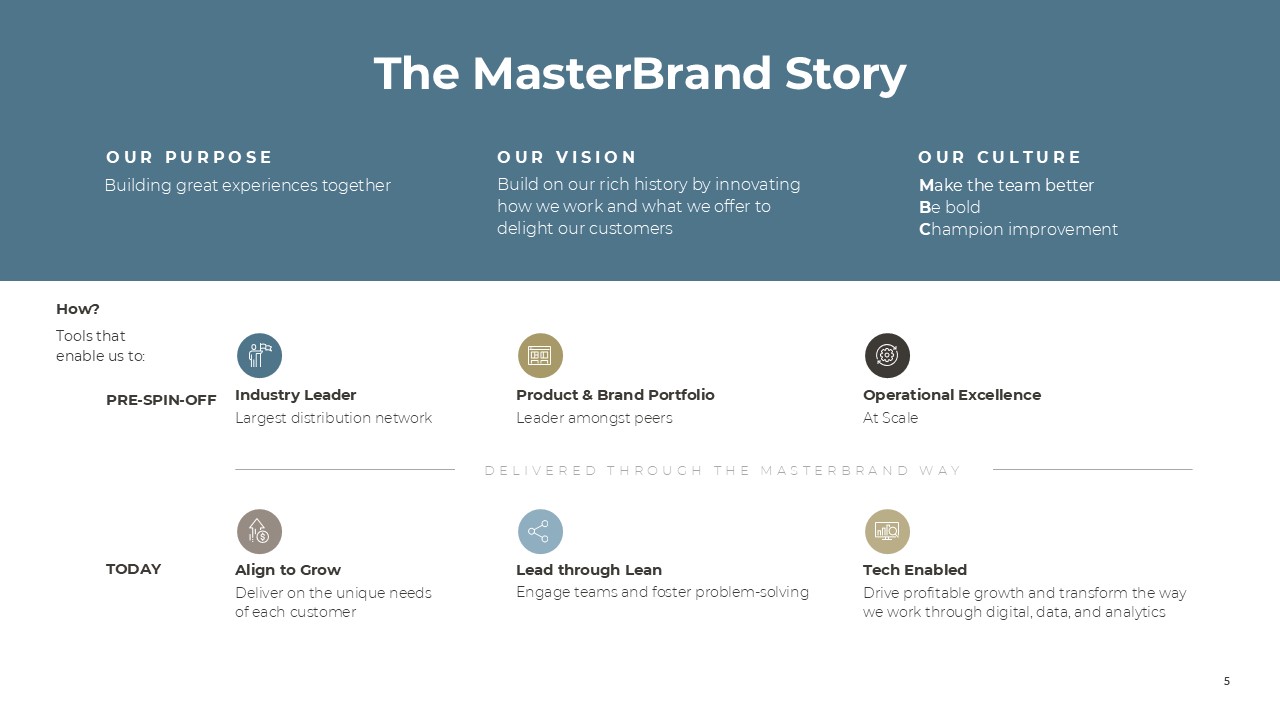
The MasterBrand Story Building great experiences together OUR
PURPOSE How? Tools that enable us to: Lead through Lean Engage teams and foster problem-solving Align to Grow Deliver on the unique needs of each customer Tech Enabled Drive profitable growth and transform the way we work
through digital, data, and analytics DELIVERED THROUGH THE MASTERBRAND WAY Build on our rich history by innovating how we work and what we offer to delight our customers OUR VISION Make the team better Be boldChampion
improvement OUR CULTURE 5 PRE-SPIN-OFF TODAY Industry Leader Largest distribution network Product & Brand Portfolio Leader amongst peers Operational Excellence At Scale

CSR HIGHLIGHTS 6
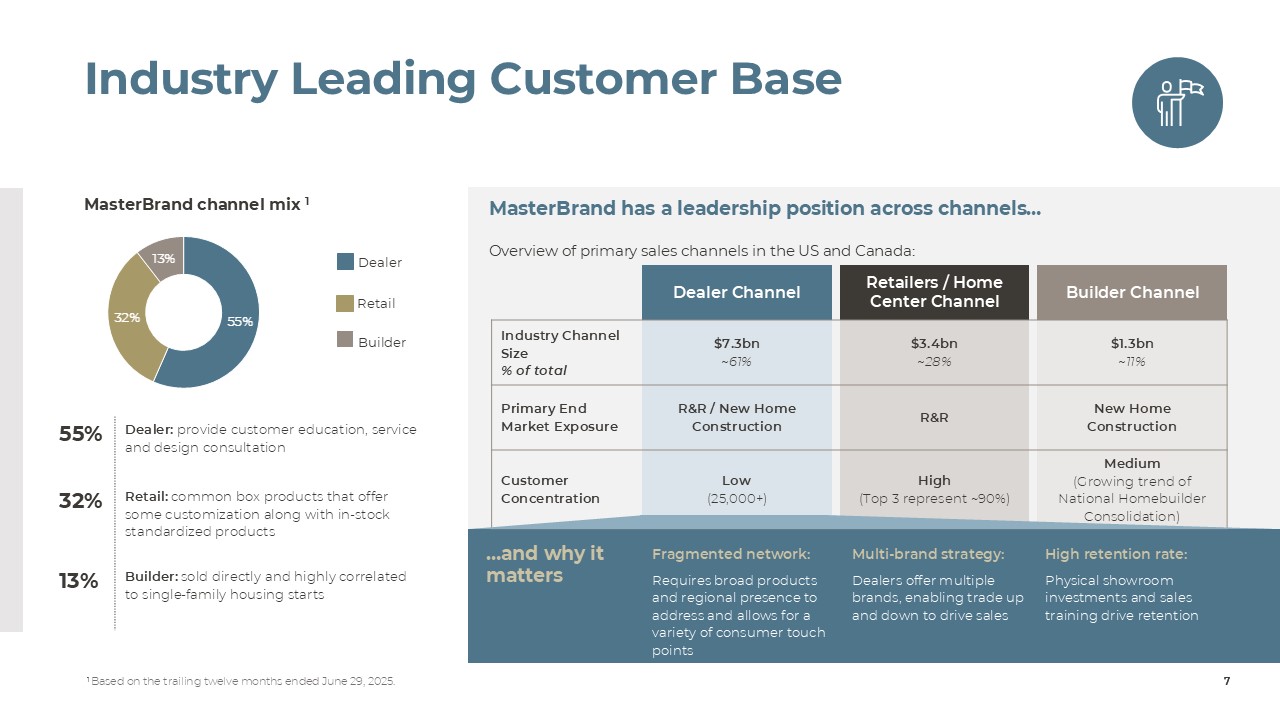
Industry Leading Customer Base 7 MasterBrand channel mix
1 55% Dealer: provide customer education, service and design consultation 32% Retail: common box products that offer some customization along with in-stock standardized products 13% Builder: sold directly and highly correlated to
single-family housing starts Dealer Retail Builder 7 MasterBrand has a leadership position across channels… Overview of primary sales channels in the US and Canada: Dealer Channel Retailers / Home Center Channel Builder
Channel Industry Channel Size % of total $7.3bn ~61% $3.4bn ~28% $1.3bn ~11% Primary End Market Exposure R&R / New Home Construction R&R New Home Construction Customer Concentration Low (25,000+) High (Top 3
represent ~90%) Medium (Growing trend of National Homebuilder Consolidation) Fragmented network: Requires broad products and regional presence to address and allows for a variety of consumer touch points Multi-brand
strategy: Dealers offer multiple brands, enabling trade up and down to drive sales High retention rate: Physical showroom investments and sales training drive retention …and why it matters 1 Based on the trailing twelve months
ended June 29, 2025.
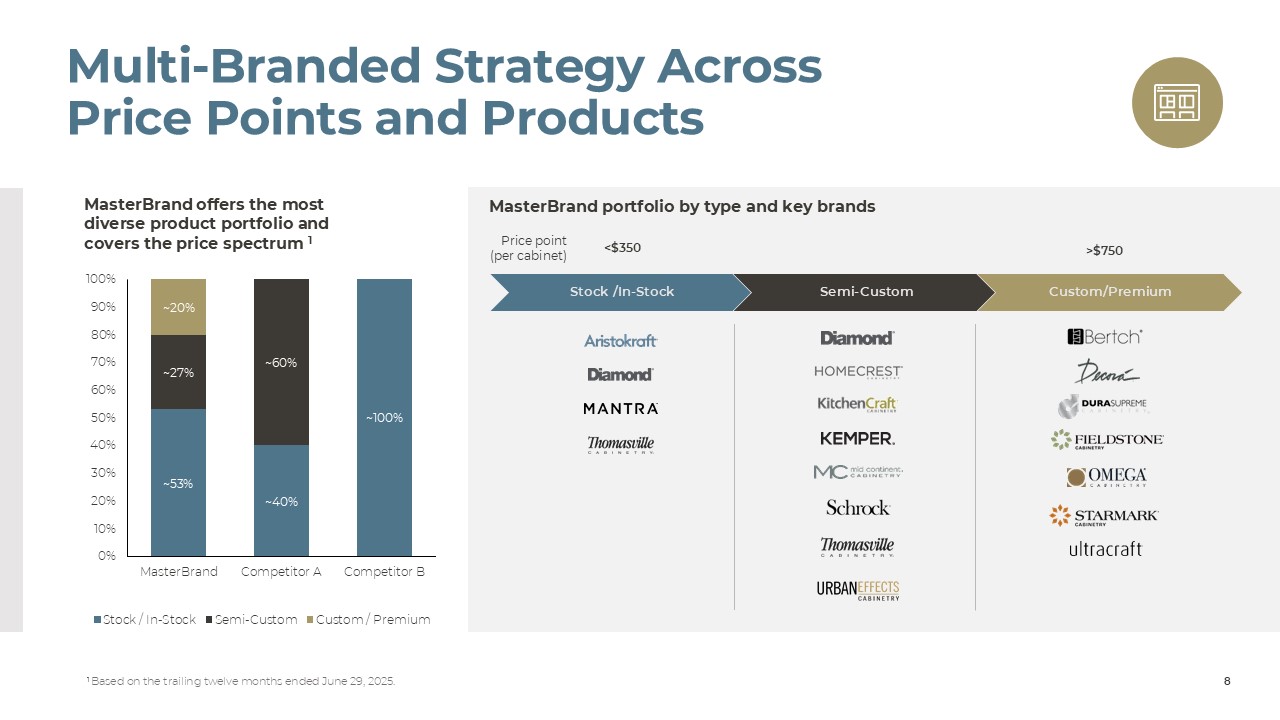
8 Multi-Branded Strategy Across Price Points and Products Price point
(per cabinet) <$350 >$750 MasterBrand portfolio by type and key brands Stock /In-Stock Semi-Custom Custom/Premium MasterBrand offers the most diverse product portfolio and covers the price spectrum 1 1 Based on the
trailing twelve months ended June 29, 2025.
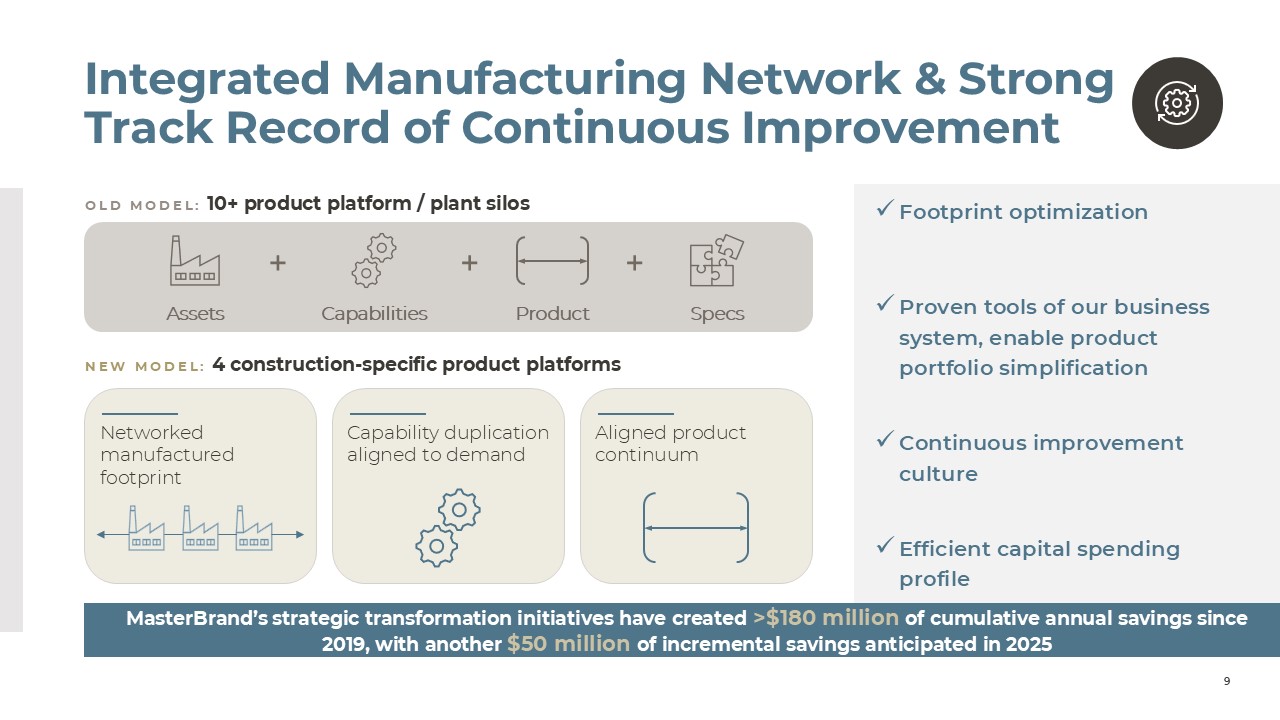
+ + + Integrated Manufacturing Network & Strong Track Record of
Continuous Improvement Footprint optimization Proven tools of our business system, enable product portfolio simplification Continuous improvement culture Efficient capital spending profile 9 MasterBrand’s strategic
transformation initiatives have created >$180 million of cumulative annual savings since 2019, with another $50 million of incremental savings anticipated in 2025 OLD MODEL: 10+ product platform / plant silos NEW MODEL: 4
construction-specific product platforms Assets Capabilities Product Specs Networked manufactured footprint Capability duplication aligned to demand Aligned product continuum
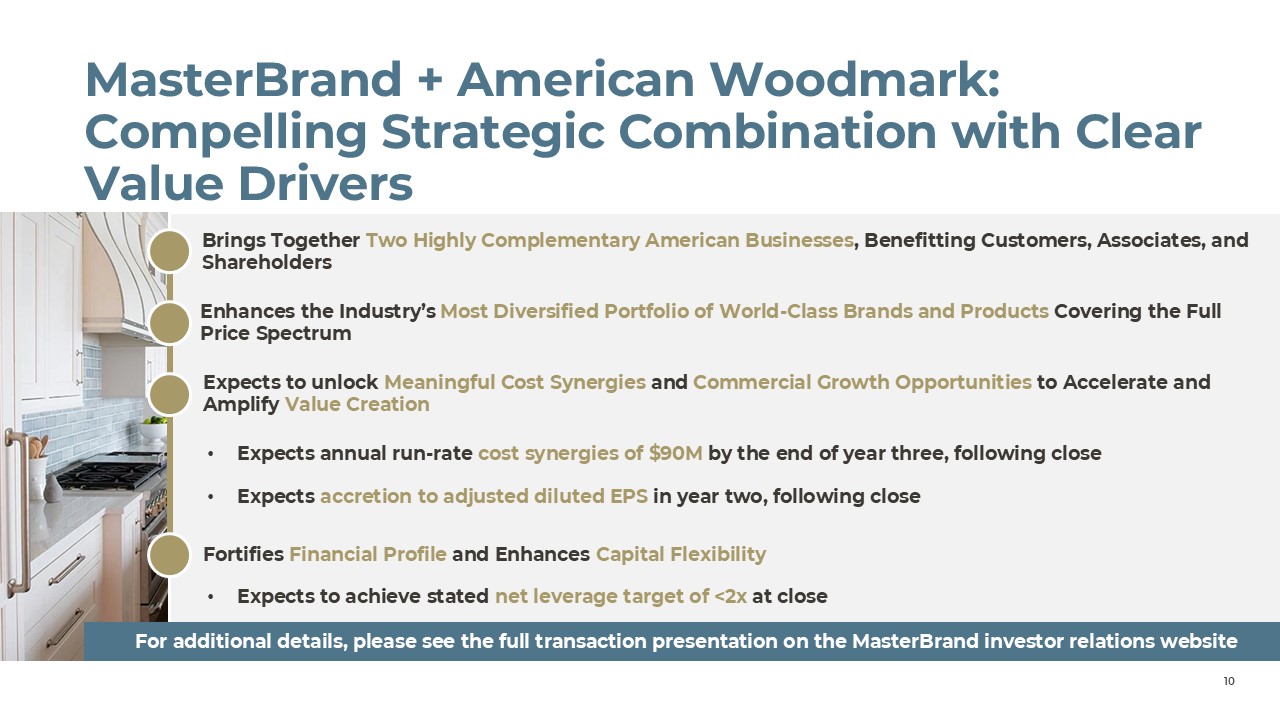
MasterBrand + American Woodmark: Compelling Strategic Combination with
Clear Value Drivers 10 Brings Together Two Highly Complementary American Businesses, Benefitting Customers, Associates, and Shareholders Fortifies Financial Profile and Enhances Capital Flexibility Expects to unlock Meaningful Cost
Synergies and Commercial Growth Opportunities to Accelerate and Amplify Value Creation Expects annual run-rate cost synergies of $90M by the end of year three, following close Expects accretion to adjusted diluted EPS in year two,
following close Expects to achieve stated net leverage target of <2x at close For additional details, please see the full transaction presentation on the MasterBrand investor relations website Enhances the Industry’s Most
Diversified Portfolio of World-Class Brands and Products Covering the Full Price Spectrum
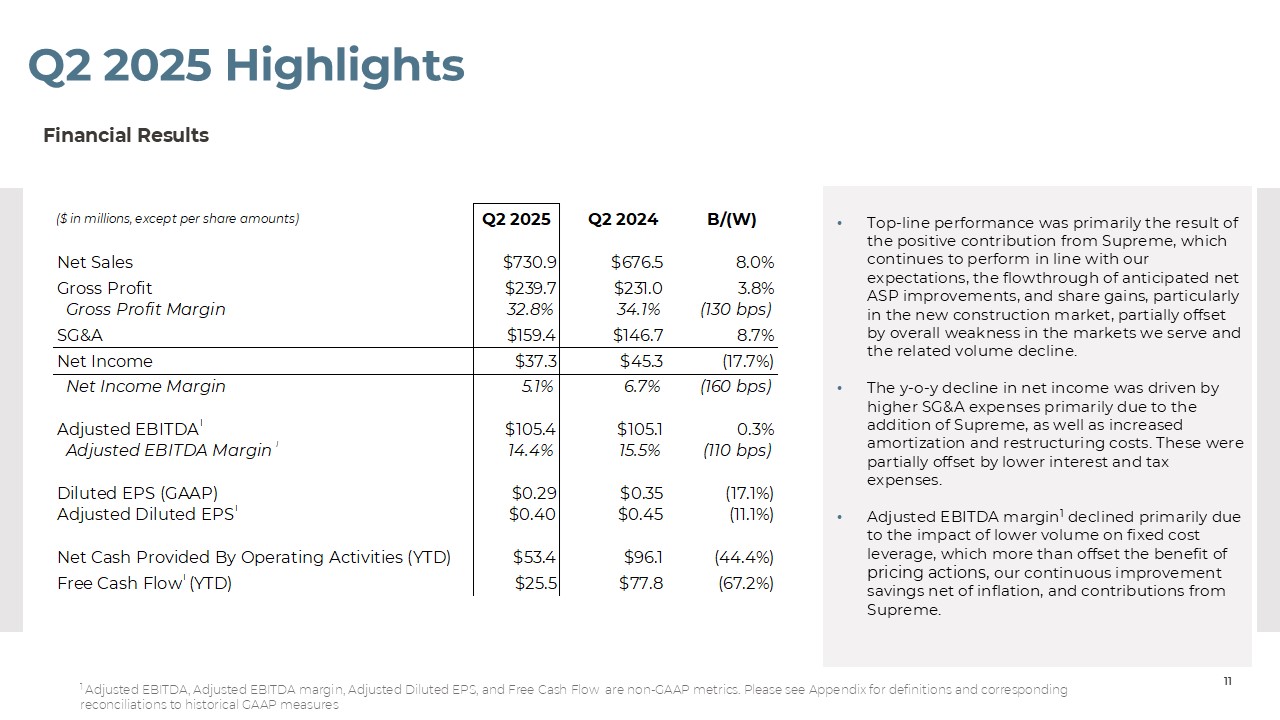
Q2 2025 Highlights Top-line performance was primarily the result of the
positive contribution from Supreme, which continues to perform in line with our expectations, the flowthrough of anticipated net ASP improvements, and share gains, particularly in the new construction market, partially offset by overall
weakness in the markets we serve and the related volume decline. The y-o-y decline in net income was driven by higher SG&A expenses primarily due to the addition of Supreme, as well as increased amortization and restructuring
costs. These were partially offset by lower interest and tax expenses. Adjusted EBITDA margin1 declined primarily due to the impact of lower volume on fixed cost leverage, which more than offset the benefit of pricing actions, our
continuous improvement savings net of inflation, and contributions from Supreme. 11 Financial Results 1 Adjusted EBITDA, Adjusted EBITDA margin, Adjusted Diluted EPS, and Free Cash Flow are non-GAAP metrics. Please see Appendix for
definitions and corresponding reconciliations to historical GAAP measures
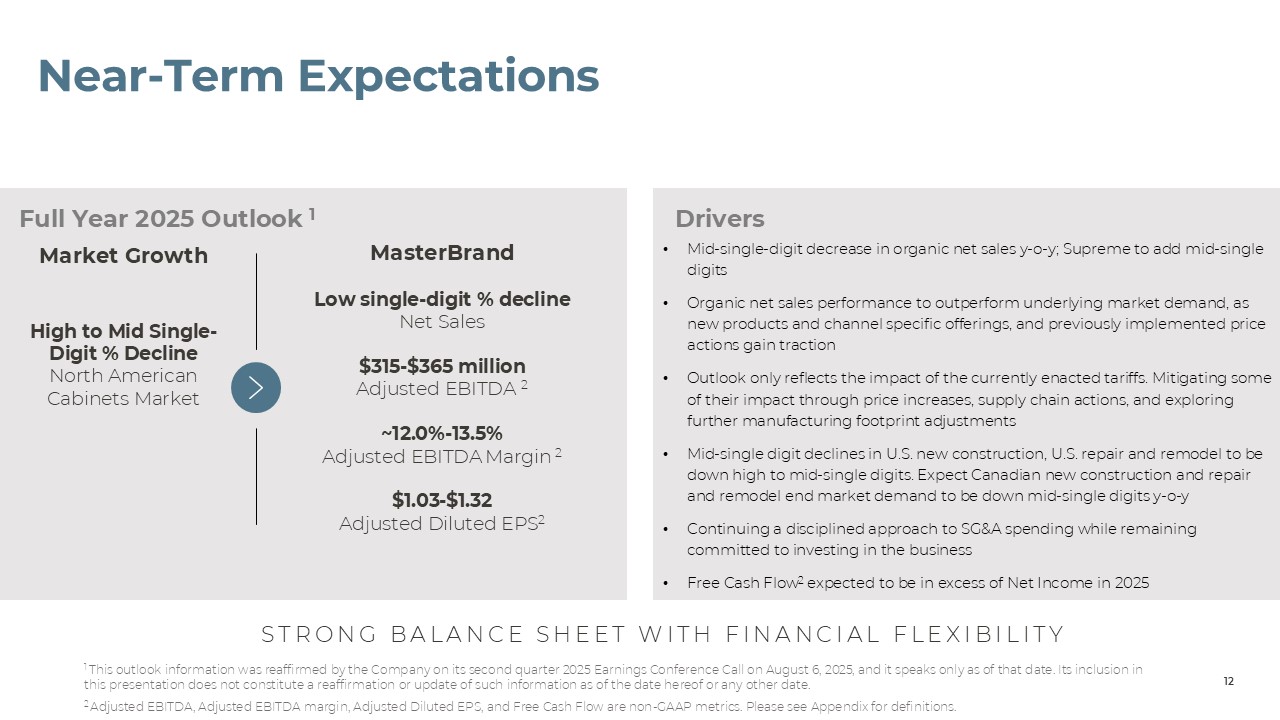
Near-Term Expectations Full Year 2025 Outlook 1 Mid-single-digit
decrease in organic net sales y-o-y; Supreme to add mid-single digits Organic net sales performance to outperform underlying market demand, as new products and channel specific offerings, and previously implemented price actions gain
traction Outlook only reflects the impact of the currently enacted tariffs. Mitigating some of their impact through price increases, supply chain actions, and exploring further manufacturing footprint adjustments Mid-single digit
declines in U.S. new construction, U.S. repair and remodel to be down high to mid-single digits. Expect Canadian new construction and repair and remodel end market demand to be down mid-single digits y-o-y Continuing a disciplined
approach to SG&A spending while remaining committed to investing in the business Free Cash Flow2 expected to be in excess of Net Income in 2025 Drivers Market Growth High to Mid Single-Digit % Decline North American Cabinets
Market MasterBrand Low single-digit % decline Net Sales $315-$365 million Adjusted EBITDA 2 ~12.0%-13.5% Adjusted EBITDA Margin 2 $1.03-$1.32 Adjusted Diluted EPS2 STRONG BALANCE SHEET WITH FINANCIAL FLEXIBILITY 12 1 This
outlook information was reaffirmed by the Company on its second quarter 2025 Earnings Conference Call on August 6, 2025, and it speaks only as of that date. Its inclusion in this presentation does not constitute a reaffirmation or
update of such information as of the date hereof or any other date. 2 Adjusted EBITDA, Adjusted EBITDA margin, Adjusted Diluted EPS, and Free Cash Flow are non-GAAP metrics. Please see Appendix for definitions.
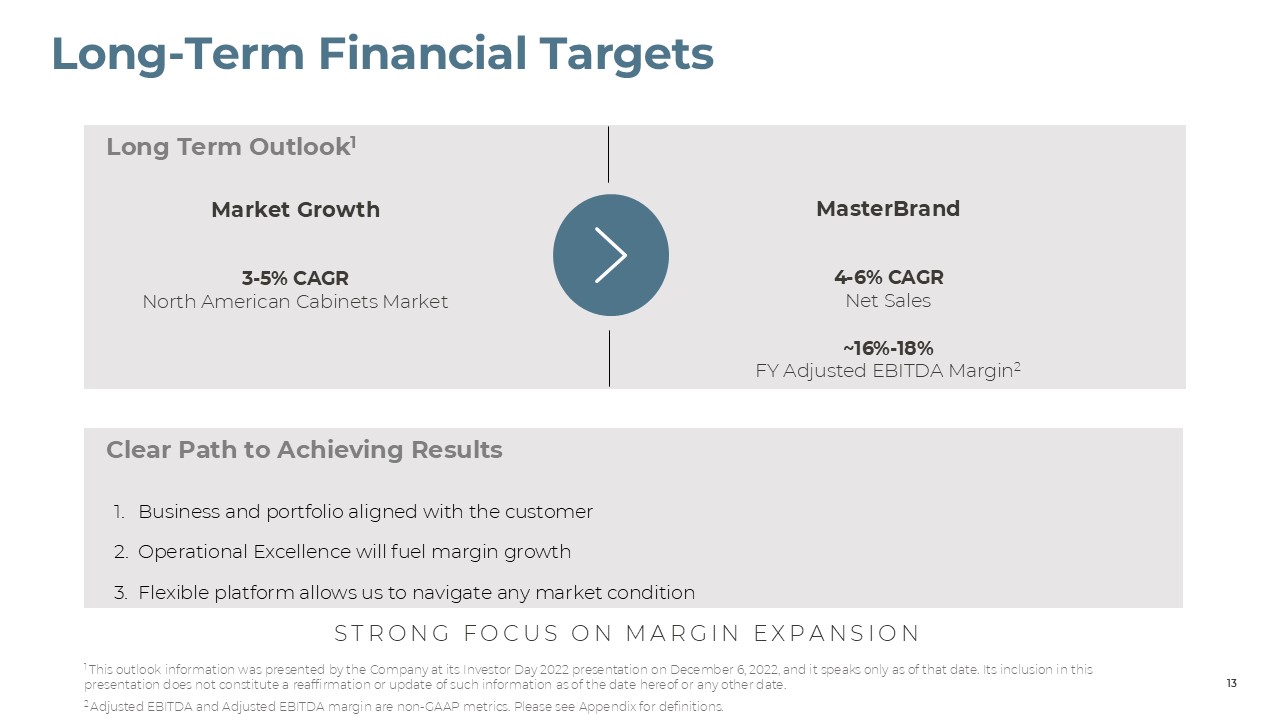
Long-Term Financial Targets Long Term Outlook1 Business and portfolio
aligned with the customer Operational Excellence will fuel margin growth Flexible platform allows us to navigate any market condition Clear Path to Achieving Results 1 This outlook information was presented by the Company at its
Investor Day 2022 presentation on December 6, 2022, and it speaks only as of that date. Its inclusion in this presentation does not constitute a reaffirmation or update of such information as of the date hereof or any other date. 2
Adjusted EBITDA and Adjusted EBITDA margin are non-GAAP metrics. Please see Appendix for definitions. Market Growth 3-5% CAGR North American Cabinets Market MasterBrand 4-6% CAGR Net Sales ~16%-18% FY Adjusted EBITDA Margin2
13 STRONG FOCUS ON MARGIN EXPANSION

05 Appendix
Non-GAAP Financial Measures To supplement the financial information
presented in accordance with generally accepted accounting principles in the United States (“GAAP”) in this presentation, certain non-GAAP financial measures as defined under SEC rules have been included. It is our intent to provide
non-GAAP financial information to enhance understanding of our financial information as prepared in accordance with GAAP. Non-GAAP financial measures should be considered in addition to, not as a substitute for, other financial measures
prepared in accordance with GAAP. Our methods of determining these non-GAAP financial measures may differ from the methods used by other companies for these or similar non-GAAP financial measures. Accordingly, these non-GAAP financial
measures may not be comparable to measures used by other companies. We use EBITDA, adjusted EBITDA, adjusted EBITDA margin, adjusted net income, adjusted net income margin, adjusted diluted earnings per share (“adjusted diluted EPS”),
free cash flow, net debt, and net debt to adjusted EBITDA, which are all non-GAAP financial measures. EBITDA is defined as earnings before interest, taxes, depreciation and amortization. We evaluate the performance of our business based
on income before income taxes, but also look to EBITDA as a performance evaluation measure because interest expense is related to corporate functions, as opposed to operations. For that reason, we believe EBITDA is a useful metric to
investors in evaluating our operating results. Adjusted EBITDA is calculated by removing the impact of non-operational results and special items from EBITDA. Adjusted EBITDA margin is calculated as adjusted EBITDA divided by net sales.
Adjusted net income is calculated by removing the impact of non-operational results, including non-cash amortization expense, which is not deemed to be indicative of the results of current or future operations, and special items from
net income. Adjusted net income margin is calculated as adjusted net income divided by net sales. Adjusted diluted EPS is a measure of our diluted earnings per share excluding non-operational results and special items. We believe these
non-GAAP measures are useful to investors as they are representative of our core operations and are used in the management of our business, including decisions concerning the allocation of resources and assessment of performance. Free
cash flow is defined as cash flow from operations less capital expenditures. We believe that free cash flow is a useful measure to investors because it is a meaningful indicator of cash generated from operating activities available for
the execution of our business strategy, and is used in the management of our business, including decisions concerning the allocation of resources and assessment of performance. Net debt is defined as total balance sheet debt less cash
and cash equivalents. We believe this measure is useful to investors as it provides a measure to compare debt less cash and cash equivalents across periods on a consistent basis. Net debt to adjusted EBITDA is calculated by dividing net
debt by the trailing twelve months adjusted EBITDA. Net debt to adjusted EBITDA is used by management to assess our financial leverage and ability to service our debt obligations. As required by SEC rules, detailed reconciliations of
these non-GAAP financial measures to the most directly comparable GAAP measure are included in the appendix of this presentation. We have not provided a reconciliation of our fiscal 2025 adjusted EBITDA, adjusted EBITDA margin and
adjusted diluted EPS guidance because the information needed to reconcile these measures is unavailable due to the inherent difficulty of forecasting the timing or amount of various items that have not yet occurred, including gains and
losses associated with our defined benefit plans and restructuring and other charges, which are excluded from adjusted EBITDA, adjusted EBITDA margin, adjusted net income, adjusted net income margin, and adjusted diluted EPS.
Additionally, estimating such GAAP measures and providing a meaningful reconciliation consistent with the Company’s accounting policies for future periods requires a level of precision that is unavailable for these future periods and
cannot be accomplished without unreasonable effort. Forward-looking non-GAAP measures are estimated consistent with the relevant definitions and assumptions used for historical non-GAAP measures. 15
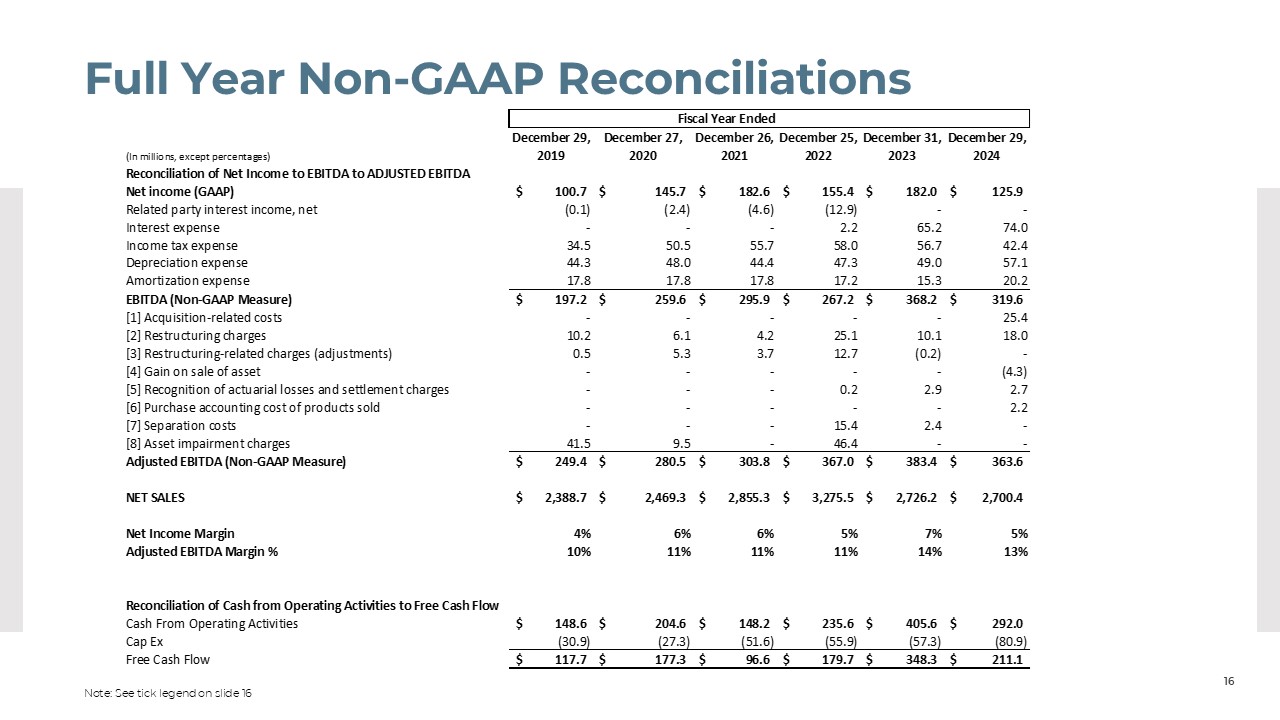
Full Year Non-GAAP Reconciliations 16 Note: See tick legend on slide 16
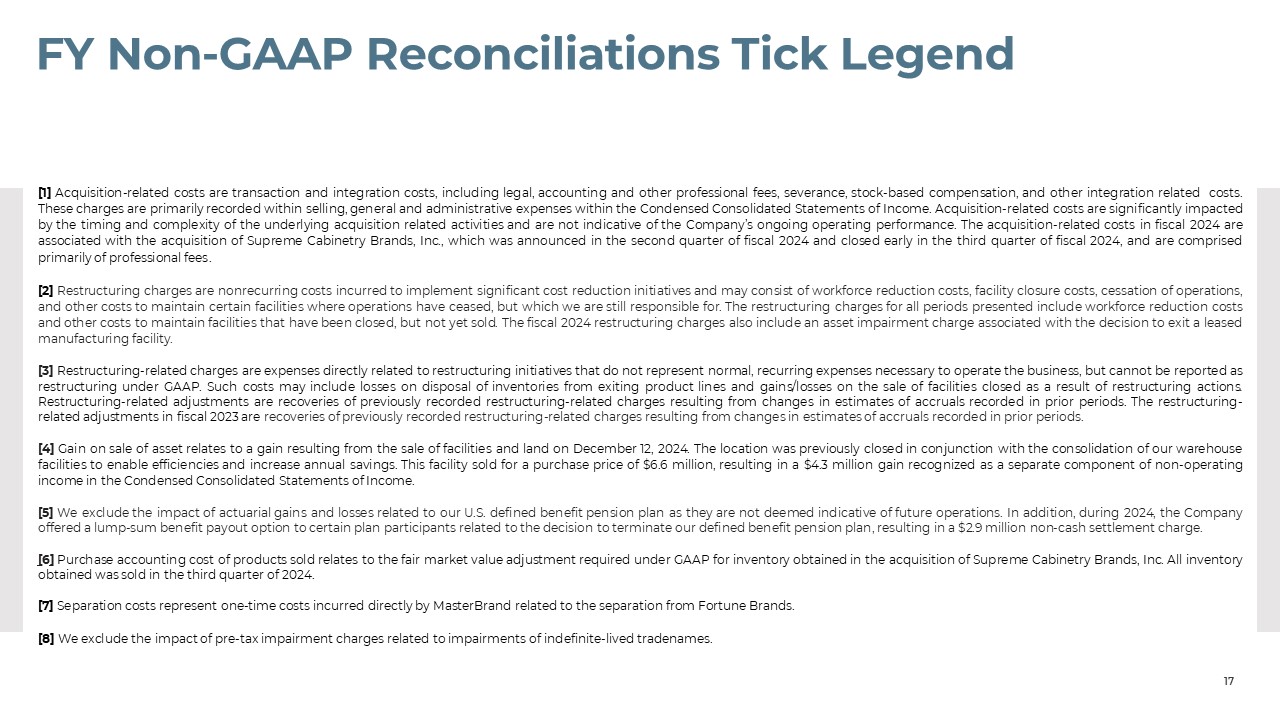
FY Non-GAAP Reconciliations Tick Legend 17 [1] Acquisition-related costs
are transaction and integration costs, including legal, accounting and other professional fees, severance, stock-based compensation, and other integration related costs. These charges are primarily recorded within selling, general and
administrative expenses within the Condensed Consolidated Statements of Income. Acquisition-related costs are significantly impacted by the timing and complexity of the underlying acquisition related activities and are not indicative of
the Company’s ongoing operating performance. The acquisition-related costs in fiscal 2024 are associated with the acquisition of Supreme Cabinetry Brands, Inc., which was announced in the second quarter of fiscal 2024 and closed early
in the third quarter of fiscal 2024, and are comprised primarily of professional fees. [2] Restructuring charges are nonrecurring costs incurred to implement significant cost reduction initiatives and may consist of workforce
reduction costs, facility closure costs, cessation of operations, and other costs to maintain certain facilities where operations have ceased, but which we are still responsible for. The restructuring charges for all periods presented
include workforce reduction costs and other costs to maintain facilities that have been closed, but not yet sold. The fiscal 2024 restructuring charges also include an asset impairment charge associated with the decision to exit a
leased manufacturing facility. [3] Restructuring-related charges are expenses directly related to restructuring initiatives that do not represent normal, recurring expenses necessary to operate the business, but cannot be reported
as restructuring under GAAP. Such costs may include losses on disposal of inventories from exiting product lines and gains/losses on the sale of facilities closed as a result of restructuring actions. Restructuring-related adjustments
are recoveries of previously recorded restructuring-related charges resulting from changes in estimates of accruals recorded in prior periods. The restructuring-related adjustments in fiscal 2023 are recoveries of previously recorded
restructuring-related charges resulting from changes in estimates of accruals recorded in prior periods. [4] Gain on sale of asset relates to a gain resulting from the sale of facilities and land on December 12, 2024. The location
was previously closed in conjunction with the consolidation of our warehouse facilities to enable efficiencies and increase annual savings. This facility sold for a purchase price of $6.6 million, resulting in a $4.3 million gain
recognized as a separate component of non-operating income in the Condensed Consolidated Statements of Income. [5] We exclude the impact of actuarial gains and losses related to our U.S. defined benefit pension plan as they are not
deemed indicative of future operations. In addition, during 2024, the Company offered a lump-sum benefit payout option to certain plan participants related to the decision to terminate our defined benefit pension plan, resulting in a
$2.9 million non-cash settlement charge. [6] Purchase accounting cost of products sold relates to the fair market value adjustment required under GAAP for inventory obtained in the acquisition of Supreme Cabinetry Brands, Inc. All
inventory obtained was sold in the third quarter of 2024. [7] Separation costs represent one-time costs incurred directly by MasterBrand related to the separation from Fortune Brands. [8] We exclude the impact of pre-tax
impairment charges related to impairments of indefinite-lived tradenames.
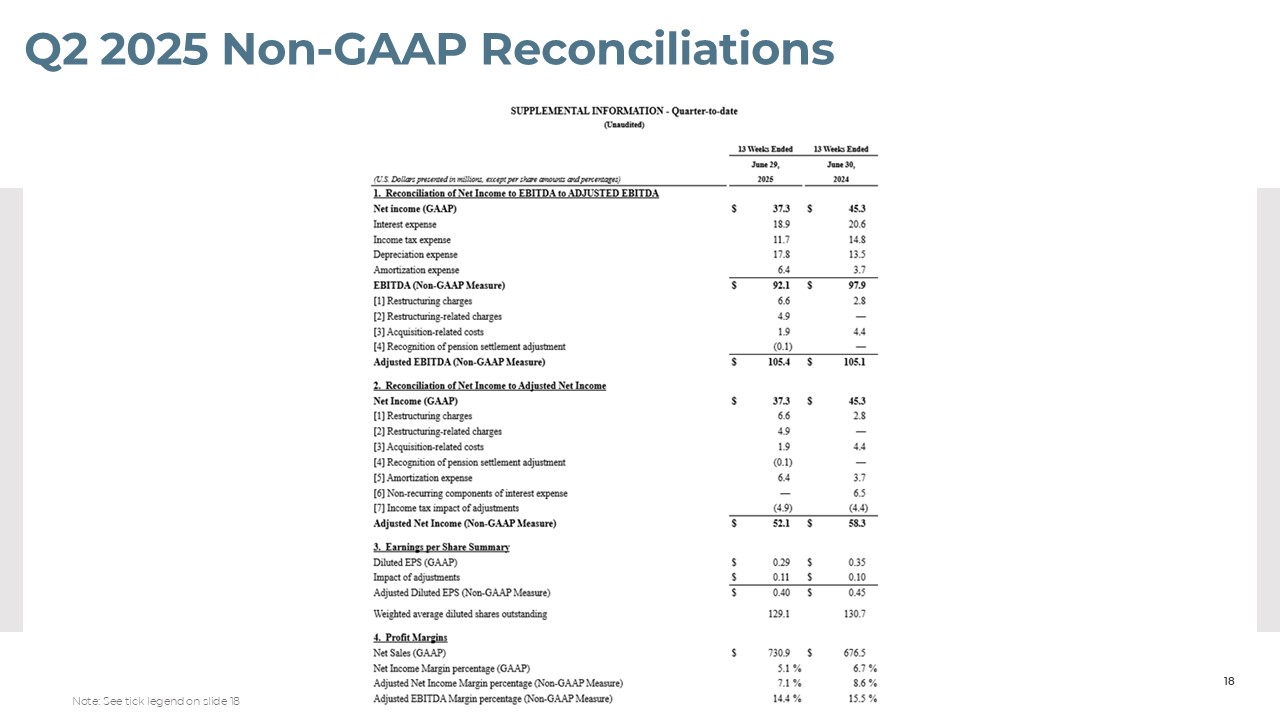
Q2 2025 Non-GAAP Reconciliations 18 Note: See tick legend on slide 18
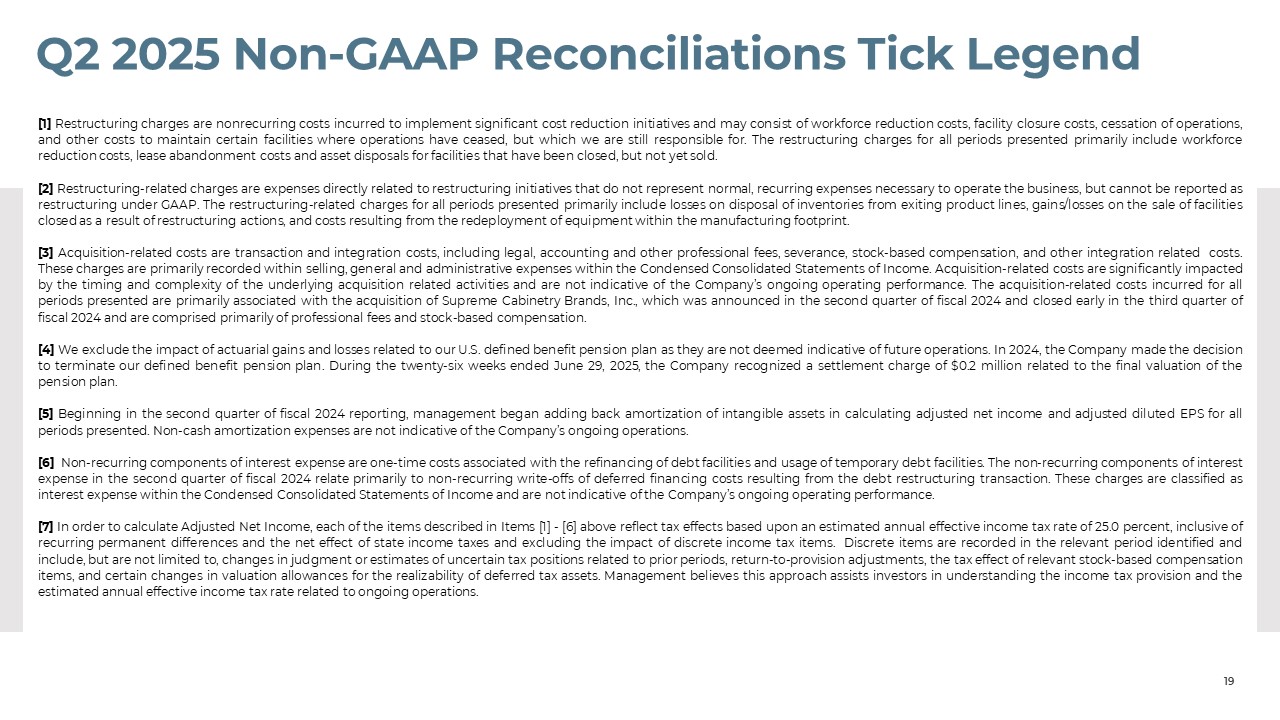
Q2 2025 Non-GAAP Reconciliations Tick Legend 19 [1] Restructuring
charges are nonrecurring costs incurred to implement significant cost reduction initiatives and may consist of workforce reduction costs, facility closure costs, cessation of operations, and other costs to maintain certain facilities
where operations have ceased, but which we are still responsible for. The restructuring charges for all periods presented primarily include workforce reduction costs, lease abandonment costs and asset disposals for facilities that have
been closed, but not yet sold. [2] Restructuring-related charges are expenses directly related to restructuring initiatives that do not represent normal, recurring expenses necessary to operate the business, but cannot be reported as
restructuring under GAAP. The restructuring-related charges for all periods presented primarily include losses on disposal of inventories from exiting product lines, gains/losses on the sale of facilities closed as a result of
restructuring actions, and costs resulting from the redeployment of equipment within the manufacturing footprint. [3] Acquisition-related costs are transaction and integration costs, including legal, accounting and other professional
fees, severance, stock-based compensation, and other integration related costs. These charges are primarily recorded within selling, general and administrative expenses within the Condensed Consolidated Statements of Income.
Acquisition-related costs are significantly impacted by the timing and complexity of the underlying acquisition related activities and are not indicative of the Company’s ongoing operating performance. The acquisition-related costs
incurred for all periods presented are primarily associated with the acquisition of Supreme Cabinetry Brands, Inc., which was announced in the second quarter of fiscal 2024 and closed early in the third quarter of fiscal 2024 and are
comprised primarily of professional fees and stock-based compensation. [4] We exclude the impact of actuarial gains and losses related to our U.S. defined benefit pension plan as they are not deemed indicative of future operations. In
2024, the Company made the decision to terminate our defined benefit pension plan. During the twenty-six weeks ended June 29, 2025, the Company recognized a settlement charge of $0.2 million related to the final valuation of the pension
plan. [5] Beginning in the second quarter of fiscal 2024 reporting, management began adding back amortization of intangible assets in calculating adjusted net income and adjusted diluted EPS for all periods presented. Non-cash
amortization expenses are not indicative of the Company’s ongoing operations. [6] Non-recurring components of interest expense are one-time costs associated with the refinancing of debt facilities and usage of temporary debt
facilities. The non-recurring components of interest expense in the second quarter of fiscal 2024 relate primarily to non-recurring write-offs of deferred financing costs resulting from the debt restructuring transaction. These charges
are classified as interest expense within the Condensed Consolidated Statements of Income and are not indicative of the Company’s ongoing operating performance. [7] In order to calculate Adjusted Net Income, each of the items described
in Items [1] - [6] above reflect tax effects based upon an estimated annual effective income tax rate of 25.0 percent, inclusive of recurring permanent differences and the net effect of state income taxes and excluding the impact of
discrete income tax items. Discrete items are recorded in the relevant period identified and include, but are not limited to, changes in judgment or estimates of uncertain tax positions related to prior periods, return-to-provision
adjustments, the tax effect of relevant stock-based compensation items, and certain changes in valuation allowances for the realizability of deferred tax assets. Management believes this approach assists investors in understanding the
income tax provision and the estimated annual effective income tax rate related to ongoing operations.
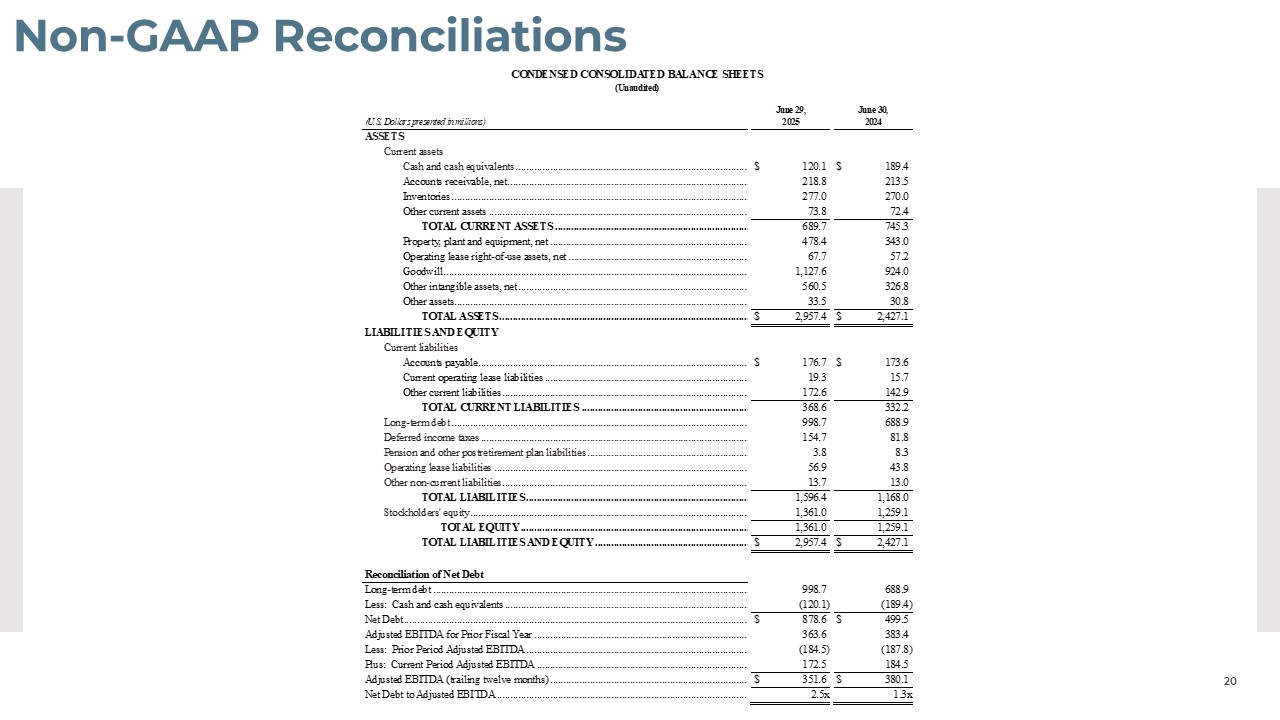
Non-GAAP Reconciliations 20
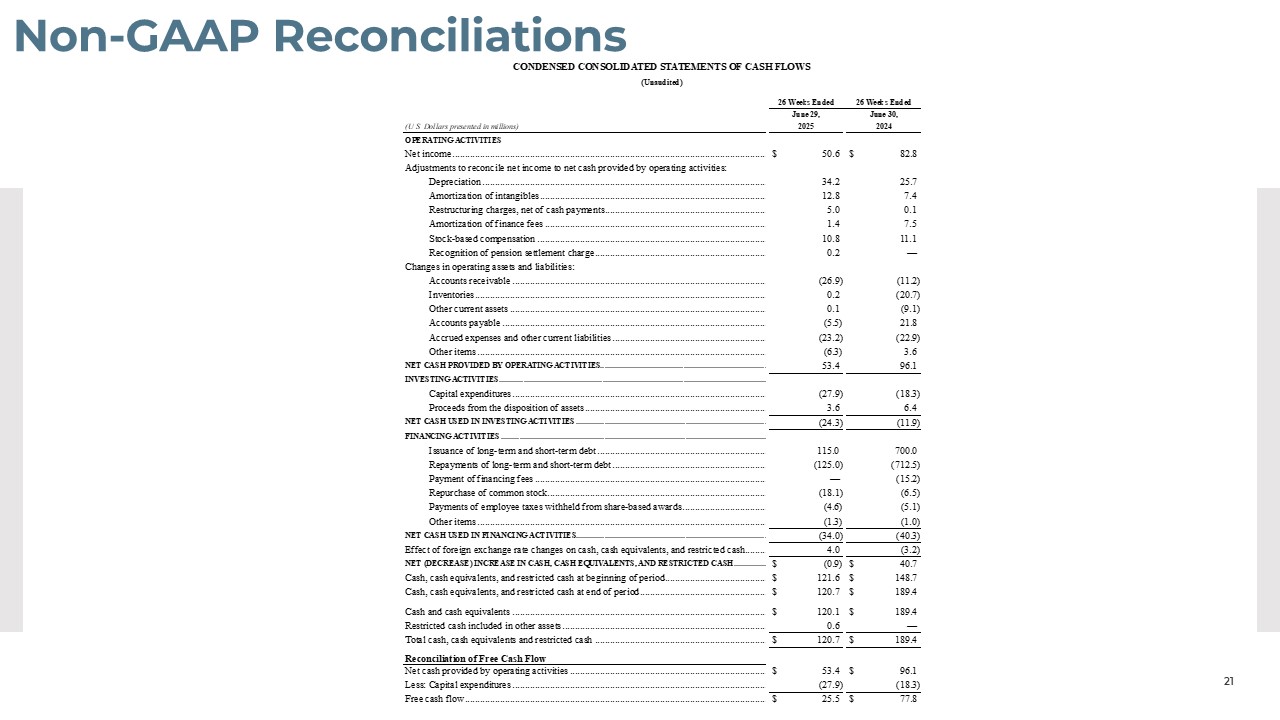
Non-GAAP Reconciliations 21
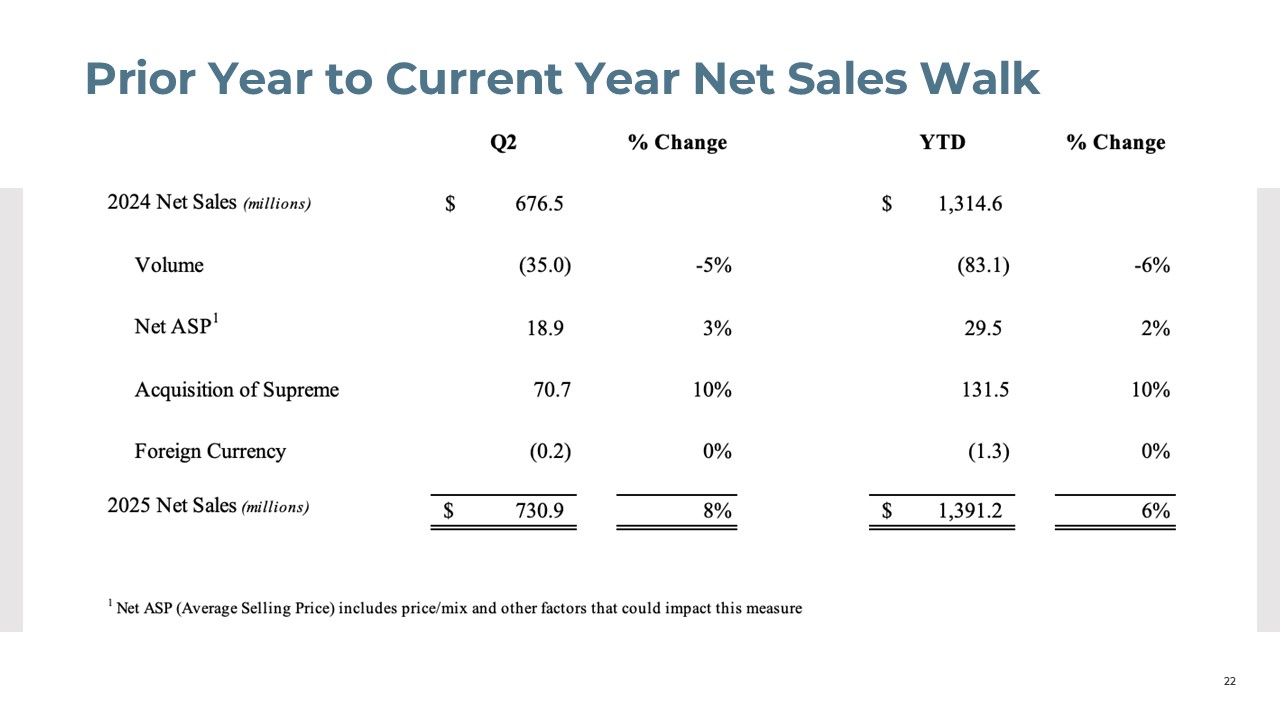
Prior Year to Current Year Net Sales Walk 22