2025 Base Case
Island Gold District
NI 43-101 Technical Report
Dubreuilville, Ontario, Canada
Prepared for
181 Bay Street, Suite 3910
Toronto, ON M5J 2T3, Canada
Prepared by
Christopher Bostwick - FAusIMM
Nathan Bourgeault - P.Eng.
Tyler Poulin - P.Geo.
Jeffrey Volk - M.Sc. CPG, FAusIMM
David Bucar - P.Eng.
Effective Date: June 23, 2025
Issue Date: August 6, 2025
| | | | | |
Island Gold District – NI 43-101 Technical Report August 6, 2025 | 1
|
Cautionary Note Regarding Forward-Looking Statements and Information
This report contains or incorporates by reference “forward-looking statements” and “forward-looking information” as defined under applicable Canadian and U.S. securities laws. All statements and information, other than information and statements of historical fact, which address events, results, outcomes or developments that Alamos Gold Inc. (“Alamos” or the “Company”) expects to occur are, or may be deemed to be, forward-looking and are generally, but not always, identified by the use of forward-looking terminology such as “expect”, “assume”, “believe”, “anticipate”, “intend”, “potential”, “proposed”, “plan”, “objective”, “predict”, “estimate”, “scheduled”, “continue”, “ongoing”, “likely”, “future”, “forecast”, “budget”, “target” or variations of such words and phrases and similar expressions or statements that certain actions, events or results “may”, “could”, “would”, “might” or “will” be taken, occur or be achieved or the negative connotation of such terms. Forward-looking statements and information contained in this report are based on information available to Alamos at the time of preparation of this report; expectations, estimates and projections as of the date of this report; assumptions, conditions and qualifications as set forth in the report; and data, reports and other information supplied to Alamos by third party sources.
Forward-looking statements and information in this report may include, without limitation, guidance and information as to strategy, plans, expectations or future financial or operating performance, pertaining to, or anticipated to result from, the Island Gold District, such as expectations, assumptions, estimations and guidance regarding: integration of the Island Gold and Magino operations; Mineral Resource and Mineral Reserve estimates; mine and reserve life; mine plans; the Island Gold Phase 3+ project and anticipated timing of progress and completion as well as results therefrom; Island Gold District project infrastructure; project-related risks; project economics; estimates of capital and operating expenditures; the financial model for the integrated Island Gold District; construction of the 115kV powerline; timing of installation and coming online of a 44kV grid power line; Island Gold and Magino sites power integration; water management plan; mined and processed gold grades and weights; market demand for gold and silver; gold and other metal prices; foreign exchange rates; gold metallurgical recovery rates; mining methodologies and results; equipment requirements; recovery methods; use of the Magino mill; mining, processing and milling rates; production rates; mine production schedules; life of mine production physicals; planned exploration activities; environmental studies, permitting and social and community impact; the Company’s approach to sustainability; mine closure; reclamation; and other statements that express management’s expectations or estimates of future performance, operational, geological or financial results.
Alamos cautions that forward-looking statements are necessarily based upon a number of factors and assumptions that, while considered reasonable by the Company at the time of making such statements, are inherently subject to significant business, economic, technical, legal, political and competitive uncertainties and contingencies. Known and unknown factors could cause actual results to differ materially from those projected in the forward-looking statements and undue reliance should not be placed on such statements and information.
Risk factors that may affect Alamos’ ability to achieve the expectations set forth in the forward-looking statements in this document include, but are not limited to: assumptions and parameters underlying the life of mine not being realized; a decrease in the future gold price; discrepancies between actual and estimated production; discrepancies related to the impact of various capital projects and the anticipated benefits therein; required capital investments; estimates of net present value and internal rate of returns; changes to tax rates; the accuracy of or changes to current estimates of Mineral Reserve and Mineral Resources changes to capital and operating cost estimates and the assumptions on which such estimates are based; changes to production estimates (which assume accuracy of projected ore grade, mining rates, recovery timing and recovery rate estimates which may be impacted by unscheduled maintenance, weather issues, labour and contractor availability and other operating or technical difficulties); operations may be exposed to illnesses, diseases, epidemics and pandemics; the impact of any illness, disease, epidemic or pandemic on the broader market and the trading price of the Company's shares; provincial and federal orders or mandates (including with respect to mining operations generally or auxiliary businesses or services required for the Company’s operations) in Canada, Mexico, the United States and
| | | | | |
Island Gold District – NI 43-101 Technical Report August 6, 2025 | 2
|
Türkiye; the duration of any regulatory responses to any illness, disease, epidemic or pandemic; government and the Company’s attempts to reduce the spread of any illness, disease, epidemic or pandemic which may affect many aspects of the Company's operations including the ability to transport personnel to and from site, contractor and supply availability and the ability to sell or deliver gold doré bars; fluctuations in the price of gold or certain other commodities such as, diesel fuel, natural gas, and electricity; changes in foreign exchange rates (particularly CAD, MXN, USD and Turkish lira); the impact of inflation and any tariffs, trade barriers and/or regulatory costs; changes in the Company's credit rating; any decision to declare a quarterly dividend; employee and community relations; litigation and administrative proceedings; disruptions affecting operations; availability of and increased costs associated with mining inputs and labour; delays with the Phase 3+ Expansion project at the Island Gold mine, construction of the Lynn Lake Project, construction of the PDA project, and/or the development or updating of mine plans; risks associated with the start-up of new mines; the risk that the Company’s mines may not perform as planned; uncertainty with the Company’s ability to secure additional capital to execute its business plans; the speculative nature of mineral exploration and development, including the risks of obtaining and maintaining necessary licenses and permits, including the necessary licenses, permits, authorizations and/or approvals from the appropriate regulatory authorities for the Company’s development stage and operating assets; labour and contractor availability (and being able to secure the same on favourable terms); contests over title to properties; expropriation or nationalization of property; political and economic developments; inherent risks and hazards associated with mining and mineral processing including environmental hazards, industrial hazards, industrial accidents, unusual or unexpected formations, pressures and cave-ins; changes in national and local government legislation, controls or regulations in Canada, Mexico, Türkiye, the United States and other jurisdictions in which the Company does or may carry on business in the future; increased costs and risks related to the potential impact of climate change; failure to comply with environmental and health and safety laws and regulations; disruptions in the maintenance or provision of required infrastructure and information technology systems; risk of loss due to sabotage, protests and other civil disturbances; the impact of global liquidity and credit availability and the values of assets and liabilities based on projected future cash flows; risks arising from holding derivative instruments; and business opportunities that may be pursued by the Company.
Additional risk factors and details with respect to risk factors that may affect the Company’s ability to achieve the expectations set forth in the forward-looking statements contained in this Technical Report are set out in the Company's latest 40-F/Annual Information Form and Management’s Discussion and Analysis under the heading “Risk Factors”, which is available on the SEDAR+ website at www.sedarplus.ca or on EDGAR at www.sec.gov. The foregoing should be reviewed in conjunction with the information, risk factors and assumptions found in this Technical Report.
The Company and the Qualified Persons who authored the Technical Report disclaim any intention and undertake no obligation to update publicly or otherwise revise any forward-looking statements or information contained herein whether as a result of new information or future events or otherwise, except as may be required by law.
Cautionary Note to U.S. Investors
Alamos prepares its disclosure in accordance with the requirements of securities laws in effect in Canada. Unless otherwise indicated, all Mineral Resource and Mineral Reserve estimates included in this document have been prepared in accordance with National Instrument 43-101 - Standards of Disclosure for Mineral Projects (“NI 43-101”) and the Canadian Institute of Mining, Metallurgy and Petroleum (the “CIM”) - CIM Definition Standards on Mineral Resources and Mineral Reserves, adopted by the CIM Council, as amended (the “CIM Standards”). NI 43-101 is a rule developed by the Canadian Securities Administrators, which established standards for all public disclosure an issuer makes of scientific and technical information concerning mineral projects. Mining disclosure in the United States was previously required to comply with SEC Industry Guide 7 (“SEC Industry Guide 7”) under the United States Securities Exchange Act of 1934, as amended. The U.S. Securities and Exchange Commission (the “SEC”) has adopted final rules, to replace SEC Industry Guide 7 with new mining disclosure rules under sub-part 1300 of Regulation S-K of the U.S. Securities Act (“Regulation S-K 1300”) which became mandatory for U.S.
| | | | | |
Island Gold District – NI 43-101 Technical Report August 6, 2025 | 3
|
reporting companies beginning with the first fiscal year commencing on or after January 1, 2021. Under Regulation S-K 1300, the SEC now recognizes estimates of “Measured Mineral Resources”, “Indicated Mineral Resources” and “Inferred Mineral Resources”. In addition, the SEC has amended its definitions of “Proven Mineral Reserves” and “Probable Mineral Reserves” to be substantially similar to international standards.
Investors are cautioned that while the above terms are “substantially similar” to CIM Definitions, there are differences in the definitions under Regulation S-K 1300 and the CIM Standards. Accordingly, there is no assurance any mineral reserves or mineral resources that Alamos may report as “proven mineral reserves”, “probable mineral reserves”, “measured mineral resources”, “indicated mineral resources” and “inferred mineral resources” under NI 43-101 would be the same had Alamos prepared the mineral reserve or mineral resource estimates under the standards adopted under Regulation S-K 1300. U.S. investors are also cautioned that while the SEC recognizes “measured mineral resources”, “indicated mineral resources” and “inferred mineral resources” under Regulation S-K 1300, investors should not assume that any part or all of the mineralization in these categories will ever be converted into a higher category of mineral resources or into mineral reserves. Mineralization described using these terms has a greater degree of uncertainty as to its existence and feasibility than mineralization that has been characterized as reserves. Accordingly, investors are cautioned not to assume that any measured mineral resources, indicated mineral resources, or inferred mineral resources that Alamos reports are or will be economically or legally mineable.
Cautionary non-GAAP Measures and Additional GAAP Measures
Note that for purposes of this section, GAAP refers to IFRS. The Company believes that investors use certain non-GAAP and additional GAAP measures as indicators to assess gold mining companies. They are intended to provide additional information and should not be considered in isolation or as a substitute for measures of performance prepared with GAAP. “Cash flow from operating activities before changes in non-cash working capital” is a non-GAAP performance measure that could provide an indication of the Company’s ability to generate cash flows from operations and is calculated by adding back the change in non-cash working capital to “cash provided by (used in) operating activities” as presented on the Company’s consolidated statements of cash flows. “Cash flow per share” is calculated by dividing “cash flow from operations before changes in working capital” by the weighted average number of shares outstanding for the period. “Free cash flow” is a non-GAAP performance measure that is calculated as cash flows from operations net of cash flows invested in mineral property, plant and equipment and exploration and evaluation assets as presented on the Company’s consolidated statements of cash flows and that would provide an indication of the Company’s ability to generate cash flows from its mineral projects. “Mine site free cash flow” is a non-GAAP measure which includes cash flow from operating activities at, less capital expenditures at each mine site. “Return on equity” is defined as earnings from continuing operations divided by the average total equity for the current and previous year. “Mining cost per tonne of ore” and “cost per tonne of ore” are non-GAAP performance measures that could provide an indication of the mining and processing efficiency and effectiveness of the mine. These measures are calculated by dividing the relevant mining and processing costs and total costs by the tonnes of ore processed in the period. “Cost per tonne of ore” is usually affected by operating efficiencies and waste-to-ore ratios in the period. “Total capital expenditures per ounce produced” is a non-GAAP term used to assess the level of capital intensity of a project and is calculated by taking the total growth and sustaining capital of a project divided by ounces produced life of mine. “Growth capital” are expenditures primarily incurred at development projects and costs related to major projects at existing operations, where the projects will materially benefit the mine site. “Sustaining capital” are expenditures that do not increase annual gold ounce production at a mine site and excludes all expenditures at the Company’s development projects. “Total cash costs per ounce”, “all-in sustaining costs per ounce”, “mine-site all-in sustaining costs”, and “all-in costs per ounce” as used in this analysis are non-GAAP terms typically used by gold mining companies to assess the level of gross margin available to the Company by subtracting these costs from the unit price realized during the period. These non-GAAP terms are also used to assess the ability of a mining company to generate cash flow from operations. There may be some variation in the method of computation of these metrics as determined by the Company compared with other mining
| | | | | |
Island Gold District – NI 43-101 Technical Report August 6, 2025 | 4
|
companies. In this context, “total cash costs” reflects mining and processing costs allocated from in-process and doré inventory and associated royalties with ounces of gold sold in the period. Total cash costs per ounce are exclusive of exploration costs. “All-in sustaining costs per ounce” include total cash costs, exploration, corporate and administrative, share based compensation and sustaining capital costs. “Mine-site all-in sustaining costs” include total cash costs, exploration, and sustaining capital costs for the mine-site, but exclude an allocation of corporate and administrative and share based compensation. “Capitalized exploration” are expenditures that meet the IFRS definition for capitalization and are incurred to further expand the known Mineral Reserve and Resource at existing operations or development projects. “Adjusted net earnings” and “adjusted earnings per share” are non-GAAP financial measures with no standard meaning under IFRS. “Adjusted net earnings” excludes the following from net earnings: foreign exchange gain (loss), items included in other loss, certain non-reoccurring items and foreign exchange gain (loss) recorded in deferred tax expense. “Adjusted earnings per share” is calculated by dividing “adjusted net earnings” by the weighted average number of shares outstanding for the period.
Additional GAAP measures that are presented on the face of the Company’s consolidated statements of comprehensive income and are not meant to be a substitute for other subtotals or totals presented in accordance with IFRS, but rather should be evaluated in conjunction with such IFRS measures. This includes “Earnings from operations”, which is intended to provide an indication of the Company’s operating performance and represents the amount of earnings before net finance income/expense, foreign exchange gain/loss, other income/loss, and income tax expense. Non-GAAP and additional GAAP measures do not have a standardized meaning prescribed under IFRS and therefore may not be comparable to similar measures presented by other companies. A reconciliation of historical non-GAAP and additional GAAP measures are detailed in the Company’s Management’s Discussion and Analysis available at www.alamosgold.com.
| | | | | |
Island Gold District – NI 43-101 Technical Report August 6, 2025 | 5
|
TABLE OF CONTENTS
| | | | | |
Island Gold District – NI 43-101 Technical Report August 6, 2025 | 6
|
| | | | | |
Island Gold District – NI 43-101 Technical Report August 6, 2025 | 7
|
| | | | | |
Island Gold District – NI 43-101 Technical Report August 6, 2025 | 8
|
LIST OF TABLES
| | | | | |
Island Gold District – NI 43-101 Technical Report August 6, 2025 | 9
|
| | | | | |
Island Gold District – NI 43-101 Technical Report August 6, 2025 | 10
|
| | | | | |
Island Gold District – NI 43-101 Technical Report August 6, 2025 | 11
|
LIST OF FIGURES
| | | | | |
Island Gold District – NI 43-101 Technical Report August 6, 2025 | 12
|
| | | | | |
Island Gold District – NI 43-101 Technical Report August 6, 2025 | 13
|
| | | | | |
Island Gold District – NI 43-101 Technical Report August 6, 2025 | 14
|
1 SUMMARY
1.1 Introduction
On 12 July 2024, Alamos Gold Inc. (Alamos or Alamos Gold or the Company) completed the acquisition of Argonaut Gold Inc. (Argonaut) and its Magino Mine (Magino) located next to Alamos’ Island Gold Mine (Island Gold), located in Northern Ontario, Canada. Having since successfully integrated the Island Gold and Magino operations into a combined operating entity, the Island Gold District (District), Alamos, in a press release dated June 23rd, 2025, announced the results of its Base Case Life of Mine Plan completed on the District. This report outlines the Base Case Life of Mine Plan and conforms to National Instrument 43-101 Standards of Disclosure of Mineral Projects (NI 43-101).
This Report will provide an update on several aspects of the District, including:
•Status of the integration of the Island Gold and Magino operations;
•The planned Magino mill expansion to 11,200 tpd and further on to 12,400 tpd;
•An updated Mineral Resource estimate;
•Updated mine plans, based on Proven and Probable Mineral Reserves, and resultant Mineral Reserve estimate;
•Status of Island Gold Phase 3+ Expansion development work consisting of shaft complex, shaft, paste plant, and underground expansion from 1,200 tpd to 2,400 tpd, completed to date;
•Updated estimates of capital and operating expenditures; and
•Updated financial model for the integrated District, based on Proven and Probable Mineral Reserves.
Island Gold utilized the services of internal resources and several qualified independent consulting firms to design, engineer and cost various elements of the Report. External resources included: Halyard Inc., Hatch Ltd., Redpath Mining Inc., WSP Global Inc., SLR Consulting Ltd., and Paterson and Cooke.
All costs are in Q1-2025 Canadian dollars (C$) unless otherwise stated.
All units of measurement are in metric, unless otherwise stated.
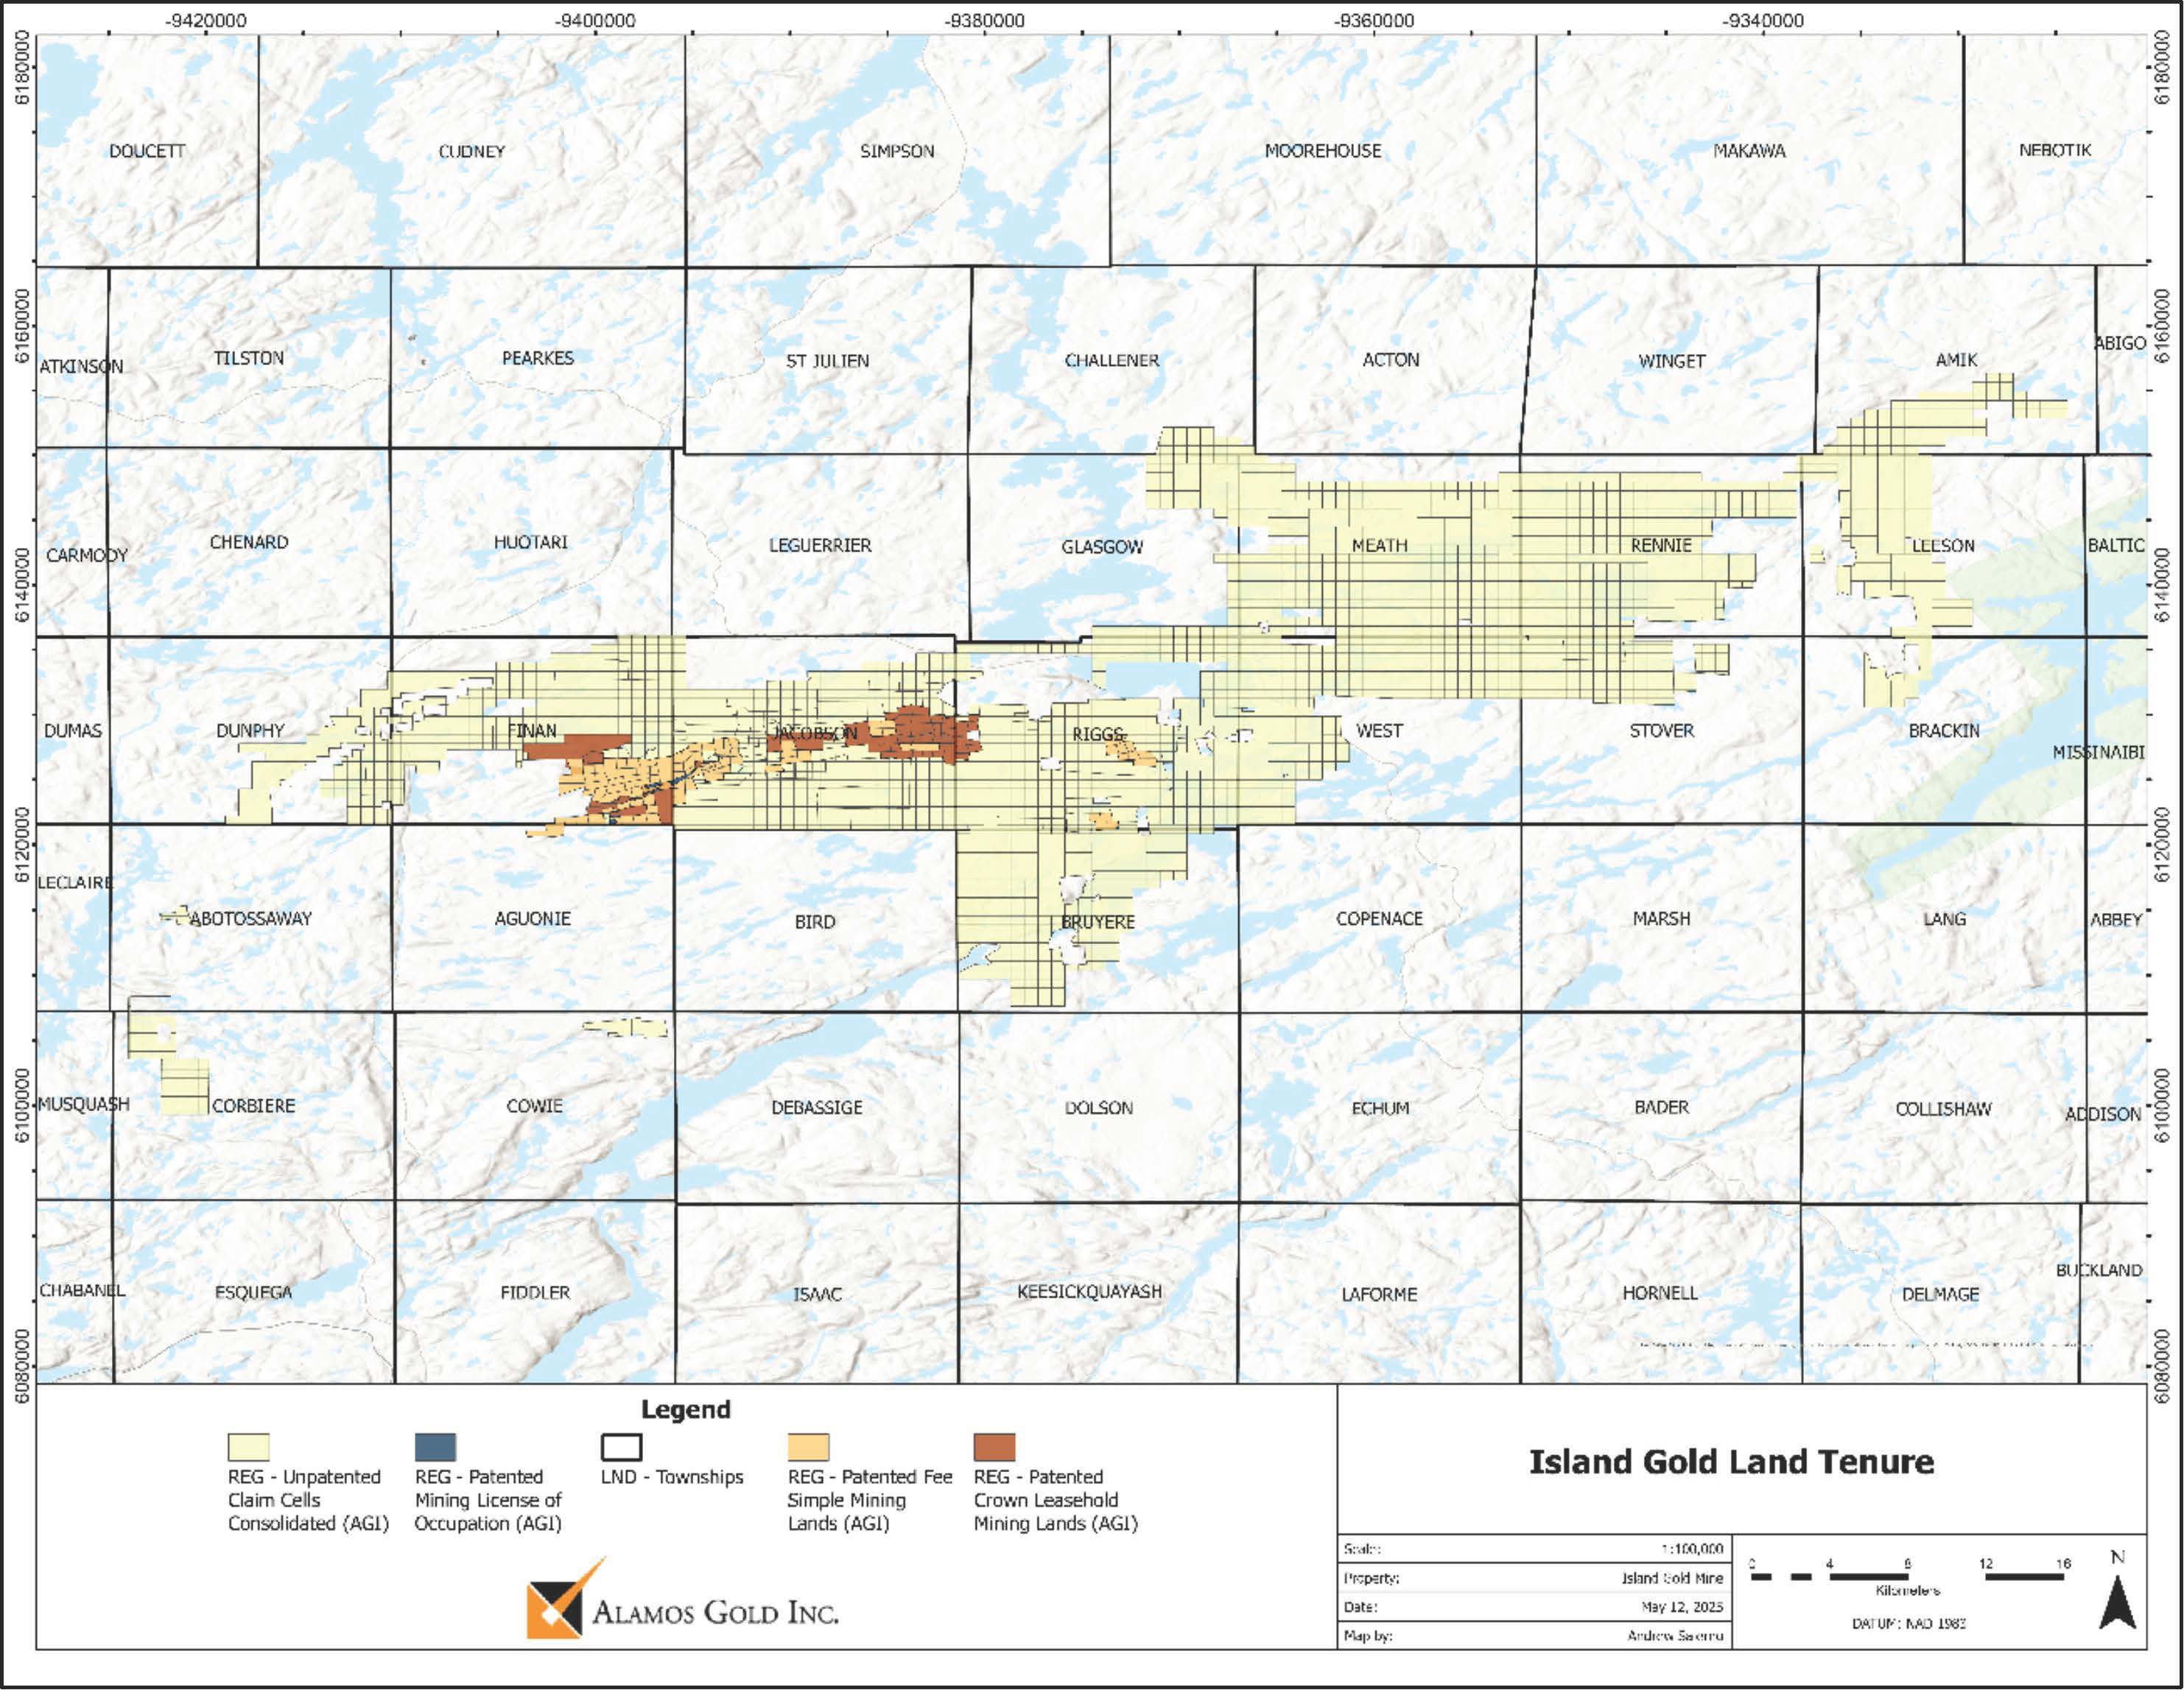
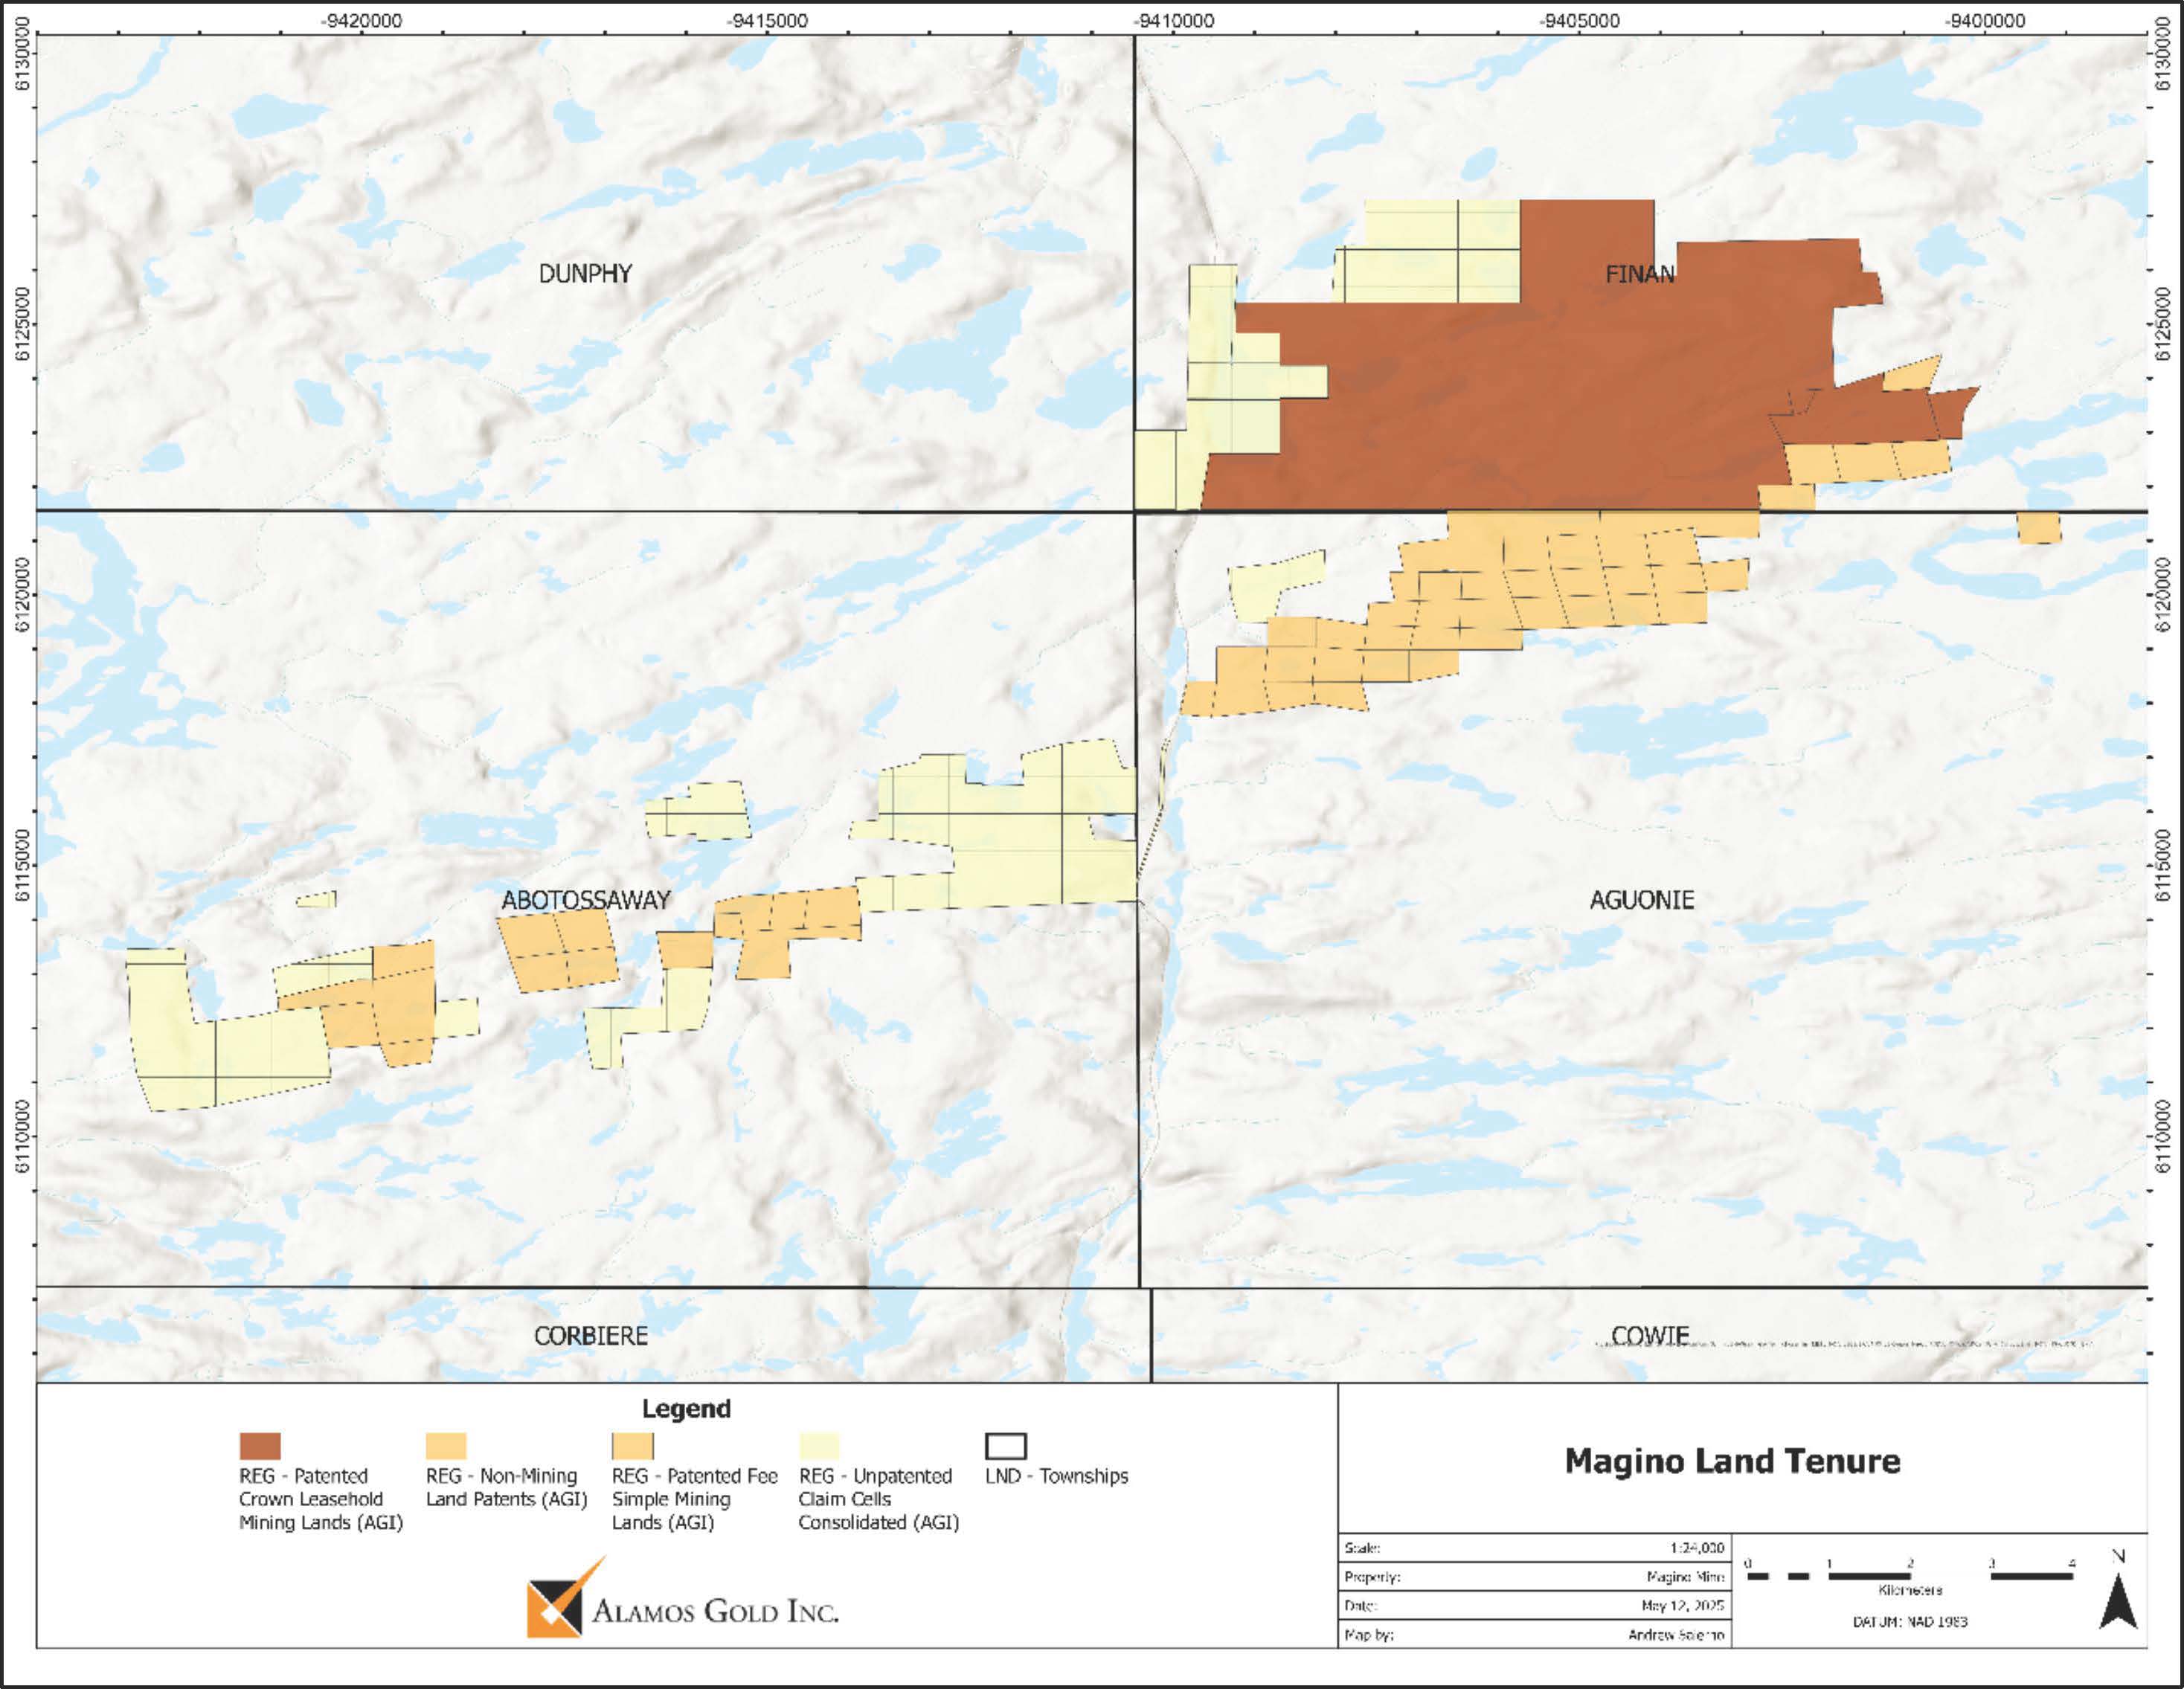
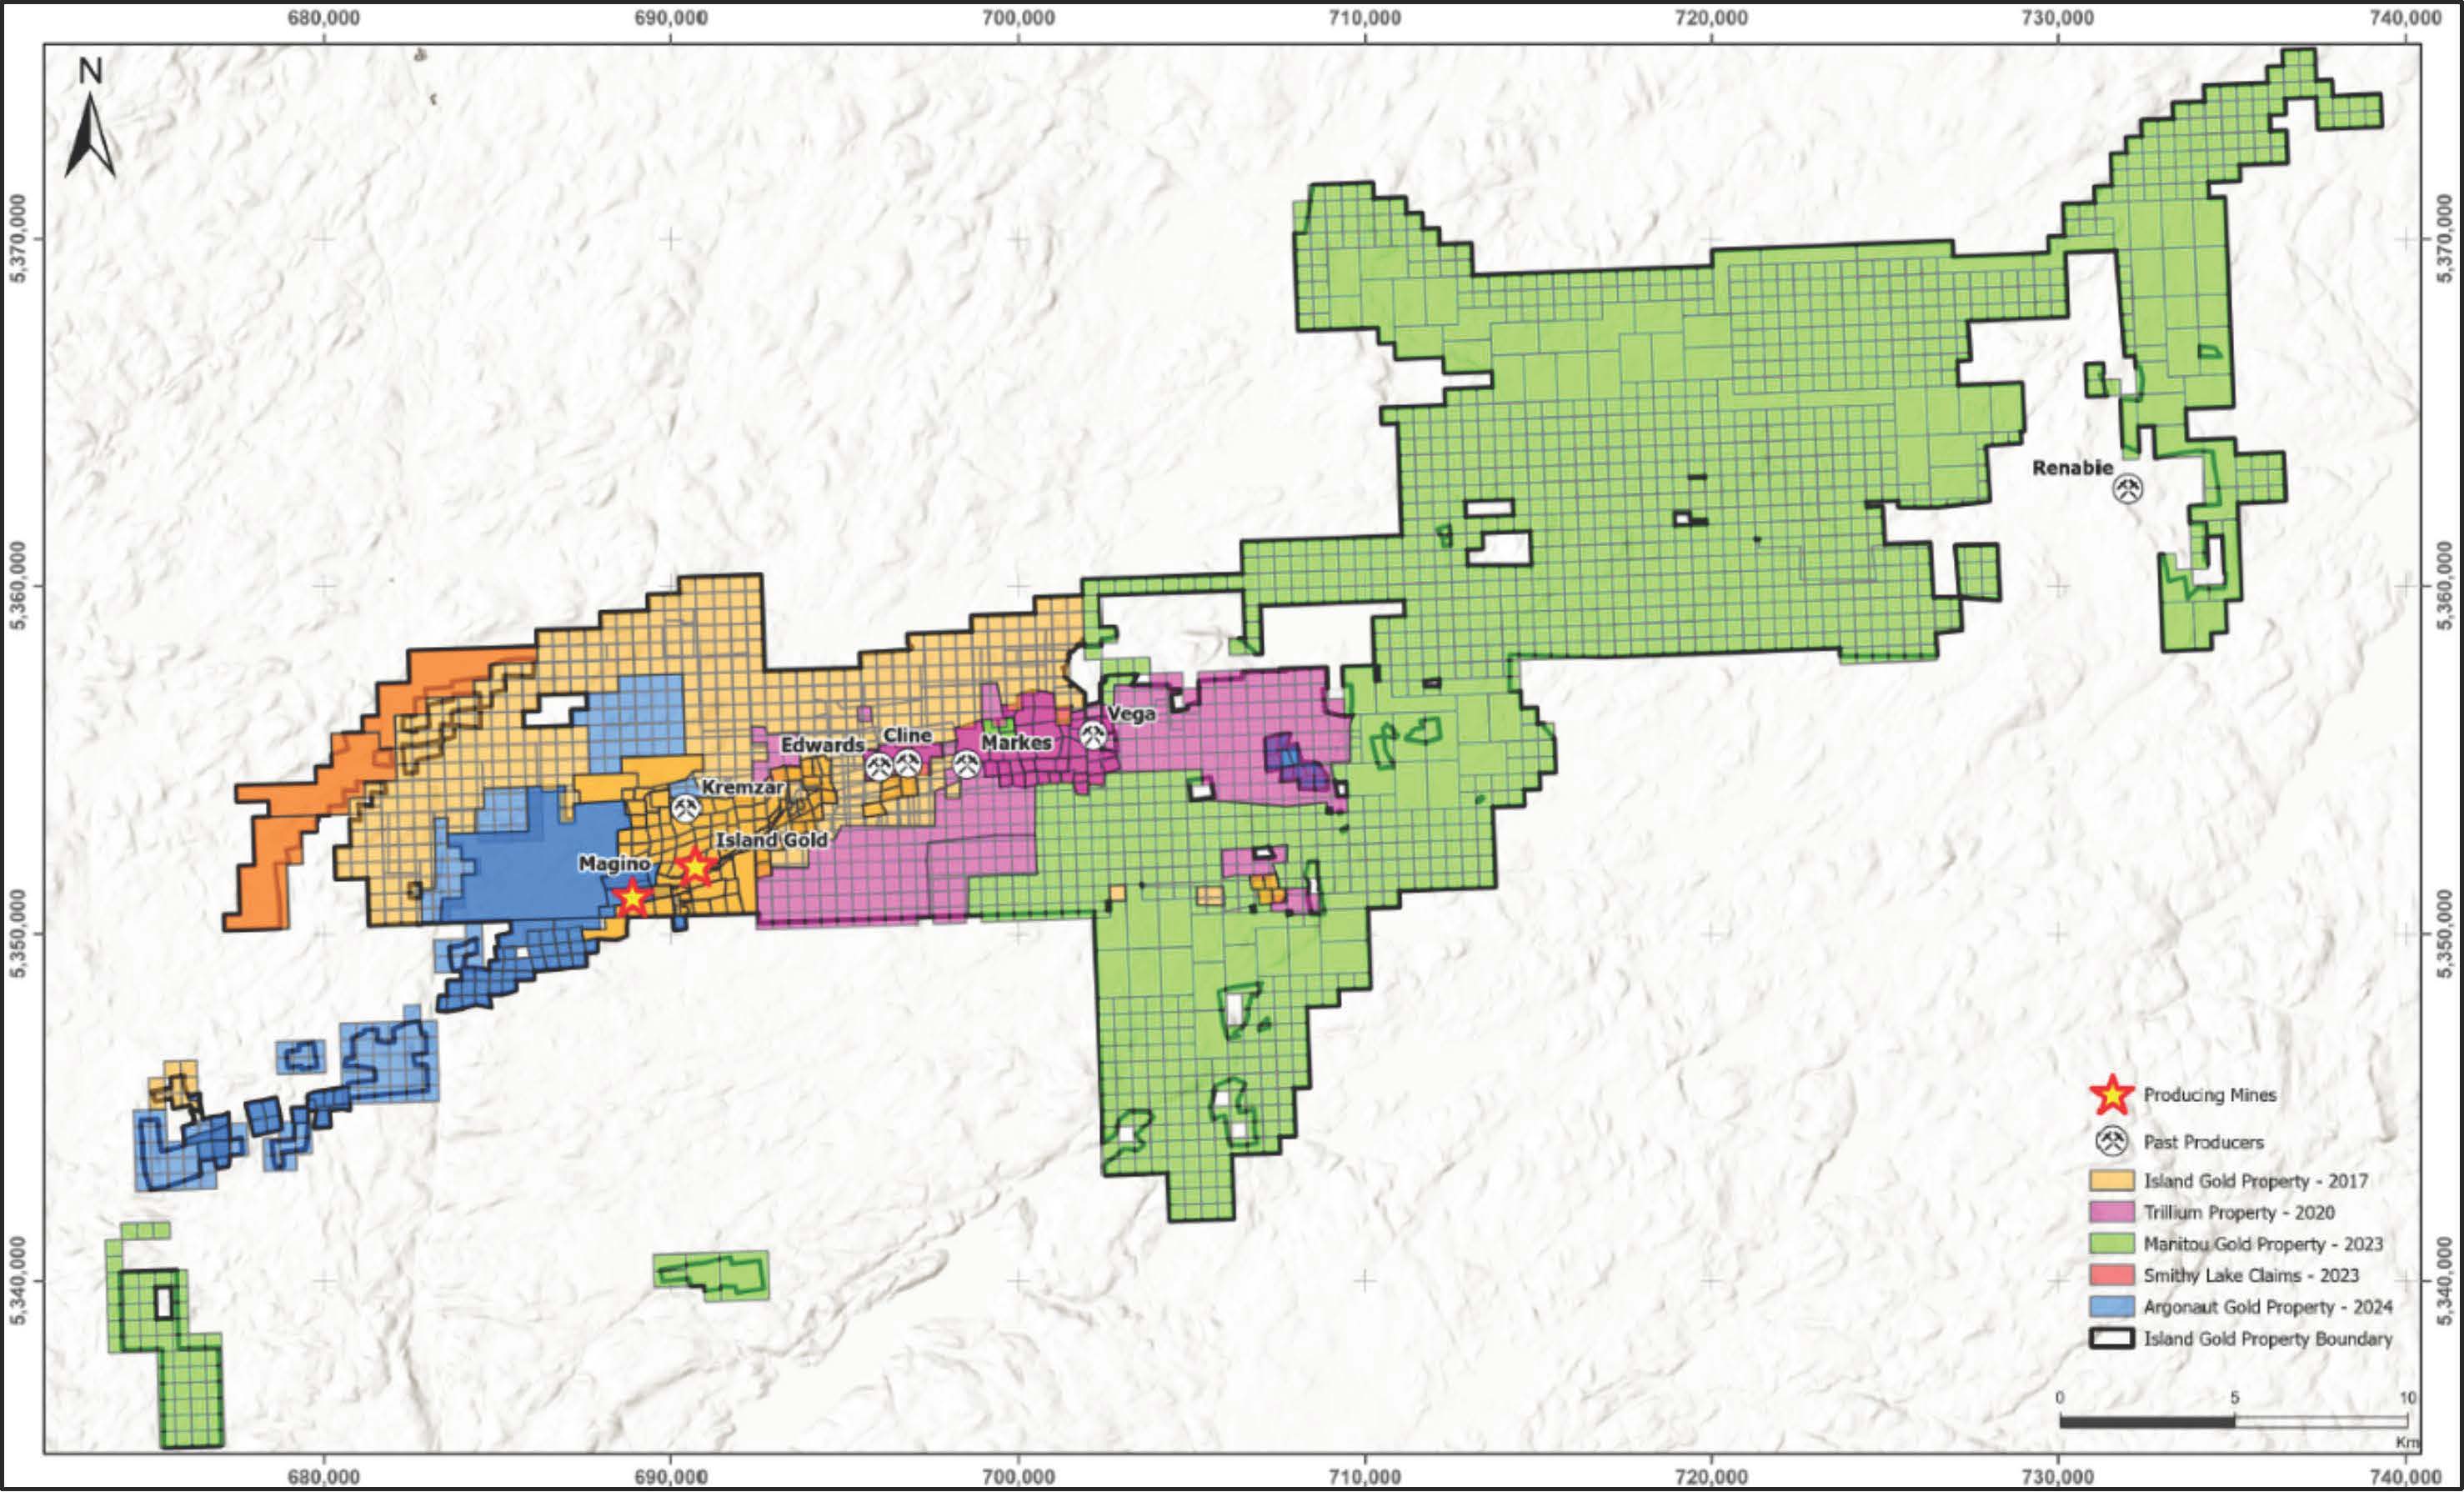
1.2 Property Description
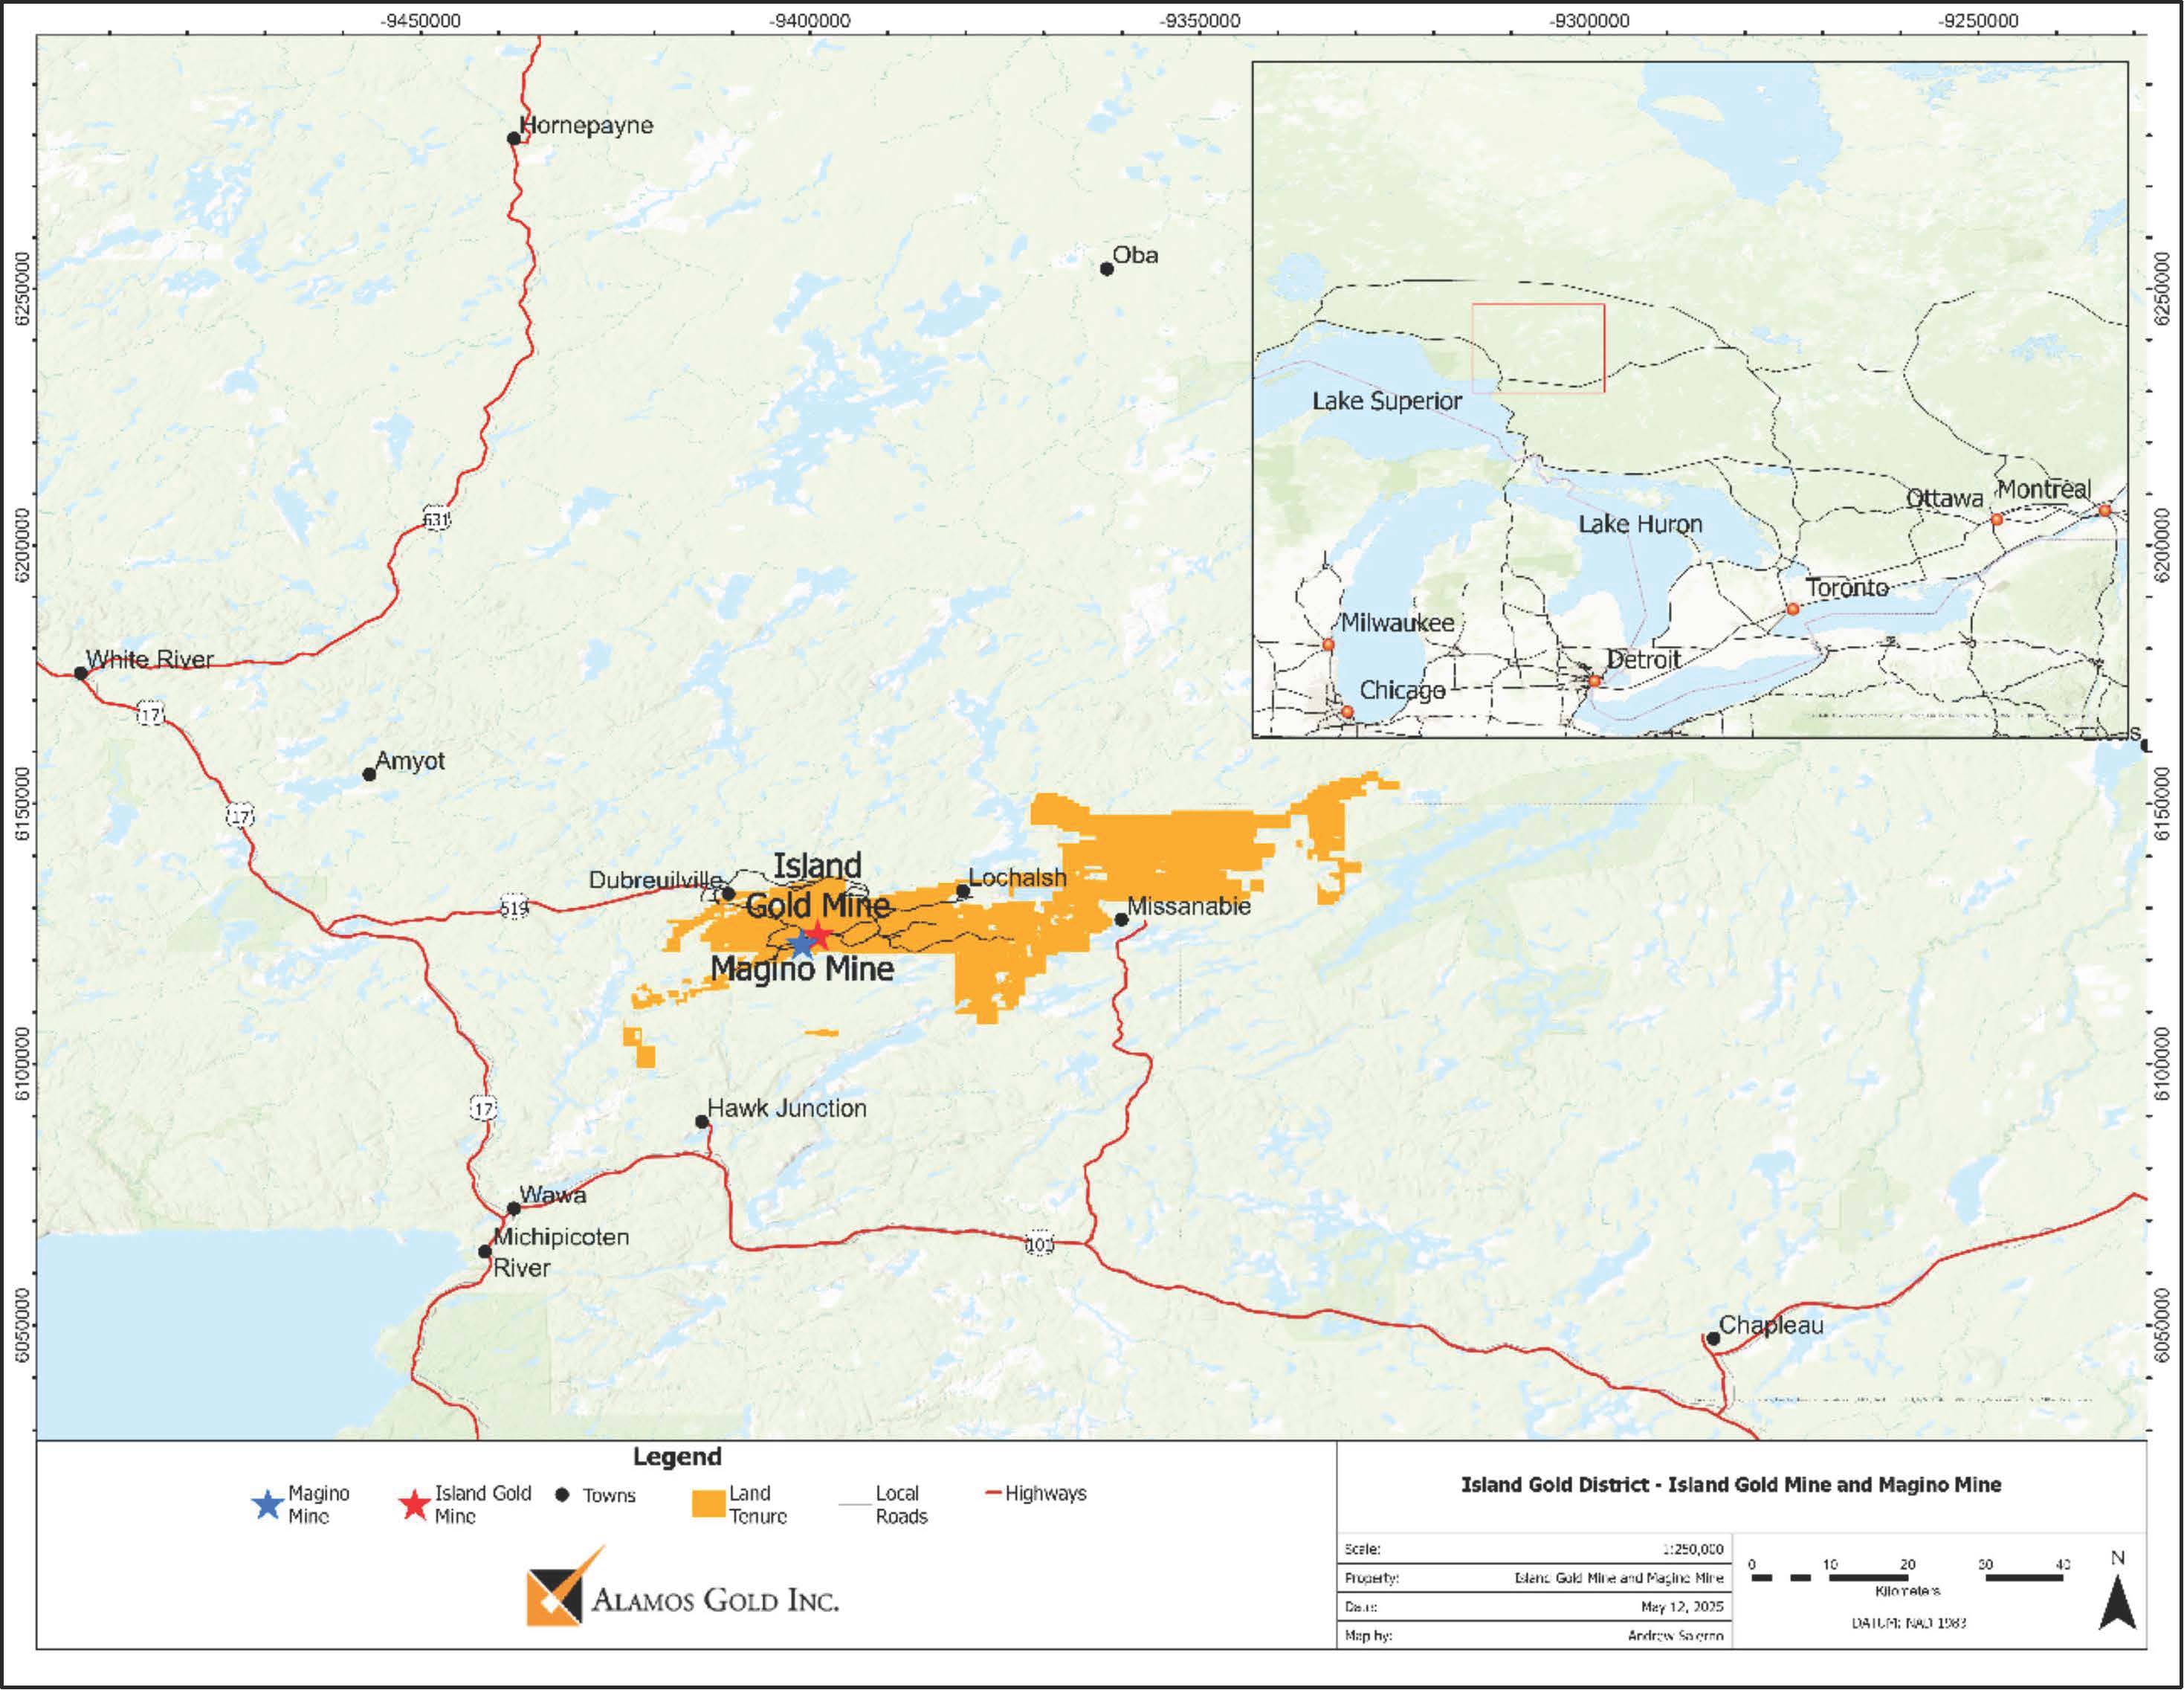
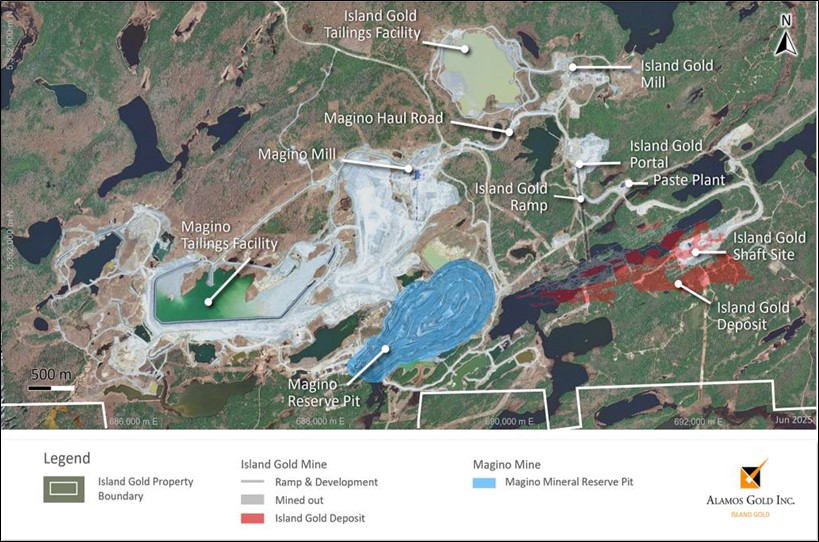
The District, collectively comprised of the Island Gold Property and Magino Property is situated approximately 43 km northeast of Wawa, ON within the Ontario Ministry of Energy and Mines (MEM) Sault Ste. Marie Mining Division. The town of Dubreuilville, originally a forestry center, is located approximately 10 km to the northwest of the District. Access to the area is provided by the Trans-Canada Highway 17 which continues north from Wawa for 35 km, then following Highway 519 for 31 km to Dubreuilville. The Goudreau Road, an all-weather, year-round road, extends southeast from Dubreuilville for 12 km to the District.
The District consists of patented fee simple and/or patented Crown leasehold mining rights and surface rights claims, mining licences of occupation, and unpatented cell claims, covering approximately 58,921 hectares (ha). Alamos controls, owns or holds 100% of the mineral rights to all the Mineral Resources and Mineral Reserves related claims at the District property.
| | | | | |
Island Gold District – NI 43-101 Technical Report August 6, 2025 | 15
|
Collectively, the District is subject to different obligations and royalties. Based on the currently defined Mineral Resources and Mineral Reserves, the only royalties applicable are:
Island Gold Property
•The Lochalsh property area is subject to a 3% net smelter returns (NSR) royalty payable to Osisko Gold Royalties Ltd. (Osisko). The Island Main and Lochalsh zones, as well as a part of the Island Gold Mineral Resources below the 400 m Level, are located within this property area;
•The Goudreau Lake property area is subject to a 2% NSR royalty payable to Osisko as to a 69% interest and to Franco-Nevada Corporation as to a 31% interest; and
•The Goudreau property area is subject to a 2% NSR royalty payable to Osisko.
Magino Property
•A 3% NSR royalty in favour of Franco-Nevada Canada Holdings Corp.;
•A 0.84% NSR royalty in favour of certain Indigenous partners, as defined and identified under specific agreements entered with these partners;
•Two further royalties, a 2% NSR and a 3% NSR, both in favour of Osisko, that apply only to approximately 1% of the Magino Mineral Reserves; and
•A 10% Net Profits Interest royalty in favour of a third-party, which, based on current plans, is not expected to be payable.
The QP is not aware of any environmental liabilities on the Property not discussed in this Report and Alamos has obtained all required permits and / or has reasonable expectations to obtain all required permits to conduct the proposed work to achieve the work program outlined in this Report. The QP is not aware of any other significant factors and risks that may affect access, title, or the right or ability to perform the proposed work program on the Property.
1.3 Accessibility, Climate, Local Resources, Infrastructure and Physiography
Access to the area is provided by the Trans Canada Highway 17, which continues north from Wawa for 35 km, and then following Highway 519 for 31 km to Dubreuilville which is 12 km to the northwest of the mine site via the all-weather Goudreau Road.
The District is contained within the Lake Superior Regional climatic zone and is described as "modified continental”. The mean annual temperature is about 10 ˚C, with extremes of –51 ˚C and 38 ˚C being recorded. Precipitation is in the range of 980 mm per year, with about 600 mm as rainfall and evaporation at 517 mm/year principally during the summer months.
Wawa has a population of 2,705 inhabitants and, Dubreuilville, originally a forestry community, has a population of 576 permanent residents and contains accommodations for mine personnel. The District is also within a few kilometres of a railway line operated by Canadian National. A hydro-electric power substation, water supply, gravel roads, and living accommodations are all available within the general mine area. Island Gold power is connected to the provincial power grid, meanwhile Magino energy supply is provided through a series of compressed natural gas-powered generators. A 115 kV powerline is currently being constructed between Hawk Junction and the mine site.
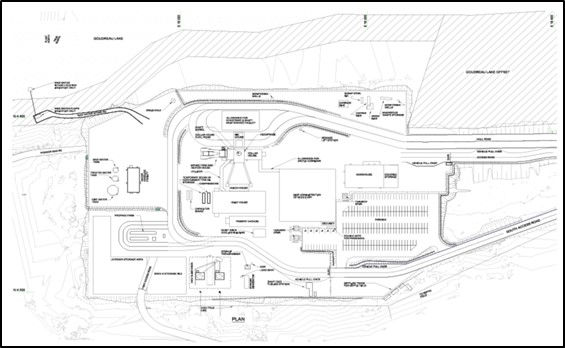
Island Gold infrastructure includes a primary tailings pond, a secondary settling pond, the Kremzar mill, the Lochalsh ramp and portal, a mine access road, power lines, and an electrical substation. Offices, core logging and storage facilities, a fire hall and separate mine drys for
| | | | | |
Island Gold District – NI 43-101 Technical Report August 6, 2025 | 16
|
men and women are also located at the mill site. The mill currently has a capacity of 1,200 tpd and the fully permitted tailings area is located at Miller Lake, west of the historic Kremzar Mine.
In addition, the Magino infrastructure includes a tailing management facility, various water control ponds, the 10,000 tpd Magino mill, offices, an assay laboratory (currently under construction), truck shop and wash (currently under construction) and a compressed natural gas-powered generating station.
The District lies in the Superior Province of the Canadian Shield, overlapped by the Boreal Shield ecological zone. Topography within the mine area varies from a high of approximately 490 masl in the vicinity of Miller and Maskinonge Lakes to a low of approximately 380 masl at Goudreau Creek. Periods of intense glacial activity have contributed to the hummocky, rock knelled and largely bedrock-controlled topography, characteristic of the region. Glacial advance from the north deposited a thin mantle of stony sand till over a scoured rock surface.
1.4 History
The Goudreau – Lochalsh Gold Camp area has been the subject of interest dating back to the early 1900’s and has attracted prospectors and mining companies in search of iron ore, gold, and base metal deposits. The Wawa – Michipicoten area has been recognized for its long history of iron exploration which has resulted in the development and production of several iron ore mining operations.
Gold exploration followed shortly thereafter, resulting in several gold discoveries which were subsequently developed and brought into commercial production in the area which would later become the District.
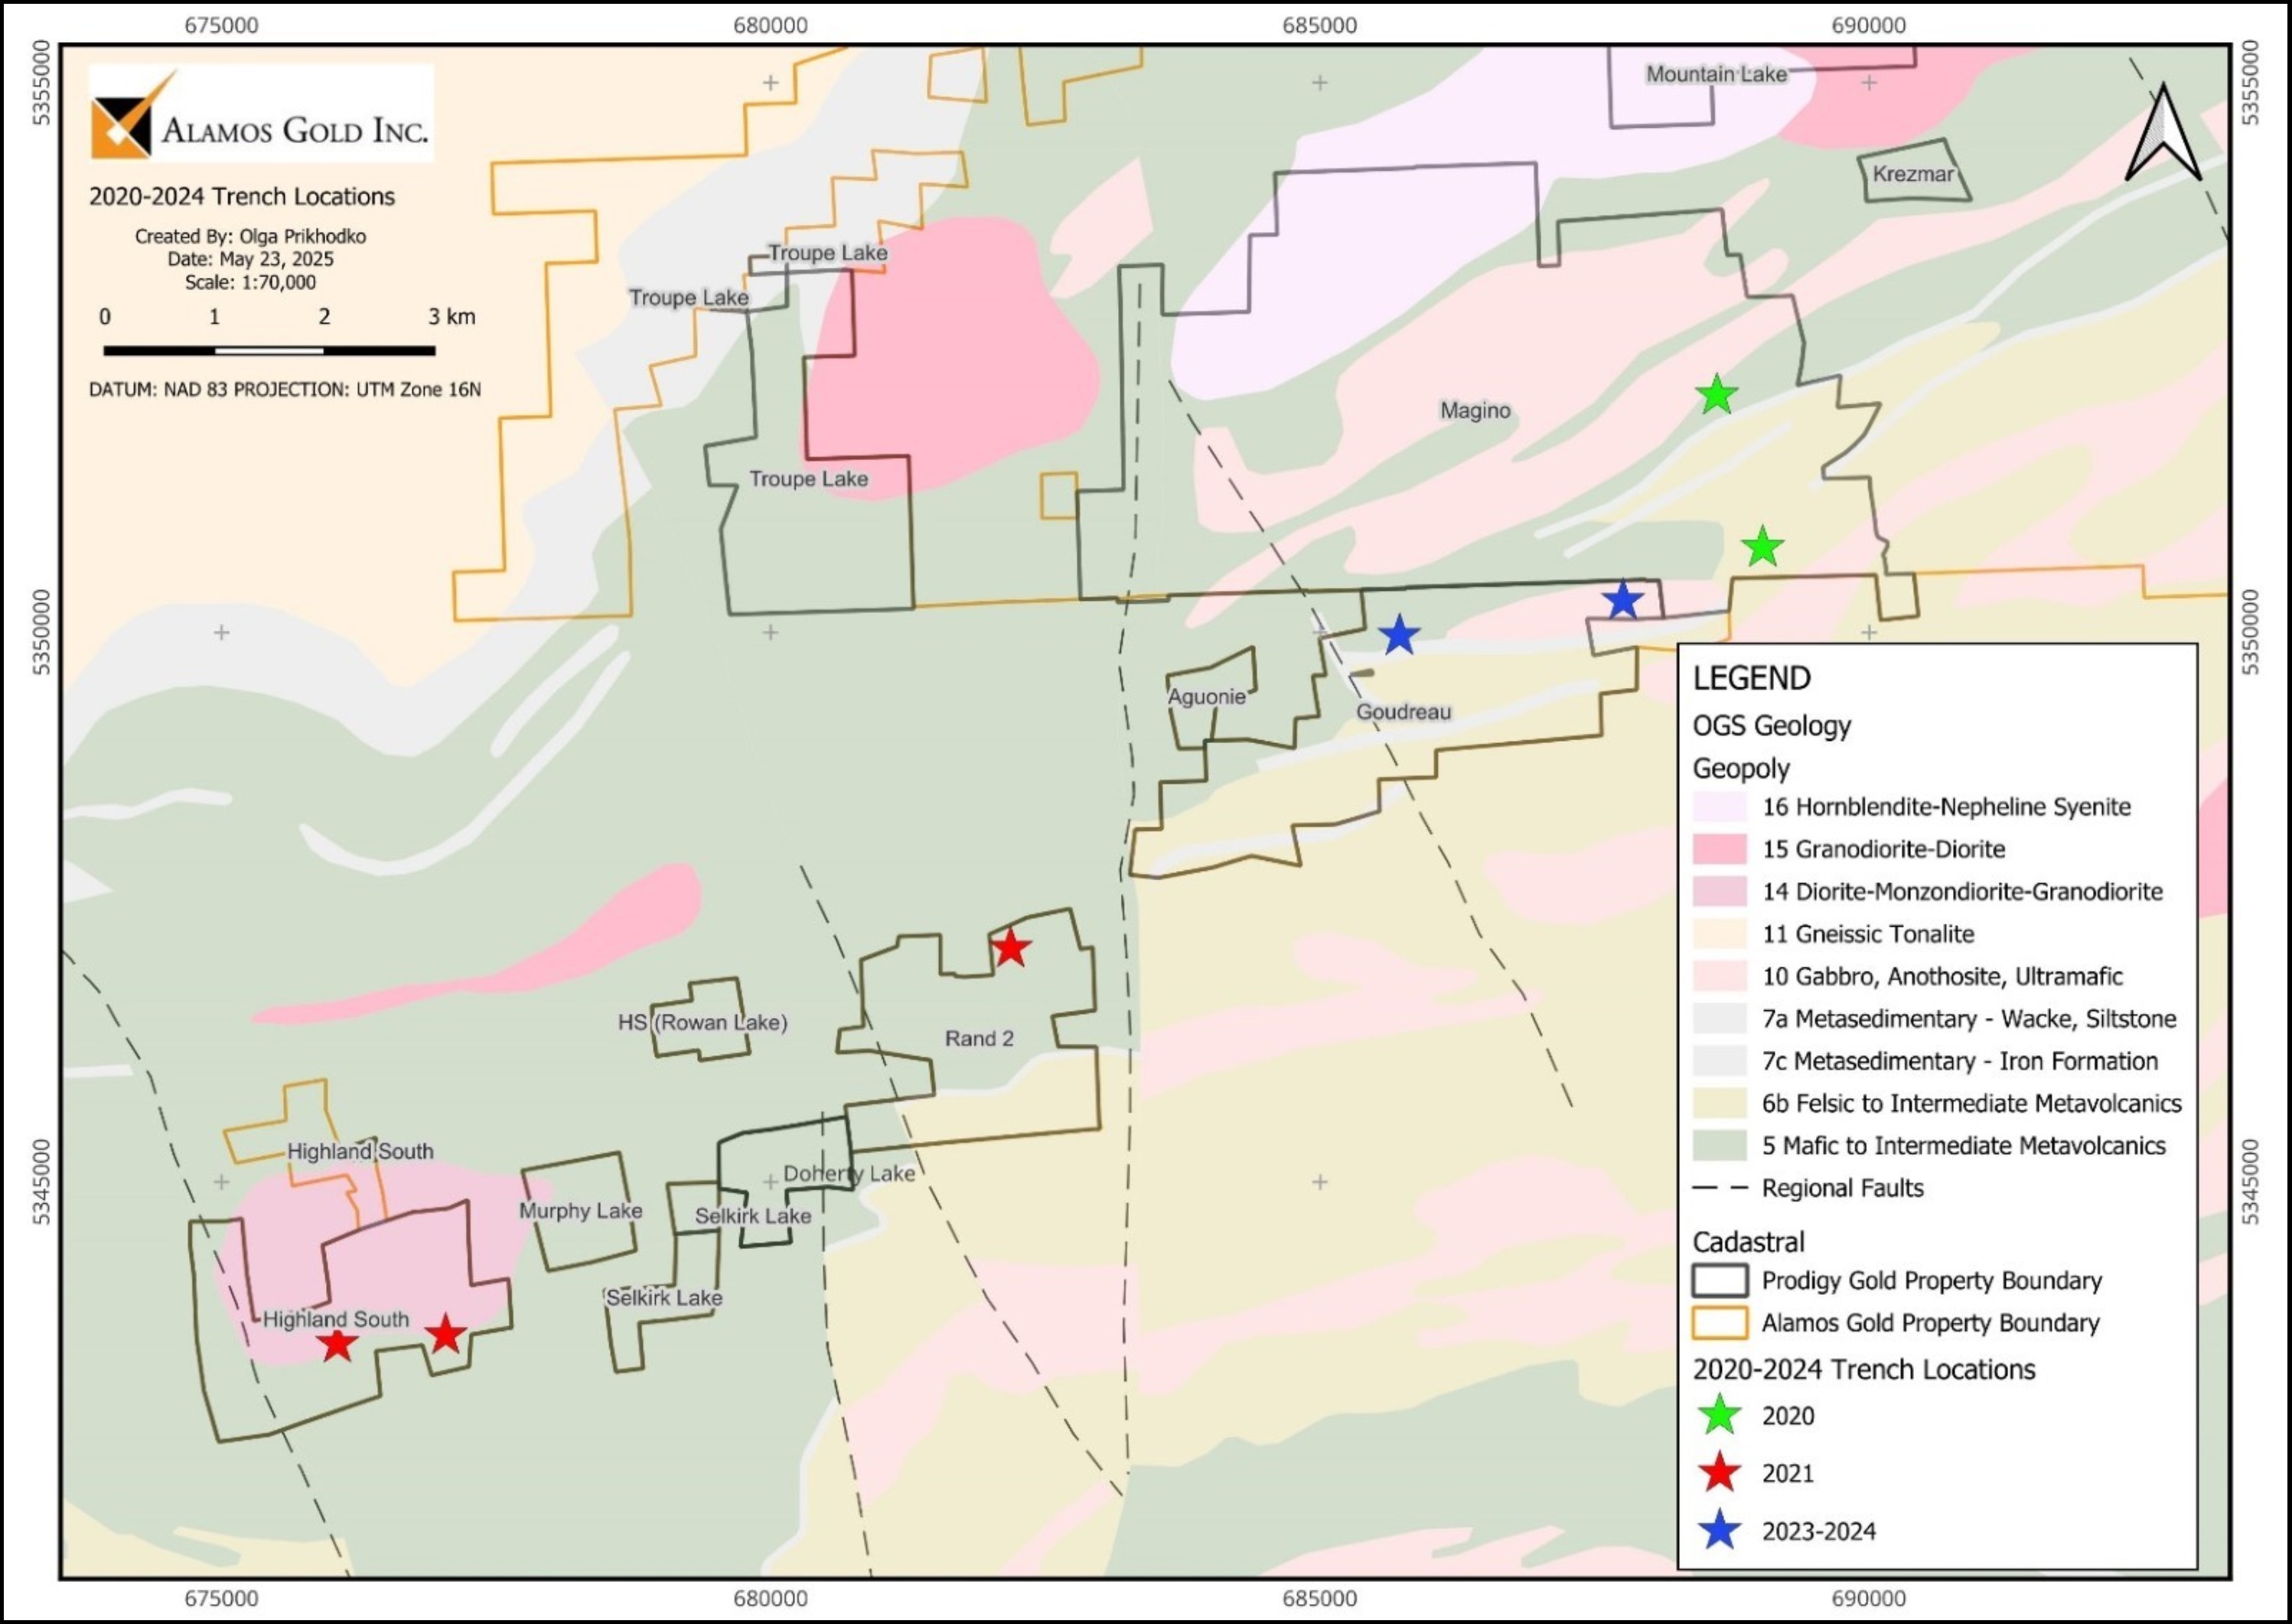
The initial discovery of gold was made by a group of prospectors at Emily Bay on Dog Lake in Riggs Township in 1900. Up to 1944, prospecting, geological mapping, trenching, shaft sinking, and 1,732 m of diamond drilling were completed to explore various gold prospects. Ultimately this period is marked principally by various exploration efforts by several companies carrying out surface trenching and diamond drilling on several gold prospects.
Island Gold Mine
After an extended period of relatively little interest and activity in the area presently known as the Island Gold Mine, exploration was resumed by Amax Inc. and its Canadian division, Canamax Resources Inc. (Canamax) in 1974. In 1985, drilling approximately 2 km south of the Kremzar Mine intersected a series of sub-parallel lenses containing gold mineralization within deformed rocks of the Goudreau Lake Deformation Zone. In December 1988, Canamax’s Kremzar Mine began commercial production. From 1988 to 1990, production from the Kremzar Mine was 306,603 t grading 4.77 g/t gold. Over 1989 and 1990, underground access was established into the Island Gold deposit with an adit and ramp developed from the north shore of Goudreau Lake. A 4,167 t bulk sample was extracted and processed at the Kremzar Mill. At the end of 1990, Canamax suspended all operations at both the Kremzar and Island Gold projects.
In 1996 the Island Gold property was acquired from Canada Tungsten Inc. by Patricia Mining Corp. (Patricia). From 1996 to 2002, various exploration activities on the property included prospecting, surface trenching, geological and geophysical surveys, and diamond drilling was carried out to explore for both Island Gold and Kremzar styles of gold bearing prospects and zones. In 2003, Patricia and Richmont Mines Inc. (Richmont), entered into a joint venture agreement. Work completed during the joint venture included 72,984 m of surface and
| | | | | |
Island Gold District – NI 43-101 Technical Report August 6, 2025 | 17
|
underground diamond drilling to test the various zones. On January 1, 2005, Richmont became the operator of the project.
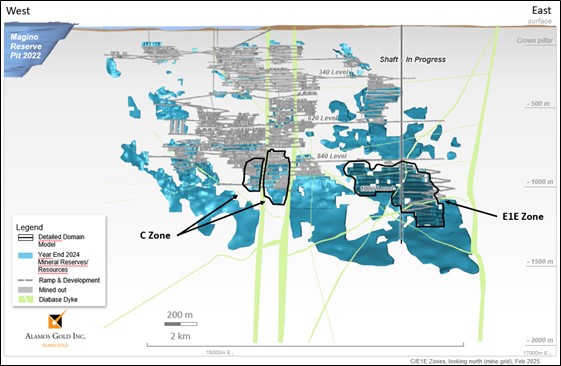
Commercial production at Island Gold began on October 1, 2007. Richmont acquired Patricia’s 45% interest in December 2008, becoming 100% owner of the property and operations. Exploration activities ramped up in 2009 with a minimum of 30,000 m of drilling completed in each of the next several years, increasing sharply to more than 80,000 m in 2012. This included drilling below the 400 m Level as part of the Island Gold deep exploration program, which was successful in extending the main C Zone at depth with an initial Inferred Mineral Resource being calculated on the high-grade deep C Zone in January 2013.
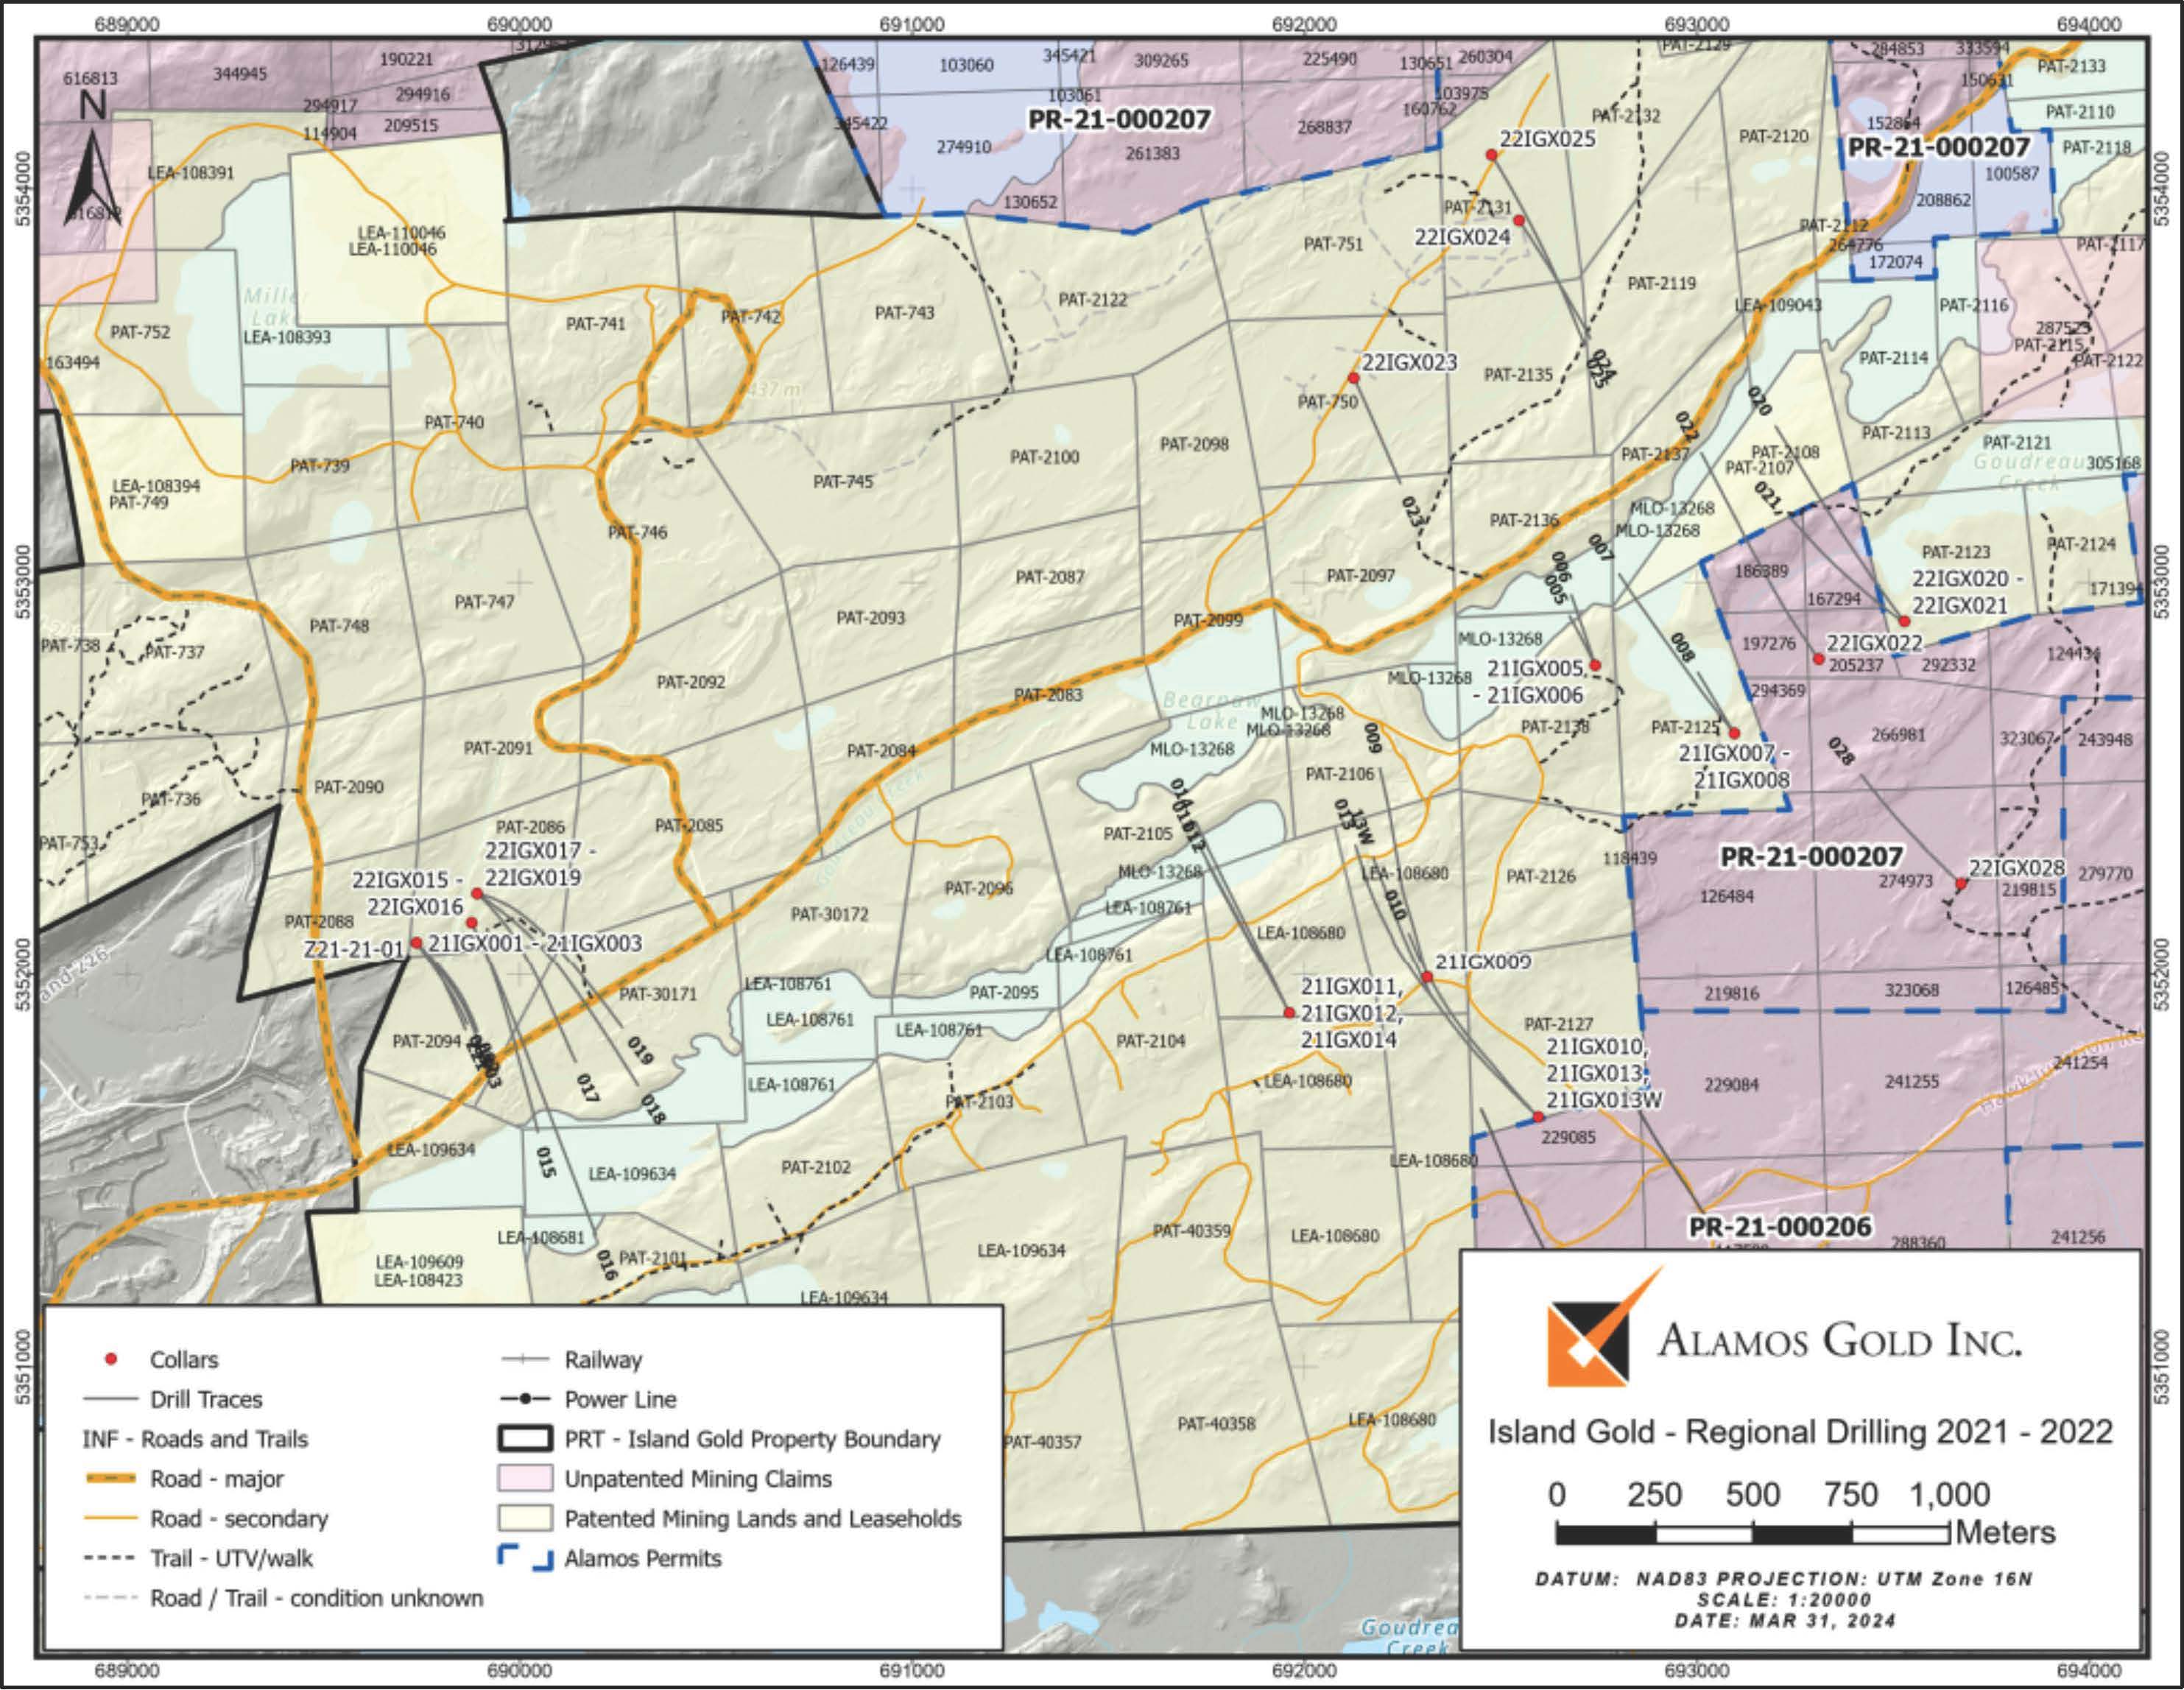
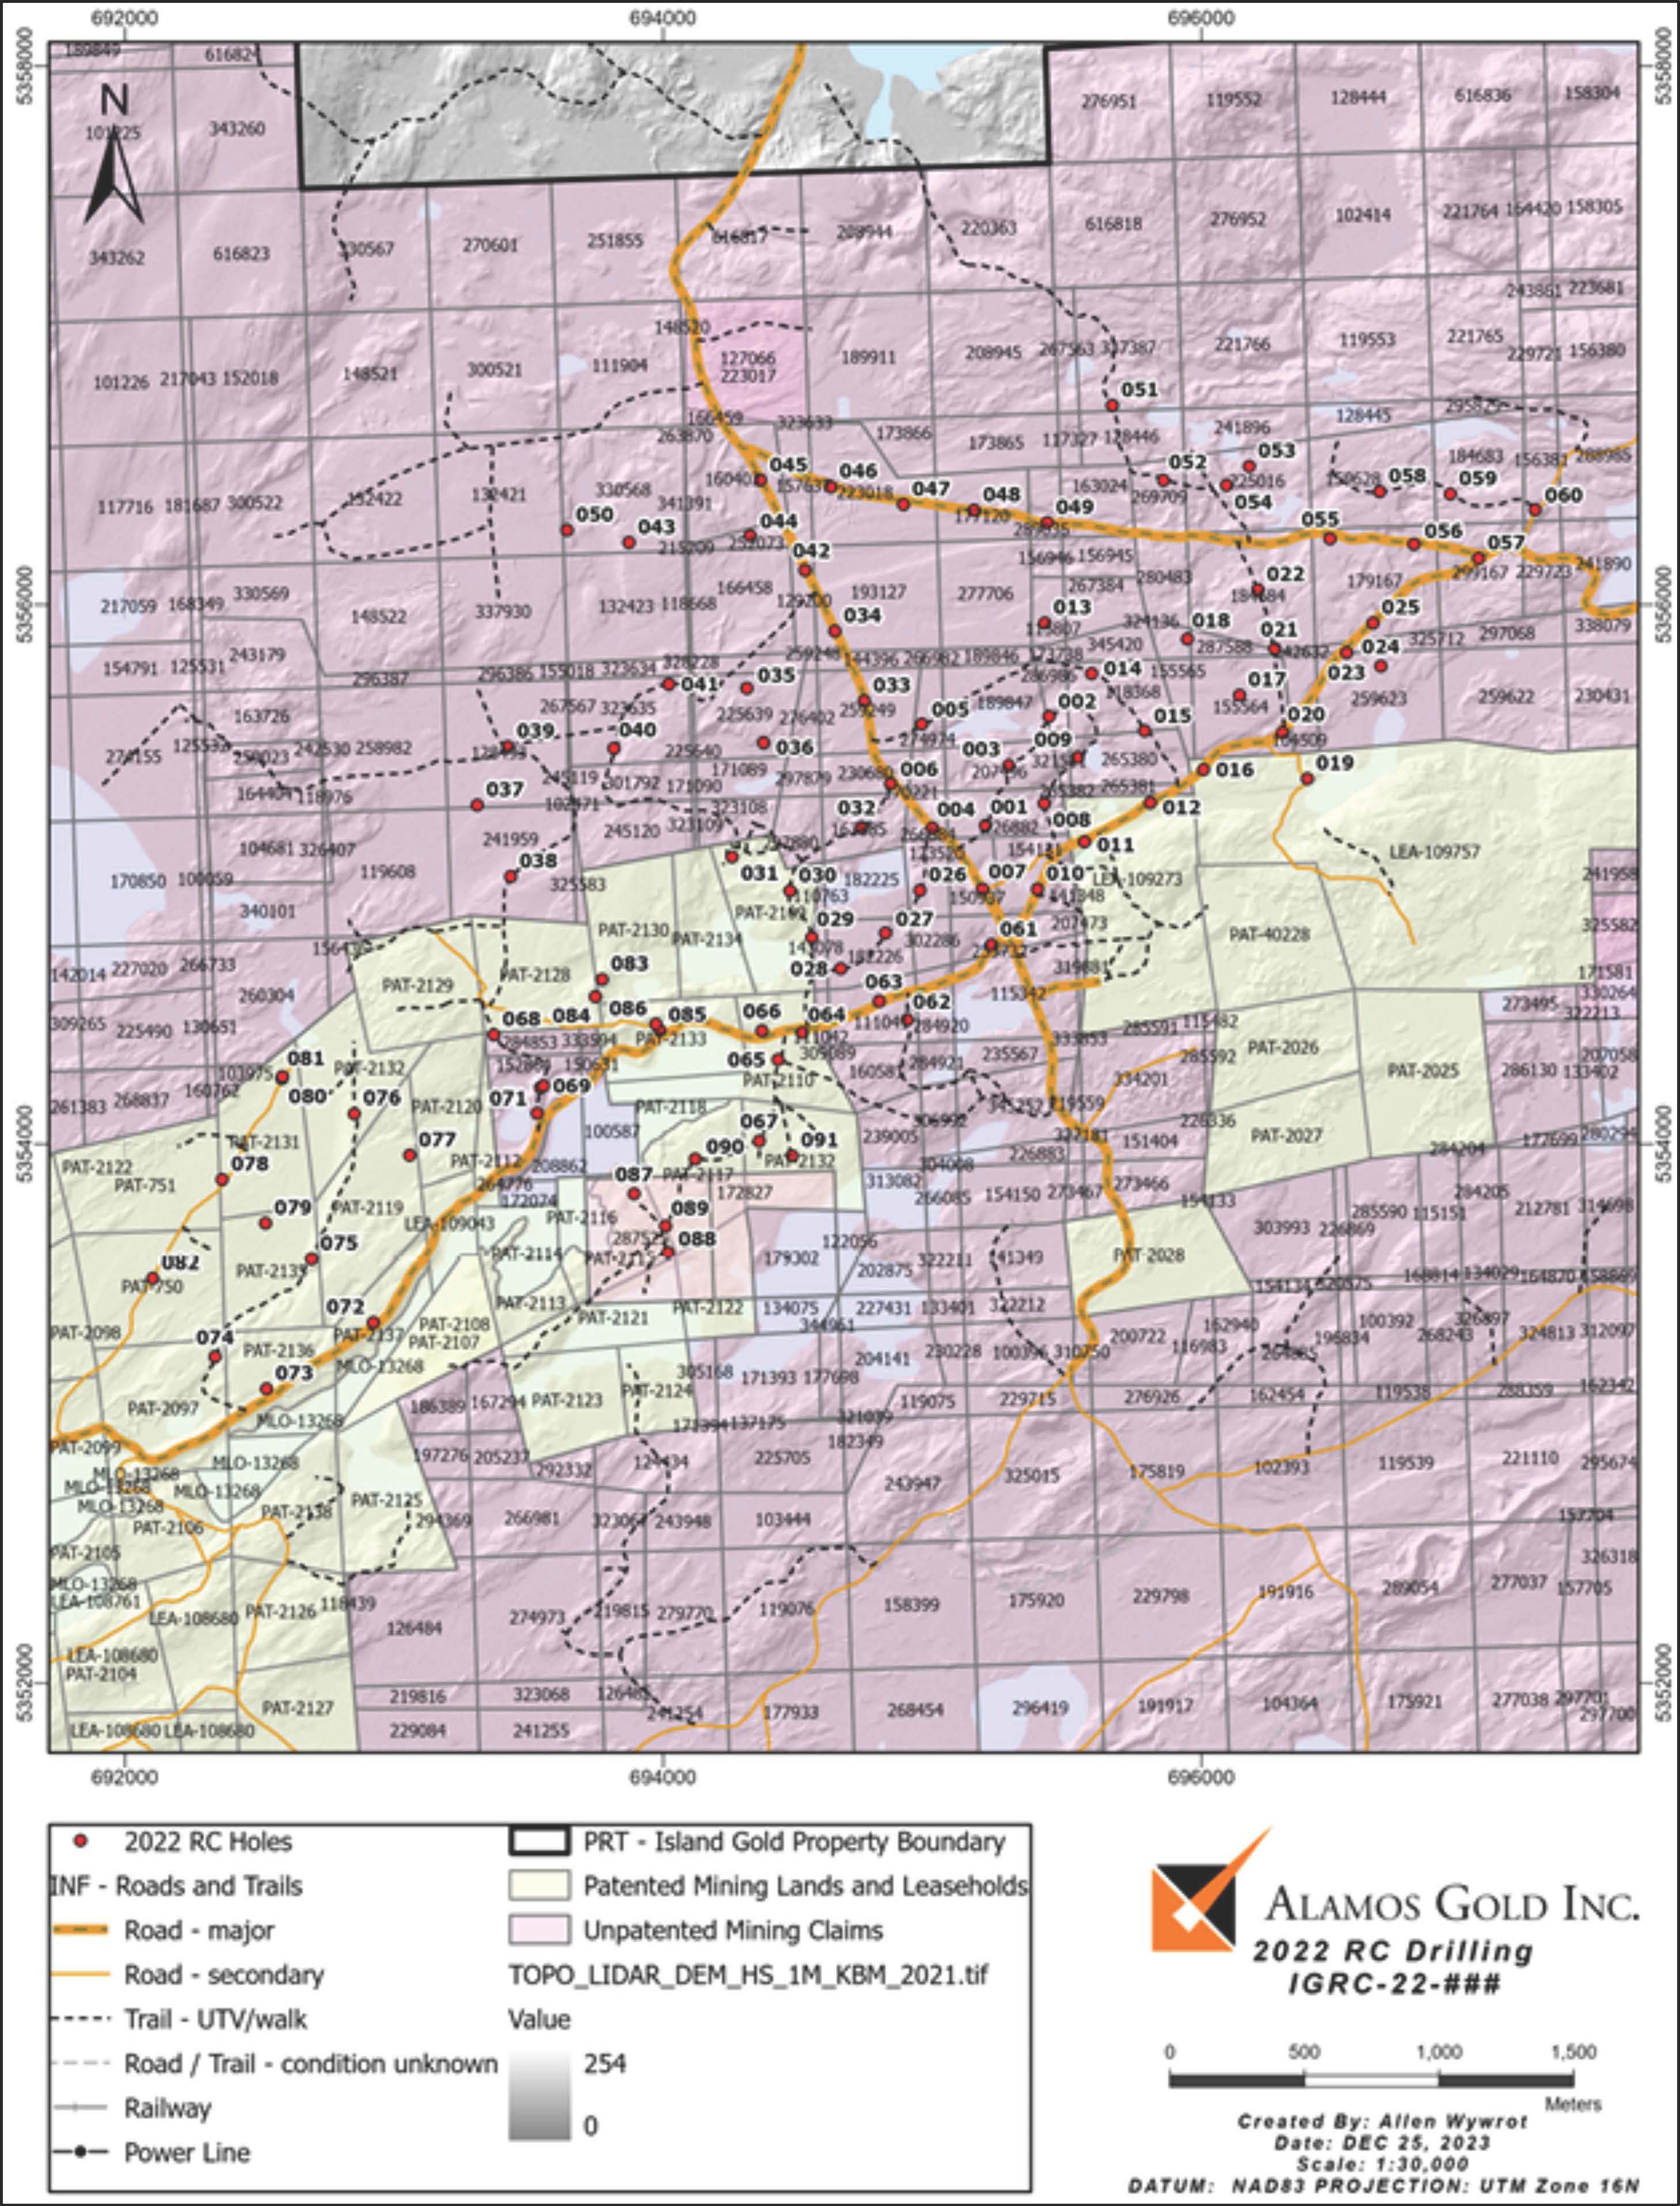
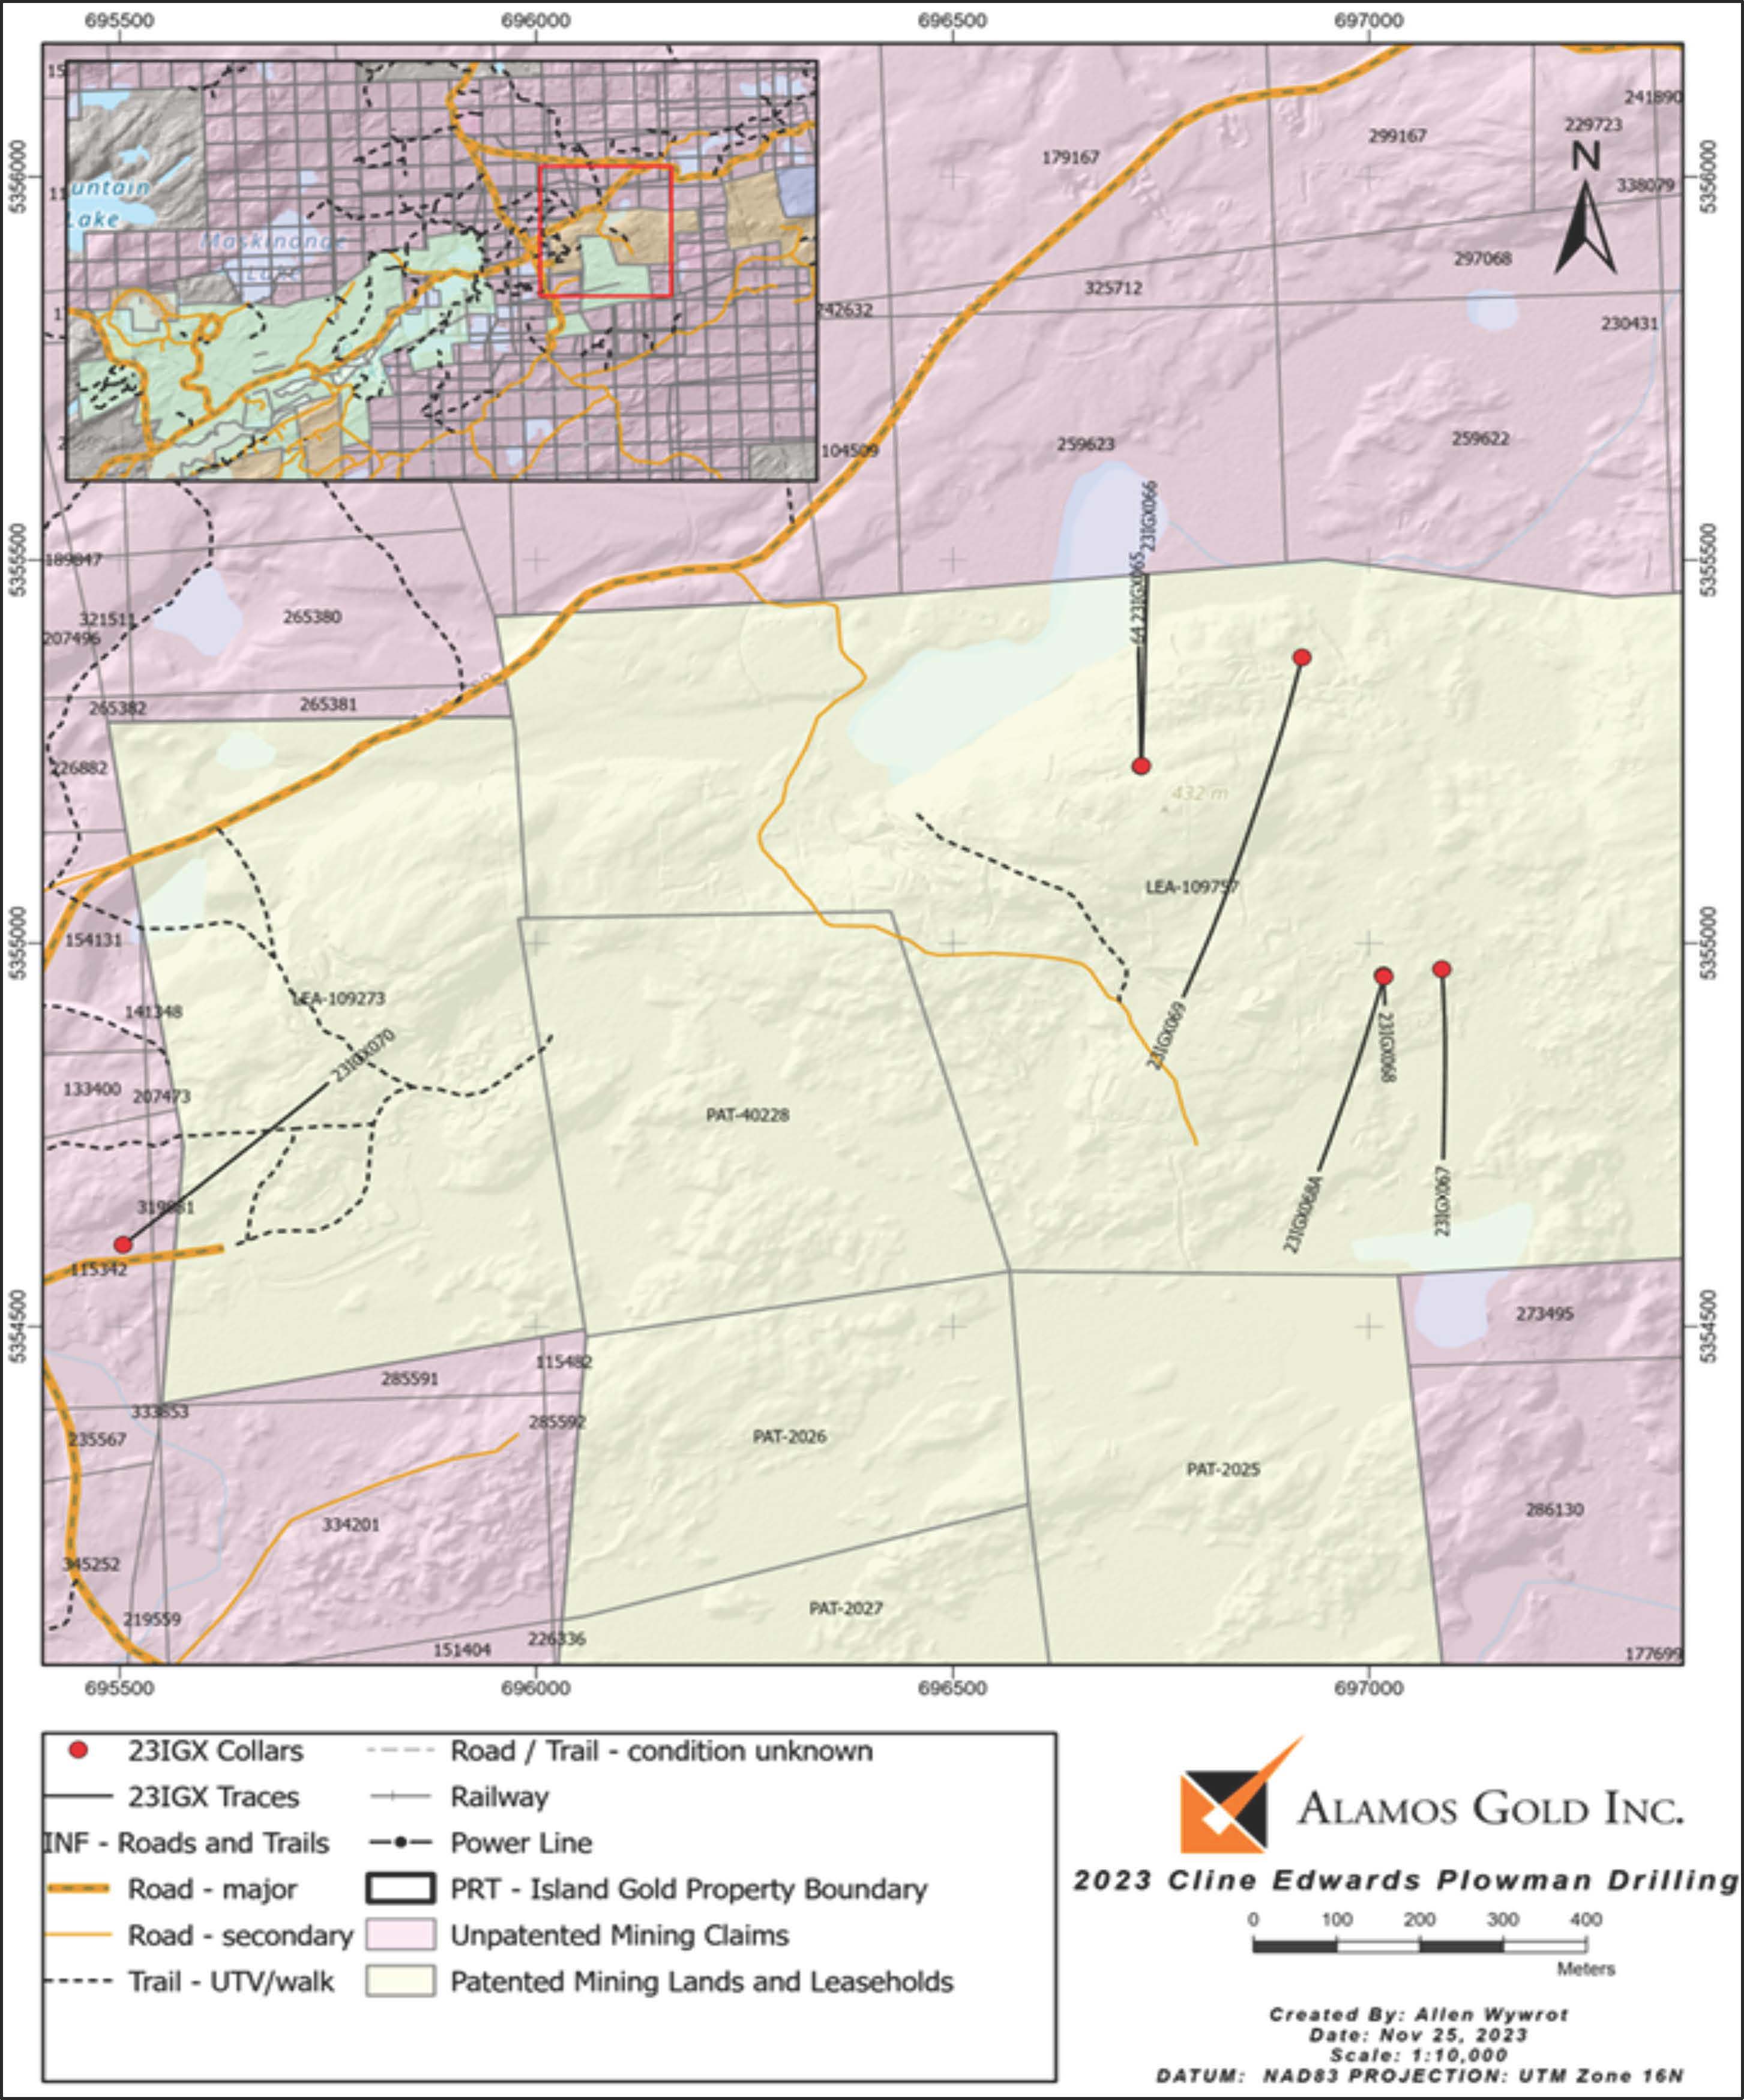
A large exploration program commenced at the end of 2015 to explore beneath Island Gold. Directional diamond drilling was used to reach targets at depth, allowing greater accuracy than conventional drilling techniques. As a result of this program, Mineral Resources were added in the C Zone at depth and to the East in the E1E Zone in the Extension 2 area. A total of 1,122,714 m of drilling was completed at the Island Gold Mine between 2015 and 2024.
Magino Mine
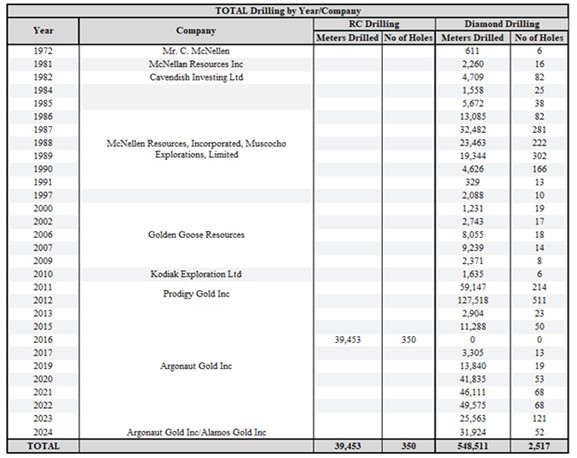
Various companies owned, operated, and explored the Magino Property between 1917 and present day, with a 30-year gap of inactivity from 1942 to 1972.
On September 25th, 1981, McNellen Resources Incorporated (McNellen), formerly Rico Copper Incorporated entered a joint venture with Cavendish Investing Limited (Cavendish); under the terms of the agreement, Cavendish could earn an undivided 50% interest in the property and project management control by expending C$900,000 on the property, which they did.
On November 1st, 1985, Muschocho Explorations Limited (Muscocho) acquired Cavendish’s interest in the property. At the time, Cavendish and McNellen each owned a 50% interest in the property.
Underground development began in 1986 under project ownership of McNellen and Muscocho, with production beginning in 1988. Mining continued from 1988 to 1992, during which 768,678 t were processed at a recovered grade of 0.137 oz/t gold (4.3 g/t), producing 105,543 oz of gold.
In 1996, three companies – Muscocho, McNellen, and Flanagan McAdam Resources Incorporated – combined to form Golden Goose Resources Inc. (Golden Goose), which emerged with a 100% interest in the property.
On August 31st, 2010, Kodiak Exploration Limited and Golden Goose announced a definitive merger agreement, whereby Kodiak Exploration Limited would acquire all the issued and outstanding shares of Golden Goose. The arrangement effectively combined the assets of both companies on a consolidated basis, with Golden Goose becoming a wholly owned subsidiary of Kodiak Exploration Limited. On January 4th, 2011, the merged assets were renamed Prodigy Gold Inc (Prodigy).
On December 11th, 2012, an agreement was completed that made Prodigy a wholly owned subsidiary of Argonaut. Argonaut accelerated the exploration program during 2011 and 2012 with the drilling of 725 holes for 186,665 m. This allowed Argonaut to continue to advance the project with Preliminary Feasibility Studies issued in 2014 and 2017 and a Feasibility Study completed during December 2017. Additional studies were conducted during 2018, 2019, and 2020, and Argonaut decided to develop the Magino Project in November 2020 and construction activity commenced in the first quarter of 2021. Commercial production of the Project was achieved in November 2023.
| | | | | |
Island Gold District – NI 43-101 Technical Report August 6, 2025 | 18
|
Exploration after 2012, through 2019, continued at a relatively slower pace but accelerated from 2020 to present day with continued delineation drilling of the deposit.
In March 2024 Alamos announced the friendly acquisition of Argonaut whose combination would form the District. The acquisition closed in July 2024.
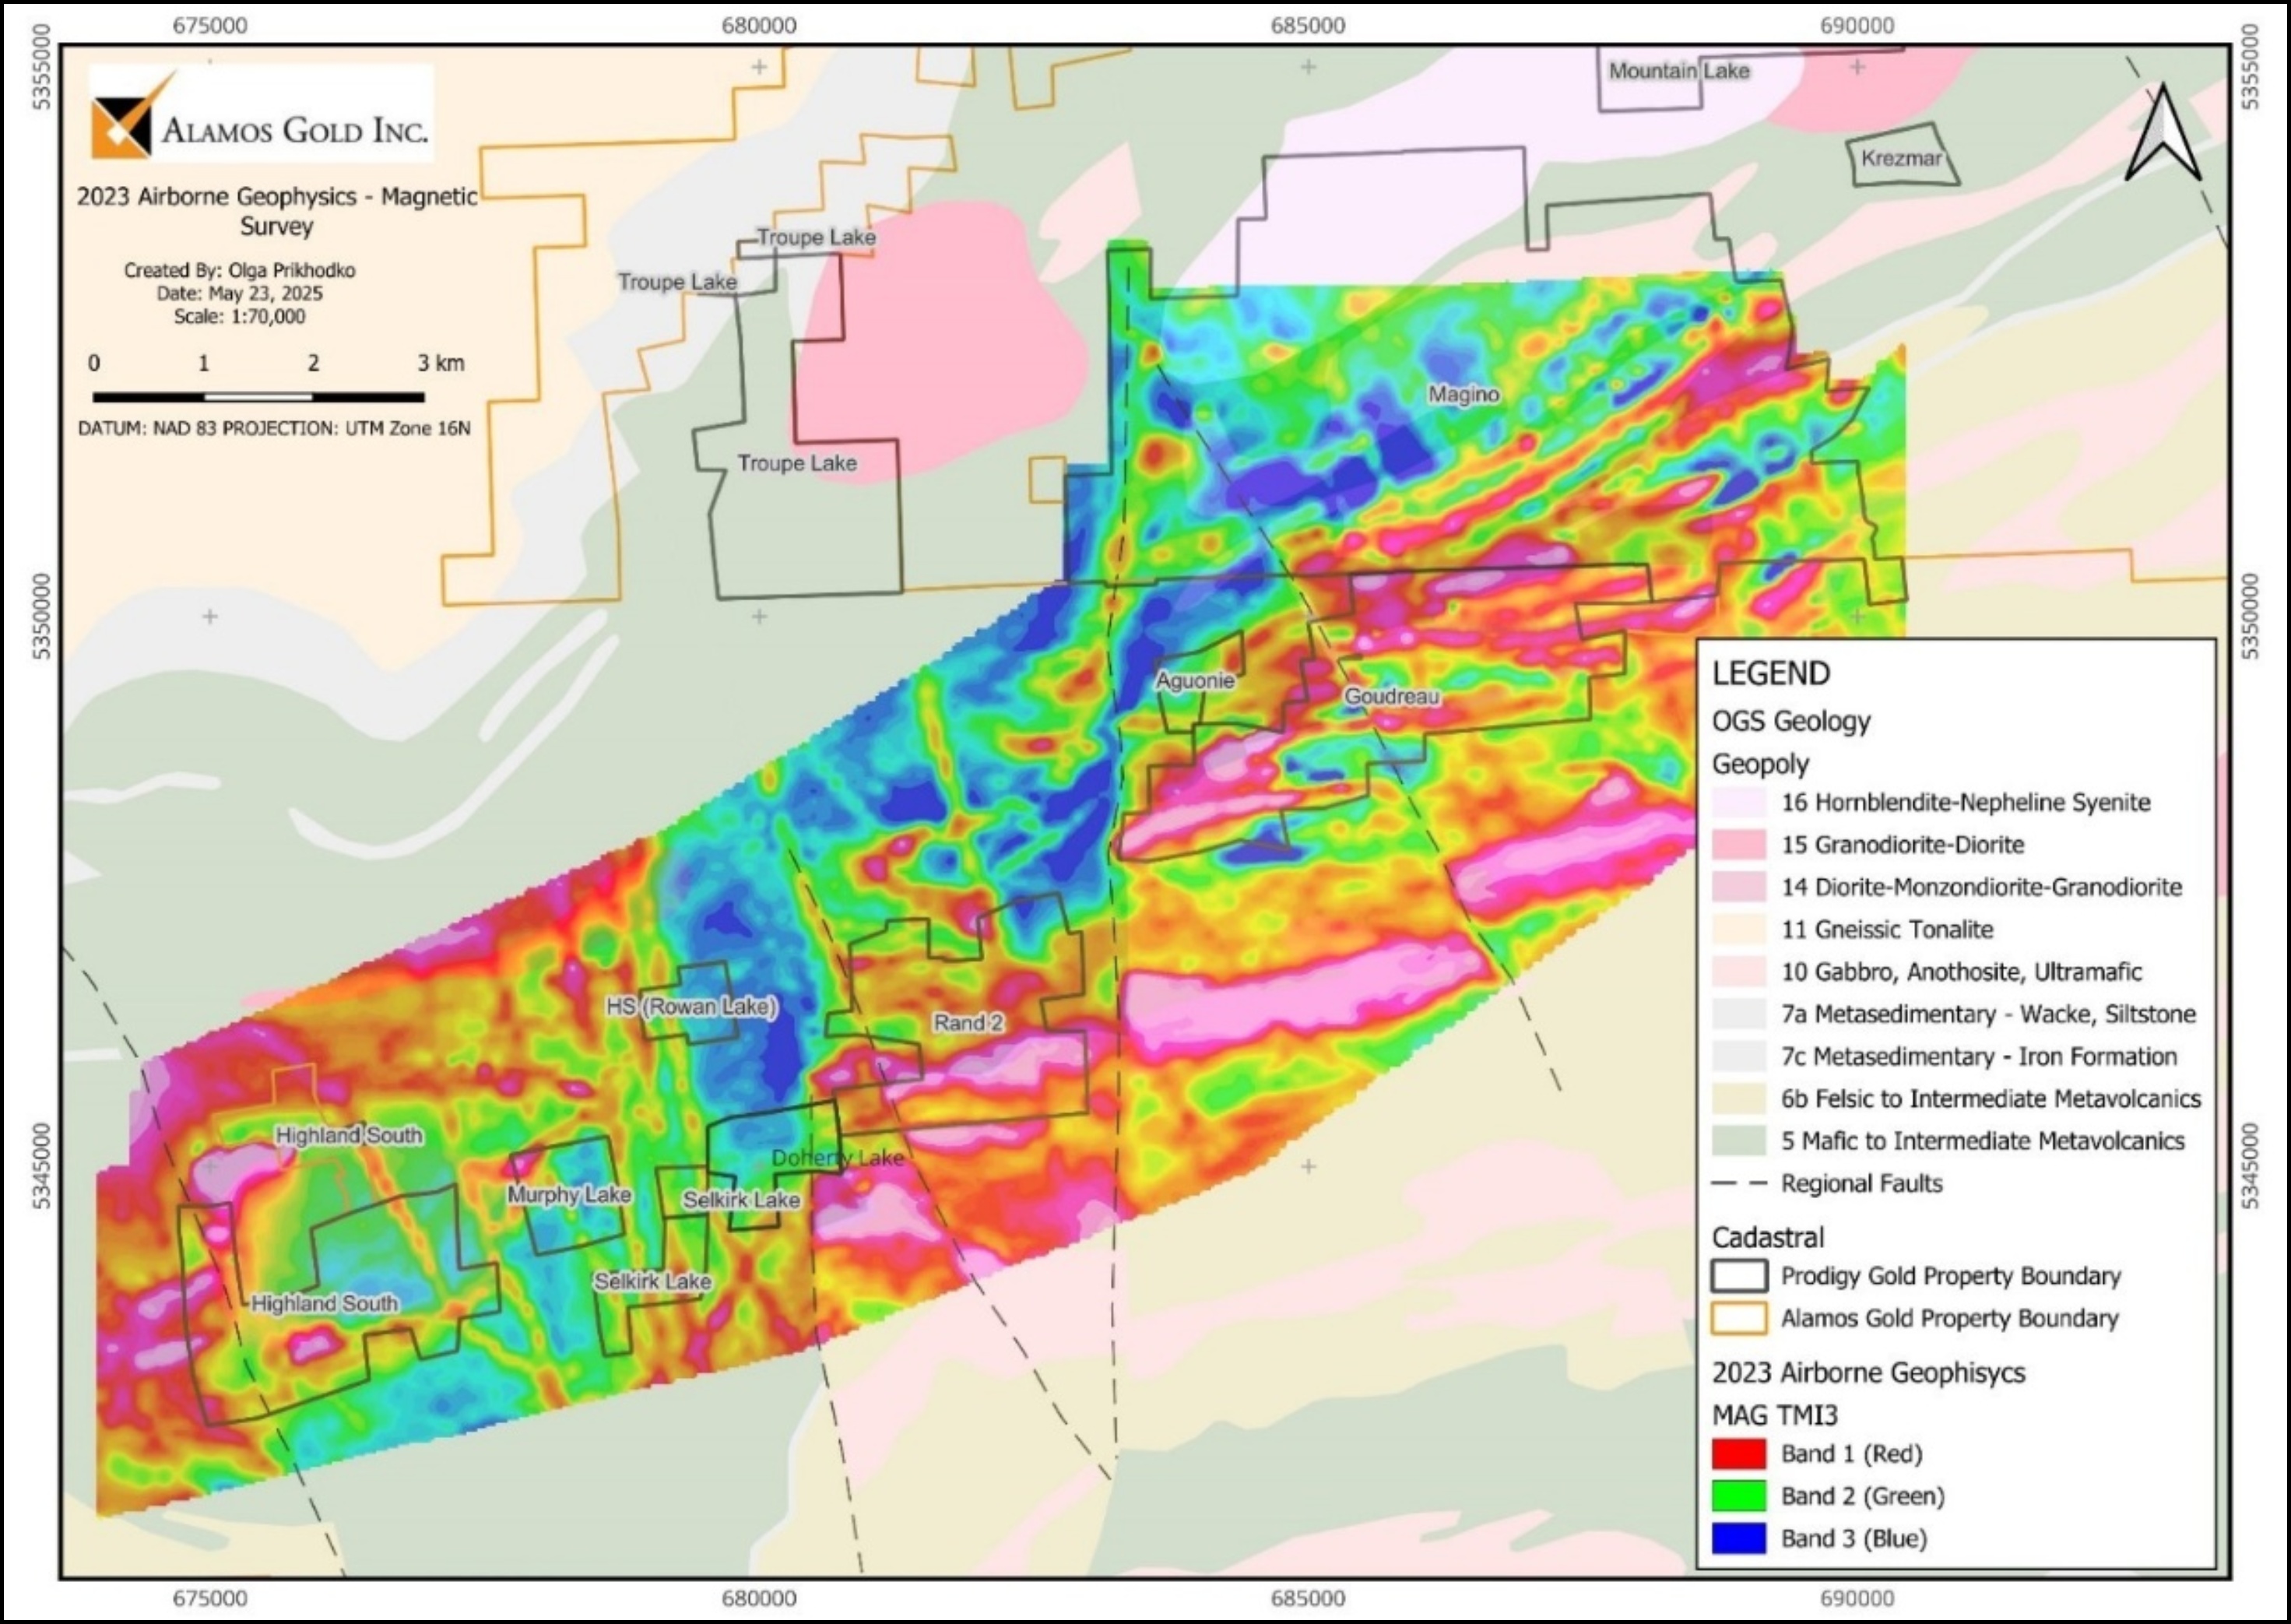
1.5 Geological Setting, Mineralization and Deposit Types
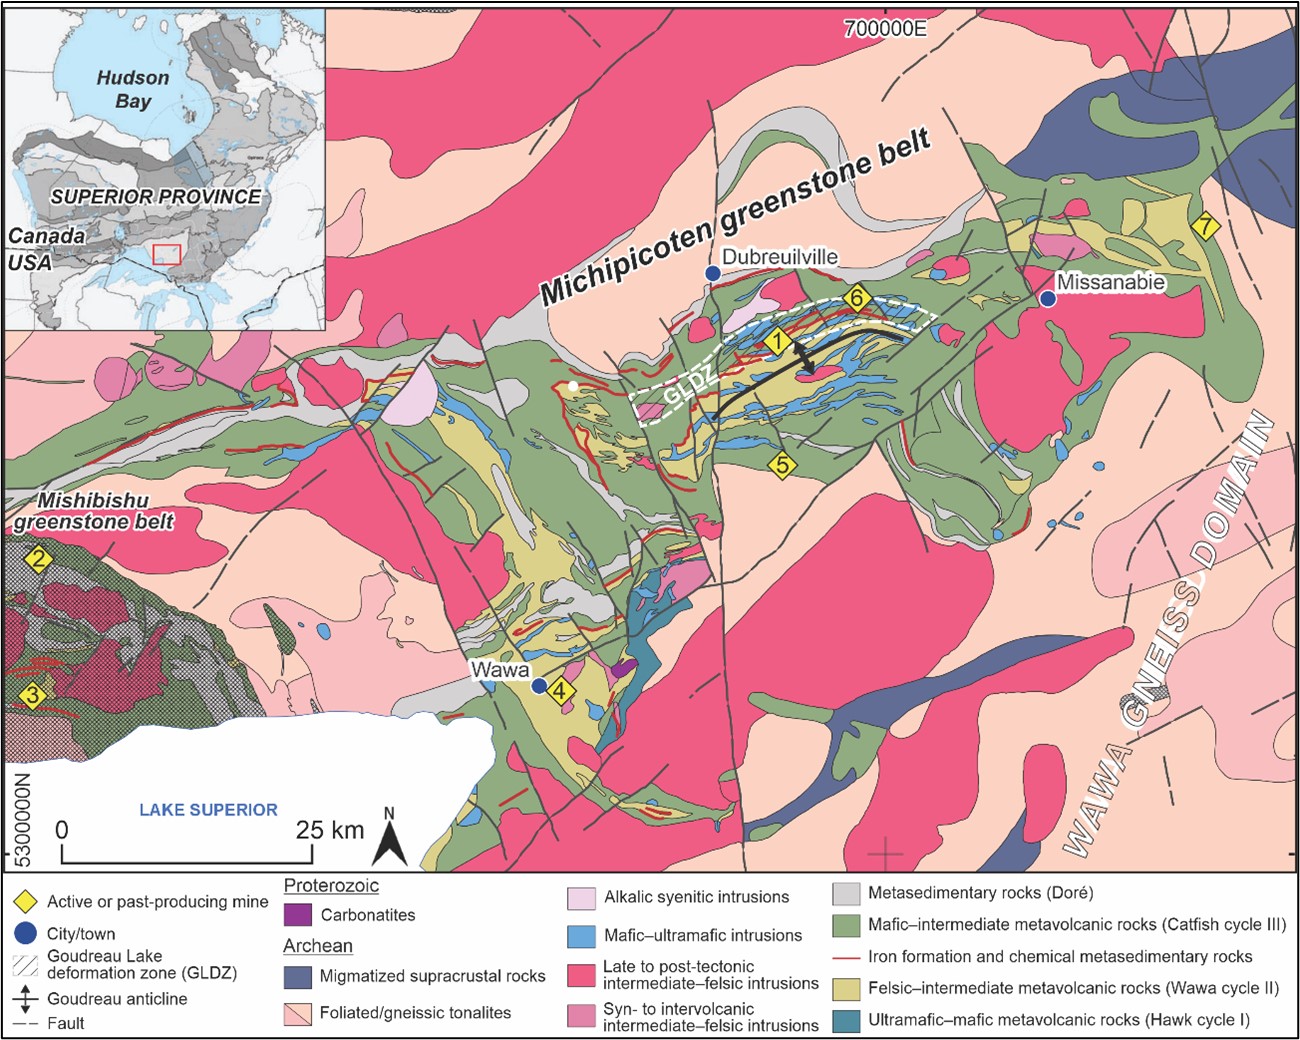
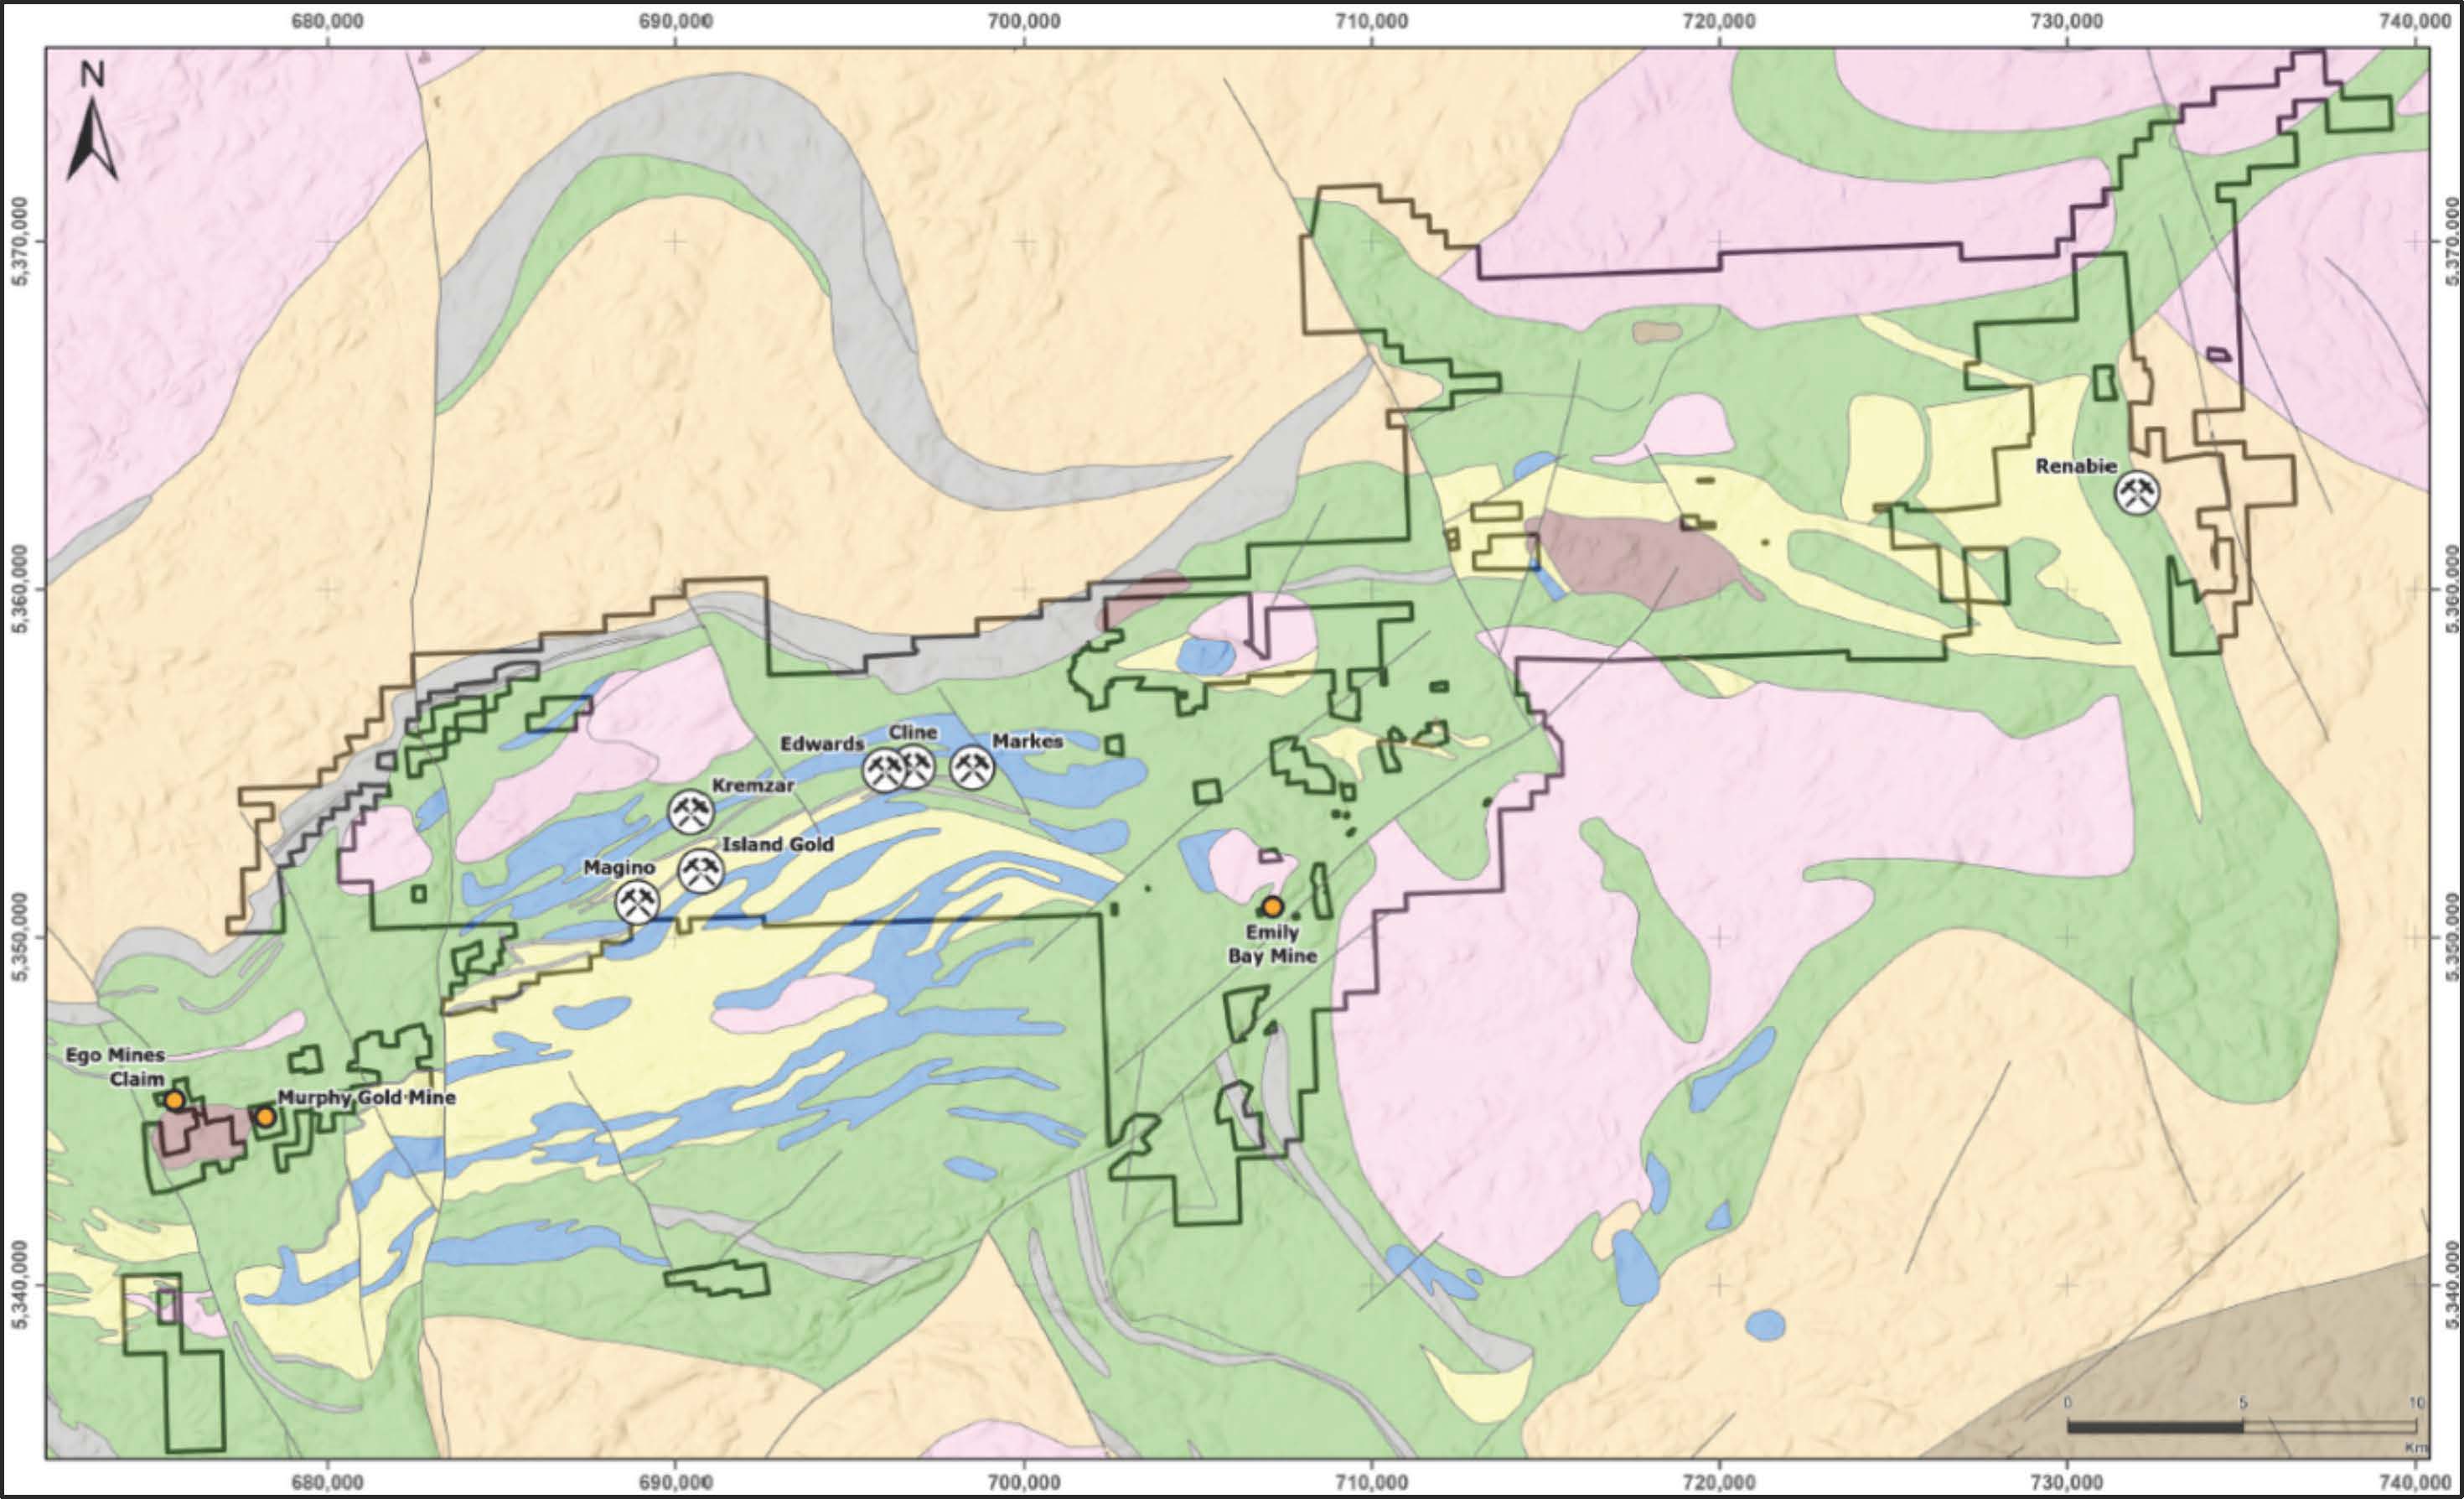
The Island Gold and Magino deposits are located in the Michipicoten Greenstone Belt (MGB) which is part of the Wawa Subprovince within the Archean Superior Province. The belt is east-west striking with an approximate length of 140 km and a maximum width of 40 km.
The MGB volcanic stratigraphy comprises three bimodal volcanic cycles with lower mafic and upper felsic sequences that are cut by syn-volcanic intrusions. The three volcanic cycles are separated by chemical sedimentary rocks, including Algoma-type iron formations. Rocks vary in age from 2,889 million years (Ma) for the Hawk Assemblage (Cycle I) to 2,750 Ma for the Wawa Assemblage (Cycle II), and to 2,700 Ma for the Catfish Assemblage (Cycle III). However, recent mapping and geochronological work suggests that volcanism may be more continuous than previously interpreted. The volcanic cycles are unconformably overlain by the Doré sedimentary rocks, a turbiditic sequence interpreted as the youngest supracrustal rocks in the MGB. Matachewan diabase dykes, lamprophyre dykes, as well as late- to post-tectonic alkalic to calc-alkalic intrusions and Proterozoic carbonatites intrude the folded and metamorphosed MGB supracrustal rocks.
The supracrustal rocks of the MGB have been repeatedly deformed and affected by regional greenschist to amphibolite-facies metamorphism. Early structures include major F1 recumbent folds, thrusts and associated cleavages. These early structures are refolded and crenulated by tight to isoclinal upright F2 folds with a steep penetrative regional S2 cleavage. The latest structures include northeast-trending shear zones that host auriferous vein systems and northerly-trending sinistral faults.
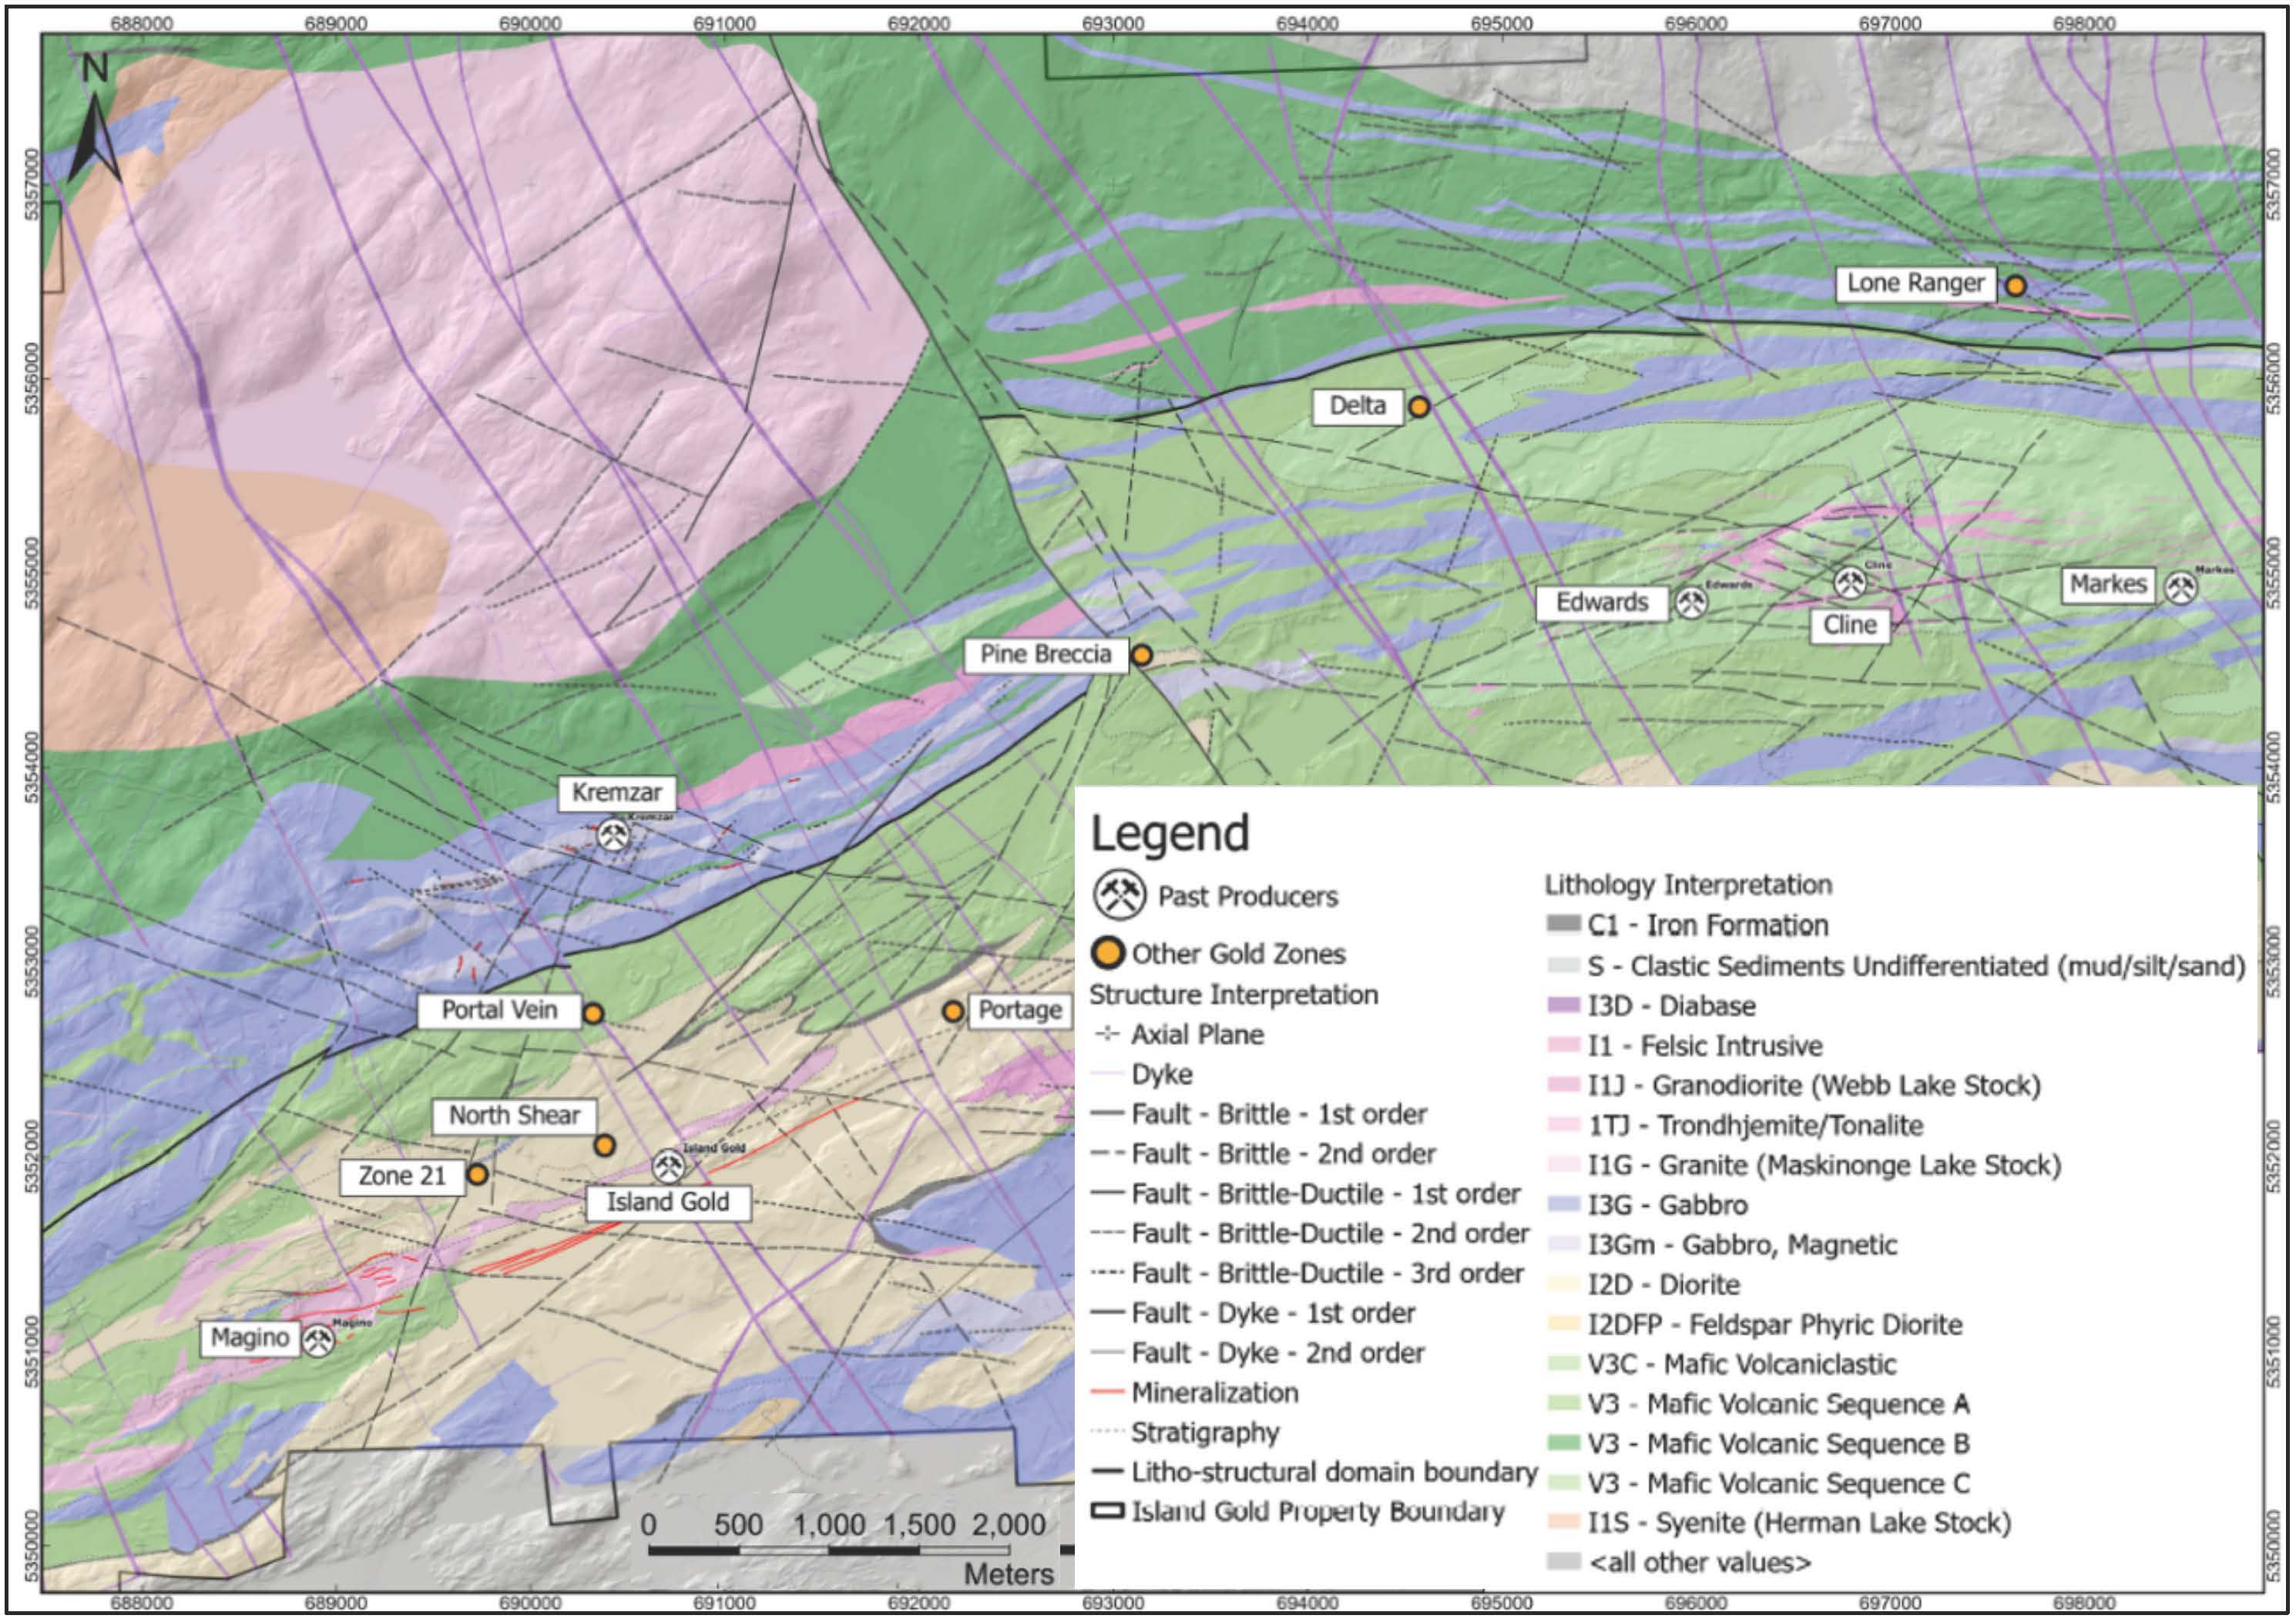
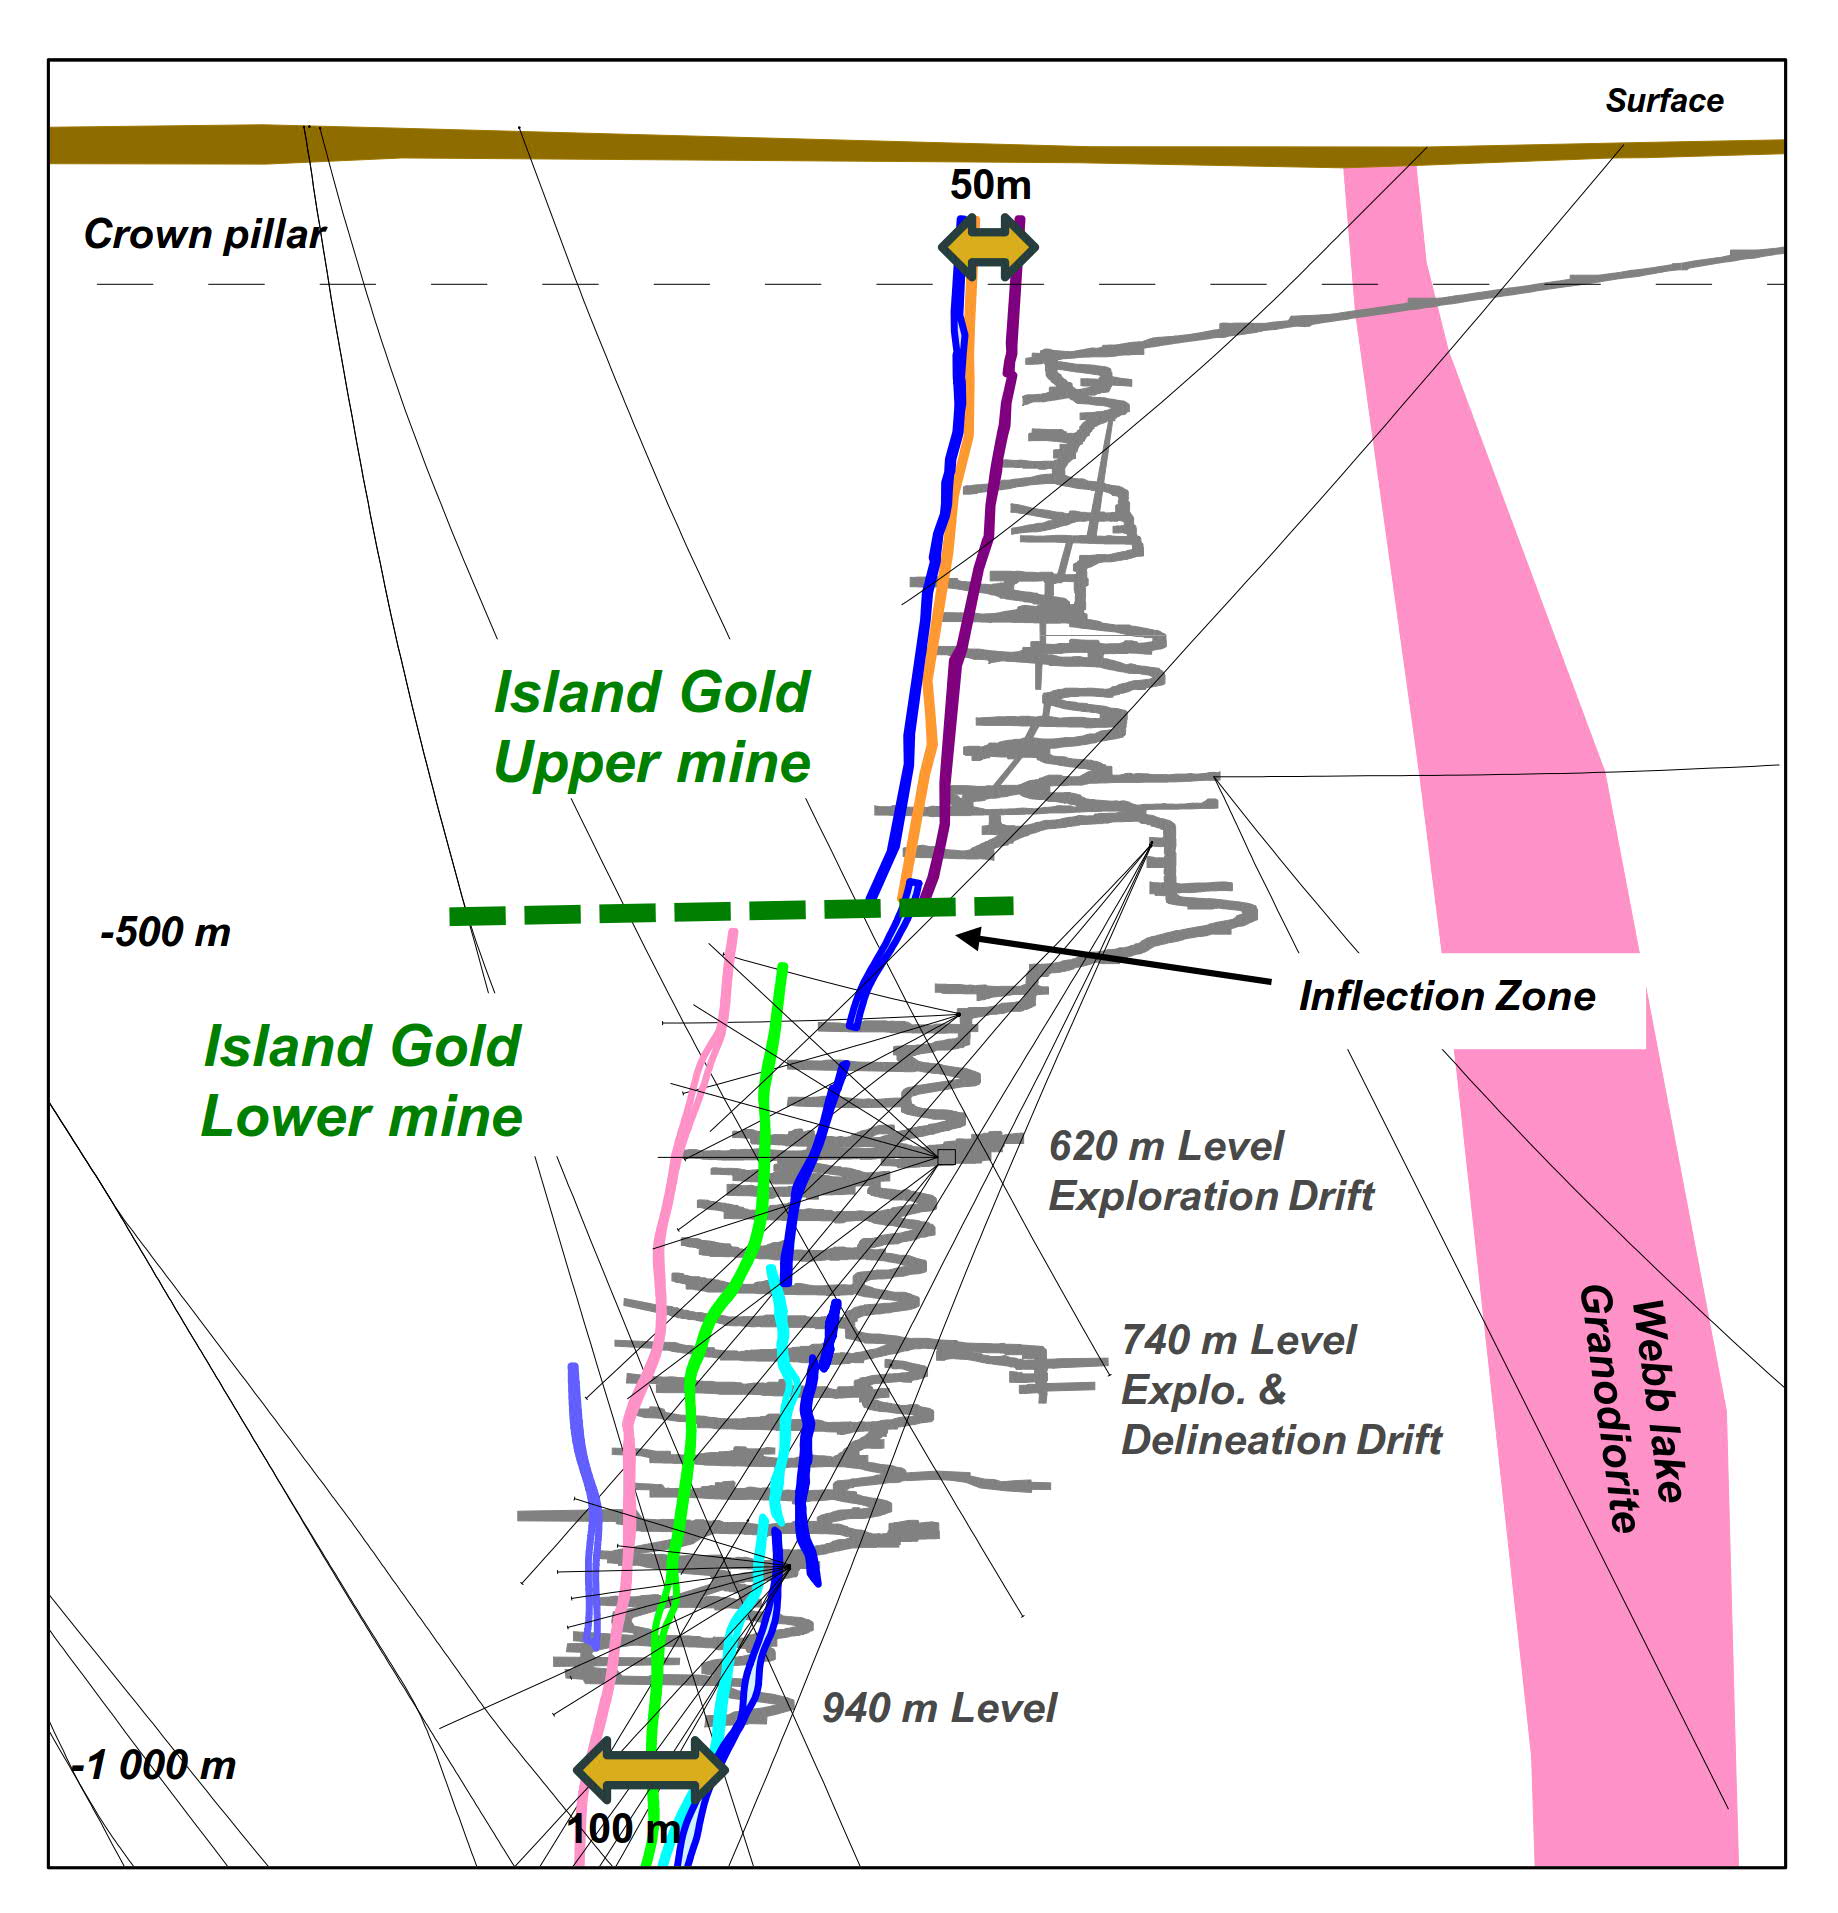
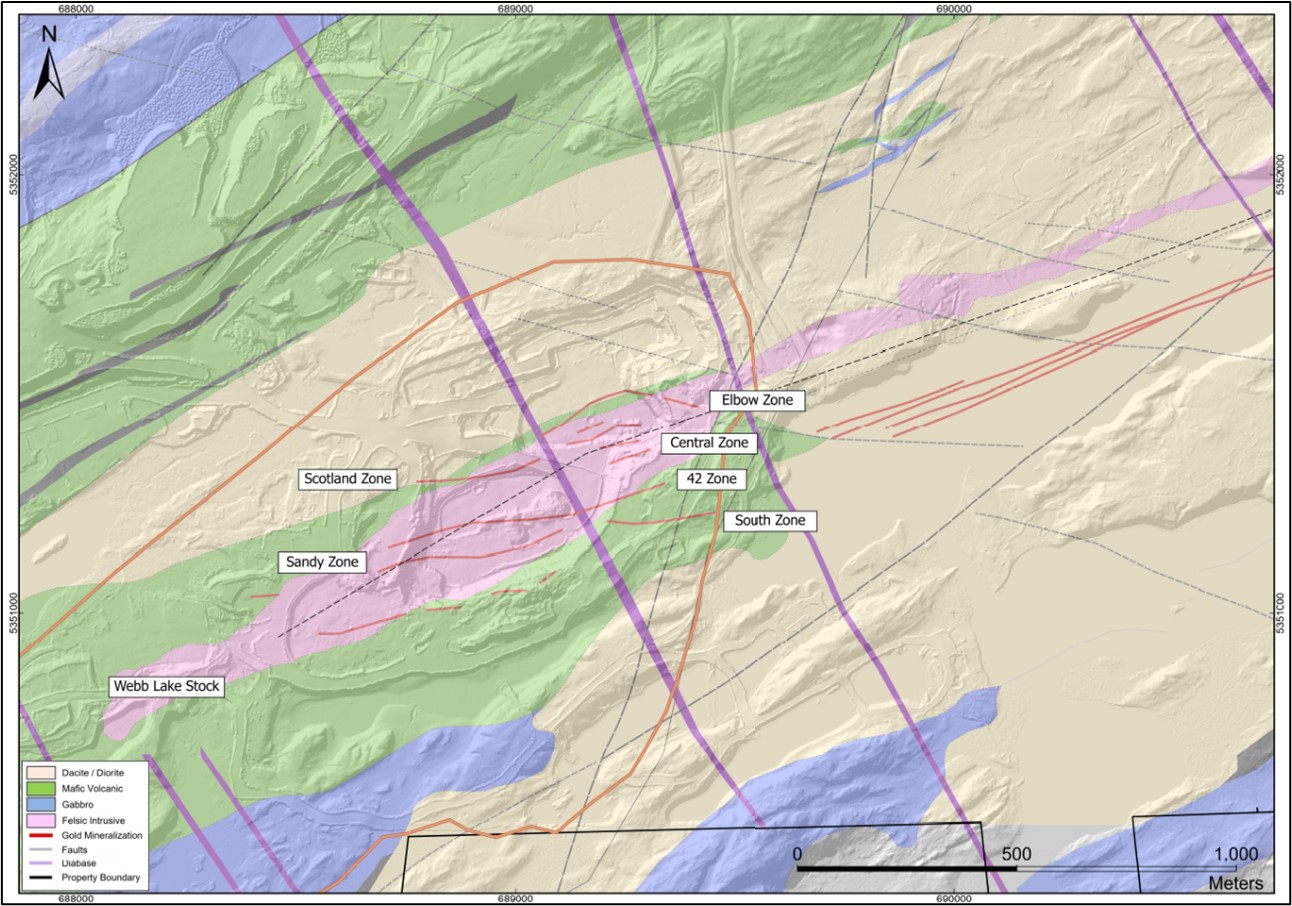
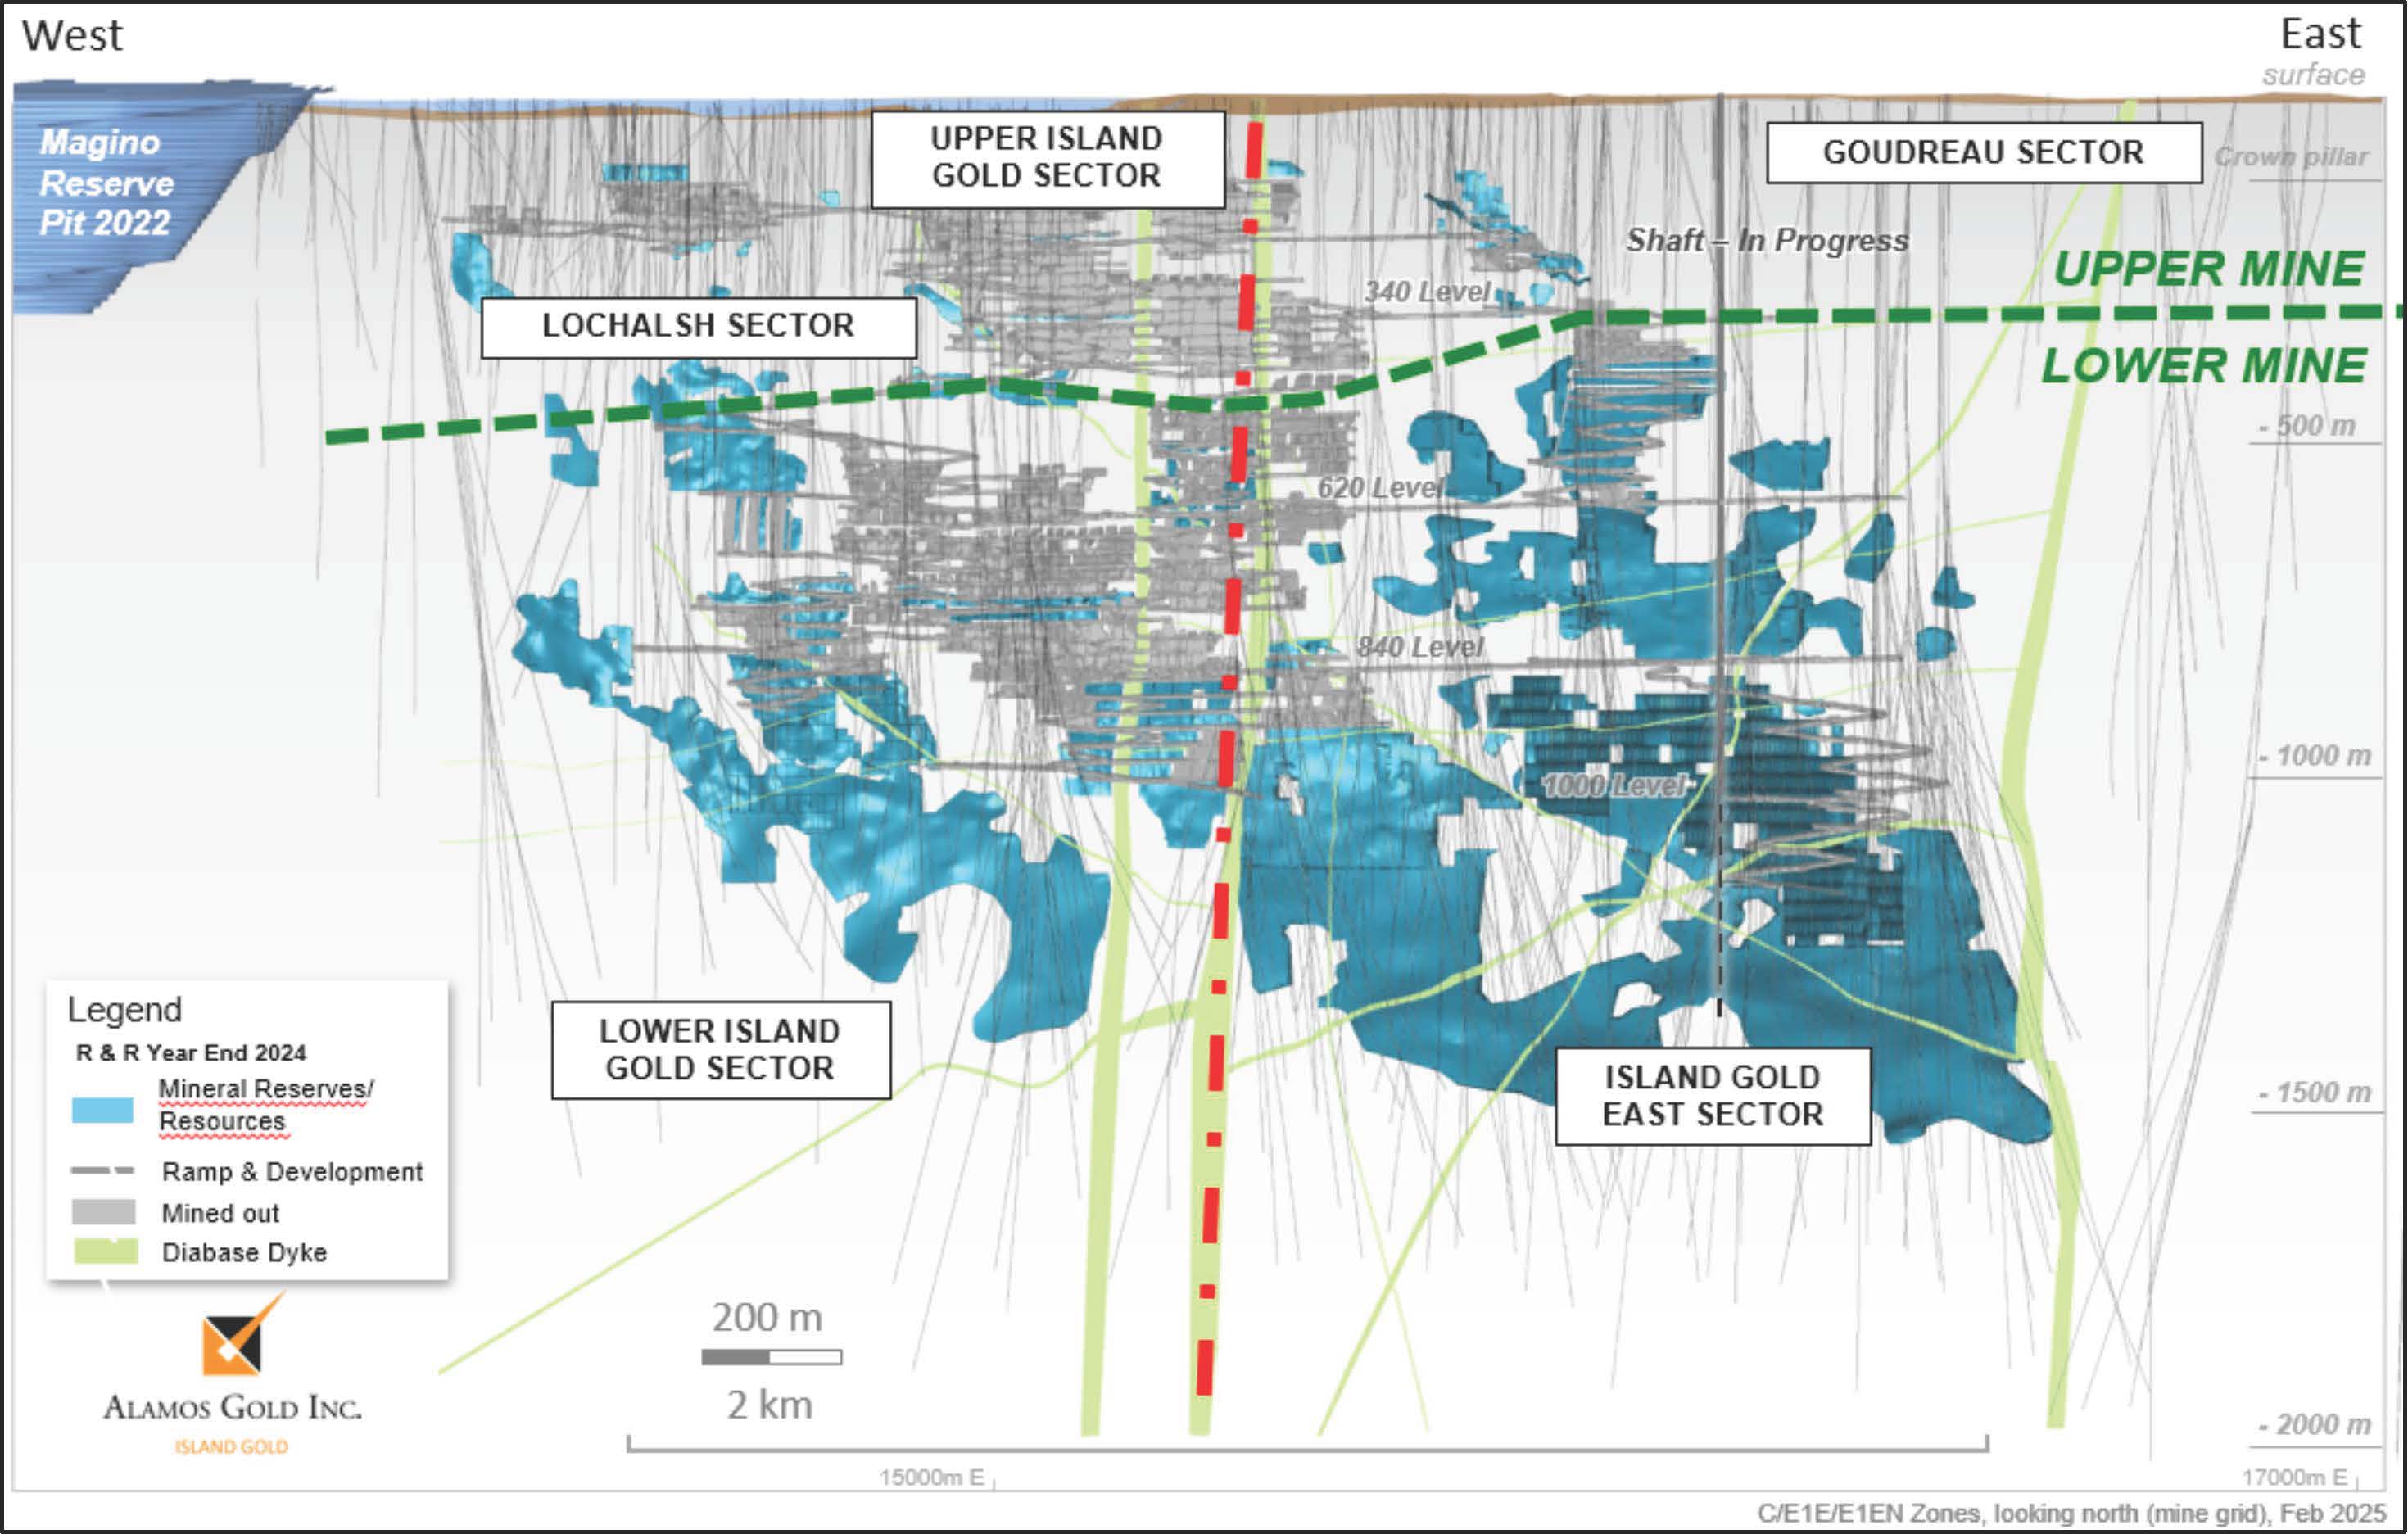
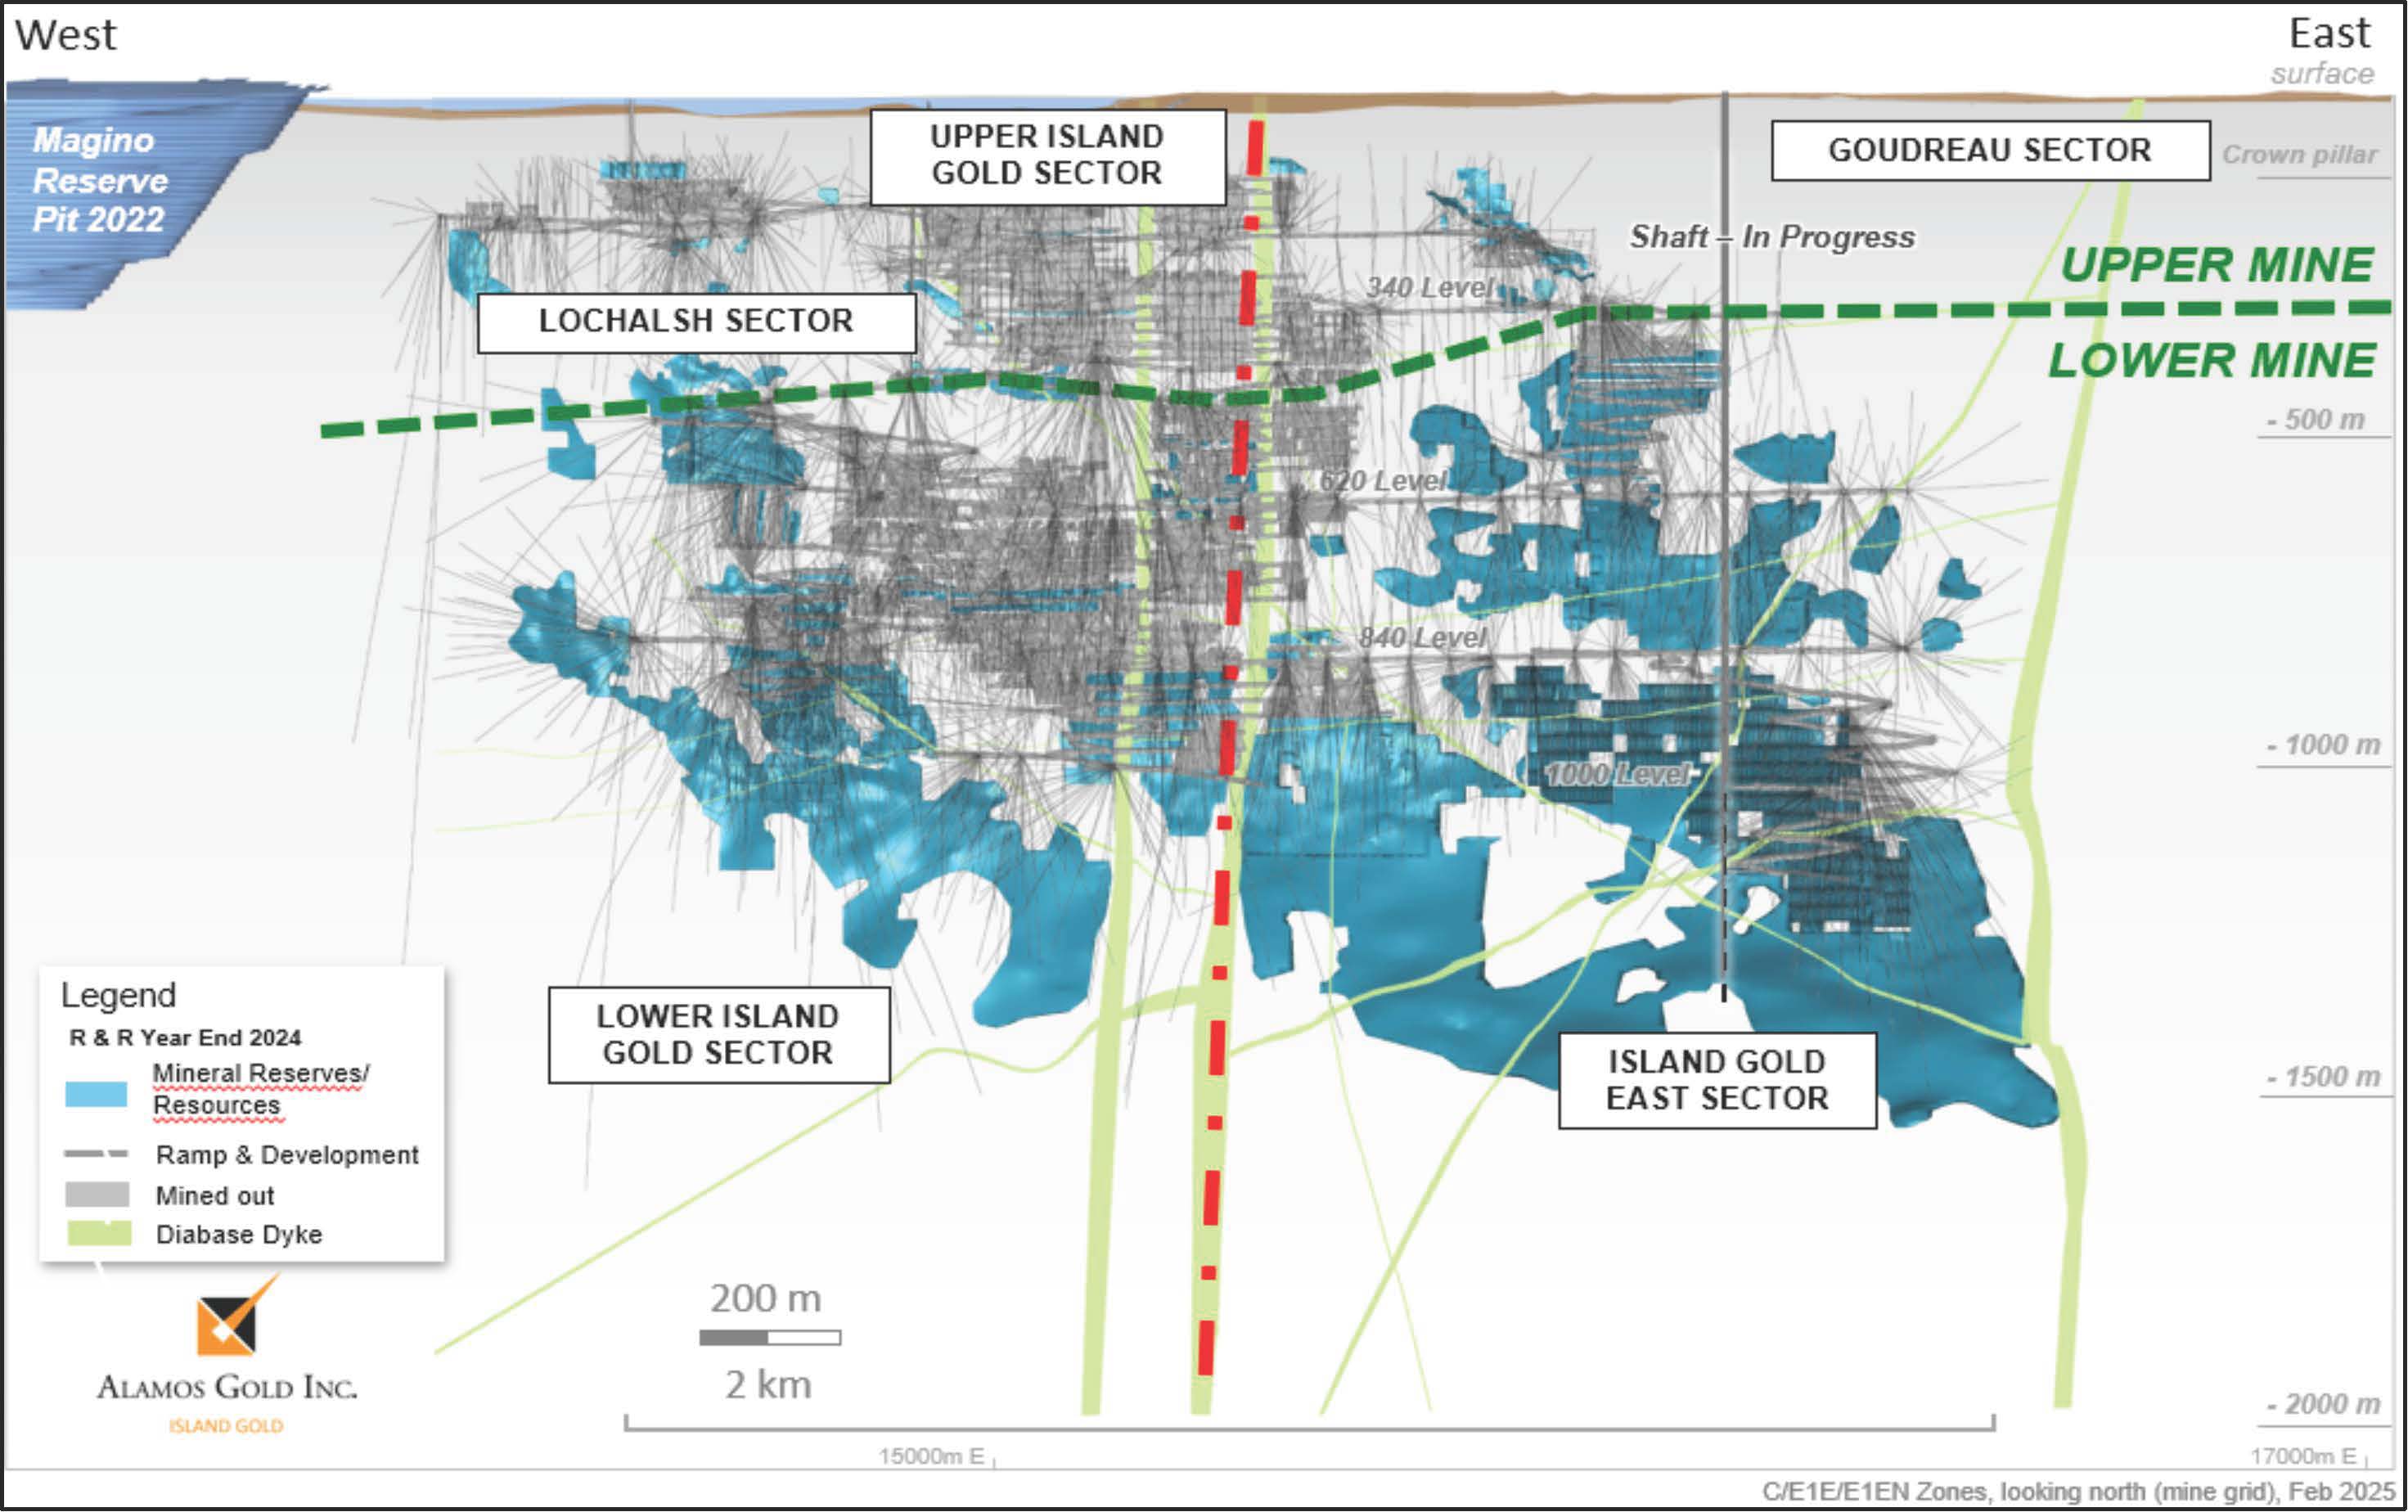
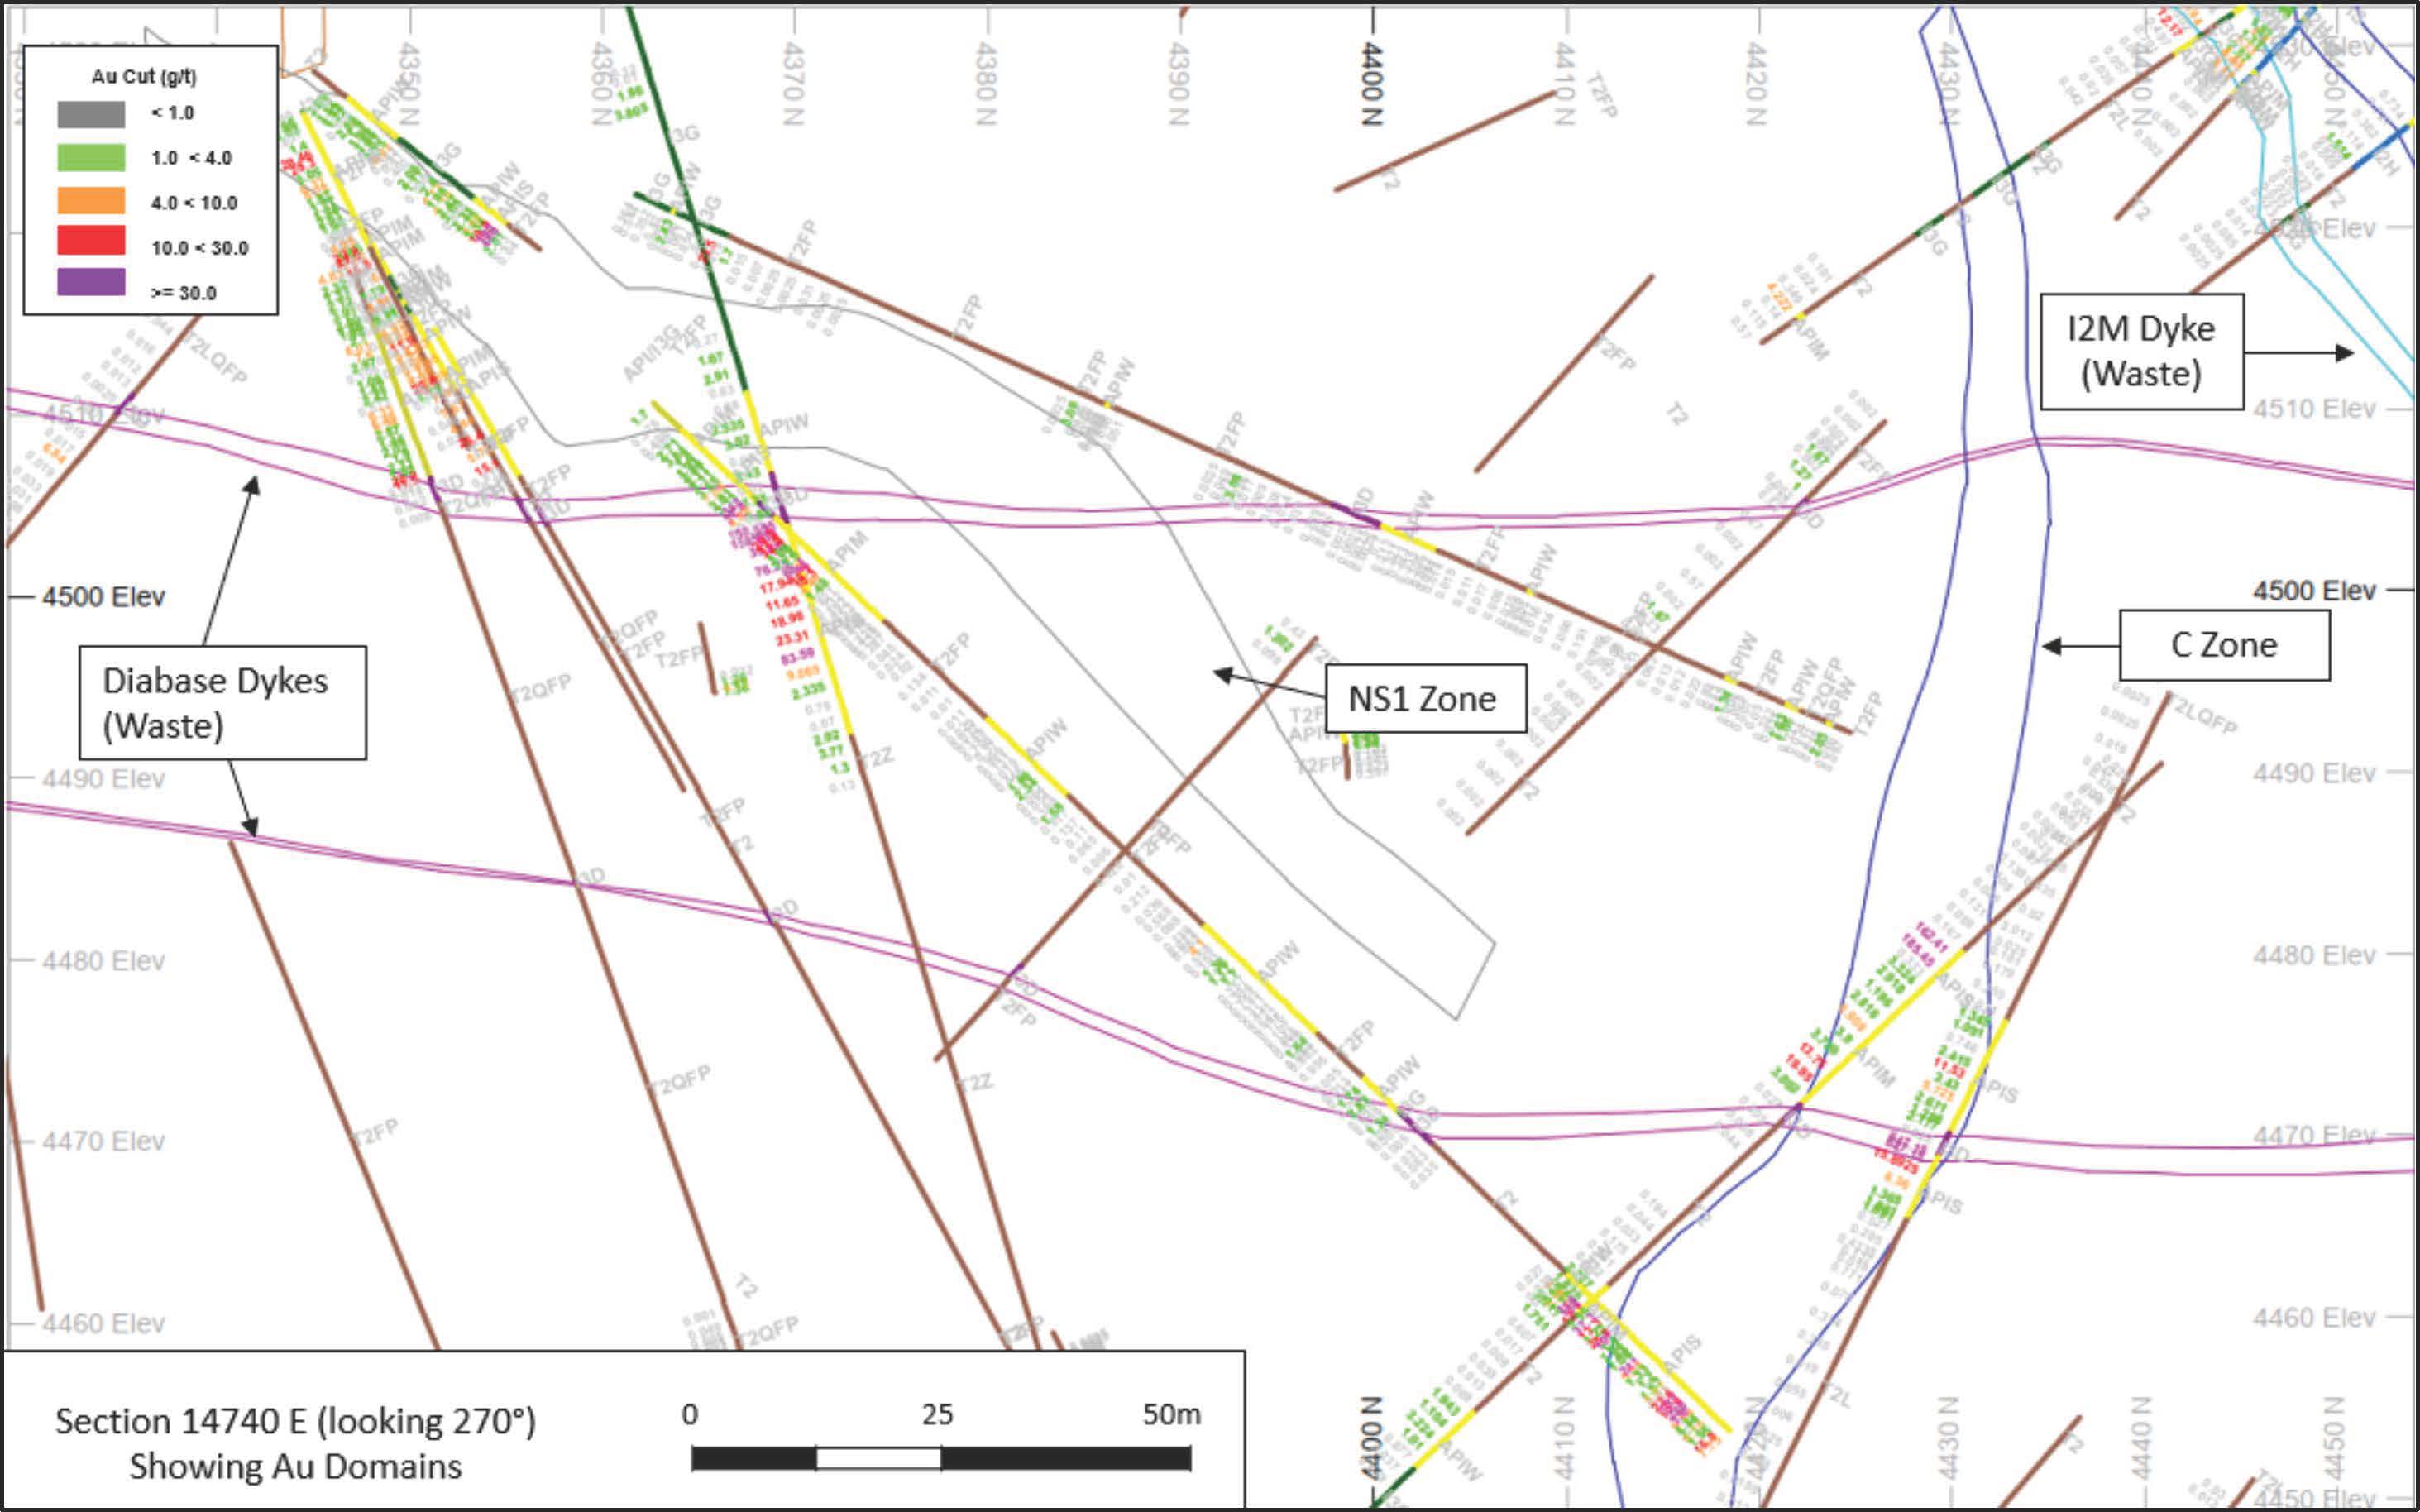
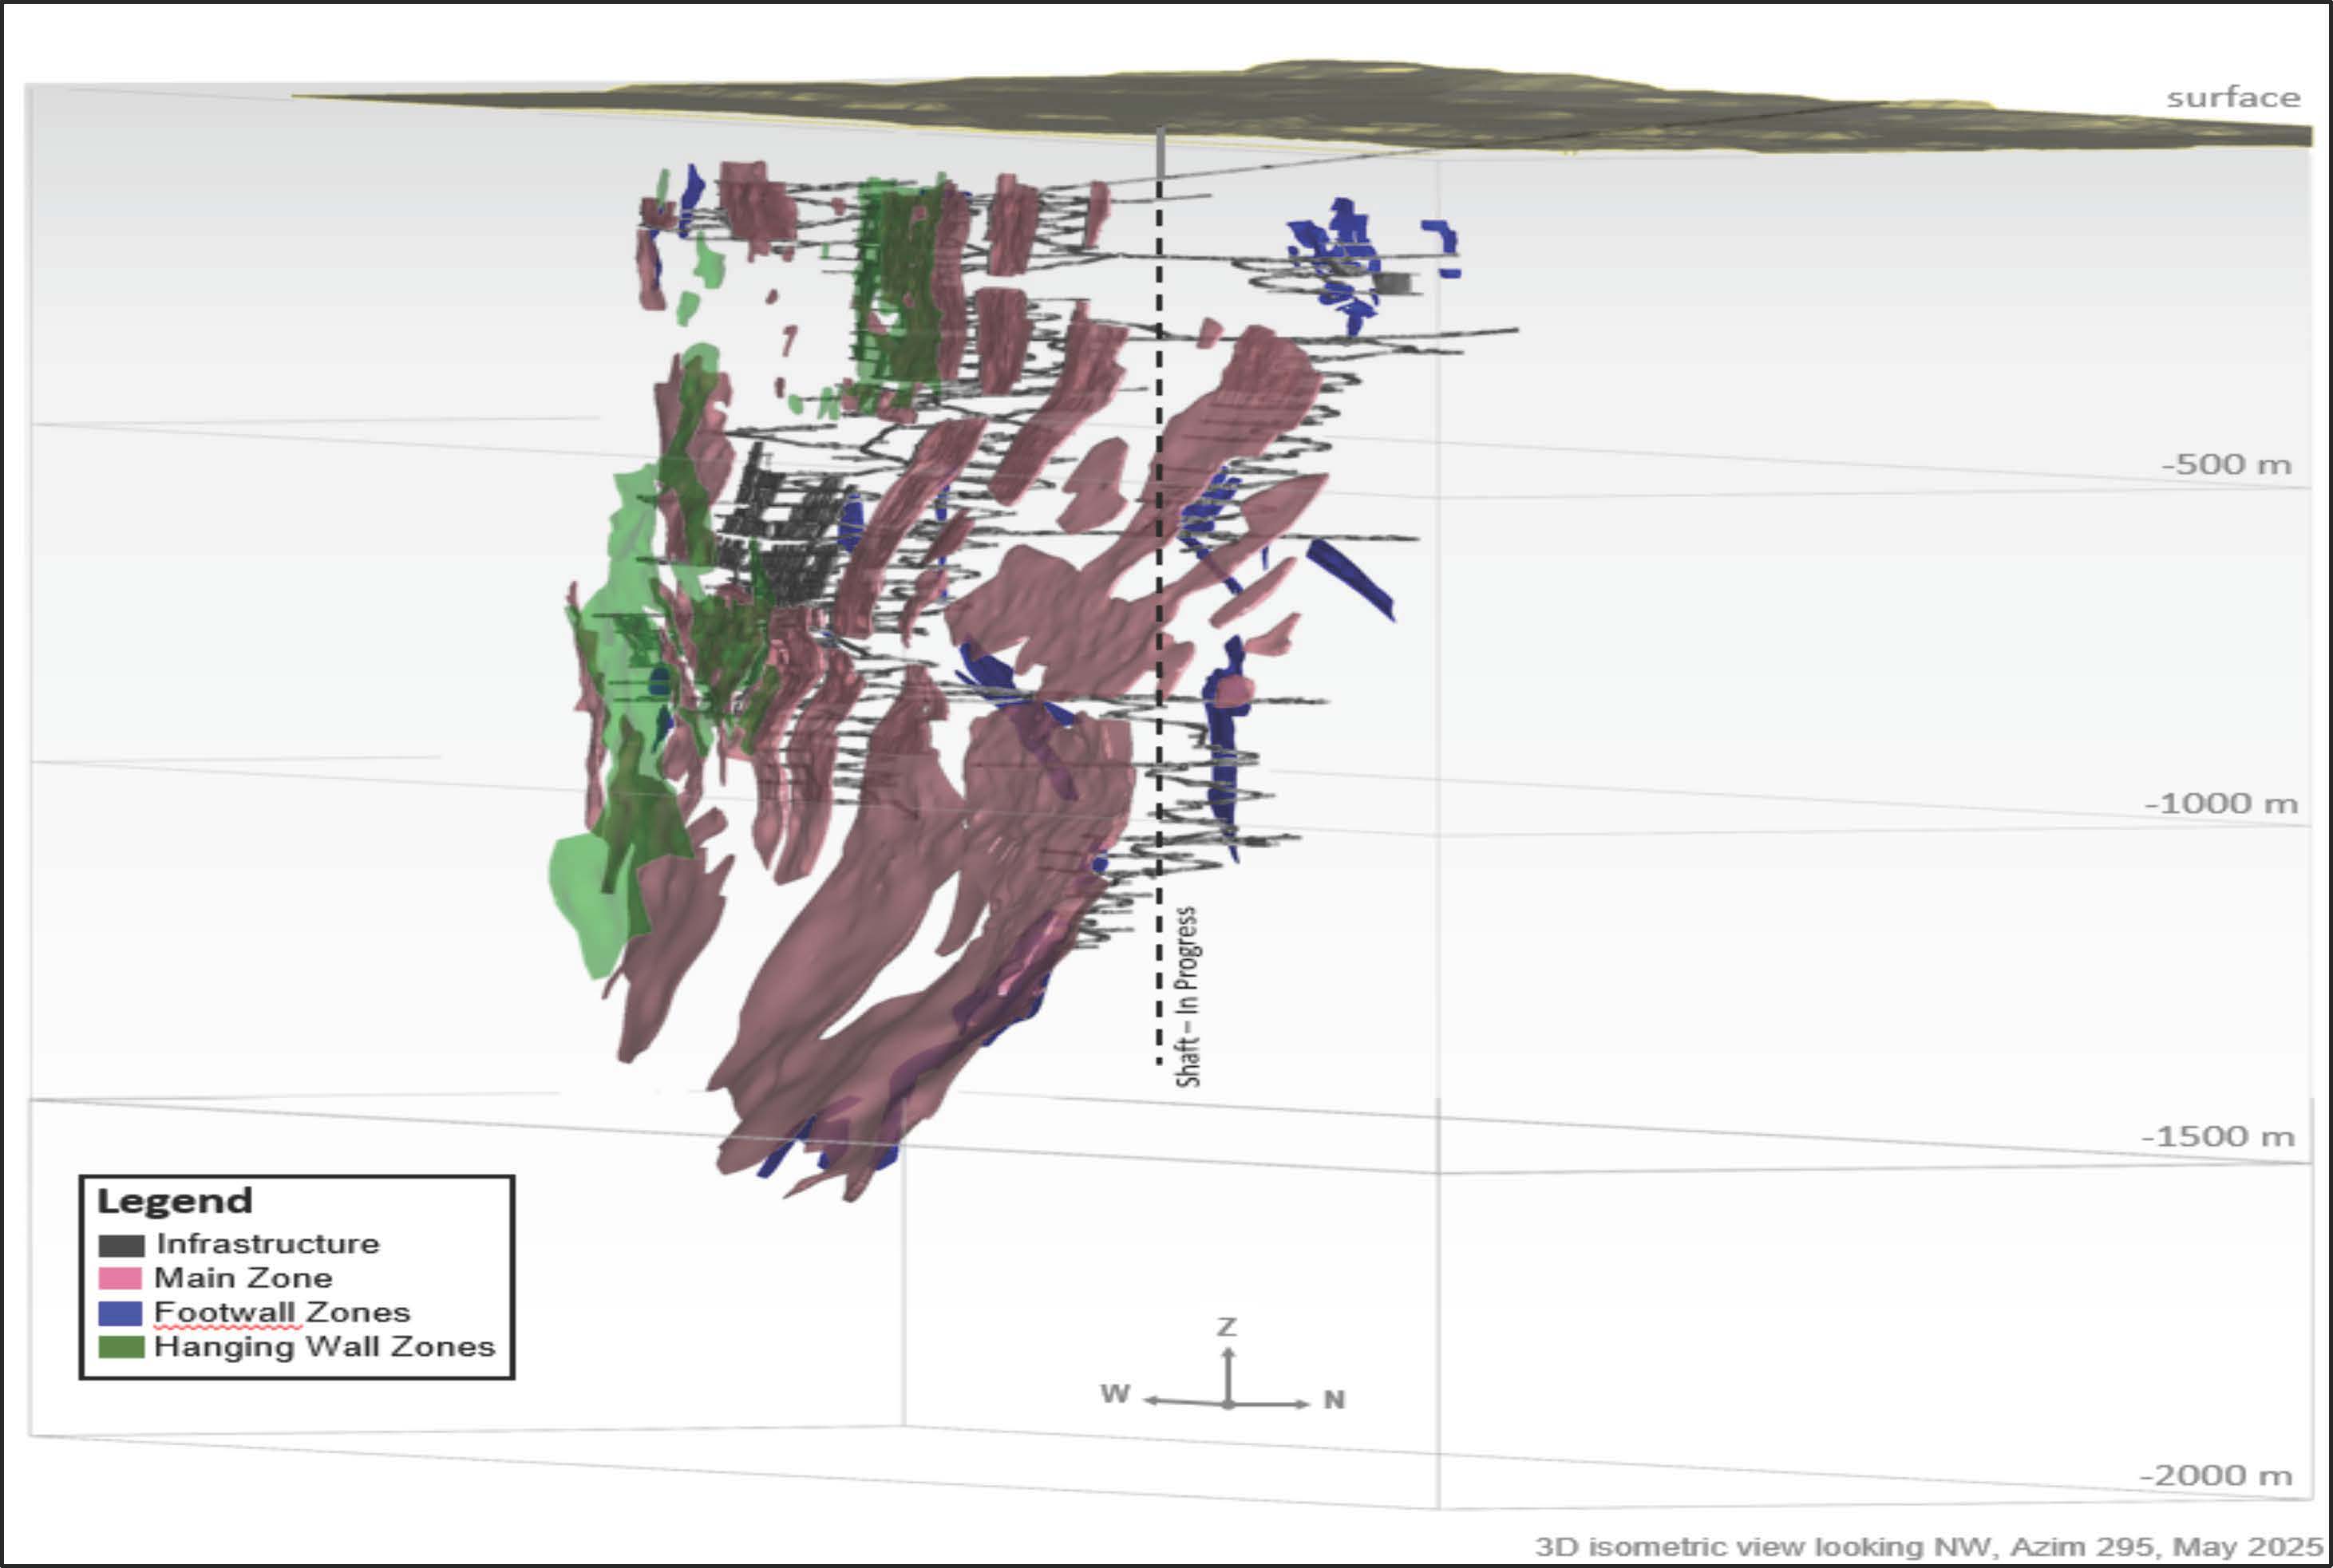
A regional northeast-trending deformation zone called the Goudreau Lake Deformation Zone (GLDZ) is situated in the Island Gold and Magino deposit areas, at the interface of the Wawa and Catfish Assemblage cycles. The GLDZ has been traced along strike for 30 km with a width of 4.5 km and is believed to be the main control of gold mineralization for the Island Gold and Magino deposits. It is a high angle, oblique-slip, fault zone with an overall dextral movement cutting stratigraphy at a shallow angle. The Island Gold and Magino gold deposits occur as a sequence of stacked east-northeast striking, steeply dipping, and subparallel zones of gold mineralization within the GLDZ.
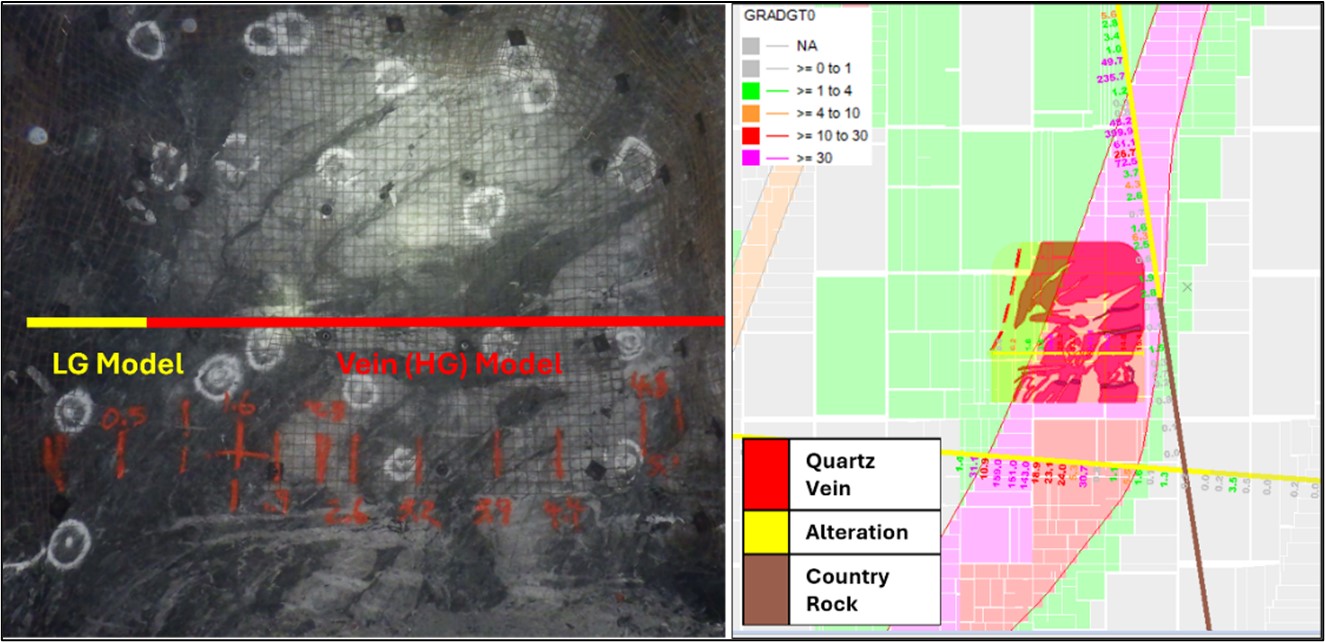
The Island Gold and Magino deposits are both considered Archean orogenic lode gold deposits. Both deposits occur within the GLDZ and are part of the same system; however, they are hosted within different lithologies. Island Gold is a high-grade structurally hosted quartz-carbonate vein system hosted within felsic to intermediate volcanics, whereas gold mineralization at Magino occurs primarily within the tonalitic Webb Lake Stock with the first gold mineralizing event coincident with the emplacement of the stock, and the second later event associated with gold overprinting and remobilization during deformation within the GLDZ, a major regional brittle-ductile structure. The host terrane is a sequence of felsic to intermediate volcanic and intrusive rocks of the Wawa Assemblage which are in the greenschist to amphibolite metamorphic range as is common for this type of deposit.
| | | | | |
Island Gold District – NI 43-101 Technical Report August 6, 2025 | 19
|
1.6 Sample Preparation, Analyses and Security
Island Gold and Magino have had historically different sample preparation, analysis and security policies and procedures. As part of the integration of the two operations, these policies and procedures are under review with the objective of standardization of the policies and procedures within the District.
Intervals selected for sampling are determined by a geologist during core logging. Sampling is conducted over mineralized zones at regular intervals. Where present, lithological boundaries - such as geological contacts or alteration zones - are used to constrain sample intervals. Sample locations are identified and marked on the core by the geologist during the logging process. Corresponding sample tags are inserted beneath the core within the core boxes at the end of each designated interval. Sample interval data, including sample numbers and associated quality control materials (standards and blanks), are manually recorded in the project database by District personnel.
The acQuire databases, which store all drill core and channel sample logs, assays, and surveys, are securely maintained on Island Gold’s private network. Access is restricted to employees directly involved in the process, with security groups limiting everyone to only the necessary sections of the database. Access is granted exclusively by a supervisor in the Geology Department.
Sample intervals, sample numbers, and the insertion of quality control samples - including CRMs and blanks - are manually recorded in the database by geologists at Island Gold. Upon completion of analytical work, assay results are delivered by the laboratories via email in CSV and PDF formats to designated Island Gold personnel. These results are electronically uploaded into the project database using a custom in-house application, which automatically matches assay data to the corresponding sample numbers, thereby eliminating the need for manual data entry at this stage.
Island Gold
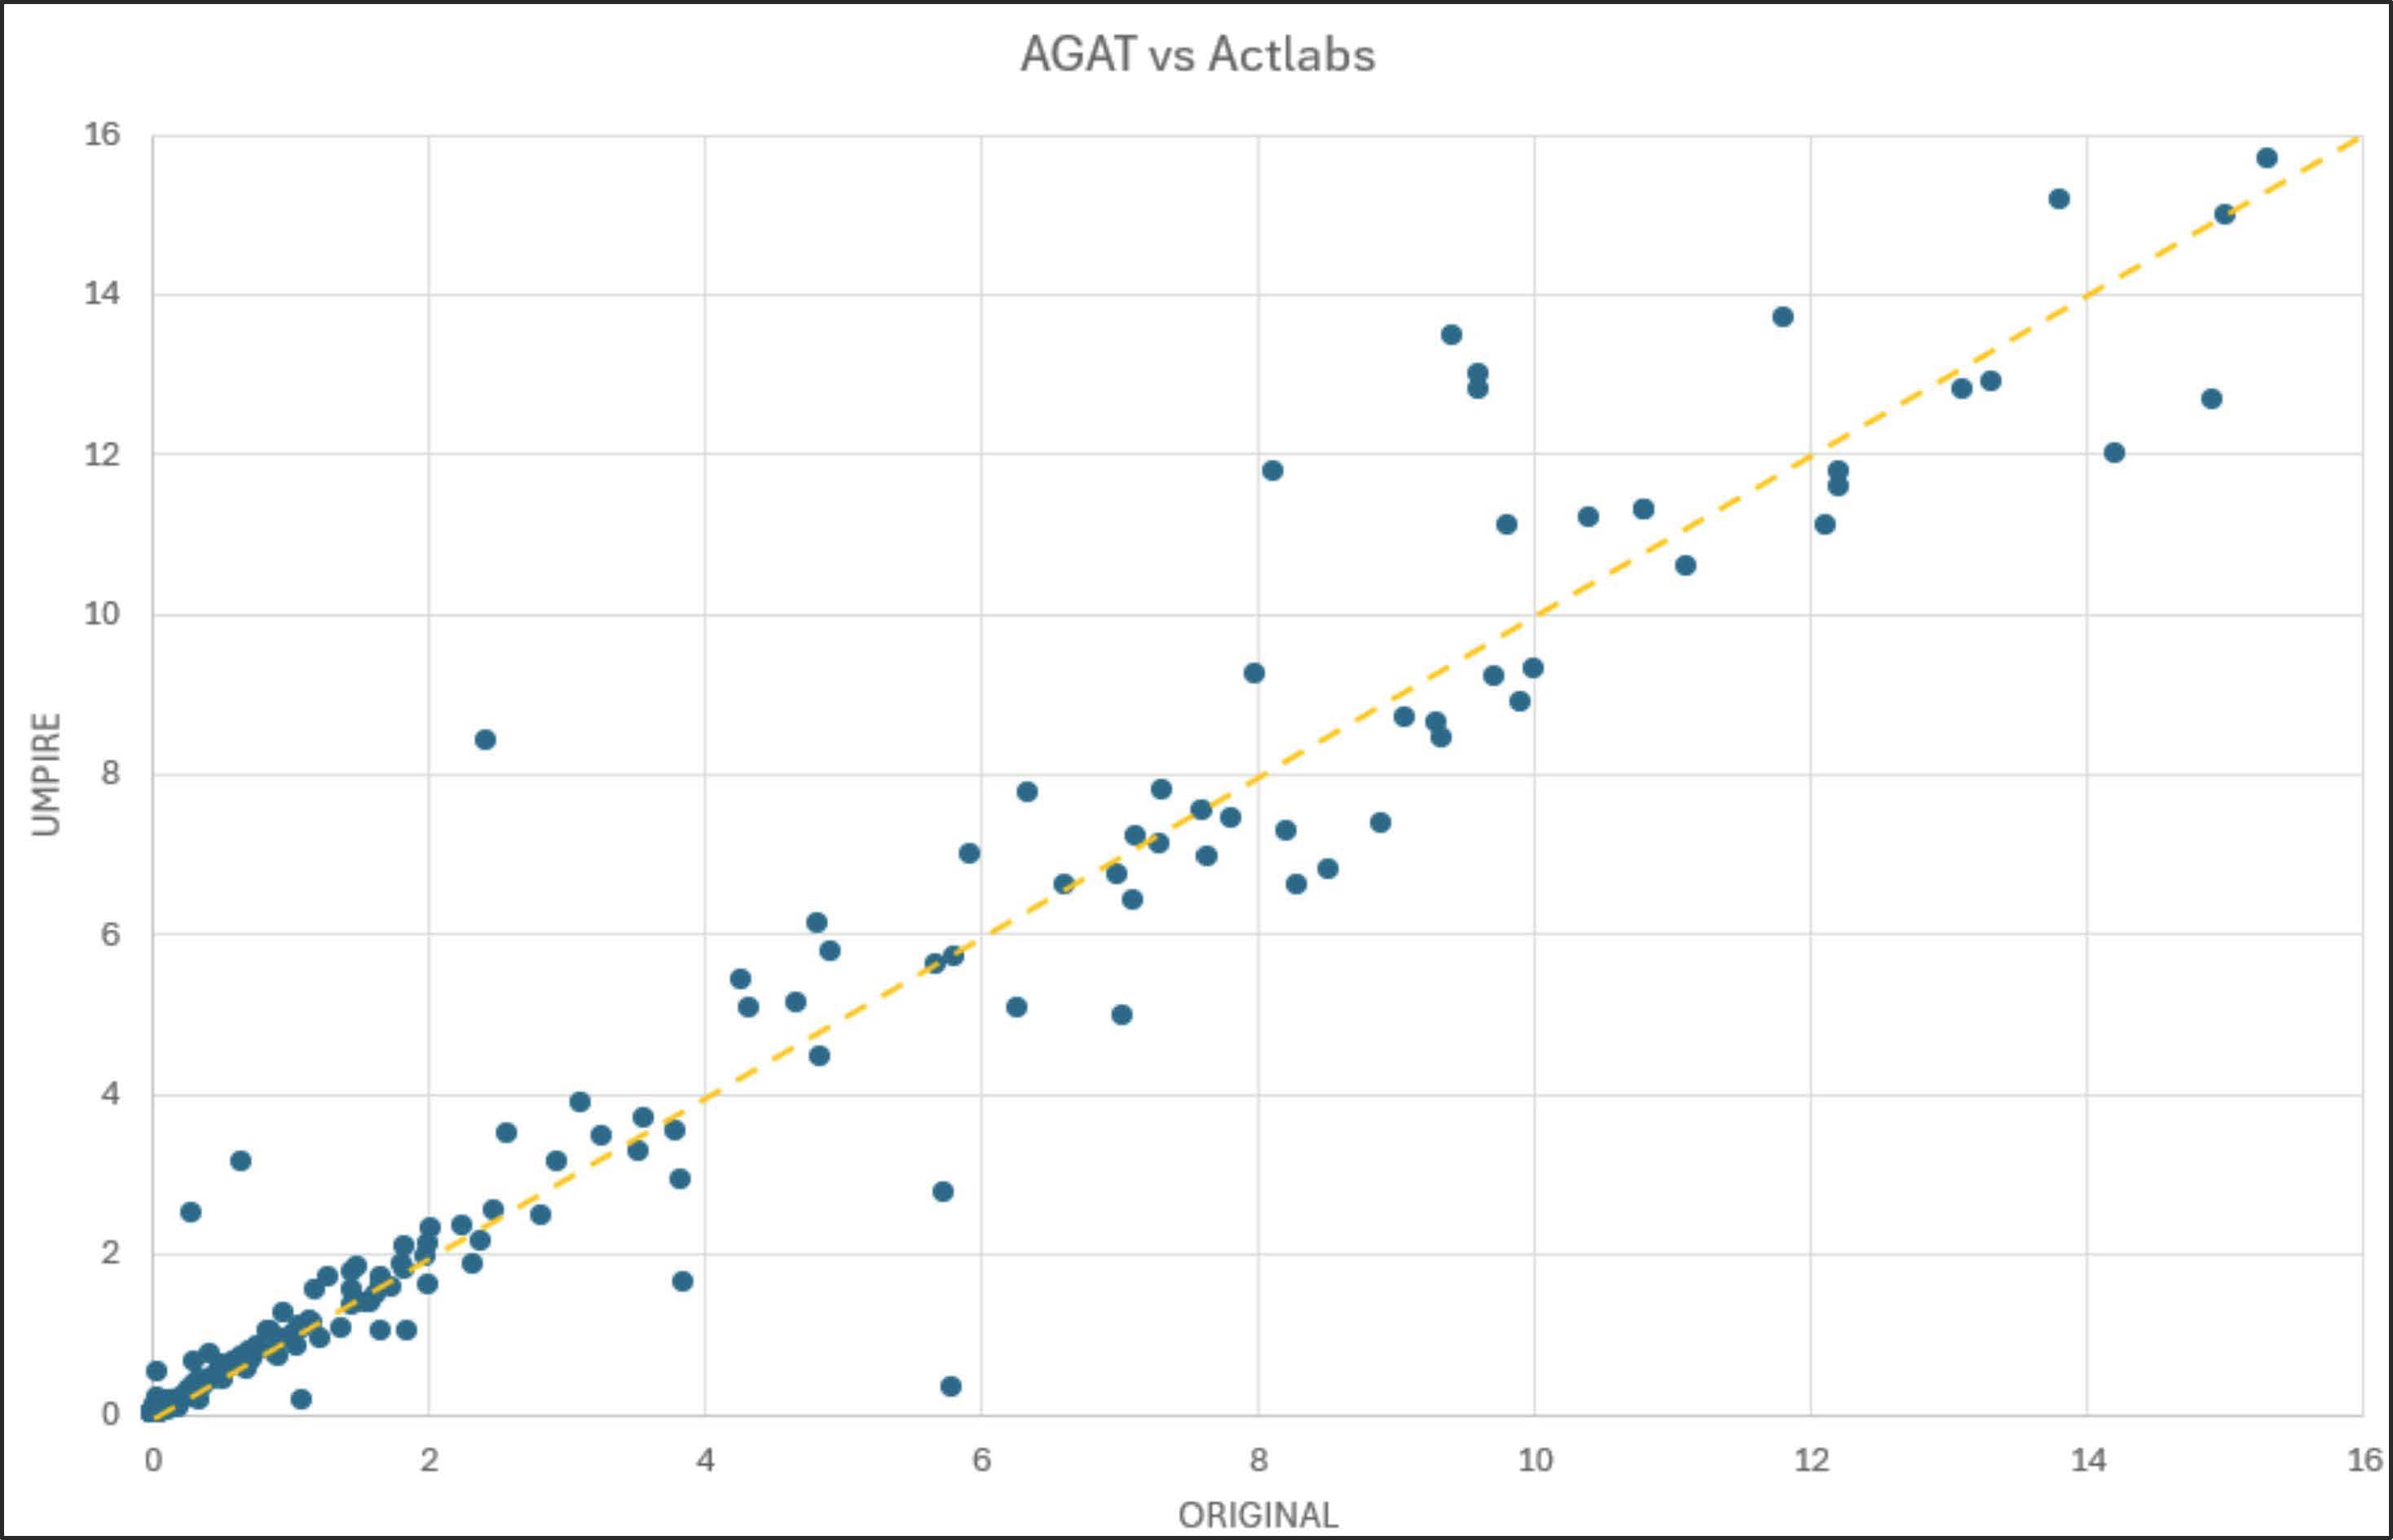
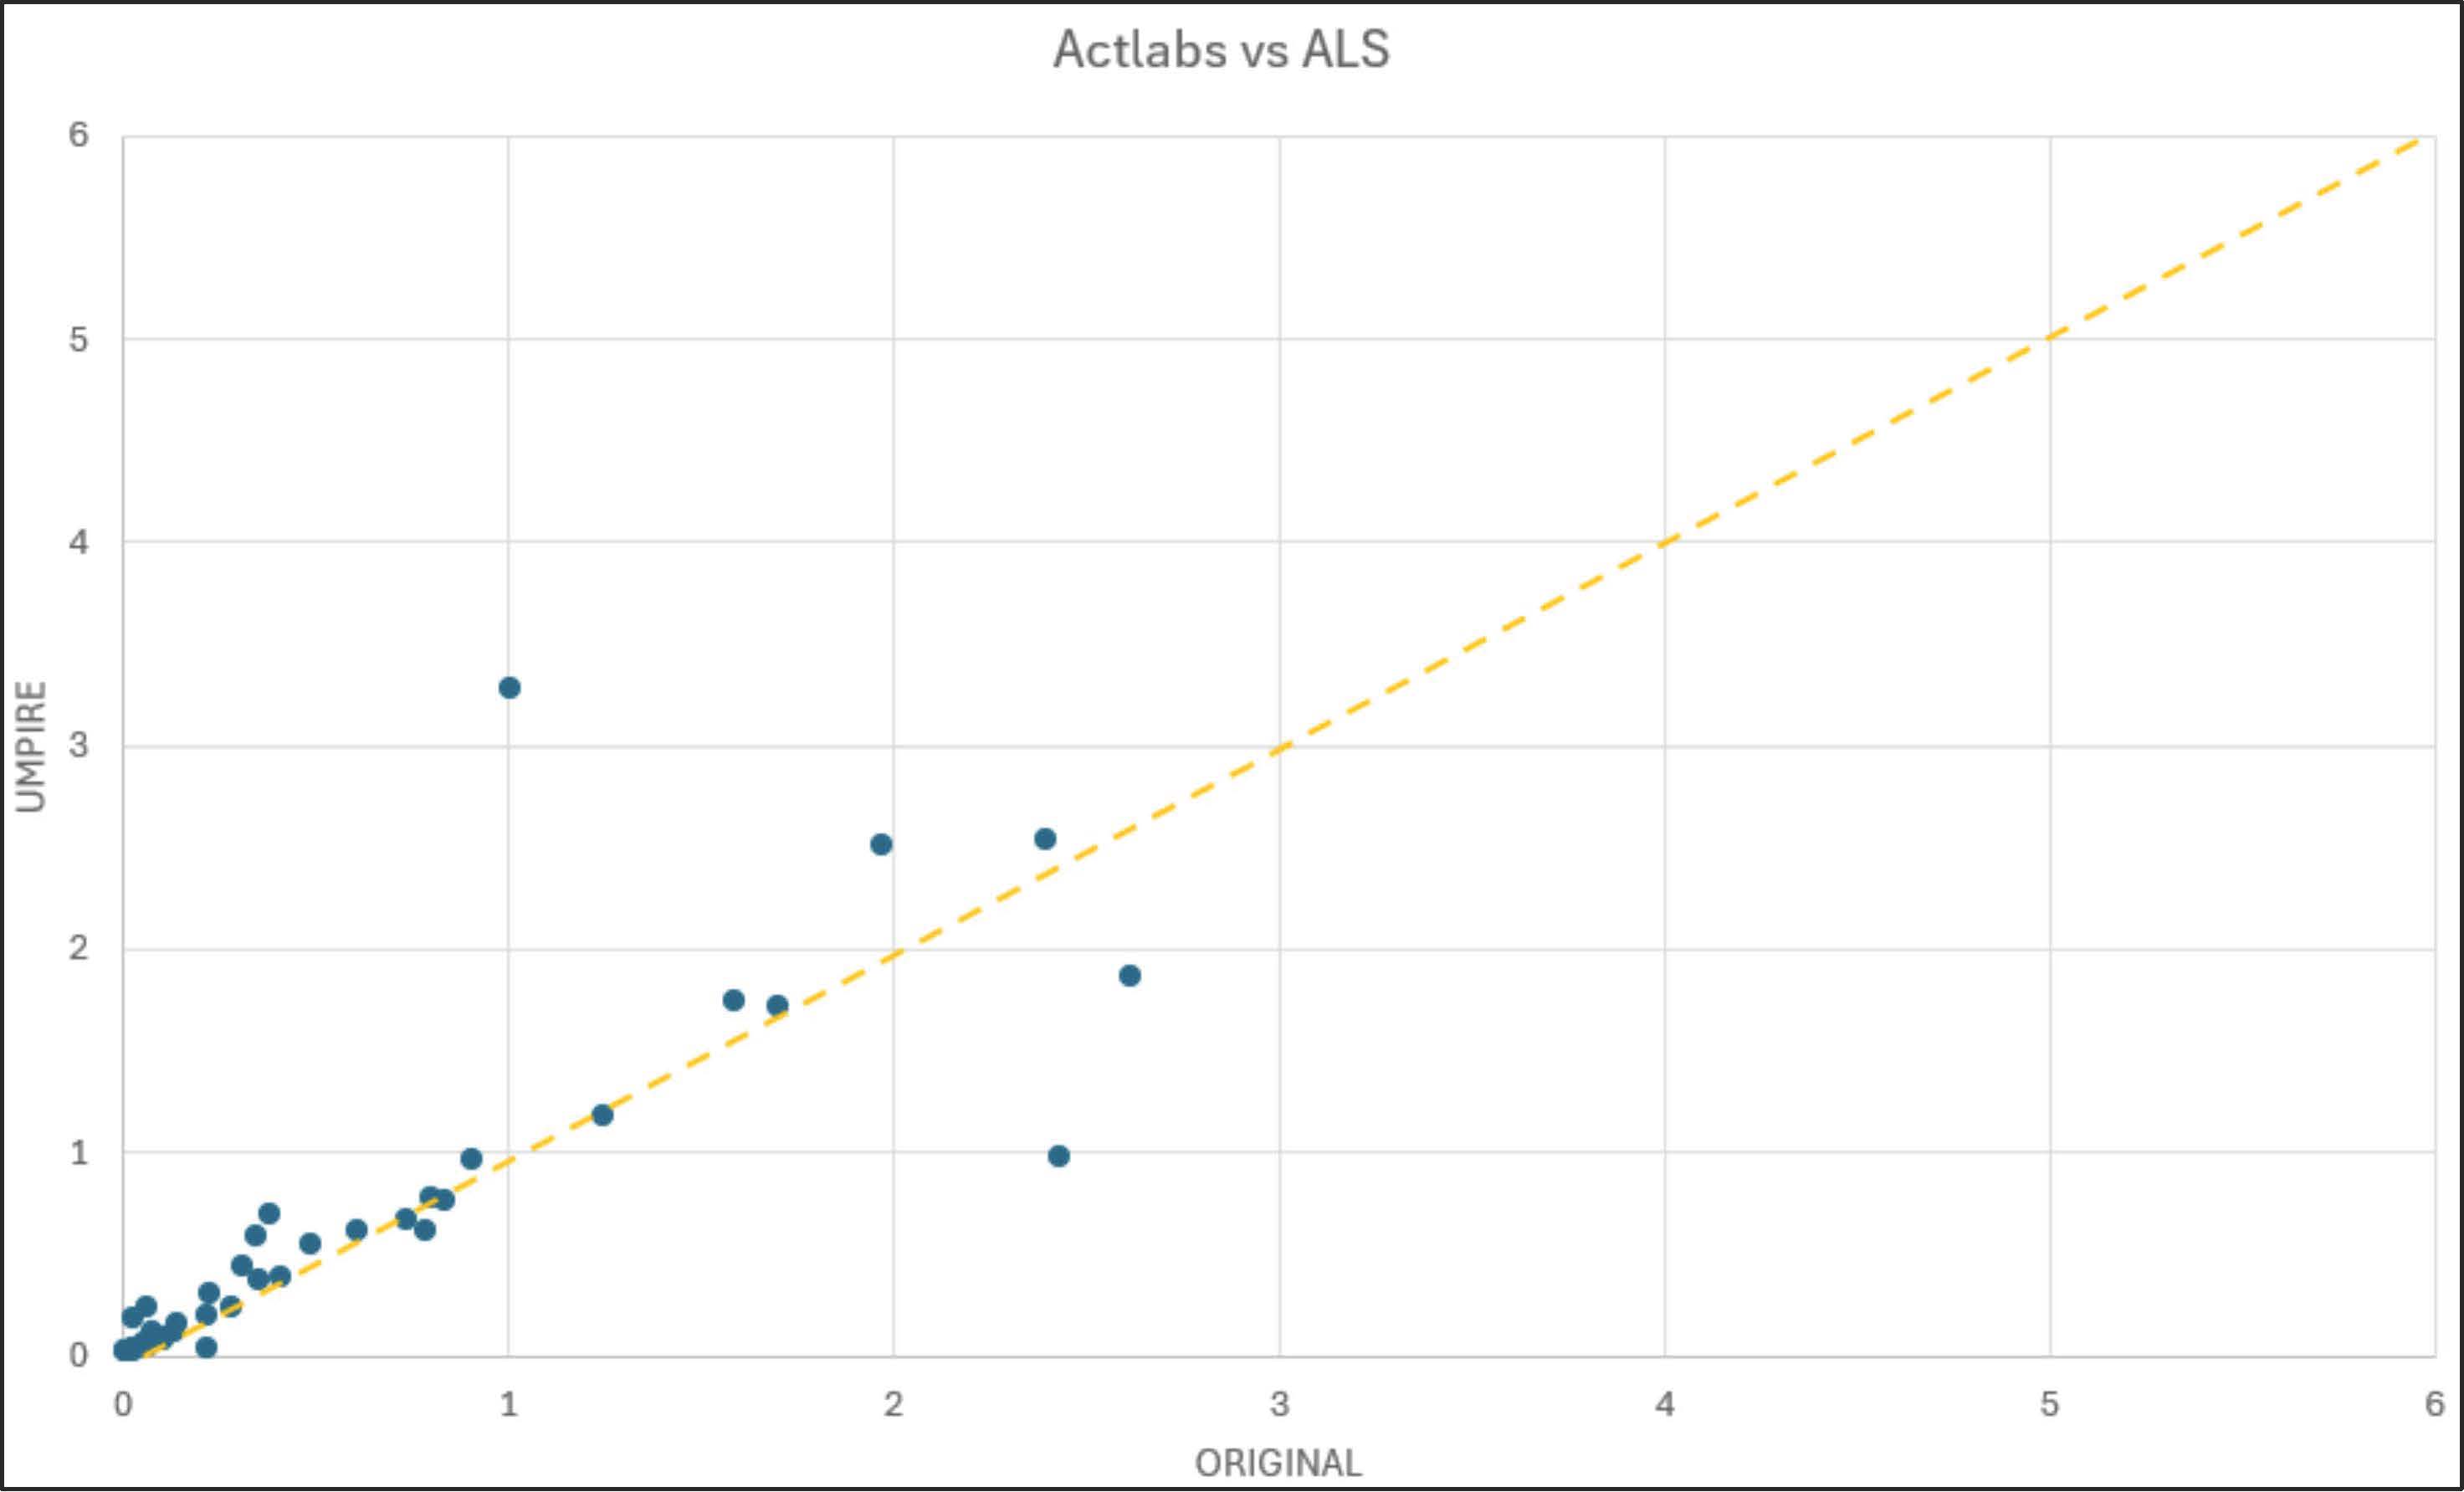
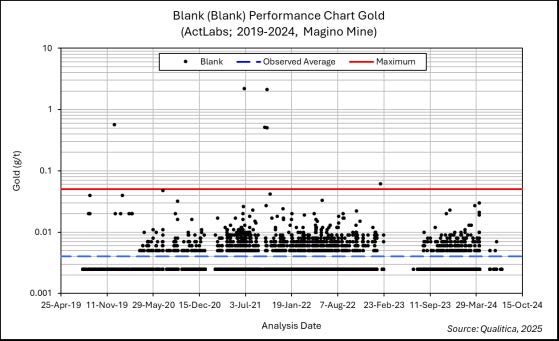
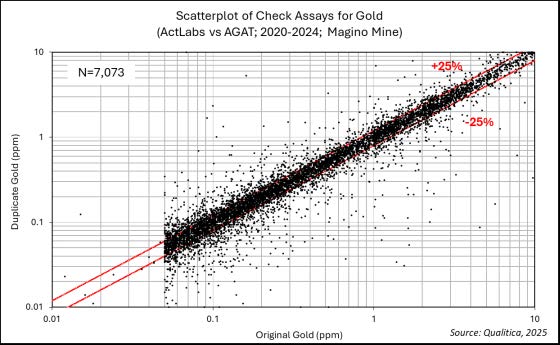
The primary analytical laboratory for drill core samples from Island Gold is AGAT. During the 2024 drilling program, core samples were also submitted to Actlabs, while the surface exploration drill core samples were analysed by ALS. AGAT, Actlabs, and ALS are all independent, accredited analytical laboratories conforming to the requirements of ISO/IEC 17025, as recognized by the Standards Council of Canada.
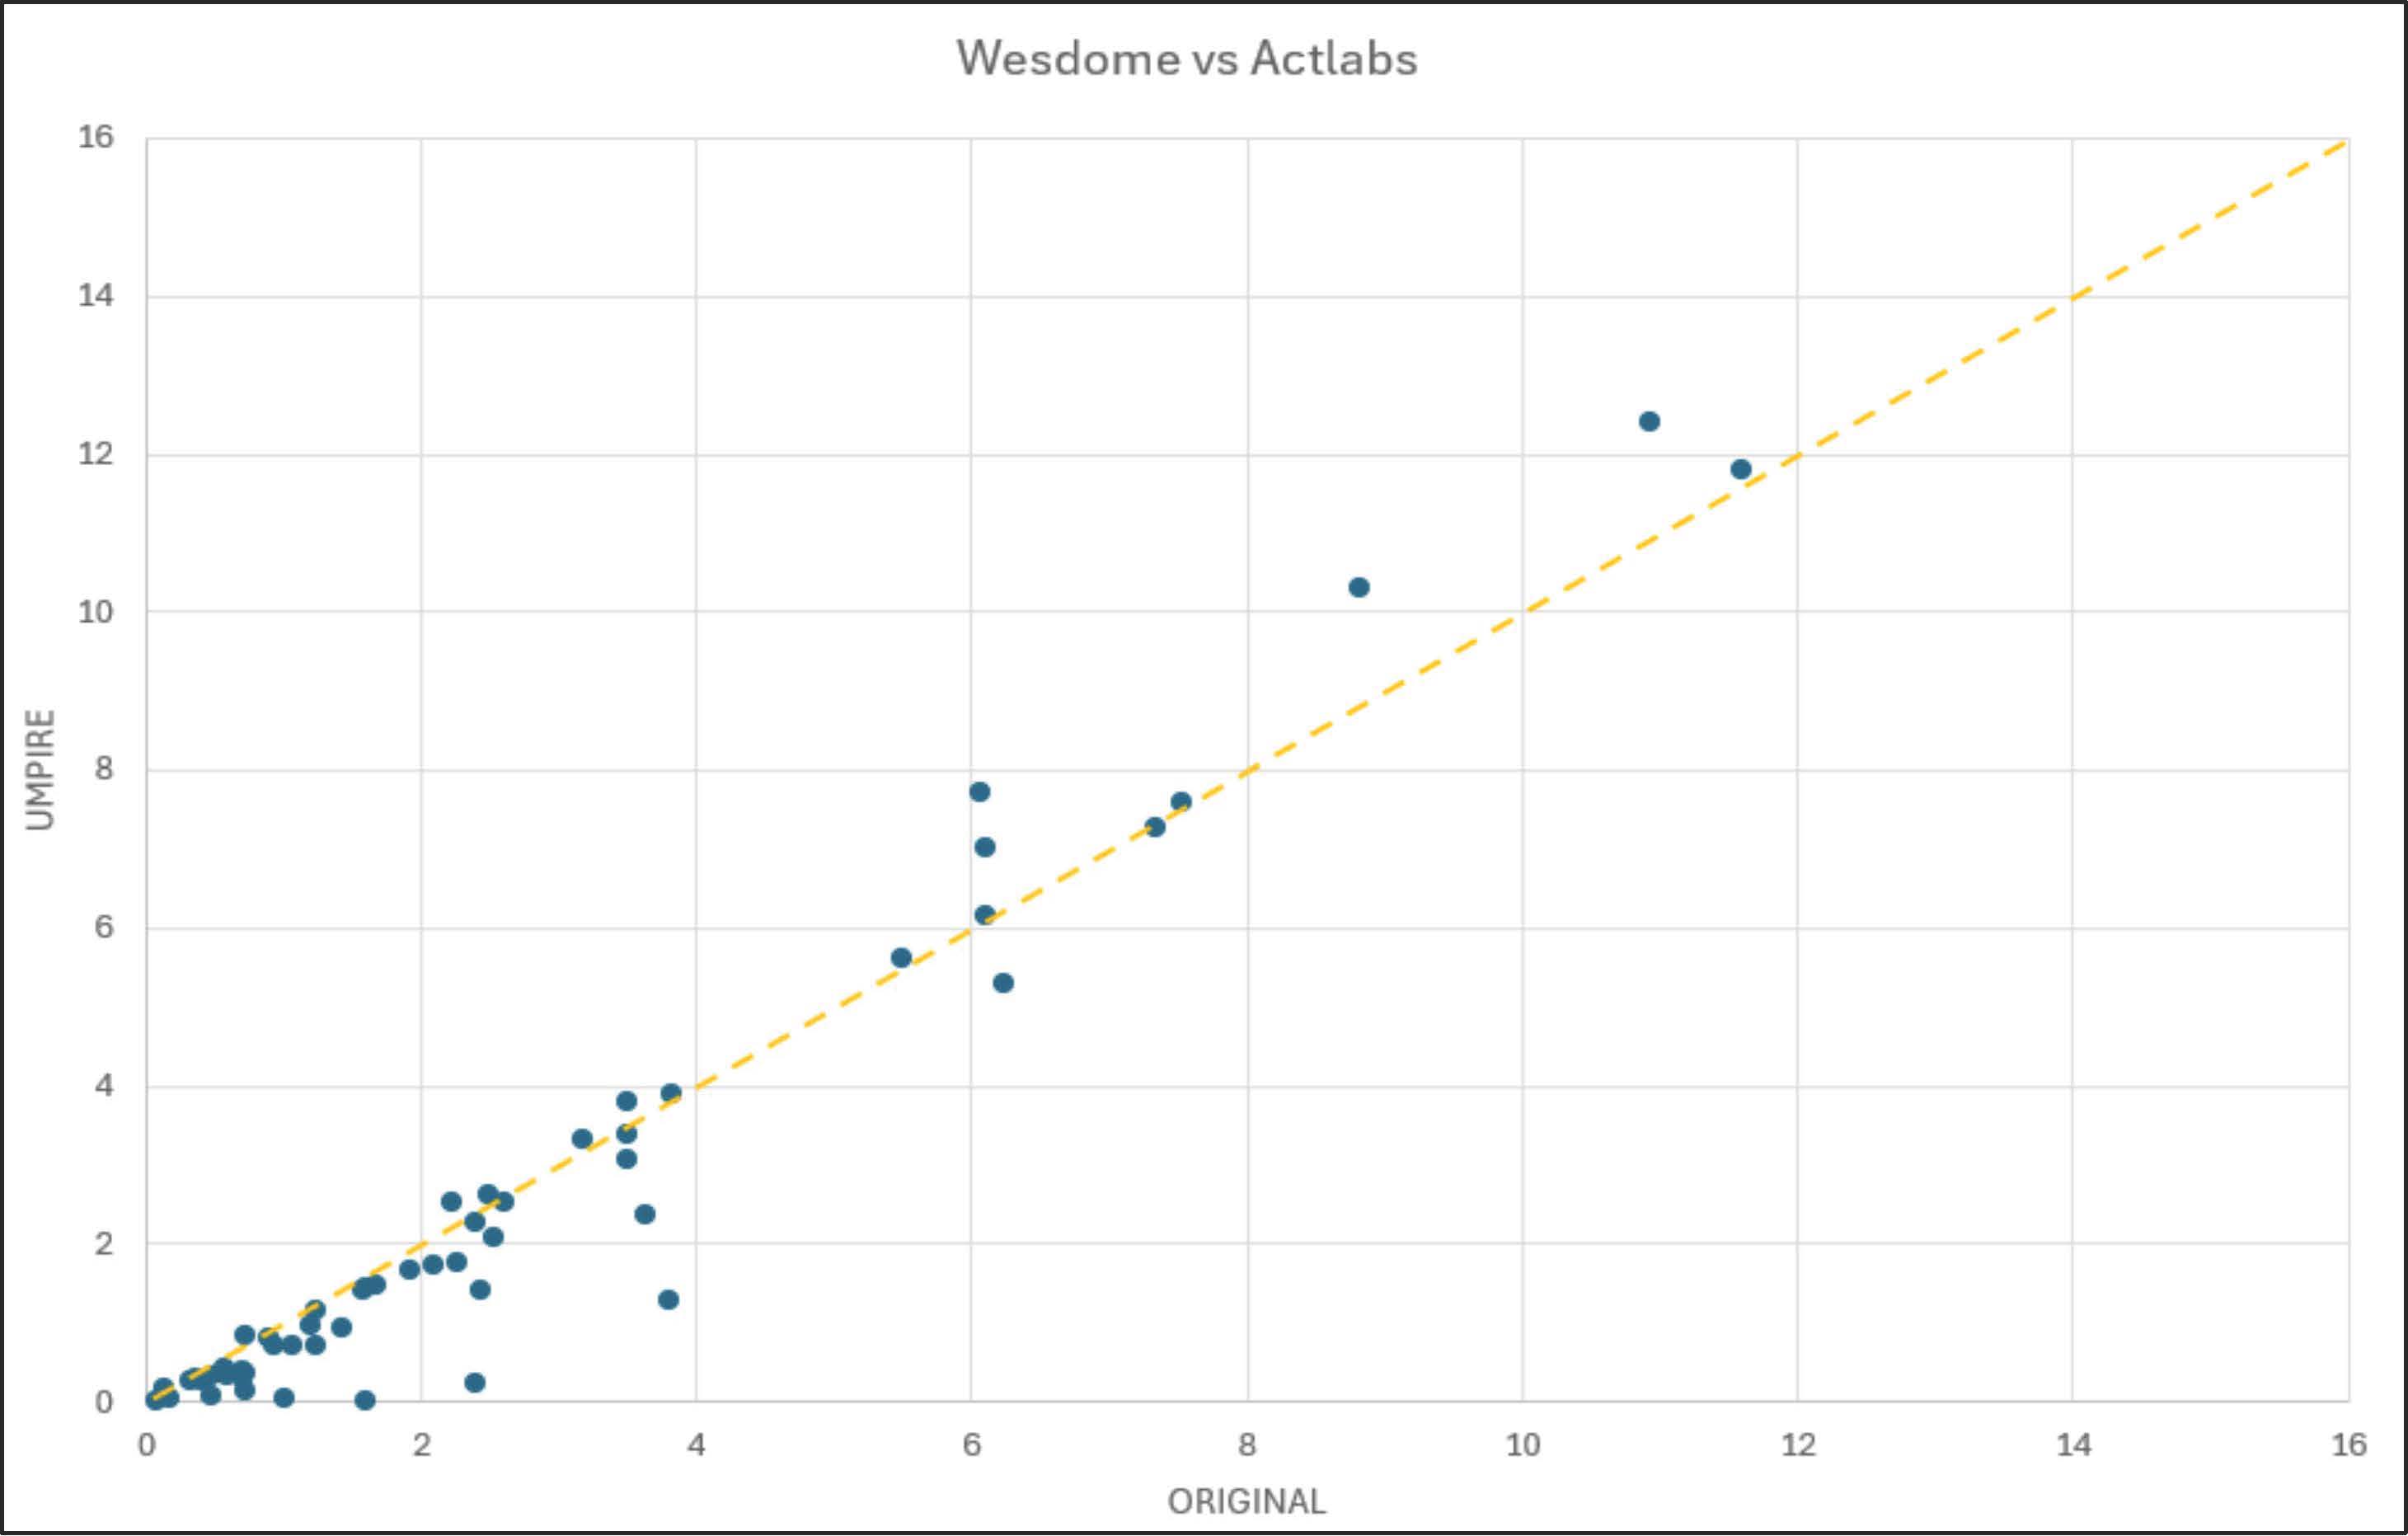
Until April 2021, most drill core samples were prepared and analyzed by LabExpert. In previous years, a limited number of definition drill core samples, along with all underground production samples, were analyzed at Wesdome. This laboratory also provides assay services for Wesdome’s Eagle River Mine. Between 2022 and 2023, approximately 19,900 samples were analyzed at Alamos’ Young Davidson Lab. The Wesdome and Young Davidson laboratories are not accredited facilities.
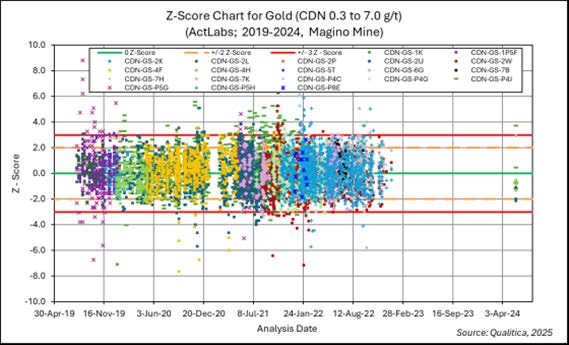
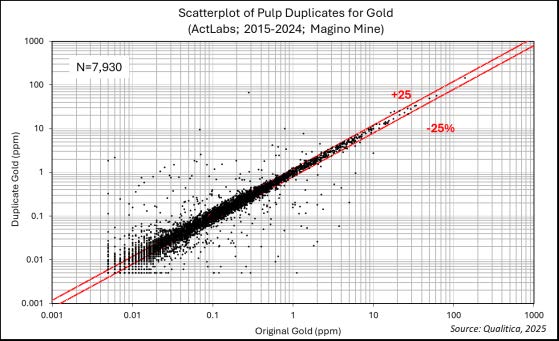
All laboratories referenced maintain internal quality control programs that include the routine insertion of reagent blanks, certified reference materials (CRMs), and pulp duplicates. AGAT, Actlabs, and ALS routinely participate in international proficiency testing (round robin programs), monitor the preparation of duplicate samples, and operate under quality management systems consistent with ISO/IEC 17025 accreditation.
In 2024, Island Gold mine received over 61,000 gold assay results. The QP has reviewed the sample preparation, analytical, and security procedures, along with the insertion rates and performance of blanks, CRMs, and check assays for the mine’s drillhole samples. The observed failure rates are within expected industry ranges, and appropriate follow-up actions
| | | | | |
Island Gold District – NI 43-101 Technical Report August 6, 2025 | 20
|
were taken where failures occurred. No significant assay biases were identified. In the QP’s opinion, the Island Gold sampling protocols and resulting assay data meet industry standards, and the database is suitable for use in the Mineral Resource estimation
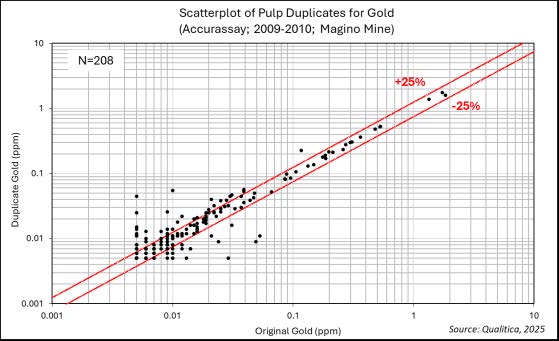
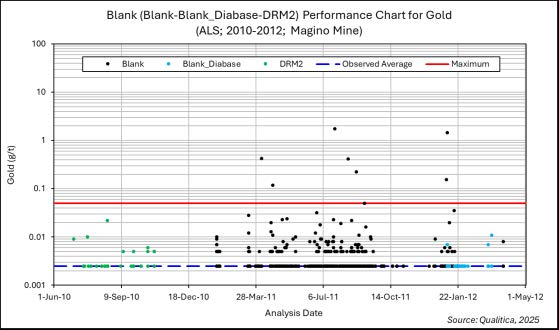
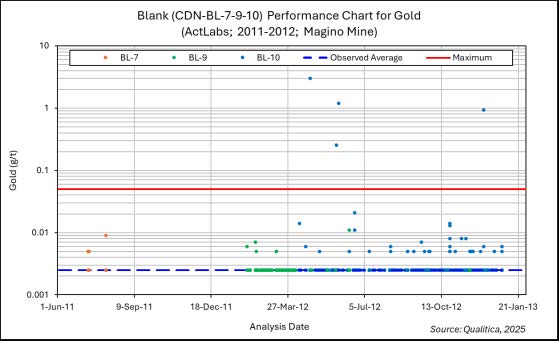
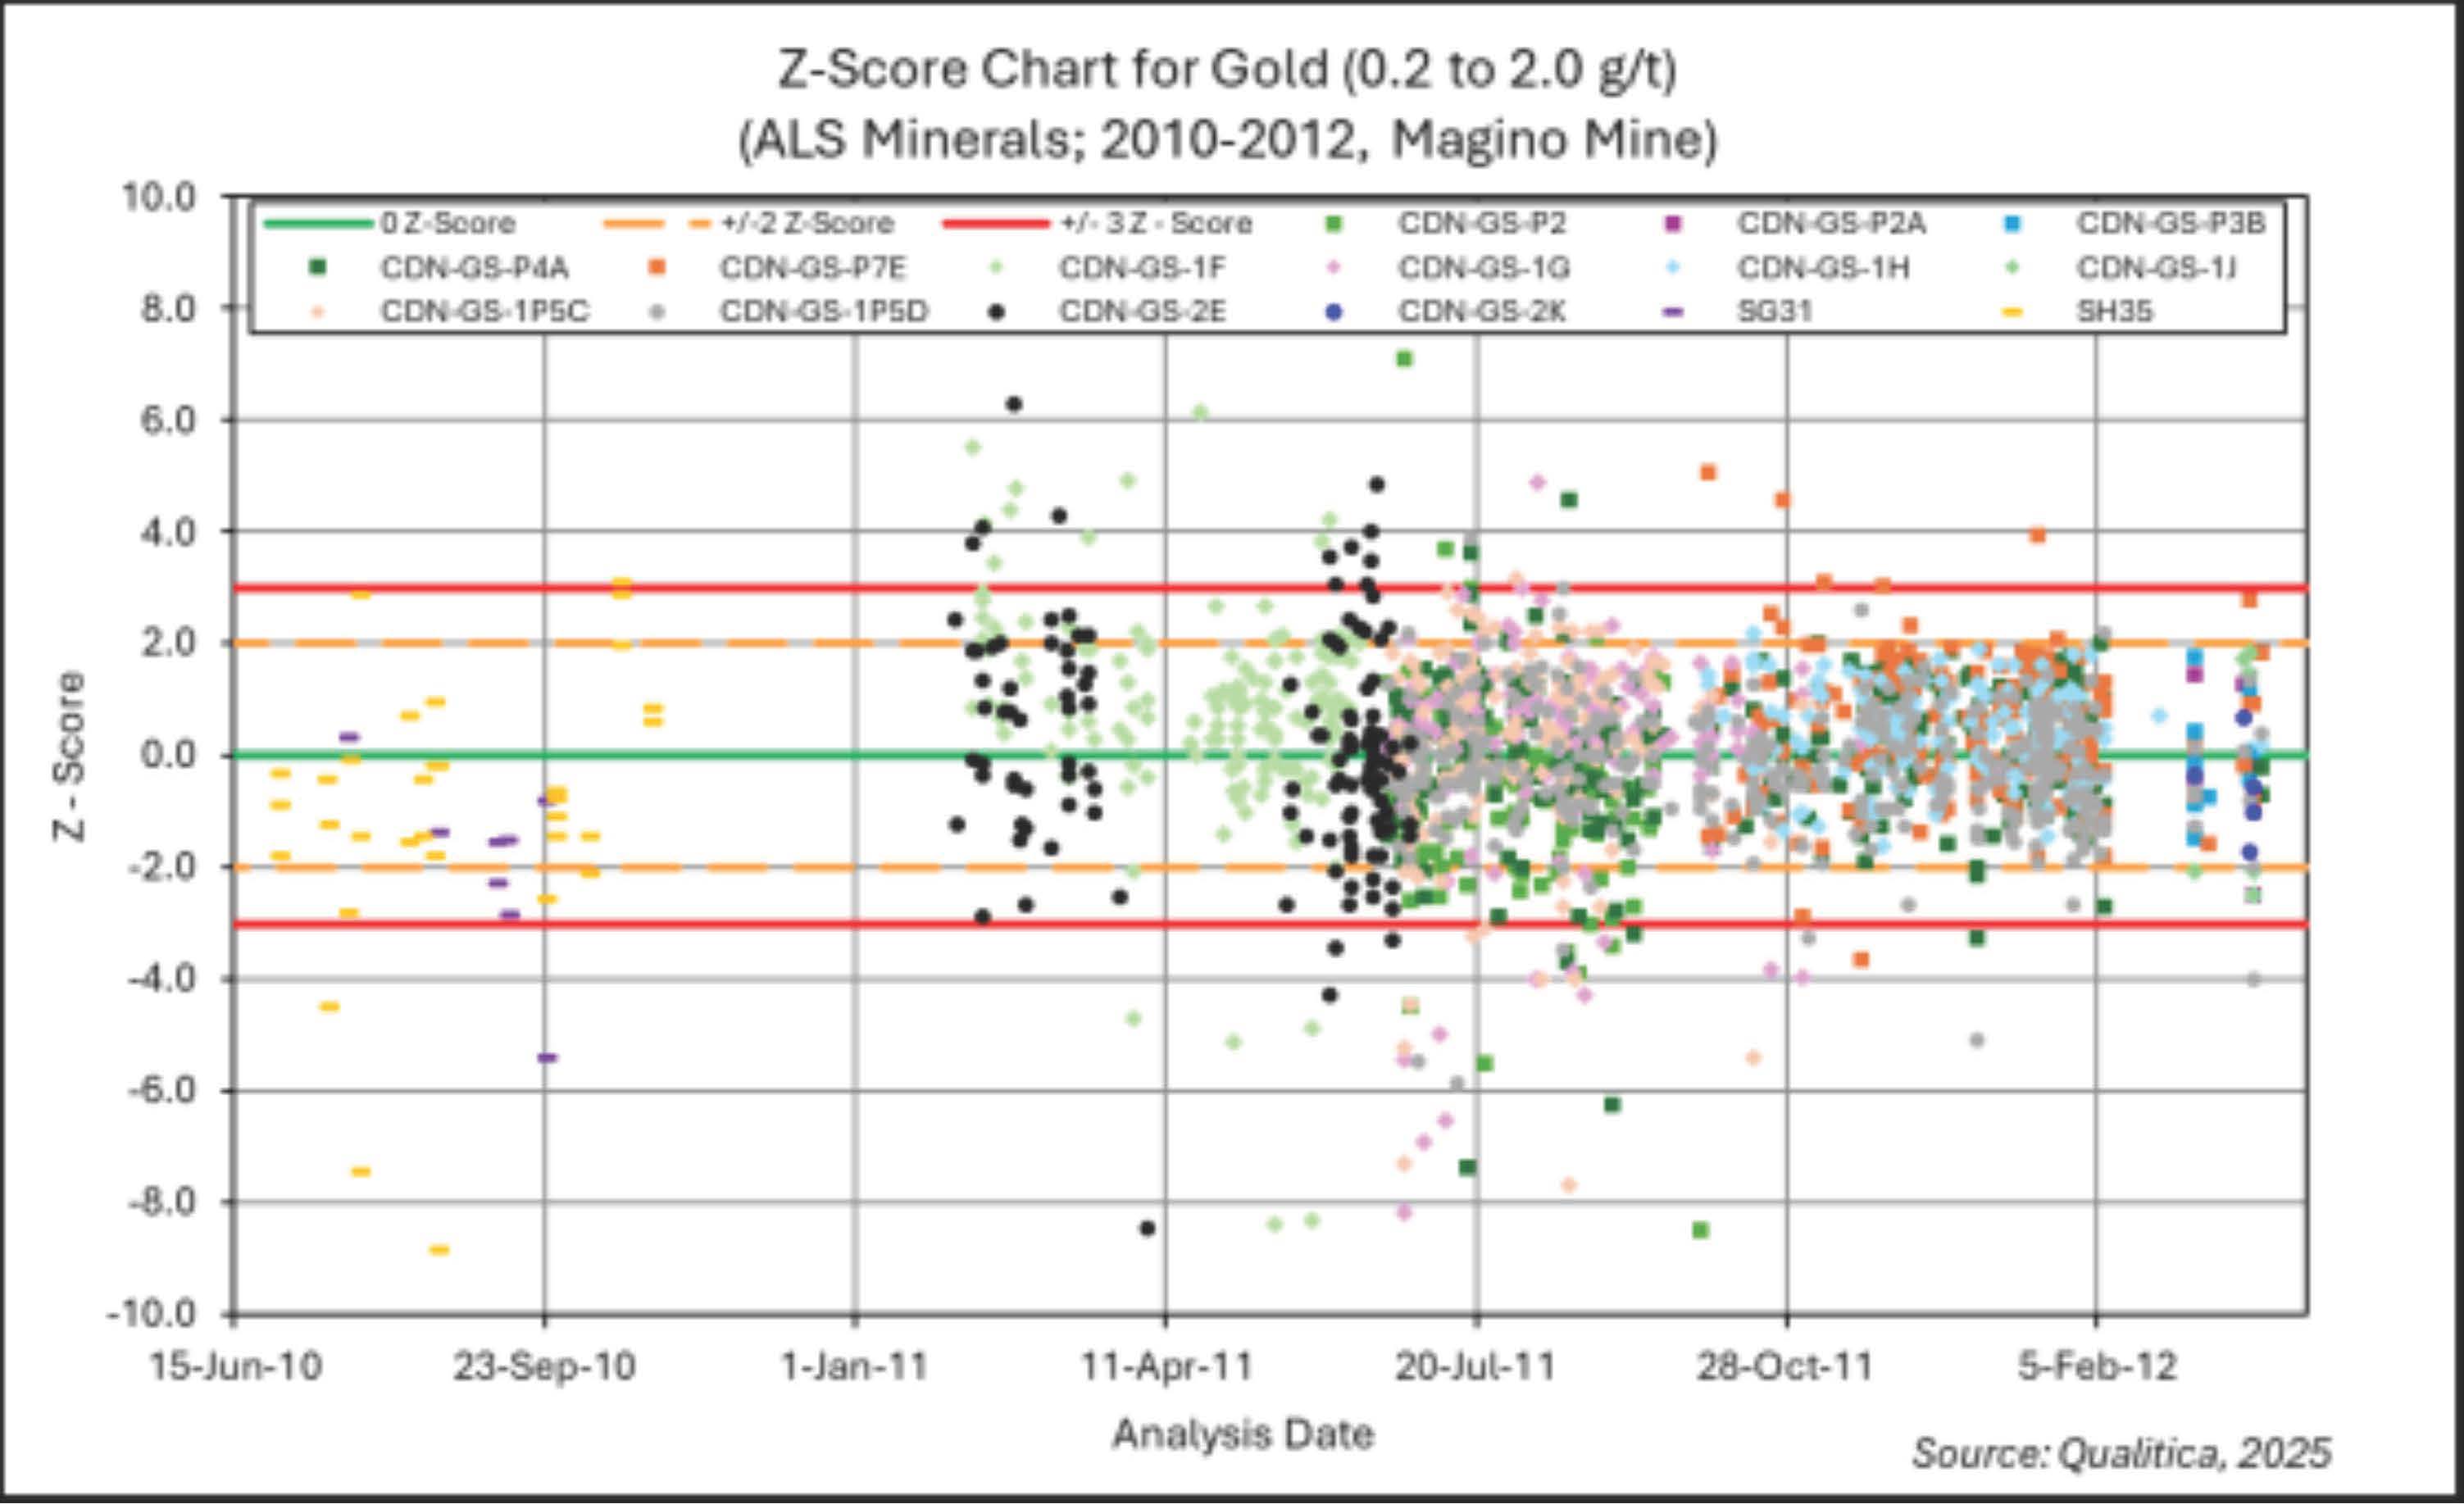
Magino
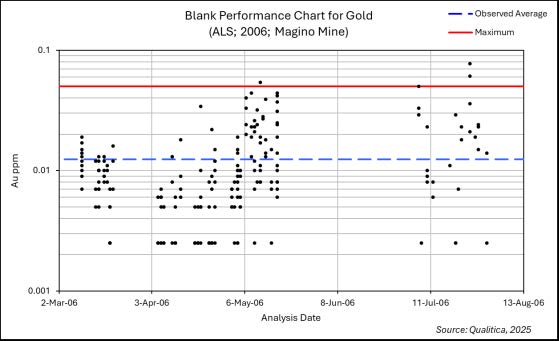
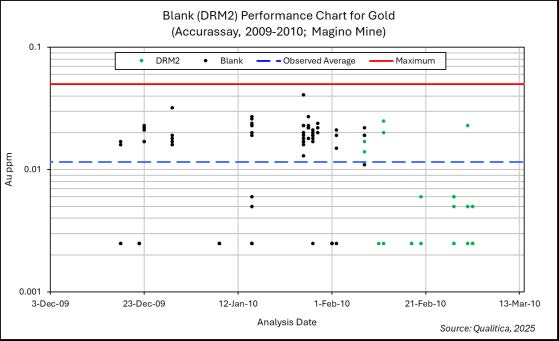
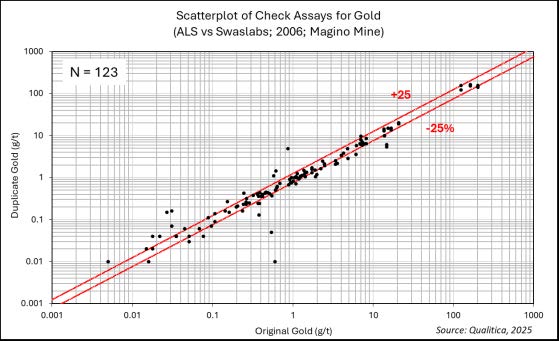
Golden Goose submitted samples to ALS Chemex (2006) and Accurassay Laboratories (2007–2010). Prodigy submitted samples to Accurassay (2010), ALS Chemex (2010-2012), and ActLabs (2011-2012). Argonaut submitted samples to ActLabs (2013-2024), Bureau Veritas (2016-2017), and MSA Labs (2024). Alamos has continued to submit samples to ActLabs and MSA Labs. All utilized labs are ISO 17025-accredited facilities.
The Company maintains a rigorous assay quality control program. Blanks and CRMs are inserted with drill core samples on a routine basis. In addition, sample pulps are routinely submitted for check assays to an accredited commercial laboratory.
There is no evidence of significant assay bias or systematic contamination identified based on the quality control program.
The responsible QP is of the opinion that Magino maintains a quality program that meets or exceeds industry standards. Sample preparation, security, and analytical procedures are all industry-standard and produce analytical results for gold with accuracy and precision that is suitable for Mineral Resource estimation.
1.7 Data Verification
The Qualified Persons consider that the Island Gold and Magino databases are suitable for use in the Mineral Resource and Mineral Reserve estimation. These databases contain all the information related to drillholes, drift sampling, assay results and the laboratory certificates. Some verification of the original data was performed, and modifications were completed if needed prior to the calculation of any estimates. The verification of, and corrections to, the Island Gold and Magino databases were done prior to the Mineral Resource and Mineral Reserve estimates as of December 31st, 2024, presented in this Report.
1.8 Metallurgical Test Work
The Magino expansion project from 10,000 tpd to 12,400 tpd will see ore from two different ore bodies being processed through the common operating complex. The existing Magino feed is sourced from a low-grade high tonnage open pit operation, while the neighbouring Island Gold ore feed is sourced from the high-grade and lower tonnage underground operation. Previous metallurgical testing campaigns have been completed for each deposit to develop their respective original mineral processing flowsheets. Now that both ores will be combined in a common feed, a dedicated blended test work campaign has been completed to explicitly review the metallurgical performance of both ores being processed at the same time utilizing a new flowsheet design. The blended test work program was focused on developing the process design criteria for comminution, gravity concentration, leaching, and dewatering.
Both the historical Magino and Island Gold test work programs were developed with master composite samples intended on providing a representation of their respective deposits. Variability tests were also completed to help support development.
A blended test work program focused on the currently planned expansion utilizing feed material from each of the respective mines. Each contributing sample in the blend was assayed to ensure they were representative of the mine plan and fell within the bounds of what was
| | | | | |
Island Gold District – NI 43-101 Technical Report August 6, 2025 | 21
|
presented in the previous test work campaigns.
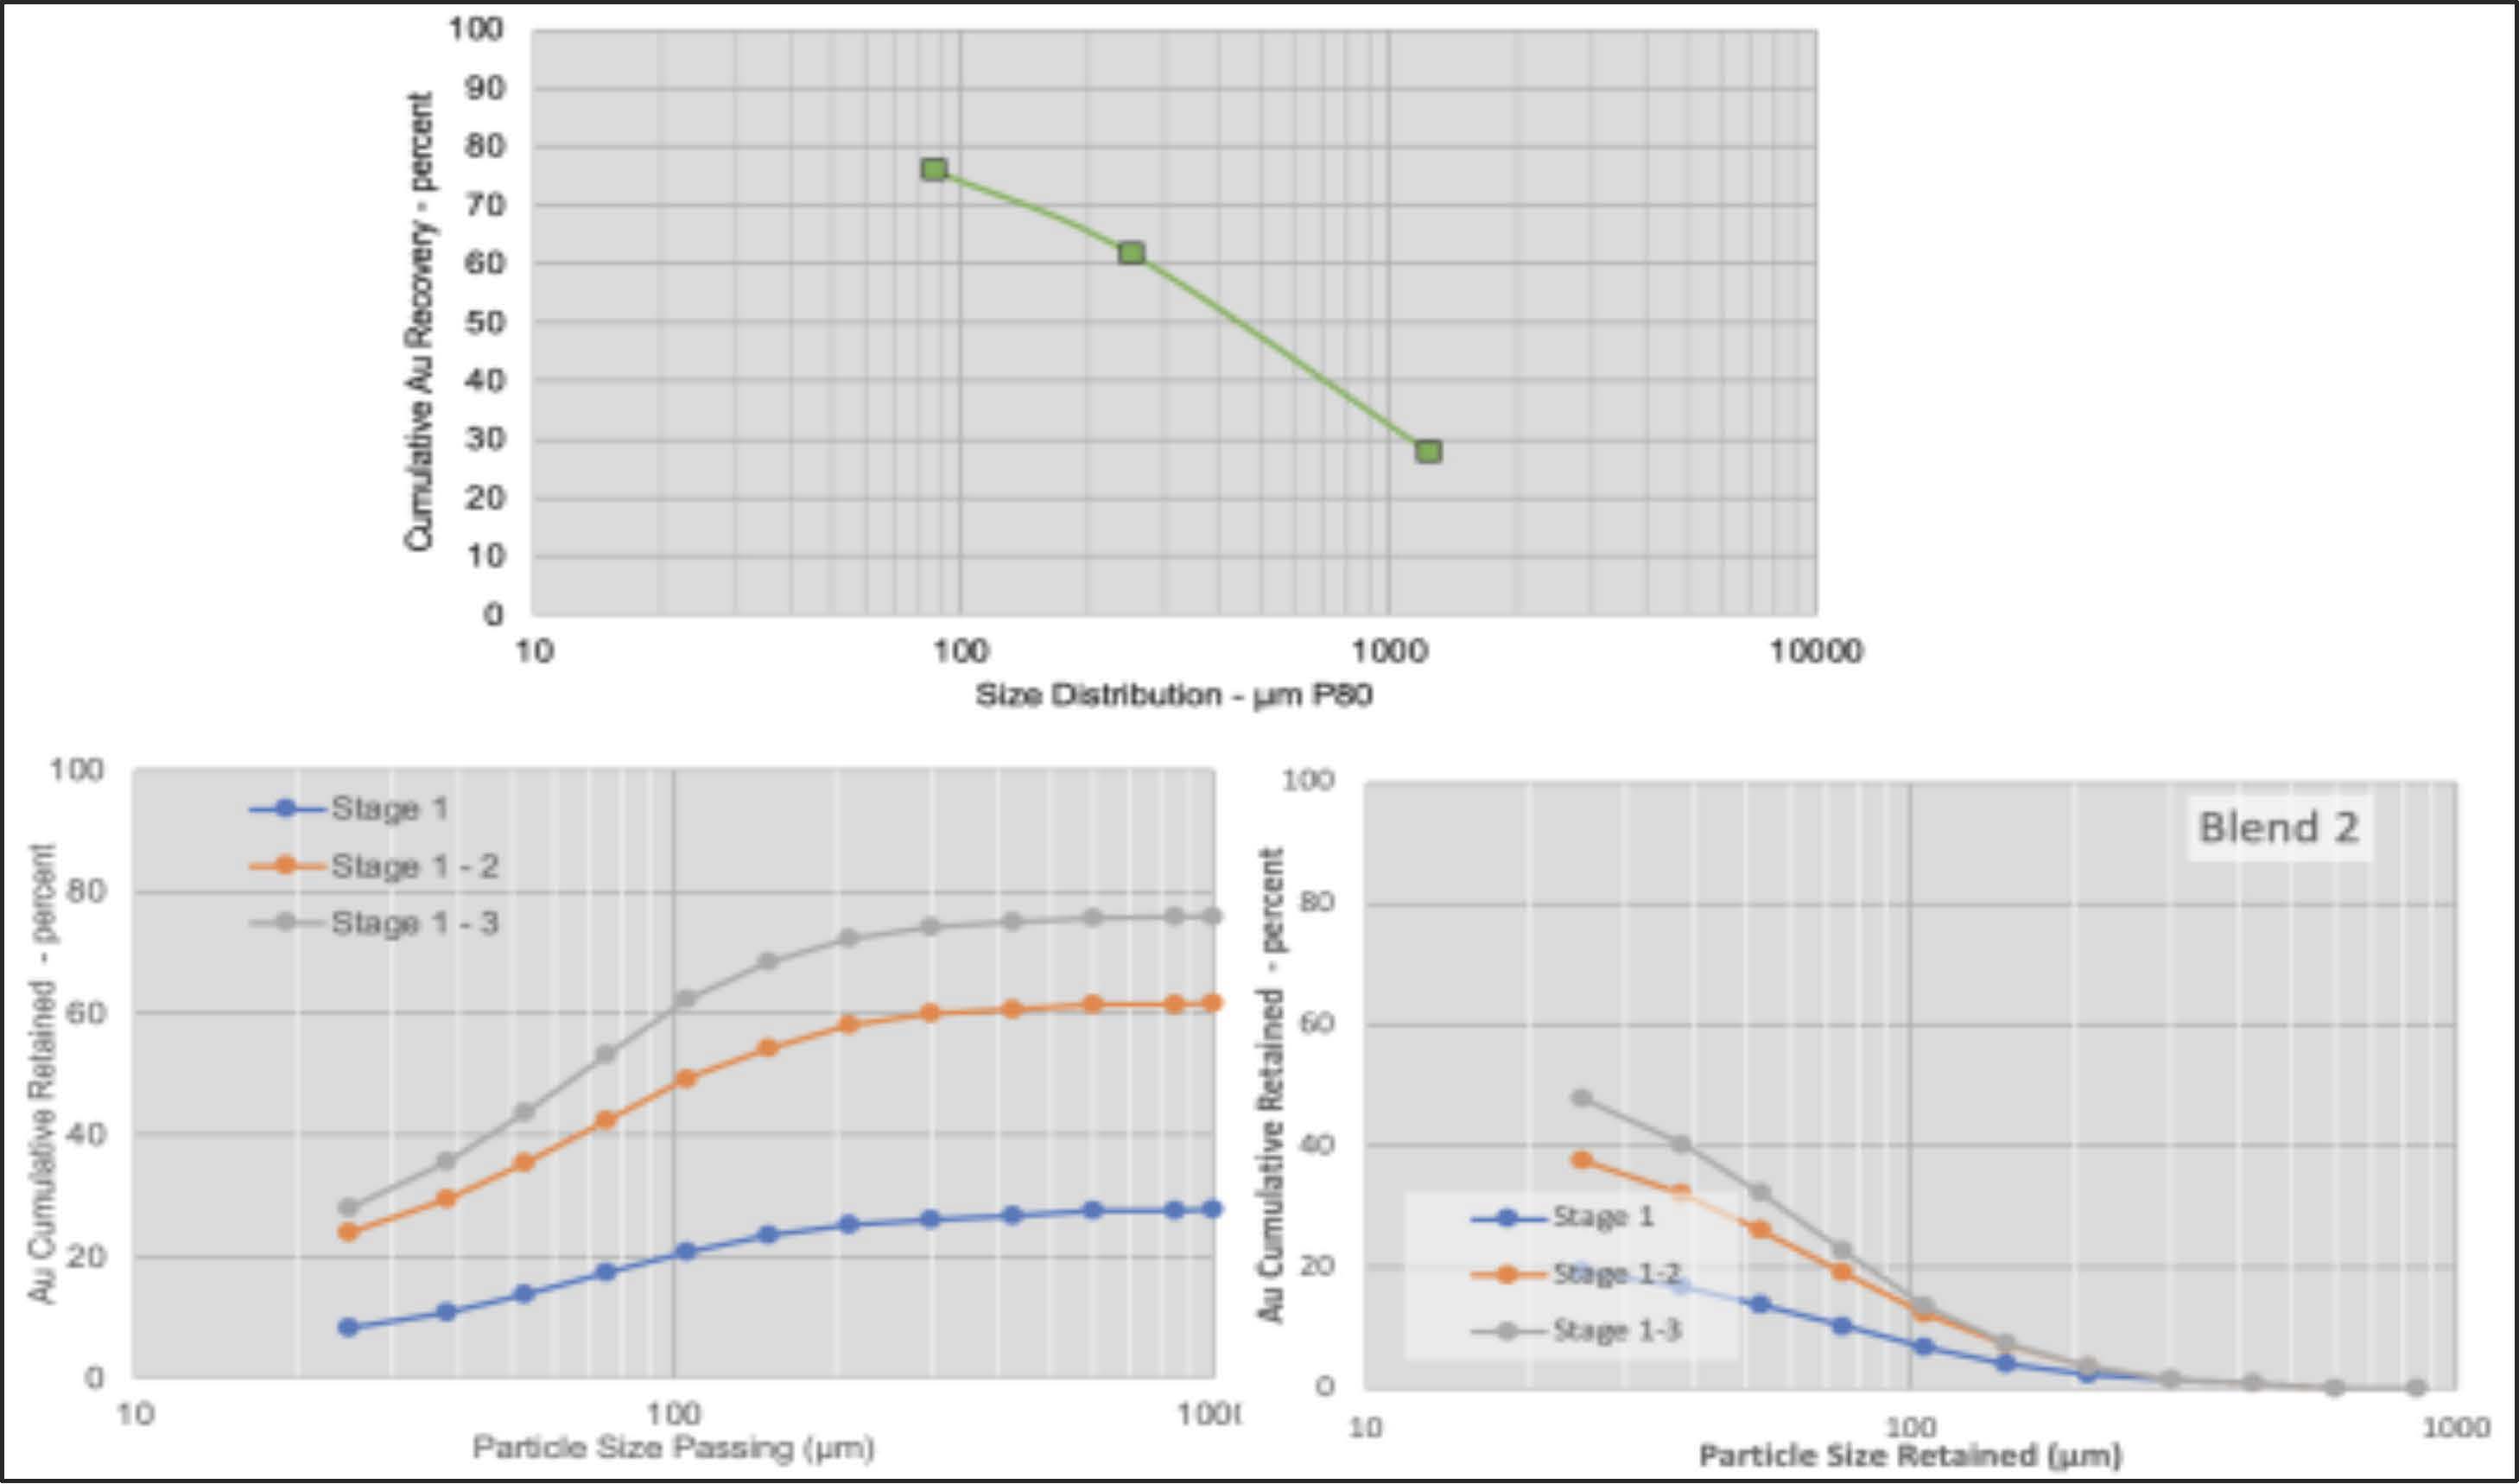
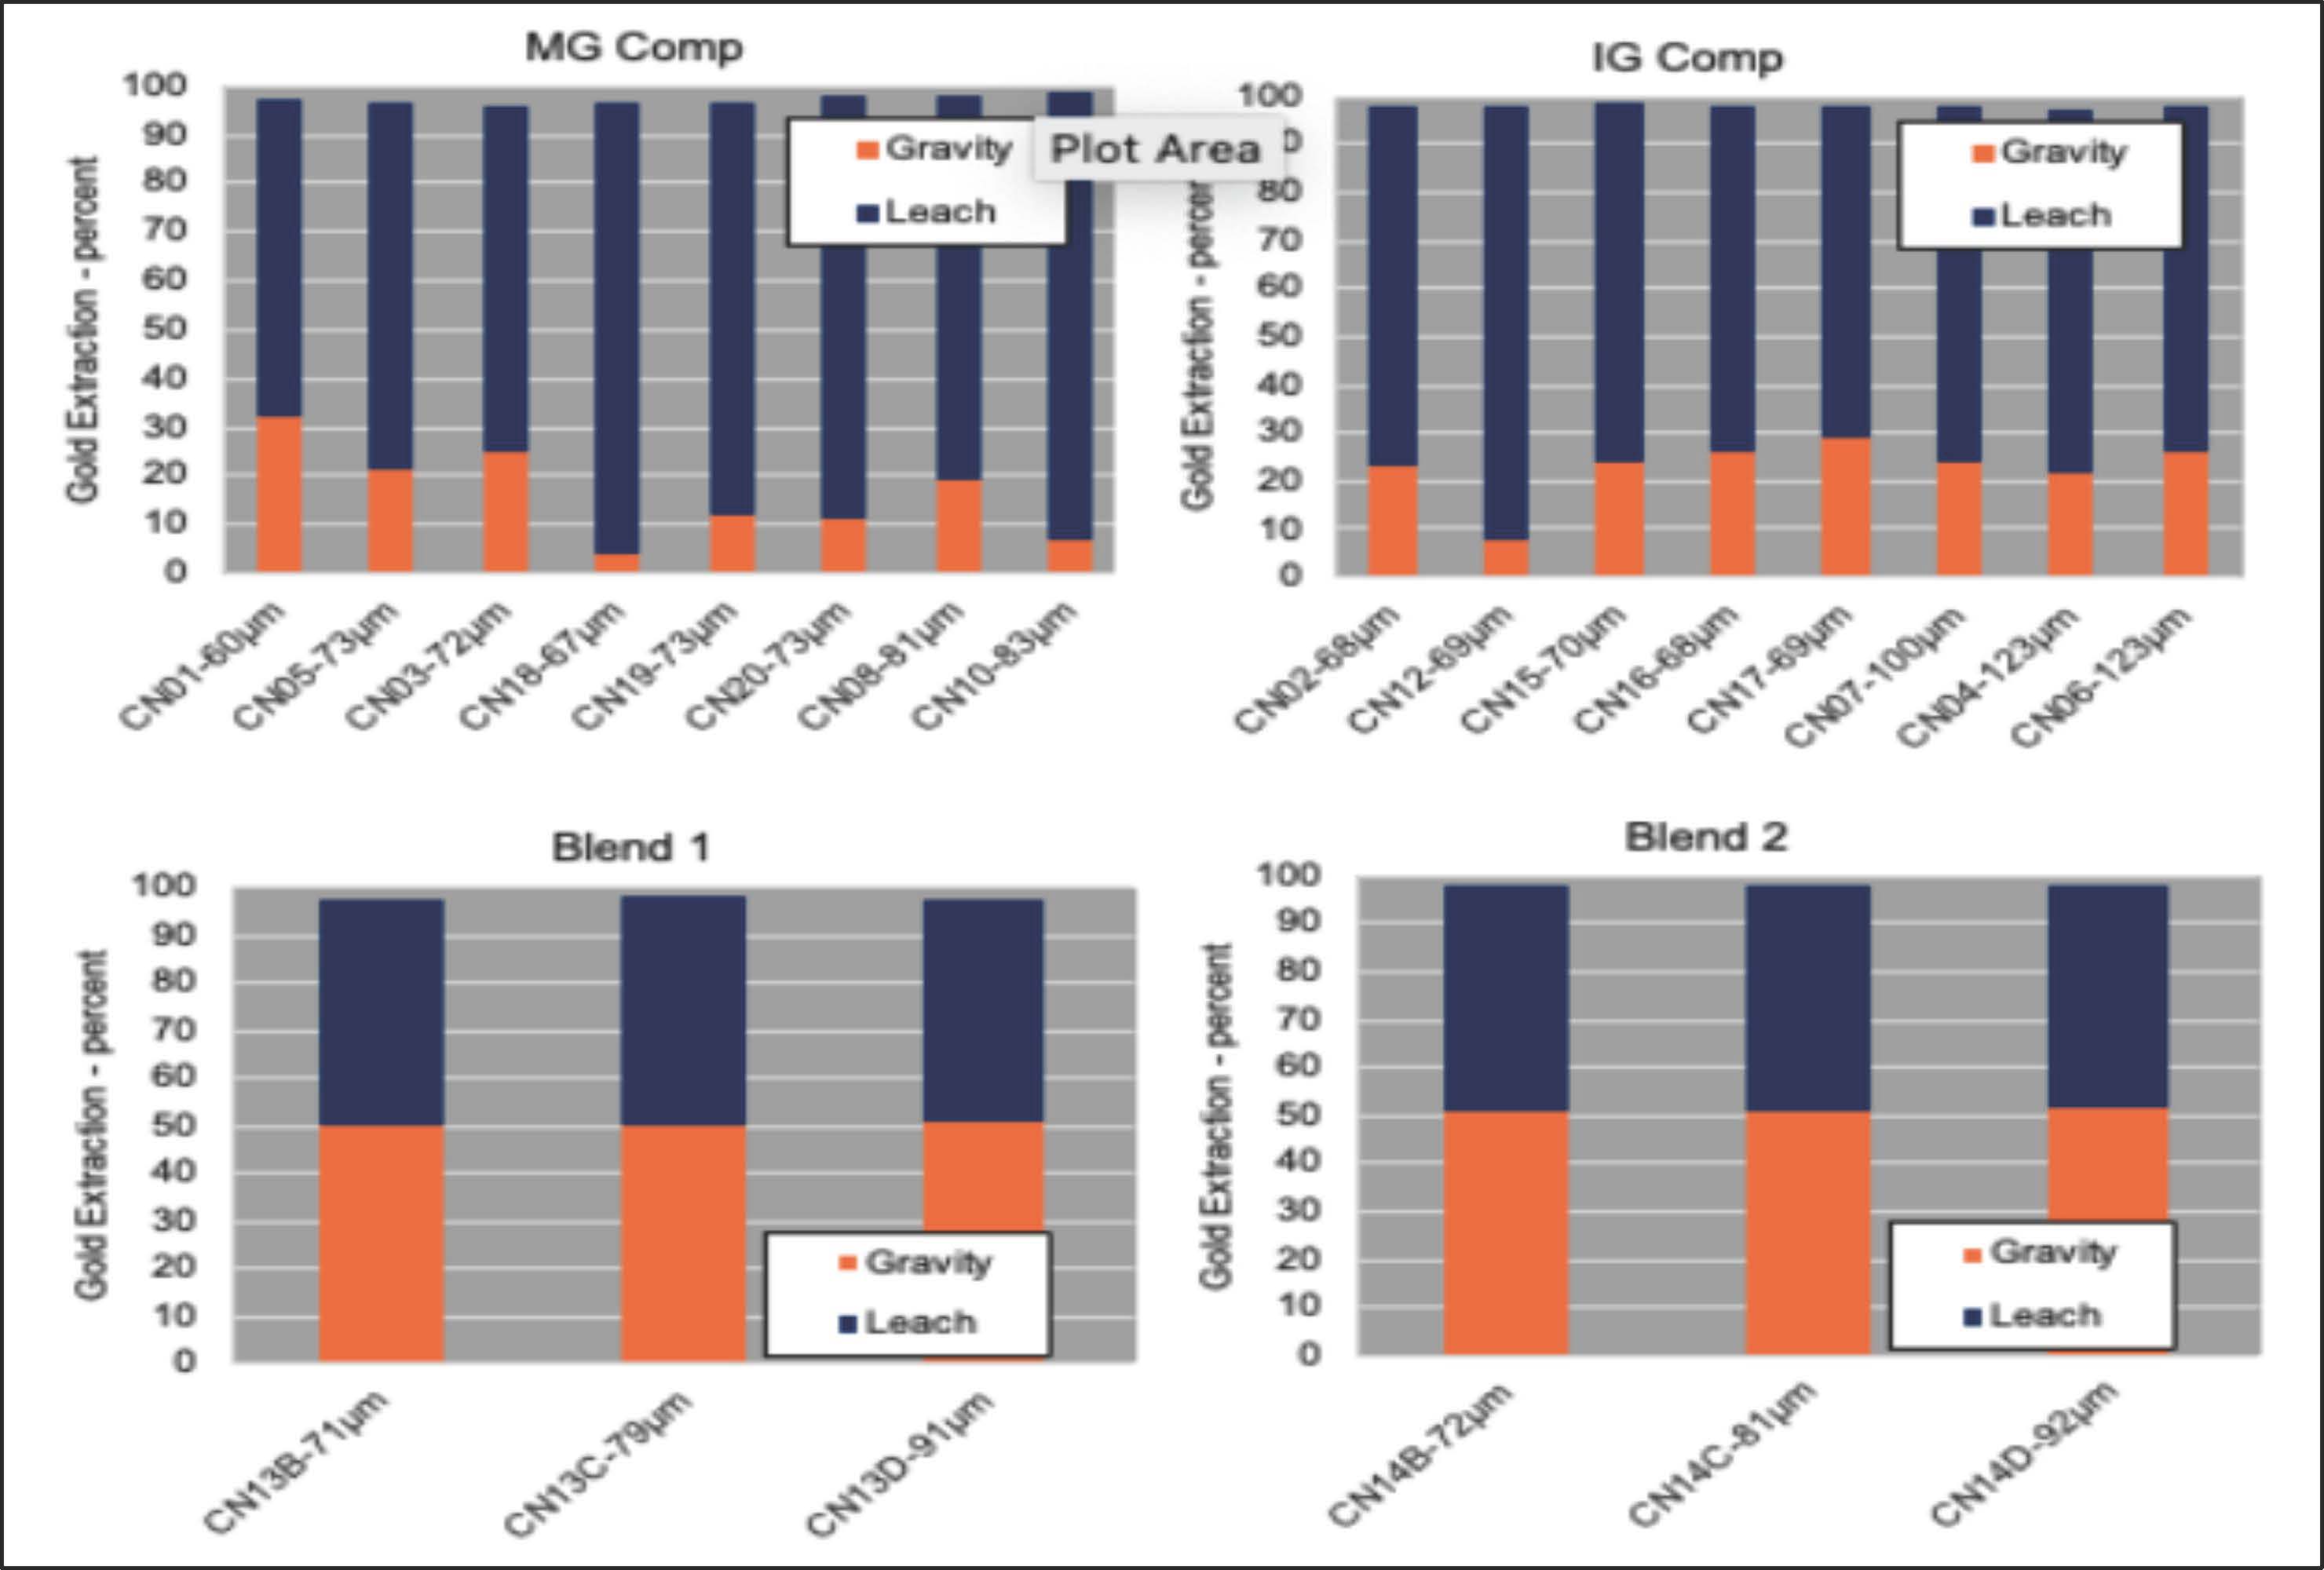
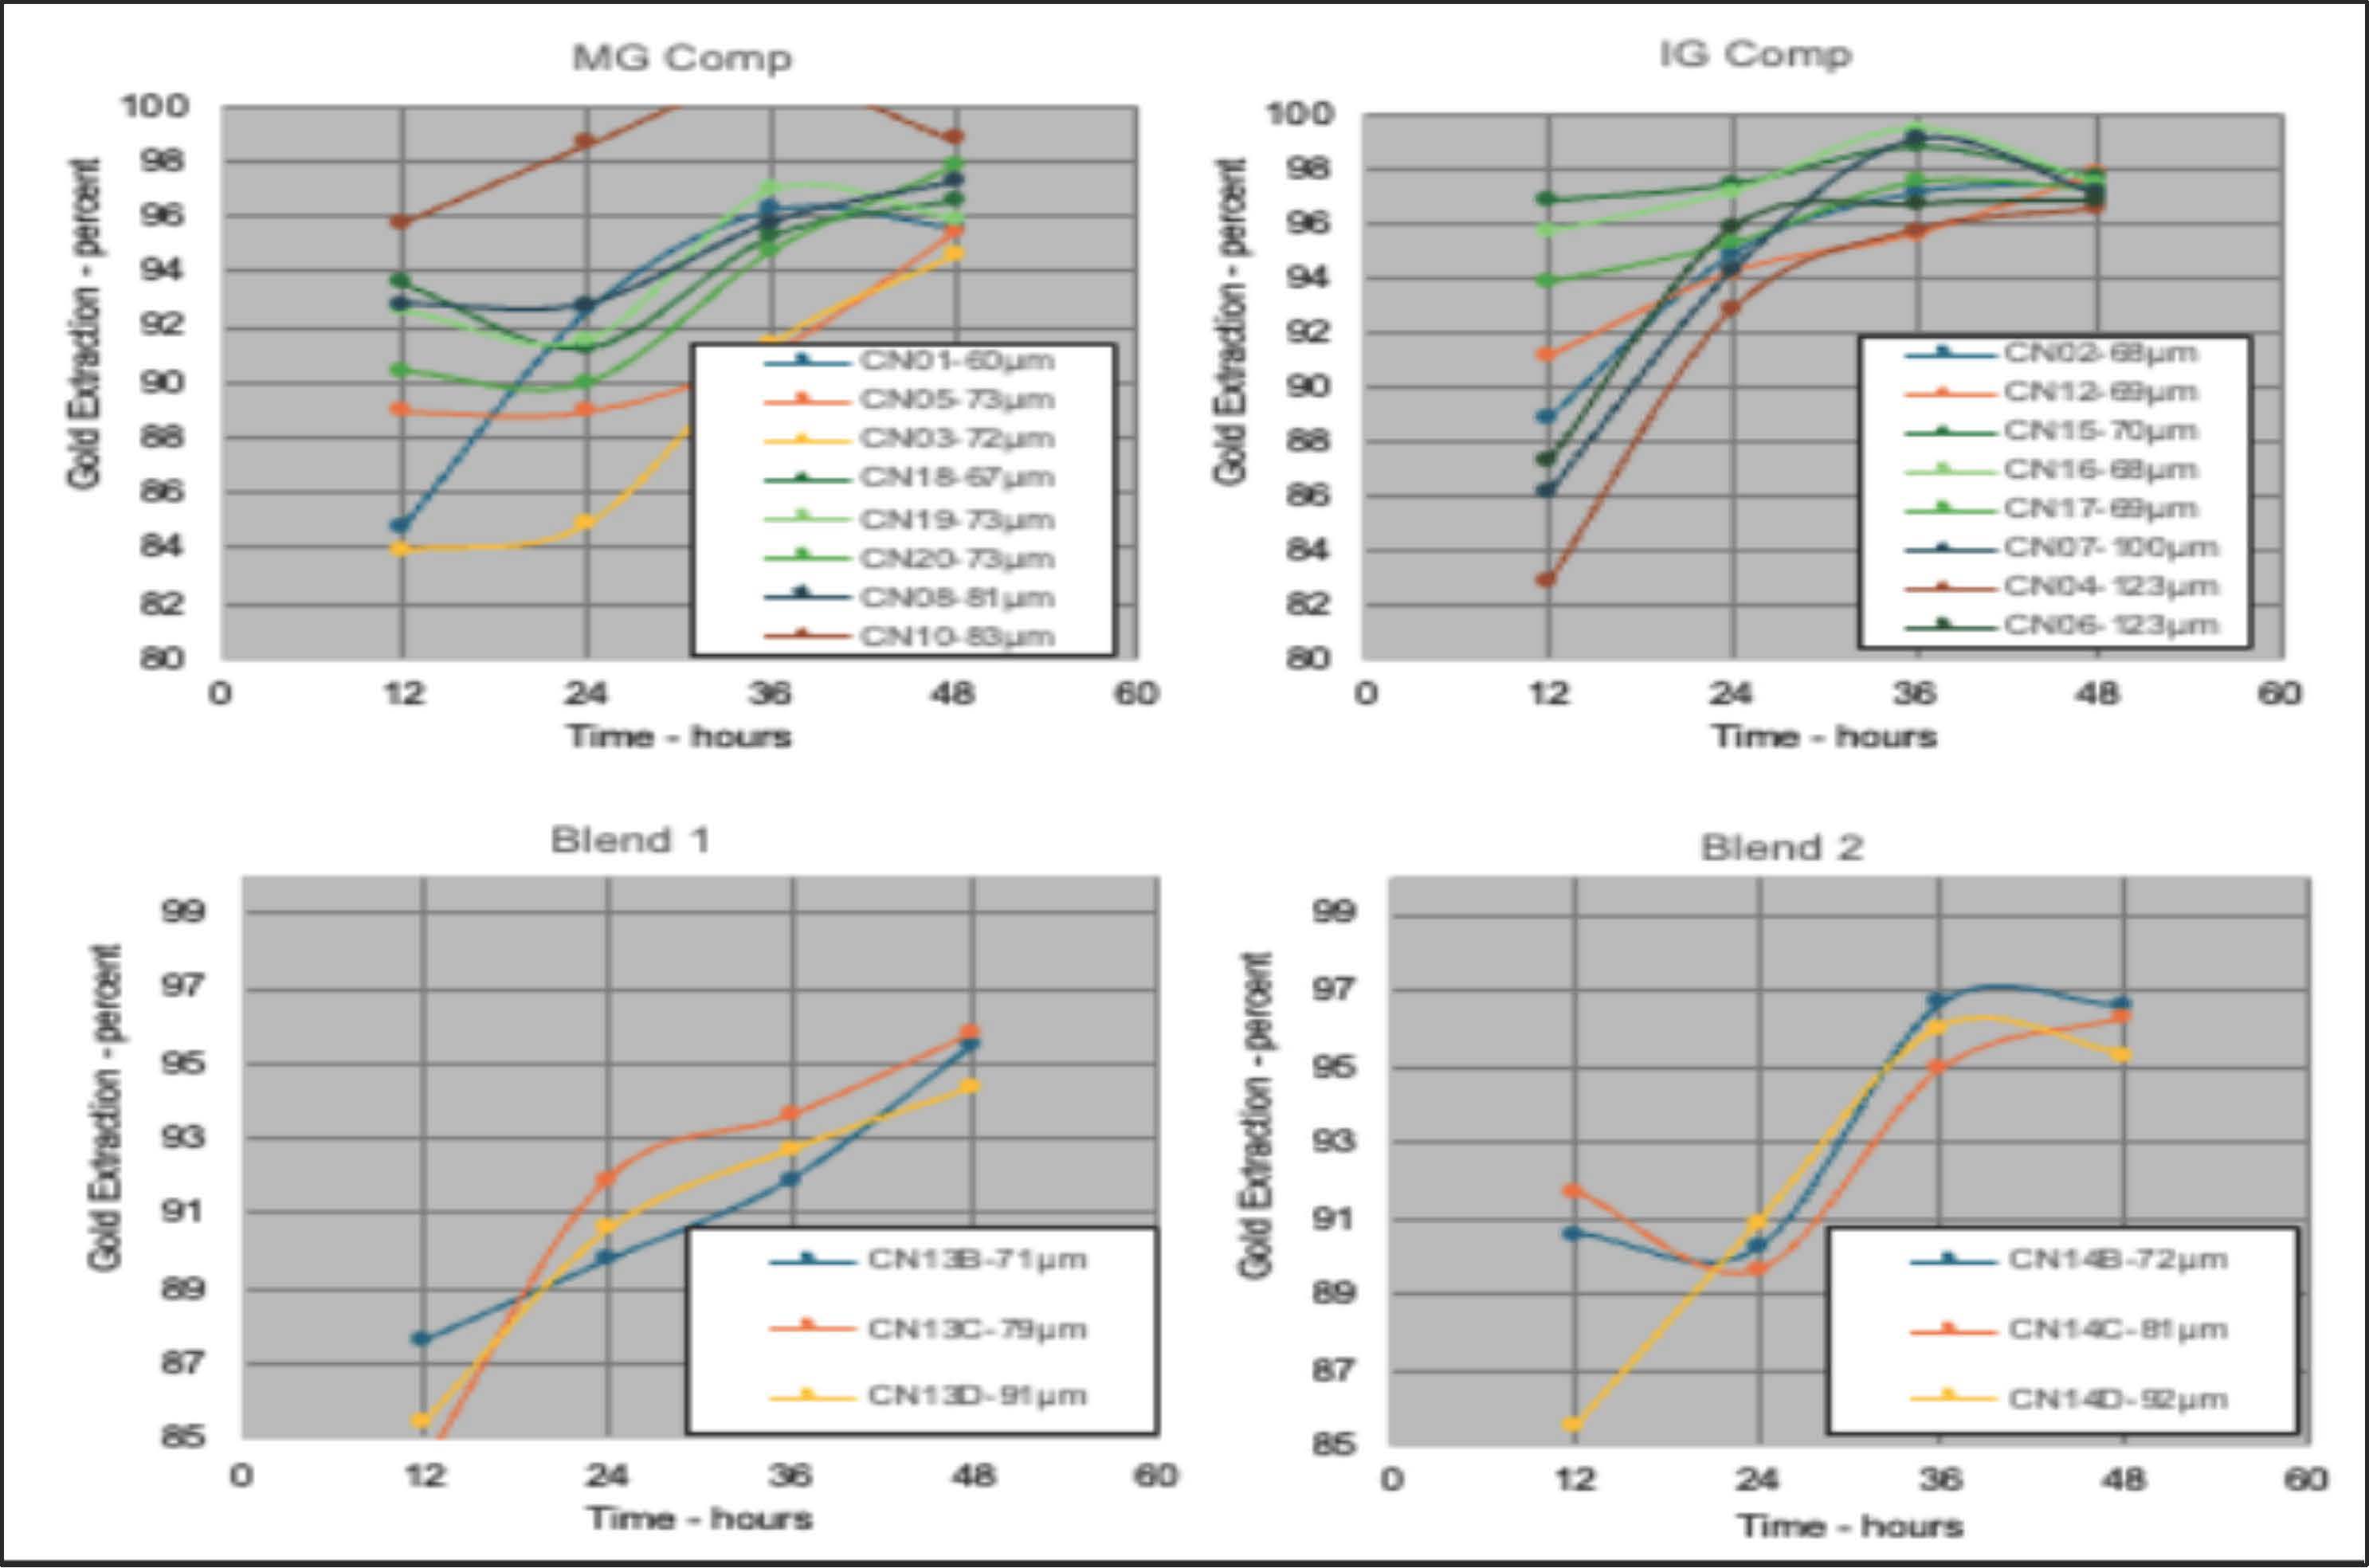
A metallurgical test program was carried out to evaluate the impact on gold recovery of blending material from the Magino and Island Gold deposits using a gravity and tailings leach flowsheet, followed by thickening. Two blend ratios were tested at selected grind sizes to assess their effect on recovery performance.
Island Gold material has limited SMC test data available. For this program, a single sample was provided and tested, yielding an Axb value of 30.2. This result is consistent with previous tests reported, which averaged an Axb of 30.0, classifying the sample as medium-hard with respect to SAG milling.
The Magino sample achieved combined gravity and leach gold recoveries ranging from 95.6 - 98.8%. Finer regrinding of the gravity tailings had no significant impact on gold extraction for this material.
The Island Gold sample showed slightly higher combined recoveries, between 97.3 - 98.2% gold. Gold content in the gravity concentrate was notably higher for this composite. However, recoveries decreased at coarser grind sizes, particularly above K₈₀ 100 µm.
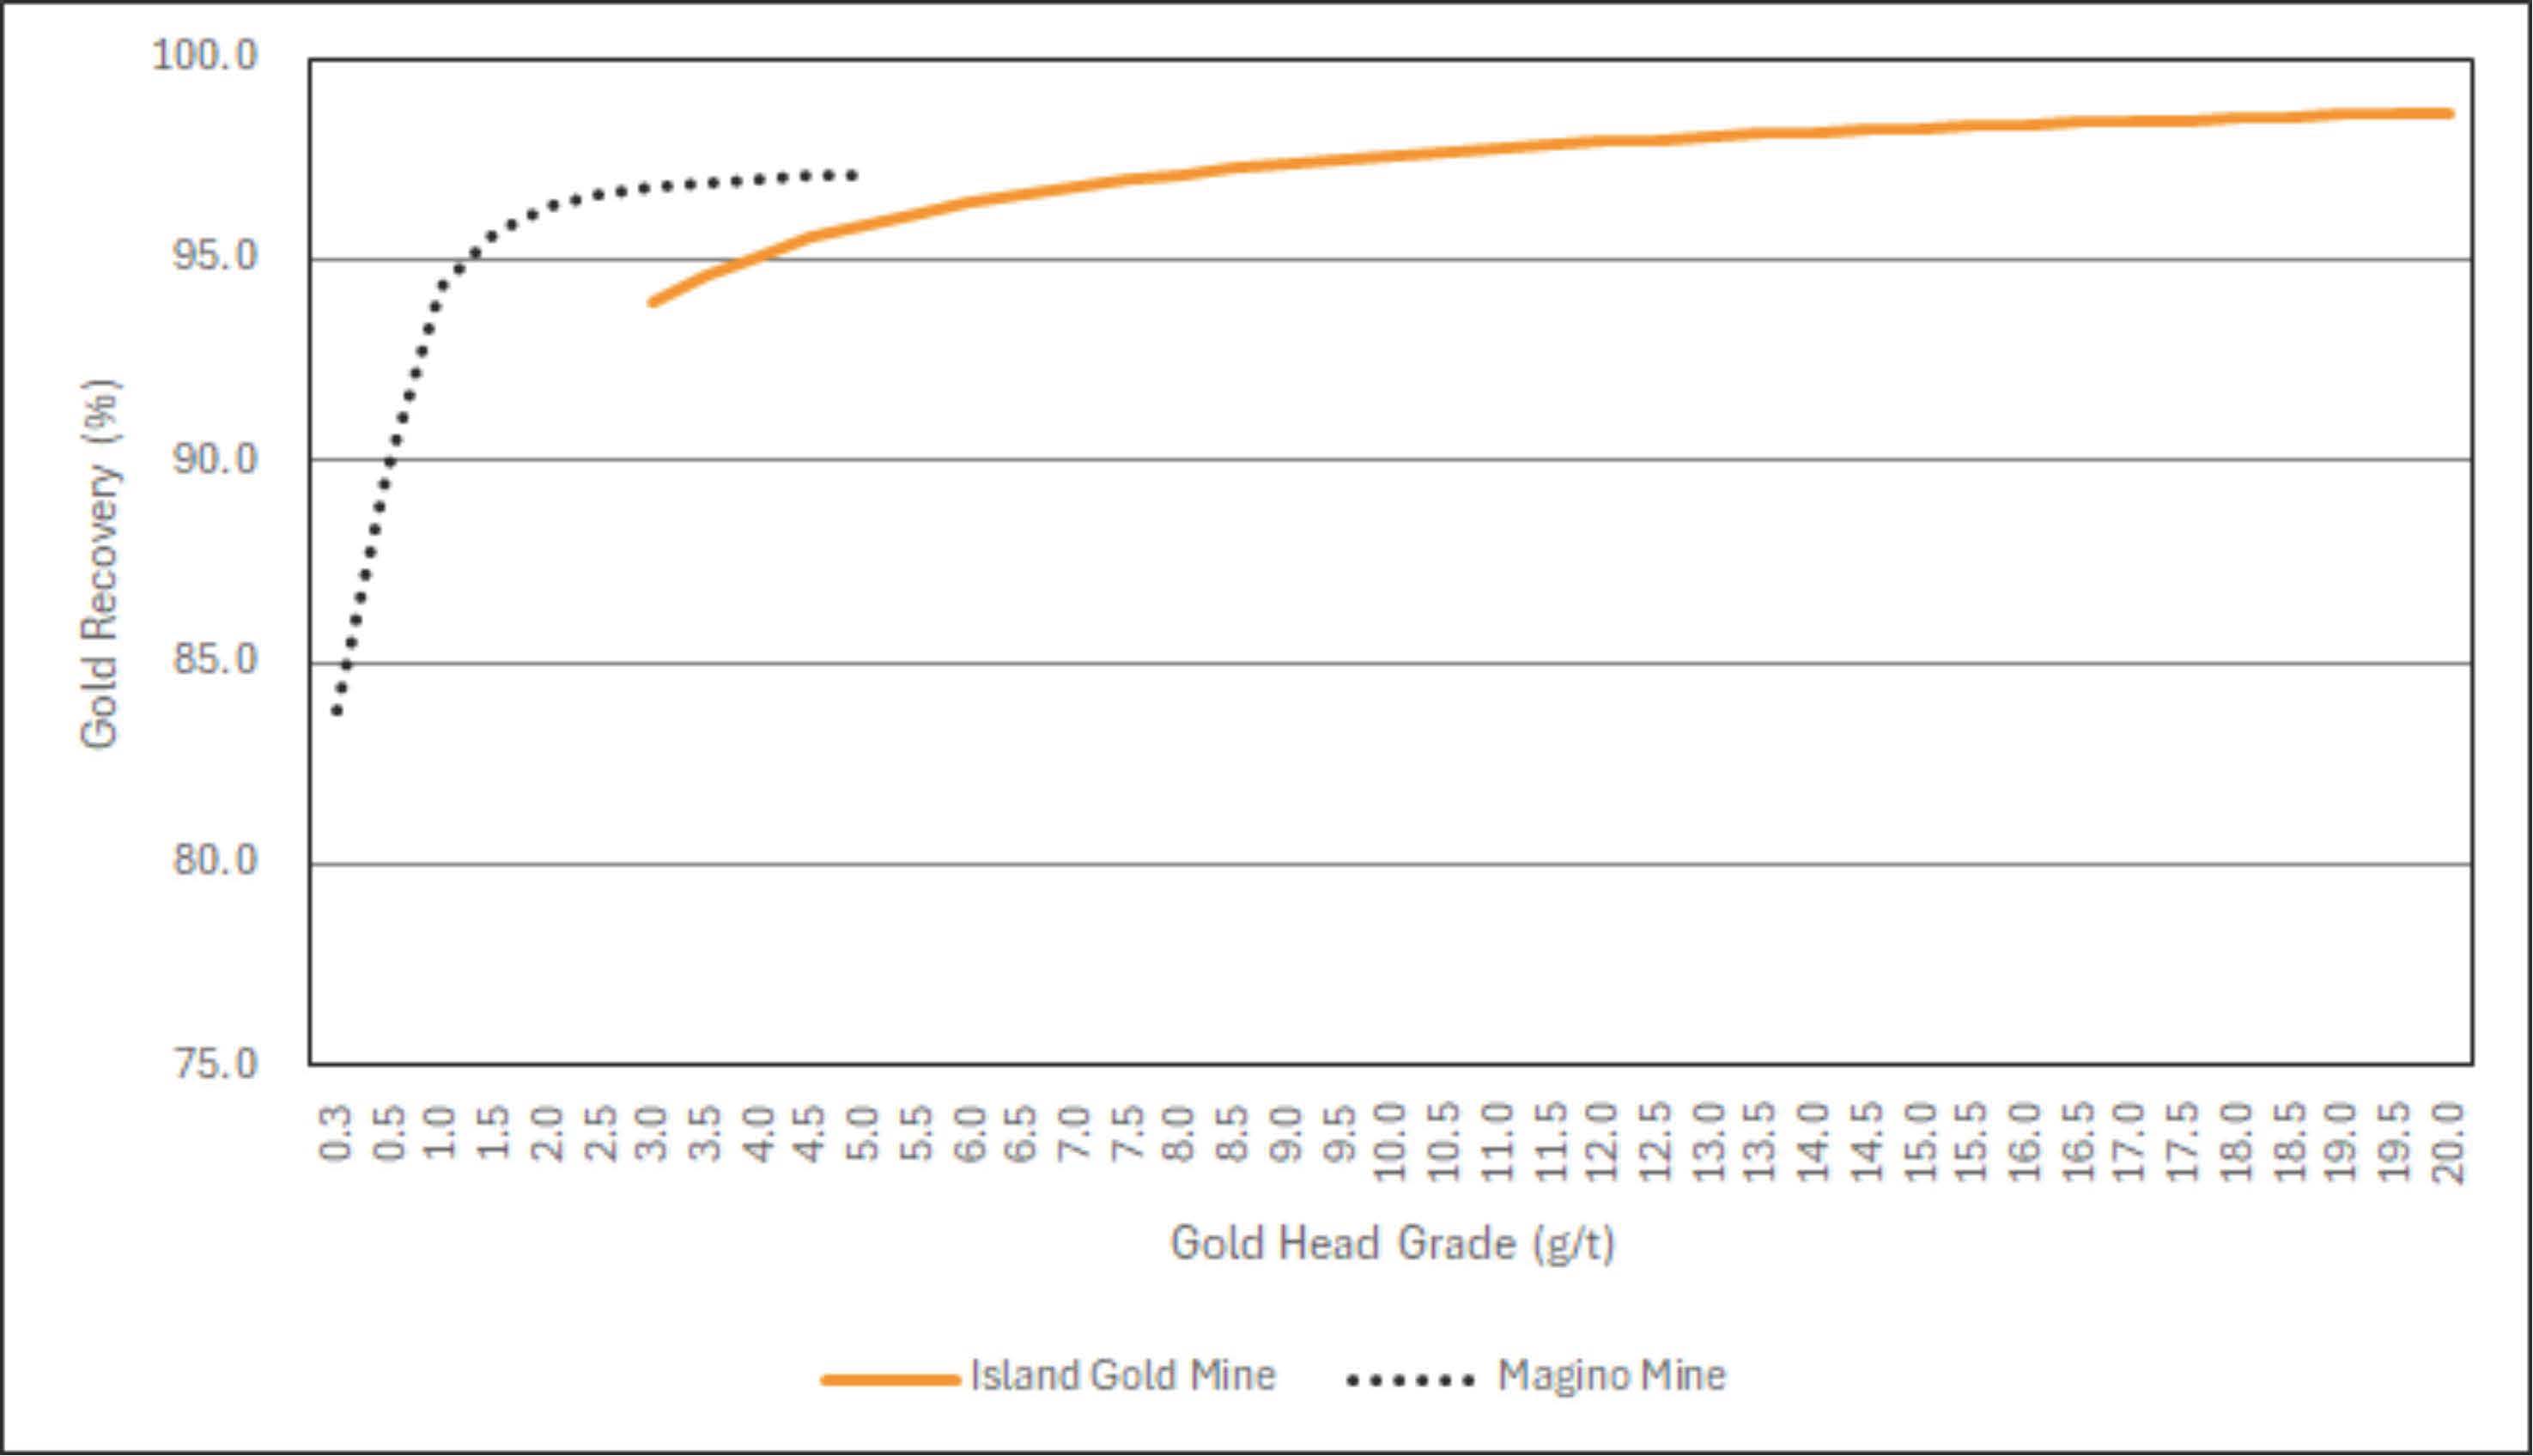
Recovery curves have been modeled based on actual mill performance for both ores. The Island Gold recovery curve is based on 2023 through Q1-2025 daily grade / recovery data in the Island Gold Mill and the Magino recovery curve is based on daily grade / recovery data since Magino mill start-up in 2023. The corresponding gold recovery algorithms are as follows:
Island Gold
AuRec = exp(4.580933 – 0.135214/Au + 0.005823*ln(Au))
Magino
AuRec = 57.088538 + (40.341080 * Au^1.514130) / (0.192565^1.514130 + Au^1.514130)
Where, AuRec = recoverable gold (%)
Au = gold head grade (g/t)
Both blend composites performed well overall. Blend 2, which contained a higher proportion of Island Gold material, delivered the highest overall gold recoveries, though a slight decline was observed as grind size increased. Based on the range of recoveries achieved in the test work and sensitivity to grind with the Island Gold ore, a calculated recovery has been developed to provide an overall recovery of approximately 96%. This is based on using a 1:9 blend ratio of Island Gold to Magino ore with average mine feed grades of 10.85 g/t gold for Island Gold and 0.91 g/t gold for Magino. Modeled recoveries of 97.7% for Island Gold and 93.9% for Magino are used.
1.9 Mineral Resource Estimates
Updated Mineral Resource estimates were conducted for both the Island Gold underground and Magino open pit deposits, with an effective date of December 31st, 2024. The Island Gold and Magino Mineral Resource models are both separate and independent, and utilize different grade estimation and resource classification methodologies, as deemed appropriate by the respective QP’s and dictated by mining methods.
| | | | | |
Island Gold District – NI 43-101 Technical Report August 6, 2025 | 22
|
The Mineral Resource Estimates conform to CIM Definition Standards for Mineral Resources and Mineral Reserves (2014) and include Measured, Indicated and Inferred Resources
The underground Mineral Resources have been prepared by Alamos under the supervision of Mr. Tyler Poulin, P.Geo., Island Gold District Geology Superintendent. Mr. Poulin is not independent of the issuer and takes QP responsibility as defined in NI 43-101 for the underground Mineral Resource estimate.
The open pit Mineral Resources have been prepared under the supervision of Mr. Jeffrey Volk, CPG, FAusIMM, Director of Reserves and Resources for Alamos Gold Inc. Mr. Volk is not independent of the issuer and takes QP responsibility as defined in NI 43-101 for the open pit Mineral Resource estimate.
A summary of the Mineral Resource estimates within the Island Gold District is presented in Table 1-1.
Table 1-1 Summary of Mineral Resources – as of December 31st, 2024
| | | | | | | | | | | |
| Category | Tonnes and Grade | Contained Gold |
| Tonnes (kt) | Gold Grade (g/t) | (koz) |
Island Gold - Underground Measured Indicated Sub-Total Measured + Indicated Inferred |
470 2,640 3,110 2,449 |
14.66 9.75 10.49 16.88 |
222 827 1,049 1,329 |
Magino – Open Pit Measured Indicated Sub-Total Measured + Indicated Inferred |
5,061 55,209 60,270 40,291 |
0.87 0.91 0.91 0.92 |
141 1,615 1,756 1,191 |
Total Island Gold District Measured Indicated Total Measured + Indicated Inferred |
5,531 57,849 63,380 42,740 |
2.04 1.31 1.38 1.83 |
363 2,442 2,805 2,520 |
Notes:
•CIM definition standards for Mineral Resources and Mineral Reserves (2014) were used for reporting of Mineral Resources.
•Mineral Resources are estimated using a long-term gold price of US$1,800 per troy ounce. The exchange rate used was 1.00 C$ = 0.75 US$.
•Island Gold underground assumptions include:
Underground Mineral Resources are estimated at an undiluted cut-off grade of 3.36 g/t gold and are constrained by potentially mineable zones of contiguous blocks.
Gold metallurgical recovery estimated as 97%.
A minimum mining width of 2.00 m was used for all zones.
A specific gravity value of 2.78 t/m3 was used for all zones.
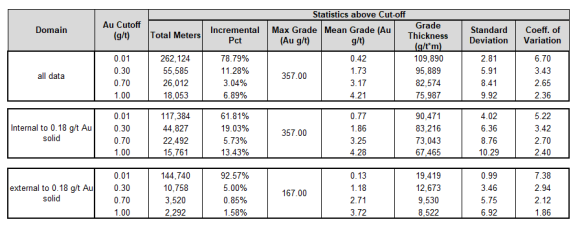
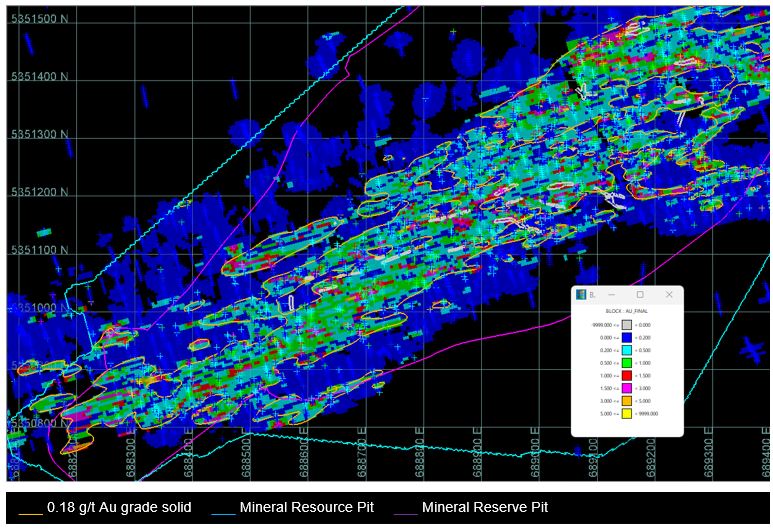
•Magino open pit assumptions include:
Open pit Mineral Resources are estimated at a cut-off grade of 0.28 g/t gold and contained within a potentially economic open pit shell optimized on Measured, Indicated and Inferred material. Includes external dilution at 0.00 g/t gold for material external to the 0.18 g/t gold solid.
Gold metallurgical recovery estimated as 91.7%.
Contained gold ounces are in-situ and do not include mining losses or metallurgical recovery losses.
•Mineral Resources, which are not Mineral Reserves, do not have demonstrated economic viability.
•Mineral Resources are exclusive of Mineral Reserves.
| | | | | |
Island Gold District – NI 43-101 Technical Report August 6, 2025 | 23
|
•Date of Mineral Resources is as of December 31st, 2024.
•The QP for the Island Gold underground Mineral Resource estimate is Mr. T. Poulin, P.Geo., Alamos Gold.
•The QP for the Magino open pit Mineral Resource estimate is Mr. Jeffrey Volk, CPG, FAusIMM, Director of Reserves and Resources for Alamos Gold Inc.
•Totals may not match due to rounding.
The Mineral Resources reported herein supersede the Mineral Resources reported previously at year-end 2024 by Alamos for the District on February 18th, 2025.
1.10 Mineral Reserve Estimates
The District is currently in operation, with production being provided by an underground mine (Island Gold) in combination with an adjacent open pit mine (Magino).
The Mineral Reserve Estimates conform to CIM Definition Standards for Mineral Resources and Mineral Reserves (2014) and only include Measured and Indicated Resources that have been converted to Proven and Probable Reserves.
The underground Mineral Reserves have been prepared by Island Gold under the supervision of Mr. Nathan Bourgeault, P.Eng., Technical Services Manager at the Island Gold District. Mr. Bourgeault is not independent of the issuer and takes QP responsibility as defined in NI 43-101 for the underground Mineral Reserve estimate.
The open pit Mineral Reserves have been prepared by Magino under the guidance of Mr. Christopher Bostwick, FAusIMM, Senior Vice President – Technical Services at Alamos. Mr. Bostwick is not independent of the issuer and takes QP responsibility as defined in NI 43-101 for the open pit Mineral Reserve estimate.
The modifying factors utilized to determine the underground reserves at Island Gold are found in Table 1-2.
Table 1-2 Island Gold Underground Cut-Off Grade Parameters
| | | | | | | | |
| Parameter | Units | Value |
| Gold Price | US$ | $1,600 |
| Exchange Rate | US$:C$ | 0.75 |
| Stope Cut-off Grade | g/t | 3.78 |
| Development/Marginal Cut-off Grade | g/t | 2.95 |
Stope Dilution1 | % | 10 - 25% |
Development1 Dilution | % | 15 - 30% |
| Dilution Grade | g/t | 0.50 |
Mining Recovery1 | % | 50 - 95% |
| Process Recovery | % | 96.5% |
| Ore Specific Gravity | t/m3 | 2.78 |
| Minimum Mining Width | m | 2.8 |
| Mining, Processing and G&A Cost (incl. royalties) | C$/t | $251 |
Notes:
1.Dependant on sector and mining method
The modifying factors utilized to determine the open pit reserves at Magino are found in Table 1-3.
| | | | | |
Island Gold District – NI 43-101 Technical Report August 6, 2025 | 24
|
Table 1-3 Open Pit COG Calculation Parameters
| | | | | | | | |
Parameter Field | Unit | Value |
Metal Prices & FX Gold FX |
US $/oz (US$ : C$) |
1,600 0.75 |
Mining Cost Ore Base Cost Waste Base Cost Overburden Base Cost Inc. Cost per 5m Bench Below 390 Re-handle Long Term Stockpiles Sustaining Capital |
$/t ore $/t waste $/t overburden $/t mined $/t re-handle $/t mined |
3.65 3.59 1.68 0.01 1.96 1.29 |
Process Cost Process Fixed Cost Process Variable Cost Sustaining Capital Tailings Management Facility |
$/t milled $/t milled $/t milled $/t milled |
- 11.29 0.55 2.41 |
Treatment and Refining Gold Deductable (@99.9 % Payable) Freight, refining and representation |
$/oz recoverable $/oz recoverable |
2.13 5.09 |
Royalties IBAs Franco-Nevada Osisko South Osisko East |
% NSR % NSR % NSR % NSR |
0.84 3.00 2.00 3.00 |
| Gold Recovery at Cut-off Grade (COG) | % | 82.6 |
COG | g/t | 0.30 |
A summary of the Mineral Reserves estimated for the District is presented in Table 1-4.
Table 1-4 Summary of Mineral Reserves – as of December 31st, 2024
| | | | | | | | | | | |
| Category | Tonnes and Grade | Contained Gold |
| Tonnes (kt) | Gold Grade (g/t) | (koz) |
Island Gold Proven Probable Sub-Total Underground |
821 10,947 11,769 |
11.82 10.78 10.85 |
312 3,795 4,107 |
Magino Proven Probable Sub-Total Open Pit |
22,163 54,710 76,873 |
0.88 0.92 0.91 |
626 1,613 2,240 |
Total Island Gold District Proven Probable Total Mineral Reserves |
22,984 65,657 88,642 |
1.27 2.56 2.23 |
938 5,408 6,347 |
Notes:
•CIM definition standards for Mineral Resources and Mineral Reserves (2014) were used for reporting of Mineral Reserves.
•Mineral Reserves are estimated using a long-term gold price of US$1,600 per troy ounce. The exchange rate used was 1.00 C$ = 0.75 US$.
•Underground Mineral Reserves are estimated at cut-off grade of 2.95 g/t gold for developed areas and 3.78 g/t gold for undeveloped areas.
| | | | | |
Island Gold District – NI 43-101 Technical Report August 6, 2025 | 25
|
•Underground assumptions include:
A minimum mining width of 2.80 m.
A specific gravity value of 2.78 t/m3 was used for all zones
Planned dilution ranged between 15% and 35% depending on mining objective, method and zone at an average grade of 0.5 g/t gold.
Mining recovery ranged between 50% and 95% depending on mining objective, method and zone.
Average gold recovery estimated as 96.5%.
Cut-off value of C$ 251/t, inclusive of costs for mining, processing, G&A, refining & transport, and royalties.
•Open pit Mineral Reserves are estimated at a cut-off grade of 0.30 g/t gold.
•Open pit assumptions include:
A 1.0-metre dilution skin applied to above COG block sides adjacent to below COG blocks. Dilution grade is applied per the grade present in below COG blocks.
Gold recovery is variable per a recovery algorithm. At COG, metal recovery is estimated as 82.6%.
•Effective date of Mineral Reserves is December 31st, 2024.
•The QP for the Island Gold underground estimate is Mr. N. Bourgeault, P.Eng., Alamos Gold.
•The QP for the Magino open pit estimate is Mr. C. Bostwick, FAusIMM, Alamos Gold.
•Totals may not match due to rounding.
The Mineral Reserves reported herein supersede the Mineral Reserves reported previously at year-end 2024 by Alamos for the District on February 18th, 2025.
1.11 Mining Production Plans
Mining at the District is conducted using both underground and open pit mining methods. As the combined operations integrate and commence processing through only the Magino mill, the processing rate is expected to increase from a combined 11,200 tpd in 2025 to 12,400 tpd by late 2026.
Over the life-of-mine (LOM), the underground and open pit operations (including stockpiles) are scheduled to provide 13.3% and 86.7% of the ore tonnage processed with 64.7% and 35.3% of the contained ounces processed, respectively.
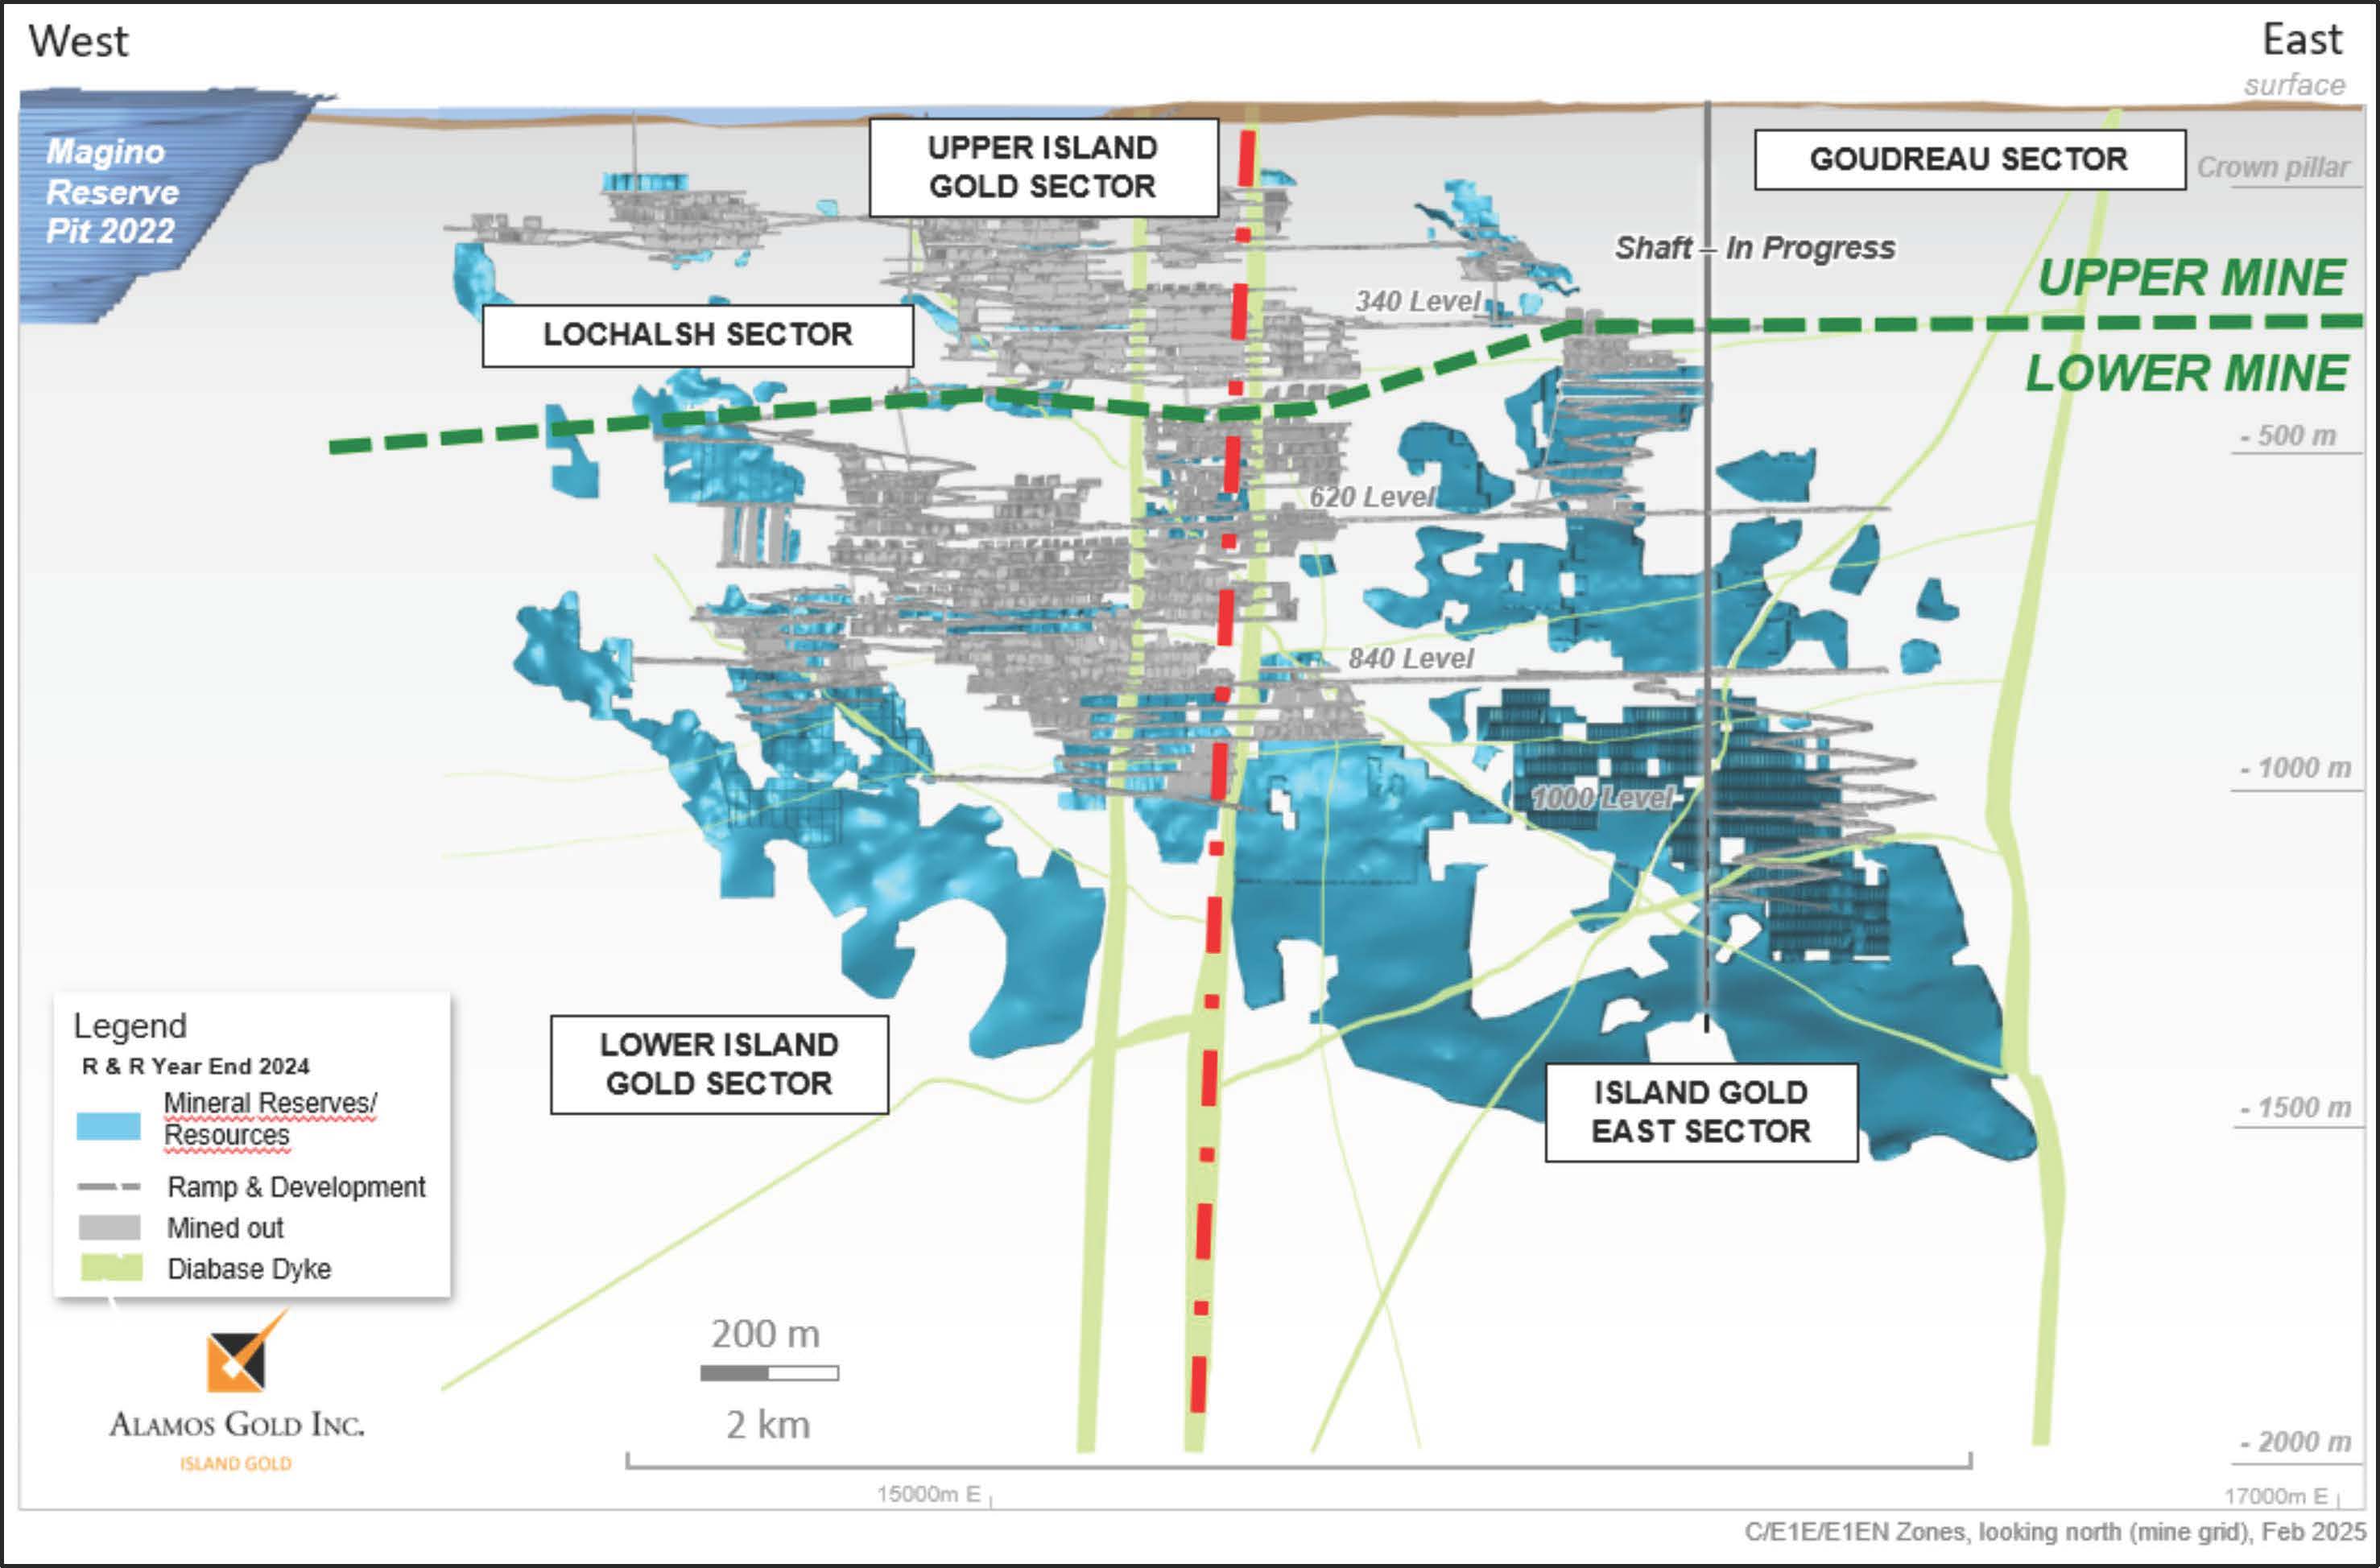
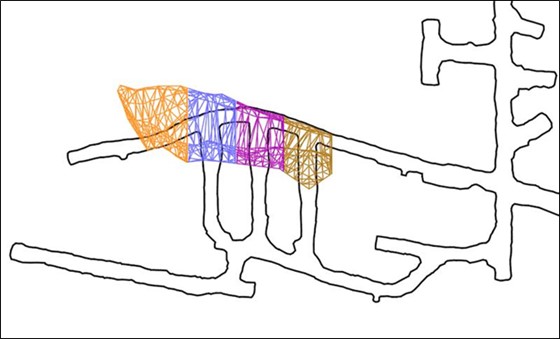
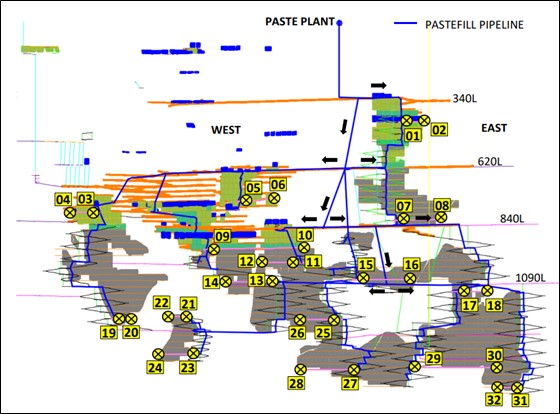
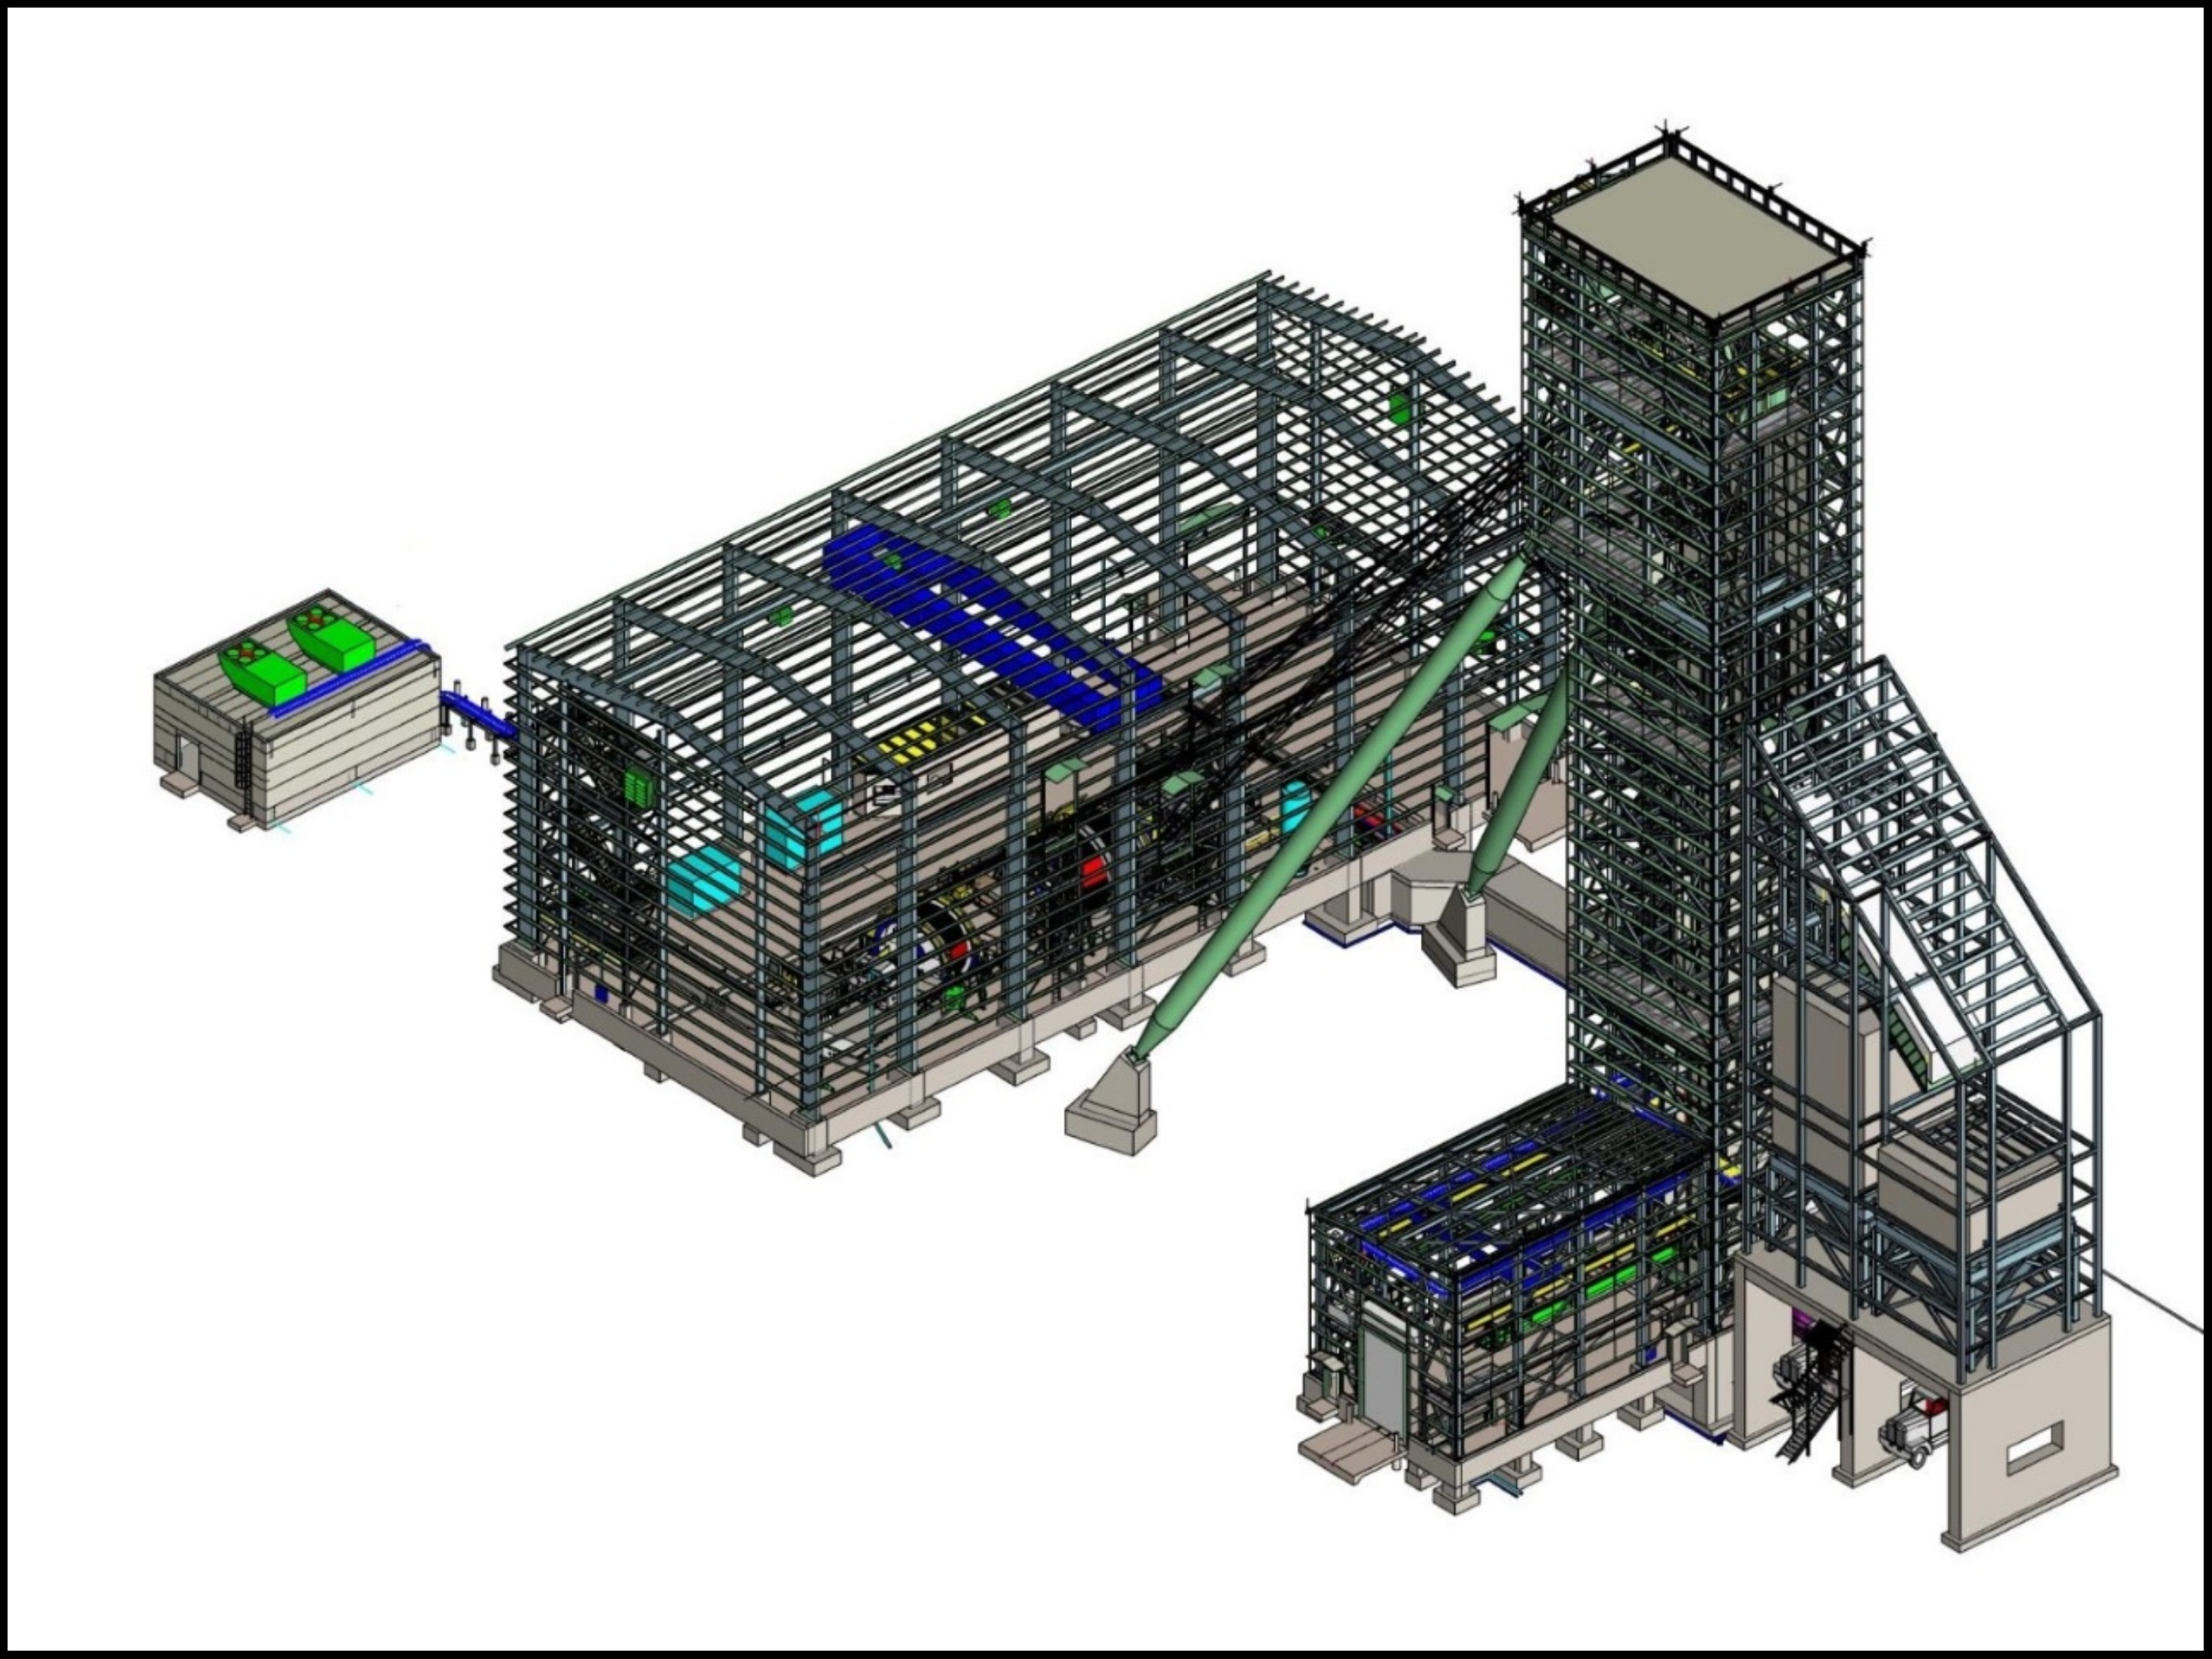
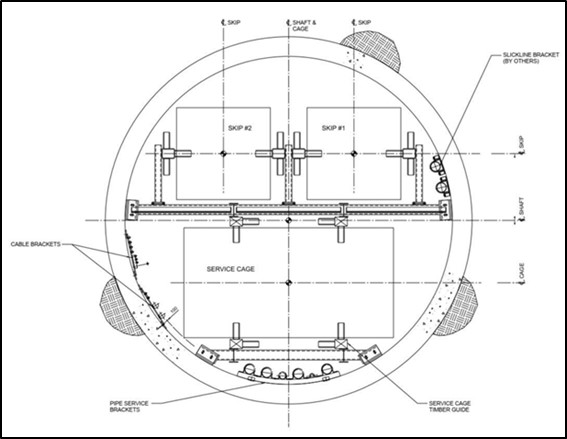
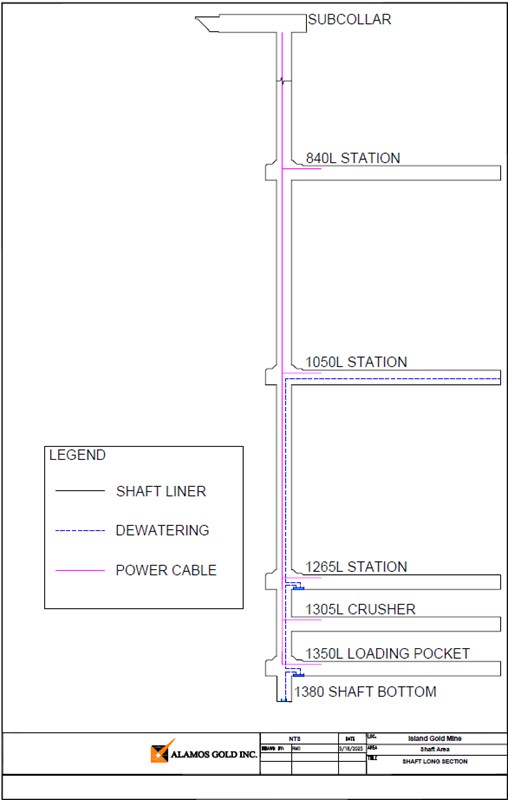
The underground mine is currently accessed via a single decline from surface down to the 425L, at which point multiple ramps are developed to internally access different zones of the mine at generally 26 m level intervals. A shaft is currently in development with completion scheduled in 2026 which will permit hoisting of ore and waste from the 1350L and provide services for the transport of personnel and services to any of three shaft stations.
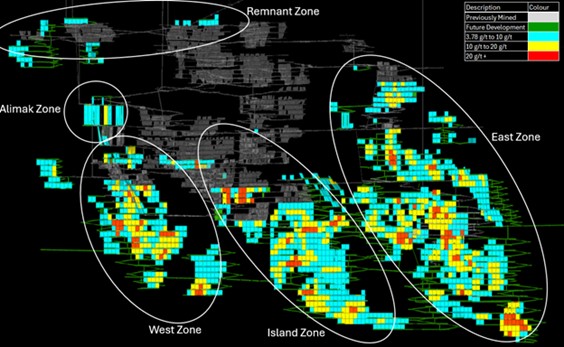
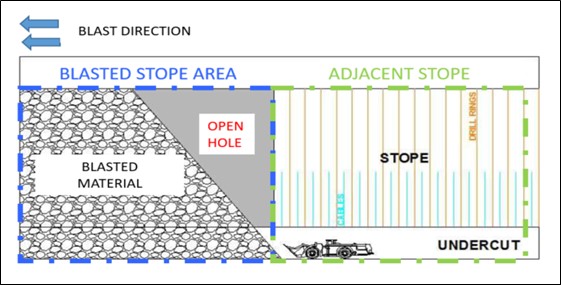
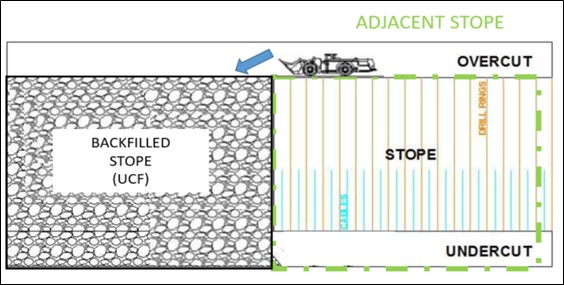
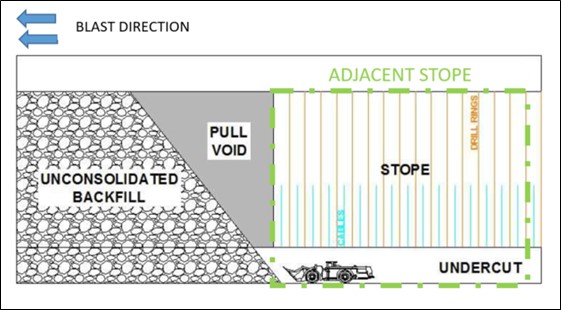
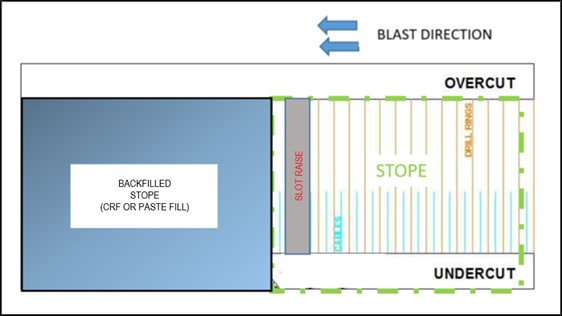
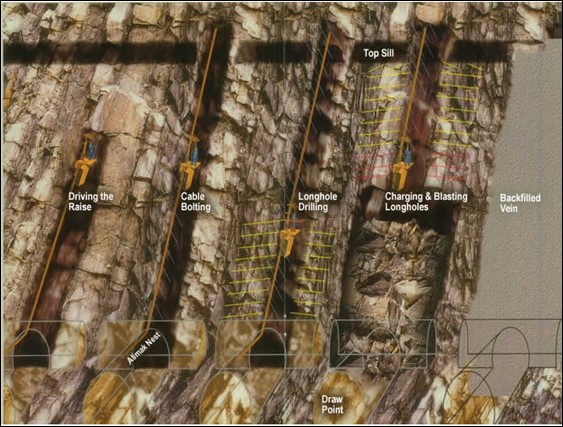
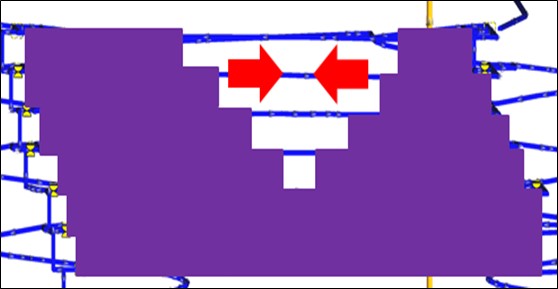
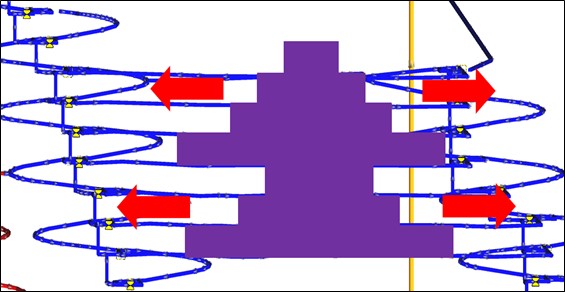
Multiple underground mining methods are employed, including: longitudinal longhole open stoping (principal method), transverse longhole open stoping, and alimak stoping. The selection of mining method is based on a variety of considerations including mineralization geometry, width of the ore zone, local stresses, etc.
A total of 140 km of lateral and vertical development are planned as part of the life of mine plan. Of this total approximately 21% is operating development, 75% is capital development and 4% is planned to support exploration activities.
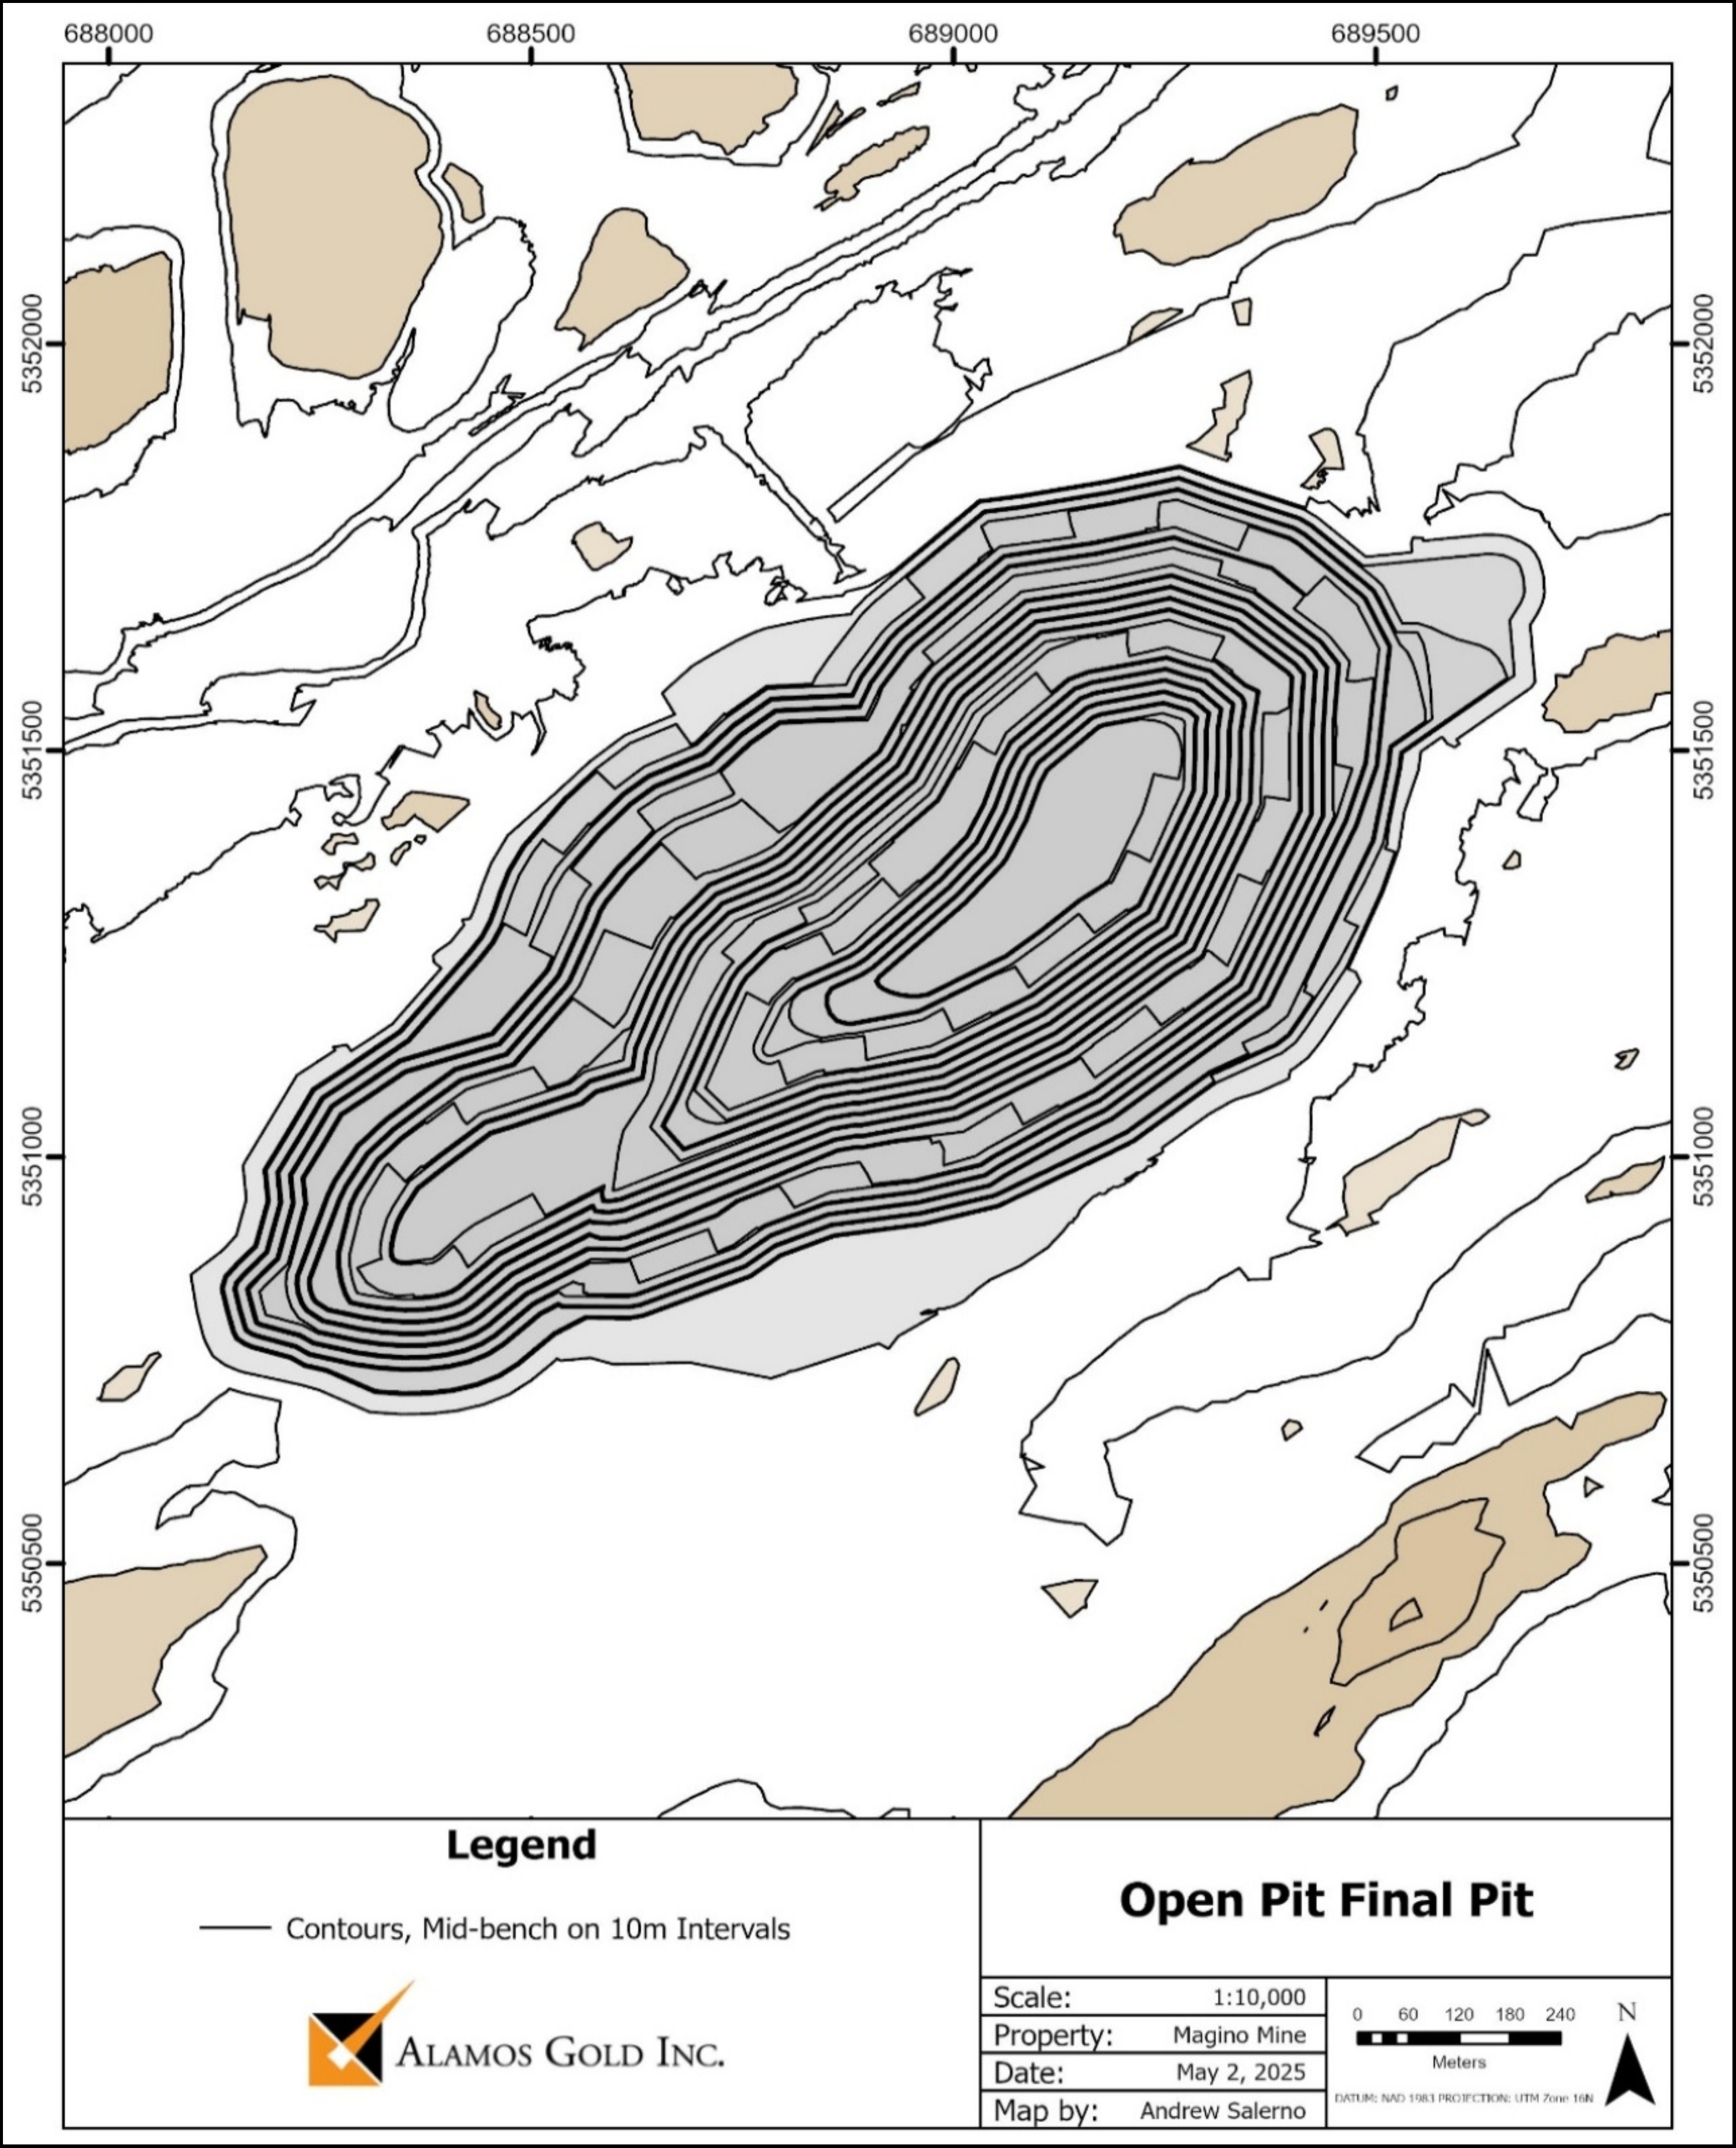
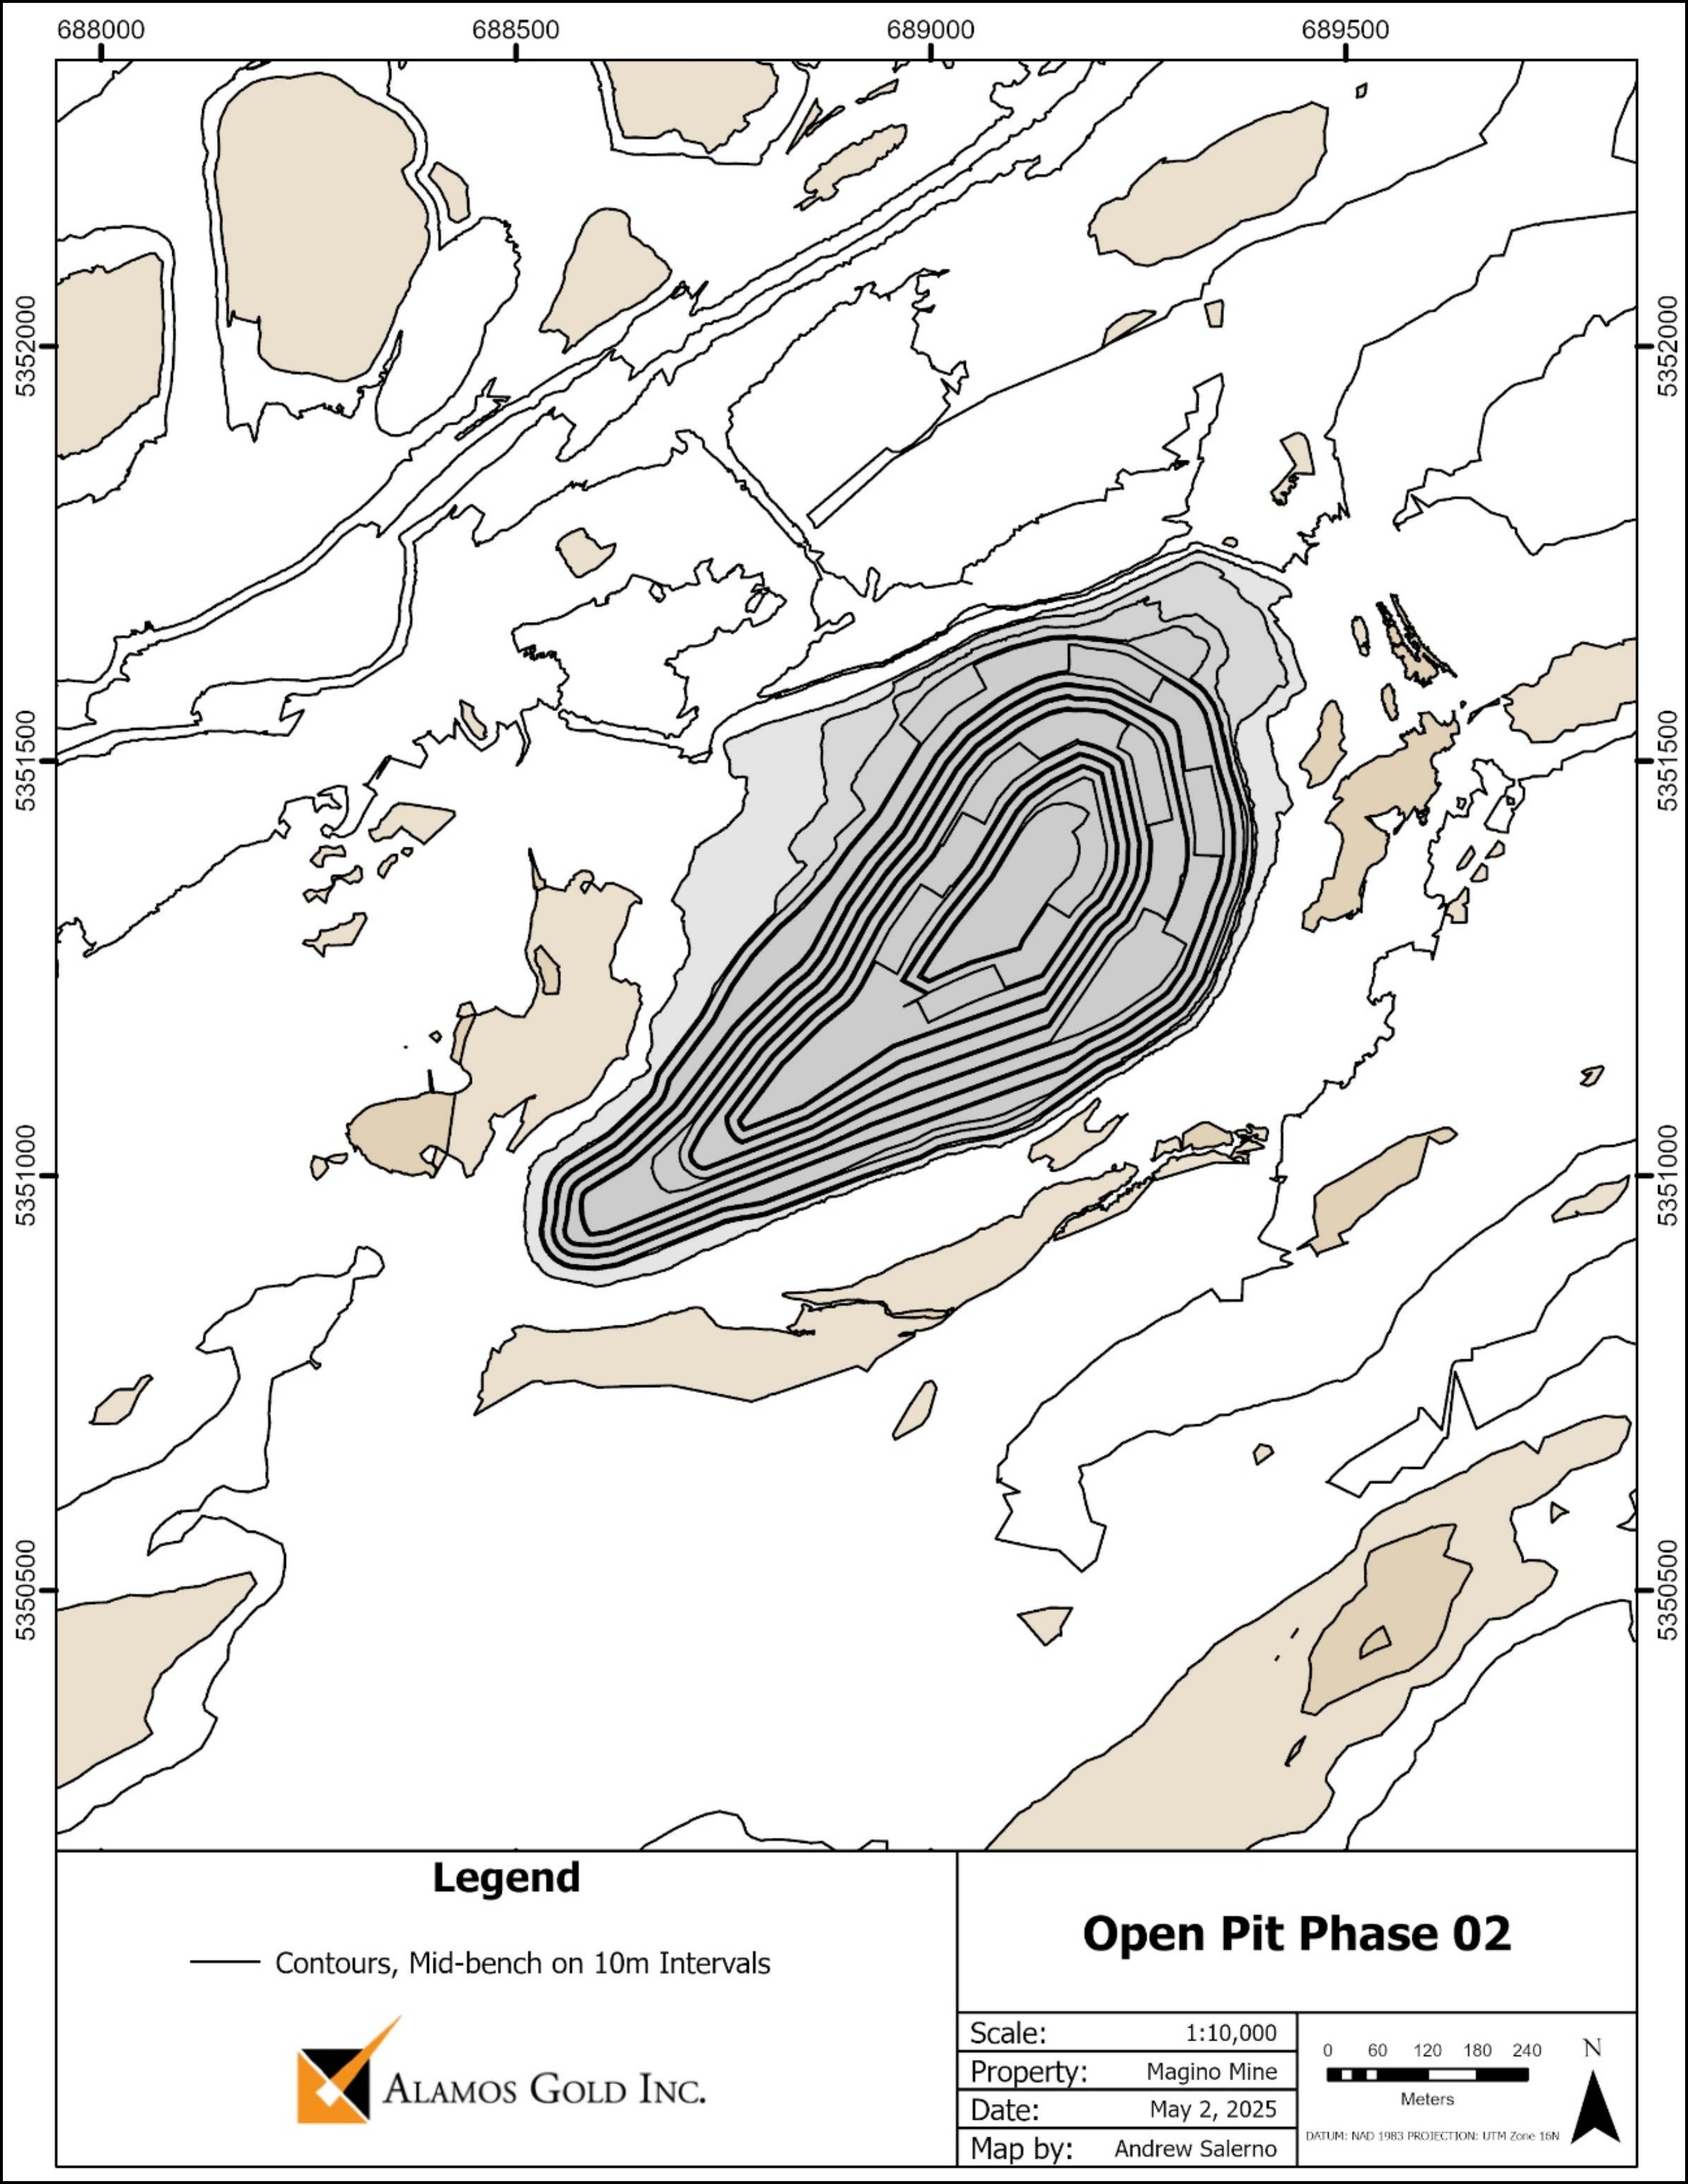
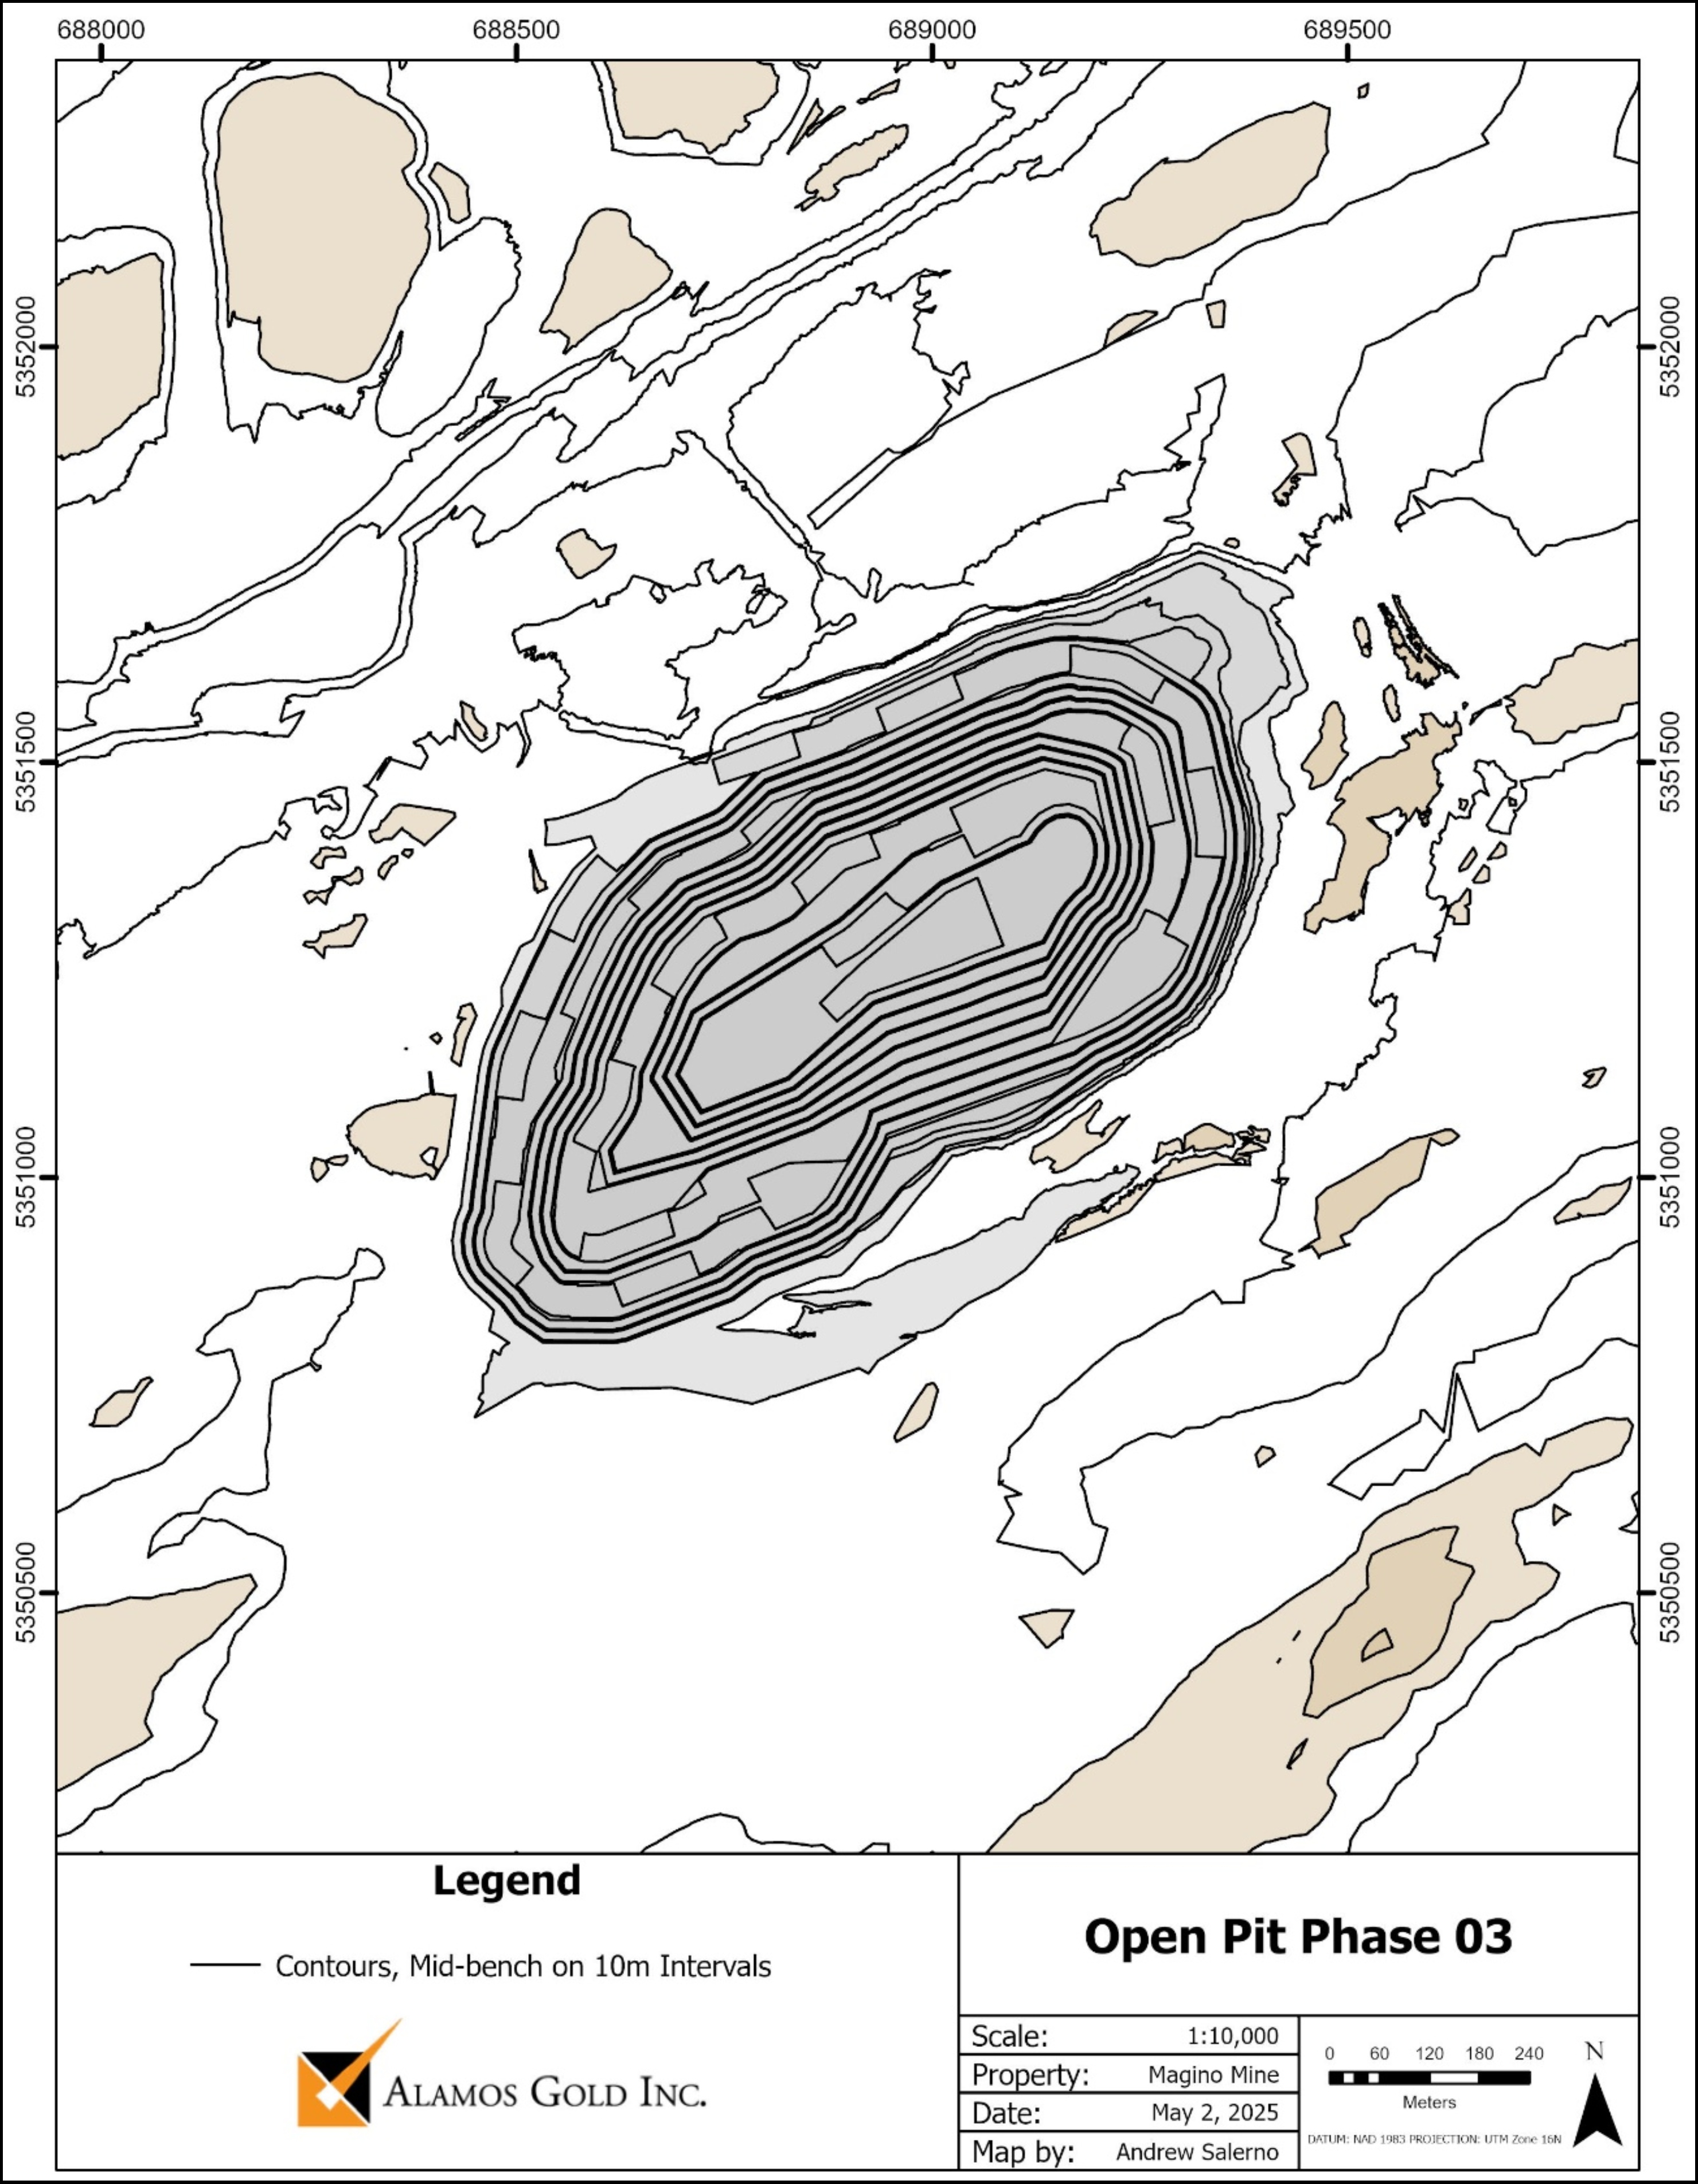
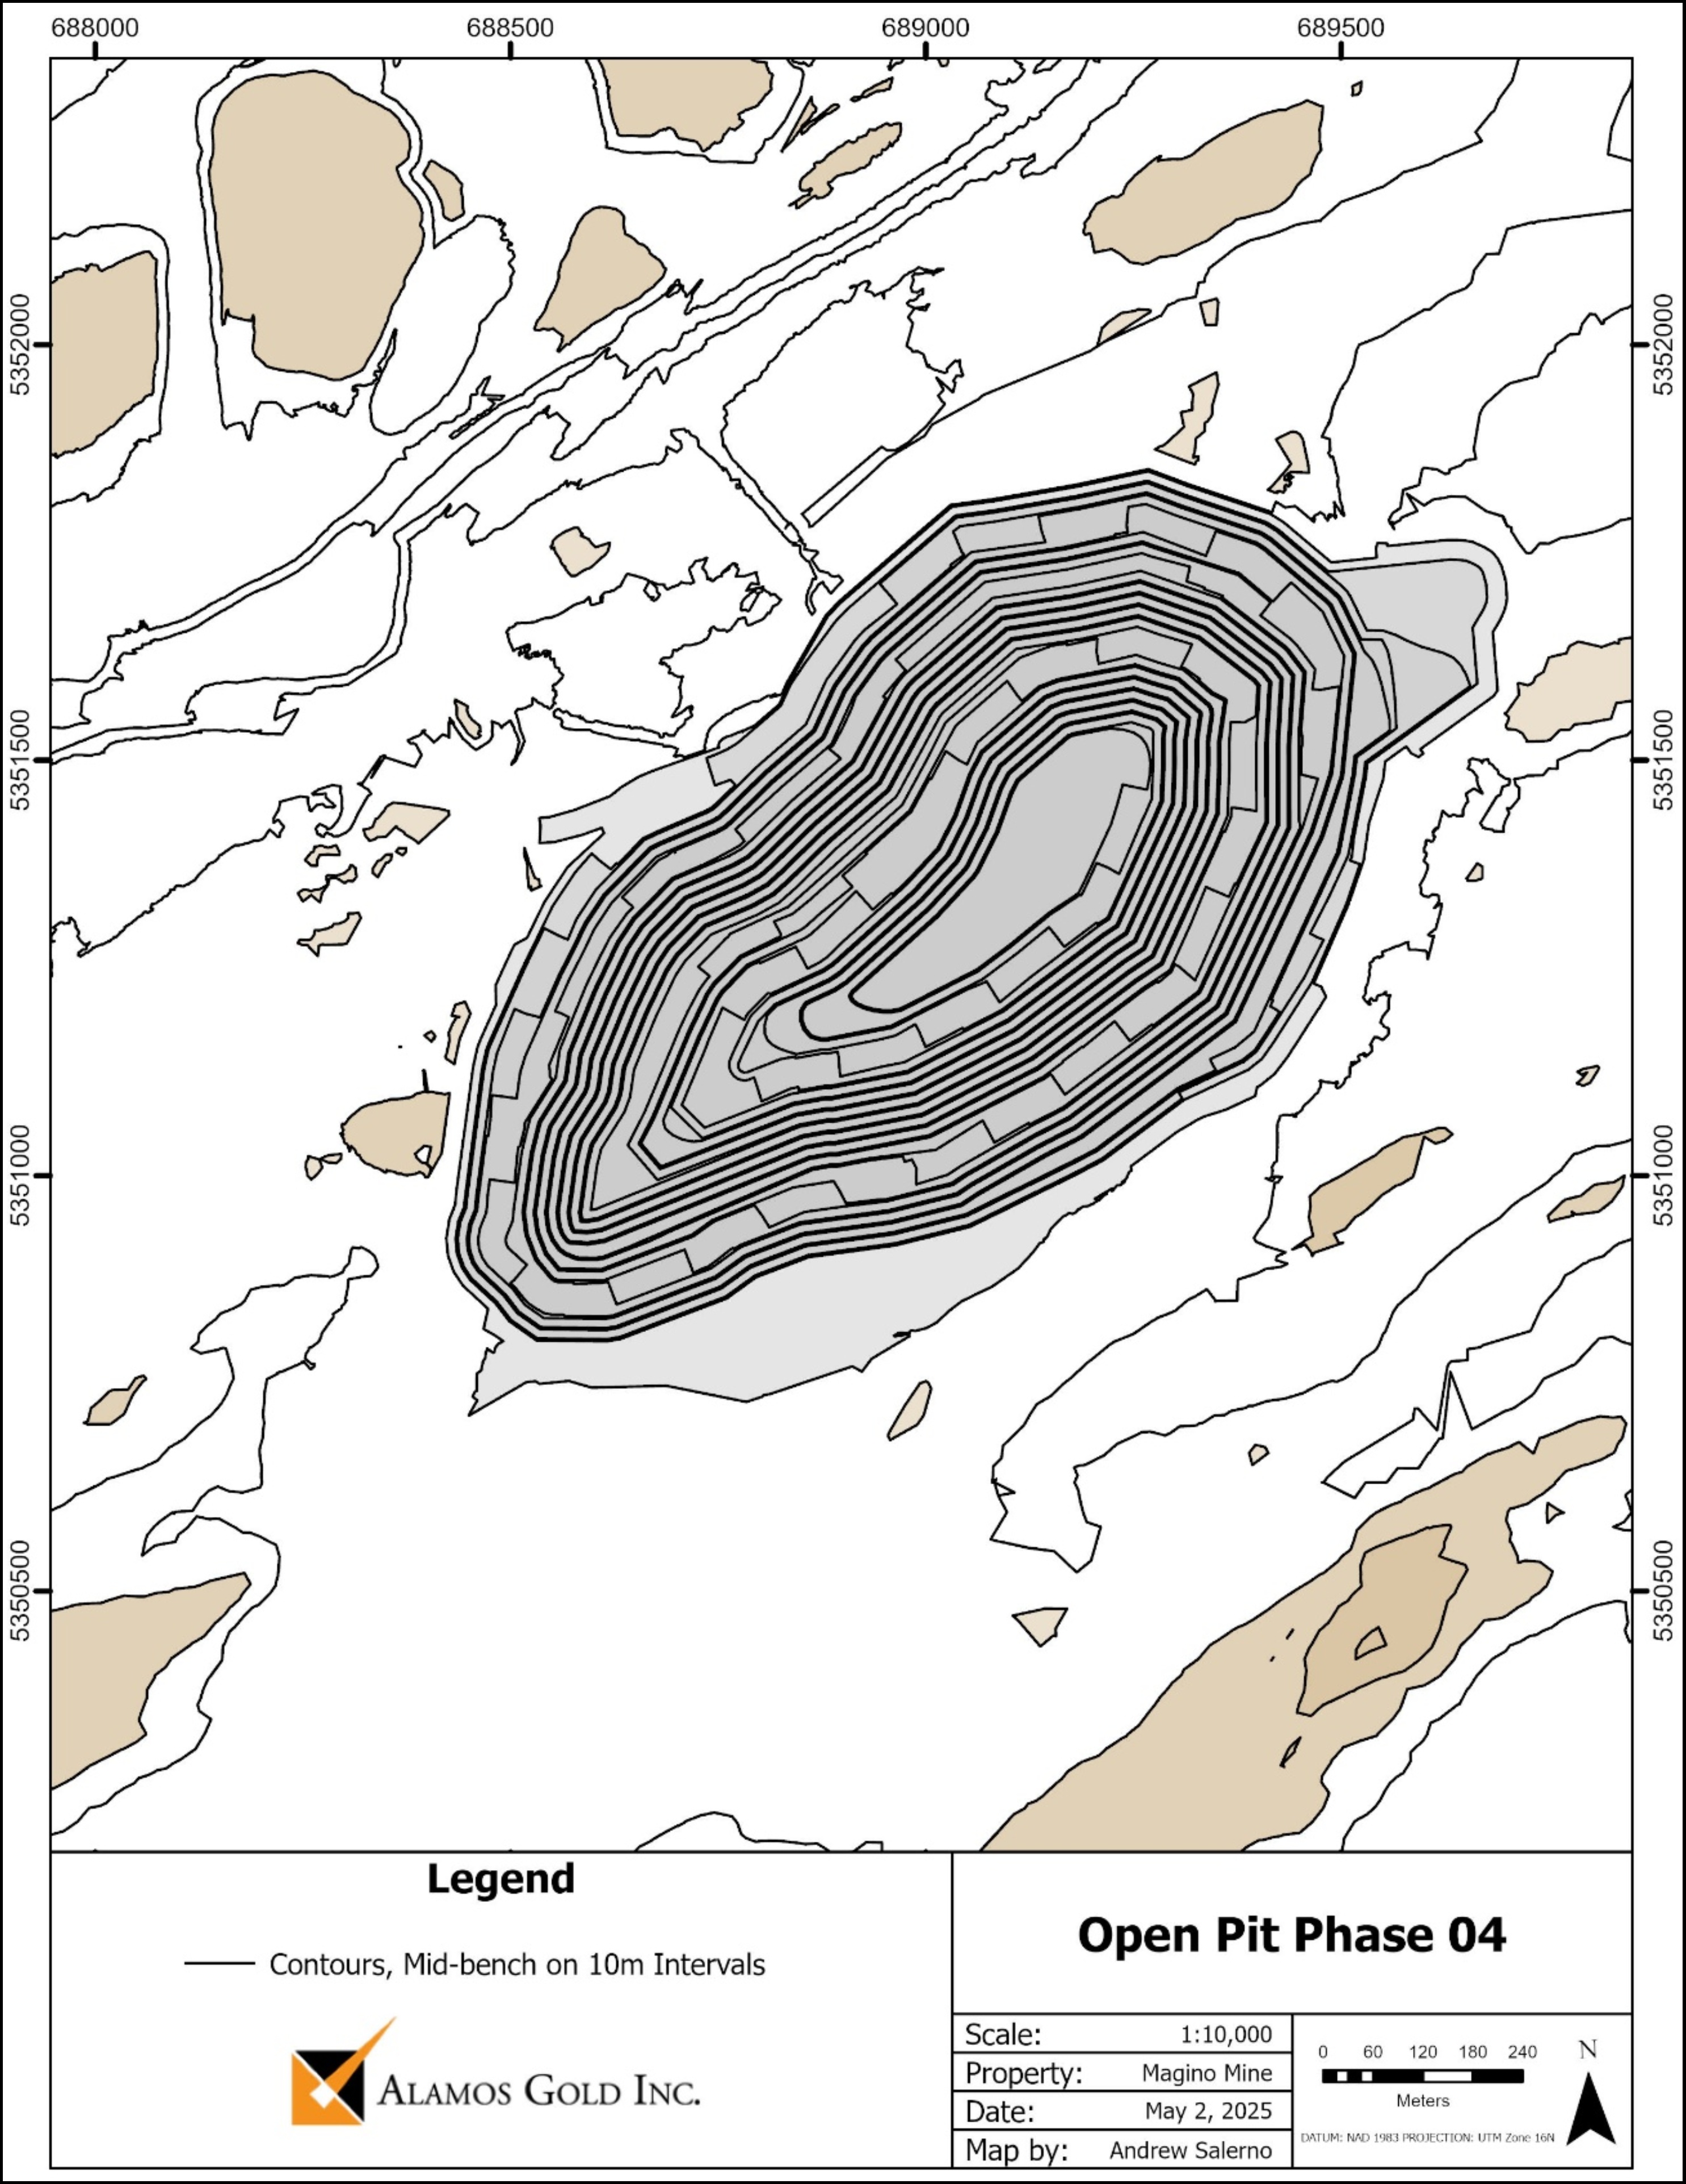
The open pit mine is a conventional truck and shovel mining operation, with a fleet of 139 t payload class haul trucks combined with diesel powered hydraulic shovels and excavators, supported by front-end loaders. The open pit operates at a peak mining rate of 74 ktpd ore and waste and has an overall strip ratio of 3.7:1 (waste:ore).
| | | | | |
Island Gold District – NI 43-101 Technical Report August 6, 2025 | 26
|
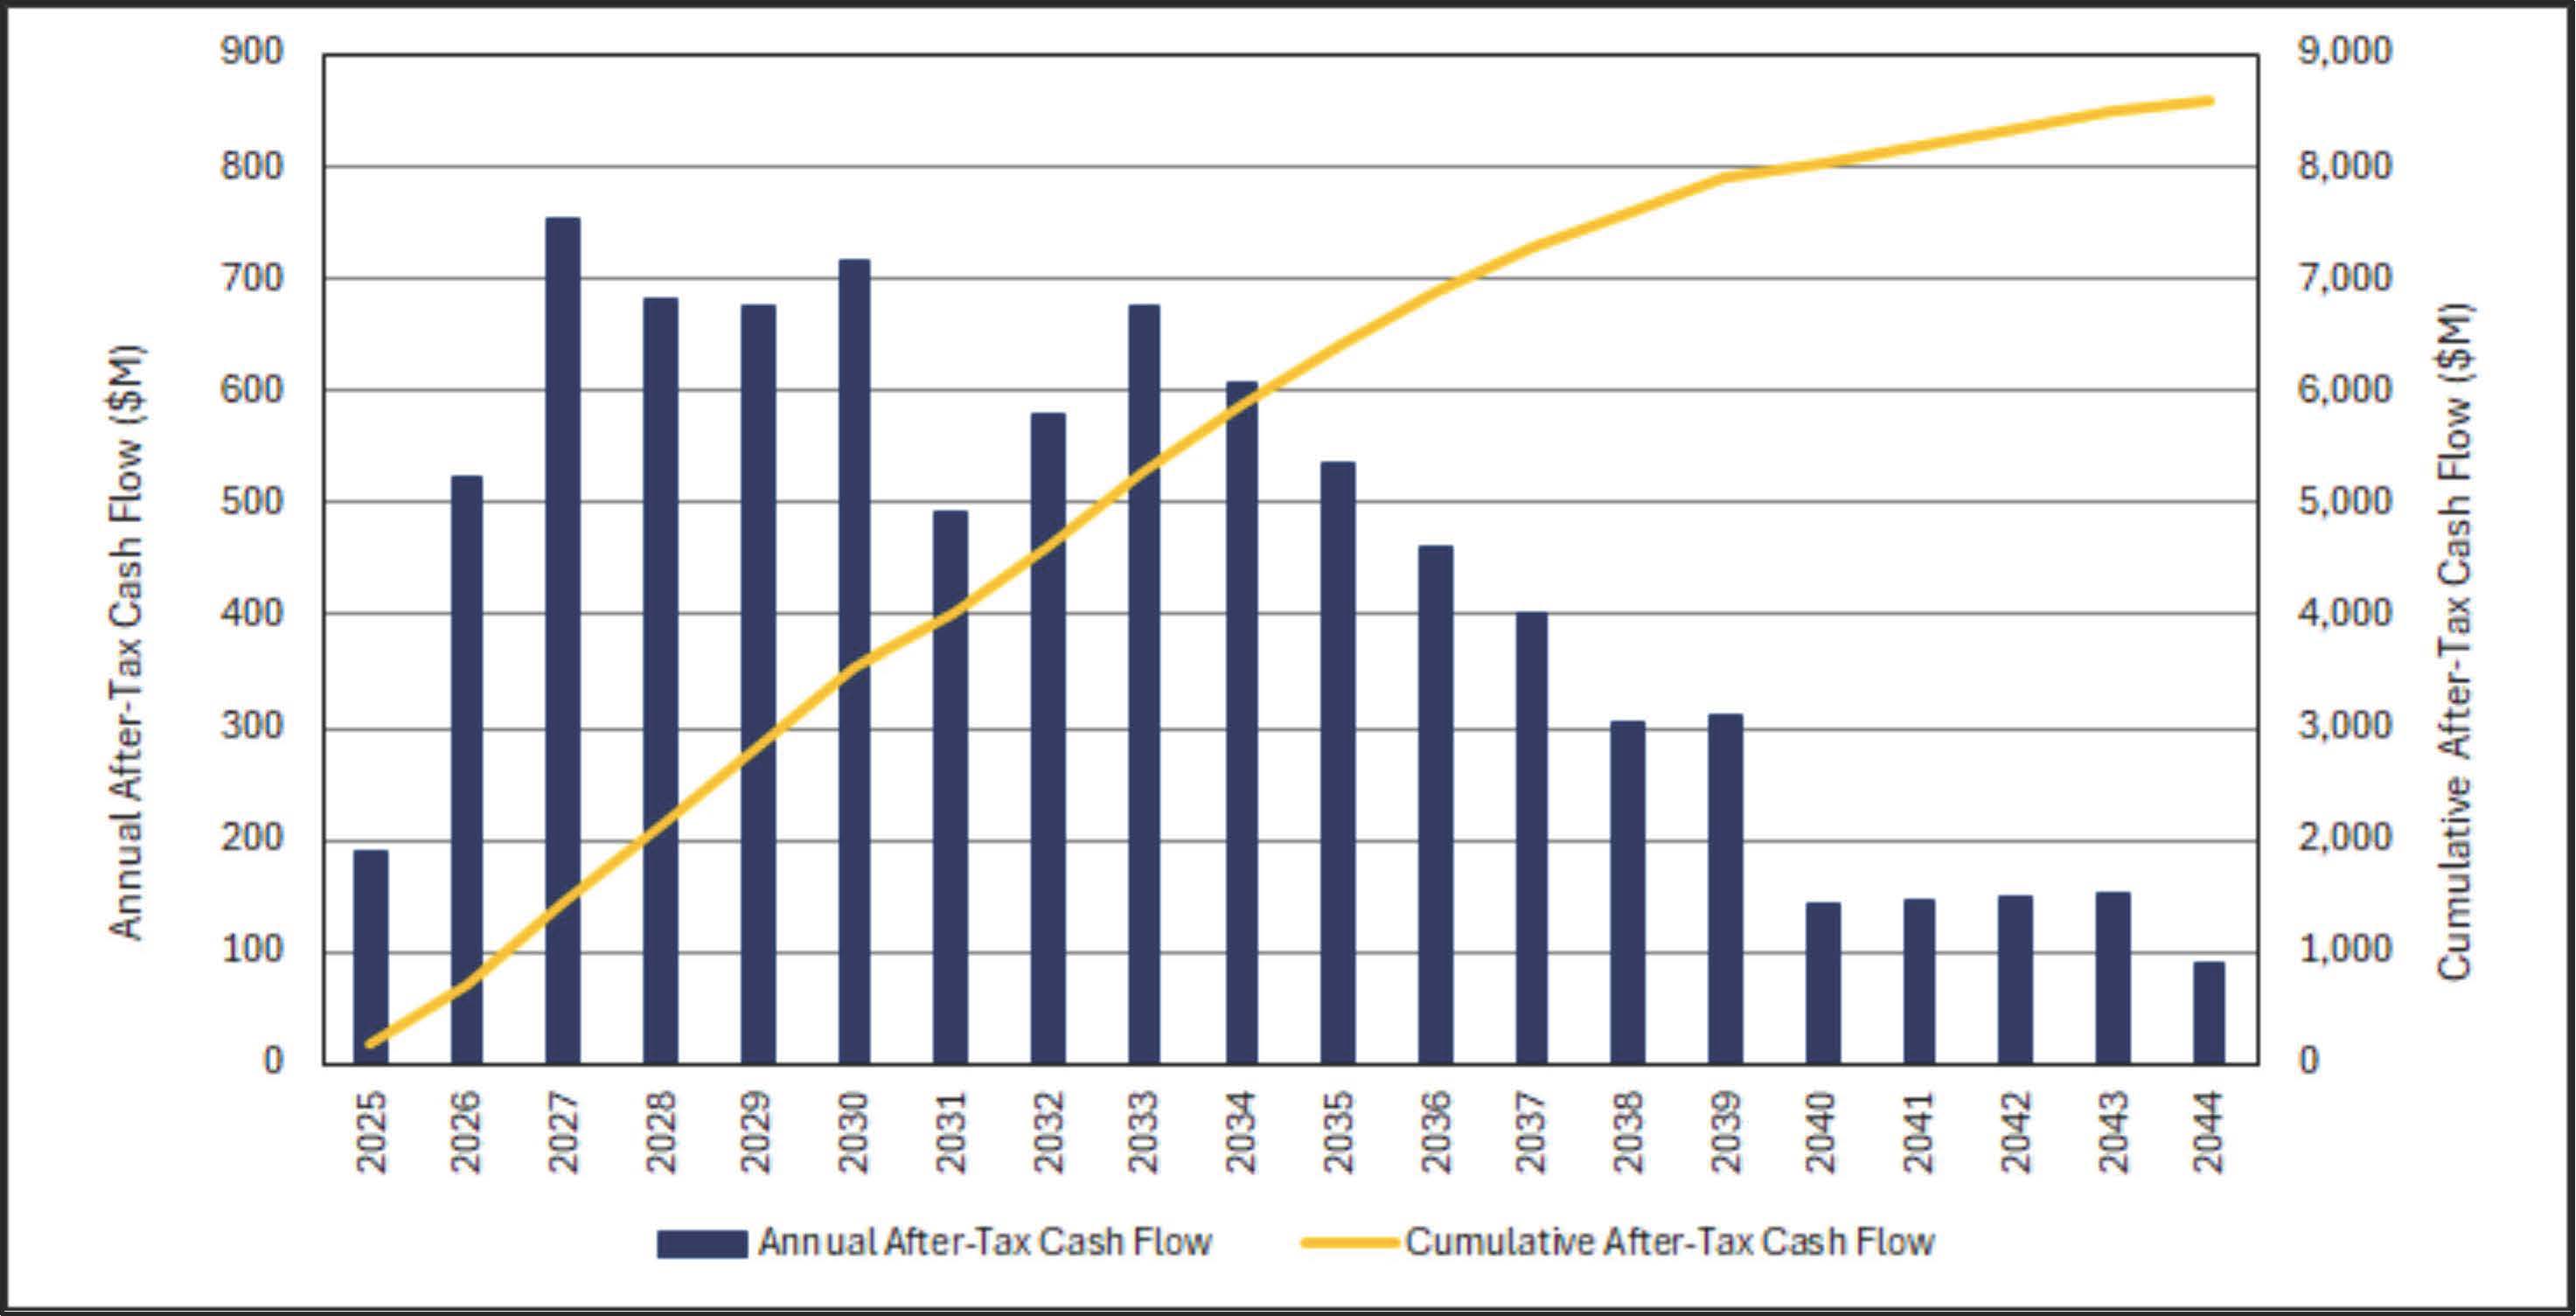
The combined open pit and underground operations have a remaining mine life through 2039. Processing of Magino stockpiles continues afterwards through 2044.
Key physicals associated with the underground life of mine plan are presented in Table 1-5. The open pit life of mine plan is presented in Table 1-6.
| | | | | |
Island Gold District – NI 43-101 Technical Report August 6, 2025 | 27
|
Table 1-5 Life of Mine Underground Production Physicals
| | | | | | | | | | | | | | | | | | | | | | | | | | | | | | | | | | | | | | | | | | | | | | | | | | | | | |
| Units | Total LOM | 2025 | 2026 | 2027 | 2028 | 2029 | 2030 | 2031 | 2032 | 2033 | 2034 | 2035 | 2036 | 2037 | 2038 | 2039 |
| Stope Tonnes | kt | 9,871 | 323 | 509 | 640 | 663 | 716 | 712 | 744 | 772 | 770 | 770 | 770 | 755 | 737 | 619 | 371 |
| Stope Grade | g/t | 11.38 | 13.06 | 11.25 | 11.99 | 13.81 | 13.68 | 13.33 | 10.93 | 12.92 | 13.54 | 11.62 | 10.28 | 8.25 | 8.82 | 7.44 | 9.67 |
| Development Tonnes | kt | 1,882 | 159 | 182 | 236 | 214 | 159 | 164 | 132 | 106 | 106 | 106 | 106 | 105 | 104 | 3 | - |
| Development Grade | g/t | 8.10 | 9.38 | 9.83 | 7.20 | 8.06 | 9.29 | 9.12 | 11.19 | 7.34 | 6.56 | 7.22 | 5.97 | 7.33 | 4.29 | 2.29 | - |
| Total Ore Tonnes | kt | 11,769 | 482 | 699 | 878 | 878 | 876 | 876 | 876 | 878 | 876 | 876 | 876 | 861 | 841 | 625 | 371 |
| Total Ore Grade | g/t | 10.85 | 11.83 | 10.85 | 10.69 | 12.42 | 12.88 | 12.54 | 10.97 | 12.24 | 12.70 | 11.09 | 9.76 | 8.14 | 8.25 | 7.41 | 9.67 |
| | | | | | | | | | | | | | | | | |
| | | | | | | | | | | | | | | | | |
| Waste Tonnes | kt | 7,287 | 520 | 656 | 724 | 728 | 726 | 700 | 704 | 606 | 579 | 597 | 392 | 279 | 71 | 5 | - |
| | | | | | | | | | | | | | | | | |
| Ore Development | m | 29,927 | 2,894 | 2,890 | 3,671 | 3,331 | 2,486 | 2,596 | 2,035 | 1,671 | 1,659 | 1,669 | 1,697 | 1,658 | 1,618 | 53 | - |
| Waste Development | m | 99,382 | 5,987 | 8,477 | 9,651 | 10,356 | 10,145 | 10,003 | 9,886 | 7,517 | 7,949 | 8,637 | 5,615 | 4,023 | 1,070 | 64 | - |
| Exploration Development | m | 5,509 | 888 | 960 | 991 | 186 | 372 | 197 | 267 | 1,215 | 432 | - | - | - | - | - | - |
| Total Lateral Development | m | 134,818 | 9,769 | 12,327 | 14,313 | 13,873 | 13,003 | 12,797 | 12,188 | 10,402 | 10,041 | 10,306 | 7,313 | 5,682 | 2,688 | 117 | - |
| | | | | | | | | | | | | | | | | |
| Raise Development | m | 5,305 | 364 | 1,039 | 367 | 459 | 454 | 278 | 430 | 453 | 374 | 312 | 344 | 263 | - | 168 | - |
| | | | | |
Island Gold District – NI 43-101 Technical Report August 6, 2025 | 28
|
Table 1-6 Life of Mine Open Pit Production Physicals
| | | | | | | | | | | | | | | | | | | | | | | | | | | | | | | | | | | | | | | | | |
| Units | Total | Period |
| 2025 | 2026 | 2027 | 2028 | 2029 | 2030 | 2031 | 2032 | 2033 | 2034 | 2035 |
| Ore Tonnes | kt | 72,511 | 5,309 | 8,555 | 7,676 | 5,659 | 6,288 | 5,364 | 941 | 1,549 | 3,735 | 5,436 | 7,392 |
| Gold Grade | g/t | 0.92 | 0.85 | 0.82 | 0.94 | 1.00 | 0.80 | 1.08 | 0.66 | 0.73 | 1.00 | 0.99 | 1.03 |
| Gold Contained | koz | 2,142 | 146 | 224 | 233 | 183 | 162 | 186 | 20 | 36 | 120 | 173 | 244 |
| Waste Tonnes | kt | 267,977 | 15,456 | 15,037 | 18,727 | 21,266 | 20,637 | 21,561 | 23,275 | 23,275 | 19,600 | 17,899 | 15,943 |
| Total Tonnes Mined | kt | 340,488 | 20,765 | 23,592 | 26,403 | 26,925 | 26,925 | 26,925 | 24,216 | 24,824 | 23,335 | 23,335 | 23,335 |
| Strip Ratio | t:t | 3.70 | 3.91 | 2.76 | 3.44 | 4.76 | 4.28 | 5.02 | 25.74 | 16.02 | 6.25 | 4.29 | 3.16 |
| Re-handle Tonnes | kt | 35,925 | - | 337 | 1,648 | 740 | 730 | 730 | 2,709 | 2,111 | 0 | 0 | 0 |
| Total Tonnes Moved | kt | 376,413 | 20,765 | 23,929 | 28,051 | 27,665 | 27,655 | 27,655 | 26,925 | 26,935 | 23,335 | 23,335 | 23,335 |
| | | | | | | | | | | | | |
| Units | Total | Period |
| 2036 | 2037 | 2038 | 2039 | 2040 | 2041 | 2042 | 2043 | 2044 | 2045 | 2046 |
| Ore Tonnes | kt | | 5,932 | 2,667 | 5,602 | 406 | - | - | - | - | - | - | - |
| Gold Grade | g/t | | 1.02 | 0.87 | 0.76 | 0.74 | - | - | - | - | - | - | - |
| Gold Contained | koz | | 194 | 74 | 136 | 10 | - | - | - | - | - | - | - |
| Waste Tonnes | kt | | 17,403 | 19,685 | 17,733 | 480 | - | - | - | - | - | - | - |
| Total Tonnes Mined | kt | | 23,335 | 22,352 | 23,335 | 886 | - | - | - | - | - | - | - |
| Strip Ratio | t:t | | 3.93 | 8.38 | 4.17 | 2.18 | - | - | - | - | - | - | - |
| Re-handle Tonnes | kt | | 27 | 1,018 | 251 | 3,747 | 4,538 | 4,526 | 4,526 | 4,526 | 3,759 | - | - |
| Total Tonnes Moved | kt | | 23,362 | 23,370 | 23,586 | 4,634 | 4,538 | 4,526 | 4,526 | 4,526 | 3,759 | - | - |
| | | | | |
Island Gold District – NI 43-101 Technical Report August 6, 2025 | 29
|
1.12 Processing
During H1-2025, both the Island Gold and Magino mills are used to process ore corresponding to each operation. In July 2025, the Island Gold mill will be put into a care-and-maintenance mode and eventually closed and dismantled.
Due to the limited use of the Island Gold mill in relation to the LOM presented within this Report, only the Magino mill process is presented.
The existing Magino processing facility will begin blending and processing Island Gold ore and Magino ore together in July of 2025. This will be described as Step 1 “Existing Magino Processing Facility”. In 2025 and 2026 Island Gold ore will be pre-crushed at the existing Island Gold crushing plant and hauled to Magino via a 2.7 km dedicated haul road at an initial rate of 1,200 tpd, increasing to 1,400 tpd by the end of 2025. Magino ore will fluctuate between 9,800 tpd and 10,000 tpd resulting in a combined Step 1 mill throughput of 11,200 tpd through the Magino processing facility. Starting in 2027 Island Gold ore will be crushed underground as opposed to at the existing Island Gold crushing plant and will be transported 6.6 km from the shaft complex to the Magino mill for processing.
The mill feed head grade is based on a 9:1 blend ratio of Magino lower grade ore at a nominal 1.0 g/t gold and Island Gold higher grade ore at a nominal 10 g/t gold, on average. This produces an average feed grade of approximately 1.9 g/t gold. The overall gold recovery from the blend is expected to be approximately 96.0%.
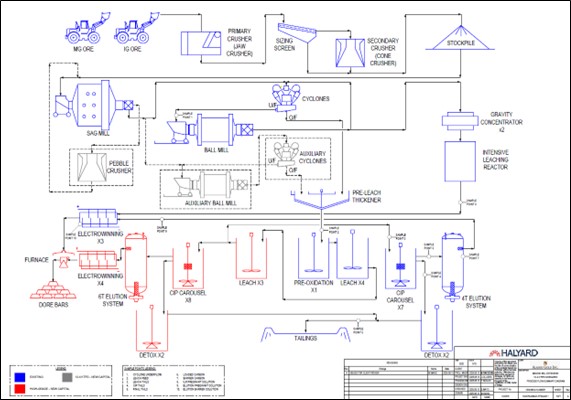
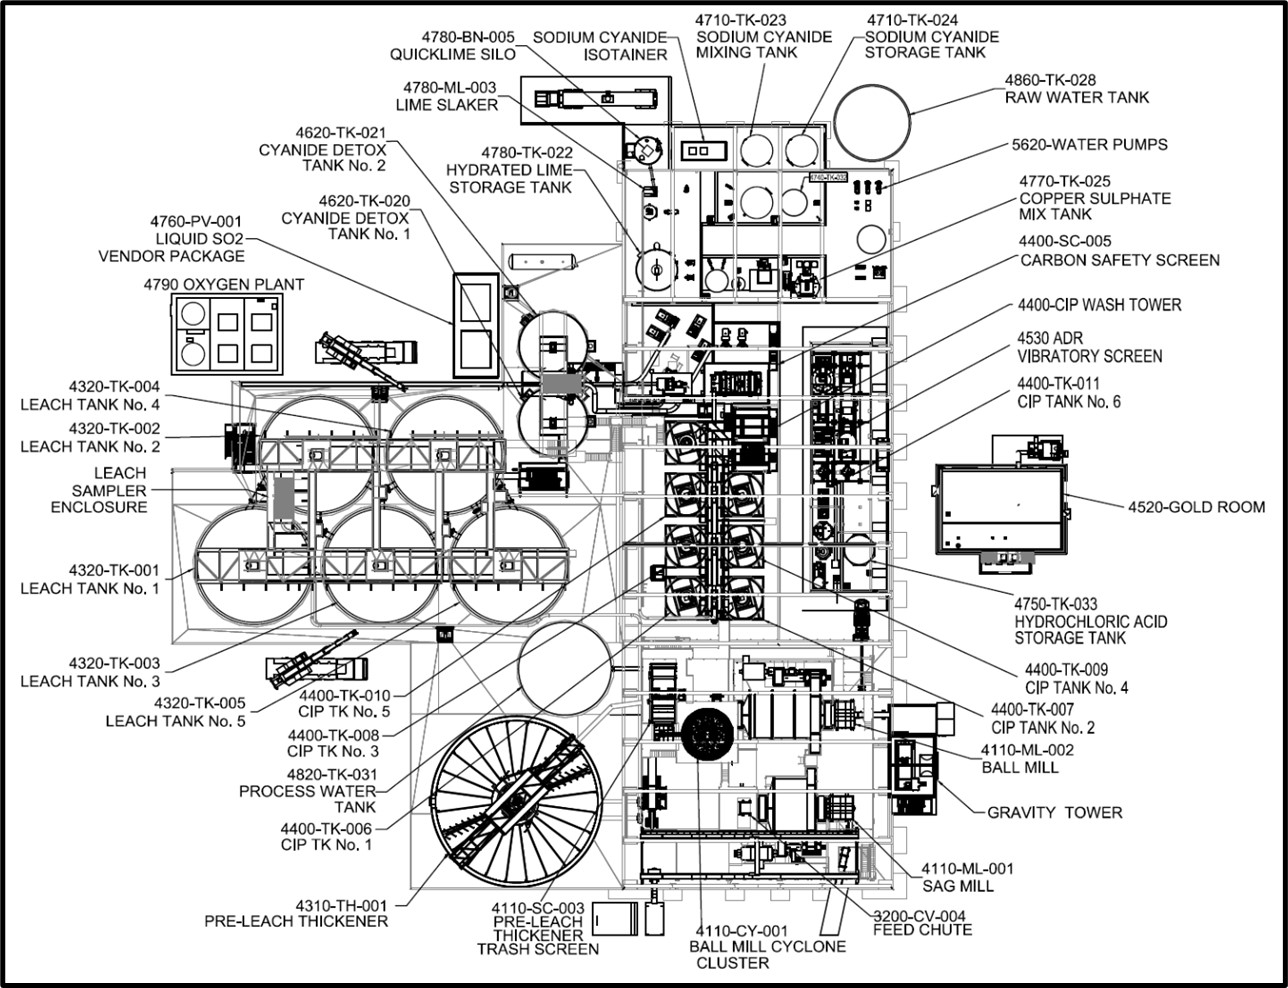
The existing Step 1 Magino process plant utilizes a crushing and grinding configuration consisting of a primary jaw and secondary cone crushing followed by a semi-autogenous (SAG) mill and ball mill grinding configuration. Ball mill discharge is in closed circuit with cyclones for classification and a gravity circuit to remove coarse gold. Cyclone overflow product is thickened and pumped to the existing carbon-in-leach (CIL) circuit where oxygen, lime and cyanide are added for cyanidation. The carbon-in-pulp (CIP) circuit recovers the dissolved gold and silver from the leached slurry. Loaded carbon from the CIP circuit is acid washed, followed by carbon stripping using an Anglo American Research Laboratories (AARL) elution process and electrowinning to recover the gold. Gravity concentrate is processed via an intensive leaching reactor (ILR). Pregnant solution from the AARL has two electrowinning cells and the ILR has its own electrowinning cell. This is followed by smelting of the filtered electrowinning sludge to produce gold doré.
CIP slurry tailings are pumped to the cyanide destruction circuit which uses a sulphur dioxide process to reduce the cyanide weak acid dissociable concentration to acceptable environmental levels prior to pumping of the plant tailings to the tailings management facility.
The Magino process plant Step 2 expansion phase will utilize underground crushing of Island Gold ore along with existing Magino ore being processed through the existing Magino crushing plant. Grinding will include the addition of a pebble crusher and auxiliary mill to re-crush the oversize product. The ball mill will be retrofitted with a new gear reducer to speed up the ball mill to 78% of critical speed. These additions will help improve mill throughput to 12,400 tpd. The Step 2 expansion will also include an expanded gold recovery plant to support additional gold production. The gold recovery plant consists of pre-oxidation, leaching, CIP elution, electrowinning and smelting. This expansion is expected to be completed in Q3-2026 and is linked to the completion of the Island Gold underground shaft and ore handling system, which is scheduled for completion in phases between Q3-2026 and H1-2027.
The Step 2 blending and crushing process at Magino will remain similar to Step 1. This will consist of blending 2,400 tpd Island Gold ore and 10,000 tpd Magino ore through the crushing and grinding system, resulting in a combined throughput of 12,400 tpd. The mill feed head
| | | | | |
Island Gold District – NI 43-101 Technical Report August 6, 2025 | 30
|
grade is based on Magino lower grade ore at a nominal 1.0 g/t gold and Island Gold high grade ore at a nominal 10 g/t gold, producing an average feed grade of approximately 2.7 g/t gold. The overall gold recovery from the blend is expected to be approximately 96.0%.
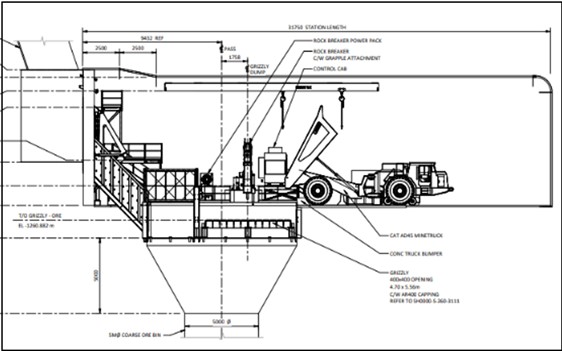
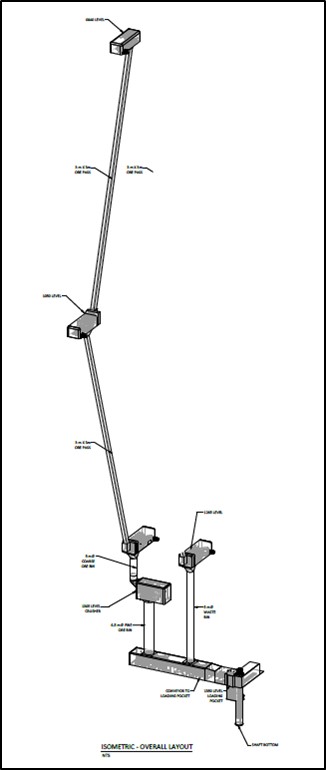
An underground crushing system to be implemented as part of the Phase 3+ Expansion will be introduced at this time and is expected to produce a 125 mm crushed product. The ore will be skipped to surface, loaded into 40 t haul trucks and transported to the Magino crusher utilizing a designated 6.6 km haul road. When completed, this underground crushing system will replace the existing surface crusher at Island Gold.
The existing Step 1 Magino process plant consists of the following unit operations:
•Primary and secondary crushing circuit and associated material handling equipment;
•Crushed ore storage reclaim tent and associated reclaim systems;
•SAG mill and ball mill circuits that produce a primary grind size P80 of 75 µm, gravity concentrators, cyclone classification and associated pumping and material handling systems;
•Pre-leach thickening;
•Cyanidation (5 leach tanks) circuit providing approximately 27 hours residence time;
•CIP carousel (7 tanks) circuit;
•Acid wash, elution, and carbon reactivation (4.0 t AARL plant);
•Gold electrowinning and smelting (gold room);
•SO2 cyanide destruction (2 DETOX tanks); and
•Tailings pumping to the primary tailings management facility.
The Step 2 Magino process plant expansion includes the following additions to the unit operations:
•Installation of a pebble crusher and auxiliary mill to the existing grinding circuit to increase throughput to 12,400 tpd;
•Conversion of one existing leach tank into a pre-oxidation tank;
•Installation of a leach feed transfer pump to split the feed between the existing leach circuit and Step 2 leach circuit;
•Installation of four additional leach tanks, providing approximately 48 hours additional residence time;
•Installation of an additional CIL carousel circuit (eight pump cell tanks);
•Installation of an additional 6.0 t adsorption-desorption-recovery (ADR) plant consisting of acid wash, elution (6.0 t ZADRA), and carbon reactivation;
•Replacement of the existing gold room with a new gold room for the increased doré production;
•Installation of an additional cyanide destruction circuit; and
•Installation of a new tailings pumping system for the increased throughput.
| | | | | |
Island Gold District – NI 43-101 Technical Report August 6, 2025 | 31
|
1.13 Project Infrastructure
Principal site infrastructure at the District has generally been constructed, with only a few outstanding buildings scheduled for completion for 2025 through 2026. Major infrastructure currently installed (or in the process of being installed) includes:
Current Infrastructure
•Dubreuilville infrastructure, including a main administrative building and camp facilities.
•Primary access and mine haul roads.
•A 10,000 tpd gold process plant.
•Underground and surface mining and maintenance facilities including an underground portal, fuel bays, and maintenance facilities.
•Warehousing facilities at both Island Gold (permanent) and Magino (temporary).
•A temporary explosive magazine managed by a specialized contractor at Magino and underground explosive magazines at Island Gold.
•A powerline connection to Island Gold and a compressed natural gas power generation station powering Magino.
•A mine rock management facility for the storage of non-acid generating waste rock excavated principally from Magino but also from development activities at Island Gold. Overburden (organics, soils, etc.) is collected from mining and infrastructure expansion areas and deposited in the southwest management area for temporary storage until required for progressive or final closure remediation purposes.
•A mid- to long-term stockpile storage area which is an integral part of the MRMF, forming the eastern side of the MRMF.
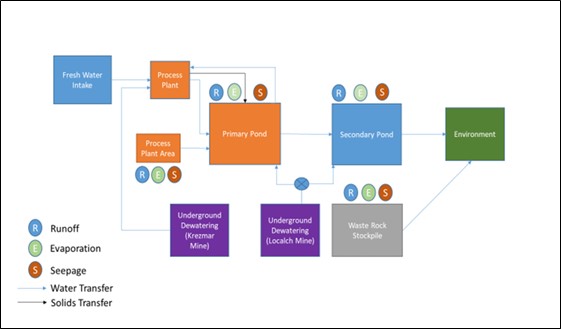
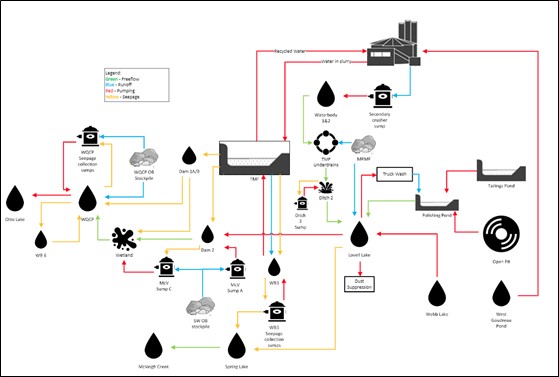
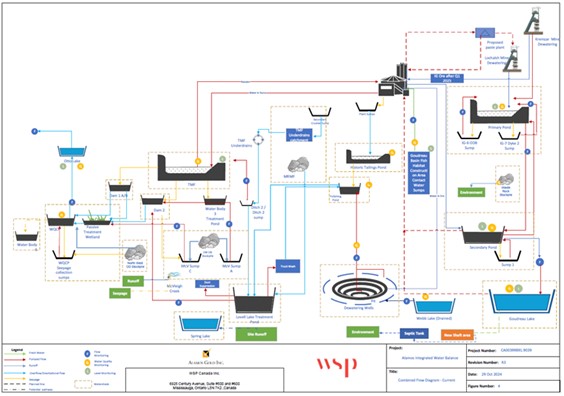
•A water treatment system designed to manage water for both Island Gold and Magino. An integral water balance of the integrated District has been developed.
•A tailings management facility for the storage of process tailings, including sufficient volume for the storage of historical Magino tailings and the sub-aqueous deposition of a limited quantity of potentially acid generating waste from Magino.
•Misc. security, administration, and general offices and buildings located throughout the property.
Under Construction
•An expansion of the current Magino mill to 11,200 tpd in 2025, including an assay laboratory. The mill will be further expanded to 12,400 tpd for 2027.
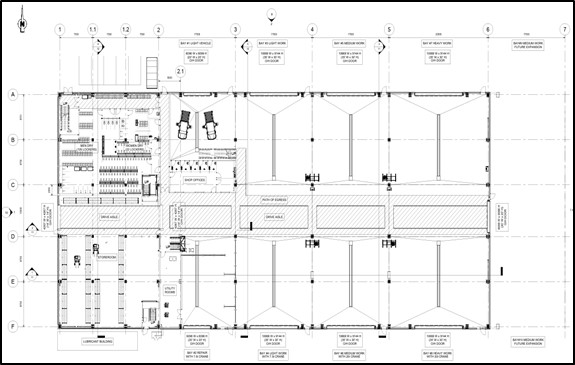
•Mining and maintenance facilities including a shaft complex (including new offices and maintenance facilities) and a paste backfill plant at Island Gold and a truck shop and truck wash at Magino. The truck shop will also contain new mine and maintenance offices and a warehouse facility.
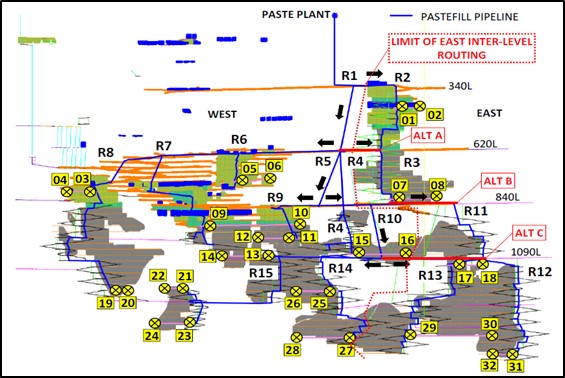
•An underground ore / waste handling and crushing system for completion in 2026, as well as the development of an underground distribution system for paste backfill.
•Identification and construction of a new explosive magazine for the District for implementation in 2026.
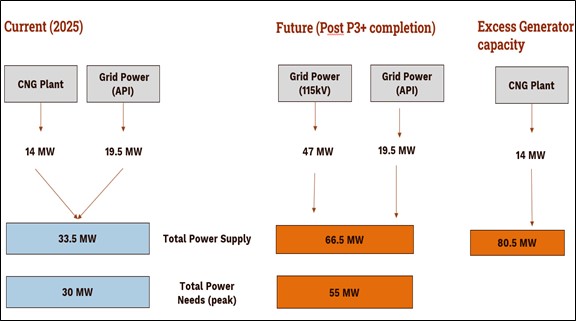
•A 115 kV connection of the provincial power grid to Magino to lower requirements from the compressed natural gas plant is programed for completion in 2026.
| | | | | |
Island Gold District – NI 43-101 Technical Report August 6, 2025 | 32
|
1.14 Environmental Studies, Permitting and Social or Community Impact
From exploration to operations to closure, one of the goals at the District is to safeguard the environment, educate its employees and the communities about the company’s environmental programs and commitments, and apply best management practices to prevent or mitigate any potential environmental impacts.
Numerous baseline studies have been completed across the District in the past 10 years as part of the various Island Gold expansion studies as well as the Magino Mine development which included a Federal Environmental Assessment process that was concluded in January 2019. Monitoring programs at both mine sites have been developed over time in collaboration with the numerous Indigenous Communities with whom Alamos has formal agreements.
The Island Gold Mine is located within the Maskinonge Lake and Goudreau Lake sub-watersheds (total area of 48.2 km2), approximately 40 km south of the Arctic drainage divide. Both sub-watersheds are part of the Michipicoten-Magpie watershed and Lake Superior Drainage Basin. Surface water drainage at the site is bedrock-controlled, generally flowing from northeast to southwest within the valleys between the elongated hills and ridges.
Magino is located within the Magpie – Michipicoten River Basin. The line dividing the river basins bisects the property, with surface flows in the northwestern portion of Magino draining to the Magpie River, and surface flows in the southeastern portion of site draining to the Michipicoten River. Both catchments eventually drain to Lake Superior.
Both mines are required to have an on-going water balance model which tracks all inputs and outputs out of the system. Since the integration of the Island Gold and Magino mines, an integrated water balance is being developed. This is still a work in progress and will allow for optimization of water management between the combined mine sites.
At Island Gold a groundwater monitoring program has been in place since 2013 with regular monitoring of groundwater levels and quality. Additional wells were installed from 2022 to 2024. Samples from the groundwater wells have been tested for various parameters including metals, cyanide, hydrocarbons, and anions, with no exceedances of the Ontario drinking water quality guidelines.
At the Magino, overall groundwater quality sampling results indicate that the groundwater in the project area is of good quality.
The District is largely composed of trembling aspen, white birch, balsam poplar, black spruce, white spruce, balsam fir, and jack pine. Wildlife populations in the area are regionally typical with the noted presence of moose, wolves, foxes, black bears, beavers, otters, muskrats, mink, snowshoe hares and red squirrels.
Several species at risk have been identified within the District and are discussed in detail in Section 20.1.7.
District strategy is to reduce consumption, reuse any waste generated, and dispose final waste in a safe and responsible manner. A waste management procedure has been developed and implemented for the District; it provides guidance to District and non-District personnel on the handling, processing, and disposal of waste, including hazardous waste and domestic materials generated during the normal operations of the facility.
Relevant regulatory agencies for the anticipated District permitting needs include the provincial Ministry of the Environment, Conservation and Parks, Ministry of Natural Resources, Ministry of Ministry of Energy and Mines. There may also be permitting requirements from the Federal
| | | | | |
Island Gold District – NI 43-101 Technical Report August 6, 2025 | 33
|
Department of Fisheries and Oceans and the Impact Assessment Agency of Canada if Alamos triggers any substantial changes to the current federal environmental assessment.
All permitting activities will cover modifications and/or additions to the site including but not limited to:
•Increased production rates;
•Updated water management and effluent discharge strategies;
•New air and noise discharges;
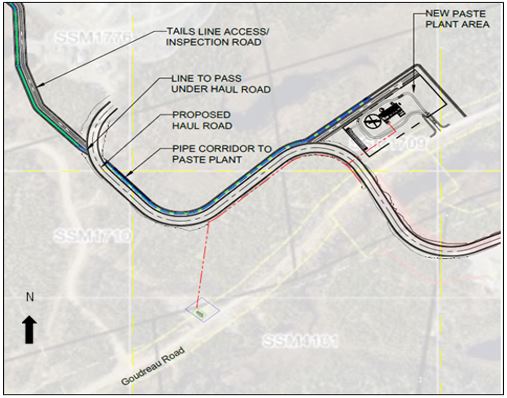
•Infrastructure additions/modifications related to the paste fill plant and new shaft area;
•New access roads;
•Aggregate sources; and
•Potential impacts to terrestrial habitats and natural water bodies including related fisheries resources.
The District’s environmental programs are designed with the goal of preventing all environmental incidents. However, in the event of unplanned incidents, the mine maintains a high degree of emergency preparedness with appropriate plans, resources, and training to minimize the impact on workers, operations, the environment, and the community should an unplanned incident occur. A spill prevention and control plan is mandated under the regulatory requirements of Ontario Reg. 224/07 Spill Prevention and Contingency Plan, the primary purpose of which is to prevent and reduce the risk of spills of pollutants, and to prevent, eliminate or ameliorate any adverse effects that result from spills of pollutants, is updated annually.
Alamos philosophy is to maximize local hiring of employees from the labour pool in the surrounding communities. This has increased the economic stability of the local communities of Dubreuilville, Wawa and White River who have been hit hard by the downturn of the forestry industry.
As of end of December 2024 there were 910 employees and approximately 248 contractors employed by the District. This increase in contractors has largely been due to supporting contractors for the Phase 3+ Expansion construction. District employees have significantly augmented the local economy by living locally or supporting the local businesses when residing at the mine workforce accommodation facilities in Dubreuilville for approximately six months out of the year.
The District supports the local businesses and various non-profit organizations through its substantial local donations, purchase of goods, services, and materials, use of area motels and many home and apartment rentals for workforce accommodations. Support is also reflected through company programs such as the health and wellness program which provides yearly funds to encourage employees to join a fitness centre along with rental of local facilities such as the arena and school gym for employee activities or events. The recreational committee’s various activities with the local communities (curling & golfing tournaments) aid in developing relations with the town and supporting their economic developments which is of important need to reconnect post the COVID-19 pandemic.
Indigenous engagement initiatives for the District were initiated in December 2003 by Patricia Mining Corp. and continued with Richmont Mines Inc. Alamos has increased Indigenous engagement efforts since acquiring Island Gold in 2017 and Magino in 2024. The corporation’s site and executive management team is actively engaged with all Indigenous engagement initiatives.
| | | | | |
Island Gold District – NI 43-101 Technical Report August 6, 2025 | 34
|
To date the following Indigenous groups have been identified as having varying degrees of interest around the District: Batchewana First Nation, Garden River First Nation, Metis Nation of Ontario, Michipicoten First Nation, Missanabie Cree First Nation, and Red Sky Metis Independent Nation. Agreements are in place with all these groups.
Implementation of all the Indigenous agreements continues as part of the overall District, with regular meetings and consultations providing the communities regular updates on activities at the District. There have also been engagement activities to outline any proposed significant changes to the District due to the integration of Island Gold and Magino. Discussions have centered on the opportunities for employment, contracting, training, environmental effects of the project, and community development.
Consultation is an integral part of our business. Environment committees with each Indigenous Community have been a part of our process which allows for meaningful relationship building, ongoing dialogue to deal with any community concerns and a formal process to track and integrate feedback into our environmental permitting and systems.
Island Gold and Magino have separate closure plans, whose boundaries are adjacent to one another. Island Gold has a filed Closure Plan Amendment from December 2023, with Magino’s most recent Closure Plan Amendment filed in September 2024.
As required by Ontario's Mining Act and Ontario Regulation 35/24, financial assurance must be provided for closure and rehabilitation of the District along with the certified closure plan.
The financial assurance amount will cover the cost of closure and rehabilitation and be provided as part of the filing of a certified closure plan to be acknowledged by the Ministry of Mines to satisfy the requirements under the Mining Act.
1.15 Capital and Operating Costs
LOM capital costs are estimated to total $3,040M as summarized in Table 1-7. This includes $2,420M in sustaining capital and $620M in growth capital. This includes $62M identified for progressive and final closure.
Table 1-7 Capital Cost Summary
| | | | | | | | |
| Description | Units | Total |
| Underground | $ million | 1,340.3 |
| Open Pit | $ million | 754.2 |
| Process + TMF | $ million | 263.6 |
| Phase 3+ Expansion | $ million | 476.8 |
| Other | $ million | 80.2 |
| Capital Leases | $ million | 63.0 |
| Reclamation / Closure | $ million | 61.9 |
| Total | $ million | 3,039.9 |
| Growth Capital | $ million | 619.9 |
| Sustaining Capital | $ million | 2,419.9 |
| Total | $ million | 3,039.9 |
•Totals may not match due to rounding.
| | | | | |
Island Gold District – NI 43-101 Technical Report August 6, 2025 | 35
|
The estimated District operating costs total $5,360M over the LOM and averages $60.46/t of ore milled. A summary of the estimated District LOM operating costs is shown in Table 1-8. Estimated District unit operating costs are shown in Table 1-9.
Table 1-8 LOM Total Operating Cost Summary
| | | | | | | | |
| Description | Units | Total |
| Underground | $ million | 1,454.6 |
| Open Pit | $ million | 1,204.4 |
| Process | $ million | 1,483.9 |
| G&A | $ million | 1,216.7 |
| Total | $ million | 5,359.7 |
•Operating costs are exclusive of underground capitalized development and open pit capitalized stripping.
•Totals may not match due to rounding.
| | | | | |
Island Gold District – NI 43-101 Technical Report August 6, 2025 | 36
|
Table 1-9 Unit Operating Cost Summary
| | | | | | | | | | | | | | | | | | | | | | | | | | | | | | | | | | | | | | | | | |
| Description | Units | Total | Period |
| 2025 | 2026 | 2027 | 2028 | 2029 | 2030 | 2031 | 2032 | 2033 | 2034 | 2035 |
| Underground | $/t ore | 123.59 | 166.17 | 132.66 | 115.85 | 116.72 | 115.86 | 117.29 | 119.45 | 121.83 | 121.95 | 121.79 | 123.90 |
| Open Pit | $/t mined | 4.24 | 5.84 | 3.98 | 3.72 | 3.91 | 3.86 | 3.91 | 4.13 | 3.93 | 4.16 | 4.31 | 4.40 |
| Mine | $/t milled | 30.00 | 45.15 | 33.42 | 26.42 | 26.58 | 26.45 | 26.78 | 27.30 | 27.71 | 27.86 | 27.86 | 28.35 |
| Process | $/t milled | 16.74 | 24.66 | 20.70 | 16.96 | 16.96 | 16.96 | 16.96 | 16.96 | 16.96 | 16.96 | 16.96 | 16.96 |
| G&A | $/t milled | 13.73 | 20.25 | 14.47 | 13.84 | 13.79 | 13.61 | 13.89 | 13.20 | 13.70 | 14.15 | 14.11 | 15.41 |
| Total | $/t milled | 60.46 | 90.07 | 68.59 | 57.22 | 57.33 | 57.02 | 57.62 | 57.46 | 58.37 | 58.97 | 58.93 | 60.71 |
| | | | | | | | | | | | | |
| Description | Units | Total | Period |
| 2036 | 2037 | 2038 | 2039 | 2040 | 2041 | 2042 | 2043 | 2044 | 2045 | 2046 |
| Underground | $/t ore | | 127.71 | 133.90 | 136.85 | 85.04 | - | - | - | - | - | - | - |
| Open Pit | $/t mined | | 4.38 | 3.93 | 4.02 | 38.99 | - | - | - | - | - | - | - |
| Mine | $/t milled | | 29.11 | 30.45 | 31.12 | 27.40 | - | - | - | - | - | - | - |
| Process | $/t milled | | 16.91 | 16.86 | 16.25 | 15.55 | 14.50 | 14.50 | 14.50 | 14.50 | 14.50 | - | - |
| G&A | $/ t milled | | 16.07 | 17.64 | 17.66 | 14.14 | 11.96 | 10.95 | 9.31 | 7.61 | 9.09 | - | - |
| Total | $/t milled | | 62.08 | 64.95 | 65.04 | 57.09 | 26.46 | 25.45 | 23.81 | 22.11 | 23.59 | - | - |
•Operating costs are exclusive of underground capitalized development and open pit capitalized stripping.
•Open pit mining transitions during 2039 to full stockpile re-handle thereafter as the open pit is depleted and stockpiles are all that remain.
•Totals may not match due to rounding.
| | | | | |
Island Gold District – NI 43-101 Technical Report August 6, 2025 | 37
|
1.16 Economic Analysis
An engineering economic model was developed to estimate annual cash flows and sensitivities for the District. After-tax estimates were developed to approximate the true investment value.
The estimates of capital and operating costs have been developed specifically for the District and are summarized in Section 21 of this report. They are presented in Q1-2025 C$ unless otherwise stated. The economic analysis has been run with no additional inflation (constant dollar basis).
Table 1-10 outlines the planned life of mine tonnage and grade estimates.
Table 1-10 Life of Mine Plan Summary
| | | | | | | | |
| Parameters | Unit | Value |
| Mine Life | Years | 15 |
| Process Life | Years | 20 |
| Total Mill Feed | kt | 88,642 |
| Processing Rate (2027+) | tpd | 12,400 |
| Average Gold Head Grade | g/t | 2.23 |
| Average Gold Recovery | % | 96.3 |
| Total Gold Production over Life of Mine | koz | 6,112 |
| Au Production (Years 2026 to 2037) | Average koz/a | 411 |
| Au Production (Life of Mine) | Average koz/a | 306 |
The economic analysis was performed using the following assumptions and basis:
•The financial analysis was performed on Proven and Probable Mineral Reserves as outlined in this Report for the open pit and underground mines.
•The LOM presented in the financial analysis covers 2025 through 2044.
•The Island Gold Phase 3+ Expansion shaft project will be completed in 2026, after which the Magino mill throughput will ramp up to 12,400 tpd in 2027.
•Gold and silver metal prices vary through time in the analysis as follows:
•2025 – 2027 US$ 3,000/oz gold, US$ 33.00/oz silver
•2028+ US$ 2,400/oz gold, US$ 28.00/oz silver
•The foreign exchange rate varies through time in the analysis as follows:
•2025 $0.725 US$/C$
•2026 – 2027 $0.740 US$/C$
•2028+ S0.750 US$/C$
•The NPV was calculated from the after-tax cash flow generated by the project based on a discount rate of 5%.
•Closure costs are included for Island Gold and Magino totalling $62M.
| | | | | |
Island Gold District – NI 43-101 Technical Report August 6, 2025 | 38
|
•No salvage value has been assumed at the end of project life.
•All related payments and disbursements incurred prior to 2025 are considered sunk costs and are excluded from the financial analysis. However, 70% of Alamos’ Canadian tax pools at December 31st, 2024, are utilized in the tax calculations.
The after-tax net present value at 5% (NPV5%) is $5,991M (US $4,477M).
Figure 1-1 shows the projected cash flows used in the economic analysis and based on the assumptions in Section 22.1. Table 1-11 shows the summary results of this evaluation.
Figure 1-1 Annual and Cumulative After-Tax Cash Flow
Source: Alamos (2025)
| | | | | |
Island Gold District – NI 43-101 Technical Report August 6, 2025 | 39
|
Table 1-11 Summary of Economic Results
| | | | | | | | |
| Category | Unit | Value |
| Revenues | $M | 19,922 |
Operating Costs1 | $M | 5,568 |
After-Tax Cash Flow from Operations2 | $M | 11,619 |
| Total Capital, Leases & Closure Costs | $M | 3,040 |
Total Cash Cost (2026-2037)3 | US$/oz | 581 |
Mine Site All-In Sustaining Cost (2026-2037)3 | US$/oz | 915 |
| Total Cash Cost (Life of Mine) | US$/oz | 699 |
| Mine Site All-In Sustaining Cost (Life of Mine) | US$/oz | 1,003 |
| Net After-Tax Cash Flow | $M | 8,579 |
| After-Tax NPV5% | $M | 5,991 |
| After-Tax NPV5% | US$M | 4,477 |
Notes:
1.Operating costs include mining, processing, G&A, royalties, transport & refining costs, and silver credit.
2.Cash flow from operations includes payable taxes.
3.Post-shaft completion in 2026.
1.17 Sensitivities
A sensitivity analysis was performed to test value drivers on the District’s NPV using a 5% discount rate. The results of this analysis are demonstrated in Table 1-12 and Table 1-13, and illustrated in Figure 1-2.
Table 1-12 After-Tax NPV5% Sensitivity Results (C$)
| | | | | | | | | | | | | | | | | |
| ($M of C$) | -10% | -5% | 100% | 5% | 10% |
| Gold Price | $4,464 | $5,214 | $5,991 | $6,799 | $7,634 |
| Canadian Dollar | $7,067 | $6,502 | $5,991 | $5,529 | $5,106 |
| Capital Costs | $6,092 | $6,042 | $5,991 | $5,941 | $5,890 |
| Operating Costs | $6,308 | $6,150 | $5,991 | $5,833 | $5,674 |
Table 1-13 After-Tax NPV5% Sensitivity Results (US$)
| | | | | | | | | | | | | | | | | |
| ($M of US$) | -10% | -5% | 100% | 5% | 10% |
| Gold Price | $3,337 | $3,897 | $4,477 | $5,080 | $5,704 |
| Canadian Dollar | $4,752 | $4,616 | $4,477 | $4,339 | $4,198 |
| Capital Costs | $4,552 | $4,514 | $4,477 | $4,440 | $4,403 |
| Operating Costs | $4,722 | $4,600 | $4,477 | $4,355 | $4,232 |
| | | | | |
Island Gold District – NI 43-101 Technical Report August 6, 2025 | 40
|
Figure 1-2 After-Tax NPV5% Sensitivity Results
Source: Alamos (2025)
The District proved to be most sensitive to changes in metal price followed by foreign exchange, capital costs and operating costs. A sensitivity analysis of the after-tax results was performed using various gold prices as provided in Table 1-14.
| | | | | |
Island Gold District – NI 43-101 Technical Report August 6, 2025 | 41
|
Table 1-14 Gold Price Sensitivity on NPV
| | | | | | | | |
| Gold Price in US$ | After-Tax NPV (C$M) | After-Tax NPV (US$M) |
| $2,000 | $3,926 | $2,942 |
$2,4001 | $5,991 | $4,477 |
| $2,750 | $6,814 | $5,098 |
| $3,000 | $7,770 | $5,811 |
| $3,300 | $8,915 | $6,667 |
| $3,500 | $9,678 | $7,236 |
1 Gold price of $3,000/oz in 2025 through to 2027, and a long-term (2028+) gold price of $2,400/oz
1.18 Recommendations
The Island Gold and Magino mines within the District are properties in active operation. Unless indicated with a corresponding monetary value, recommendations are currently budgeted within Alamos’ current LOM plan or are assumed to be able to be undertaken as an everyday task within the corresponding department at site without additional cost.
•Conduct additional drilling within the areas of the Mineral Resources with the objective of converting Inferred Mineral Resources to Measured and Indicated Mineral Resources.
•Continue mine and near-mine exploration activities with the objective of adding to the Mineral Resource inventory.
•Continue to advance a pipeline of regional targets within the district with the objective of defining additional Mineral Resources in proximity to the Magino mill.
•Review and validate with historical data collected over the past several years of production the estimation parameters used in relation to Mineral Resource classification for Magino.
•Execute a geotechnical investigation program on the south wall of the Magino pit to ensure compliance of the design with the underlying objectives of slope design.
•Island Gold has significant positive reconciliation, meanwhile Magino is incurring above planned ore dilution. It is recommended to continually track and analyze reconciliation and operational results and apply learnings to subsequent Mineral Resource estimations.
•A selective mining unit size study is recommended to be conducted at Magino to compare against reconciliation results through 2025 to determine if a change in block dimensions in the Mineral Resource model is warranted.
•Undertake metallurgical test work of Magino samples in the vicinity of the Mineral Reserve COG of 0.30 g/t gold to confirm recovery of gold at low grades.
•Complete the District airstrip study.
•An opportunity has been identified to potentially increase Magino mill throughput. It is recommended that this study be completed in 2025 such that District value can be maximized should the opportunity be confirmed to be attractive. Early determination of an economically feasible expansion would allow the pebble crusher and auxiliary mill to be removed from the Step 2 capital identified in this Report.
| | | | | |
Island Gold District – NI 43-101 Technical Report August 6, 2025 | 42
|
2 INTRODUCTION
2.1 General and Terms of Reference
This Technical Report (Report) on the Island Gold District (District) located in north-eastern Ontario (ON) in Canada has been prepared by Alamos Gold Inc. (Alamos) headquartered in Toronto, ON, Canada. It has been prepared to a standard which is in accordance with the requirements of National Instrument 43-101, Standards of Disclosure for Mineral Projects (NI 43-101), of the Canadian Securities Administrators (CSA) for lodgment on CSA’s “System for Electronic Document Analysis and Retrieval” (SEDAR+).
The District is situated approximately 43 kilometres (km) northeast of Wawa, ON and approximately 10 km southeast of the town of Dubreuilville. The District is comprised of two adjacent operational properties, the underground Island Gold Mine (Island Gold) and the open pit Magino Mine (Magino). This Report is developed to describe the new District resulting from the integration of the two operations after the friendly acquisition of Argonaut Gold Inc. (Argonaut) by Alamos, announced March 27th, 2024, and which closed on July 12th, 2024.
This Report will provide an update on several aspects of the District, including:
•Status of the integration of the Island Gold and Magino operations;
•The planned Magino mill expansion to 11,200 tpd and further on to 12,400 tpd;
•An updated Mineral Resource estimate;
•Updated mine plans and resultant Mineral Reserve estimate;
•Status of Island Gold Phase 3+ Expansion development work consisting of shaft complex, shaft, paste plant, and underground expansion from 1,200 tpd to 2,400 tpd, completed to date;
•Updated estimates of capital and operating expenditures; and
•Updated financial model for the integrated District, based on Proven and Probable Mineral Reserves.
2.2 The Issuer
Alamos is a Canadian-based intermediate gold producer with diversified production from three operations in North America. This includes the Island Gold District and Young-Davidson mine in northern Ontario, Canada, and the Mulatos District in Sonora State, Mexico. Additionally, the Company has a strong portfolio of growth projects, including the Phase 3+ Expansion at Island Gold, and the Lynn Lake project in Manitoba, Canada. Alamos employs more than 2,400 people and is committed to the highest standards of sustainable development. The Company’s shares are traded on the TSX and NYSE under the symbol “AGI”.
2.3 Sources of Information
As the District is currently integrating and operating both Island Gold and Magino in unison, the District has many personnel at site, where much of the current information has been procured, developed and / or maintained by Alamos personnel. In addition to generating much of the content for this report, they have also reviewed the available data for reasonableness and consistency.
| | | | | |
Island Gold District – NI 43-101 Technical Report August 6, 2025 | 43
|
Significant sources of information included:
•“NI 43-101 Technical Report for the Island Gold Mine, Dubreuilville, Ontario, Canada” issued August 29th, 2022.
•“Magino Gold Project Ontario, Canada. NI 43-101 Technical Report Mineral Resource and Mineral Reserve Update” issued March 3rd, 2022.
•“Feasibility Study Technical Report on the Magino Project, Ontario, Canada”, issued December 21st, 2017.
•Supporting data, reports and documentation that inform the previously stated reports, as well as current ongoing work, from qualified independent consulting companies, including, but not limited to: Halyard Inc., Hatch Ltd., Redpath Mining Inc., WSP Global Inc., SLR Consulting Ltd., and Paterson and Cooke.
•Specific sources of information reviewed and utilized in this Report are provided in Section 27 of this report.
2.4 Qualified Persons and Site Inspections
Table 2-1 sets out the Qualified Persons (QPs) responsible for each section of this Report.
Table 2-1 Qualified Persons Report Compilation Responsibility Matrix
| | | | | | | | | | | |
| Section | Description | Qualified Person | Company |
| 1 | Summary | All in part | Alamos |
| 2 | Introduction | Christopher Bostwick | Alamos |
| 3 | Reliance on Other Experts | Christopher Bostwick | Alamos |
| 4 | Property Description and Location | Christopher Bostwick | Alamos |
| 5 | Accessibility, Climate, Local Resources, Infrastructure and Physiography | Christopher Bostwick | Alamos |
| 6 | History | Tyler Poulin | Alamos |
| 7 | Geological Setting and Mineralization | Tyler Poulin | Alamos |
| 8 | Deposit Types | Tyler Poulin | Alamos |
| 9 | Exploration | Tyler Poulin | Alamos |
| 10 | Drilling | Tyler Poulin | Alamos |
| 11 | Sample Preparation, Analyses and Security | Tyler Poulin | Alamos |
| 12 | Data Verification | Tyler Poulin | Alamos |
| 13 | Mineral Processing and Metallurgical Testing | Christopher Bostwick | Alamos |
| 14 | Mineral Resource Estimates | Tyler Poulin – Island Gold Jeffrey Volk - Magino | Alamos |
| 15 | Mineral Reserve Estimates | Nathan Bourgeault – Island Gold Christopher Bostwick - Magino | Alamos |
| 16 | Mining Methods | Nathan Bourgeault – Island Gold Christopher Bostwick - Magino | Alamos |
| 17 | Recovery Methods | Christopher Bostwick | Alamos |
| 18 | Project Infrastructure | Nathan Bourgeault | Alamos |
| 19 | Market Studies and Contracts | Christopher Bostwick | Alamos |
| 20 | Environmental Studies, Permitting and Social or Community Impact | Dave Bucar | Alamos |
| | | | | |
Island Gold District – NI 43-101 Technical Report August 6, 2025 | 44
|
| | | | | | | | | | | |
| Section | Description | Qualified Person | Company |
| 21 | Capital and Operating Costs | Nathan Bourgeault | Alamos |
| 22 | Economic Analysis | Christopher Bostwick | Alamos |
| 23 | Adjacent Properties | Tyler Poulin | Alamos |
| 24 | Other Relevant Data and Information | Christopher Bostwick | Alamos |
| 25 | Interpretations and Conclusions | All in part | Alamos |
| 26 | Recommendations | All in part | Alamos |
| 27 | References | All in part | Alamos |
The following QPs visited the District as indicated below:
•Christopher Bostwick, FAusIMM, Alamos Senior Vice President, Technical Services has visited the District on numerous occasions during the previous year with his last site visit occurring June 19th, 2025;
•Nathan Bourgeault, P.Eng., Alamos Technical Services Manager, Island Gold District is employed at the site;
•Tyler Poulin, P.Geo., Alamos Geology Superintendent, Island Gold District is employed at the site;
•Jeffrey Volk, CPG, FAusIMM, Alamos Director, Reserves and Resources has visited the District on numerous occasions during the previous year with his last site visit occurring May 12th to 14th, 2025;
•Dave Bucar, P.Eng., Alamos Director, Environmental Sustainability has visited the District on numerous occasions during the previous year with his last site visit occurring June 11th, 2025.
2.5 Units of Measurement
Units of measurement used throughout this report are metric, unless otherwise stated.
Currency used throughout this report is Canadian dollars (C$), unless otherwise stated. Where applicable, conversion factors used are as shown in Table 2-2.
Table 2-2 Exchange Rates
| | | | | | | | |
Yeear | Currency Name | Exchange Rate |
2025 2026 2027 2028+ | Canadian Dollar | C$ 1.00 = US$ 0.725 C$ 1.00 = US$ 0.740 C$ 1.00 = US$ 0.740 C$ 1.00 = US$ 0.750 |
2.6 Effective Date
This report has an effective date of June 23rd, 2025.
| | | | | |
Island Gold District – NI 43-101 Technical Report August 6, 2025 | 45
|
3 RELIANCE ON OTHER EXPERTS
Reliance on other experts has not been required in the development of the Report.
| | | | | |
Island Gold District – NI 43-101 Technical Report August 6, 2025 | 46
|
4 PROPERTY DESCRIPTION AND LOCATION
4.1 Location
The District, collectively comprised of the Island Gold Property and Magino Property is situated approximately 43 km northeast of Wawa, ON within the Ontario Ministry of Energy and Mines (“MEM”) Sault Ste. Marie Mining Division. The town of Dubreuilville, originally a forestry center, is located approximately 10 km to the northwest of the District. Access to the area is provided by the Trans-Canada Highway 17 which continues north from Wawa for 35 km, then following Highway 519 for 31 km to Dubreuilville. The Goudreau Road, an all-weather, year-round road, extends southeast from Dubreuilville for 12 km to the District.
The District is approximately centred at Universal Transverse Mercator (UTM) 690,400E 5,352,700N, North American Datum 83 (NAD 83) Zone 16N or Latitude W84° 25’ 56” Longitude N48° 17’ 57”. The location of the District is shown in Figure 4-1.
Figure 4-1 Island Gold District - Island Gold Mine & Magino Mine Property Locations
Source: Alamos (2025)
4.2 Description of Mining Titles and Recorded Interests
The District consists of patented fee simple and / or patented Crown leasehold mining rights and surface rights claims (collectively, the Patented Claims), mining licenses of occupation (MLOs), and unpatented cell claims, covering approximately 58,921 hectares (ha). Alamos itself or through its wholly owned subsidiary, 1001061522 Ontario Inc., control, own or hold
| | | | | |
Island Gold District – NI 43-101 Technical Report August 6, 2025 | 47
|
100% of the mineral rights to all the Mineral Resource and Mineral Reserve related claims at the District property. Together, Alamos and 1001061522 Ontario Inc. are the “Company”.
4.2.1 Island Gold Property
The Island Gold Property (Figure 4-2), is divided into fourteen property areas, namely: Argonaut, Dog Lake, Edwards, Ego, Goudreau, Goudreau Lake, Island Gold, Kremzar, Lochalsh, Magino – Kremzar, Mountain Lake, Salo, Trillium, and Manitou, consisting of Patented Claims, MLOs, and Unpatented Cell Claims, covering approximately 54,186 ha.
Figure 4-2 Mining Titles Map – Island Gold Property
Source: Alamos (2025)
Alamos holds or owns 100% of the title and/or interest in the tenures, except for:
•Part of one mining lease, for which Alamos holds 100% of the registered title below 100 metres (m) in elevation, within the Lochalsh property area;
•Six patented fee simple claims, for which Alamos owns 100% of the registered title below 400 m in elevation, and part of one patented fee simple claim for which it owns 100% of the registered title below 100 m in elevation, both situated within the Goudreau property area;
•Four patented fee simple claims, for which it owns 100% of the registered title below 400 m, situated within the Kremzar property area; and,
| | | | | |
Island Gold District – NI 43-101 Technical Report August 6, 2025 | 48
|
•Three patented fee simple claims, for which it owns 100% of the registered title below 400 m in elevation, on the Argonaut property area.
4.2.2 Magino Property
The Magino Property (Figure 4-3), consisting of the Magino Mine and its surrounding project lands, is divided into eight property areas, namely: Aguonie, Doherty, Highland South, Magino Mine, Magino – Goudreau, Murphy, Rand2 and Selkirk Lake.
Figure 4-3 Mining Titles Map – Magino Mine Property
Source: Alamos (2025)
The property areas consist of Patented Claims and Unpatented Cell Claims covering approximately 4,735 ha, with approximately 2,219 ha supporting the Magino area. 1001061522 Ontario Inc. holds or owns 100% of the title and / or interest in the aforementioned tenures, except for:
•Part of one mining lease, for which it has a 100% interest in the registered title above 100 m in elevation situated within Alamos’ Lochalsh property, forming part of the Magino property area;
•Six patented fee simple claims, for which it owns 100% of the registered title above 400 m in elevation, and part of one patented fee simple claim for which it holds a 100% interest in the registered title above 100 m in elevation, both situated within Alamos’ Goudreau property, forming part of the Magino property area;
| | | | | |
Island Gold District – NI 43-101 Technical Report August 6, 2025 | 49
|
•Four patented fee simple claims, for which it owns 100% of the registered title above 400 m, situated within Alamos’ Kremzar property, forming part of the Magino property area;
•Three patented fee simple claims, for which it owns 100% of the registered title above 400 m in elevation, situated within the Alamos’ Argonaut property, forming part of the Magino property area; and
•One patented fee simple claim, for which it owns 75% of the registered title, situated within its Magino – Goudreau property area.
4.3 Ownership of Mineral Rights
All registered titles and recorded interests pertaining to the Patented Claims, MLOs, and Unpatented Cell Claims, as applicable to and supporting the Island Gold Property and the Magino Property, are registered or recorded in the name of Alamos and 1001061522 Ontario Inc., respectively, subject to the clarification above in Section 4.2
The Company has completed title work and received title opinions supporting the collective District Property. Notwithstanding the foregoing, while the Company has carried out reviews of the registered title and recorded interests to its Patented Claims, MLOs and Unpatented Cell Claims, this should not be construed as a guarantee that such title and/or such interests will not be challenged or impugned. Said Patented Claims, MLOs and Unpatented Cell Claims may be subject to prior unregistered agreements or transfers or Indigenous land claims, and therefore title and / or interests may be affected by undetected defects.
Each of the Patented Claims and MLOs are surveyed and do not have annual assessment work obligations. Taxes covering provincial land tax levies and MEM mining land taxes, along with Crown rents and fees are paid, as applicable, annually to the provincial government to keep the Patented Claims and MLOs in good standing. While Unpatented Cell Claims are not surveyed but are staked, said Unpatented Cell Claims do require that minimum assessment work be completed annually either by conducting exploration work or by distributing banked assessment work credit available from contiguous Patented Claims and / or Unpatented Cell Claims, to facilitate renewal of the expiring Unpatented Cell Claim on or before its anniversary date.
The Company has a dedicated land and tenure manager, along with internal procedures and measures to ensure compliance, validity, and good standing of its Patented Claims, MLOs, and Unpatented Cell Claims.
The mineralized zones, including those containing the Mineral Resources and Mineral Reserves, for the Island Gold Property, are located on patented Crown leasehold claims SSM724370, SSM724372, SSM825287, SSM825288, SSM825289, SSM825290, SSM837118, SSM991852, SSM991853, SSM991854, SSM991855, SSM991856, and SSM991857, and on patented fee simple claims SSM2264, SSM2490, SSM2491, SSM2666, SSM2667, and SSM3817. The ramp and waste pad are on patented fee simple claims SSM1776 and SSM1710.
For the Magino Property, mineralized zones, including those containing the Mineral Resources and Mineral Reserves, are located on patented Crown leasehold claims SSM543310, SSM581948, SSM581949, SSM722481, and SSM1110086 (part of CLM520), and on patented fee simple claims SSM2049, SSM2050, SSM2051, SSM2052 and SSM2055.
| | | | | |
Island Gold District – NI 43-101 Technical Report August 6, 2025 | 50
|
4.4 Mining Royalties
Collectively, the District is subject to various obligations and royalties. Based on the currently defined Mineral Resources and Mineral Reserves, the only royalties applicable are identified as follows:
4.4.1 Island Gold Property
•The Lochalsh property area is subject to a 3% net smelter return (NSR) royalty payable to Osisko Gold Royalties Ltd. (Osisko). The Island Main and Lochalsh zones, as well as a part of the Island Gold Mineral Resources below the 400 m Level, are located within this property area;
•The Goudreau Lake property area is subject to a 2% NSR royalty payable to Osisko as to a 69% interest and to Franco-Nevada Corporation as to a 31% interest; and
•The Goudreau property area is subject to a 2% NSR royalty payable to Osisko.
4.4.2 Magino Property
•A 3% NSR royalty in favour of Franco-Nevada Canada Holdings Corp.;
•A 0.84% NSR royalty in favour of certain Indigenous partners, as defined and identified under specific agreements entered with these partners;
•Two further royalties, a 2% NSR and a 3% NSR, both in favour of Osisko, that apply only to approximately 1% of the Magino Mineral Reserves; and
•A 10% Net Profits Interest royalty in favour of a third-party, which, based on current plans, is not expected to be payable.
4.5 Environmental, permits, and Other Factors
The QP is not aware of any environmental liabilities on the Property not discussed in this Report and Alamos has obtained all required permits and / or has reasonable expectations to obtain all required permits to conduct the proposed work to achieve the work program outlined in this Report. The QP is not aware of any other significant factors and risks that may affect access, title, or the right or ability to perform the proposed work program on the Property.
This item is more fully covered in Section 20.
| | | | | |
Island Gold District – NI 43-101 Technical Report August 6, 2025 | 51
|
5 ACCESSIBILITY, CLIMATE, LOCAL RESOURCES, INFRASTRUCTURE, AND PHYSIOGRAPHY
5.1 Accessibility
Access to the District is provided by the Trans-Canada Highway 17, which continues north from Wawa for 35 km then following Highway 519 for 31 km to Dubreuilville. The Goudreau Road, an all-weather road, extends from Dubreuilville for 12 km to the District.
5.2 Climate
The District is contained within the Lake Superior Regional climatic zone. This area borders the north shore of Lake Superior from Sault Ste. Marie to Thunder Bay and extends inland approximately 40 - 80 km. The climate is described as "modified continental", the modification being due to impacts of Lake Superior. Climatologic records for temperature, precipitation and wind obtained from the Wawa weather station are representative of the actual conditions at the District.
The mean annual temperature is about 10 degrees Celsius (˚C), with extremes of –51 ˚C and 38 ˚C being recorded. January is the coldest month and July the warmest.
Precipitation is in the range of 980 millimetres per year (mm/y), with about 600 mm as rainfall and evaporation at 517 mm/y principally during the summer months. Peak months for rainfall are August and September, with over 100 mm typically in September. Snow cover generally persists from late October to early May, with 50 - 60 mm (water equivalent) occurring monthly.
Approximately 45 percent (%) of the annual precipitation is lost as runoff, with 50 – 60% of the total annual runoff occurring in April and May in association with spring melt and spring rains.
Average annual wind speeds are in the range of 7 - 15 kilometre per hour (km/h). Winds from the northwest through north are most prevalent during the winter, while winds from the southwest through west dominate in the summer months. East winds are infrequent in all months. The percentage of calm is high at 21 - 36%.
Exploration and mining activities can be conducted in the District year-round.
5.3 Local Resources
Wawa has a population of 2,705 inhabitants (2021 Census of Population) and, Dubreuilville, originally a forestry community, has a population of approximately 576 permanent residents (2021 Census of Population) and contains accommodations for District personnel. The District is also within a few kilometres of a railway line operated by Canadian National. Sidings for this railway line are in the villages of Dubreuilville, Goudreau and Lochalsh.
A hydro-electric power substation, water supply, gravel roads, offices, maintenance buildings, and living accommodations are all available within the mine’s general area. Island Gold power is connected to the provincial power grid and is supplied by Algoma Power Inc. (API), meanwhile Magino energy supply is provided through a series of compressed natural gas (CNG) powered generators. A 115 kilovolt (kV) powerline is currently being constructed between Hawk Junction and the mine site.
The District offers temporary living accommodations and flexible schedules to its non-local employees. Training is offered to maintain a local qualified workforce.
| | | | | |
Island Gold District – NI 43-101 Technical Report August 6, 2025 | 52
|
5.4 Physiography
The District lies in the Superior Province of the Canadian Shield, overlapped by the Boreal Shield ecological zone. Topography within the mine area varies from a high of approximately 490 metres above sea level (masl) to a low of approximately 380 masl and the area is characterized by low ridges and hills up to approximately 50 metres (m) high, with extreme slopes in the area measuring 30 - 50%. The area is flanked by generally flat areas of glacial outwash, swamps, and numerous lakes and bogs.
Periods of intense glacial activity have contributed to the hummocky, rock knelled and largely bedrock-controlled topography, characteristic of the region. Glacial advance from the north deposited a thin mantle of stony sand till over a scoured rock surface (Boissonneau, 1966). The till is generally less than 1 m thick on the crests of hills but can exceed 5 m on some slopes and valleys (Gartner and McQuay, 1979).
The vegetation is comprised of mixed forest, which dominates the landscape, with secondary conifer occurrence. Hardwood trees in the area are largely composed of trembling aspen and white birch, with balsam and poplar occurring on more moist areas. Conifer species common to the area include black spruce, white spruce, balsam fir, and jack pine. Undergrowth includes grass, ferns, moss, berry plants, and numerous types of shrubs. Animals common to the area include moose, black bear, deer, lynx, bobcat, wolf, beaver, muskrat, hare, marten, squirrel, and chipmunk, as well as a variety of birds including grouse, raven, waterfowl, and birds of prey.
Water depths in Goudreau Lake vary substantially. The deepest areas, up to 13 m, occur in the northern portion of the lake, upstream of the first narrows. Downstream of the narrows, lake depths are shallow, generally being less than 2 - 3 m. Considerable areas of marginal swamp are associated with the lower portions of Goudreau Lake.
| | | | | |
Island Gold District – NI 43-101 Technical Report August 6, 2025 | 53
|
6 HISTORY
The Goudreau – Lochalsh Gold Camp area has been a subject of interest dating back to the early 1900’s and has attracted prospectors and mining companies in search of iron ore, gold, and base metal deposits. The Wawa – Michipicoten area has been recognized for its long history of iron exploration which has resulted in the development and production of several iron ore mining operations.
Gold exploration followed shortly thereafter, resulting in several gold discoveries which were subsequently developed and brought into commercial production in the area which would later become the District.
6.1 Island Gold History
6.1.1 Ownership and Work History
Five distinct periods of ownership and work history have been identified:
•Period 1: 1901 to 1954;
•Period 2: 1972 to 1992;
•Period 3: 1996 to 2002;
•Period 4: 2003 to 2014;
•Period 5: 2015 to 2019; and
•Period 6: 2020 to Present.
6.1.1.1 Period 1: 1901 to 1954
The initial discovery of gold was made by a group of prospectors at Emily Bay on Dog Lake in Riggs Township in 1901. Up to approximately 1944, prospecting, geological mapping, trenching, shaft sinking, and 1,732 m of diamond drilling were completed in the area to explore various gold prospects.
From 1916 to 1954, Algoma Ore Properties Limited (Algoma) carried out extensive exploration work on the Morrison No. 1 iron sulphide property in Finan Township, defining a sizable iron-bearing deposit. In the later years of this period the deposit was further explored for gold to define 491,000 tonnes (t) grading 1.59 grams/tonne (g/t) gold.
In 1925, Patrice Kremzar discovered the first gold occurrences on what is now the present Island Gold property. By the 1930’s, thirteen gold zones had been identified across the property including the ‘New Zone’ which eventually became the Kremzar deposit.
Ultimately this period is marked principally by various exploration efforts by several companies carrying out surface trenching, diamond drilling, shaft sinking, and underground development on several gold prospects including the Magino deposit which is currently being mined today. In the overall area during this period, 159 holes totaling 12,070 m of diamond drilling was carried out, exploring for iron originally, then gold.
Table 6-1 is a summary of ownership and work history at Island Gold during the 1901 to 1954 period.
| | | | | |
Island Gold District – NI 43-101 Technical Report August 6, 2025 | 54
|
Table 6-1 Summary of Ownership and Work History – Island Gold Period 1: 1901 to 1954
| | | | | | | | | | | | | | | | | | | | |
| Year | Company | Area | Type of work | Drillholes | Comment |
| No. | Metres |
| 1916 | Algoma | Morrison #1 | - Trenching - Diamond drilling | 19 | 1,524 | - 277,000 tons pyrite 35% sulphur |
| 1925 | Patrice Kremzar | Kremzar Property | - Prospecting - Staking | | | - Staking of part of present mine property - First gold discovery |
| 1925-1930 | Algoma | Kremzar Property | - Diamond drilling | 6 | 203 | - #2, #7, #8 zone work |
| 1930 | M.J. O'Brien Ltd. | Kremzar Property | - Diamond drilling | 10 | 1,476 | - #1, #2 zones, Tent vein |
| 1935-1936 | Cockshutt and Hopkins | Kremzar Property | - Diamond drilling | 12 | 611 | - Local high grade Tent vein result |
| 1940 | O'Brien Gold Mines | Kremzar Property | - Diamond drilling | 41 | 2,628 | - #2, #7, and Tent veins, - Discovery of Kremzar deposit |
| 1944 | Algoma | Emily Bay | - Diamond drilling | 38 | 1,732 | - Gold bearing iron formation |
| 1953-1954 | Algoma | Morrison #1 | - Diamond drilling | 33 | 3,896 | - Up to 3.8 g/t gold over 30 m intersected, BP series |
| TOTAL | | | | 159 | 12,070 |
|
6.1.1.2 Period 2: 1972 to 1992
After an extended period of relatively little activity in the area, exploration was resumed by Amax Inc. and its Canadian division, Canamax Resources Inc (Canamax). Canamax carried out assorted exploration efforts in Finan and Jacobson Townships, consisting of various types of geophysical and geological surveys followed up with diamond drilling.
In 1985 drilling, approximately 2 km south of the Kremzar Mine, intersected a series of sub-parallel lenses containing gold mineralization within deformed rocks of the Goudreau Lake Deformation Zone (GLDZ). These lenses are known as the Lochalsh, Island Gold, Shore, and Goudreau Lake Zones which today form part of the Island Gold deposit.
In December 1988, Canamax’s Kremzar Project began commercial production. From 1988 to 1990, production from the Kremzar Mine was 306,603 t grading 4.77 g/t gold. A total of 46,798 troy ounces (oz) were extracted from the Kremzar Mine before being shutdown late in 1990 due to lower-than-expected mill head grades reportedly caused by excessive dilution.
Over 1989 and 1990, underground access was established into the Island Gold deposit with a 1,280 m long ramp from the north shore of Goudreau Lake. A 4,167 t bulk sample grading 6.50 g/t gold was extracted and processed at the Kremzar mill. At the end of 1990, Canamax suspended all operations at both the Kremzar Mine and Island Gold Projects.
A total of 66,661 m of diamond drilling was completed in 336 holes across the District during this time.
Table 6-2 presents a summary of ownership and work history at Island Gold during the 1972 to 1992 period.
| | | | | |
Island Gold District – NI 43-101 Technical Report August 6, 2025 | 55
|
Table 6-2 Summary of Ownership and Work History – Island Gold Period 2: 1972 to 1992
| | | | | | | | | | | | | | | | | | | | |
| Year | Company | Area | Type of work | Drillholes | Comment |
| No. | Metres |
| 1976-1979 | Amax Inc. | Finan, Jacobson, Riggs | '- Diamond drilling | 21 | 2,408 | - Edwards and Island claims |
| 1983 | Canamax | Algoma Property | - Joint venture between Algoma Ore Properties Ltd. and Canamax | | | - 117 patented claims |
| 1983-1986 | Canamax | Goudreau Project | - Diamond drilling | 75 | 10,186 | '- Island zone discovery. Defined Inferred Mineral Resources of 1.1M tons @ 0.235 oz/ton Au. |
| 1985-1986 | Canamax | Kremzar Property | '- Ramp driven - Mill constructed | | | - Ramp developed to 240L |
| 1987 | Canamax | Goudreau Lake | - Diamond drilling | 77 | 23,860 | '- Drilling on several gold showings: Breccia zone, #2, #8, Tent Vein, Pine Zone, Morrison #1, Portage Showing, Portal Zone |
| 1988 | Canamax. | Goudreau Lake | - Diamond drilling | 65 | 18,400 | '- Surface exploration Goudreau project |
| 1989 | Canamax | Goudreau Lake | - Diamond drilling | 29 | 5,295 | '- Surface exploration Goudreau project |
| 1989 | Canamax | Kremzar Mine | - Start of production | | | '- Start of production during 4th Quarter of 1988 |
| 1989-1990 | Canamax | Island Gold Zone | - Development | | | '- 2,062 m of development (ramp, 125L and 140L) |
| 1990 | Canamax | Kremzar Mine | - Production | | | '- Mine shutdown 1990 - 46,798 oz of gold were produced. |
| 1990 | Canamax | Goudreau Lake | - Diamond drilling | 12 | 1,528 | '- Surface exploration Goudreau project |
| 1990 | Canamax | Island Gold Zone | - Bulk sample | | | '- 4,167 t of ore grading 6.5 g/t gold |
| 1991 | Canamax | Island Gold Zone | - Diamond drilling | 57 | 4,984 | '- Definition drilling on Island Gold deposit |
| TOTAL | | | | 336 | 66,661 |
|
6.1.1.3 Period 3: 1996 to 2002
The Island Gold property was acquired from Canada Tungsten Inc. by Patricia Mining Corp (Patricia). From 1996 to 2002, various exploration activities on the property including prospecting, surface trenching, geological and geophysical surveys, and diamond drilling were carried out to explore for both Island Gold and Kremzar styles of gold bearing prospects and zones.
During this period of exploration, 20,237 m of diamond drilling was completed in 115 holes at various locations on various properties.
Table 6-3 presents a summary of ownership and work history at Island Gold during the 1996 to 2002 period.
| | | | | |
Island Gold District – NI 43-101 Technical Report August 6, 2025 | 56
|
Table 6-3 Summary of Ownership and Work History – Island Gold Period 3: 1996 to 2002
| | | | | | | | | | | | | | | | | | | | |
| Year | Company | Area | Type of work | Drillholes | Comment |
| No. | Metres |
| 1996 | Patricia. | Island Property | - Acquisition of property from Canada Tungsten Inc. | - | - | - Patricia Mining Corp. acquired Kremzar, Lochalsh and Goudreau claim groups |
| 1996-1997 | Patricia | Island, Lochalsh zones | - Diamond drilling | 43 | 15,610 | - Surface exploration holes, PL -01 to PL-35 series |
| 1997 | Patricia | Kremzar property | - Trenching | - | - | - Trenching in 15 areas to expand historic showings |
| 1997 | Patricia | Island Gold Project | - Technical Report | - | - | - Technical Report on the Island Gold deposit by RPA |
| 1998 | Patricia | Island, Lochalsh zones | - Diamond drilling | 58 | 2,206 | - Surface exploration drilling north of Island Gold |
| 2000 | Patricia | Island Gold Project | - Technical Report | - | - | - Technical Report on Island Gold by RPA |
| 2000 | Patricia | Island Gold Project | - Mapping - Geophysics - Diamond drilling | 2 | 289 | - Exploration drilling work focused on Pine Zone |
| 2001 | Patricia | North Shear | - Diamond drilling | 5 | 1,027 | - Surface exploration holes, PL series |
| 2002 | Patricia | North Shear | - Diamond drilling | 7 | 1,105 | - Surface exploration holes, PL series |
| 2002 | Patricia | Island Gold Project | - Re-logging | | | - Re-logging of 24 diamond drillholes |
| 2002 | Patricia | Island Gold Project | - Technical Report | | | - Addendum to 2000 Technical Report by RPA |
| TOTAL | | | | 115 | 20,237 |
|
6.1.1.4 Period 4: 2003 to 2014
In 2003, Patricia. and Richmont Mines Inc. (Richmont) entered into a joint venture agreement. Work completed during the joint venture included 72,984 m of surface and underground diamond drilling to test the various zones of the Island Gold property. On January 1, 2005, Richmont became the operator of the project.
Commercial production at Island Gold began on October 1st, 2007. Richmont acquired Patricia’s 45% interest in December 2008, becoming 100% owner of the property and operations.
Exploration activities ramped up in 2009 with a minimum of 30,000 m of drilling completed in each of the next several years, increasing sharply to more than 80,000 m in 2012. This included drilling below the 400 m Level elevation as part of the Island Gold Deep exploration program which was successful in extending the main C Zone at depth with an initial Inferred Mineral Resource being calculated on the high-grade deep C Zone in January 2013.
Over the next year, drilling in the Island Gold Deep sectors from the west, below Lochalsh, to the east and below Extension 1 confirmed the presence and continuity of the C Zone and some parallel zones. This created a substantial increase in Inferred Mineral Resources to 3.6 Mt
| | | | | |
Island Gold District – NI 43-101 Technical Report August 6, 2025 | 57
|
grading 9.07 g/t for 1.04 Moz of gold as of April 2014. This represented an increase of nearly 1.0 Moz at a 46% higher grade from the end of 2012.
Richmont completed several ground and airborne geophysical surveys, and extensive surface and underground exploration diamond drilling programs totalling 2,227 drillholes for 453,158 m.
Table 6-4 presents a summary of ownership and work history at Island Gold during the 2003 to 2014 period.
Table 6-4 Summary of Ownership and Work History – Island Gold Period 4: 2003 to 2014
| | | | | | | | | | | | | | | | | | | | |
| Year | Company | Area | Type of work | Dill Holes | Comment |
| No. | Metres |
| 2003 | Richmont / Patricia | Island Gold Project | - Joint venture agreement | | | '- Richmont acquires 55% interest of Island Gold |
| 2004 | Richmont / Patricia | Island Gold Project | - Surface and U/G diamond drilling and development | | | '- 10 surface holes on North Shear zone, - No information available on quantity of holes or metreage. |
| 2005 | Richmont / Patricia | Island Gold Mine | - U/G drilling | 72 | 18,330 | - E1E and CD zone work |
| 2006 | Richmont / Patricia | Island Gold Mine | - Surface and U/G diamond drilling | 81 | 7,906 | - 26 surface holes |
| 2007 | Richmont / Patricia | Island Gold Mine | - U/G drilling and production | 215 | 38,696 | '- Beginning of commercial production |
| 2008 | Richmont | Island Gold Mine | - U/G drilling | 134 | 13,060 | '- Acquisition of Island Gold from Patricia Mining Corp. |
| 2009 | Richmont | Island Gold Mine | - Surface and U/G diamond drilling | 87 | 16,126 | '- Delineation and exploration, one hole on Edward property |
| 2010 | Richmont | Island Gold Mine | - U/G drilling | 219 | 33,107 | - Delineation and definition of zones |
| 2011 | Richmont | Island Gold Mine | - Surface and U/G diamond drilling | 272 | 66,710 | '- Island Gold deep drilling, delineation, and definition drilling, - 4 holes on Edward property |
| 2012 | Richmont | Island Gold Mine | - Surface and U/G diamond drilling | 323 | 64,981 | '- Island Gold deep drilling, delineation, and definition drilling - 30 holes on Kremzar and other targets |
| 2013 | Richmont | Island Gold Mine | - Surface and U/G diamond drilling | 440 | 96,067 | '- Deep drilling of the Island Zone, delineation, and definition drilling |
| 2014 | Richmont | Island Gold Mine | - Surface and U/G diamond drilling | 384 | 98,175 | Deep drilling of the Island Zone, delineation, and definition drilling |
| TOTAL | | | | 2,227 | 453,158 | |
6.1.1.5 Period 5: 2015 to 2019
A large exploration program commenced at the end of 2015 to explore beneath Island Gold. Directional diamond drilling was used to reach targets at depth which allowed greater accuracy than conventional drilling techniques. As a result of this program, Mineral Resources were added in the C Zone at depth and to the East in the E1E Zone in the Extension 2 area. Of the 647,723 m of drilling completed between 2015 – 2021, this includes a total of 274,345 m of
| | | | | |
Island Gold District – NI 43-101 Technical Report August 6, 2025 | 58
|
directional drilling.
Between 2016 and 2018 a drill program totalling 9,669 m was conducted to explore the Kremzar Mine. During this period further exploration was carried out along the GLDZ east and west of Island Gold along strike to test the extent of mineralization.
Alamos acquired Richmont in November 2017.
Two Master’s theses on Island Gold geology were completed in 2019 from the University of Waterloo focussing on structural geology (Jellicoe, 2019) and alteration (Cuifo, 2019).
Other exploration activities undertaken during this period include stripping a 145 m long trench
along the GLDZ and collecting 185 soil and gas hydrocarbon samples over the Island Gold property in three transects. Geophysical surveys and remote sensing such as light detection and ranging (LiDAR) and very low frequency (VLF) surveys were conducted as well.
In 2018 a 2,200 line-km high-sensitivity aeromagnetic and HeliFALCON airborne gravity
gradiometre survey was completed over the Island Gold property by CGG Canada Services Ltd.
A geological modelling project of Island Gold was completed between 2018 and 2021. The project comprised targeted re-logging of drill core, collection and analysis of geochemical, spectral, and structural data sets, and 3D modelling. The results of the project included an updated understanding of the geological framework of the Island Gold deposit and a mine-scale to property wide targeting framework for ongoing exploration. These concepts are being actively applied within current exploration programs.
In 2019 a regional mapping program on the Island Gold Property surrounding the mine mapped approximately 35 square kilometres (km2). During mapping, 883 samples were collected of which 141 were sent for litho-geochemical analysis, 402 were sent for gold and metal assaying and 41 were sent for thin sections analysis.
Table 6-5 presents a summary of ownership and work history at Island Gold during the 2015 to 2019 period.
Table 6-5 Summary of Ownership and Work History – Island Gold Period 5: 2015 to 2019
| | | | | | | | | | | | | | | | | | | | |
| Year | Company | Area | Type of work | Drillholes | Comment |
| No. | Metres |
| 2015 | Richmont | Island Gold Mine | - Surface and U/G diamond drilling | 563 | 102,997 | '- Deep drilling Island Zone, delineation, and definition drilling |
| 2016 | Richmont | Island Gold Mine | - Surface and U/G diamond drilling | 722 | 149,585 | '- Deep drilling Island Zone, delineation, and definition drilling |
| 2017 | Richmont | Island Gold Mine | - Surface and U/G diamond drilling | 835 | 139,243 | '- Deep drilling Island Zone, delineation, and definition drilling |
| 2017 | Richmont | Island Gold Mine | '- Trenching - LiDAR survey
| | | '-145 m trench - LiDAR survey of the mine and surrounding area ~270 km2 |
| 2017 | Alamos | Island Gold/ Kremzar | - Acquisition | | | '- Alamos Gold Inc. acquired Richmont Mines Inc. in November 2017 |
| | | | | |
Island Gold District – NI 43-101 Technical Report August 6, 2025 | 59
|
| | | | | | | | | | | | | | | | | | | | |
| Year | Company | Area | Type of work | Drillholes | Comment |
| No. | Metres |
| 2018 | Alamos | Island Gold Mine | '- VLF survey - Airborne survey
| | | ''- 2,200 km of HeliFALCON airborne gravity gradiometre of Island Gold - VLF on 4 transects over Island Gold |
| 2018 | Alamos | Island Gold Mine | - Surface and U/G diamond drilling | 715 | 136,565 | '- Deep drilling Island Zone, delineation, and definition drilling |
| 2018 | Alamos | Island Gold Mine | - Geologic modelling project | | | '- 3D geological modelling of Island Gold, completed in 2021 |
| 2019 | Alamos | Island Gold Mine | - Soil and gas hydrocarbon sampling | | | '- 3 transects of samples on Island Gold, 185 samples collected |
| 2019 | Alamos | Island Gold Mine | - Surface and U/G diamond drilling | 502 | 119,333 | '- Deep drilling Island Zone, delineation, and definition drilling |
| 2019 | Alamos | Island Gold Mine | - 2 master's theses | | | '- University of Waterloo thesis on Island Gold geology and alteration |
| 2019 | Alamos | Island Gold Mine | - Mapping | | | '- Regional mapping surrounding Island Gold and GLDZ encompassing ~35 km2 |
| TOTAL | | | | 3,337 | 647,723 | |
6.1.1.6 Period 6: 2020 to Present
The deep directional exploration drill program beneath Island Gold resources, which started in 2015, continues to the present day, predominantly targeting the C Zone and E1E Zone. A total of 76 drillholes and 73,595 m of directional drilling was completed between 2020 and 2024 (of a total of 2,129 holes and 474,991 m executed during the period).
During this period 48,301 m in 121 holes were drilled to test gold targets with further proximity to Island Gold including the Plowman Zone in the Cline-Edwards property, the 88-60 Zone, the Pic Zone, the Delta till anomaly and the Pine-Breccia Zone. Near mine targets included the 21 Zone and North Shear structure which occurs along the north contact of the Webb Lake Stock (WLS). B horizon soil surveys, till surveys and reverse circulation (RC) drilling program were also conducted on the property during this period.
In March 2024 Alamos announced the friendly acquisition of Argonaut whose combination of the adjacent Island Gold and Magino mines would form the District. The acquisition was closed in July 2024.
Table 6-6 presents a summary of ownership and work history at Island Gold during the 2020 to 2024 period.
| | | | | |
Island Gold District – NI 43-101 Technical Report August 6, 2025 | 60
|
Table 6-6 Summary of Ownership and Work History – Island Gold Period 6: 2020 to 2024
| | | | | | | | | | | | | | | | | | | | | | | |
| Year | Company | Area | Type of work | Drillholes | Comment |
| No. | Metres |
| 2020 | Alamos | Island Gold/ Regional | - Acquisition | | | - Alamos Gold acquires Trillium land package of 54.2 km2 |
| 2020 | Alamos | Island Gold Mine | - Surface and U/G diamond drilling | 280 | 64,782 | - Deep drilling Island Zone, delineation and definition drilling |
| 2020 | Alamos | Island Gold Property | - Surface drilling | 14 | 8,865 | - Regional drilling 21 Zone, Eastern Extension and North Zone |
| 2020-2021 | Alamos | Island Gold Mine | - Geochemical sampling program | | | - Litho-geochemical characterization of IGM, PCA analysis, 12,500 samples |
| 2020 | Alamos | Island Gold Property | - Gold in till sampling | | | - Island Gold Property, 102 samples |
| 2020 | Alamos | Island Gold Mine | - Airborne magnetic survey | | | - Drone Magnetic survey on Original Island Property. 1,515 km of lines covering 65 km2 |
| 2021 | Alamos | Island Gold Mine | - Surface and U/G diamond drilling | 446 | 82,017 | '- Deep drilling Island Zone, delineation and definition drilling, including North Zone |
| 2021 | Alamos | Island Gold Property | - Surface drilling | 14 | 10,954 | - 21 zone, North Shear, Delta Anomaly, NE Fault, East of Dyke 3 deep targets, deep west targets. |
| 2021 | Alamos | Island Gold/ Trillium | - Airborne magnetic survey | | | - Drone Magnetic survey SE part Island Property. 3,106 km of lines covering 90 km2 |
| 2021 | Alamos | Island Gold/ Trillium | - Gold in till sampling | | | - Till sampling, 329 samples, |
| 2021 | Alamos | Island Gold/ Kremzar | - Mapping | | | - Regional mapping surrounding IGM, Pine Breccia, Kremzar. 439 Geochem samples, ~55 km2 |
| 2022 | Alamos | Island Gold Mine | - Surface and U/G diamond drilling | 355 | 81,332 | - Deep drilling Island Zone, delineation and definition drilling |
| 2022 | Alamos | Island Gold Property | - Surface drilling | 14 | 9,712 | '- 21 Zone, North Shear, Delta Anomaly, NE Fault |
| 2022 | Alamos | Island Gold Property | - RC drill program | 91 | n/a | - Edwards Cline Area, 1675 samples |
| 2023 | Alamos | Island Gold Mine
| - Surface and U/G diamond drilling | 397 | 86,069 | - Deep drilling Island zone, Deep East Extension, UG delineation, definition and exploration |
| 2023 | Alamos | Island Gold Property | - Surface drilling | 44 | 8,439 | - 88-60 zone, 87-53 zone, Delta Anomaly, Indian Lake. Pine Breccia, SW Edwards. |
| 2023 | Alamos | Island Gold Property | - Soil survey | | | - B-Horizon, 328 samples |
| 2024 | Alamos | Island Gold Mine | - Surface and U/G diamond drilling | 439 | 112,490 | - 840 gap drilling, UG delineation, definition and exploration |
| 2024 | Alamos | Island Gold Property | - Surface drilling | 35 | 10,331 | - Cline-Edwards, North Shear, Pic, Pine Breccia |
| 2024 | Alamos | District | - Acquisition | | | - Alamos Gold Inc. Acquires Argonaut Gold Inc. including Magino Mine and 22 km2 land package |
| TOTAL | | | | 2,129 | 474,991 | |
| | | | | |
Island Gold District – NI 43-101 Technical Report August 6, 2025 | 61
|
6.2 Magino Mine History
The following account of the history of the Magino deposit is derived from Koskitalo (Nov, 1983), Turcotte and Pelletier (May, 2009), Turcotte, et al., (2010), and Ross (2011), where a more detailed description of historical exploration on the property can be found.
The discovery of iron mineralized material around the turn of the 20th century in the Michipicoten area southwest of Wawa led to a search for similar deposits along the iron ranges further north. The iron formations near Goudreau were found to contain pyrite in sufficient quantity to form the basis of a mining industry of considerable importance at one time. Between 1916 and 1919, about 250,000 t of pyrite were produced, but a lack of markets for sulphuric acid at the close of World War I led to the abandonment of the mines and the dismantling of the acid plants that had been erected two miles east of Goudreau.
Gold was discovered in 1918 near Goudreau, and prospecting and mining have continued since then, being particularly active from the mid-1920s to the beginning of World War II. Records show that gold production from the Goudreau area was sporadic.
6.2.1 Ownership and Work History
Various companies owned, operated, and explored the property between 1917 and present day, with a 30-year gap of inactivity from 1942 to 1972. A summary of these activities can be found in Table 6-7.
Table 6-7 Summary of Ownership and Work History – Magino
| | | | | | | | | | | | | | | | | | | | |
| Year | Company | Area | Type of work | Drillholes | Comment |
| No. | Metres |
| 1918 | McCarthy-Webb Goudreau Mines Ltd. (MWG Mines) | Magino Property | - Sinking 2 shafts - Drilling | n/a | 335 | - Discovered gold near Webb Lake - No available drill results |
| 1925-1933 | (MWG Mines) | Magino Property | - Test pits and trenching - 25 t/d mill constructed | n/a | n/a | - No available trench or test pit results |
| 1925-1933 | Consolidated Mining and Smelting Company | Magino Property | - Diamond drilling | 5 | 640 | - No available results |
| 1934 | (MWG Mines) | Magino Property | - Test pits and trenching - 421 t ore milled | | | - 144 oz gold produced - Gold grade ~ 0.342 oz/ton |
| 1935-1937 | Algoma Summit Gold Mines | Magino Property | - Surface mining - 33° inclined shaft sunk to vertical depth of 100’, - UG development - 500 t/d mill constructed - 47,785 t of ore milled - UG drilling | n/a | n/a | - 2,274 oz gold produced - Gold grade ~ 0.048 oz/ton |
| | | | | |
Island Gold District – NI 43-101 Technical Report August 6, 2025 | 62
|
| | | | | | | | | | | | | | | | | | | | |
| Year | Company | Area | Type of work | Drillholes | Comment |
| No. | Metres |
| 1938-1939 | Algoma Summit Gold Mines | Magino Property | - Inclined shaft sunk to 114m - 68,421 t ore milled - UG drilling - UG development and drifting | 8 | 231 | - 6,049 oz gold produced - Gold grade ~ 0.088 oz/ton |
| 1938-1939 | Mr. J. O’Brien | Magino Property | - Exploration drilling | n/a | n/a | - Discovery of E zone |
| 1939-1942 | Magino Gold Mines | Magino property | - Detailed UG exploration - UG development, drilling and mine closure | 42 | 1,353 | - 2,860 m of drifting, crosscuts and raises - 309 oz gold from mill clean-up |
| 1942 | M.J. O’Brien Limited Option | Magino Property | - Surface diamond drilling | 13 | 1,276 | - Drilling along strike of UG working - Assay results range 0.1 - 3.47 oz/ton - Widths range 0.5 - 12’. |
| 1972 | Mr. C. McNellen | Magino Property | - Detailed UG exploration and drilling | 6 | 610 | - Mineralized intersections recorded |
| 1981 | McNellen | Magino Property | - Exploration drilling | 16 | 2,261 | - Testing continuity of A, B and E Zones |
| 1982 | Cavendish | Magino Property | - UG drilling - Relogging of old core - UG channel and face sampling - Surface drilling | 82 | 4,709 | - Increased delineation of gold resource |
| 1986-1987 | McNellen / Muscocho | Magino Property | - UG development work | 426 | 52,797 | - Production stopes developed |
| 1988-1992 | McNellen / Muscocho | Magino Mine | - UG mine production, 768,678 t of ore milled | 703 | 47,762 | - 105,543 oz gold produced - Gold grade ~ 0.137 oz/ton |
| 1997 | Golden Goose. | Magino Mine | - Surface drilling - Check sampling program - Surface geochemical study - IP survey of WLS - Stripping, mapping and channel sampling | 10 | 2,088 | DDH S-97-01; 1.548 g/t over 24 m. DDH S-97-09; 1.502 g/t over 26 m. DDH S-97-10; 1.524 g/t over 22m. |
| 2000 | Golden Goose | Magino Mine | - Surface drilling | 19 | 1,231 | DDH 00-01; 2.801 g/t Au over 13.72 m DDH 00-07; 3.358 g/t Au over 10.36 m DDH 00-18; 0.987 g/t Au over 31.09 m |
| | | | | |
Island Gold District – NI 43-101 Technical Report August 6, 2025 | 63
|
| | | | | | | | | | | | | | | | | | | | |
| Year | Company | Area | Type of work | Drillholes | Comment |
| No. | Metres |
| 2002 | Golden Goose | Magino Mine | - Surface drilling | 17 | 2,743 | DDH 02-02; 2.231 g/t Au over 6.31m DDH 02-05; 1.23 g/t Au over 14.02 m DDH 02-15; 0.609 g/t Au over 10.21 m |
| 2006 | Golden Goose | Magino Mine | - Surface diamond drilling | 18 | 8,055 | DDH 2007-22; 3.260 g/t Au over 19.0 m DDH 2007-24; 3.172 g/t Au over 30.2 m DDH 2007-26; 2.131 g/t Au over 21.0 m |
| 2009 | Golden Goose | Magino Mine | - Surface diamond drilling | 8 | 2,371 | DDH 09-03; 1.309 g/t Au over 13.0 m DDH 09-06; 4.733 g/t Au over 4.0 m DDH 09-08; 1.518 g/t Au over 10.0 m |
| 2010 | Kodiak Exploration Limited | Magino Mine | - Surface diamond drilling | 6 | 1,635 | DDH 10-02; 1.656 g/t Au over 8.0 m DDH 10-02; 1.138 g/t Au over 8.5 m DDH 10-03; 2.867 g/t Au over 5.0 m |
| 2011-2012 | Prodigy | Magino Mine | - Surface diamond drilling | 725 | 186,665 | DDH MA11-004; 2.881 g/t Au over 65.6 m DDH MA11-055; 2.511 g/t Au over 42.0 m DDH MA11-083; 2.019 g/t Au over 62.0 m DDH MA12-256; 1.346 g/t Au over 51.0 m DDH MA12-264; 1.685 g/t Au over 45.0m DDH MA12-429; 2.403 g/t Au over 55.0 m |
| 2013 | Argonaut | Magino Mine | - Surface diamond drilling - Sampling old core - Selection of metallurgical samples - Worked on PFS study (JDS) | 23 | 2,904 | - Initial results suggest high bias with older data - Completed metallurgical study - Completed PFS |
| 2014 | Argonaut | Magino Mine | - Sampling old core - Review of historical underground data | | | - Filed PFS in early January |
| 2015 | Argonaut | Magino Mine | - Surface diamond drilling - Remodelled deposit - Leased claims from Richmont Mines Inc. - Updated 2014 PFS | 50 | 11,288 | - Extended mineralization eastward - Filed updated PFS (2016) |
| 2016 | Argonaut | Magino Mine | - Surface RC drilling - Remodelled deposit - Updated Technical Report | 350 | 39,453 | - Infill drilling confirmed and upgraded resource - Filed updated FS (2017) |
| 2017 | Argonaut | Magino Mine | - Surface diamond drilling | 13 | 3,304 | |
| | | | | |
Island Gold District – NI 43-101 Technical Report August 6, 2025 | 64
|
| | | | | | | | | | | | | | | | | | | | |
| Year | Company | Area | Type of work | Drillholes | Comment |
| No. | Metres |
| 2019 | Argonaut | Magino Mine | - Surface diamond drilling | 19 | 13,840 | |
| 2020 | Argonaut | Magino Mine | - Surface diamond drilling | 53 | 42,019 | |
| 2020 -2024 | Argonaut | Magino Mine | - Surface diamond drilling | 362 | 195,008 | - Delineation and definition drilling - Production decision in November 2020 |
| 2023-2024 | Argonaut | Magino Mine | - Trenching and channeling | | | - 88 channels and trenches, 679 m |
| 2024 | Alamos | Magino Mine | - Acquisition | | | - Alamos Gold Acquires Argonaut Gold, Magino Mine site and 22 km2 land package |
| TOTAL | | | | 2,974 | 624,578 |
|
In the fall of 1917, D. J. McCarthy and W. J. Webb of Sault Ste. Marie, ON staked the current patented claims for pyrite after Rand Consolidated and Nichols Chemical Company started their operations in the district. Gold was discovered on the property on what is now claim SSM 2050. McCarthy‐Webb Goudreau Mines Limited was formed to take over and develop the claim group. Between 1925 and 1933, McCarthy-Webb Goudreau Mines Limited excavated test pits and trenches on the property, built and operated a small test mill with a daily capacity of 25 t, and tried to interest major companies in the property. One such company was Consolidated Mining and Smelting Company, which drilled an unknown number of metres in five surface holes.
In 1935, Algoma Summit Gold Mines started underground development by sinking an inclined shaft at 33° on the Grey Vein to a vertical depth of 100 feet. During 1936, a 500 tpd mill was constructed, consisting of amalgamation and flotation sections.
Toward the end of 1938, control of the property passed to a newly formed company called Magino Gold Mines Limited who commenced a detailed underground exploration program consisting of diamond drilling, mapping, sampling, and drifting to develop a proven ore reserve inventory. It would also appear that just before Magino Gold Mines Limited acquired the property, the M.J. O'Brien interests, who operated the nearby Cline Gold Mine, drilled a series of holes east of the mill buildings and discovered a new gold zone referred to as the "E" Zone (Koskitalo, 1983).
On September 25th, 1981, McNellen Resources Incorporated (McNellen), formerly Rico Copper Incorporated entered a joint venture with Cavendish Investing Limited (Cavendish); under the terms of the agreement, Cavendish could earn an undivided 50% interest in the property and project management control by expending C$900,000 on the property (Koskitalo, 1983), which they did.
On November 1st, 1985, Muschocho Explorations Limited (Muschcho) acquired Cavendish’s interest in the property. At the time, Cavendish and McNellen each owned a 50% interest in the property.
Underground development began in 1986 under project ownership of McNellen and Muscocho, with production beginning in 1988. Mining continued from 1988 to 1992, during which 768,678 t
| | | | | |
Island Gold District – NI 43-101 Technical Report August 6, 2025 | 65
|
were processed at a recovered grade of 0.137 (ounce per tonne) oz/t gold (4.3 g/t), producing 105,543 oz of gold (McBride, 1991; Nielsen, 1995; Perkins, 1999; Ross, 2011).
Twenty-eight shrinkage stopes were mined totaling 177,486 t at a grade of 0.217 oz/t (6.8 g/t), producing 38,572 oz of gold. Thirty-four long-hole stopes were mined totaling 371,285 t at a grade of 0.118 oz/t (3.7 g/t) and producing 43,938 oz of gold. Three combined longhole and shrinkage stopes were mined totaling 53,766 t at a grade of 0.177 oz/t (5.5 g/t), producing 9,534 oz of gold.
The mine closed in mid-1992 due to high operating costs, and the underground workings were allowed to flood. Excess dilution within longhole stopes seemed to be a major factor in the reduced grades from these stopes, and the lower operating costs of the longhole mining method were not sufficient to offset the dilution factor (Nielsen, 1995).
In 1996, three companies – Muscocho, McNellen, and Flanagan McAdam Resources Incorporated – combined to form Golden Goose Resources Inc. (Golden Goose), which emerged with a 100% interest in the property.
On August 31st, 2010, Kodiak Exploration Limited and Golden Goose announced a definitive merger agreement and plan of arrangement dated August 30th, 2010, whereby Kodiak Exploration Limited would acquire all the issued and outstanding shares of Golden Goose. The arrangement effectively combined the assets of both companies on a consolidated basis, with Golden Goose becoming a wholly owned subsidiary of Kodiak Exploration Limited. On January 4th, 2011, the merged assets were renamed Prodigy Gold Inc (Prodigy).
On February 9th, 2011, Prodigy signed an option agreement with MPH Ventures Corp. allowing Prodigy. to earn up to a 100% interest in the 128 ha Gould Gold Property, adjacent to the Property.
On December 11th, 2012, an agreement was completed that made Prodigy. a wholly owned subsidiary of Argonaut. Argonaut accelerated the exploration program during 2011 and 2012 with the drilling of 725 holes for 186,665 m. This allowed Argonaut to continue to advance the project with Preliminary Feasibility Studies issued in 2014 and 2017 and a Feasibility Study completed during December 2017. Additional studies were conducted during 2018, 2019, and 2020, and Argonaut decided to develop the Magino Project in November 2020 and construction activity commenced in the first quarter of 2021. Commercial production of the Project was achieved in November 2023.
Exploration after 2012, through 2019, continued at a relatively slower pace but accelerated from 2020 to present day with continued delineation drilling of the deposit. In addition to this exploration, in 2017 a 3,302 m condemnation program was completed beneath the claims held by Argonaut at the Magino Mine to the west of the Island Gold Mine to facilitate a claim trade.
In March 2024 Alamos announced the friendly acquisition of Argonaut whose combination would form the District. The acquisition closed in July 2024.
| | | | | |
Island Gold District – NI 43-101 Technical Report August 6, 2025 | 66
|
6.3 Historical Production from the District
Since the start of underground mining operations in 2006 and up to December 31st, 2024, Island Gold has produced a total of 1,509,520 oz of gold. Commercial production commenced in October 2007, and since that time approximately 1,485,285 oz of gold have been produced. Annual production details are provided in Table 6-8.
Table 6-8 Island Gold Historical Production
| | | | | | | | | | | | | | |
Year | Tonnage (t) | Head Grade (g/t Au) | Gold Recovery (%) | Gold Produced (oz) |
2006 | 41,521 | 4.80 | 93.45 | 3,255 |
2007 | 159,493 | 6.02 | 94.36 | 29,281 |
2008 | 162,158 | 7.74 | 95.83 | 39,224 |
2009 | 223,345 | 5.85 | 94.52 | 39,794 |
2010 | 246,712 | 6.03 | 95.49 | 43,762 |
2011 | 255,103 | 6.05 | 95.91 | 49,443 |
2012 | 247,833 | 5.47 | 96.45 | 41,952 |
2013 | 239,766 | 4.57 | 96.06 | 34,691 |
2014 | 230,828 | 5.91 | 96.26 | 42,042 |
2015 | 242,137 | 7.31 | 96.75 | 52,835 |
2016 | 297,757 | 9.02 | 96.52 | 81,799 |
2017 | 338,603 | 9.36 | 96.82 | 97,932 |
2018 | 369,767 | 9.20 | 96.16 | 105,823 |
2019 | 401,276 | 11.85 | 97.05 | 150,355 |
2020 | 386,591 | 11.62 | 96.75 | 138,987 |
2021 | 435,297 | 10.35 | 96.01 | 141,209 |
2022 | 432,293 | 9.97 | 95.67 | 130,701 |
2023 | 439,008 | 9.48 | 97.30 | 131,394 |
2024 | 392,459 | 12.47 | 98.17 | 155,040 |
Total | 5,541,948 | 8.79 | 96.51 | 1,509,520 |
1.Bulk sample in 2006
2.20,983 oz produced prior to commercial production (October 2007)
At Magino, historical production up to 1992 totaled 803,362 t of ore, yielding 114,319 oz of gold at an average grade of 4.43 g/t gold. Magino mining operations resumed commercial production on November 1st, 2023, with production totaling approximately 108,307 oz of gold up to December 31st, 2024. Annual production details since 2022 are summarized in Table 6-9.
Table 6-9 Magino Historical Production (2022+)
| | | | | | | | | | | | | | |
Year | Tonnage (t) | Head Grade (g/t Au) | Gold Recovery (%) | Gold Produced (oz) |
2023 | 1,505,615 | 0.85 | 87.4 | 32,948 |
2024 | 2,587,761 | 0.95 | 94.4 | 75,359 |
Total | 4,093,376 | 0.91 | 90.4 | 108,307 |
| | | | | |
Island Gold District – NI 43-101 Technical Report August 6, 2025 | 67
|
7 GEOLOGICAL SETTING AND MINERALIZATION
7.1 Regional Geology
The Island Gold and Magino deposits are located in the Michipicoten Greenstone Belt (MGB) which is part of the Wawa Subprovince within the Archean Superior Province (Figure 7-1). The belt is east-west striking with an approximate length of 140 km and a maximum width of 40 km (Sage, et al., 1996a,b).
| | | | | |
Legend of active or past producing mines:
1 = Island Gold District (Island Gold Mine & Magino Mine) 2 = Mishi & Magnacon Mines 3 = Eagle River Mine 4 = Jubilee – Surluga – Minto Mines) |
5 = Forge Lake Mine 6 = Cline & Edwards Mine 7 = Renabie Mine |
•Map of western part of the Wawa Subprovince,, after Campos et. Al ( 2024). •Simplified regional geologic map of the Wawa Subprovince, compiled after William et al. (1991), Sage (1994), Stott et al. (2010), and Ontario Geological Survey (2011). •Inset shows map position within the Superior Province, modified after Montsion et al. (2018). •Map coordinates in NAD83 UTM zone 16N
|
Figure 7-1 Michipicoten Greenstone Belt
Source: Alamos (2025)
| | | | | |
Island Gold District – NI 43-101 Technical Report August 6, 2025 | 68
|
The MGB volcanic stratigraphy comprises three bimodal volcanic cycles with lower mafic and upper felsic sequences that are cut by syn-volcanic intrusions. The three volcanic cycles are separated by chemical sedimentary rocks, including Algoma-type iron formations (Sage, 1994). Rocks vary in age from 2,889 million years before present (Ma) for the Hawk Assemblage (Cycle I) to 2,750 Ma for the Wawa Assemblage (Cycle II), and to 2,700 Ma for the Catfish Assemblage (Cycle III) (Sage, 1994). However, recent mapping and geochronological work suggests that volcanism may be more continuous than previously interpreted (Vice et al. 2022 and Mole et al. 2021). The volcanic cycles are unconformably overlain by the Doré sedimentary rocks, a turbiditic sequence interpreted as the youngest supracrustal rocks in the MGB (Sage, 1994). Matachewan diabase dykes, lamprophyre dykes, as well as late- to post-tectonic alkalic to calc-alkalic intrusions and Proterozoic carbonatites intrude the folded and metamorphosed MGB supracrustal rocks (Sage, 1994).
The supracrustal rocks of the MGB have been repeatedly deformed and affected by regional greenschist to amphibolite-facies metamorphism (Sage, 1994). Early structures include major F1 recumbent folds, thrusts and associated cleavages. These early structures are refolded and crenulated by tight to isoclinal upright F2 folds with a steep penetrative regional S2 cleavage (Arias and Helmstaedt, 1990; Corfu and Sage, 1992; Sage, 1994). The latest structures include northeast-trending shear zones that host auriferous vein systems (Heather, 1989) and northerly-trending sinistral faults.
A regional northeast-trending deformation zone called the Goudreau Lake Deformation Zone (GLDZ) is situated in the Island Gold and Magino deposit areas, at the interface of the Wawa and Catfish Assemblage cycles. The GLDZ has been traced along strike for 30 km with a width of 4.5 km and is believed to be the main control of gold mineralization for the Island Gold and Magino deposits. It is a high angle, oblique-slip, fault zone with an overall dextral movement cutting stratigraphy at a shallow angle. The Island Gold and Magino gold deposits occur as a sequence of stacked east-northeast striking, steeply dipping, and subparallel zones of gold mineralization within the GLDZ.
7.2 Property Geology
The Island Gold and Magino deposits are located along the northern limb of the Goudreau Anticline in the GLDZ (Heather and Arias, 1992; Sage, 1993a,b). The Goudreau Anticline is an east-northeast trending regional synformal anticlinorium which is subparallel to the long axis of the MGB (Heather and Arias, 1992; Sage, 1994). The GLDZ hosts several current and past-producing gold mines, including the Magino, Island Gold, Kremzar, Cline, Edwards and Murphy mines. The GLDZ is characterized as an intensification of the steep east-northeast striking regional S2 foliation (Arias and Helmstaedt, 1990; Heather and Arias, 1992).
The GLDZ has been described as a series of narrow brittle and brittle-ductile high strain zones exhibiting dextral oblique-slip displacement (Heather and Arias, 1992). These strain zones show intense strain between rocks of different competencies or rheology. There are at least four deformation periods which reflect several periods of folding and faulting (Jellicoe, 2019). The first regional compressional event (D1) developed the S1 cleavage and large F1 folds. North-side-up trans-compression (D2) resulted in the development of the S2 foliation and the GLDZ which are subparallel to each other. Several regional northwesterly trending faults crosscut all rock types and show sinistral movement throughout the MGB.
The supracrustal rocks underlying the Island Gold and Magino properties are characteristic of Wawa Assemblage (Cycle II) and Catfish Assemblage (Cycle III) (2,750 - 2,700 Ma). The property is underlain by primarily mafic-felsic volcanics and mafic-intermediate intrusions with a smaller proportion of metasediments and porphyritic, synvolcanic felsic to intermediate intrusions (see Figure 7-2). Younger, late to post-tectonic, alkalic dykes associated with the Herman Lake Stock and the Matachewan-type diabase dykes account for the remaining rock types.
| | | | | |
Island Gold District – NI 43-101 Technical Report August 6, 2025 | 69
|
Figure 7-2 Geological Map of the Island Gold and Magino Mine Area
Source: Alamos (2025)
The Island Gold deposit is stratigraphically positioned in the upper portion of the Wawa Assemblage (Cycle II) sequence with lithologies dominated by felsic to intermediate volcanic and intrusive rocks. These Cycle II rocks are capped to the north by the Goudreau Iron Range which separates the Cycle II and Cycle III rocks. The felsic to intermediate and mafic metavolcanics are classified as a bimodal calc-alkaline dacite to rhyodacite and iron-rich tholeiitic basalts, respectively. Basaltic rocks consist of massive to pillow flows with volcaniclastics, with fine to medium grained, sub-volcanic hypabyssal gabbro. The unaltered felsic to intermediate metavolcanics are predominantly dacitic tuffaceous fragmental.
The WLS lies to the north of the Island Gold deposit (Figure 7-2) and is host to the Magino deposit. The WLS is an east-northeast striking, north-dipping, elongate polyphase, granodiorite-tonalite-trondhjemite intrusion that can be traced over 2 km along the Goudreau Lake deformation zone. The WLS varies in width from approximately 250 m to the west to less than 50 m to the east (Sage, 1993). The WLS has a crystallization age of 2724.1 ± 4.3 Ma (Jellicoe et al., 2022) and intrudes Wawa Assemblage (Cycle II) felsic-intermediate volcanic rocks and the Catfish Assemblage (Cycle III) mafic-intermediate volcanic rocks (Heather and Arias, 1992; Sage, 1994; Haroldson, 2014). All supracrustal rocks at Island Gold and Magino are crosscut by northwest-to-northwest trending Matachewan diabase dykes
The Island Gold and Magino sequence of rocks are folded in an upright orientation with sub-vertical axial planes trending east-northeast and fold axes plunging very shallow to the east-northeast and southwest for Island Gold and Magino, respectively. The dominant northeast trending stratigraphy is cut by brittle-ductile east-northeast, northeast, and southeast faults, and an array of north-northwest brittle faults.
| | | | | |
Island Gold District – NI 43-101 Technical Report August 6, 2025 | 70
|
The past producing Kremzar Mine is located 2 km north of the Island Gold deposit and is stratigraphically positioned in the lower portion of the Catfish Assemblage, within a sequence of massive and pillowed magnesium and iron-rich tholeiitic flows. The mafic flows of the Catfish Assemblage face north and are cut by the Herman Lake alkalic intrusive complex and the Maskinonge Lake granodiorite stock (see Figure 7-2).
The past producing Cline and Edwards mines are located 7 km northeast of the Island Gold deposit (see Figure 7-2). The property is underlain predominantly by massive, pillowed and amygdaloidal mafic volcanics, with much lesser amounts of felsic dykes including quartz-feldspar porphyries, granodiorites, and quartz diorites. Thin bands of iron formation are encountered as well as late northwesterly trending diabase and east-southeast trending lamprophyre dykes. The Edwards-Cline Shear Zone is the dominant structural feature, strikes east-west across the entire property and dips moderately to the north.
7.3 Mineralization and Alteration
The Island Gold and Magino deposits are both considered Archean orogenic lode gold deposits. Both deposits occur within the GLDZ zone and are part of the same system; however, are hosted within different lithologies. Island Gold is a high-grade structurally hosted quartz-carbonate vein system hosted within felsic to intermediate volcanics and intrusives. Gold mineralization at Magino is primarily hosted within the altered granodioritic to tonalitic WLS.
7.3.1 Island Gold Mine
Gold mineralization within the Island Gold deposit generally falls into three styles as described by Jellicoe et al. (2022):
1)Folded, centimetre-scale, saccharoidal white to pale grey quartz veins, which host visible gold within the veins and along white mica-quartz-sulphide alteration selvages surrounding the veins;
2)Metre-wide bleached and deformed white mica-quartz-pyrite alteration zones; and
3)Barren to weakly mineralized north-trending quartz-tourmaline-carbonate veins which cut the other mineralization styles.
Alteration within the Island Gold deposit is characterized by the presence of silica, sulfides, white mica, biotite, and carbonate (Ciufo et al., 2018). Pyrite content ranges from 1% to 11% in disseminated form and less commonly as millimeter-scale discontinuous stringers. Pyrrhotite and chalcopyrite can be present but are uncommon. Alteration minerals which are not consistently associated with the ore body may include tourmaline, apatite, epidote, chloritoid and local garnets in the deeper levels. The alteration occurs primarily in linear south dipping envelopes which can pinch, swell, and vary in thickness between decimeter-scale to over 15 m in thickness. There appears to be a gradual change in alteration with depth as silicification becomes more dominant. The alteration envelopes are termed Alteration Package Island in mine geology nomenclature.
The alteration envelopes generally possess a strong degree of deformation. Structural elements such as a deposit-wide strong penetrative foliation, shear fabric, boudinaged structures, crenulation cleavage, mylonitization and smaller scale thrust faults are noted to be present throughout the Island Gold deposit.
Quartz veins commonly bear visible gold in the form of aggregates, disseminated fine grains or along chlorite-sericite slickensides within the veins (Jellicoe, 2019). Metallurgical studies indicate that free gold flakes are typically less than 25 microns (µm) in diameter. The quartz
| | | | | |
Island Gold District – NI 43-101 Technical Report August 6, 2025 | 71
|
veins host most of the gold, however, the surrounding altered rock within the zone can host gold mineralization. The degree of veining appears to change at depth, transitioning from a stringer style quartz-carbonate vein on millimeter-scales to larger scale veins which can be over 4 m in width.
7.3.2 Magino Mine
Gold mineralization at Magino is primarily hosted by the WLS, which intrudes mafic volcanic rocks. The WLS has been interpreted to be a granodiorite-tonalite-trondhjemite intrusion. The WLS is east northeast-striking and has a steep northerly dip. The mineralized zones in the intrusion contain 5 to 10% quartz-veining. The veins generally parallel the orientation of the WLS.
Carbonate, biotite, white mica, sulphidation and silica-flooded alteration associated with gold mineralization occurs primarily in linear south dipping envelopes which can pinch, swell, and vary in thickness between decimeter-scale to over 5 m in thickness. Gold is closely tied to the amount of silica flooding and veining, with most visible gold hosted in laminated, folded, and often boudinaged grey quartz veins, which are typically isolated and structurally controlled.
Mineralized zones are oriented either parallel to sub-parallel to the west-southwest-striking and steeply dipping regional S2 foliation at ~257/70°, with gold bearing veins and alteration zones generally subparallel to this fabric.
7.4 Island Gold Deposit
Most of the gold mineralization at the Island Gold deposit is hosted in multiple, stacked, south dipping lenses. The mineralized corridor expands from 50 m wide in the upper levels to over 150 m wide at depth. The main Zone’s dip varies from -50 degrees (°) to -90° south. Locally, north dip reversals occur but are not common. Instances of offset or folding are also observed. Around the 400 m Level there is a shallow dipping southern inflection of the mineralized zones. It is not yet clear if this inflection is related to a fault, a shear zone, or a fold. This inflection point is the division of what is locally referred to as the Upper Island Gold Mine and the Lower Island Gold Mine (Figure 7-3 and Figure 7-4).
| | | | | |
Island Gold District – NI 43-101 Technical Report August 6, 2025 | 72
|
Figure 7-3 Longitudinal View of Sectors and Mineral Resources and Mineral Reserves
Source: Alamos (2025)
| | | | | |
Island Gold District – NI 43-101 Technical Report August 6, 2025 | 73
|
Figure 7-4 Cross Section Showing the Inflection to the South of Mineralized Zones
Source: Alamos (2025)
7.4.1 Upper Island Gold Mine
Three main sectors are found in the Upper Island Gold Mine:
1)The Upper Island Gold Sector;
2)The Lochalsh Sector; and
3)The Goudreau Sector.
| | | | | |
Island Gold District – NI 43-101 Technical Report August 6, 2025 | 74
|
7.4.1.1 Upper Island Gold Sector
Five mineralized zones have been recognized in the Upper Island Gold Sector which include, from north to south, E2, E1E, D1, D, and C. The relationship between the different zones in their respective sectors can be complex, they pinch and swell, merge, and anastomose. The complexities of the zones are well documented by sill development and drilling. Most of the Upper Island Gold Sector has been mined out. This sector also includes part of what was formerly referred to as Extension 1. A diabase dyke crosscuts the mineralized zones, however there is no offset therefore both sides of the dyke are grouped into the same sector.
7.4.1.2 Lochalsh Sector
The Lochalsh Sector has a 450 m strike length between depths of 100 - 450 m below surface. The geology, mineralization, and alteration of the Lochalsh Sector are similar to the Upper Island Gold Sector. Four mineralized zones have been recognized in the Lochalsh Sector which include, from north to south, E2, E1E, D, and C.
Drilling between the Upper Island Gold Sector and Lochalsh Sector has shown that the zones reduce in thickness and in grade between the two sectors. Drilling at that same easting, lower in elevation, indicates economic mineralization in the area but at deeper levels that fall within the Lower Island Gold Sector as discussed below.
7.4.1.3 Goudreau Sector
The Goudreau Sector is situated between 15,600E and 15,900E approximately 200 m north of the main mine structure which hosts the other sectors. There are seven zones in the Goudreau Sector; GD2, GD3, GD6, GD7, and GD9 are vertical and GP2 and GP5 are horizontal. The vertical zones are stacked, steeply dipping to vertical mineralized lenses consisting of quartz-sericite-carbonate-pyrite alteration envelopes and contain high-grade gold in quartz veining.
GP2 and GP5 are interpreted to be very folded flat lying gently east dipping zones which may link the vertical zones. The majority of the gold comes from decametric gold-bearing quartz veins. Alteration surrounding these flat lying zones is limited to a maximum of 0.5 m surrounding the quartz vein or is altogether absent. These veins are hosted within volcanics or a quartz diorite intrusion which they crosscut. The horizontal nature of GP2 and GP5 have been confirmed by mining development.
7.4.2 Lower Island Gold Mine
Most of the current Mineral Resources and Mineral Reserves are within the Lower Island Gold Mine in:
1)The Lower Island Gold Sector; and
2)The Island East Gold Sector.
7.4.2.1 Lower Island Gold Sector
Sixteen mineralized zones have been recognized in the Lower Island Gold Sector, they are, from north to south, E1E, D, D1, C, B, G, GNW, G1, STH, NS1, NS2, H, CD1N, DN1, DN2 and DN3. A diabase dyke crosscuts the mineralized zones, however, there is no offset therefore both sides of the dyke are grouped into the same sector. It is bounded by a north-south trending vertical diabase dyke in the east and is open on the west.
| | | | | |
Island Gold District – NI 43-101 Technical Report August 6, 2025 | 75
|
The C Zone is the most laterally and vertically continuous of the sixteen mineralized zones of the Lower Island Sector. It contains by far the most Mineral Resources and Mineral Reserves in this sector and has been successfully mined since 2014. Other zones have been mined with some success but demonstrate significantly less lateral and vertical continuity. Within the Lower Island Gold Sector, only small portions of the other fifteen zones form part of the Mineral Reserves, with the remainder categorized as Inferred and Indicated Mineral Resources. The C Zone Mineral Reserve currently being mined below the 450 m level (450L) has a larger average width and a higher average grade than what was previously mined in the upper part of the mine.
Within the sector is a thick assemblage of intermediate volcanic and/or intrusive rocks (diorite/crystal tuff, lapilli tuff, ash tuff and possible flows) and often mineralized zones follow the contacts between these units. Mafic dykes/plutons emplaced pre-mineralization are found throughout the mine and can be mineralized but it is rare. Several later mafic dykes of a different composition are present, usually between 0.1 - 1 m wide and can conform to the stratigraphy and proliferate within the mineralized corridor. A diorite to monzodiorite dyke ranging from 0.3 - 2 m in width is observed in several locations in the mine and crosscuts the zone but does not seem to offset it.
7.4.2.2 Island Gold East Sector
Island Gold East Sector is composed of nine defined zones, the E1D and E1D1 to the north and the E1E to the south. The zones NTH, NTH1, NTH2, NTH3, NTH4 and NTH5 are on the footwall of the E1E Zone with limited lateral continuity and all at different azimuths and dips. The E1E Zone is open at depth and reaches as high as the 100L. On the western limit of this sector is a north-south trending vertical diabase dyke however, it is still open to the east. This sector is considered unique because the zone is offset approximately 10 - 30 m north from the Lower Island Gold Sector across the diabase dyke. The zone also has differing geological characteristics, such as zone width and grade, from the Lower Island Gold C Zone, which affirms the division. The E1E Zone in the Island Gold East Sector hosts the most Mineral Resources and Mineral Reserves at Island Gold and it is where most of the underground and surface diamond drilling is focused.
The extent of the E1E Zone is confirmed for ~ 1.2 km laterally. Above the 840L the economically viable areas of the E1E Zone are concentrated into narrow corridors that extend vertically but are rather short laterally. Below the 840L the zone opens to become more laterally extensive and continuous as can be seen by the Mineral Resource and Mineral Reserve block shapes (Figure 7-3).
Alteration in this sector is similar to elsewhere in the mine. Veining above the 840L remains at less than 1 m and more frequently centimetre to decimetre width. Below the 840L in the E1E Zone, the mineralized corridor increases in width and increases in the amount of visible gold, grade and quartz veining are observed.
7.4.3 North South Zones
In 2022, underground exploration encountered an economic gold zone with similar geologic characteristics to the northerly east-west trending C Zone but with an orthogonal orientation. The NS1 Zone has been delineated thus far to extend from the 560L down to the 980L for a current plunge of over 400 m and strike length of approximately 250 m. The NS1 Zone contains 210,502 t averaging 10.57 g/t gold for a total of 71,565 oz (all categories), including 25,205 oz of Proven and Probable Reserves at a grade of 10.14 g/t gold. In 2024, an additional north-south oriented mineralized zone, the NS2 Zone, was estimated at 67,681 t averaging 8.27 g/t gold for a total of 17,998 oz of Inferred Mineral Resource.
| | | | | |
Island Gold District – NI 43-101 Technical Report August 6, 2025 | 76
|
Both NS1 and NS 2 Zones are similar in geological and mineralogical character to most Island Gold deposit zones. They contain a variety of quartz vein styles which are hosted within a highly altered rock envelope of silicification, sulfidation, sericite and other accessory minerals. Quartz vein types include massive smoky grey, laminated style white, grey and whitish extensional on scale between centimetres and metres. Small millimetre scale veinlets from foliation parallel to irregular crack and seal may also be present.
7.5 Magino Deposit
The Magino deposit is situated within the WLS (Figure 7-5), a tonalite-trondhjemite intrusion that extends for over 2 km along the northern limb of the east northeast-trending F2 Goudreau anticline, located in the GLDZ (Heather and Arias, 1992; Sage, 1993). The WLS is a north-dipping, elongated, and deformed polyphase intrusion, ranging in width from around 250 m in the west to under 50 m near Island Gold in the east (Sage, 1993). It crystallized at approximately 2724.1 ± 4.3 Ma (Jellicoe, 2019) and intrudes into Wawa cycle II felsic to intermediate volcanic rocks, as well as the lower part of the Catfish cycle III mafic to intermediate volcanic sequence (Haroldson, 2014). While the upper felsic-intermediate volcanic rocks of Catfish cycle III date to about 2700 Ma (Turek et al., 1992). Gold mineralization is hosted in a series of northeast to east-west oriented, steeply north dipping corridors of mineralization. The gold mineralized zones, from north to south, include the Elbow, Central, Scotland, 42 Zone and South Zones (Figure 7-6).
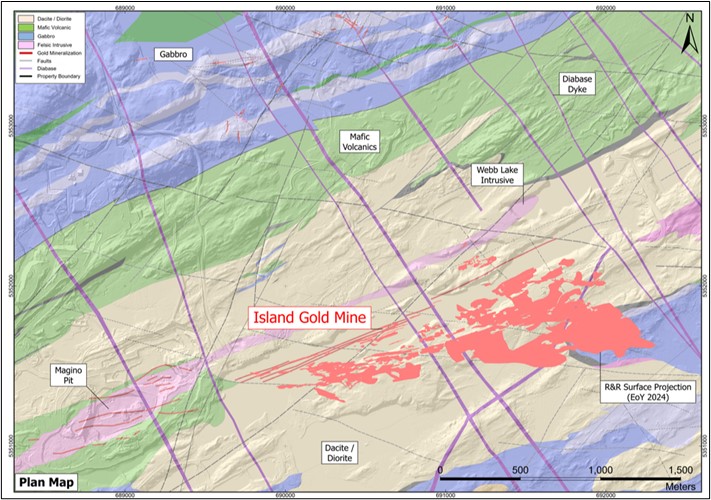
Figure 7-5 Island Gold and Magino Gold Zones Projected to Surface with Bedrock Geology.
Source: Alamos (2025)
| | | | | |
Island Gold District – NI 43-101 Technical Report August 6, 2025 | 77
|
Figure 7-6 Magino Deposit Mineralized Zones with Bedrock Geology
Source: Alamos (2025)
7.5.1 Elbow Zone
The Elbow Zone is situated along the northern contact of the WLS and extends over 1 km, striking northeast and dipping from 70 - 80° to the northwest. Mineralization is typically controlled by brittle to ductile deformation zones formed at the contacts of intermediate volcanics and/or tonalite-trondhjemite rocks.
Gold mineralization predominantly occurs in boudinaged millimetre to centimetre scale grey granular quartz-carbonate veins, which include minor fine pyrite disseminations and occasional visible gold. Additionally, trace to minor pyrrhotite and chalcopyrite disseminations are noted in the wallrock within this zone. Trace to minor amount of molybdenite has also been observed in grey granular quartz veining in the eastern limit of this zone. Alteration in the area is marked by moderate to strong sericitization, with possible silicification. Minor traces of scheelite have been noted as well in the eastern part from 2023 to 2024 drilling.
The lower portion of the Elbow Zone remains open at depth. Ongoing exploration aims to increase drill density and establish continuity of high-grade gold mineralization, potentially extending down to at least 1000 m.
7.5.2 Central Zone
The Central Zone is located approximately 50 -100 m south of the Elbow Zone. This zone strikes east-west with a steep north-northwest dip. The majority of the gold is hosted within foliated, bleached, and often silica-flooded granodiorite, with high gold grades in quartz veins occurring near or developing proximal to gabbro dykes. The alteration style is marked by strong sericite +/- silica envelopes within the granodiorite, ranging from 2 – 5 m in width, with mineralization typically comprising disseminated pyrite +/- pyrrhotite. These envelopes also
| | | | | |
Island Gold District – NI 43-101 Technical Report August 6, 2025 | 78
|
show moderate to strong foliation and often correlate with zones of increased quartz veining and fine pyrite content.
Quartz-carbonate vein development, like that in the Elbow Zone, consists of grey granular veins varying from a few millimetres to 10 cm in width, containing pyrite with traces to minor amounts of chlorite, tourmaline, and sericite. The veins are massive to weakly laminated, can be undulating and boudinaged, and sometimes folded. Visible gold is typically found within or adjacent to grey veins. Near or within mafic dykes, quartz veining comprises milky white quartz-carbonate veins +/- chlorite-tourmaline, containing pyrite-pyrrhotite, and can be up to 1 m thick.
7.5.3 Scotland Zone
The Scotland Zone is situated approximately 50 m south of the Central Zone. The zone has been intersected in drilling from the eastern property boundary westward over a strike distance of more than 1500 m and remains open both at depth and to the west. It also shares a similar trend of 75 - 80° north-northwest with the Elbow and Central Zones.
The geology, mineralization, and alteration of the Scotland Zone are quite similar to those of the Central Zone. Gold mineralization is hosted within the foliated, bleached, and often sericite-silica altered granodiorite, which is crosscut by several mafic intrusives. The alteration envelopes in the granodiorite generally exhibit a strong degree of deformation, with a pronounced shear fabric and occasionally boudinaged structures.
In the Scotland Zone, high gold grades occur proximal to or at the contacts between the granodiorite and gabbro dykes, associated with grey granular quartz and tourmaline veining. Grey quartz veins are typically on the millimetre to centimetre scale, and quartz-tourmaline can exceed 0.5 – 1 m in thickness. Quartz veins commonly bear disseminated pyrite, with possible inclusions of pyrrhotite, scheelite and molybdenite (east side). Fine visible gold disseminations are often noted in grey granular veins, and free gold appears as aggregates in tourmaline veining.
The lower portion of the Scotland Zone remains open along strike and at depth.
7.5.4 42 Zone
The 42 Zone is located approximately 30 – 70 m south of the Scottland Zone. Generally, the zone follows the same east-west trend as the Central and Scottland Zones, however, it becomes shallower and dips from 40 - 65° north-northeast at the eastern limit of the Magino property, close to the southern volcanics contact.
Gold is hosted within the granodiorite, which contains grey granular veins and is later crosscut by quartz-tourmaline veining. Mafic intrusives, less than 5 m thick, crosscut the 42 Zone in some areas on both the east and west sides.
Alteration style is generally characterized by narrow (0.5 – 5 m) strong envelopes of sericite-silica in moderately to highly strained granodiorite. There is a gradual change in the degree of alteration and shearing in some areas distant to mafic intrusives.
Grey granular veins are millimetre to centimetre in width with fine pyrite disseminations. Traces of molybdenite are often noted in strongly sheared zones on the eastern portion of Magino. Quartz-tourmaline veins with pyrite +/- pyrrhotite range from 0.1 - 0.5 m and are sometimes notable with a silica-albite alteration halo. Occasional visible gold is often noted in granular veins within the strongly sheared zones. Gold can also be associated with fine pyrite disseminations in alteration envelopes, but generally only at low-grade level
| | | | | |
Island Gold District – NI 43-101 Technical Report August 6, 2025 | 79
|
7.5.5 South Zone
The South Zone is located 300 m south of the Elbow Zone. The zone follows the southern contact of the WLS (granodiorite rocks) and volcanic rocks. This zone contains two parallel vein systems within a structural corridor with poorly defined widths. The orientation of these mineralized trends approximates the trend of a nearby aplite dyke. The zone appears to transect eastward into the volcanic rock package for an apparent strike length of 1.5 km to the eastern property boundary. Mineralization beyond the tonalite-trondhjemite contact is weak and discontinuous, and no specific trend could be followed.
7.6 Historic or Past-Producing Mines
There are several historic gold producers on the District property (Figure 7-7). These include the Kremzar Mine (Finan Township), the Cline and Edwards Mines (Jacobson Township), Emily Bay Mine (Riggs Township), and the Murphy Mine (Abotossaway Township). Advanced stage gold prospects include the Markes and Vega Zone (Riggs Township) and the Ego Mine prospect (Abotossaway Township). There is also a history of iron mining on the District properties, most notably on the Goudreau Iron Range (Augonie Township).
Figure 7-7 Island Gold District Property with Producing, Past Producing and Select Gold Prospects
Source: Alamos (2025)
7.6.1 Kremzar Mine
The Kremzar deposit (Figure 7-7) occurs 1,200 m to the north of the GLDZ on a northwest-trending fault structure at 120° azimuth that dips at -75° to the southwest in what has previously been termed the northern splay of the GLDZ on the mine property. The Kremzar Mine, which was in production from 1988 to 1990, produced 306,000 t at a grade of 4.8 g/t gold, totaling 47,000 oz.
| | | | | |
Island Gold District – NI 43-101 Technical Report August 6, 2025 | 80
|
The alteration style of the Kremzar deposit is characterized by strong envelopes of biotite, carbonate, and silica in widths from 1 - 3 m. Mineralization within the envelopes ranges generally from 2 - 5% disseminated pyrite/pyrrhotite. Quartz carbonate vein development is present as grey blueish siliceous bands, sinuous lenses and broad pervasive silicification. The siliceous bands can also extend into the footwall and hanging wall. Fourteen other historic mineralized zones occur along this trend developing at or near the southern contact of an east-west trending gabbroic sill. Drilling in 2016 indicated that gold extends at deeper levels below the Kremzar Mine as a zone grading 9.71 g/t gold over 8 m was intersected in drillhole KZ-16-02 approximately 600 m below surface.
7.6.2 Cline Mine
The Cline Mine is located approximately 2 km northeast of Island Gold’s eastern boundary and is northeast of the Edwards Mine (Figure 7-7). The Cline Mine deposit comprises a series of steeply dipping quartz veins that are hosted by highly carbonated and silicified sheared granodiorite, felsic porphyry, and intermediate volcanic rocks. Deformation is related to splays developing off the east-west trending Edwards-Cline shear. The gold bearing zone has been identified along a strike length of 150 m and to vertical depths exceeding 200 m.
Gold bearing mineralization was discovered on the Cline property in 1918 by J.P. Cline just south of Cline Lake, through prospecting and trenching. Thereafter, up to 1928, Cline Canadian GML conducted underground exploration through three exploration shafts, situated on three sub-parallel, 100 - 110° trending, auriferous fault zones. A new orebody, the A-Zone ore shoot, was discovered and consequently mined by Cline Lake GML and O’Brien GML between 1938 and 1942. A total of 369,539 t @ 6.67 g/t gold (79,231 oz) was mined, mainly from the A-Zone ore shoot. Over 4,500 m of drilling in more than 70 surface diamond drillholes were completed during this period as well.
Between 1959 and 1968, Pick Mines Ltd. conducted various exploration programs, including 33 diamond drillholes totaling 2,708 m, mainly on the Pick No 3 Zone. A relatively quiet period of exploration then followed, until the 1980s, when Noranda Exploration Company Ltd. optioned the property and drilled 89 diamond drillholes between 1986 and 1990 for a total of 15,179 m. These drill programs led to the discovery of several ore shoots, including the Lake 88-60 Alteration Zone; numerous other targets were tested as well. Win Eldrich Mines Ltd. optioned the property in 1998 and tested the Lake 88-60 Alteration Zone with eight diamond drillholes, for a total of 1,400 m. Between 2005 and 2008, Cline Mining Corporation drilled 60 diamond drillholes for a total of 20,106 m, testing various zones including the Lake 88-60 Alteration Zone.
Trillium Mining Corporation completed a 20 drillhole, 5,021 m drill program in 2020 testing the extensions of known occurrences on the Cline/Edwards property. This encompasses the last exploration work completed prior to Alamos acquisition of the property.
Since 2021, Alamos’ exploration efforts have focused on comprehensive data compilation, airborne geophysics, glacial till and soil surveys and diamond drilling in proximity to the past producing Cline Mine.
7.6.3 Edwards Mine
The Edwards Mine property is located to the northeast of Island Gold’s eastern boundary (Figure 7-7). The property was originally staked in 1924 by Peter Edwards. During the pre-1920s to mid-1920s, Hollinger Gold Mines and McCormick & Prospectors conducted various exploration programs, including surface trenching, mapping, and sampling. In 1933 - 1934, Gold Lands Syndicate optioned the property and sunk an inclined shaft to a depth of 105 feet, with consequent underground development work through to 1937. In 1935, Edwards Gold Mines Ltd. acquired the property and deepened the shaft to 300 feet and erected a 75 ton per
| | | | | |
Island Gold District – NI 43-101 Technical Report August 6, 2025 | 81
|
day mill. During this period 1,573 tons of ore were milled producing 435 oz of gold (at a recovered grade of 0.31 oz/ton). Between 1939 and 1960 the property laid dormant, until staked by A. Paquette followed by several other company options, notably Shaynee Consolidated Mines Ltd. Shaynee Consolidated Mines Ltd. conducted 1,830 m of surface diamond drilling between 1962 and 1964, successfully intersecting the Edwards 1 - 3, Edwards West, and Shaynee Zones.
A relatively quiet period of exploration followed, until the mid 1980s, when Spirit Lake Exploration Limited drilled over 30,000 m in 167 diamond drillholes between 1986 and 1993. These holes successfully intersected the afore-mentioned zones and discovered and delineated numerous other zones, including the Porphyry and Carbonate Zones. In 1994, Spirit Lake Exploration Limited changed its name to VenCan Gold Corporation, who then conducted a diamond drilling program of 23 holes totaling 3,081 m, testing the previously discovered Plowman 1 - 3 Zones.
In late 1996, River Gold Mines Ltd. agreed to purchase the two leasehold mining claims comprising the Edwards Mine from VenCan Gold Corporation. From 1996 to 2001, River Gold Mines Ltd. exploited three zones on which Vencan Gold Corporation had concentrated its drilling. River Gold Mines Ltd. ramped down to a depth of 300 m. Production occurred between 1997 and 2001, with a total of 392,155 t @ 13.17 g/t gold (166,093 oz) being mined. In 1999, River Gold Mines Ltd. purchased VenCan Gold Corporation’s claims comprising the Edwards Mine and adjoining Plowman claim, and the leasing agreement was consequently terminated. In 2002, the Plowman claim became part of the historical two-claim Edwards Mine property. Strike Minerals Inc. acquired these claims and drilled 10,681 m in 41 diamond drillholes between 2002 and 2011, to test all known zones and explore for new zones.
In July 2001, River Gold Mines Ltd. closed the Edwards Mine and put it on care and maintenance. In July 2002, the Edwards Mine was sold to Strike Minerals Inc. Strike Minerals Inc. conducted more than 40,000 feet of drilling on the property that delineated several parallel auriferous quartz vein systems in addition to the vein systems mined in early 2000.
In 2012, Strike Minerals Inc. dewatered the mine to the 140L and did some development in the upper portion of the deposit. Development of the crosscut on the 60L intersected the Edwards #1 and Edwards #5 zones and Strike Minerals Inc. planned to continue development on the 60L past the Rusty Weathered Zone to the Plowman #1 and #3 Zones. On the 90L, Strike Minerals Inc. planned to develop the crosscut through the New North 2, New North 1, Edwards #1, Edwards #5, Rusty Weathered, Plowman #1 and Plowman #3 Zones.
In March 2013, Strike Minerals Inc. announced sampling results from the first lift on the Edwards #1 Zone above the 60L. The lift created approximately 225 tonnes of mineralized material. Muck samples at 8 foot intervals from the first lift returned an average grade of 38.98 g/t gold over a 1.5 m width for a length of 24 m. Chip samples taken across the back after removal of the first lift returned a weighted average grade of 15.39 g/t gold over 1.5 m for a length of 24 m. Initial back sampling of the Edwards #1 Zone on the 60L returned a weighted average grade of 25.45 g/t gold over 1.5 m for a length of 21 m.
Since 2021, Alamos’ exploration efforts have focused on comprehensive data compilation, airborne geophysics, glacial till and soil surveys and diamond drilling in proximity to the past producing Edwards Mine.
7.6.4 Murphy Mine
The Murphy Gold Mine is located 6 km southwest of the town of Goudreau in Abotossaway Township (Figure 7-7). The Murphy Gold Mine operated sporadically between 1922 and 1940, during which 2,450 oz of gold and 351 oz of silver (Ag) were produced from 23,211 t with an
| | | | | |
Island Gold District – NI 43-101 Technical Report August 6, 2025 | 82
|
average grade of 0.11 oz/t (Heather and Arias, 1992). Gold is hosted in a subvertical, quartz filled, brecciated shear zone hosted in mafic to intermediate volcanic rocks and felsic dykes considered to be apophyses of the trondhjemitic Gutcher Lake Stock in the western domain of the GLDZ (Cavey et al., 1988; Heather and Arias, 1992; Archibald, 2004). Wall rock adjacent to the vein system is characterized by intense Fe-carbonate alteration, with strong to intense white mica and silica alteration in felsic dykes (Cavey et al., 1988; Heather and Arias, 1992). Gold mineralization is associated with pyrrhotite, pyrite, and trace chalcopyrite and is discontinuous throughout the mineralized vein system, which has an average width of 1 - 3 m (Cavey et al., 1988). Highlights from diamond drilling conducted between 1986 and 2004 include intersections grading up to 0.287 oz/t over 8.5 m, 2.09 oz/t over 1.8 m, and 0.228 oz/t over 1.2 m (Cavey et al., 1988; Archibald, 2004).
7.6.5 Emily Bay Mine
The historic Emily Bay Mine is in the Riggs Township (Figure 7-7). Development in the area constitutes several mechanically dug trenches, shafts and adits from the early 1900’s and diamond drilling by Algoma steel in the 1940’s and Canamax in the 1980’s. No reliable historic gold production figures are available.
7.6.6 Ego Mine
The Ego Mine Au-Cu property is in Abotossaway Township approximately 2.5 km north-northwest of the Murphy Mine on the eastern side of Mall Lake north of the Gutcher Lake Stock (Figure 7-7). A tightly folded oxide to sulphide facies iron formation marker horizon within a sequence of mafic to felsic volcanic tuffs, flows, and sediments is closely associated with gold and copper mineralization in the area (Kallio, 2003; MacMillan, 2012). Mineralization occurs primarily within 60 m of the northern contact of the Gutcher Lake Stock and consists of sulphide-filled fractures, lenses of sulphidized iron formation, and quartz veins up to 3 m wide within strongly sheared white mica, Fe-carbonate, and silica altered rocks surrounding the marker iron formation where it intersects with east-west trending quartz porphyry dykes (Sage, 1993a; Kallio, 2003; Edgar, 2007; MacMillan, 2012). A non-NI 43-101 compliant Inferred Mineral Resource based on 36 diamond drillhole intersections on the main mineralized zone on the Ego Mine property calculated in 1989 was 163,610 tons, grading 0.106 oz/ton (Tindale, 1988). These “Mineral Resources” are historical in nature and should not be relied upon. Additionally, assumptions used to determine cut-off grades are likely to have changed since the estimate was done. Consequently, these “Mineral Resources” cannot be considered as current. They are included in this section for illustrative purposes only and should not be disclosed out of context.
7.6.7 Goudreau Iron Range
The Goudreau Iron Range, consisting of the Bear, Rand No 1, A-Pit, C-Pit, and the C-Pit Extension, are located between the Magino Mine and the former Town of Goudreau in Aguonie Township. Historic mine pits are all hosted by the Goudreau Iron Range, consisting of an iron formation that has typically been thickened by tight isoclinal folding located at the contact between Cycle I intermediate to felsic volcanic and Cycle II intermediate to mafic volcanic rocks (Sage, 1993b). The iron formation consists of granular chert grading downward into sulphide facies (pyrite), which further grades downward into carbonate (calcite) facies at the stratigraphic bottom (Sage, 1993b). Between 1914 and 1920, 313,074 tons of pyrite ore grading from between 30 - 35% sulphur and 40 - 42% iron were mined from the C-Pit. Mining of pyrite ore from the Goudreau area was also conducted between 1958 and 1963, where a total of 942,000 tons of pyrite ore were mined from the Bear, Rand No 1, A-Pit, C-Pit and C-Pit Extension (Sage, 1993b). Gold was not a primary focus of exploration on the Goudreau Iron Range until Prodigy began surface exploration in 2022, but trace gold was noted while exploring for iron (Sage, 1993b)
| | | | | |
Island Gold District – NI 43-101 Technical Report August 6, 2025 | 83
|
7.6.8 Markes Prospects
The Markes prospects include the Markes, Markes “B” and Markes “A” Zones. These are respectively located ~2.5 km, 4.3 km and 6.3 km east of the Edwards Mine (Figure 7-7) and are situated within the same structural domain as the past-producing Cline and Edwards gold mines. The Markes prospects have been subject to extensive exploration including geochemistry, geophysics, stripping, drilling and test pitting.
7.7 Other Gold Zones
Several other gold zones and showings occur throughout the property area (see Figure 7-2), mainly north of Island Gold where multiple mineralized zones have been identified north of the WLS. These zones are north dipping shear zones that strike parallel to the mine trend. They are interpreted to be within the north limb of a deposit scale antiform, which accounts for the change in dip. Exploration in this northern area conducted by Patricia from 1997 to 2004 and the area received new attention by the Island Gold Exploration and Regional Exploration teams in recent years. North of the Island Gold deposit was a focus for Regional Exploration drilling from 2021 - 2024.
7.7.1 Portal Zone
Near surface, Island Gold’s ramp intersects a series of east-west-striking quartz-ankerite veins called the Portal Zone. Locally, these veins assayed up to 20 g/t gold over 1 m and averaged 4.0 g/t gold over 11 m in ramp wall samples. A series of four short holes totaling 1,227 m were drilled along strike to the east and west of the ramp portal without extending the zone.
7.7.2 Portage Showing
The Portage Showing occurs along the Bearpaw Lake portage and consists of a series of quartz veins which occur within a deformed feldspar porphyry. Quartz veins were located along the stream bed as well as in nearby trenches dating back to the 1920’s and 1930’s. Grab samples have averaged 2.3 g/t gold in past sampling. Limited shallow drilling to the north and northeast of the zone under Pine Lake encountered only weak alteration structures and negligible gold values. Canamax drilling encountered gold in the immediate area. Drillhole 061-02-23 east of north Bearpaw Lake intersected 95.9 g/t gold over 1.4 m, drillhole 061-03-24 intersected 9.9 g/t gold over 0.6 m north of Pine Lake in Jacobson Township and drillhole 061-02-66 intersected 1.7 g/t gold over 0.7 m.
7.7.3 North Shear
The North Shear Zone is located along the northern contact of the WLS and has been traced over a 1 km strike length. The North Shear structure is marked by a broad brittle to ductile deformation zone which dips from 75 - 80° north. The zone contains quartz-tourmaline stringer veining and stockwork quartz which occurs within highly strained and crenulated felsic volcanic and WLS host rocks. Alteration is characterized by strong silicification, sericitization and pyritization. The gold mineralization is hosted in chlorite-quartz-tourmaline stringer and stockwork veining containing visible gold, minor pyrite, and trace chalcopyrite. Mineralized zones can be up to 50 m wide in places, grading 0.5 - 1.0 g/t gold. In 2005, the 140L vent drift development cut through the North Shear. The shear is observed dipping 65 - 70° north and is believed to follow the contact between the WLS and a massive feldspar porphyry unit. Recent drilling has confirmed the presence of a wide low grade mineralized zone and extended it to ~450 m below surface. Higher grade structures exist near both the north and southern contact of the wider zone, but drilling has not established significant continuity.
| | | | | |
Island Gold District – NI 43-101 Technical Report August 6, 2025 | 84
|
In 2004, the Kallio Inferred Mineral Resource estimate of the North Shear zone is stated as 229,000 t at 6.57 g/t gold totaling 48,429 oz (at a 5 g/t gold cut-off) in the NI 43-101 RPA Technical Report on the Island Deposit (RPA, 2004). These “Mineral Resources” are historical in nature and should not be relied upon. Additionally, assumptions used to determine cut-off grades are likely to have changed since the estimate was done. Consequently, these “Mineral Resources” cannot be considered as current. They are included in this section for illustrative purposes only and should not be disclosed out of context.
7.7.4 Zone 21
In April 1997, Patricia intersected a series of gold-bearing, quartz veins in drillhole PL-21 at a vertical depth of 250 m. The intersection averaged 52.2 g/t gold over 19 m with erratically distributed values and visible gold within a strongly deformed feldspar porphyry. Drilling in 2021 and Q1-2022 determined the mineralized zone comprised a single narrow 10 - 20 cm smoky quartz vein, with frequent visible gold identified ~20 m into the hanging wall of the Northern Shear. Multiple intercepts returned more than 100 g/t gold over 0.3 m. The vein has demonstrated strike continuity for ~100 m and approximately 60 m vertical continuity.
7.7.5 Pine Zone and Breccia Zone
The Pine Zone and the Breccia Zone are located north-east of Bearpaw Lake in Jacobson Township and immediately east and adjacent to the Maskinonge Lake Fault. The Maskinonge Lake Fault is a major structure trending north to northwest at an azimuth of 320˚ and has a geophysical inferred sinistral strike slip movement of over a kilometer.
The Pine Zone is a folded sulphide-oxide iron formation which is part of the Goudreau Iron Range. It contains gold proximal to the Maskinonge Lake Fault. The Breccia Zone is a silicic fault breccia to quartz stockwork zone which crosscuts the stratigraphy at right angles and can be traced over several kilometres along the Maskinonge Lake Fault.
7.7.6 Lone Ranger (Indian Lake) Target
Alamos’ geologists mapped the Lone Ranger showings and surrounding area in 2021. From these programs a 1.83 g/t gold sample was collected. It was hosted in a shear zone, 140 m along strike of historical stripping. Channel sampling was completed in 2022 to verify incomplete historical results from Pele Gold Inc. Grades from the 2022 channel sampling range up to 36.9 g/t gold over 0.55 m across a vein, but the vein pinches out over an 8 m strike. Channel sampling results indicated a mineralizing structure, but no mineralization trends were identified. The shear zone and the felsic dyke hosting mineralization has some continuity from the mapping but returned low assay values.
Two diamond drillholes were completed in 2023. Drilling intersected the intended target horizons hosted in predominantly basalt, gabbro and sheared felsic dyke which hosts the mineralization at Lone Ranger. The best mineralization was hosted in the sheared felsic dykes with the highest assay value returning 0.42 g/t gold over 0.46 m. Although the structure and geological observations reflect the zone at surface the drillhole mineralization unfortunately was sporadic and discontinuous.
7.7.7 Delta Anomaly Target
The Delta Anomaly was generated from a regional base-of-till survey completed using RC drilling. It was targeted with two drillholes in 2022 to determine the source of gold-in-till anomalism. The drillholes intercepted a mafic volcanic package intruded by diabase and felsic porphyritic dykes. The mafic volcanics are moderately to strongly sheared and are bleached and silicified with laminated quartz-carbonate veins. Mineralization is sparse and discontinuous
| | | | | |
Island Gold District – NI 43-101 Technical Report August 6, 2025 | 85
|
with grades ranging between 0.10 - 1.53 g/t gold. In 2023, three drillholes were drilled ~280 m in the up-ice direction from the 2022 drillholes. A high strain corridor was successful intercepted in the 2023 drill program with assays of up to 3.47 g/t gold.
7.8 Property Acquisition History
Alamos completed its corporate acquisition of Trillium Mining Corp. in 2020, which included 5,400 ha directly adjacent to, and along strike from the Island Gold deposit. The Trillium property consisted of two historic producing mines, the Edwards and Cline Mines and several advanced prospects including Markes and Vega (Figure 7-8). The historic mines along with several advanced prospects all lie within or adjacent to the well-defined GLDZ in the Jacobson and Riggs Townships.
Figure 7-8 Island Gold District Property Indicating Recent Acquisitions
Source: Alamos (2025)
In 2023 Alamos acquired Manitou Gold Inc. and its Goudreau property, approximately 40,000 ha adjacent to and along strike from Island Gold. The acquisition extended Alamos’ mineral tenure along strike to the east within the GLDZ and covers portions of the townships of Acton, Amik, Bird, Brackin, Bruyere, Challener, Copenace, Glasgow, Jacobson, Leeson, Meath, Rennie, Riggs, Stover, and West, within the MEM Sault Ste. Marie Mining Division (Figure 7-8). Several prospects have been explored by previous operators on the Goudreau property including the historic Emily Bay Gold Mine as well as gold occurrences such as Tracanelli, Mother's Day, Rock Star, Pileggi, and Stover prospects.
In 2024 Alamos completed the acquisition of the Argonaut Magino deposit and the adjacent properties. The acquisition added approximately 5,000 ha of property forming together with Island Gold the District, a property with a size of approximately 58,921 ha. In addition to the Magino deposit, several historic iron and gold occurrences are situated on the newly consolidated property. These include the past producing Murphy Mine and the Highland South property which hosts prospects known as Farquhar, Springbank, and Talisker.
| | | | | |
Island Gold District – NI 43-101 Technical Report August 6, 2025 | 86
|
8 DEPOSIT TYPES
The Island Gold and Magino deposits are both considered Archean orogenic lode gold deposits. Both deposits occur within the GLDZ and are part of the same system; however, they are hosted within different lithologies. Island Gold is a high-grade structurally hosted quartz-carbonate vein system hosted within felsic to intermediate volcanics, whereas gold mineralization at Magino occurs primarily within the tonalitic WLS with the first gold mineralizing event coincident with the emplacement of the stock, and the second later event associated with gold overprinting and remobilization during deformation within the GLDZ, a major regional brittle-ductile structure. The host terrane is a sequence of felsic to intermediate volcanic and intrusive rocks of the Wawa Assemblage which are in the greenschist to amphibolite metamorphic range as is common for this type of deposit.
High strain zones associated with the GLDZ have the tendency to develop at variable scales along lithologic unit contacts where complex geology and related competency contrasts can control stress patterns and facilitate shearing and the consequent development of dilatancy zones and concomitant quartz carbonate vein formation. It is generally accepted that these Archean orogenic lode gold deposits are related to compressional and transpressional tectonics and the associated metamorphic dewatering and devolatization of magma processes from which the gold bearing fluids are derived.
Gold mineralization in the Goudreau-Lochalsh area is not restricted to any rock type with the general exception of the late intruding north-west trending Matachewan diabase dykes which show no evidence of mineralization. Deposits may be hosted by one or several rock types, with past-producing mines and numerous other gold occurrences in the area exhibiting a close spatial association with felsic, intermediate, and even mafic intrusive rocks. East of the District, in Jacobson Township, the past producing Edwards and Cline Lake gold mines are associated with felsic intrusive complexes and dykes. Magino is hosted by the WLS, a trondhjemite intrusive. The past producing Kremzar Mine, located on the Island Gold property, is hosted by a regional gabbroic sill.
Mineralization in the Goudreau Camp occurs along a 30 km strike length of the GLDZ which transects the District area in a roughly east-west direction. The GLDZ is a major regional deformation structure, and it is believed to be the main control on gold mineralization for the area. The GLDZ and subsidiary splays have been subdivided into four structural domains (Southern, Northern, Eastern and Western) based on the style of deformation, lineation patterns, and the orientation and sense of shear displacement on sets of shear zones. Island Gold mineralized zones are within the Southern domain of the GLDZ (Heather and Arias 1992). Most mineralization in this domain is hosted by quartz veining and/or shear zones with an orientation of 75°. The zones with this orientation are roughly parallel with the overall deformation zone and are considered to have formed along shear planes related to the dextral oblique slip movement of the GLDZ and are potentially localized near fold hinges and intersecting oblique structures.
Typical alteration mineralogy associated with gold deposits of the Goudreau Camp includes variable amounts of carbonatization (Fe-carbonate ± calcite), silicification, sulphidization, biotitization, sericitization, feldspathization, and chloritization. Deposits and gold occurrences with a felsic rock association are generally associated with a quartz-sericite-pyrite ± pyrrhotite alteration package. Deposits and occurrences hosted by mafic host rocks, such as the Kremzar Mine and the historic showings along this trend are generally altered to biotite, Fe-carbonate, pyrrhotite ± pyrite, quartz, and minor K-feldspar. Chloritization is common throughout the belt. Gold presence in the Goudreau-Lochalsh area is primarily associated with quartz stringers, fracture fillings and veins. Gold can be associated with pyrite disseminated in alteration envelopes but generally only in low grade levels.
| | | | | |
Island Gold District – NI 43-101 Technical Report August 6, 2025 | 87
|
9 EXPLORATION
9.1 Introduction
From 2021 to 2024 Alamos, as part of its Regional Exploration programs, conducted various exploration programs on its Island Gold properties, which includes the former Trillium property acquired from Trillium Mining Corp. (2020) and its’ Goudreau property acquired from Manitou Gold Inc. (2023). The properties described above, in addition to the 2024 acquisition of the Argonaut Magino properties, collectively are now referred to as the District. Alamos began actively exploring both the Trillium and Goudreau properties in 2023. The objectives were to discover new gold mineralization and to evaluate and advance exploration targets outside the main Island Gold area. Programs conducted during the 2021 - 2024 period, include field mapping, till and soil surveys, trenching, channel sampling, relogging, diamond and RC drilling, airborne surveys, and historic data compilation. Table 9-1is a summary of drilled metres and samples collected during this period.
Table 9-1 Summary of Regional Exploration Drilled Metres and Surface Sampling
| | | | | | | | | | | | | | | | | |
| 2021 | 2022 | 2023 | 2024 | Total |
| Drilling |
| Surface DDH (m) | 10,955 | 9,860 | 8,442 | 10,330 | 39,587 |
No Holes | 14 | 13 | 44 | 35 | 106 |
| Surface RC (m) | - | 1,428 | - | - | 1,428 |
No Holes | - | 92 | - | - | 92 |
| TOTAL (m) | 10,955 | 11,288 | 8,442 | 10,330 | 41,015 |
| Surface Sampling |
| Rock Grabs | 526 | 451 | 17 | 917 | 1,911 |
| Channel Samples | | 1,224 | | | 1,224 |
| Soil Samples | | | 321 | | 321 |
| Till Samples | 340 | | 88 | 1125 | 1,553 |
| Remote Sensing |
| LiDAR (ha) | 32,982 | | | 116,020 | 149,002 |
•Data from 2021 to 2024
9.2 Island Gold Property
9.2.1 Drilling
During 2021 - 2022 regional exploration drilling focused on the 21 Zone and North Shear Zone (Figure 9-1) that are located north of Island Gold in a series of sub-parallel mineralized zones. Both the North Shear Zone and the 21 Zone, returned several gold values within a broad zone of low-grade mineralization in the WLS, adjacent to volcanic rocks. The gold mineralization is characterized by narrow-discontinuous grey veinlets with local anomalous visible gold.
During this period, drilling was also completed on the easterly extensions of the Island Gold deposit in areas called E1E, IGM East and IGM East Extension (Figure 9-1). Drilling the E1E Zone targets on the east and west side of the dyke was successful, each hole intersecting anomalous gold values but there was no lateral and depth continuity between these gold intercepts. The IGM East drilling comprised a series of step-outs from the best intercepts along the trend of the Island Gold mineralization below Pine Lake. The drillholes intercepted sparse gold mineralization and weak structure. The IGM East Extension intercepted a mineralized sulphide replacement zone and weakly mineralized structures.
| | | | | |
Island Gold District – NI 43-101 Technical Report August 6, 2025 | 88
|
Figure 9-1 Regional Exploration Diamond Drillhole Collars and Traces for 2021 – 2022 Period
Source: Alamos (2025)
Till surveys from 2020 and 2021 showed major gold dispersion trains abruptly terminating along an area under deltaic cover known as Strobus Lake (also known as Pine Lake). A base-of-till survey was designed to test beneath the cover using a RC drill. The program was comprised of ninety-two holes totalling 1,428 m (Figure 9-2). Results of the RC drilling led to the generation of the Delta Anomaly target, a gold-in-till anomaly, that was drill tested in 2022 and 2023.
In the 2023 - 2024 period, drilling targets included the North Shear, Pine Breccia and testing laterally and down-plunge of historically mined mineralized zones of the Cline, Edwards and Plowman (CEP) Mines, such as the 88-60 Zone, Carbonate Zone and Porphyry Zone (Edwards Mine) and the strike extensions of the past producing Cline and Pic mines (Figure 9-3). All 2023 drillholes targeting the 88-60 zone intersected mineralized shears with sulphidized quartz-carbonate veins. 2023 and 2024 drilling did not intersect significant gold mineralization at the Edwards Mine target horizons (the Carbonate and Porphyry Zones).
| | | | | |
Island Gold District – NI 43-101 Technical Report August 6, 2025 | 89
|
Figure 9-2 Reverse Circulation Drillhole Collars on the Delta Target
Source: Alamos (2025)
| | | | | |
Island Gold District – NI 43-101 Technical Report August 6, 2025 | 90
|
Figure 9-3 2023 Regional Exploration Diamond Drillhole Collars and Traces – CEP Area
Source: Alamos (2025)
2024 drilling at North Shear and Pine Breccia was designed to follow-up on historic intercepts and areas identified during the regional exploration drilling completed in 2021 and 2022. Gold mineralization at North Shear was intersected in narrow-discontinuous grey veinlets with local anomalous visible gold developed in a structural corridor within and adjacent to the north contact of the WLS. Gold mineralization at Pine Breccia was further delineated down-plunge of the 2023 high-grade plunges.
| | | | | |
Island Gold District – NI 43-101 Technical Report August 6, 2025 | 91
|
During 2024, regional exploration also targeted areas near the historic Pic Mine (Figure 9.4). The Pic Mine is located 500 m west northwest of the Cline Mine. Underground development, mining and exploration began in 1924 by Cline Canadian GML and continued sporadically until 1942.
Figure 9-4 2024 Regional Exploration Diamond Drillhole Collars and Traces – CEP & Pic Areas
Source: Alamos (2025)
9.2.2 Till and Soil Sampling
Between 2021 and 2024, Alamos developed a property wide till sampling program which focused on collecting 12-kilogram (kg) C-horizon samples to analyze for gold grains and other indicator minerals (Figure 9-5). In 2021 a detailed surficial geology interpretation was completed to determine the effectiveness of till sampling on the Island Gold property, before any sampling
| | | | | |
Island Gold District – NI 43-101 Technical Report August 6, 2025 | 92
|
was completed. The interpretation concluded that ~80% of the property can be effectively tested by till sampling. The report also determined the regional ice flow direction is between 200 - 215° and was the orientation used for interpretation of the data. The till survey was designed to delineate anomalous areas for targeted exploration in a large land package effectively and efficiently.
Figure 9-5 C-Horizon Till Samples Collected from 2021 – 2024
Source: Alamos (2025)
In early 2021, Alamos initiated the regional scale till sampling program focused on collecting gold grains and other indicator minerals. A detailed surficial geology interpretation was completed, and 340 samples were collected across the Island Gold and Cline-Edwards Mine areas. A follow-up program of 88 till samples and B-horizon soil samples was completed during 2023 to follow-up on the results from the 2021 to 2022 till program which outlined a dispersal train originating from the historic CEP mines.
In 2024 the surficial geology interpretation was expanded to include the recently acquired Goudreau (Manitou Gold Inc.) property. A reconnaissance till survey, on a 250 m by 1,000 m grid, was designed using the extended surficial geology interpretation. The helicopter-supported program began in late May 2024 and concluded in August 2024 with a total of 1,125 till samples collected for gold grain and indicator mineral analyses.
9.2.3 Mapping, Stripping and Channel Sampling
Early in 2021 the regional exploration department began a systematic prospecting and sampling program along the Maskinonge Lake Fault to identify areas of additional mineralization. Several high-grade samples were collected along the fault during this program. In the fall of 2021, the exploration team expanded an existing stripping at the Pine-Breccia target. Between 2021 and 2022 two campaigns of mapping and channel sampling took place at the Pine Breccia and Lone Ranger prospects. In 2024 mapping focused in the Bruyere Township on the historic Emily Bay Mine, Tracanelli and Midas occurrences. During the 2021 to 2024 period a total of 1,224 channel samples and 1,911 grab rock samples were collected.
| | | | | |
Island Gold District – NI 43-101 Technical Report August 6, 2025 | 93
|
9.2.4 Light Detection and Ranging Survey
Two phases of LiDAR survey have been completed on the property. In 2021 a total area of 32,982 ha was flown using fixed wing-based platforms. With the acquisition of the Trillium, Goudreau (Manitou Gold Inc.) and Magino (Argonaut) properties, Alamos in 2024 completed a LiDAR survey covering the District property, a total area of 116,020 ha was completed (see Figure 9-6).
Figure 9-6 LiDAR Surveys of the Island Gold District Property
Source: Alamos (2025)
9.3 Magino Property
9.3.1 Mapping and Prospecting
Property scale line mapping and geological sampling was carried out at 100 m line spacing on the Aguonie, Selkirk Lake, Rand 2, Goudreau, Highland South, Highland South Rowan Lake, Murphy Lake, Magino West and East/South-East, and Doherty Lake Properties between 2020 and 2024. Approximately 157.95 line-kilometre of geological mapping, along north-south oriented traverses spaced 100 m apart, was completed across all properties. Known occurrences and targets identified during field mapping were followed up with prospectors. A total of 2,316 grab samples were collected during the mapping and prospecting campaigns (Figure 9-7).
| | | | | |
Island Gold District – NI 43-101 Technical Report August 6, 2025 | 94
|
Figure 9-7 2020 - 2024 Magino Property Mapping and Prospecting Grab Sample Locations
Source: Alamos (2025)
9.3.2 Trenching and Channel Sampling
Mechanized trenching, detailed geological mapping, and channel sampling programs were completed on the Magino, Rand 2, Murphy Lake, and Goudreau Properties both in 2020 and 2024 over favourable gold mineralized targets identified during the mapping and prospecting programs. Over 16,216 m2 of bedrock was exposed through mechanized stripping which preceded trench mapping and sampling (Figure 9-8).
Detailed mapping and channel sampling was completed on existing and restored trenches (total 3,481 metres squared (m2)) near the Farquhar, Springbank, and Talisker occurrences on the Highland South Property in 2021. A total of 1,299 channel samples were collected from the 119 channels for a total of 901.18 m. Additionally, 98 channel grab and 134 grab samples were collected from all trench areas.
Based on geological mapping and prospecting conducted between 2020 and 2023, along with historical exploration and mining data, trenching programs were initiated to confirm surface assay results, investigate mineralized zones, and map geological structures.
Results from the trenching programs indicate that elevated gold mineralization is associated with quartz veins hosted within moderately to strongly ductile deformation zones, often near lithological contacts and accompanied by sulphide mineralization. In some areas, sulphide-rich iron formations contain grades exceeding 1 g/t gold. The grades ranged from below detection to 29.2 g/t gold. A summary of the channel sampling is listed in Table 9-2.
| | | | | |
Island Gold District – NI 43-101 Technical Report August 6, 2025 | 95
|
Figure 9-8 2020 – 2024 Magino Property – Trench Locations
Source: Alamos (2025)
Table 9-2 Summary of Magino Channel Samples Collected 2020 – 2024
| | | | | | | | | | | |
| Parameters | Year | Total | Sample Length (m) |
| Channel samples collected | 2020 | 123 | 95.1 |
| Channel samples collected | 2021 | 288 | 134.54 |
| Channel samples collected | 2022 | - | - |
| Channel samples collected | 2023 | 755 | 579.32 |
| Channel samples collected | 2024 | 133 | 92.22 |
| Total | | 1,299 | 901.18 |
9.3.3 Humus and Soil Sampling Surveys
Humus (O-horizon) and soil (B-horizon) sampling was carried out by Prodigy regional exploration personnel on the Highland South Property in 2022 and 2023 (Figure 9-9). Orientation lines were conducted over known occurrences (Farquhar and Talisker) with 100 m line spacing and 12.5 - 25 m sample spacing to test the validity of the method. The known occurrences were reflected in the humus orientation survey, so the full grid was completed. A total of 796 humus and soil samples were collected.
| | | | | |
Island Gold District – NI 43-101 Technical Report August 6, 2025 | 96
|
Figure 9-9 Magino Property - 2022-2023 Humus and Soil Sample Locations
Source: Alamos (2025)
An orientation humus survey was conducted on the Goudreau Property in 2022, collecting 20 humus samples. A follow-up survey consisting of 64 humus samples in two lines were collected in 2023. A summary of the humus and soil sampling is listed in Table 9-3.
Table 9-3 Summary of Humus and Soil Samples Collected on Magino Property 2022 – 2023
| | | | | | | | |
Parameters | Year | Total |
| Humus samples collected | 2022 | 359 |
| Soil samples collected | 2022 | 32 |
| Humus samples collected | 2023 | 489 |
| Total |
| 880 |
The 2023 program successfully identified multiple northwest-trending gold anomalies within the humus layer overlying the granodiorite of the Gutcher Lake Stock, located on the Highland South property. The highest recorded gold value there was 237 parts per billion (ppb). Gold concentrations of 5 ppb or higher are considered anomalous, while background levels are typically below 1 ppb, which is near the lower detection limit.
For the Goudreau Property, the results of the 2023 humus soil sampling program were somewhat inconclusive. The survey did not reveal any significant clustering of gold-in-humus anomalies across the Goudreau Stock. In areas where previous bedrock grab samples had returned mineralized gold values (>0.5 g/t Au), the corresponding humus samples yielded only moderate gold values, averaging between 6 and 10 ppb gold.
| | | | | |
Island Gold District – NI 43-101 Technical Report August 6, 2025 | 97
|
9.3.4 Regional Exploration Diamond Drilling
The 2022 and 2024 drilling programs were initiated to expand the gold inventory within the northern Rand 2 area and the Goudreau Stock, both located in the northeastern part of the Goudreau Properties (Figure 9-10). These programs were specifically designed to test gold mineralization at depth within historically known gold occurrences, guided by previous exploration results. In total, fourteen NQ-sized (47.6 mm core diameter) diamond drillholes were completed, for a combined total of 3,633 m of drilling. As a result, 3,456 half-split core samples were submitted for gold assay analysis.
Figure 9-10 Magino Property – Regional Exploration 2022 and 2024 Drillhole Collar Locations
Source: Alamos (2025)
In 2022, seven drillholes totaling 1,230 m targeted the Greasy Bear showing on the Rand 2 Property. In 2024, an additional seven holes totaling 2,403 m were drilled within the felsic–intermediate intrusive rocks of the Goudreau Stock.
Details of the drill programs by year and target area are summarized in Table 9-4. Highlights of the drill program results are presented in Table 9-5. True width has not been calculated, and intercept is reported as drilled length.
| | | | | |
Island Gold District – NI 43-101 Technical Report August 6, 2025 | 98
|
Table 9-4 Magino Property Summary of 2022 and 2024 Regional Exploration Drillholes
| | | | | | | | | | | | | | | | | | | | | | | | | | |
| Area | Year | Hole ID | Easting UTM | Northing UTM | Elev. (m) | Azimuth | Inclination (°) | Depth (m) |
| Rand 2 | 2022 | R2-22-01 | 682047 | 5347103 | 396 | 179 | -60 | 207 |
| Rand 2 | 2022 | R2-22-02 | 682142 | 5347179 | 395 | 180 | -45 | 252 |
| Rand 2 | 2022 | R2-22-03 | 682142 | 5347179 | 395 | 180 | -60 | 192 |
| Rand 2 | 2022 | R2-22-04 | 682177 | 5347161 | 395 | 179 | -45 | 99 |
| Rand 2 | 2022 | R2-22-05 | 682177 | 5347162 | 395 | 180 | -70 | 198 |
| Rand 2 | 2022 | R2-22-06 | 682246 | 5347191 | 396 | 180 | -45 | 108 |
| Rand 2 | 2022 | R2-22-07 | 682246 | 5347191 | 396 | 180 | -60 | 174 |
Subtotal | | 7 | | | | | | 1,230 |
| Goudreau | 2024 | GD24-001 | 5350484 | 687773 | 399 | 198 | -52 | 369 |
| Goudreau | 2024 | GD24-002 | 5350546 | 688055 | 394 | 152 | -47 | 360 |
| Goudreau | 2024 | GD24-003 | 5350397 | 687748 | 405 | 199 | -51 | 249 |
| Goudreau | 2024 | GD24-004 | 5350447 | 687519 | 396 | 154 | -47 | 450 |
| Goudreau | 2024 | GD24-005 | 5350440 | 687292 | 394 | 198 | -47 | 333 |
| Goudreau | 2024 | GD24-006 | 5350418 | 686994 | 391 | 198 | -47 | 402 |
| Goudreau | 2024 | GD24-007 | 5350441 | 687590 | 393 | 218 | -61 | 240 |
Subtotal | | 7 | | | | | | 2,403 |
Total | | 14 | | | | | | 3,633 |
Table 9-5 Magno Property – Regional Exploration - Highlights from Core Sample Assay Results
| | | | | | | | | | | | | | | | | |
| Area | Hole ID | From (m) | To (m) | Length (m) | Gold (g/t) |
| Rand 2 | R2-22-03 | 49.4 | 56.1 | 6.7 | 1.0 |
| Including | | 53.0 | 54.0 | 1.0 | 5.4 |
| Goudreau | GD24-001 | 349.8 | 356.2 | 6.5 | 1.1 |
| Including | | 355.0 | 356.2 | 1.2 | 6.9 |
| Goudreau | GD24-002 | 42.2 | 43.1 | 0.9 | 1.6 |
| Goudreau | GD24-002 | 79.0 | 80.0 | 1.0 | 1.5 |
| Goudreau | GD24-002 | 101.0 | 101.7 | 0.7 | 1.7 |
| Goudreau | GD24-002 | 99.9 | 101.7 | 1.7 | 1.3 |
| Goudreau | GD24-003 | 34.0 | 35.0 | 1.0 | 1.2 |
| Goudreau | GD24-003 | 53.0 | 54.9 | 1.9 | 2.0 |
| Including | | 54.0 | 54.9 | 0.9 | 3.7 |
| Goudreau | GD24-004 | 30.5 | 35.0 | 4.5 | 1.2 |
| Including | | 34.1 | 35.0 | 1.0 | 4.8 |
| Goudreau | GD24-004 | 81.6 | 84.0 | 2.4 | 5.1 |
| Including | | 82.3 | 82.8 | 0.5 | 15.6 |
| Including | | 82.8 | 83.3 | 0.5 | 4.4 |
| Goudreau | GD24-004 | 93.0 | 107.0 | 14.0 | 1.9 |
| Including | | 94.3 | 95.1 | 0.8 | 21.6 |
| | | | | |
Island Gold District – NI 43-101 Technical Report August 6, 2025 | 99
|
| | | | | | | | | | | | | | | | | |
| Area | Hole ID | From (m) | To (m) | Length (m) | Gold (g/t) |
| Goudreau | GD24-004 | 270.3 | 271.1 | 0.7 | 5.7 |
| Goudreau | GD24-005 | 165.3 | 166.2 | 1.0 | 3.2 |
| Goudreau | GD24-005 | 192.5 | 193.3 | 0.8 | 1.1 |
| Goudreau | GD24-006 | 183.8 | 184.6 | 0.9 | 3.2 |
| Goudreau | GD24-007 | 24.0 | 25.0 | 1.0 | 4.3 |
| Goudreau | GD24-007 | 72.0 | 74.0 | 2.0 | 2.2 |
| Including | | 72.0 | 73.2 | 1.2 | 3.7 |
| Goudreau | GD24-007 | 96.0 | 102.0 | 6.0 | 1.8 |
| Including | | 96.0 | 97.0 | 1.0 | 1.7 |
| Including | | 99.5 | 100.0 | 0.5 | 2.0 |
| Including | | 101.0 | 102.0 | 1.0 | 7.8 |
Gold grades reported > 1.0 g/t only
9.3.5 Drilling Program Results
The 2022 drilling program at the Greasy Bear gold showing yielded results that did not correlate well with previous surface exploration findings. Gold mineralization at depth was limited and mainly confined to quartz veins near narrow zones of intermediate to felsic intrusive rocks. Most assay results returned low gold values, with only a few intervals exceeding 0.3 g/t gold. The best result was 5.4 g/t gold over 1.0 m.
In contrast, the 2024 drilling program targeting the Goudreau Stock returned encouraging results, indicating continuity of gold mineralization at depth. All drillholes intersected elevated gold values above 1.0 g/t gold, with the highest assay reaching 21.6 g/t gold over 0.77 m. Gold mineralization was associated with quartz veining - both parallel to and crosscutting foliation - within ductile deformation zones in felsic to intermediate intrusive rocks. Mineralized intervals also exhibited increased sericitization and silicification, along with elevated sulphide content.
9.3.6 Historical Drillhole Relogging and Sampling Programs (2022, 2024)
The 2022 and 2024 historical drillhole relogging and sampling programs were initiated to verify previous geological interpretations - such as lithology, structure, alteration, and veining - and to resample historical core that was either unsampled or only selectively sampled. These efforts were undertaken to support modern exploration activities and improve the accuracy of geological modeling. Forty-seven historical drillholes totaling 4,320 m were relogged and resampled. Some drillholes contained missing core intervals, which were recorded as gaps in the logs. As a result, 2,553 half-split core samples were submitted for gold assay analysis. Core intervals that had been previously sampled were not resampled during the programs. A summary of the program details is provided in Table 9-6 and Figure 9-11.
Table 9-6 Magino Property - Summary of Historical Drillhole Relogging and Sampling Programs
| | | | | | | | | | | | | | | | | |
| Area | Year | DDH | Depth (m) | Total Sampled (m) | No. Samples |
| Highland South | 2022 | 22 | 2,345 | 998 | 1,038 |
| Highland South | 2024 | 25 | 1,975 | 1,352 | 1,515 |
Total | | 47 | 4,320 | 2,350 | 2,553 |
| | | | | |
Island Gold District – NI 43-101 Technical Report August 6, 2025 | 100
|
Figure 9-11 Magino Property – Historical Drillhole Core Relogging – Drillhole Collar Locations
Source: Alamos (2025)
The logging procedures followed the same protocols as the 2022 and 2024 drilling programs, including the collection of data on lithology, alteration, mineralization, veining, and deformation. The same sampling procedures, gold assay methods, and quality control protocols were also applied. Magnetic susceptibility and specific gravity measurements were not collected during these programs.
Gold assay values ranged from below the detection limit up to 107 g/t gold over 0.13 m. Highlights of assay results exceeding 1 g/t gold are presented in Table 9-7. The results confirmed the presence of gold mineralization at depth within two subparallel, northeast-trending gold-bearing structures.
Table 9-7 Highlights from Historical Core Sample Assay Results
| | | | | | | | | | | | | | | | | |
| Area | Hole ID | From (m) | To (m) | Length (m) | Gold (g/t) |
| Highland South | FQ-1 | 1.0 | 75.5 | 4.5 | 1.2 |
| Including | | 71.0 | 71.6 | 0.6 | 5.1 |
| Highland South | W-88-6 | 105.0 | 108.3 | 3.3 | 23.5 |
| Including | | 106.9 | 107.0 | 0.1 | 107.0 |
| | | 107.0 | 108.0 | 1.0 | 10.2 |
| Highland South | W-88-10 | 33.4 | 36.0 | 2.6 | 0.9 |
Including | | 35.0 | 36.0 | 1.0 | 2.7 |
| | | | | |
Island Gold District – NI 43-101 Technical Report August 6, 2025 | 101
|
| | | | | | | | | | | | | | | | | |
| Area | Hole ID | From (m) | To (m) | Length (m) | Gold (g/t) |
| Highland South | W-88-11 | 50.0 | 52.0 | 2.0 | 1.2 |
| Including | | 51.0 | 52.0 | 1.0 | 1.7 |
| Highland South | W-88-5 | 77.0 | 79.6 | 2.6 | 1.9 |
| Including | W-88-5 | 77.0 | 78.0 | 1.0 | 5.1 |
| Highland South | W-88-8 | 85.0 | 86.0 | 1.0 | 1.4 |
| Highland South | W-88-17 | 16.8 | 17.6 | 0.9 | 1.1 |
| Highland South | W-88-17 | 86.0 | 88.9 | 2.9 | 6.6 |
| Including | W-88-17 | 86.0 | 87.0 | 1.0 | 1.9 |
| | W-88-17 | 87.0 | 87.8 | 0.8 | 1.5 |
| | W-88-17 | 87.8 | 88.9 | 1.1 | 16.3 |
| Highland South | FDH06-28 | 171.7 | 172.4 | 0.7 | 2.2 |
•Gold reported at > 1.0 g/t
9.3.7 Geophysics
In 2022 - 2023, Prodigy commissioned Geotech to fly a helicopter-borne versatile time-domain electromagnetic, horizontal magnetic gradiometer and gamma-ray spectrometry geophysical survey over the western domain of the GLDZ, southwest of Magino. The total area covered was 92 km2 and the total survey line coverage was 1,004 line-km for the versatile time-domain electromagnetic and 1,000 line-km for the Radiometric Survey Figure 9-12.
Figure 9-12 Magino Property - 2023 Airborne Geophysics
Source: Alamos (2025)
| | | | | |
Island Gold District – NI 43-101 Technical Report August 6, 2025 | 102
|
The surveyed property was flown in a south to north (N-000°/ N-180°E azimuth) direction with traverse line spacing of 100 m. Tie lines were flown perpendicular to the traverse lines at a spacing of 1,000 m. Based on the geophysical results obtained, a number of electromagnetic, magnetic and radiometric anomalies of interest have been identified over the blocks. The results were provided without accompanying interpretation, structural or lineament analysis, or any modelling efforts.
In 2020, Exsics Exploration Ltd. was contracted by First Limited Exploration Ltd. to conduct a ground geophysical survey on the northern portion of the Rand 2 Property (Jackson Lake). The survey included a total field magnetic survey combined with a VLF electromagnetic survey, using the Terraplus GSM-19 system. The survey was conducted along north–south oriented grid lines spaced 50 m apart, with measurement stations every 25 m, totalling approximately 26 line-km. The magnetic survey identified several linear features interpreted as dykes and faults, trending southwest–northeast, northwest–southeast, and west–east. The VLF survey outlined a series of short conductor axis scattered across the northeastern section of the grid area but there does not appear to be any definite magnetic correlation with the zones. The majority of the VLF trends have been distorted and or faulted by the dyke like units and the main fault/shear zones.
In 2021, Simcoe Geoscience completed 2-dimensional alpha induced polarization - wireless time domain distributed induced polarization and ground magnetics surveys over the Highland South Property. A total of 19.23 line-km of data was collected along the 19 profiles running north-south with 25 m line spacing and 50 m station spacing.
In 2024, Abitibi Geophysics conducted 3-dimensional induced polarization surveys over two areas - the eastern and northern blocks - within the Highland South Property and the Murphy Lake Property. A ground magnetic survey was also completed over the Murphy block. The survey was conducted along north-south oriented grid lines spaced 50 m apart, covering the northern extent of the felsic-intermediate intrusive Gutcher Lake Stock, and its southern lithological contact located in the eastern part of the Highland South Property, and the entire Murphy Lake Property. Approximately 25 ha across both properties were surveyed. A total of 39,218 apparent resistivity and chargeability measurements were collected for this survey.
The survey identified three chargeability zones on the Murphy Lake Property and four zones across the Highland South grid areas. The anomalies at Highland South were classified as first-priority targets, while those at Murphy Lake were designated as second priority. Proposed drill targets and corresponding drillhole parameters were defined for each zone. Additionally, six magnetic trends were identified on the Murphy Lake Property. These trends are interpreted as being associated with lithological contacts, when some exhibit orientations that differ from the known local geology.
9.3.8 Remote Sensing
In 2023, Argonaut commissioned Eagle Mapping Ltd. to complete a LiDAR survey over the western domain of the GLDZ, southwest of Magino, totalling 49.7 km2.
| | | | | |
Island Gold District – NI 43-101 Technical Report August 6, 2025 | 103
|
10 DRILLING
10.1 Island Gold Mine
10.1.1 Methodology and Planning
Drillhole planning begins by marking targets on longitudinal sections of the targeted zone. Cross sections are used to confirm the positioning of the drill targets and the distance of planned drillholes from any existing infrastructure.
An optimal drilling pattern of 20 m by 20 m hole spacing is sought during the planning for definition drilling. In geologically complex areas, the pattern may be reduced to 10 m by 15 m. At surface, a spacing pattern of 50 m to 100 m is used for the first phase of exploration drilling in new sectors. For underground exploration drilling, a 40 m by 40 m drill pattern is applied.
Diamond drillholes are planned to intersect all known zones. The depth at which holes are stopped depends on confidence in the interpreted zone intersection; typically 20 - 50 m beyond the last mineralized zone for definition and delineation drilling, and at least 100 m for exploration drilling.
10.1.2 Drillhole Alignment
Beginning in August of 2020, underground drillholes were aligned to drifts using the Devico DeviAligner rig alignment system. The DeviAligner is a north-seeking gyro alignment system that records azimuth, inclination, and roll angle measurements. It is attached directly to the drill rod and provides the measurements to the driller. Prior to the use of the DeviAligner system, surveyors marked a back and foresight on drift walls using a Leica Total Station surveying instrument.
Some drillholes that collar from drifts are marked up with front and back sight locations by members of the production geology team or surveyors. These drillholes are typically relatively short ‘sill’ type holes that are intended for detailed definition drilling. Drillholes that are planned within drill bays are not required to have a front and back sight marked up. Surface drillhole locations are spotted and marked using a global positioning system (GPS), and drill alignment is performed with a compass or GPS. The alignment of holes is confirmed using an azimuth aligner system.
10.1.3 Collar Surveying
Island Gold employees use a Leica Global Positioning System to survey surface collar locations. Drillhole coordinates are recorded in the Island Gold Mine's local grid system, which is rotated 22° west from geographic north.
Underground drillhole locations are tagged, identified, and recorded by drilling contractors. This information is then provided to Island Gold surveyors after the drillholes are completed. The underground diamond drillhole collars are subsequently surveyed by Island Gold employees with a Leica Total Station. Geologists then record the collar information into the acQuire drillhole database.
10.1.4 Down-Hole Surveying
For underground diamond drillholes Multishot gyro down-hole survey measurements start at either 15 m or 21 m from the collar and are carried out at 30 m intervals thereafter, with a final measurement at the end of the hole. If the azimuth and dip are outside of a ±2° tolerance of the
| | | | | |
Island Gold District – NI 43-101 Technical Report August 6, 2025 | 104
|
requested values at the first gyro measurement, the hole is attempted again. Previously, Reflex down-hole survey tools were used with a tolerance of ±1.5°. All measurements are converted to the Island Gold Mine grid for entry into the acQuire database.
Surface exploration drillholes have employed both Reflex survey tools and gyroscopic instruments in past programs. Directional drilling has utilized a north-seeking Axis Champ gyro as well as a reference-type DeviGyro for downhole surveys. During directional drilling, where the core diameter is reduced to AQ size, a PeeWee magnetometer-based multishot survey tool is used to survey the steered sections of the hole. Downhole survey measurements in surface drillholes are typically taken at 30 m intervals. Upon hole completion, a multi-shot gyroscopic survey is conducted using a metre counter and time-based measurement system to improve accuracy.
10.1.5 Cementing of Drillholes
Underground diamond drillholes are cemented at the collar once they are completed or abandoned. Cementing of drillholes is recorded in the acQuire database. Generally, fifteen sticks of cement are used to cement a diamond drillhole collar, or to 9 m depth. If the hole has intersected water, then a grout pump is used to pump cement into the hole until the water stops.
Surface drillholes for the exploration directional drilling program are cemented from the bottom of the hole until 100 m above the expected zone. Many surface exploration holes which are not immediately adjacent to the mine are left uncemented to provide an option for re-entry if desired or to provide access for bore-hole geophysical surveys.
10.1.6 Drill Core Logging
Core logging is carried out by professional geologists or geologists-in-training under the supervision of a QP. Island Gold geologists enter core logging data into an acQuire database. The user interface of the acQuire system has been customized for Island Gold geologists’ use. The data entries follow a pre-established structure with consistent lithology codes and structural descriptions, creating uniformity in the geological description. With the acQuire logging program, mandatory data such as lithology, sample lengths, etc. are required fields that if not completed will alert the user and halt any further progress until the mandatory information is entered.
10.1.7 Geology and Analysis
Under the direct supervision of a QP, geologists prepare a detailed description of the drill core. A computerized log is created for each drillhole, including the following key information:
•Collar location;
•Downhole surveys;
•Rock quality designation (RQD);
•Major and minor lithological units;
•Texture and structure;
•Mineralization and alteration (mineralogy, thickness, type);
•Sample location; and
•Core photos.
| | | | | |
Island Gold District – NI 43-101 Technical Report August 6, 2025 | 105
|
The length and limits of core samples are defined by geological features, including geological units, alteration, mineralization, and structure. For surface exploration holes, sampled intervals are sawed in half along the core length, with one half retained as a reference sample. For holes drilled underground, approximately one in five is sawed in half, with the unsampled portion kept for reference. The remaining four holes are sampled as whole core, and any unsampled core is discarded.
Assay results are plotted on sections and level plans at the appropriate scale. Nomenclature and symbols for the geological units follow an in-house legend, adapted from the legend prepared by the Ministère de l’Énergie et des Ressources Naturelles du Québec. Horizontal and true thicknesses of drillhole intercepts (composites) are calculated in Datamine Studio software using a modeled representation of the ore zone. Composite grades and true thicknesses are then plotted on vertical longitudinal sections.
10.2 Magino Mine
10.2.1 Type and Extent of Drilling
Diamond drilling on the Magino Mine property was conducted in a number of phases by several companies from 1947 to 2013. By the end of December 2013, a total of 2,073 diamond drillholes (325,070m) had been completed on the property, including a number of underground drillholes completed during the period 1982 - 1991. The diamond drillholes that were drilled from surface and underground at the Magino mine are summarized in Table 10-1.
Table 10-1 Drilling Campaign by Year
| | | | | |
Island Gold District – NI 43-101 Technical Report August 6, 2025 | 106
|
Alamos currently utilizes only post-2006 drilling and assay data for Mineral Resource and Mineral Reserve estimates, as compiled by Argonaut and predecessor companies. The QP responsible for resource estimation was unable to verify drillhole assay information for drilling completed prior to 2006 and has elected to exclude that data from being used to estimate Mineral Resources. Work is ongoing towards verification of a portion of this historic dataset for potential use in future resource estimates. Close spaced RC grade control drilling assay information from 2021 to present is not used for the Mineral Resource grade estimation.
10.2.2 Drilling Procedures
Argonaut completed varying phases of drilling through the period 2013 - 2024. Drillhole depths ranged from 400 m to 1,420 m and was undertaken with NQ sized core.
10.2.3 Drillhole Alignment
Drillhole azimuths are generally directed towards the southeast (~160° azimuth), to drill as perpendicular to the dominant northeast trend of mineralization as possible and generally drilled at angles between 50 - 75°. The approximate average drillhole spacing within the reserve pit is 20 - 25 m, with average drillhole spacing increasing with depth below the Mineral Resource pit.
Collar alignment was completed using the Reflex TN-14, and the Devico DeviAlign system was used to align the drill rigs. Geologists are responsible for verifying the alignment in the field, ensuring that the orientation is within ±0.5° of the planned azimuth and dip. If the initial collar survey deviates by more than 3°, re-alignment is requested. Drill alignment data is uploaded to Devico DeviCloud and set as the active collar survey. Drillers access this alignment shot through mobile devices during down-hole survey collection. In cases where the collar alignment is missing or incomplete, the geologist may manually input the collar orientation using survey photos captured during the setup process.
Drillholes are typically planned based on desired separation at target depth utilizing the same drill pads where possible. Local infrastructure and development activities limited accessible pad locations. This resulted in intersection angles ranging from approximately 90 - 45°, depending on the depth of target and available pad locations. A more robust structural model was developed by using oriented core.
10.2.4 Collar Surveying
After completion of the drillhole, the collar is surveyed using high-precision GPS methods with up to 1 cm accuracy. Geologists then record the collar information in the drill tracking sheet and enter it into the acQuire drillhole database. Casings were then capped with a red metal cap, post and flag.
10.2.5 Down-Hole Surveying
Early drilling programs employed EZ Shot tools at 50 m intervals. This was later replaced with Devico DeviGyro down-hole survey instruments and survey intervals were shortened to 3 m intervals. Down-hole survey measurements are collected using Reflex multi-shot tools, beginning as soon as feasible after casing is complete to confirm that the collar setup remains intact. The frequency and pattern of surveys vary depending on the precision of the drilling target. Gyro surveys are completed more frequently, beginning at 15 - 100 m initially, then every 100 m to end-of-hole.
Survey data is reviewed to ensure alignment with rig collar orientation. Azimuth corrections are made as needed within DeviCloud. All measurements are exported and imported to the acQuire database.
| | | | | |
Island Gold District – NI 43-101 Technical Report August 6, 2025 | 107
|
10.2.6 Drill Core Logging
Core logging was conducted on all drill core recovered from Magino using standardized geological protocols. Logging captured lithology, alteration, veining, mineralization, and structural features where applicable. All geological and sampling data were entered and managed using the acQuire database system by qualified geologists.
All diamond drill core was transported to the Magino core shack, located approximately 1 km north of the town of Dubreuilville. In 2024, core processing operations including logging, photography, and sampling were transitioned to the Island Gold core shack to optimize logistics and improve infrastructure efficiency.
Drill core was boxed, covered, and sealed at the drill rig by the drilling crew prior to transport. Core was then moved to the logging and sampling facility by geologic staff. At all times, the core remained under the direct observation of geologic personnel or their contract drilling crew, ensuring full chain of custody from the drill site to the sampling facility.
Drill core was measured, reassembled, and checked for completeness. Core recovery was calculated by comparing the recovered length of core to the expected drilled interval between core blocks. RQD was measured over standard 3 m runs, in accordance with accepted industry guidelines, by summing the total length of intact core fragments greater than 10 cm in length. Both recovery and RQD data were recorded in the box ends and metre mark logs and entered into the database.
As of early 2025, orientation line marking was discontinued. Structural measurements based on oriented core are no longer collected as part of routine procedures at Magino.
High-resolution core photography was conducted using the Imago Capture X system. Both dry and wet photos were taken using standardized templates, capturing four boxes at a time. Photos included sample tags, meterage, and a reference board displaying hole ID, box numbers, and depth intervals. Images were automatically uploaded to the Imago cloud platform for centralized access, quality control, and integration into interpretation workflows.
Quality assurance and quality control (QA/QC) protocols included the routine insertion of certified reference materials (CRMs) and blank samples at regular intervals, typically every 10th sample. For intervals containing visible gold, a blank sample was inserted immediately afterward to monitor for potential contamination. All control samples were tagged, photographed, and tracked prior to laboratory submission.
Sampling intervals were typically 1 m in length but varied between 0.5 m and 1.5 m depending on geological contacts, veining, alteration intensity, and mineralization. Sampling boundaries were clearly marked on the core using red arrows to ensure consistent cutting and processing. Cut lines were defined by the logging geologist to split mineralized or structurally significant features. Any missing intervals due to core loss were recorded in the sample tracking sheet and documented with appropriate comments in acQuire database.
The core was then cut using core splitters, with half-core samples submitted for analysis. The remaining half-core was retained in long-term storage at the core storage facility adjacent to the processing building. In selected areas of the ongoing infill drilling campaign, where sufficient surrounding assay and geological data exist, whole core was submitted for analysis to reduce sample preparation lag time and accelerate turnaround of assay results.
| | | | | |
Island Gold District – NI 43-101 Technical Report August 6, 2025 | 108
|
10.3 QP Comments
The QP responsible for this section of the Report is of the opinion that the logged geological data, collar, and downhole survey data in the exploration and infill programs to be comparable to industry standards and suitable to support Mineral Resource estimation for Island Gold and Magino deposits.
| | | | | |
Island Gold District – NI 43-101 Technical Report August 6, 2025 | 109
|
11 SAMPLE PREPARATION, ANALYSIS, AND SECURITY
Island Gold and Magino have had historically different sample preparation, analysis and security policies and procedures. These are described in this Section.
As part of the integration of the two operations, these policies and procedures are under review with the objective of standardization of the policies and procedures within the District.
11.1 Island Gold Mine
The Mineral Resource estimate at Island Gold is supported by diamond drill core samples and underground channel samples. Other sample types, such as muck samples (rock fragments collected after an underground blast) and test holes (sludge from jack-leg drilling), assist in guiding production decisions but are not used in Mineral Resource estimates. The assays from these sample types are not discussed further in this report, as their results do not impact Mineral Resource estimates.
Until April 2021, diamond drilling samples were sent to Laboratoire Expert Inc. (LabExpert) located in Rouyn-Noranda, QC, with a small portion sent to the Wesdome Gold Mines Inc. laboratory (Wesdome) in Wawa, ON. Since April 2021, production and mine exploration diamond drilling samples have been predominantly sent to AGAT Laboratories Ltd. (“AGAT”) laboratories in Thunder Bay, ON. Drill core fire assay analysis has also been completed at Alamos’ Young-Davidson Mine assay laboratory (YD Lab) in Matachewan, ON, Activision Laboratories Ltd. (“Actlabs”) in Thunder Bay, ON, as well as ALS Canada Ltd. (ALS) in North Vancouver, BC. All production samples (chip, mucks, and test-holes) are sent exclusively to the Wesdome laboratory, excepting third party check assays. Sample volumes for 2024 are summarized in Table 11-1.
Table 11-1 Island Gold Mine – 2024 Sample Volumes
| | | | | | | | | | | | | | |
| Sample Type | ALS | Actlabs | AGAT | Wesdome |
| Drill core | 1,742 | 24,409 | 32,664 | - |
| Underground chips | - | - | - | 2,617 |
| Mucks | - | - | - | 10,347 |
| Test hole sludges | - | - | - | 1,419 |
11.1.1 Core Sampling and Collection
11.1.1.1 Drill Core Sampling
Intervals selected for sampling are determined by a geologist during core logging. Sampling is conducted over mineralized zones at regular intervals, with sample lengths typically ranging from 0.3 - 1.0 m. Where present, lithological boundaries, such as geological contacts or alteration zones, are used to constrain sample intervals. Sample locations are identified and marked on the core by the geologist during the logging process. Corresponding sample tags are inserted beneath the core within the core boxes at the end of each designated interval. Sample interval data, including sample numbers and associated quality control materials (standards and blanks), are manually recorded in the project database by Island Gold personnel.
Core recovery is considered excellent and is generally close to 100%. Minor occurrences of centimetre-scale fault gouge and blocky core are observed but are considered to have a negligible impact on the reliability of analytical results from drill core samples.
| | | | | |
Island Gold District – NI 43-101 Technical Report August 6, 2025 | 110
|
Core is cut lengthwise into halves by trained technicians using an electric core saw fitted with a diamond-impregnated blade. For all surface drillholes, underground directional drilling, and approximately 20% of the non-directional underground drillholes, one half of the core is submitted for analysis, and the remaining half is retained in the core box for future reference. For approximately 80% of underground drillholes, the entire core is submitted for analysis. Island Gold routinely inserts quality control samples and tracks sample shipments to the commercial laboratories.
11.1.1.2 Core Size
Most of the underground diamond drilling was completed using BQ-sized core, with a smaller proportion using NQ or AQTK core sizes. Surface diamond drilling is primarily completed using NQ-sized core, except during the steering phase of directional drilling, where AQTK-sized core is used.
11.1.1.3 Core Storage
The drill core is stored outdoors in covered racks or as separate cross-piles on the mine site. The reference portions of the drill core are stored and catalogued for future reference in the core library located at Island Gold.
11.1.2 Channel Sample Collection
The underground channel sampling method involves collecting horizontal, representative samples from the exposed ore zone, either from the drift face or adjacent walls. Samples, ranging from 0.3 - 1.0 m in length and weighing between 0.5 - 2.0 kg, are chipped using a rock hammer. The sampler records the location and lithology of each channel sample. Blanks are inserted after a sample containing potentially high-grade outlier material is collected, such as samples with visible gold, however, in general a blind commercial standard is included for every 25 samples. Channel sample lithologies and assay results are imported into the Island Gold database with the use of a custom-built graphical user interface within acQuire software. Once collected, channel samples are placed in plastic sample bags and securely sealed with zip ties prior to being shipped for analyses.
11.1.3 Laboratory Procedures
The primary analytical laboratory for drill core samples from Island Gold is AGAT. During the 2024 drilling program, a significant portion of core samples was also submitted to Actlabs, while a small volume of surface drill core samples was analysed by ALS. AGAT, Actlabs, and ALS are all independent, accredited analytical laboratories conforming to the requirements of the International Organization for Standardization (ISO) and the International Electrotechnical Commission (IEC) ISO/IEC 17025, as recognized by the Standards Council of Canada.
Prior to April 2021, most drill core samples were prepared and analyzed by LabExpert. In previous years, a limited number of definition drill core samples, along with all underground production samples, were analyzed at Wesdome. This laboratory also provides assay services for Wesdome’s Eagle River Mine. Between 2022 and 2023, approximately 19,900 samples were analyzed at Alamos’ YD Lab. The Wesdome and YD laboratories are not accredited facilities. A summary of the laboratories and their associated quality control procedures is provided in Table 11-2.
All laboratories referenced maintain internal quality control programs that include the routine insertion of reagent blanks, CRMs, and pulp duplicates. AGAT, Actlabs, and ALS routinely participate in international proficiency testing (round robin programs), monitor the preparation of
| | | | | |
Island Gold District – NI 43-101 Technical Report August 6, 2025 | 111
|
duplicate samples, and operate under quality management systems consistent with ISO/IEC 17025 accreditation.
Table 11-2 Summary of Preparation and Assay Methods Employed at the Island Gold Mine
| | | | | | | | | | | | | | | | | | | | |
| Method | LabExpert | Actlabs | Wesdome | AGAT | ALS | YD Lab |
| Crushing | 80% - 2 mm | 80% - 2 mm | Approx. 1/4 inch | 80% - 2 mm | 70% - 2mm | 80% - 2 mm |
| Splitting | 300 g | 250 g | 150 to 300 g | 300 g | 1000 g | 250 – 400 g |
| Pulverizing | 90% -200 mesh | 95% -105 µm | ~90% at 200 mesh (not measured) | 90% - 75 µm | 85% - 75 µm | 80% -110 mesh (135 µm) |
Gold by Fire Assay Sample Weight | 1 assay-ton (29.16 g) | 50 g | 30 g | 50 g | 50 g | 30 g |
| AA Finish | AA to 10 g/t; detection limit: 5 ppb | AA to 10 g/t; detection limit: 5 ppb | - | AA to 10 g/t; detection limit: 2 ppb | AA to 5 g/t; detection limit: 5 ppb | AA to 8 g/t; detection limit: 1 ppb |
| Gravimetric Finish | Gravimetric finish > 10 g/t Au* | Gravimetric finish >10 g/t Au | Gravimetric finish; detection limit 0.04 g/t Au | Gravimetric finish > 10 g/t Au | Gravimetric finish > 10 g/t Au | Gravimetric finish > 8 g/t Au |
| Internal Quality Control | Rigorous (>10%) | Rigorous (>10%; to ISO standards) | 5 to 10% (reliance on duplicates) | Rigorous (>10%; to ISO standards) | Rigorous (>10%; to ISO standards) | 10% from geology/lab STDs, 15% on checks (replicates/ certificate) |
•LabExpert prepared a second pulp of high-grade samples and assayed by fire assay with a gravimetric finish.
As is typical for on-site mining laboratories, Wesdome does not insert quality control materials with routine muck and test hole samples. Overall, the quality control protocols at Wesdome are less rigorous than those implemented by accredited commercial laboratories. In September 2019, both LabExpert and Wesdome were audited by Analytical Solutions Ltd. The audits involved a comprehensive review of laboratory procedures, policies, and methods, including on-site observations and discussions regarding the handling and processing of Island Gold samples. Analytical Solutions Ltd.’s audit of the Wesdome laboratory (Bloom & Jolette, 2019) identified some deficiencies in the assaying of samples with grades lower than 2.0 g/t gold. However, most samples sent to Wesdome are used for daily production decisions rather than for Mineral Resource and Mineral Reserve reporting. Given that the Mineral Reserve cut-off grades are 2.95 g/t gold for development areas and 3.78 g/t gold for production areas, any inaccuracies below 2.0 g/t gold are not considered material. Recommendations made by Analytical Solution Ltd. for both laboratories have since been implemented.
11.1.4 Security
Access to Island Gold is controlled by security personnel. Individual sample bags of drill core are sealed with zip ties. The samples are packed in labelled, sealed rice bags, which are then placed in collapsible bulk containers. Outgoing shipments of drill core are photographed by Company personnel before being transported by AGAT to their facility. Prior to 2024, the samples were shipped on pallets by transportation companies such as Manitoulin Transport Inc. or Gardewine Group Ltd. Underground channel and muck samples are sealed with red security tags and transported by Island Gold personnel to Wesdome. Extra red security tags are also
| | | | | |
Island Gold District – NI 43-101 Technical Report August 6, 2025 | 112
|
provided to the laboratory assaying mucks for returning any reject materials. Tag numbers are tracked in a spreadsheet. The assay laboratories provide a letter upon reception of the samples detailing the shipment they received.
11.1.5 Database Security
The acQuire databases, which store all drill core and channel sample logs, assays, and surveys, are securely maintained on Island Gold’s private network. Access is restricted to employees directly involved in the process, with security groups limiting everyone to only the necessary sections of the database. Access is granted exclusively by a supervisor in the Geology Department.
Sample intervals, sample numbers, and the insertion of quality control samples, including CRMs and blanks, are manually recorded in the database by geologists at Island Gold. Upon completion of analytical work, assay results are delivered by the laboratories via email in comma separated value (CSV) and portable document (PDF) formats to designated Island Gold personnel. These results are electronically uploaded into the project database using a custom in-house application, which automatically matches assay data to the corresponding sample numbers, thereby eliminating the need for manual data entry at this stage.
11.1.6 Internal Quality Assurance and Quality Control Program (QA/QC)
Alamos maintains an internal QA/QC program at Island Gold to validate analytical results from both diamond drill core and underground production chip samples. CRMs are sourced from OREAS North America Inc. and are inserted into the sample stream for both drill core and channel samples. Geologists are responsible for the random insertion of QA/QC materials, with two CRMs inserted per 50 samples. Crushed pink quartz is used as a blank material and is inserted at the same frequency. Prior to 2023, blank samples were typically prepared from washed and cleaned diabase dyke drill core collected from the property.
To mitigate the risk of cross-contamination from samples containing visible gold, a quartz blank is inserted immediately following any uninterrupted interval where visible gold is observed. Additionally, a minimum of one high-grade CRM is included within the sample sequence. This protocol is designed to reduce the potential for contamination of adjacent samples within the same batch.
All samples containing visible gold are clearly marked with flagging tape and are documented accordingly. These samples are also explicitly identified on the chain of custody documents, which accompany each shipment to the analytical laboratories. The chain of custody documents includes a comprehensive list of submitted samples and any specific assay instructions. The identification of visible gold bearing samples on the chain of custody forms notifies the laboratory to implement enhanced cleaning procedures for crushing, pulverizing, and splitting equipment to minimize risk of cross-contamination between samples.
In 2024, eleven CRMs were used in the QA/QC program, with certified gold values ranging from 0.54 - 42.96 g/t gold. These values reflect the expected mineralization range at Island Gold. The CRMs come from orogenic lode gold deposits with primary gold in a greenstone matrix, similar to the geology of the Island Gold mineralized zones.
QC criteria for the certified laboratories include a general acceptance threshold of 0.1 parts per million (ppm) gold for blank samples, and +/- 3 times the standard deviation from the expected mean value for CRMs. Any result outside this range is considered a failure and flagged for further investigation. Threshold for acceptance of assays from Wesdome includes 0.5 ppm gold for blank samples and for CRMs a 10% variation of the expected mean assay result. If an
| | | | | |
Island Gold District – NI 43-101 Technical Report August 6, 2025 | 113
|
assay result for a control sample exceeds these thresholds, the responsible geologist determines the appropriate course of action, which may include:
•Requesting a partial or full re-assay of the batch (either from pulps or rejects);
•Deferring the batch pending further investigation; or
•Accepting the batch as reported.
All QC-related decisions and actions are systematically documented within the database.
11.1.6.1 Certified Reference Materials (2024)
In 2024, approximately 1,911 CRMs were analyzed by AGAT, resulting in a 7.8% failure rate. The average observed values for the eleven different CRM grades ranged from 97.0% - 101% of the expected value (Table 11-3). The two highest-grade CRMs showed slightly higher variability, as indicated by their relative standard deviations. An outlier in CRM 235b, likely due to a mislabelling, contributed to its high observed standard deviation. Overall, the performance of the CRMs in the QA/QC program supports the accuracy and reliability of AGAT's analytical results, which are deemed suitable for the Mineral Resource and Mineral Reserve estimates provided in this Report. For all CRM failures, the corresponding pulp material was re-assayed and compared against the original result, along with typically ten surrounding samples from the same certificate. Only one assay result is accepted into the database, based on the judgment and investigation of the geologist responsible for the re-assay request.
Table 11-3 AGAT Reference Material Results 2024 – from DDH
| | | | | | | | | | | | | | | | | | | | | | | | | | | | | | | | | | | |
| Standard | Number of Samples | Expected Values | Observed Values for the Year |
Mean (g/t Au) | Standard Deviation (g/t Au) | 1 Relative Standard Dev. | Mean (g/t Au) | Standard Deviation (g/t Au) | 1 Relative Standard Dev. | Within 1 SD | Within 2 SD | Failure or ≥3 SD | Failure Pct |
| OREAS231 | 1 | 0.54 | - | - | 6.74 | 0.00 | 0.0% | - | - | 1 | - |
| OREAS235b | 372 | 1.63 | 0.053 | 3.3% | 1.65 | 0.41 | 24.8% | 219 | 326 | 31 | 8.3% |
| OREAS237 | 1 | 2.21 | 0.054 | 2.4% | 2.22 | 0.00 | 0.0% | 1 | 1 | 0 | 0.0% |
| OREAS239 | 5 | 3.55 | 0.086 | 2.4% | 3.45 | 0.10 | 3.0% | | 4 | 0 | 0.0% |
| OREAS239b | 184 | 3.61 | 0.110 | 3.0% | 3.53 | 0.20 | 5.7% | 74 | 142 | 2 | 1.1% |
| OREAS240 | 49 | 5.51 | 0.139 | 2.5% | 5.50 | 0.27 | 5.0% | 29 | 41 | 7 | 14.3% |
| OREAS240b | 216 | 5.65 | 0.143 | 2.5% | 5.51 | 0.19 | 3.4% | 91 | 166 | 14 | 6.5% |
| OREAS241 | 389 | 6.91 | 0.309 | 4.5% | 6.93 | 0.38 | 5.4% | 279 | 361 | 26 | 6.7% |
| OREAS228b | 1 | 8.57 | 0.199 | 2.3% | 8.54 | 0.00 | 0.0% | 1 | 1 | 0 | 0.0% |
| OREAS242 | 384 | 8.67 | 0.215 | 2.5% | 8.46 | 0.56 | 6.6% | 211 | 299 | 50 | 13.0% |
| OREAS243 | 309 | 12.39 | 0.306 | 2.5% | 12.29 | 1.02 | 8.3% | 191 | 289 | 18 | 5.8% |
In 2024, approximately 1,036 CRMs were analysed by Actlabs, resulting in a 4.2% failure rate. The average observed values for the eleven different CRM grades ranged from 99.0 - 103% of the expected value as shown in Table 11-4. No significant bias was observed with respect to CRM grade. As with AGAT, an outlier was observed with CRM 235b, which contributed to its elevated standard deviation. Overall, the analytical performance of the blind standards at Actlabs was slightly better than at AGAT in terms of failure rate, and the CRM performance in the QA/QC program confirms that Actlabs analytical results are accurate and reliable, supporting the Mineral Resource and Mineral Reserve estimates presented within this Report.
| | | | | |
Island Gold District – NI 43-101 Technical Report August 6, 2025 | 114
|
In 2024, approximately 90 CRMs were analysed by ALS, resulting in a 1.1% failure rate. The average observed values for the eleven different CRM grades ranged from 99.0 - 100% of the expected values (Table 11-5). No significant bias was observed with respect to CRM grade. Although results from ALS were not used in the Mineral Resource and Mineral Reserve estimates provided in this Report, the CRM performance within the QA/QC program confirms that ALS analytical results are accurate and reliable to support future Mineral Resource and Mineral Reserve estimates.
Table 11-4 Actlabs Reference Material Results 2024 - from DDH
| | | | | | | | | | | | | | | | | | | | | | | | | | | | | | | | | | | |
| Standard | Number of Samples | Expected Values | Observed Values for the year |
Mean (g/t Au) | Standard Deviation (g/t Au) | 1 Relative Standard Dev. | Mean (g/t Au) | Standard Deviation (g/t Au) | 1 Relative Standard Dev. | Within 1 SD | Within 2 SD | Failure or ≥3 SD | Failure Pct |
| OREAS235b | 151 | 1.63 | 0.053 | 3.3% | 1.68 | 0.344 | 20.5% | 102 | 140 | 4 | 2.6% |
| OREAS239b | 80 | 3.61 | 0.110 | 3.0% | 3.63 | 0.280 | 7.7% | 47 | 67 | 6 | 7.5% |
| OREAS240 | 85 | 5.51 | 0.139 | 2.5% | 5.56 | 0.117 | 2.1% | 61 | 82 | 0 | 0.0% |
| OREAS240b | 92 | 5.65 | 0.143 | 2.5% | 5.69 | 0.388 | 6.8% | 45 | 76 | 4 | 4.3% |
| OREAS241 | 189 | 6.91 | 0.309 | 4.5% | 7.00 | 0.495 | 7.1% | 154 | 183 | 6 | 3.2% |
| OREAS242 | 218 | 8.67 | 0.215 | 2.5% | 8.54 | 0.346 | 4.1% | 125 | 192 | 9 | 4.1% |
| OREAS243 | 221 | 12.39 | 0.306 | 2.5% | 12.34 | 1.161 | 9.4% | 135 | 201 | 14 | 6.3% |
Table 11-5 ALS Reference Material Results 2024 - from DDH
| | | | | | | | | | | | | | | | | | | | | | | | | | | | | | | | | | | |
| Standard | Number of Samples | Expected Values | Observed Values for the year |
Mean (g/t Au) | Standard Deviation (g/t Au) | 1 Relative Standard Dev. | Mean (g/t Au) | Standard Deviation (g/t Au) | 1 Relative Standard Dev. | Within 1 SD | Within 2 SD | Failure or ≥3 SD | Failure Pct |
| OREAS231 | 39 | 0.54 | 0.015 | 2.8% | 0.54 | 0.014 | 2.7% | 31 | 38 | 38 | 1 |
| OREAS235b | 40 | 1.63 | 0.053 | 3.3% | 1.64 | 0.035 | 2.1% | 34 | 40 | 40 | 0 |
| OREAS239 | 7 | 3.55 | 0.086 | 2.4% | 3.51 | 0.060 | 1.7% | 5 | 7 | 7 | 0 |
| OREAS229b | 4 | 11.95 | 0.288 | 2.4% | 11.90 | 0.154 | 1.3% | 4 | 4 | 4 | 0 |
In 2024, approximately 239 CRMs were analysed by Wesdome, resulting in a 3.8% failure rate. The average observed values for the eleven different CRM grades ranged from 98.0 - 103% of the expected value (Table 11-6). No significant bias was observed with respect to CRM grade. Overall, the CRM performance in the QA/QC program confirms that Wesdome analytical results are accurate and reliable, supporting the Mineral Resource and Mineral Reserve estimates presented in this Report.
| | | | | |
Island Gold District – NI 43-101 Technical Report August 6, 2025 | 115
|
Table 11-6 Wesdome Reference Material Results 2024 – From Chips
| | | | | | | | | | | | | | | | | | | | | | | | | | | | | |
| Standard | Number of Samples | Expected Values | Observed Values for the year |
Mean (g/t Au) | Standard Deviation (g/t Au) | 1 Relative Standard Dev. | Mean (g/t Au) | Standard Deviation (g/t Au) | 1 Relative Standard Dev. | Pass QC (10% of mean) | Fail QC (≥10% of mean) |
| OREAS240 | 53 | 5.51 | 0.139 | 2.52% | 5.61 | 0.20 | 3.48% | 51 | 2 |
| OREAS242 | 60 | 12.39 | 0.306 | 2.47% | 12.44 | 0.98 | 7.91% | 58 | 2 |
| OREAS243 | 13 | 8.85 | 1.219 | 13.78% | 8.85 | 1.22 | 13.78% | 11 | 2 |
| OREAS245 | 48 | 25.73 | 0.546 | 2.12% | 25.78 | 2.74 | 10.61% | 47 | 1 |
| OREAS247 | 64 | 42.96 | 0.900 | 2.09% | 42.30 | 2.70 | 6.39% | 62 | 2 |
11.1.6.2 Blanks
Field blanks made of barren, crushed pink quartz from a quarry operated by Sitec Amérique du Nord Inc. were included in the 2024 Island Gold drill program and underground channel sampling stream to monitor potential contamination during sample preparation and analysis. Blanks are inserted at a rate of 1 in 25 samples and are also inserted alongside groups or individual samples containing visible gold. Assay results exceeding a threshold of 0.5 g/t gold for Wesdome and 0.1 g/t gold for AGAT, Actlabs and ALS will trigger an investigation, and a re-assay from rejects is generally requested for that sample along with some or all the remaining assays in the certificate. The results, whether accepted or rejected, are recorded in the acQuire software, along with the reasoning for any actions taken. Failure rates among the various labs for 2024 is:
•AGAT tested 2,014 blanks and had a 3.0% failure rate;
•Actlabs tested 1,233 blanks and had a 1.0% failure rate;
•ALS tested 91 blanks and had a 0% failure; and
•Wesdome tested 345 blanks and had 40 assays that exceeded Island Gold’s QC threshold or a 11.6% failure rate.
All failures were requested to have their rejects re-assayed along with the rest of the assays in the certificate. Depending on the results of the re-assay certificate, usually either the original or re-assay results were accepted into the database. Wesdome has seen an increased performance in acceptance of blanks with respect to previous years.
The drill core blanks submitted to each laboratory are summarized in Table 11-7.
Table 11-7 Summary of 2024 Blank Performance
| | | | | | | | | | | | | | |
| Description | AGAT | Actlabs | ALS | Wesdome |
| Number of blank insertions | 2,014 | 1,233 | 91 | 345 |
| Maximum grade for failure | 0.1 g/t Au | 0.1 g/t Au | 0.1 g/t Au | 0.5 g/t Au |
| Number of failures | 60 | 12 | 0 | 40 |
| Percent of failures | 3.0% | 1.0% | 0% | 11.6% |
| Maximum value | 2.4 g/t Au | 0.29 g/t Au | 0.03 g/t Au | 2.63 g/t Au |
| | | | | |
Island Gold District – NI 43-101 Technical Report August 6, 2025 | 116
|
11.1.7 Laboratory Cross Check Sampling (Pulp Samples)
Island Gold has implemented a quality control system that compares assay results from primary laboratories with those from an ISO 17025-accredited secondary (umpire) laboratory. This QA/QC practice is designed to assess assay accuracy and detect any potential bias in the primary laboratory’s results.
From 2022 to end of 2024, a total of 2,978 pulp duplicates from drill core and 363 pulp duplicates from chip samples have been assayed at umpire laboratories. A breakdown by lab of the 2024 statistics is presented in Table 11-8. Scatterplots comparing the labs’ duplicate pulp sample assays versus the original assays are shown in Figure 11-1, Figure 11-2, and Figure 11-3. For a more simplified visual interpretation, the scale has been adjusted to the higher population of data.
Table 11-8 Statistics of Pulp Check Assays
| | | | | | | | | | | | | | | | | | | | |
| AGAT vs ActLabs | ActLabs vs ALS | Wesdome vs Actlabs |
| AGAT | ActLabs | ActLabs | ALS | Wesdome | ActLabs |
| Number of pairs | 468 | 59 | 65 |
| Minimum (g/t) | 0.003 | 0.003 | 0.008 | 0.008 | 0.070 | 0.006 |
| Maximum (g/t) | 1830 | 1910 | 565 | 552 | 619 | 666 |
| Mean (g/t) | 62.39 | 63.02 | 53.22 | 56.15 | 24.14 | 26.16 |
| Median (g/t) | 7.89 | 7.52 | 0.41 | 0.58 | 2.42 | 1.92 |
| Standard Deviation | 168.78 | 169.29 | 115.37 | 120.78 | 85.56 | 93.98 |
| Coefficient of Correlation | 0.99 | 1.00 | 1.00 |
Figure 11-1 AGAT (primary) vs Actlabs (umpire)
| | | | | |
Island Gold District – NI 43-101 Technical Report August 6, 2025 | 117
|
Source: Alamos (2025)
Figure 11-2 Wesdome (primary) vs Actlabs (umpire)
Source: Alamos (2025)
Figure 11-3 Actlabs (primary) vs ALS (umpire)
Source: Alamos (2025)
| | | | | |
Island Gold District – NI 43-101 Technical Report August 6, 2025 | 118
|
Results are reasonably distributed on both sides of the line of best fit. Globally, the statistics presented in Table 11-8 show no evidence of strong bias between laboratories. Wesdome sample assay results demonstrate a tendency for over-estimation compared to Actlabs, especially in the range of 0 - 4 ppm, likely influenced by the singular use of gravimetric finish (Figure 11-2). In general, the AGAT vs Actlabs and ALS vs Actlabs data show a strong correlation between each other. There is no significant discernable bias demonstrated by the assay results between the labs.
11.1.8 Core Duplicates
Until 2015, drill core duplicates were sent to LabExpert and Actlabs to be assayed. The audit conducted by Analytical Solutions Ltd. in November 2015 (Bloom, 2015), demonstrated that the core duplicates exhibit poorer reproducibility than the pulp duplicates. This data cannot be used to improve or monitor the sampling procedures or assay quality. The precision for core duplicates is within the expected range for the deposit style. Following the recommendation from the audit, Island Gold reviewed the assay quality control program and decided to no longer assay core duplicates.
11.1.9 Underground Muck Tracking
Internal tracking of broken rock material underground, whether ore or waste, is conducted using machine monitoring systems installed on haul trucks and coordinated by an underground dispatcher. This system ensures that all daily underground muck movements are accounted for. Regular stope inspections and interviews with muckers are conducted as follow-up. Assays and sample tags received are entered into an Access database, supporting daily production decisions.
11.1.10 QP Commentary
In 2024, Island Gold mine received over 61,000 gold assay results. The QP has reviewed the sample preparation, analytical, and security procedures, along with the insertion rates and performance of blanks, CRMs, and check assays for the mine’s drillhole samples. The observed failure rates are within expected industry ranges, and appropriate follow-up actions were taken where failures occurred. No significant assay biases were identified. In the QP’s opinion, the Island Gold sampling protocols and resulting assay data meet industry standards, and the database is suitable for use in the Mineral Resource estimation.
11.2 Magino Mine
This section describes the sample preparation, analysis, and security protocols for drilling programs at Magino conducted by Golden Goose (2006 - 2010), Prodigy (2010 - 2012), Argonaut (2013 - 2024), and Alamos (2024). Alamos retained the services of Qualitica Consulting Inc. (Qualitica) to conduct a comprehensive review and assessment of all post-2006 drillhole assays, which form the basis for current Mineral Resource estimation (Qualitica, 2025). Many of the details related to Magino sample preparation and analyses are excerpted from previous technical reports, as summarized in the most recent Argonaut Mineral Resource and Mineral Resource Update (IMC, 2022).
11.2.1 Core Handling Sampling & Security
Golden Goose, Prodigy and Argonaut conducted core logging, sampling, and secure storage onsite or at company facilities. Golden Goose split core using a core splitter while Prodigy, Argonaut, and Alamos sawed core in half. In all cases the company retained one half of the
| | | | | |
Island Gold District – NI 43-101 Technical Report August 6, 2025 | 119
|
core and submitted the other half for analysis. Sample shipments were shipped in secured bags and transported to laboratories via commercial carriers.
11.2.2 Laboratory Accreditation and Certification
Golden Goose submitted samples to ALS Chemex (2006) and Accurassay Laboratories Ltd. (Accurassay) (2007 – 2010). Prodigy submitted samples to Accurassay (2010), ALS Ltd. (ALS CHEMEX) (2010-2012), and ActLabs (2011 - 2012). Argonaut submitted samples to ActLabs (2013 - 2024), Bureau Veritas Canada Inc. (Bureau Veritas) (2016 - 2017), and MSALABS Inc. (MSA Labs) (2024). Alamos has continued to submit samples to ActLabs and MSA Labs. All utilized labs are ISO 17025-accredited facilities.
11.2.3 Laboratory Preparation, Assays and Measurements
Sample preparation and assay methods have been kept functionally consistent at each lab throughout the tenure of ownership at Magino. Sample preparation details by assay lab are presented in Table 11-9.
Table 11-9 Details of Sample Preparation and Assay Methods by Lab at Magino
| | | | | | | | | | | | | | | | | |
Procedure | ALS Chemex | Accurassay | ActLabs | Bureau Veritas | MSA Labs |
| Crushing | 70% Passing 2 mm | 90% passing -8 mesh | 90% passing -8 mesh | 90% passing 2 mm | 90% passing 2 mm |
| Splitting | Riffle split | Riffle split | Riffle split | Riffle split | Riffle split |
| Pulverizing | 1,000 grams to 85% passing 75 microns | 250-500 grams to 90% passing -150 mesh | 250-500 grams to 90% passing -150 mesh | 250 grams to 85% passing 75 microns | NA |
| Gold Assay | 30- or 50-gram fire assay with AAS finish and 0.005 g/t detection limit. | 30-gram fire assay with AAS finish and 0.005 g/t gold detection limit. | 30-gram fire assay with AAS finish and 0.005 g/t gold detection limit. | 50-gram fire assay with AAS finish and 0.005 g/t gold detection limit. | 450-gram Photon Assay and 0.015 gold detection limit. |
| Over Limit Gold Assay | 30- or 50-gram fire assay with gravimetric finish for over 10 g/t gold and 0.01 g/t detection limit. | 30-gram fire assay with gravimetric finish for over 10 g/t gold and 0.01 g/t detection limit. | 30-gram fire assay with gravimetric finish for over 3 g/t gold and 0.01 g/t detection limit. | For samples with an initial result over 5 g/t, done on 1,000-gram sample. | NA |
Screen Metallics
(Argonaut & Alamos Gold) | NA | NA | For over limit result over 10 g/t. Done on 500gram samples | For over limit results over 10 g/t. Done on 1,000-gram sample. | NA |
11.2.4 Quality Assurance & Quality Control
QA/QC procedures for the three relevant ownership eras of Magino are summarized below. Only select charts are shown for brevity.
| | | | | |
Island Gold District – NI 43-101 Technical Report August 6, 2025 | 120
|
11.2.4.1 Golden Goose (2006 - 2010)
Quality control measures during this period included blank materials, core duplicates, and check assays.
In 2006, 211 blanks were inserted, with a failure rate below 2% (Figure 11-4). Between 2009 and 2010, blank materials submitted to Accurassay showed no failures (Figure 11-5).
After the 2006 drill program, 123 samples originally submitted to ALS were submitted to Swastika Labs for check assaying. Sixty-eight percent of the check assay pairs agreed within ±25% relative percent difference (see Figure 11-6). This is acceptable based on the gold deposit type.
The 2006 core duplicate reproducibility was low (34% within ±25%), consistent with the known nuggety and erratic gold distribution within the deposit. In these cases, core duplicates are not recommended, and they were discontinued going forward for Magino.
Figure 11-4 Blank Performance Charts: ALS Chemex 2006 (n=211)
Source: Qualitica (2025)
| | | | | |
Island Gold District – NI 43-101 Technical Report August 6, 2025 | 121
|
Figure 11-5 Blank Performance Charts: Accurassay, 2009-2010 (n=143)
Source: Qualitica (2025)
Figure 11-6 Check assays: ALS Chemex (Original) vs Swastika Labs (Duplicate), 2006 (n=123)
Source: Qualitica (2025)
The 2009 - 2010 results included pulp duplicate results from Accurassay; they showed high reproducibility, with 92% falling within an acceptable ±25% relative percent difference (Figure 11-7).
| | | | | |
Island Gold District – NI 43-101 Technical Report August 6, 2025 | 122
|
Figure 11-7 Scatterplot of Pulp Duplicates, Accurassay, 2009-2010
Source: Qualitica (2025)
These results indicate acceptable overall analytical performance; the early QA/QC procedures had limited documentation available for review.
11.2.5 Prodigy (2010-2012)
QA/QC protocols included CRMs, blanks, pulp and coarse duplicates, and check assays. ALS Chemex blank materials had a <1% failure rate based on a 5% insertion rate with approximately 50,000 samples submitted during the period 2010 - 2012 (Figure 11-8). ActLabs blanks performed well and showed a <2% failure rate (Figure 11-9).
Figure 11-8 Coarse Blank Performance Chart: ALS Chemex, 2010-2012 (n=1465)
Source: Qualitica (2025)
| | | | | |
Island Gold District – NI 43-101 Technical Report August 6, 2025 | 123
|
Figure 11-9 Pulp Blank Performance Chart: ActLabs, 2011-2012 (n=3413)
Source: Qualitica (2025)
Over 9,300 reference materials were analyzed across both laboratories with <1% failure at ActLabs and ~7% at ALS Chemex, mainly due to material misidentification. Z-score plots indicate acceptable precision and minimal bias (Figure 11-10). Note that this Z-score chart indicates the deviation of gold assay results from the certified value, expressed in standard deviations. Z-scores within ±3 indicate acceptable analytical accuracy
Figure 11-10 Z-score chart for CRMs (n=1828)
Source: Qualitica (2025)
| | | | | |
Island Gold District – NI 43-101 Technical Report August 6, 2025 | 124
|
Reproducibility of pulp duplicates was mixed: 64% of ALS Chemex duplicate pairs were within ±25%, while ActLabs duplicates showed lower precision at 79%. Check assays submitted to ActLabs from ALS Chemex pulps demonstrated 67% agreement within ±25%, with acceptable relative differences given the deposit’s nuggety gold. Field duplicates from RC drilling in 2012 showed 65% reproducibility.
Overall, analytical QA/QC practices during this period were comprehensive and results are considered reliable for Mineral Resource estimation.
11.2.6 Argonaut Gold Inc. (2013 - 2024)
Following acquisition of Prodigy in 2013, Argonaut continued core and RC drilling at Magino. Sampling, logging, and cutting were conducted under standardized procedures in Dubreuilville. Core was cut in half; RC samples were collected via wet splitter into cloth bags for better drying. All samples were shipped using commercial carriers under secure chain of custody protocols.
Laboratories used include ActLabs (2013–2024), Bureau Veritas (2016–2017), and MSA Labs (2024). Sample preparation followed industry standards, with crushing to 90% passing 2 mm or -8 mesh and pulverizing to 85 – 90% passing appropriate mesh sizes. Photon Assay was introduced at MSA Labs in 2024 for high-throughput, non-destructive gold analysis, and is currently utilized for all grade control RC samples.
QA/QC measures remained consistent with every 10th sample being a reference material or blank material. Additional blanks and higher-grade reference materials were used for visible gold. More than 15,000 blank materials and more than 16,000 CRMs were inserted from 2013 to 2024. ActLabs data showed a less than 1% blank failure rate during the period 2019 - 2024 (Figure 11-11). Check assays comparison of original ActLabs results conducted by AGAT for the period 2020 - 2024 are provided in Figure 11-12. Seventy-five percent of the check assay pairs with gold values greater than ten times the detection limit agree within ±25% relative percent difference. This is an acceptable range of repeatability given the nuggetty nature of the gold deposit. It is apparent that only samples with a gold grade above 0.05 g/t gold were submitted for check assay.
Figure 11-11 Coarse Blank Performance Chart, ActLabs, 2019-2024
Source: Qualitica (2025)
| | | | | |
Island Gold District – NI 43-101 Technical Report August 6, 2025 | 125
|
Figure 11-12 Check assays: ActLabs (Original) vs AGAT (Duplicate), 2020-2024
Source: Qualitica (2025)
The reference materials in use by Argonaut for the 2016 - 2017 RC drill program consist of materials purchased from CDN Resource Laboratories Ltd. The materials selected have gold grades ranging from 0.3 - 2.0 g/t gold.
Three different reference materials were analyzed 1,231 times in sequence with the samples submitted to Bureau Veritas (excluding failures). The results are summarized in Table 11-10. There are 86 cases where the results for gold have failed. Multiple cases appear to be misidentified CRMs. This represents a failure rate of 7%. This is considered high. Despite the high failure rate, the overall results are acceptable. The Z-score chart, in shows that the results were generally well distributed within plus or minus three standard deviations for most of the period, however increased variability was observed beginning in mid-November 2017 and continued through the end of the program with Bureau Veritas.
Table 11-10 Summary of Reference Material Results, Bureau Veritas, 2016-2017
| | | | | | | | | | | | | | | | | | | | | | | |
CRM | No. | Failures Excluded | Au g/t | Observed Au g/t | Percent of Expected |
Expected | Std. Dev. | Average | Std. Dev. |
GS-P4C | 370 | 34 | 0.362 | 0.018 | 0.358 | 0.025 | 99% |
GS-P8E | 388 | 17 | 0.827 | 0.039 | 0.824 | 0.050 | 100% |
GS-2R | 387 | 35 | 2.03 | 0.070 | 2.01 | 0.087 | 99% |
Total | 1,145 | 86 | Weighted Average | 99% |
|
| | | | | |
Island Gold District – NI 43-101 Technical Report August 6, 2025 | 126
|
Figure 11-13 Z-score Chart – Certified Reference Materials: 0.3 - 7.0 g/t Gold, ActLabs, 2019 - 2024
Source: Qualitica (2025)
Reproducibility for duplicates was variable. RC field duplicates showed lower reproducibility (43 - 45% within ±25%), as expected due to sample heterogeneity. Pulp duplicates showed better performance, showing 70 – 79% agreement within ±25% (Figure 11-14). Check assays between ActLabs and AGAT, and between Bureau Veritas and ActLabs, were within acceptable precision ranges (60–75%), with minor lab-to-lab bias (Figure 11-14).
Figure 11-14 Scatterplot for Pulp Duplicates, ActLabs, 2015-2024
Source: Qualitica (2025)
| | | | | |
Island Gold District – NI 43-101 Technical Report August 6, 2025 | 127
|
In summary, the QA/QC results from Argonaut’s tenure are robust and support the use of these data for Mineral Resource and Mineral Reserve estimation presented within this Report.
11.2.7 Alamos Gold (2024)
Procedures at Magino inherited from Argonaut were deemed by Alamos to be adequate to continue for the remainder of 2024 drilling and are unchanged.
11.2.8 QP Commentary
The Company maintains a rigorous assay quality control program. Blanks and CRMs are inserted with drill core samples on a routine basis. In addition, sample pulps are routinely submitted for check assays to an accredited commercial laboratory.
There is no evidence of significant assay bias or systematic contamination identified based on the quality control program.
The responsible QP is of the opinion that Magino maintains a quality program that meets or exceeds industry standards. Sample preparation, security, and analytical procedures are all industry-standard and produce analytical results for gold with accuracy and precision that is suitable for Mineral Resource estimation.
| | | | | |
Island Gold District – NI 43-101 Technical Report August 6, 2025 | 128
|
12 DATA VERIFICATION
12.1 Island Gold Mine
12.1.1 Data Verification
Data verification involved both digital and physical checks of information housed in the mine’s SQL database, which is used to manage and store drilling, assay, and geological data. This database includes collar coordinates, downhole surveys, lithology logs, analytical results, QA/QC data, and laboratory certificates. Monthly random checks are performed on drillhole records to ensure that assay intervals and geological logging data accurately reflect original source documents and certificates. Any inconsistencies were corrected prior to inclusion in the estimation database.
QA/QC protocols form a core component of Island Gold’s data verification process. Control samples, including CRMs and blanks, are routinely inserted into the sample stream to monitor the accuracy and precision of assay results. All QA/QC data are reviewed on an ongoing basis, with any failures triggering investigation and appropriate corrective actions, such as re-assaying affected sample batches.
In 2024, AGAT Laboratories analyzed approximately 1,911 CRMs, reporting a failure rate of 7.8%, while Actlabs analyzed approximately 1,036 CRMs with a lower failure rate of 4.2%. All failures were reviewed by qualified personnel, and re-assays were conducted as required. Performance trends across CRM types were evaluated, and despite some higher variability in the higher-grade CRMs, results were considered to fall within acceptable thresholds for the purpose of Mineral Resource and Mineral Reserve estimation.
To assess the accuracy and identify any potential bias in primary assay results, a system of check assays is employed. A target of 4% of total samples is selected for re-assay at an ISO 17025-accredited secondary (umpire) laboratory. Results are reviewed for consistency, and discrepancies are investigated.
Laboratory inspections were conducted in 2023 at AGAT, the YD Lab, and Wesdome, where Island Gold personnel directly observed the procedures and sample handling protocols. These inspections confirmed that each laboratory adhered to standard operating procedures for drying, crushing, pulverizing, fire assay and gravimetric analyses, and that equipment cleaning and contamination controls were in place - particularly in relation to samples containing visible gold.
Further historical data verification measures included a 2019 audit of the LabExpert and Wesdome laboratories by Analytical Solutions Ltd. The audit involved a detailed review of laboratory policies, workflows, and sample processing. While Analytical Solutions Ltd. noted some minor deficiencies in the Wesdome laboratory’s ability to accurately analyze samples below 2.0 g/t gold, this was not considered material, as most assays from this laboratory are used for daily mine operations and not for Mineral Resource or Mineral Reserve reporting. The suggestions provided by Analytical Solutions Ltd. were implemented.
There were no material limitations encountered during the verification process. Some minor issues, such as isolated CRM failures or suspected sample mislabelling (e.g., CRM 235b), were identified but did not affect the integrity of the dataset used for Mineral Resource estimation presented in this Report. These were investigated and corrected prior to estimation.
| | | | | |
Island Gold District – NI 43-101 Technical Report August 6, 2025 | 129
|
12.1.2 QP Commentary
Based on the procedures and verification steps conducted, the QP considers the data supporting the Mineral Resource estimates to be adequate, accurate, and suitable for the purposes of this Report. The mine’s digital database and QA/QC framework are robust and meet industry best practices. All reasonable steps have been taken to ensure the validity of the data inputs used in the Mineral Resource models described within this Report.
12.2 Magino Mine
Since acquisition of Magino, Alamos has focussed on the validation of all digital drilling data as provided, with the aim of validating and correcting any mistakes in the database of historical operators. The emphasis to date has been on the 2006 - present assay information, although preliminary evaluation of historic data is also ongoing.
12.2.1 Pre-2006 Drillhole Data
Numerous previous authors have discounted the use of pre-2006 drilling information and have excluded them from the resource estimate. The basis for this exclusion was that the pre-2006 data appeared to exhibit a high bias when compared with the post-2006 surface drilling data. However, other than some generally cursory and limited basic statistical comparisons, no systematic attempt at validation of this data has been documented. Alamos personnel have conducted a rigorous search of any available historic documentation, and it is believed that some of this historic assay data from surface drillholes may in fact be verifiable, and suitable for use in Mineral Resource estimation. For the current Mineral Resource estimate, Alamos has elected to exclude this data as have previous authors, until the ongoing pre-2006 data verification process is completed.
12.2.2 Prior Data Verification
12.2.2.1 Data Verification - 2012
In 2012, Tetra Tech Canada Inc. carried out several internal validations of the diamond drillhole data against the original drill logs and assay certificates. The validation of assay files against the certificates was carried out on 172 of the holes drilled by Prodigy between September 2011 and June 2012, which equates to 71% of the holes drilled in this period and 14% of the database provided as a whole. Of the 1,193 assay records checked that were greater than 2.0 g/t gold there was a 100% match between the database records and the certificates. Data verification was also completed on collar coordinates, end-of-hole depths, down-hole survey measurements, from and to intervals, measurements of assay sampling intervals, and gold grades for about 35% of the database provided, and no major issues were found.
In 2013, Kirkham Geosystems Ltd. performed internal validations on drillholes MA12-366 through MA12-434 and PDMA12-001 through PDMA12-121. Approximately 10% of the assay data was selected randomly for validation and verification. There were no errors or omissions encountered.
12.2.2.2 Data Verification - 2015
During the 2015 data verification process, three holes were randomly selected from the 2015 program and comparisons were made of the remaining half sawn core against drill logs and assays. This review showed that the core was logged in a professional manner with no material issues. Random core recovery checks were also conducted, and it was confirmed that the electronic entries made by Argonaut's geologic staff were accurate. Random down-hole survey
| | | | | |
Island Gold District – NI 43-101 Technical Report August 6, 2025 | 130
|
records were compared with the electronic database for a number of 2011 and 2012 drillholes. No errors were detected.
Five drillholes were also selected from the 2015 drilling campaign (MA15-443, MA15-451, MA15-459, MA15-467, and MA15-475) representing 10% of the total 2015 drilling data. Electronic database gold grade assays for 922 intervals (922 m) were compared against ActLabs certificates. No errors were encountered.
12.2.2.3 Data Verification - 2016
During 2016, a 100% check of the 2016 gold assay database (approximately 36,000 records) was conducted. The CSV data files that were provided to Argonaut by Bureau Veritas and ActLabs were combined into two files (one for each lab) and then compared to assays stored in Argonaut's electronic database. This comparison showed that approximately 450 Bureau Veritas assay records stored in Argonaut's database were internal duplicate assays that were completed by the lab. After consultation with the lab, the "original" assay results for these intervals were re-imported into Argonaut's electronic database.
During 2016, the electronic drillhole logs and several down-hole survey records were spot checked. These reviews showed that the RC chips were logged in a professional manner and no apparent errors or deficiencies were encountered.
12.2.2.4 Data Verification - 2021
Argonaut conducted a further data verification process in 2021. Datashed is the original data source for collar data, lithography, and surveys for work between 2011 and 2020. Data was logged into GeoSpark and was linked directly into the Datashed database. No known sources of original data exist for collar, lithography, and survey data at this time. Geosequel is the current database for Magino and has been exclusively used since late 2020. Data was migrated from Datashed and imported into Geosequel. Since late 2020, all collar, and lithology was collected and imported directly into Geosequel.
The Magino Geology Team conducted a 100% check of all the data in the Geosequel Database against available source data for the period 2011 to 2021. The following was found:
•Collar Surveys
o 2.4% of drillholes had a location difference between 20 m and 100 m. 0.4% of drillholes had variances >100 m;
•Lithology and Downhole Surveys
o 18,090 lithology records were recorded in Geosequel and were compared to Datashed; and
o After Datashed, hole “from” and “to” down hole distance values were rounded to 2 decimal places, lithology errors were identified in one drillhole only and corrected.
•Assays - Geosequel Datashed Comparison - 263,101 gold values were compared between the Geosequel and Datashed databases. Of these, 257,927 values were exact matches. Some of the errors that were found in the assay database were as follow:
o Two hundred and thirty errors were identified related to detection limit issues in Geosequel and in Datashed;
o Additional 115 assays that are < 0.1 ppm because of re-assaying, of which one value is 0.37 ppm because of re-assaying;
| | | | | |
Island Gold District – NI 43-101 Technical Report August 6, 2025 | 131
|
o Nine assay variances between 0.10 - 1.15 ppm, all of which have multiple assays; and
o One value with a difference of 2.935 ppm which appears to have been re-run multiple times.
•Assays - Geosequel Actlabs Comparison - 263,101 gold assay samples in Geosequel exist. 70,738 assays were readily available from the Actlabs LIMS System and were compared against Geosequel:
o 61,291 were an exact match. The unmatched data appears largely due to a CSV import error;
o 5,647 assays were removed due to conversion errors of batch importing mass data from CSV;
o 3,800 samples had mismatched assay values representing an error rate of 5%;
- 3,000 assays within 0.1 ppm, 500 assays were within 0.2 ppm to 0.5 ppm;
- 288 assays were within 0.5 ppm to 2 ppm;
- 6 assays were between 2 ppm and 70 ppm; and
- Of the 3,800 unmatched assays, 489 samples in the CSV match the secondary (presumably re-run) flame atomic absorption assay (FAAA) table in Datashed.
12.2.2.5 Data Verification - 2025
Qualitica was retained by Alamos to conduct a comprehensive review of quality control data for Magino, encompassing exploration and drill programs from 2006 to early 2025. The verification process focused on evaluating the precision and accuracy of assay data and ensuring its integrity for use in Mineral Resource estimation. The review incorporated quality control data from multiple operators - Golden Goose, Prodigy, Argonaut, and Alamos - and assessed results from a range of ISO 17025-accredited laboratories including ALS, Accurassay, ActLabs, Bureau Veritas, AGAT, and MSA Labs.
The verification involved analysis of CRMs, blanks, field duplicates, coarse and pulp duplicates, and external check assays. Data was provided in CSV format, alongside original assay certificates, and was accepted as-is; a review of the digital database itself was not within the scope of work. Overall, quality control results showed acceptable levels of accuracy and precision, with low failure rates and no evidence of systematic issues. The quality control program, including the recent implementation of photon assaying in 2024, demonstrated consistent and reliable practices, supporting the conclusion that the assay data from 2006 to 2024 is suitable for use in Mineral Resource estimation.
12.2.3 QP Commentary
Based on the 2024 database validation, it is the opinion of the QP responsible for this section that:
The Magino 2006 - present drillhole data are accurate and of sufficient quality to be used to estimate Mineral Resources. Errors that were found are not considered material, and almost all the errors related to assay data are near detection limit which is of no material economic importance.
The near detection limit assay results are important to increase the confidence when comparing blanks and previous samples as well as duplicate assays near the detection limit. These values
| | | | | |
Island Gold District – NI 43-101 Technical Report August 6, 2025 | 132
|
are also important for the determination of the practical detection limits of the different assay labs. There was enough data available to determine the practical detection limits for the different laboratories with confidence, but it is recommended that these errors be corrected for future resource estimates to further improve the confidence in the practical detection limits of the different laboratories.
It is recommended that additional effort be focused on attempting to validate a subset of the pre-2006 surface drilling data, which could ultimately increase drillhole sampling locally and potentially reduce future infill drilling requirements in specific areas of the deposit.
| | | | | |
Island Gold District – NI 43-101 Technical Report August 6, 2025 | 133
|
13 MINERAL PROCESSING AND METTALURGICAL TESTING
13.1 Introduction and Summary
The Magino mill expansion project from 10,000 tpd to 12,400 tpd will see ore from two different ore bodies being processed through the common operating complex. The existing Magino mill feed is sourced from a low-grade high tonnage open pit operation, while the neighbouring Island Gold ore feed is sourced from a high-grade and lower tonnage underground operation. Previous metallurgical testing campaigns have been completed for each deposit to develop their respective original mineral processing flowsheets. Now that both ores will be combined in a common feed, a dedicated blended test work campaign has been completed to explicitly review the metallurgical performance of both ores being processed at the same time utilizing a new flowsheet design. The blended test work program was focused on developing the process design criteria for comminution, gravity concentration, leaching, and dewatering.
The existing 10,000 tpd Magino mill operation has had dedicated test work completed in the past with key reports summarized in Table 13-1.
Table 13-1 Magino Mill – Magino Open Pit Mine Test Work
| | | | | | | | |
Laboratory | Study | Date |
| McClelland Laboratories | Milling/Cyanidation and Gravity Concentration Testing – Magino Drill Core Composites | Dec 18th, 2013 |
| McClelland Laboratories | 2014 Milling/Cyanidation and Gravity Concentration Testing – Magino Ore Grade Drill Core Composites | Mar 25th, 2015 |
| McClelland Laboratories | Feasibility Study Metallurgical Testing Program – Magino Drill Core Composites | Jul 11th, 2017 |
| McClelland Laboratories | Gravity / Cyanidation Testing Results – Magino Drill Core Composites | Nov 12th, 2019 |
This collection of test work programs formed the metallurgical process basis that was ultimately applied to the development of the now constructed and operating Magino mill.
The Island Gold ore has also had dedicated test work completed as indicated in Table 13-2. This was originally completed to expand the existing Island Gold mill prior to the purchase of Argonaut’s Magino property in 2024.
Table 13-2 Island Gold Mill – Island Gold Underground Mine Test Work
| | | | | | | | |
Laboratory | Study | Date |
Base Met Labs | Metallurgical Evaluation of Island Gold Project | Feb 3rd, 2023 |
Both the historical Island Gold and Magino test work programs were developed with master composite samples intended on providing a representation of their respective deposits. Variability tests were also completed to help support development.
The blended test work program to represent a co-mingling of the ores through the Magino mill focused on the currently planned expansion utilizing feed material from each of the respective deposits. Each contributing sample in the blend was assayed to ensure it was representative of
| | | | | |
Island Gold District – NI 43-101 Technical Report August 6, 2025 | 134
|
the mine plan and fell within the bounds of what was presented in the previous test work campaigns.
The blends were combined to explicitly test the gold recovery performance of the blended feed (BML 2025). This Section provides further detail regarding the outcomes of the blended test work program.
13.2 Sample Description and Preparation
A total of three stock samples were used throughput the completion of the blended test work campaign. The first was collected from the Magino mill feed conveyor to represent the Magino feed portion of the test; the second was sourced from the existing Base Met Labs Inc. (BML) storage as material was still available from previous Island Gold test work and remained representative of the mine plan. Both samples were used to complete blended test work.
The third and final sample was a new sample collected from the existing Island Gold operation to complete SMC test work.
13.2.1 Island Sample – Blended Test Work
During the previous Island Gold test program, a significant quantity of mill feed material was collected and sent to BML for a series of tests to support the development of the original Island Gold mill expansion flowsheet. After the original Island Gold expansion was put on hold, the lab retained the representative material for future use in the Magino expansion program.
Four pails, labeled Feed Buckets 1 through 4 and weighing a total of 74 kg, had been previously prepared to minus 6 mesh. These pails were combined, blended, and rotary split into 1 kg test charges. A single head assay was taken from one of these test charges.
13.2.2 Magino Sample – Blended Test Work
Crushed ore was collected from the Magino mill feed conveyor. The lab received 16 pails of bulk material, with a total weight of 254 kg and a nominal particle size of 1 inch. The material was combined, stage-crushed to a nominal 1 inch size, and blended. A 50 kg portion was separated for testing.
The 50 kg sample was then stage-crushed to ensure 100% passed through a 6-mesh screen, blended, and rotary split into 1 kg and 10 kg test charges. A single head assay was prepared from one of these charges.
13.2.3 Blended Composites
Two blended composites were prepared as described below:
•Blend 1; 80:20 Magino to Island Gold ore blend
•Blend 2; 60:40 Magino to Island Gold ore blend
The blends were selected to represent the anticipated blending range over the course of the operation. The near-term blending operation will see ore feed represented by Blend 1 while the long-term design is expected to approach the composition of Blend 2.
Each blend was rotary split into 1 kg test charges, and a single head sample was taken. Each head split was submitted for analysis of Au, Ag, sulfur , and a multi-element inductive coupled plasma (ICP) scan.
| | | | | |
Island Gold District – NI 43-101 Technical Report August 6, 2025 | 135
|
13.2.4 Head Assays
Both stock samples and blended composites were submitted for head assays, including an ICP scan. Gold grades in the Magino and Island Gold composites were 0.98 g/t and 15.0 g/t gold, respectively. Blends 1 and 2 contained 3.85 g/t and 6.18 g/t gold, respectively. Silver content was low across all composites. Sulphur levels were also low, ranging from 0.51 - 0.82%, with the majority present as sulphide sulphur (S2).
A summary of the assays is found in Table 13-3.
Table 13-3 Head Assays Summary
| | | | | | | | | | | | | | | | | |
Sample | Assay Results |
Au (g/t) | Ag (g/t) | S (%) | SO4 (%) | S2 (%) |
Magino | 0.98 | 0.20 | 0.53 | 0.03 | 0.51 |
Island Gold | 15.0 | 1.42 | - | - | - |
Blend 1 | 3.85 | 0.50 | 0.59 | 0.01 | 0.58 |
Blend 2 | 6.18 | 1.00 | 0.85 | 0.03 | 0.82 |
Source: BML (2025)
13.3 Island Gold Sample for SMC Test Work
The change from the original Island Gold flowsheet to the new Magino mill flowsheet meant that the Island Gold ore will now be processed by a semi-autogenous grinding (SAG) mill. This was not the case in the original Island Gold expansion therefore a new dedicated SMC test on the Island Gold ore was completed. This sample was not utilized for any blended test work.
The sample was collected within the existing Island Gold crushing circuit prior to entering the secondary crusher. This composite was prepared from a single pail of Island Gold material. The 20 kg sample was coarse crushed, and a single SMC test was prepared using the 31.5 / 26.5 mm fraction. All coarse rejects were retained, and no head assays were performed.
13.4 Island Gold – Comminution Testing
A single SMC test was completed using the dedicated coarse Island Gold sample, resulting in a SMC value of 30.2 and a SCSE of 11.5 kilowatt-hour per tonne (kWh/t), consistent with previous Island Gold results reported under Base Met Labs Inc. project report BL946, which estimated an average SMC value of 30.0.
13.5 Extended Gravity Recoverable Gold Testing
Standard gravity gold recovery (GRG) is considered later as part of the gravity tails leaching section; however, a dedicated extended gravity gold (E-GRG) test was conducted on Blend 2.
For sample preparation, 20 kg of material was stage-crushed to 100% passing 1.7 mm, yielding a K₈₀ of approximately 1,248 µm. The test involved passing the entire crushed sample through a Knelson MD-3 concentrator at 60 gravitational force equivalents (G-force). The resulting concentrate was retained and sized for assay, while the tailings were sub-sampled for sizing.
| | | | | |
Island Gold District – NI 43-101 Technical Report August 6, 2025 | 136
|
The tailings were then ground in a laboratory rod mill and subjected to a second pass at a grind target of K₈₀ 250 µm. As in the first pass, both the concentrate and tailings were sampled. The tailings from the second pass were further ground to a final target of K₈₀ 75 µm and passed through the concentrator for a third pass. Final tailings were sampled, sized, and assayed by size fraction.
All assays were conducted using fire assay for gold, with concentrate fractions assayed to extinction.
The test was completed on the blended sample and achieved 76.0 % GRG which is indicative of gravity gold amenability. A summary of the E-GRG test results can be found in Table 13-4.
Table 13-4 Extended Gravity Recoverable Gold Results
| | | | | | | | | | | | | | |
| Product | Mass (%) | Feed Size (µm) | Gold (g/t) | Distribution (% gold) |
| Stage 1 Concentrate | 0.46 | 1,295 | 420 | 27.7 |
| Stage 2 Concentrate | 0.45 | 241 | 524 | 33.9 |
| Stage 3 Concentrate | 0.47 | 79 | 214 | 14.3 |
| Tailing | 97.0 | - | 1.74 | 24.0 |
| Combined Concentrate 1-3 | 1.74 | - | 384 | 76.0 |
| Feed (Calculated) | - | - | 7.00 | - |
Source: BML (2025)
It should be noted that the E-GRG result is not directly related to the GRG which will be observed in a closed-circuit milling application such as the existing Magino mill operation or the future mill expansion. It is an indication that the gold within the ore is amenable to gravity recovery but will ultimately be at a lower rate than measured in the lab.
The GRG value of 76% falls within the high range. Combined with the elevated gold content in the concentrates, particularly in screen fractions of 75 µm and smaller, this suggests that incorporating a gravity gold concentration circuit would be appropriate and beneficial for processing the material represented in this test program.
Blend 2 E-GRG results are shown below in Figure 13-1
| | | | | |
Island Gold District – NI 43-101 Technical Report August 6, 2025 | 137
|
Figure 13-1 Extended Gravity Recoverable Gold Results
Source: BML (2025)
13.6 Gravity & Tails Leach Testing
A series of twenty-eight leach tests were completed on gravity tailings. The tested flowsheet included an initial gravity stage completed at 150 µm K80 followed by the gravity tailings being reground and leached. Test variables were limited to leach grind size spanning approximately 60 - 125 µm K80.
The general test procedure included grinding a test charge (1, 2 or 3 kg) of a composite to a target K80 of 150 µm. Once ground, the entire mass was pumped through a Knelson MD-3 gravity concentrator at a force of 60 G-Force while applying 3.5 litres per minute (L/min) of fluidizing wash water. The concentrate was cleaned using a Mozley table mineral separator (C-800) to a low-weight gravity concentrate which was then fire assayed to extinction. The Knelson and Mozley tails were combined. In the case of the 1 kg gravity tests, the entire tail was reground ahead of leaching, meanwhile in the 2 and 3 kg gravity tests, the tails were split into 1 kg charges ahead of regrinding and leaching.
The following parameters were used to simulate the leaching circuit:
•Feed to leach : 1 kg
•Leach size : 60 - 125 µm K80
•Percent solids : 55% solids
•Pre-oxidation : 2 hours
•pH : 10.8
•Dissolved oxygen : 20 milligram per litre (mg/L)
•NaCN : 0.5 grams/litre (g/L)
•Retention time : 48 hours
| | | | | |
Island Gold District – NI 43-101 Technical Report August 6, 2025 | 138
|
•Kinetic samples : 12, 24, 36, and 48 hours
Gravity tailings were leached at various grind sizes. Gravity tailings were direct leached in sodium cyanide (NaCN).
13.6.1 Gravity Tails Leach - Island
For the Island Gold composite GRG recovery averaged 22.7%, with the concentrates assaying between 608 - 5,546 g/t gold. Staged gold recovery by leaching the gravity tailings ranged between 96.6 - 97.8% extracted combining for an overall gold recovery range of 97.3 - 98.2%.
13.6.2 Gravity Tails Leach - Magino
For the Magino composite GRG averaged 16.5%, with the concentrates assaying between 37 - 254 g/t gold. Gravity performance and concentrate quality likely does not satisfy an acceptable level to consider gravity when treating Magino ore in isolation. Staged gold recovery by leaching the gravity tailings ranged between 94.6 - 96.5% extracted combining for an overall gold recovery range of 95.6 - 98.8%.
13.6.3 Gravity Tails Leach - Blend
GRG recovery for Blend 1 and Blend 2 measured between 50 – 52%. As expected, gold assayed higher in Blend 2, which contained a higher percentage of Island Gold composite. Gold in the gravity (Mozley) concentrate from Blend 1 and 2 measured 2,932 and 4,729 g/t gold, respectively.
For Island Gold, Blend 1 and Blend 2 composites, there was a slight trend showing higher gold extractions at finer grind size. This was not the case for the Magino composite, where the highest gold performance was observed at the coarsest grind size with overall minor sensitivity to grind size.
The complete gravity tails leaching results summary is seen below in Table 13-5.
Table 13-5 Gravity-Leach Test Summary
| | | | | | | | | | | | | | | | | | | | | | | | | | |
| Sample ID | Test ID | Grind
(µm) | Reagent Consumption (kg/t) | Gold Grade Gravity Concentrate | Gold Recovery |
| 48 h (%) | Comb (%) |
| NaCN | Ca(OH)2 | (g/t) | (% Rec) |
| Magino Sample | CN01 | 60 | 0.24 | 1.03 | 154 | 32.3 | 64.7 | 97.0 |
| CN05 | 73 | 0.10 | 1.14 | 231 | 21.1 | 75.2 | 96.4 |
| CN03 | 72 | 0.09 | 1.27 | 254 | 24.9 | 71.0 | 95.9 |
| CN18 | 67 | 0.15 | 1.05 | 37 | 3.9 | 92.8 | 96.7 |
| CN19 | 73 | 0.06 | 0.99 | 59 | 12.2 | 84.2 | 96.4 |
| CN20 | 73 | 0.04 | 0.90 | 59 | 11.4 | 86.7 | 98.1 |
| CN08 | 81 | 0.15 | 1.11 | 241 | 19.0 | 78.8 | 97.8 |
| CN10 | 83 | 0.09 | 0.88 | 68 | 6.8 | 92.1 | 98.8 |
| CN02 | 68 | 0.16 | 1.30 | 1,489 | 22.9 | 75.1 | 98.0 |
| Island Sample | CN12 | 69 | 0.16 | 1.05 | 608 | 7.6 | 90.4 | 98.0 |
| CN15 | 70 | 0.11 | 1.10 | 8,820 | 24.2 | 74.0 | 98.2 |
| CN16 | 68 | 0.12 | 1.14 | 5,546 | 26.4 | 71.7 | 98.1 |
| | | | | |
Island Gold District – NI 43-101 Technical Report August 6, 2025 | 139
|
| | | | | | | | | | | | | | | | | | | | | | | | | | |
| Sample ID | Test ID | Grind
(µm) | Reagent Consumption (kg/t) | Gold Grade Gravity Concentrate | Gold Recovery |
| 48 h (%) | Comb (%) |
| NaCN | Ca(OH)2 | (g/t) | (% Rec) |
| CN17 | 69 | 0.19 | 1.14 | 5,361 | 29.0 | 69.3 | 98.3 |
| CN07 | 100 | 0.14 | 0.94 | 2,153 | 23.9 | 73.9 | 97.8 |
| CN04 | 123 | 0.07 | 0.94 | 3,908 | 21.9 | 75.4 | 97.3 |
| CN06 | 123 | 0.13 | 0.85 | 5,542 | 26.0 | 71.6 | 97.6 |
| Blend 1 | CN13B | 71 | 0.14 | 1.25 | 2,932 | 49.8 | 48.0 | 97.8 |
| CN13C | 79 | 0.09 | 1.07 | 2,932 | 50.0 | 47.9 | 97.9 |
| CN13D | 91 | 0.18 | 0.95 | 2,932 | 50.8 | 46.4 | 97.2 |
| Blend 2 | CN14B | 72 | 0.13 | 1.15 | 4,729 | 51.1 | 47.3 | 98.4 |
| CN14C | 81 | 0.07 | 0.98 | 4,729 | 51.1 | 47.1 | 98.2 |
| CN14D | 92 | 0.09 | 1.09 | 4,729 | 51.6 | 46.1 | 97.7 |
Source: BML (2025)
A single whole ore leach test was performed on the Island Gold composite, ground to 71 µm K80, with gold extraction measuring 98.4 %, similar to that of gravity-leach testing, with similar reagent consumptions.
The gravity-gold and leaching relationships influenced by grind size are presented in Figure 13-2 and Figure 13-3.
Figure 13-2 Gravity vs Leach Gold Distribution
Source: BML (2025)
| | | | | |
Island Gold District – NI 43-101 Technical Report August 6, 2025 | 140
|
Figure 13-3 Gold Extraction Curves
Source: BML (2025)
13.7 Dewatering Tests
The cyanide tailings from select tests were subject to thickening test work including flocculant scoping and static settling. Tails were used from a variety of tests allowing comparison of grind size and blend on static thickening characteristics.
Initial flocculant scoping tests were conducted on cyanide tailings from the Magino and Island Gold stock samples, specifically from Tests CN08 (81 µm) and CN22 (69 µm), respectively. Five flocculants, Magnafloc 10, 380, 351, 156, and AN913SH, were evaluated using small-scale settling tests in 250 millilitre (mL) cylinders. Each flocculant was prepared at a concentration of 0.1 g/L and applied at a fixed dosage of 20 g/t. A summary of the results is provided in Table 13-6. Among the flocculants tested, AN913SH produced the fastest settling rates for both the Magino and Island Gold tailings samples.
Table 13-6 Summary of Flocculant Screening Results
| | | | | | | | | | | | | | | | | | | | |
Test | Initial Density (% w/w) | Flocculant | Flocculant Type | Dosage (g/t) | Final Density (% w/w) | Settling Rate (mm/s) |
| Magino Cyanide Tails Test 08 | 15 | MF10 | Anionic | 20 | 46.8 | 4.42 |
15 | MF380 | Cationic | 20 | 56.7 | 1.83 |
15 | MF351 | Non-ionic | 20 | 53.5 | 4.31 |
15 | MF156 | Anionic | 20 | 49.3 | 4.42 |
15 | AN913SH | Anionic | 20 | 48.0 | 4.34 |
| | | | | |
Island Gold District – NI 43-101 Technical Report August 6, 2025 | 141
|
| | | | | | | | | | | | | | | | | | | | |
Test | Initial Density (% w/w) | Flocculant | Flocculant Type | Dosage (g/t) | Final Density (% w/w) | Settling Rate (mm/s) |
| Island Cyanide Tails Test 22 | 15 | MF10 | Anionic | 20 | 46.8 | 4.16 |
15 | MF380 | Cationic | 20 | 56.7 | 0.38 |
15 | MF351 | Non-ionic | 20 | 55.1 | 3.97 |
15 | MF156 | Anionic | 20 | 50.6 | 3.88 |
15 | AN913SH | Anionic | 20 | 49.3 | 4.83 |
Source: BML (2025)
Subsequent static settling tests were performed on cyanide tailings from various tests using AN913SH at 20 g/t, which aligns with typical flocculant consumption at the Magino operation. These tests also provide a basis for evaluating the impact of blending against this operational benchmark. The tests focused on assessing the effect of primary grind size on static settling. Results are summarized in Table 13-7.
Table 13-7 Static Settling Performance Summary
| | | | | | | | | | | | | | | | | | | | |
| Test | Sample | Grind | pH | Density | Free Settling |
| | (µm) | | Initial | Final | Velocity (m/h) |
| S4 | MG T10 CNTL | 83 | 8.5 | 13.7 | 56.3 | 16.2 |
| S2 | MG T08 CNTL | 81 | 8.5 | 13.7 | 57.4 | 15.4 |
| S3 | MG T01 CNTL | 60 | 8.5 | 13.8 | 56.5 | 10.8 |
| S6 | IG T07 CNTL | 100 | 8.6 | 13.7 | 57.4 | 15.6 |
| S1 | IG T11 CNTL | 71 | 8.6 | 13.7 | 57.3 | 13.0 |
| S5 | IG T02 CNTL | 68 | 8.6 | 13.7 | 56.2 | 14.5 |
| S7 | Blend 1: CN21A | 65 | 8.6 | 13.6 | 57.3 | 13.5 |
| S8 | Blend 1: CN21B | 90 | 8.6 | 13.6 | 57.3 | 14.0 |
| S9 | Blend 2: CN22B | 65 | 8.6 | 14.1 | 58.5 | 8.8 |
| S10 | Blend 2: CN22C | 90 | 8.7 | 14.2 | 59.9 | 12.9 |
•All tests used Flocculant AN913SH at a dosage of 20 g/t.
Source: BML (2025)
Results indicate faster settling rates at coarser primary grind size. In the case of the Magino sample comparing 60 and 83 µm the initial free settling velocity increases from 10.8 to 16.2 metres per hour (m/h), meanwhile for the Island Gold sample comparing 68 to 100 µm free settling increases slightly from 14.5 to 15.6 m/h which trends slightly above Magino material. Blend 1 feed observed a settling velocity between 13.5 - 14.0 m/h while Blend 2 did observe a noticeable decrease to 8.8 – 12.9 m/h.
Final densities are comparable in all cases, in the 56 - 60% solids range. The effect of blending can be compared for a nominal 65 and 90 µm K80 scenarios from 100% Magino through 80/20, 60/40 (Blend 1 and 2) and 100% Island Gold are provided in Table 13-8.
| | | | | |
Island Gold District – NI 43-101 Technical Report August 6, 2025 | 142
|
Table 13-8 Static Settling vs Blend Level
| | | | | | | | | | | | | | |
Nominal K80 | Free Settling Velocity (m/h) |
| Magino / Island Gold Blend |
| 100/0 | 80/20 | 60/40 | 0/100 |
| 65 | 10.8 | 14.5 | 8.84 | 14.5 |
| 90 | 16.2 | 14.0 | 12.9 | 15.6 |
Source: BML (2025)
13.8 Cyanide Destruction
13.8.1 The SO2 / Air Process
The chemical reaction for the oxidation of weak acid dissociable cyanides (CNWAD) using sodium metabisulphite (SMBS or Na2S2O5) as a source of SO2 is as follows:
2CN- + Na2S2O5 + 2O2 + 2OH- = 2CNO- + Na2SO4 + SO42- + H2O
Copper acts as a catalyst for the reaction and any solution containing copper (copper cyano-complexes) will contribute to overall copper. As required, additional copper is added as copper sulphate. Hydrated lime is added to the reactor to provide hydroxide ion to complete the reaction.
Base metals such as copper, zinc and nickel, if present in the leached solution as cyanide complexes, precipitate as metal hydroxides during the cyanide destruction process. Ferrocyanide is not destroyed using the SO2/air process but precipitates with other base metals as a mixed metal ferrocyanide solid as follows:
Fe(CN)64- + 2Cu2+ → Cu2Fe(CN)6
Fe(CN)64- + 2Zn2+ → Zn2Fe(CN)6
Thiocyanate (SCN-), if present is partially oxidized to cyanate (CNO-) and sulphate (SO42-). Typically, less than 10% of the SCN- in solution will be destroyed during SO2/air cyanide destruction. SCN- is unstable and slowly hydrolyzes to ammonium and carbonate:
SCN- + Na2S2O5 + 3O2 + 4OH- → CNO- + Na2SO4 + 2SO42- + 2H2O
2CNO- + 4H2O → 2CO32- + 2NH4+
When scaling laboratory data to plant design applications, a correction for consumption of SO2 and CaO must be included. During laboratory tests, SMBS is used in place of SO2, while commercial plants can use either SMBS or SO2 gas. The CaO requirement for pH control will likely be slightly higher by approximately 0.5 mole CaO per mole SO2 or 0.58 grams CaO per gram SO2 as suggested by the following reactions:
2SO2 + 2NaOH → Na2S2O5 + H2O
Na2S2O5 + Ca(OH)2 → CaSO3 + Na2SO3 + H2O
2SO2 + 2Ca(OH)2 → 2CaSO3 + 2H2O
| | | | | |
Island Gold District – NI 43-101 Technical Report August 6, 2025 | 143
|
13.8.2 Historical Test Work
Previous cyanide destruction testing has already been completed for both Island Gold and Magino and both tests reached similar design considerations. Recent testing using variable operating parameters in a batch reactor was conducted to investigate the effects on cyanide detox on both ore types.
The batch reactor was first filled with feed slurry and the required copper sulphate was added. The reactor content is then treated in batch mode with SMBS as the SO2 source and air to reduce the concentration of CNWAD in solution to target less than 10 mg/L. The oxidation reduction potential of the pulp is monitored with a Pt/Ag/AgCl combination electrode, while the residual CNWAD concentration in the solution phase is analyzed during the test determined using the modified potentiometric titration method. Target batch retention times are between 60 and 120 minutes. The batch test serves to produce treated material with low residual CNWAD, and the product is used as starting feed material for the initial continuous test. Final solutions are submitted for analysis at the completion of each test or run. It should be noted that a nominal value of 10 mg/L is desired for the site target but also requires the ability to reach 1 mg/L at a later date should this become a requirement, prompting the need for more residence time. The operating parameters sourced from the previous test work reports and maintained in this design are presented below:
•Percent solids : 55% solids
•SO2:CNWAD ratio : 4-6:1
•Cu in solution : 25 – 50 mg/l
•pH : 8.0 – 8.2
•Oxygen sparging
The general relationship developed from the historical data was that a 1-hour detox was sufficient to achieve a CNWAD near 10 ppm while a 2-hour detox would be required when targeting 1 ppm. Island Gold detox has been shown to be more demanding in terms of reagent consumption therefore these values have been utilized for the blended feed material.
13.9 Metallurgical Results
A metallurgical test program was carried out to evaluate the impact on gold recovery of blending material from the Island Gold and Magino deposits using a gravity and tailings leach flowsheet, followed by thickening. Two blend ratios were tested at selected grind sizes to assess their effect on recovery performance.
Island Gold material has limited SMC test data available. For this program, a single sample was provided and tested, yielding an Axb value of 30.2. This result is consistent with previous tests reported in BML report BL946, which averaged an Axb of 30.0, classifying the sample as medium-hard with respect to SAG milling.
The Magino sample achieved combined gravity and leach gold recoveries ranging from 95.6 - 98.8%. Finer regrinding of the gravity tailings had no significant impact on gold extraction for this material.
The Island Gold sample showed slightly higher combined recoveries, between 97.3 - 98.2% gold. Gold content in the gravity concentrate was notably higher for this composite. However, recoveries decreased at coarser grind sizes, particularly above K₈₀ 100 µm.
| | | | | |
Island Gold District – NI 43-101 Technical Report August 6, 2025 | 144
|
Recovery curves have been modeled based on actual mill performance for both ores. The Island Gold recovery curve is based on 2023 through Q1-2025 daily grade / recovery data in the Island Gold Mill and the Magino recovery curve is based on daily grade / recovery data since Magino mill start-up in 2023. The corresponding gold recovery algorithms are as follows:
Island Gold
AuRec = exp(4.580933 – 0.135214/Au + 0.005823*ln(Au))
Magino
AuRec = 57.088538 + (40.341080 * Au^1.514130) / (0.192565^1.514130 + Au^1.514130)
Where, AuRec = recoverable gold (%)
Au = gold head grade (g/t)
The resultant recovery curves over expected grade ranges are illustrated in Figure 13-4.
Figure 13-4 Gold Recovery Curves
Source: Alamos (2025)
Both blend composites performed well overall. Blend 2, which contained a higher proportion of Island Gold material, delivered the highest overall gold recoveries, though a slight decline was observed as grind size increased. Based on the range of recoveries achieved in the test work and sensitivity to grind with the Island Gold ore, a calculated recovery has been developed to provide an overall recovery of approximately 96%. This is based on using a 1:9 blend ratio of Island Gold to Magino ore with average mine feed grades of 10.85 g/t gold for Island Gold and 0.91 g/t gold for Magino. Modeled recoveries of 97.7% for Island Gold and 93.9% for Magino are used, as shown in Table 13-9.
| | | | | |
Island Gold District – NI 43-101 Technical Report August 6, 2025 | 145
|
Table 13-9 Calculated Overall Recovery
| | | | | | | | | | | |
| Grade g/t Au | Blend Ratio | Recovery |
| Island Gold | 10.85 | 1 | 97.7% |
| Magino | 0.91 | 9 | 93.9% |
| Blend | 1.90 | 10 | 96.1% |
Cyanide tailings from selected tests were subjected to dewatering evaluations, including flocculant screening and static settling tests. AN913SH, applied at 20 g/t, a dosage consistent with the Magino operation, produced the fastest settling rates and was used in all static settling tests. These tests recorded free settling rates between 8.8 -16.2 m/h, with coarser grind sizes generally resulting in faster settling.
Note that silver is not measured during ore control nor in the mill process. However, historically 17% of all doré ounces produced are silver, with the other 83% gold.
| | | | | |
Island Gold District – NI 43-101 Technical Report August 6, 2025 | 146
|
14 MINERAL RESOURCE ESTIMATES
14.1 Summary
Updated Mineral Resource estimates were conducted for both the Island Gold underground and Magino open pit deposits, with an effective date of December 31st, 2024. The Island Gold and Magino Mineral Resource models are both separate and independent, and utilize different grade estimation and resource classification methodologies, as deemed appropriate by the respective QP’s and dictated by mining methods. The resource estimation methodologies for the Island Gold and the Magino deposits are described separately within this Section.
The Mineral Resource Estimates conform to CIM Definition Standards for Mineral Resources and Mineral Reserves (2014) and include Measured, Indicated and Inferred Resources.
The underground Mineral Resources have been prepared by Alamos under the supervision of Mr. Tyler Poulin, P.Geo., Island Gold District Geology Superintendent. Mr. Poulin is not independent of the issuer and takes QP responsibility as defined in NI 43-101 for the underground Mineral Resource estimate.
The open pit Mineral Resources have been prepared under the supervision of Mr. Jeffrey Volk, CPG, FAusIMM, Director of Reserves and Resources for Alamos Gold Inc. Mr. Volk is not independent of the issuer and takes QP responsibility as defined in NI 43-101 for the open pit Mineral Resource estimate.
A summary of the Mineral Resource estimates within the Island Gold District is presented in Table 14-1.
Table 14-1 Summary of Mineral Resources –as of December 31st, 2024
| | | | | | | | | | | |
| Category | Tonnes and Grade | Contained Gold |
| Tonnes (kt) | Gold Grade (g/t) | (koz) |
Island Gold - Underground Measured Indicated Sub-Total Measured + Indicated Inferred |
470 2,640 3,110 2,449 |
14.66 9.75 10.49 16.88 |
222 827 1,049 1,329 |
Magino – Open Pit Measured Indicated Sub-Total Measured + Indicated Inferred |
5,061 55,209 60,270 40,291 |
0.87 0.91 0.91 0.92 |
141 1,615 1,756 1,191 |
Total Island Gold District Measured Indicated Total Measured + Indicated Inferred |
5,531 57,849 63,380 42,740 |
2.04 1.31 1.38 1.83 |
363 2,442 2,805 2,520 |
•CIM Definition Standards for Mineral Resources and Mineral Reserves (2014) were used for reporting of Mineral Resources.
•Refer to the footnotes to Table 14-14 and Table 14-27 for prices, cut-off, metal recoveries, etc.
•Totals may not match due to rounding.
The Mineral Resources reported herein supersede the Mineral Resources reported previously at year-end 2024 by Alamos for the District on February 18th, 2025.
| | | | | |
Island Gold District – NI 43-101 Technical Report August 6, 2025 | 147
|
14.2 Mineral Resource Classification Definition
Mineral Resources were classified in accordance with the CIM Definition Standards for Mineral Resources and Mineral Reserves (2014).
A Mineral Resource is defined as a concentration or occurrence of solid material of economic interest in or on the Earth's crust, in such form, grade or quality, and quantity that there are reasonable prospects for eventual economic extraction.
The location, quantity, grade or quality, continuity, and other geological characteristics of a Mineral Resource are known, estimated, or interpreted based on specific geological evidence and knowledge, including sampling.
The definitions are as follows, with additional comments reflected in italics:
Inferred Mineral Resource
An Inferred Mineral Resource is that part of a Mineral Resource for which quantity and grade or quality are estimated based on limited geological evidence and sampling. Geological evidence is sufficient to imply but not verify geological and grade or quality continuity.
An Inferred Mineral Resource has a lower level of confidence than an Indicated Mineral Resource and must not be converted to a Mineral Reserve. It is reasonably expected that the majority of Inferred Mineral Resources could be upgraded to Indicated Mineral Resources with continued exploration.
An Inferred Mineral Resource is based on limited information and sampling gathered through appropriate sampling techniques from locations such as outcrops, trenches, pits, workings and drillholes. Inferred Mineral Resources must not be included in the economic analysis, production schedules, or estimated mine life in publicly disclosed Pre-Feasibility or Feasibility Studies, or in the Life of Mine plans and cash flow models of developed mines. Inferred Mineral Resources can only be used in economic studies as provided under NI 43-101.
Indicated Mineral Resource
An Indicated Mineral Resource is that part of a Mineral Resource for which quantity, grade or quality, densities, shape, and physical characteristics are estimated with sufficient confidence to allow the application of Modifying Factors in sufficient detail to support mine planning and evaluation of the economic viability of the deposit.
Geological evidence is derived from adequately detailed and reliable exploration, sampling, and testing, and is sufficient to assume geological and grade or quality continuity between points of observation.
An Indicated Mineral Resource has a lower level of confidence than a Measured Mineral Resource and may only be converted to a Probable Mineral Reserve.
Mineralization may be classified as an Indicated Mineral Resource by the Qualified Person when the nature, quality, quantity and distribution of data are such as to allow confident interpretation of the geological framework and to reasonably assume the continuity of mineralization. The Qualified Person must recognize the importance of the Indicated Mineral Resource category to the advancement of the feasibility of the project. An Indicated Mineral Resource estimate is of sufficient quality to support a Pre-Feasibility Study which can serve as the basis for major development decisions.
| | | | | |
Island Gold District – NI 43-101 Technical Report August 6, 2025 | 148
|
Measured Mineral Resource
A Measured Mineral Resource is that part of a Mineral Resource for which quantity, grade or quality, densities, shape, and physical characteristics are estimated with sufficient confidence to allow the application of Modifying Factors to support detailed mine planning and final evaluation of the economic viability of the deposit.
Geological evidence is derived from detailed and reliable exploration, sampling, and testing and is sufficient to confirm geological and grade or quality continuity between points of observation.
A Measured Mineral Resource has a higher level of confidence than either an Indicated Mineral Resource or an Inferred Mineral Resource. It may be converted to a Proven Mineral Reserve or to a Probable Mineral Reserve.
Mineralization or other natural material of economic interest may be classified as a Measured Mineral Resource by the Qualified Person when the nature, quality, quantity, and distribution of data are such that the tonnage and grade or quality of the mineralization can be estimated to within close limits and that variation from the estimate would not significantly affect potential economic viability of the deposit. This category requires a high level of confidence in, and understanding of, the geology and controls of the mineral deposit.
14.3 Island Gold Mine
This section describes the Mineral Resource estimation methodology for Island Gold underground and summarizes key assumptions used for the estimate. In the opinion of the QP, the Mineral Resource evaluation reported herein is a reasonable representation of the gold Mineral Resources contained within the Island Gold deposit.
The Mineral Resource Estimates conform to CIM Definition Standards for Mineral Resources and Mineral Reserves (2014) and include Measured, Indicated and Inferred Resources.
Mineral Resources are not Mineral Reserves and do not have demonstrated economic viability. There is no certainty that all or any part of the Mineral Resources will be converted into Mineral Reserves.
Island Gold’s technical staff carried out geological interpretation of the mineralized zones according to local conventions used at Island Gold as follows:
•C, D, D1, E2, and E1E for the Upper Island Gold Sector and Lochalsh Sector;
•GD2, GP2, GD3, GP5, GD6, GD7, and GD9 for the Goudreau Sector;
•B, C, CW, D, D1, DN1, DN2, DN3, G, G1, GNW, H, NS1, NS2, and STH for the Lower Island Gold Sector;
•E1E, E1D1 and E1D for the Island Gold East Sector; and
•The NTH zones (NTH, NTH1, NTH2, NTH3, NTH4 AND NTH5) in the Island Gold East Sector.
The sectors are clearly defined on longitudinal sections indicating surface and underground drilling (Figure 14-1 and Figure 14-2).
| | | | | |
Island Gold District – NI 43-101 Technical Report August 6, 2025 | 149
|
Figure 14-1 Surface Diamond Drilling – Island Gold Mine
Source: Alamos (2025)
Figure 14-2 Underground Diamond Drilling – Island Gold Mine
Source: Alamos (2025)
| | | | | |
Island Gold District – NI 43-101 Technical Report August 6, 2025 | 150
|
14.3.1 Methodology
The Mineral Resource evaluation methodology involves the following procedures:
•Compilation and validation of the diamond drillhole and chip sample database used for the Mineral Resource estimate;
•Construction of wireframe models to define the boundaries of gold mineralization;
•Generation of a prototype block model fitting the wireframes, with determination of appropriate parent block sizes for each zone;
•Definition of domains within the various zones, where applicable;
•Extraction and filtering of assay data within each mineralized zone;
•Analysis of high-grade outliers and application of capping grade values to the raw trace and assay data, with cap values applied by domain or zone;
•Creation of composites, with composite type and parameters assessed individually by zone;
•Evaluation of whether dynamic anisotropy should be applied to each zone, and if so, estimation of dip and dip direction angles from the wireframes into the block model;
•Selection of estimation methods and parameters for each zone and/or domain, including a variography study where kriging estimation is employed;
•Generation of block model estimates using Studio RM software (Datamine Studio RM);
•Initial validation of the model using various methods;
•Identification of diabase dykes and assignment of specific grade and density values;
•Classification of material based on the geologist’s interpretation and by identifying areas of that have reasonable prospects for economic extraction, following the CIM guidelines and best practices;
•Secondary model validation (visual, statistical, and interpretive checks); and
•Preparation of the Mineral Resource statement.
Datamine Studio RM version 2.1.125.0 (Studio RM) software was used to prepare assay data for geostatistical analysis, construct the block model, estimate metal grades, construct all geological models and tabulate Mineral Resources. Block model validation was conducted in Snowden Supervisor version 9.0.
The Island Gold Geology Department defines mineralized intersections for each diamond drillhole and underground development face. Drillhole intersections are interpreted based on diamond drill core logging, while development face intersections are interpreted using a combination of face mapping and assay results. Each mineralized intersection is coded in the database according to its corresponding zone name.
14.3.2 Databases
Two separate databases are used to support the Mineral Resource estimates: one for surface and underground diamond drillholes, and a second for channel sampling, which includes samples collected from underground development faces and test holes. Both databases are managed in acQuire and imported into Studio RM for resource modelling. Test hole data is excluded from block model estimations.
| | | | | |
Island Gold District – NI 43-101 Technical Report August 6, 2025 | 151
|
The drillhole database includes all drilling completed within the local mine area, specifically between mine grid coordinates 13,800E to 18,910E and 3,000N to 5,500N. It is managed using acQuire GIM Suite version 4.0.3. As of December 31st, 2024, the database contained 8,113 diamond drillholes totaling 1,652,679 m of surface and underground drilling (Table 14-2). Several surface holes were drilled prior to 1985 during exploration programs led by Canamax and previous owners, with subsequent drilling programs conducted by Patricia, Richmont, and most recently by Alamos.
Table 14-2 Island Gold Drillhole Database Summary (as of 31 December 2024)
| | | | | | | | |
| Location | No. of Holes | Length (m) |
| Surface | 855 | 491,280 |
| Underground | 7,258 | 1,161,399 |
| Total | 8,113 | 1,652,679 |
A total of 855 holes representing 491,280 m have been drilled from surface (~ 30% based on drill metres) and 7,258 holes totaling 1,161,399 m have been drilled from underground (~ 70% based on drill metres) at Island Gold (Figure 14-1 and Figure 14-2, respectively). The drillholes span the entire strike length of the resource area, with drill spacings varying from approximately 10 - 80 m and were completed at a range of orientations.
Although extensive maintenance and quality control are applied to ensure the database remains a reliable source for resource estimation, some data must still be removed or filtered by the user to ensure only appropriate information is used. For example, certain drillhole intersections within mineralized zones have been core logged but not sampled. These cases are generally addressed individually, either by excluding the intervals from the estimation or by assigning them a grade value of zero.
In addition to the drillholes, underground channel samples collected from Island Gold are incorporated into the Mineral Resource estimation. These samples were taken from the 125L (Upper Mine) to the 920L (Lower Sector). A summary of the channel sampling is provided in Table 14-3.
Table 14-3 Island Gold Channel Sample Database Summary (as of December 31st, 2024)
| | | | | | | | |
| Sample type | No of Channels | Length (m) |
| Channel sampling | 11,205 | 48,541 |
14.3.3 Geological Interpretations
All mineralized 3D wireframes and dyke solids are generated using implicit modeling (Datamine’s vein modeling tool) to ensure flexibility and reproducibility of the solids. A minimum true width of 2.0 m was applied to all interpreted zones. Each solid was validated by the Island Gold Resource Geologist through plan and section views to maintain consistency.
A representative cross section illustrating the gold mineral zone interpretations for Island Gold is shown in Figure 14-3, while Figure 14-4 presents the resulting 3D solids in an isometric view.
| | | | | |
Island Gold District – NI 43-101 Technical Report August 6, 2025 | 152
|
Figure 14-3 Cross-Section 14740E Showing Island Gold Mineralized Zones
Source: Alamos (2025)
Figure 14-4 3D Isometric View of Island Gold’s Mineralized Zone Solids
Source: Alamos (2025)
| | | | | |
Island Gold District – NI 43-101 Technical Report August 6, 2025 | 153
|
14.3.4 Evaluation of Outliers
To mitigate the influence of high-grade sample outliers on grade estimation, grade capping is applied. These outliers are considered non-representative of the broader sample population and are capped at a level that aligns with the general data distribution.
High-grade outlier analysis and the application of capping thresholds for Island Gold were completed separately for each mineralized zone and domain. In most cases, the analysis was performed on raw assay data, except for domain 730_8 of the C Zone where composited assay data was used. The Global Topcut Analysis tool within Datamine Supervisor software (Figure 14-5) was used to generated histograms, probability plots, mean and variance plots and cumulative metal plots for each zone or domain to support the selection of appropriate grade capping thresholds.
Figure 14-5 Global Topcut Analysis in Datamine Supervisor for the CW Zone
Source: Alamos (2025)
| | | | | |
Island Gold District – NI 43-101 Technical Report August 6, 2025 | 154
|
Table 14-4 and Table 14-5 summarize key statistics derived from the raw assay data, except for domain 730_8 of the C Zone, where composite data was used. The statistics indicate that approximately 4.8% of the diamond drillhole samples and 5.6% of the channel samples were capped.
The histogram, log-probability plot, mean and variance plot, and cumulative metal plot were used to evaluate the assay data distribution and identify potential statistical outliers. Based on this analysis, a capping grade of 85 g/t gold was applied to the CW Zone to mitigate the influence of high-grade outliers on the resource estimation.
| | | | | |
Island Gold District – NI 43-101 Technical Report August 6, 2025 | 155
|
Table 14-4 Summary Statistics of Assays from Diamond Drillhole Samples
| | | | | | | | | | | | | | | | | | | | | | | | | | | | | | | | | | | | | | | | | | | | |
| | | | Raw | | Capped | | |
| Zone | Rockcode | Domain | Sample Type | Uncut Samples | Uncapped Mean | SD | C.V. | Capping | Capped Samples | Capped Mean | SD | Cap C.V. | Apparent loss % | Capped % |
| IGU-E1E | 110 | 110_1 | DDH | 1080 | 13.11 | 62.41 | 4.76 | 100 | 25 | 8.86 | 19.75 | 2.23 | -32.4% | 2.31% |
| IGU-D | 120 | 120_1 | DDH | 1259 | 10.71 | 52.79 | 4.93 | 75 | 35 | 6.87 | 14.81 | 2.16 | -35.9% | 2.78% |
| IGU-C | 130 | 130_1 | DDH | 814 | 3.87 | 15.75 | 4.07 | 75 | 6 | 3.34 | 9.28 | 2.78 | -13.7% | 0.74% |
| IGU-E2 | 150 | 150_1 | DDH | 3368 | 8.15 | 30.81 | 3.78 | 100 | 49 | 6.67 | 16.87 | 2.53 | -18.2% | 1.45% |
| IGU-D1 | 160 | 160_1 | DDH | 286 | 7.33 | 21.38 | 2.92 | 75 | 8 | 6.34 | 15.18 | 2.39 | -13.5% | 2.80% |
| IGU-EXT1-E1E | 210 | 210_1 | DDH | 1049 | 6.76 | 19.40 | 2.87 | 75 | 15 | 5.90 | 12.49 | 2.12 | -12.7% | 1.43% |
| E1D | 305 | 305_1 | DDH | 365 | 42.08 | 132.62 | 3.15 | 100 | 39 | 22.38 | 34.27 | 1.53 | -46.8% | 10.68% |
| E1D1 | 308 | 308_1 | DDH | 1060 | 17.28 | 64.21 | 3.72 | 90 | 51 | 10.87 | 22.34 | 2.06 | -37.1% | 4.81% |
| E1E | 310 | 310_1 | DDH | 6116 | 20.06 | 86.25 | 4.30 | 185 | 134 | 14.45 | 34.97 | 2.42 | -28.0% | 2.19% |
| E1E | 310 | 310_2 | DDH | 2453 | 7.75 | 24.79 | 3.20 | 80 | 54 | 6.29 | 14.57 | 2.32 | -18.8% | 2.20% |
| E1E | 310 | 310_3 | DDH | 4008 | 15.63 | 73.04 | 4.67 | 135 | 93 | 10.74 | 25.97 | 2.42 | -31.3% | 2.32% |
| E1E | 310 | 310_4 | DDH | 5557 | 23.61 | 111.39 | 4.72 | 185 | 148 | 16.21 | 37.91 | 2.34 | -31.3% | 2.66% |
| E1E | 310 | 310_5_HG | DDH | 3999 | 45.59 | 140.22 | 3.08 | 400 | 65 | 38.68 | 75.26 | 1.95 | -15.2% | 1.63% |
| E1E | 310 | 310_5_LG | DDH | 15650 | 4.25 | 33.85 | 7.95 | 35 | 250 | 2.40 | 5.14 | 2.14 | -43.5% | 1.60% |
| LC-E1E | 410 | 410_1 | DDH | 162 | 10.88 | 28.26 | 2.60 | 60 | 8 | 8.36 | 15.49 | 1.85 | -23.2% | 4.94% |
| LC-D | 420 | 420_1 | DDH | 50 | 8.13 | 13.20 | 1.62 | 45 | 2 | 7.72 | 11.81 | 1.53 | -5.0% | 4.00% |
| LC-C | 430 | 430_1 | DDH | 1518 | 10.02 | 43.62 | 4.35 | 75 | 37 | 6.99 | 14.68 | 2.10 | -30.2% | 2.44% |
| LC-E2 | 450 | 450_1 | DDH | 245 | 9.59 | 27.48 | 2.87 | 55 | 7 | 7.32 | 12.05 | 1.65 | -23.7% | 2.86% |
| GD2 | 620 | 620_1 | DDH | 270 | 83.72 | 330.28 | 3.95 | 100 | 39 | 23.08 | 36.74 | 1.59 | -72.4% | 14.44% |
| GD3 | 630 | 630_1 | DDH | 305 | 16.79 | 68.70 | 4.09 | 75 | 19 | 7.47 | 19.24 | 2.58 | -55.5% | 6.23% |
| GP5 | 655 | 655_1 | DDH | 497 | 40.81 | 221.98 | 5.44 | 75 | 48 | 13.61 | 23.82 | 1.75 | -66.7% | 9.66% |
| GD6 | 660 | 660_1 | DDH | 95 | 14.65 | 40.06 | 2.73 | 100 | 4 | 11.19 | 24.42 | 2.18 | -23.6% | 4.21% |
| G7 | 670 | 670_1 | DDH | 313 | 13.44 | 47.79 | 3.56 | 75 | 12 | 8.42 | 17.40 | 2.07 | -37.4% | 3.83% |
| GD9 | 690 | 690_1 | DDH | 253 | 8.83 | 30.06 | 3.41 | 100 | 5 | 7.43 | - | - | -15.9% | 1.98% |
| D | 720 | 720_1 | DDH | 282 | 16.65 | 49.22 | 2.96 | 98 | 15 | 11.70 | 25.22 | 2.16 | -29.7% | 5.32% |
| DW | 720 | 720_2 | DDH | 156 | 15.07 | 64.75 | 4.30 | 36 | 16 | 6.03 | 11.39 | 1.89 | -60.0% | 10.26% |
| D1 | 725 | 725 | DDH | 470 | 19.31 | 84.18 | 4.36 | 45 | 39 | 7.55 | 12.88 | 1.71 | -60.9% | 8.30% |
| C | 730 | 730_1-7 | DDH | 9849 | 15.93 | 76.44 | 4.80 | 230 | 112 | 12.50 | 34.86 | 2.79 | -21.5% | 1.14% |
| C | 730 | 730_8_HG | DDH | 2012 | 35.70 | 72.99 | 2.04 | 300 | 37 | 33.37 | 59.26 | 1.78 | -6.5% | 1.84% |
| C | 730 | 730_8_LG | DDH | 3463 | 3.31 | 40.64 | 12.29 | 20 | 39 | 2.08 | 2.90 | 1.39 | -37.2% | 1.13% |
| CD1N | 732 | 732_1 | DDH | 1077 | 18.80 | 55.59 | 2.96 | 225 | 16 | 16.58 | 39.58 | 2.39 | -11.8% | 1.49% |
| CW | 735 | 735_1 | DDH | 689 | 16.43 | 49.75 | 3.03 | 85 | 29 | 11.21 | 21.02 | 1.87 | -31.8% | 4.21% |
| G | 740 | 740_1 | DDH | 937 | 21.40 | 225.74 | 10.55 | 70 | 23 | 6.70 | 13.91 | 2.08 | -68.7% | 2.45% |
| GNW | 742 | 742_1 | DDH | 217 | 10.43 | 29.79 | 2.86 | 70 | 4 | 8.55 | 16.38 | 1.92 | -18.0% | 1.84% |
| G1 | 745 | 745_1 | DDH | 395 | 8.55 | 30.03 | 3.51 | 30 | 24 | 4.81 | 8.02 | 1.67 | -43.7% | 6.08% |
| DN3 | 746 | 746_1 | DDH | 125 | 7.03 | 23.64 | 3.36 | 35 | 4 | 4.29 | 7.52 | 1.75 | -39.0% | 3.20% |
| DN1 | 748 | 748_1 | DDH | 487 | 6.27 | 23.16 | 3.69 | 35 | 17 | 4.08 | 7.85 | 1.92 | -34.9% | 3.49% |
| DN2 | 749 | 749_1 | DDH | 24 | 15.94 | 34.85 | 2.19 | 35 | 2 | 8.40 | 9.96 | 1.19 | -47.3% | 8.33% |
| STH | 750 | 750_1 | DDH | 249 | 8.93 | 27.20 | 3.05 | 50 | 12 | 5.96 | 11.90 | 2.00 | -33.3% | 4.82% |
| H | 755 | 755_1 | DDH | 86 | 24.32 | 67.19 | 2.76 | 38 | 10 | 8.23 | 13.16 | 1.60 | -66.2% | 11.63% |
| B | 760 | 760_1 | DDH | 2340 | 17.21 | 165.41 | 9.61 | 120 | 63 | 9.24 | 24.02 | 2.60 | -46.3% | 2.69% |
| B | 762 | 762_1 | DDH | 922 | 27.86 | 113.78 | 4.08 | 200 | 27 | 18.66 | 44.70 | 2.40 | -33.0% | 2.93% |
| NS1 | 780 | 780_1 | DDH | 1429 | 18.11 | 75.28 | 4.16 | 100 | 56 | 10.18 | 22.48 | 2.21 | -43.8% | 3.92% |
| NS2 | 781 | 781_1 | DDH | 431 | 9.07 | 28.82 | 3.18 | 35 | 21 | 5.33 | 9.01 | 1.69 | -41.2% | 4.87% |
| NTH4 | 807 | 807_1 | DDH | 316 | 32.66 | 133.07 | 4.07 | 100 | 23 | 15.39 | 28.83 | 1.87 | -52.9% | 7.28% |
| NTH4 | 807 | 807_2 | DDH | 80 | 19.01 | 66.00 | 3.47 | 40 | 6 | 6.03 | 11.55 | 1.92 | -68.3% | 7.50% |
| NTH2 | 808 | 808_1 | DDH | 158 | 16.71 | 8.92 | 3.30 | 35 | 12 | 5.36 | 9.69 | 1.81 | -67.9% | 7.59% |
| NTH1 | 809 | 809_1 | DDH | 64 | 28.43 | 77.83 | 2.74 | 35 | 9 | 9.14 | 12.97 | 1.42 | -67.9% | 14.06% |
| NTH | 810 | 810_1 | DDH | 508 | 8.67 | 48.23 | 5.57 | 35 | 16 | 5.40 | 7.54 | 1.39 | -37.7% | 3.15% |
| NTH5 | 811 | 811_1 | DDH | 215 | 9.87 | 41.03 | 4.16 | 26 | 17 | 4.65 | 7.39 | 1.59 | -52.9% | 7.91% |
| NTH3 | 815 | 815_1 | DDH | 519 | 10.47 | 30.42 | 2.91 | 60 | 23 | 7.36 | 14.32 | 1.95 | -29.7% | 4.43% |
| C | | Main | DDH | 9849 | 15.93 | 76.44 | 4.80 | 230 | 112 | 12.50 | 34.86 | 2.79 | -21.5% | 1.14% |
| C | | HG | DDH | 2012 | 35.70 | 72.99 | 2.04 | 300 | 37 | 33.37 | 59.26 | 1.78 | -6.5% | 1.84% |
| C | | LG | DDH | 3463 | 3.31 | 40.64 | 12.29 | 20 | 39 | 2.08 | 2.90 | 1.39 | -37.2% | 1.13% |
| | | | | |
Island Gold District – NI 43-101 Technical Report August 6, 2025 | 156
|
Table 14-5 Summary Statistics of Assays from Underground Channel Samples
| | | | | | | | | | | | | | | | | | | | | | | | | | | | | | | | | | | | | | | | | | | | |
| | | Raw | | Topcut | | | |
| Zone | Rockcode | Domain | Sample Type | Uncut Samples | Uncapped Mean | SD | C.V. | Capping | Capped Samples | Capped mean | SD | Cap C.V. | Apparent loss % | Capped % |
| IGU-E1E | 110 | 110_1 | Chip | 7198 | 12.25 | 43.15 | 3.52 | 75 | 274 | 8.42 | 17.36 | 2.06 | -31.3% | 3.81% |
| IGU-D | 120 | 120_1 | Chip | 3193 | 16.03 | 82.57 | 5.15 | 75 | 136 | 9.34 | 17.81 | 1.91 | -41.7% | 4.26% |
| IGU-C | 130 | 130_1 | Chip | 3311 | 14.64 | 51.69 | 3.53 | 75 | 136 | 9.22 | 17.64 | 1.91 | -37.0% | 4.11% |
| IGU-E2 | 150 | 150_1 | Chip | 265 | 8.81 | 25.79 | 2.93 | 30 | 20 | 4.85 | 8.51 | 1.75 | -44.9% | 7.55% |
| IGU-D1 | 160 | 160_1 | Chip | 1383 | 6.27 | 20.55 | 3.28 | 75 | 26 | 5.32 | 13.16 | 2.47 | -15.2% | 1.88% |
| IGU-EXT1-E1E | 210 | 210_1 | Chip | 2907 | 14.94 | 52.80 | 3.53 | 75 | 119 | 9.55 | 17.89 | 1.87 | -36.1% | 4.09% |
| E1E | 310 | 310_1 | Chip | 961 | 13.12 | 48.31 | 3.68 | 125 | 16 | 10.12 | 22.50 | 2.22 | -22.9% | 1.66% |
| E1E | 310 | 310_2 | Chip | 2644 | 11.92 | 53.78 | 4.51 | 125 | 54 | 9.20 | 22.63 | 2.46 | -22.8% | 2.04% |
| E1E | 310 | 310_3 | Chip | 1634 | 17.31 | 63.08 | 3.64 | 150 | 44 | 13.60 | 31.93 | 2.35 | -21.4% | 2.69% |
| E1E | 310 | 310_4 | Chip | 139 | 21.03 | 49.74 | 2.37 | 125 | 11 | 17.16 | 37.53 | 2.19 | -18.4% | 7.91% |
| E1E | 310 | 310_5_HG | Chip | 125 | 29.57 | 66.60 | 2.25 | 400 | 1 | 28.94 | 62.57 | 2.16 | -2.1% | 0.80% |
| E1E | 310 | 310_5_LG | Chip | 282 | 4.11 | 15.53 | 3.78 | 10 | 16 | 1.84 | 2.56 | 1.39 | -55.2% | 5.67% |
| LC-E1E | 410 | 410_1 | Chip | 2088 | 10.90 | 44.78 | 4.11 | 75 | 71 | 6.77 | 16.20 | 2.39 | -37.9% | 3.40% |
| GD2 | 620 | 620_1 | Chip | 562 | 19.41 | 99.55 | 5.13 | 75 | 34 | 8.53 | 19.78 | 2.32 | -56.1% | 6.05% |
| GD3 | 630 | 630_1 | Chip | 715 | 12.81 | 78.91 | 6.16 | 75 | 22 | 5.58 | 15.49 | 2.78 | -56.4% | 3.08% |
| GP5 | 655 | 655_1 | Chip | 803 | 34.85 | 127.95 | 3.67 | 75 | 79 | 14.83 | 24.36 | 1.64 | -57.4% | 9.84% |
| GD6 | 660 | 660_1 | Chip | 284 | 13.02 | 40.48 | 3.11 | 75 | 14 | 8.42 | 19.02 | 2.26 | -35.3% | 4.93% |
| G7 | 670 | 670_1 | Chip | 917 | 5.74 | 24.06 | 4.20 | 75 | 15 | 4.36 | 12.14 | 2.78 | -24.0% | 1.64% |
| GD9 | 690 | 690_1 | Chip | 21 | 27.13 | 92.35 | 3.40 | 75 | 2 | 9.14 | 22.04 | 2.41 | -66.3% | 9.52% |
| D | 720 | 720_1 | Chip | 65 | 15.32 | 74.55 | 4.87 | 20 | 5 | 3.91 | 6.05 | 1.50 | -74.5% | 7.69% |
| C | 730 | 730_1-7 | DDH | 6010 | 19.86 | 109.95 | 5.54 | 130 | 167 | 11.88 | 26.81 | 2.26 | -40.2% | 2.78% |
| C | 730 | 730_8_HG | DDH | 1763 | 54.98 | 106.90 | 1.94 | 350 | 41 | 49.63 | 75.23 | 1.52 | -9.7% | 2.33% |
| C | 730 | 730_8_LG | DDH | 1963 | 2.16 | 5.95 | 2.76 | 6 | 46 | 1.65 | 1.28 | 0.78 | -23.6% | 2.34% |
| CD1N | 732 | 732_1 | Chip | 589 | 24.93 | 72.46 | 2.91 | 125 | 30 | 17.56 | 32.98 | 1.88 | -29.6% | 5.09% |
| G | 740 | 740_1 | Chip | 334 | 8.77 | 41.36 | 4.72 | 35 | 13 | 8.77 | 41.36 | 4.72 | 0.0% | 3.89% |
| GNW | 742 | 742_1 | Chip | 96 | 13.22 | 54.06 | 4.09 | 30 | 7 | 4.44 | 7.83 | 1.76 | -66.4% | 7.29% |
| B | 760 | 760_1 | Chip | 478 | 21.26 | 82.21 | 3.87 | 104 | 25 | 12.35 | 25.86 | 2.09 | -41.9% | 5.23% |
| B2 | 762 | 762_1 | Chip | 273 | 36.81 | 137.33 | 3.73 | 170 | 12 | 18.18 | 39.65 | 2.18 | -50.6% | 4.40% |
| NS1 | 780 | 780_1 | Chip | 429 | 36.96 | 154.13 | 4.17 | 250 | 14 | 21.52 | 52.83 | 2.45 | -41.8% | 3.26% |
| NTH4 | 807 | 807_1 | Chip | 27 | 28.95 | 40.98 | 1.58 | 35 | 7 | 12.86 | 13.52 | 1.05 | -55.6% | 25.93% |
| GP2 | #N/A | | Chip | 99 | 29.06 | 65.37 | 2.25 | 75 | 13 | 18.43 | 26.98 | 1.46 | -36.6% | 13.13% |
| | | | | |
Island Gold District – NI 43-101 Technical Report August 6, 2025 | 157
|
14.3.5 Compositing
To reduce any bias from varying sample length, gold assays were composited within each mineralized zone and/or domain. The thickness of the mineralized zone and the average sample lengths were considered when selecting the composite lengths (see Figure 14-6).
Most assay samples for Island Gold were composited to a targeted length of 1.0 m within the mineralized zone boundaries, except for the E1E Domain and some zones from the GD and NTH Sectors, which were composited to a targeted length of 2.0 m. In the targeted composite length method, the maximum composite length was set by the COMPDH process in Datamine Studio RM to 1.5 times the targeted length and minimum composite length of 0.3 m (see Figure 14-7).
Figure 14-6 Histogram of Sample Lengths from the C Zone
Source: Alamos (2025)
| | | | | |
Island Gold District – NI 43-101 Technical Report August 6, 2025 | 158
|
Figure 14-7 Histogram of Composited Lengths for the C Zone
Source: Alamos (2025)
Descriptive statistics of the coded composites used for the zones are shown in Table 14-6.
Table 14-6 Summary Statistic for Composites
| | | | | | | | | | | | | | | | | | | | |
| Zone | Rockcode | Domain | No. of Composites | Mean Gold Grade (g/t) | Standard Deviation | Coefficient of Variation |
| IGU-E1E | 110 | 110_1 | 5,896 | 6.70 | 11.16 | 1.67 |
| IGU-D | 120 | 120_1 | 2,580 | 7.86 | 10.86 | 1.38 |
| IGU-C | 130 | 130_1 | 2,269 | 8.30 | 11.97 | 1.44 |
| IGU-E2 | 150 | 150_1 | 277 | 4.74 | 6.51 | 1.37 |
| IGU-D1 | 160 | 160_1 | 1,210 | 3.78 | 7.01 | 1.85 |
| IGU-EXT1-E1E | 210 | 210_1 | 2,434 | 7.71 | 11.95 | 1.55 |
| E1D | 305 | 305_1 | 201 | 17.49 | 26.75 | 1.53 |
| | | | | |
Island Gold District – NI 43-101 Technical Report August 6, 2025 | 159
|
| | | | | | | | | | | | | | | | | | | | |
| Zone | Rockcode | Domain | No. of Composites | Mean Gold Grade (g/t) | Standard Deviation | Coefficient of Variation |
| E1D1 | 308 | 308_1 | 452 | 10.71 | 17.72 | 1.65 |
| E1E | 310 | 310_1 | 3,046 | 12.42 | 24.26 | 1.95 |
| E1E | 310 | 310_2 | 3,356 | 6.87 | 13.60 | 1.98 |
| E1E | 310 | 310_3 | 2,642 | 10.32 | 19.82 | 1.92 |
| E1E | 310 | 310_4 | 2,701 | 14.23 | 27.84 | 1.96 |
| E1E | 310 | 310_5_HG | 1,198 | 32.54 | 46.44 | 1.43 |
| E1E | 310 | 310_5_LG | 4,658 | 1.94 | 2.95 | 1.52 |
| LC-E1E | 410 | 410_1 | 2,288 | 5.80 | 10.00 | 1.72 |
| LC-D | 420 | 420_1 | 40 | 7.17 | 9.47 | 1.32 |
| LC-C | 430 | 430_1 | 113 | 7.14 | 10.18 | 1.43 |
| LC-E2 | 450 | 450_1 | 177 | 7.29 | 9.39 | 1.29 |
| GD2 | 620 | 620_1 | 679 | 11.35 | 21.03 | 1.85 |
| GD3 | 630 | 630_1 | 760 | 4.82 | 11.67 | 2.42 |
| GP5 | 655 | 655_1 | 866 | 12.29 | 18.63 | 1.52 |
| GD6 | 660 | 660_1 | 273 | 7.44 | 16.54 | 2.22 |
| G7 | 670 | 670_1 | 859 | 5.29 | 11.47 | 2.17 |
| GD9 | 690 | 690_1 | 146 | 3.55 | 8.69 | 2.45 |
| D | 720 | 720_1 | 133 | 7.48 | 10.53 | 1.41 |
| DW | 720 | 720_2 | 54 | 4.91 | 5.28 | 1.08 |
| D1 | 725 | 725_1 | 135 | 6.26 | 7.74 | 1.24 |
| C | 730 | 730_1-7 | 10,185 | 10.47 | 22.44 | 2.14 |
| C | 730 | 730_8_HG | 3,769 | 41.01 | 67.73 | 1.65 |
| C | 730 | 730_8_LG | 5,246 | 1.93 | 2.45 | 1.27 |
| CD1N | 732 | 732_1 | 1,198 | 15.64 | 29.70 | 1.90 |
| CW | 735 | 735_1 | 348 | 10.61 | 16.50 | 1.56 |
| G | 740 | 740_1 | 692 | 5.29 | 8.05 | 1.52 |
| GNW | 742 | 742_1 | 115 | 5.77 | 8.16 | 1.41 |
| G1 | 745 | 745_1 | 217 | 3.88 | 5.35 | 1.38 |
| DN3 | 746 | 746_1 | 6 | 5.95 | 4.30 | 0.72 |
| DN1 | 748 | 748_1 | 149 | 3.11 | 4.08 | 1.31 |
| DN2 | 749 | 749_1 | 41 | 3.67 | 4.50 | 1.23 |
| STH | 750 | 750_1 | 155 | 6.47 | 13.76 | 2.13 |
| B | 760 | 760_1 | 2,159 | 7.70 | 17.16 | 2.23 |
| B | 760 | 760_1 | 724 | 16.04 | 33.16 | 2.07 |
| NS1 | 780 | 780_1 | 524 | 11.79 | 24.32 | 2.06 |
| NS2 | 781 | 781_1 | 231 | 4.91 | 6.86 | 1.40 |
| NTH4 | 807 | 807_1 | 180 | 12.94 | 20.27 | 1.57 |
| NTH4 | 807 | 807_2 | 36 | 4.86 | 6.26 | 1.29 |
| NTH2 | 808 | 808_1 | 16 | 8.01 | 4.00 | 0.50 |
| NTH1 | 809 | 809_1 | 42 | 5.24 | 6.69 | 1.28 |
| NTH | 810 | 810_1 | 156 | 5.30 | 5.14 | 0.97 |
| NTH5 | 811 | 811_1 | 122 | 3.50 | 4.36 | 1.25 |
| | | | | |
Island Gold District – NI 43-101 Technical Report August 6, 2025 | 160
|
| | | | | | | | | | | | | | | | | | | | |
| Zone | Rockcode | Domain | No. of Composites | Mean Gold Grade (g/t) | Standard Deviation | Coefficient of Variation |
| NTH3 | 815 | 815_1 | 315 | 5.53 | 9.50 | 1.72 |
| GP2 | 625 | 625_1 | 62 | 16.20 | 20.60 | 1.27 |
14.3.6 Density
Multiple density studies have been conducted on various lithologies at Island Gold throughout its operational history, including the most recent campaign completed in 2024. Based on these programs, the bulk density of the mineralized material has been consistently established at 2.78 tonnes per cubic metre (t/m3) (Table 14-7).
Table 14-7 Density Measurements (2022 data)
| | | | | | | | | | | | | | |
| Rock Type | Measurements | Density (t/m3) | Standard Deviation | Coefficient of Variation (RSD) |
| Ore | 2933 | 2.78 | 0.10 | 4% |
| Diabase | 30 | 3.11 | 0.10 | 3% |
In November 2022, a focused density study on diabase dykes was undertaken, utilizing a combination of randomly selected chip samples and drill core. This study yielded an average density of 3.11 t/m³ for the dyke material. The resulting value has been incorporated into all block model density assignments and resource estimations completed since December 2022.
14.3.7 Variography
Spatial continuity of gold mineralization at Island Gold was evaluated in Studio RM using capped composite assays for each mineralized zone domain. Variograms, predominantly based on normal score-transformed data, were modelled for most domains; however, in smaller domains, variogram modelling was not feasible due to insufficient sample support.
Variogram model parameters derived from the geostatistical analysis are summarized in Table 14-8.
The resulting variogram orientations were visualized in Studio RM to ensure alignment with the geometry of the interpreted mineralized zones. Overall, the modelled orientations show good agreement with the general trends of the mineralization. In some cases, minor adjustments to the rotation angles were made to honour key geological constraints. The final search ellipse orientations are illustrated on the long section presented in Figure 14-8.
Two primary plunge orientations characterize the gold mineralization at Island Gold. The dominant, longer-range structure plunges moderately toward the south-southeast, while a secondary, but still significant shorter-range structure exhibits a 30 - 45° rake plunging westward. RPA et al. (2004) previously interpreted the westward plunge as being associated with flexural fold hinges. These plunge directions are visually evident in the block model coloured by detailed grade bins and are further supported by variography of the more spatially continuous veins, notably the C and E1E Zones.
| | | | | |
Island Gold District – NI 43-101 Technical Report August 6, 2025 | 161
|
Table 14-8 Variogram Parameters by Mineralized Domain
| | | | | | | | | | | | | | | | | | | | | | | | | | | | | | | | | | | | | | | | | | | | | | | | | | | | | | | | |
| Zone | Rock Code | Domain | Datamine Rotations | Normalized Nugget | Structure 1 | Structure 2 | Structure 3 |
| Range | Normalized Sill | Range | Normalized Sill | Range | Normalized Sill |
| Z | X | Z | 1 | 2 | 3 | 1b | 2b | 3b | 1c | 2c | 3c |
| E1D | 305 | 305_1 | 10 | 115 | -60 | No Variogram |
| E1D1 | 308 | 308_1 | 10 | 115 | -60 | No Variogram |
| D | 720 | 720_1 | 25 | 95 | -65 | 0.534 | 20 | 11 | 4 | 0.318 | 26 | 30 | 5 | 0.148 | | | | |
| DW | 720 | 720_1 | 5 | 90 | -50 | 0.655 | 29 | 17 | 1 | 0.245 | 33 | 21 | 3 | 0.1 | | | | |
| D1 | 725 | 725_1 | 30 | 95 | -45 | No Variogram |
| C | 730 | 730_1-7 | 10 | 100 | -50 | 0.292 | 6.4 | 4.2 | 3 | 0.51 | 18.2 | 17.8 | 4.8 | 0.107 | 39.6 | 28.8 | 5 | 0.0985 |
| C | 730 | 730_8_HG | 10 | 100 | -35 | 0.303 | 6.4 | 5 | 7.6 | 0.636 | 40.2 | 6.4 | 9 | 0.0613 | - | - | - | - |
| C | 730 | 730_8_LG | 10 | 100 | -50 | 0.303 | 6.4 | 5 | 7.6 | 0.636 | 40.2 | 6.4 | 9 | 0.0613 | - | - | - | - |
| CD1N | 732 | 732_1 | 10 | 105 | -50 | 0.295 | 14 | 16 | 2 | 0.523 | 16 | 19 | 6 | 0.182 | - | - | - | - |
| CW | 735 | 735_1 | 25 | 85 | -45 | No Variogram |
| G | 740 | 740_1 | 180 | 90 | 80 | No Variogram |
| GNW | 742 | 742_1 | -155 | 75 | -155 | 0.25 | 4 | 6 | 5 | 0.3 | 15 | 10 | 5 | 0.4 | - | - | - | - |
| G1 | 745 | 745_1 | 5 | 100 | -50 | No Variogram |
| DN3 | 746 | 746_1 | -165 | 85 | -110 | No Variogram |
| DN1 | 748 | 748_1 | -165 | 85 | -110 | No Variogram |
| DN2 | 749 | 749_1 | -165 | 85 | -110 | No Variogram |
| STH | 750 | 750_1 | 180 | 90 | 80 | No Variogram |
| H | 755 | 755_1 | 25 | 110 | -55 | No Variogram |
| B | 760 | 760_1 | 10 | 95 | -80 | 0.454 | 14 | 12 | 3 | 0.24 | 23 | 13 | 5 | 0.306 | - | - | - | - |
| B2 | 762 | 762_1 | 10 | 95 | -80 | No Variogram |
| NS1 | 780 | 780_1 | 80 | 65 | -70 | 0.54 | 20 | 15 | 6 | 0.12 | 21 | 16 | 7 | 0.34 | - | - | - | - |
| NS2 | 781 | 781_1 | 55 | 85 | -60 | No Variogram |
| NTH4 | 807 | 807_1 | 35 | 80 | -30 | 0.459 | 13 | 27 | 2 | 0.256 | 38 | 28 | 4 | 0.285 | - | - | - | - |
| NTH4 | 807 | 807_2 | 35 | 80 | -30 | 0.459 | 13 | 27 | 2 | 0.256 | 38 | 28 | 4 | 0.285 | - | - | - | - |
| NTH2 | 808 | 808_1 | 10 | -135 | -45 | No Variogram |
| NTH1 | 809 | 809_1 | 20 | 90 | -20 | No Variogram |
| NTH | 810 | 810_1 | 10 | 60 | -20 | 0.485 | 17 | 31 | 3 | 0.133 | 50 | 40 | 5 | 0.382 | - | - | - | - |
| NTH5 | 811 | 811_1 | 0 | 115 | -60 | No Variogram |
| NTH3 | 815 | 815_1 | 40 | 55 | -20 | 0.355 | 18 | 7 | 2 | 0.261 | 36 | 24.2 | 5 | 0.384 | - | - | - | - |
| E1E | 310 | 310_1 | 10 | 105 | -60 | 0.45 | 40 | 45 | 3 | 0.47 | 75 | 70 | 11 | 0.08 | - | - | - | - |
| E1E | 310 | 310_2 | 5 | 110 | -50 | 0.44 | 32 | 32 | 2 | 0.53 | 41 | 34 | 5 | 0.03 | - | - | - | - |
| E1E | 310 | 310_3 | 0 | 120 | -60 | 0.47 | 42 | 32 | 22 | 0.5 | 57 | 36 | 5 | 0.03 | - | - | - | - |
| E1E | 310 | 310_4 | 10 | 110 | -60 | 0.285 | 29 | 21 | 9 | 0.58 | 31 | 22 | 10 | 0.135 | - | - | - | - |
| E1E | 310 | 310_5_HG | 10 | 115 | -60 | No Variogram |
| E1E | 310 | 310_5_LG | 10 | 115 | -60 | No Variogram |
| IGU-E1E | 110 | 110_1 | -175 | 80 | -145 | 0.19 | 6 | 4 | 4 | 0.73 | 20 | 12 | 5 | 0.89 | - | - | - | - |
| IGU-D | 120 | 120_1 | -175 | 80 | -145 | 0.19 | 6 | 4 | 4 | 0.73 | 20 | 12 | 5 | 0.89 | - | - | - | - |
| IGU-C | 130 | 130_1 | -175 | 80 | -145 | 0.19 | 6 | 4 | 4 | 0.73 | 20 | 12 | 5 | 0.89 | - | - | - | - |
| IGU-E2 | 150 | 150_1 | -175 | 80 | -145 | 0.19 | 6 | 4 | 4 | 0.73 | 20 | 12 | 5 | 0.89 | - | - | - | - |
| IGU-D1 | 160 | 160_1 | -175 | 80 | -145 | 0.19 | 6 | 4 | 4 | 0.73 | 20 | 12 | 5 | 0.89 | - | - | - | - |
| IGU-EXT1-E1E | 210 | 210_1 | -175 | 80 | -145 | 0.19 | 6 | 4 | 4 | 0.73 | 20 | 12 | 5 | 0.89 | - | - | - | - |
| LC-E1E | 410 | 410_1 | -175 | 85 | -125 | No Variogram |
| LC-D | 420 | 420_1 | -175 | 85 | -125 | No Variogram |
| LC-C | 430 | 430_1 | -175 | 85 | -125 | No Variogram |
| LC-E2 | 450 | 450_1 | -175 | 85 | -125 | No Variogram |
| GD-G2 | 620 | 620_1 | -175 | 95 | 45 | 0.165 | 7.4 | 25 | 11.4 | 0.473 | 78 | 27.4 | 13.6 | 0.362 | - | - | - | - |
| GD-G3 | 630 | 630_1 | -175 | 95 | 15 | 0.169 | 3.6 | 4.4 | 3.6 | 0.472 | 23.2 | 7.8 | 3.8 | 0.36 | - | - | - | - |
| GD-GP5 | 655 | 655_1 | -90 | 155 | -5 | 0.247 | 4 | 21.8 | 2.2 | 0.309 | 29.2 | 22 | 3.2 | 0.443 | - | - | - | - |
| GD-G6 | 660 | 660_1 | 170 | 75 | 45 | 0.101 | 9 | 7.6 | 5 | 0.555 | 41.2 | 34.4 | 5.8 | 0.221 | - | - | - | - |
| GD-G7 | 670 | 670_1 | 180 | 90 | -160 | 0.119 | 8.6 | 3.8 | 3.2 | 0.413 | 30.4 | 12 | 8.8 | 0.468 | - | - | - | - |
| GD-G9 | 690 | 690_1 | 355 | 85 | 0 | No Variogram |
| | | | | |
Island Gold District – NI 43-101 Technical Report August 6, 2025 | 162
|
Figure 14-8 Search Ellipse Orientation Corresponding to Variography and Block Model Grades
Source: Alamos (2025)
14.3.8 Block Model
Separate block models were created for each mineralized zone of Island Gold, with block model configuration details summarized in Table 14-9. All block models are unrotated and were created with a parent block size of 5.0 m x 2.5 m x 5.0 m (X, Y, Z), except for the GNW, NTH, NTH1, NTH2 and NTH5 (5.0 m x 5.0 m x 5.0 m) and the GD zones (5.0 m x 2.0 m x 5.0 m).
Block models were generally sub-blocked to 1.0 m x 0.25 m x 0.25 m. The block dimensions were selected to appropriately reflect the geometry of the mineralized zones and the expected underground mining methods. These blocks were used for the grade interpolation.
Table 14-9 Parent Block Sizes for the Island Gold Mine Zones
| | | | | | | | | | | |
Zones | Parent Block Cell Size (m) |
X | Y | Z |
GD-G2, GD-G3, GD-GP5 GD-G6, GD-G7, GD-G9 | 5.0 | 2.0 | 5.0 |
E1D, E1D1, C, CD1N, CW, G, G1, DN1, DN2, DN3, STH, H, B, NS1, NS2, NTH4, NTH3, E1E, IGU-E1E, IGU-D, IGU-C, IGU-E2, IGU-E2, IGU-E2, IGU-D1, IGU-EXT1-E1E, LC-E1E, LC-D, LC-C, LC-E2 | 5.0 | 2.5 | 5.0 |
GNW, NTH, NTH1, NTH2, NTH5 | 5.0 | 5.0 | 5.0 |
| | | | | |
Island Gold District – NI 43-101 Technical Report August 6, 2025 | 163
|
14.3.9 Grade Estimation
Most of the Island Gold gold grades were interpolated into the block models using ordinary kriging (OK), or inverse distance squared (ID2) for mineralized zones where robust variograms could not be produced.
Dynamic anisotropy (DA) was first implemented in the estimation process in the year-end 2023 models. Using DA allows the rotation angles for the search ellipse to be defined individually for each estimated block based on the dip and dip direction of the mineralized zone in that location (Figure 14-9).
Figure 14-9 Dip and Dip Direction Applied to E1E Zone Model for Dynamic Anisotropy
Source: Alamos (2025)
Block estimation employed a consistent three-pass search strategy. Each pass was limited to a maximum of two composites per drillhole to reduce clustering effects and maintain spatial variability. The first and second passes required a minimum of four and a maximum of eight composites, while the third pass applied slightly relaxed criteria with a minimum of three and a maximum of eight composites. In select smaller zones, including the NS1 Zone, a minimum of six and maximum of ten composites to be estimated in the first and second pass were required. The Goudreau Sector mineralized domains, which were not updated for this Report, were estimated using a four-pass search strategy (see Table 14-10) that employed more inclusive search criteria, allowing for a maximum of 16 samples within each search volume.
The final resource model integrates two separate estimations: one derived exclusively from drillhole composites, and another that incorporates both drillhole and channel sample data collected from developed areas. The combined drillhole-and-channel model is spatially constrained to an area extending approximately 10 m from existing underground infrastructure. This restriction is applied to mitigate potential bias associated with channel samples influencing estimations too far. Within this constrained model, most blocks are estimated during the first or second interpolation pass.
| | | | | |
Island Gold District – NI 43-101 Technical Report August 6, 2025 | 164
|
Conversely, the drillhole only model is unconstrained by proximity to infrastructure and is used to estimate the remainder of the mineralized volume. The two models are subsequently merged, with the values from the constrained (channel + drillhole) model superseding those from the drillhole only model in overlapping areas. In zones where no channel data is available, the resource estimate relies solely on the drillhole based model, and merging is not required.
In the highest grade portions of the C and E1E Zones, a refined detailed domaining strategy was implemented to distinguish discrete low grade and high-grade gold populations within the principal mineralized structures (Figure 14-10). High grade, shear-vein-hosted mineralization was explicitly segregated from the surrounding lower grade, disseminated gold mineralization, which is predominantly associated with weakly altered wallrock (Figure 14-11). In the E1E Zone, an additional background domain was defined to facilitate more accurate dilution modelling. Domain boundaries were treated as hard contacts, reflecting the sharp grade transitions observed at lithological and structural contacts, and were guided by detailed geological interpretations.
Figure 14-10 Location of the Detailed Domain Model in the C and E1E Zone
Source: Alamos (2025)
| | | | | |
Island Gold District – NI 43-101 Technical Report August 6, 2025 | 165
|
Figure 14-11 Example of Multi-Domain Gold Model
Source: Alamos (2025)
A summary of the estimation and search parameters used for grade interpolation at Island Gold is provided in Table 14-10.
Table 14-10 Search Parameters for the Island Gold Mineralized Domains
| | | | | | | | | | | | | | | | | | | | | | | | | | | | | | | | | | | |
Zone | Rock Code | Domain | Interpolant | DA | SVOL | Search Distance (m) | No. of Samples |
| 1 | 2 | 3 | Min | Max | MaxKey |
| E1D | 305 | 305_1 | ID2 | Yes | 1 | 30 | 25 | 10 | 4 | 8 | 2 |
| E1D | 305 | 305_1 | ID2 | Yes | 1.5 | 45 | 37.5 | 15 | 4 | 8 | 2 |
| E1D | 305 | 305_1 | ID2 | Yes | 3 | 90 | 75 | 30 | 3 | 8 | 2 |
| E1D1 | 308 | 308_1 | ID2 | Yes | 1 | 25 | 20 | 10 | 4 | 8 | 2 |
| E1D1 | 308 | 308_1 | ID2 | Yes | 1.5 | 37.5 | 30 | 15 | 4 | 8 | 2 |
| E1D1 | 308 | 308_1 | ID2 | Yes | 3 | 75 | 60 | 30 | 3 | 8 | 2 |
| D | 720 | 720_1 | OK | Yes | 1 | 24 | 30 | 5 | 3 | 6 | 2 |
| D | 720 | 720_1 | OK | Yes | 1.5 | 36 | 45 | 45 | 6 | 10 | 2 |
| D | 720 | 720_1 | OK | Yes | 3 | 72 | 90 | 15 | 3 | 8 | 2 |
| DW | 720 | 720_2 | OK | Yes | 1 | 33 | 21 | 3 | 4 | 8 | 2 |
| DW | 720 | 720_2 | OK | Yes | 1.5 | 49.5 | 31.5 | 4.5 | 4 | 8 | 2 |
| DW | 720 | 720_2 | OK | Yes | 3 | 99 | 94.5 | 13.5 | 3 | 8 | 2 |
| D1 | 725 | 725_1 | ID2 | Yes | 1 | 20 | 10 | 5 | 4 | 8 | 2 |
| D1 | 725 | 725_1 | ID2 | Yes | 1.5 | 30 | 15 | 7.5 | 4 | 8 | 2 |
| D1 | 725 | 725_1 | ID2 | Yes | 3 | 60 | 45 | 22.5 | 3 | 8 | 2 |
| C | 730 | 730_1-7 | OK | Yes | 1 | 40 | 28 | 5 | 4 | 8 | 2 |
| C | 730 | 730_1-7 | OK | Yes | 1.5 | 60 | 42 | 7.5 | 4 | 8 | 2 |
| C | 730 | 730_1-7 | OK | Yes | 3 | 120 | 84 | 15 | 3 | 8 | 2 |
| C | 730 | 730_8_HG | OK | Yes | 1 | 40 | 7 | 9 | 4 | 8 | 2 |
| C | 730 | 730_8_HG | OK | Yes | 1.5 | 60 | 10.5 | 13.5 | 4 | 8 | 2 |
| C | 730 | 730_8_HG | OK | Yes | 3 | 120 | 21 | 27 | 3 | 8 | 2 |
| C | 730 | 730_8_LG | OK | Yes | 1 | 12 | 8 | 5 | 4 | 8 | 2 |
| C | 730 | 730_8_LG | OK | Yes | 1.5 | 18 | 12 | 7.5 | 4 | 8 | 2 |
| | | | | |
Island Gold District – NI 43-101 Technical Report August 6, 2025 | 166
|
| | | | | | | | | | | | | | | | | | | | | | | | | | | | | | | | | | | |
Zone | Rock Code | Domain | Interpolant | DA | SVOL | Search Distance (m) | No. of Samples |
| 1 | 2 | 3 | Min | Max | MaxKey |
| C | 730 | 730_8_LG | OK | Yes | 3 | 36 | 24 | 15 | 3 | 8 | 2 |
| CD1N | 732 | 732_1 | OK | Yes | 1 | 16 | 19 | 6 | 4 | 8 | 2 |
| CD1N | 732 | 732_1 | OK | Yes | 1.5 | 24 | 28.5 | 9 | 4 | 8 | 2 |
| CD1N | 732 | 732_1 | OK | Yes | 3 | 48 | 57 | 18 | 3 | 8 | 2 |
| CW | 735 | 735_1 | ID2 | Yes | 1 | 35 | 25 | 7 | 4 | 8 | 2 |
| CW | 735 | 735_1 | ID2 | Yes | 1.5 | 52.5 | 37.5 | 10.5 | 4 | 8 | 2 |
| CW | 735 | 735_1 | ID2 | Yes | 3 | 105 | 75 | 21 | 3 | 8 | 2 |
| G | 740 | 740_1 | ID2 | Yes | 1 | 27 | 23 | 3 | 6 | 10 | 2 |
| G | 740 | 740_1 | ID2 | Yes | 1.5 | 40.5 | 34.5 | 4.5 | 6 | 10 | 2 |
| G | 740 | 740_1 | ID2 | Yes | 3 | 81 | 69 | 9 | 3 | 8 | 2 |
| GNW | 742 | 742_1 | OK | Yes | 1 | 15 | 10 | 5 | 4 | 8 | 2 |
| GNW | 742 | 742_1 | OK | Yes | 1.5 | 22.5 | 15 | 7.5 | 4 | 8 | 2 |
| GNW | 742 | 742_1 | OK | Yes | 3 | 45 | 30 | 15 | 3 | 8 | 2 |
| G1 | 745 | 745_1 | ID2 | Yes | 1 | 20 | 15 | 3 | 6 | 10 | 2 |
| G1 | 745 | 745_1 | ID2 | Yes | 1.5 | 30 | 22.5 | 4.5 | 6 | 10 | 2 |
| G1 | 745 | 745_1 | ID2 | Yes | 3 | 60 | 45 | 9 | 3 | 8 | 2 |
| DN3 | 746 | 746_1 | ID2 | Yes | 1 | 40 | 30 | 10 | 6 | 10 | 2 |
| DN3 | 746 | 746_1 | ID2 | Yes | 1.5 | 60 | 45 | 15 | 6 | 10 | 2 |
| DN3 | 746 | 746_1 | ID2 | Yes | 3 | 120 | 90 | 30 | 3 | 8 | 2 |
| DN1 | 748 | 748_1 | ID2 | Yes | 1 | 40 | 30 | 10 | 6 | 10 | 2 |
| DN1 | 748 | 748_1 | ID2 | Yes | 1.5 | 60 | 45 | 15 | 6 | 10 | 2 |
| DN1 | 748 | 748_1 | ID2 | Yes | 3 | 120 | 90 | 30 | 3 | 8 | 2 |
| DN2 | 749 | 749_1 | ID2 | Yes | 1 | 40 | 30 | 10 | 6 | 10 | 2 |
| DN2 | 749 | 749_1 | ID2 | Yes | 1.5 | 60 | 45 | 15 | 6 | 10 | 2 |
| DN2 | 749 | 749_1 | ID2 | Yes | 3 | 120 | 90 | 30 | 3 | 8 | 2 |
| STH | 750 | 750_1 | ID2 | Yes | 1 | 27 | 23 | 3 | 6 | 10 | 2 |
| STH | 750 | 750_1 | ID2 | Yes | 1.5 | 40.5 | 34.5 | 4.5 | 6 | 10 | 2 |
| STH | 750 | 750_1 | ID2 | Yes | 3 | 81 | 69 | 9 | 3 | 8 | 2 |
| H | 755 | 755_1 | ID2 | Yes | 1 | 35 | 25 | 7 | 4 | 8 | 2 |
| H | 755 | 755_1 | ID2 | Yes | 1.5 | 52.5 | 37.5 | 10.5 | 4 | 8 | 2 |
| H | 755 | 755_1 | ID2 | Yes | 3 | 105 | 75 | 21 | 3 | 8 | 2 |
| B | 760 | 760_1 | OK | Yes | 1 | 23 | 13 | 5 | 4 | 8 | 2 |
| B | 760 | 760_1 | OK | Yes | 1.5 | 34.5 | 19.5 | 7.5 | 4 | 8 | 2 |
| B | 760 | 760_1 | OK | Yes | 3 | 69 | 39 | 15 | 3 | 8 | 2 |
| B2 | 762 | 762_1 | ID2 | Yes | 1 | 23 | 13 | 5 | 4 | 8 | 2 |
| B2 | 762 | 762_1 | ID2 | Yes | 1.5 | 34.5 | 19.5 | 7.5 | 4 | 8 | 2 |
| B2 | 762 | 762_1 | ID2 | Yes | 3 | 69 | 39 | 15 | 3 | 8 | 2 |
| NS1 | 780 | 780_1 | OK | Yes | 1 | 36 | 28 | 7 | 6 | 10 | 2 |
| NS1 | 780 | 780_1 | OK | Yes | 1.5 | 54 | 42 | 10.5 | 6 | 10 | 2 |
| NS1 | 780 | 780_1 | OK | Yes | 3 | 108 | 84 | 21 | 3 | 8 | 2 |
| NS2 | 781 | 781_1 | ID2 | Yes | 1 | 35 | 25 | 7 | 4 | 8 | 2 |
| NS2 | 781 | 781_1 | ID2 | Yes | 1.5 | 52.5 | 37.5 | 10.5 | 4 | 8 | 2 |
| NS2 | 781 | 781_1 | ID2 | Yes | 3 | 105 | 75 | 21 | 3 | 8 | 2 |
| NTH4 | 807 | 807_1 | OK | Yes | 1 | 38 | 28 | 4 | 4 | 8 | 2 |
| NTH4 | 807 | 807_1 | OK | Yes | 1.5 | 57 | 42 | 6 | 4 | 8 | 2 |
| NTH4 | 807 | 807_1 | OK | Yes | 3 | 114 | 84 | 12 | 3 | 8 | 2 |
| | | | | |
Island Gold District – NI 43-101 Technical Report August 6, 2025 | 167
|
| | | | | | | | | | | | | | | | | | | | | | | | | | | | | | | | | | | |
Zone | Rock Code | Domain | Interpolant | DA | SVOL | Search Distance (m) | No. of Samples |
| 1 | 2 | 3 | Min | Max | MaxKey |
| NTH4 | 807 | 807_2 | OK | Yes | 1 | 38 | 28 | 4 | 4 | 8 | 2 |
| NTH4 | 807 | 807_2 | OK | Yes | 1.5 | 57 | 42 | 6 | 4 | 8 | 2 |
| NTH4 | 807 | 807_2 | OK | Yes | 3 | 114 | 84 | 12 | 3 | 8 | 2 |
| NTH2 | 808 | 808_1 | ID2 | Yes | 1 | 40 | 30 | 10 | 4 | 8 | 2 |
| NTH2 | 808 | 808_1 | ID2 | Yes | 1.5 | 60 | 45 | 15 | 4 | 8 | 2 |
| NTH2 | 808 | 808_1 | ID2 | Yes | 3 | 120 | 90 | 30 | 3 | 8 | 2 |
| NTH1 | 809 | 809_1 | ID2 | Yes | 1 | 20 | 13 | 4 | 4 | 8 | 2 |
| NTH1 | 809 | 809_1 | ID2 | Yes | 1.5 | 30 | 19.5 | 6 | 4 | 8 | 2 |
| NTH1 | 809 | 809_1 | ID2 | Yes | 3 | 60 | 39 | 12 | 3 | 8 | 2 |
| NTH | 810 | 810_1 | OK | Yes | 1 | 50 | 40 | 5 | 4 | 8 | 2 |
| NTH | 810 | 810_1 | OK | Yes | 1.5 | 75 | 60 | 7.5 | 4 | 8 | 2 |
| NTH | 810 | 810_1 | OK | Yes | 3 | 150 | 120 | 15 | 3 | 8 | 2 |
| NTH5 | 811 | 811_1 | ID2 | Yes | 1 | 20 | 15 | 5 | 4 | 8 | 2 |
| NTH5 | 811 | 811_1 | ID2 | Yes | 1.5 | 30 | 22.5 | 7.5 | 4 | 8 | 2 |
| NTH5 | 811 | 811_1 | ID2 | Yes | 3 | 60 | 45 | 15 | 3 | 8 | 2 |
| NTH3 | 815 | 815_1 | OK | Yes | 1 | 36 | 24 | 5 | 4 | 8 | 2 |
| NTH3 | 815 | 815_1 | OK | Yes | 1.5 | 54 | 36 | 7.5 | 4 | 8 | 2 |
| NTH3 | 815 | 815_1 | OK | Yes | 3 | 108 | 72 | 15 | 3 | 8 | 2 |
| E1E | 310 | 310_1 | OK | Yes | 1 | 40 | 30 | 10 | 4 | 8 | 2 |
| E1E | 310 | 310_1 | OK | Yes | 1.5 | 60 | 45 | 15 | 4 | 8 | 2 |
| E1E | 310 | 310_1 | OK | Yes | 3 | 120 | 90 | 30 | 3 | 8 | 2 |
| E1E | 310 | 310_2 | OK | Yes | 1 | 30 | 25 | 10 | 4 | 8 | 2 |
| E1E | 310 | 310_2 | OK | Yes | 1.5 | 45 | 37.5 | 15 | 4 | 8 | 2 |
| E1E | 310 | 310_2 | OK | Yes | 3 | 90 | 75 | 30 | 3 | 8 | 2 |
| E1E | 310 | 310_3 | OK | Yes | 1 | 38 | 34 | 3 | 4 | 8 | 2 |
| E1E | 310 | 310_3 | OK | Yes | 1.5 | 57 | 51 | 4.5 | 4 | 8 | 2 |
| E1E | 310 | 310_3 | OK | Yes | 3 | 114 | 102 | 9 | 3 | 8 | 2 |
| E1E | 310 | 310_4 | OK | Yes | 1 | 28 | 20 | 9 | 4 | 8 | 2 |
| E1E | 310 | 310_4 | OK | Yes | 1.5 | 42 | 30 | 13.5 | 4 | 8 | 2 |
| E1E | 310 | 310_4 | OK | Yes | 3 | 84 | 60 | 27 | 3 | 8 | 2 |
| E1E | 310 | 310_5_HG | ID3 | No | 1 | 15 | 10 | 5 | 3 | 8 | 2 |
| E1E | 310 | 310_5_HG | ID3 | No | 1.5 | 22.5 | 15 | 7.5 | 4 | 8 | 2 |
| E1E | 310 | 310_5_HG | ID3 | No | 3 | 45 | 30 | 15 | 2 | 8 | 2 |
| E1E | 310 | 310_5_LG | ID3 | No | 1 | 15 | 10 | 5 | 3 | 8 | 2 |
| E1E | 310 | 310_5_LG | ID3 | No | 1.5 | 22.5 | 15 | 7.5 | 4 | 8 | 2 |
| E1E | 310 | 310_5_LG | ID3 | No | 3 | 45 | 30 | 15 | 2 | 8 | 2 |
| E1E | 310 | 310_5_BG | ID3 | No | 1 | 15 | 10 | 5 | 3 | 8 | 2 |
| E1E | 310 | 310_5_BG | ID3 | No | 1.5 | 22.5 | 15 | 7.5 | 4 | 8 | 2 |
| E1E | 310 | 310_5_BG | ID3 | No | 3 | 45 | 30 | 15 | 2 | 8 | 2 |
| IGU-E1E | 110 | 110_1 | OK | Yes | 1 | 20 | 12 | 5 | 4 | 8 | 2 |
| IGU-E1E | 110 | 110_1 | OK | Yes | 1.5 | 30 | 18 | 7.5 | 4 | 8 | 2 |
| IGU-E1E | 110 | 110_1 | OK | Yes | 3 | 60 | 36 | 15 | 3 | 8 | 2 |
| IGU-D | 120 | 120_2 | OK | Yes | 1 | 20 | 12 | 5 | 4 | 8 | 2 |
| IGU-D | 120 | 120_2 | OK | Yes | 1.5 | 30 | 18 | 7.5 | 4 | 8 | 2 |
| IGU-D | 120 | 120_2 | OK | Yes | 3 | 60 | 36 | 15 | 3 | 8 | 2 |
| IGU-C | 130 | 130_3 | OK | Yes | 1 | 20 | 12 | 5 | 4 | 8 | 2 |
| | | | | |
Island Gold District – NI 43-101 Technical Report August 6, 2025 | 168
|
| | | | | | | | | | | | | | | | | | | | | | | | | | | | | | | | | | | |
Zone | Rock Code | Domain | Interpolant | DA | SVOL | Search Distance (m) | No. of Samples |
| 1 | 2 | 3 | Min | Max | MaxKey |
| IGU-C | 130 | 130_3 | OK | Yes | 1.5 | 30 | 18 | 7.5 | 4 | 8 | 2 |
| IGU-C | 130 | 130_3 | OK | Yes | 3 | 60 | 36 | 15 | 3 | 8 | 2 |
| IGU-E2 | 150 | 150_4 | OK | Yes | 1 | 20 | 12 | 5 | 4 | 8 | 2 |
| IGU-E2 | 150 | 150_4 | OK | Yes | 1.5 | 30 | 18 | 7.5 | 4 | 8 | 2 |
| IGU-E2 | 150 | 150_4 | OK | Yes | 3 | 60 | 36 | 15 | 3 | 8 | 2 |
| IGU-D1 | 160 | 160_5 | OK | Yes | 1 | 20 | 12 | 5 | 4 | 8 | 2 |
| IGU-D1 | 160 | 160_5 | OK | Yes | 1.5 | 30 | 18 | 7.5 | 4 | 8 | 2 |
| IGU-D1 | 160 | 160_5 | OK | Yes | 3 | 60 | 36 | 15 | 3 | 8 | 2 |
| IGU-EXT1-E1E | 210 | 210_6 | OK | Yes | 1 | 20 | 12 | 5 | 4 | 8 | 2 |
| IGU-EXT1-E1E | 210 | 210_6 | OK | Yes | 1.5 | 30 | 18 | 7.5 | 4 | 8 | 2 |
| IGU-EXT1-E1E | 210 | 210_6 | OK | Yes | 3 | 60 | 36 | 15 | 3 | 8 | 2 |
| LC-E1E | 410 | 410_1 | ID2 | Yes | 1 | 40 | 30 | 5 | 4 | 8 | 2 |
| LC-E1E | 410 | 410_1 | ID2 | Yes | 1.5 | 60 | 45 | 7.5 | 4 | 8 | 2 |
| LC-E1E | 410 | 410_1 | ID2 | Yes | 3 | 120 | 90 | 15 | 3 | 8 | 2 |
| LC-D | 420 | 420_2 | ID2 | Yes | 1 | 40 | 30 | 5 | 4 | 8 | 2 |
| LC-D | 420 | 420_2 | ID2 | Yes | 1.5 | 60 | 45 | 7.5 | 4 | 8 | 2 |
| LC-D | 420 | 420_2 | ID2 | Yes | 3 | 120 | 90 | 15 | 3 | 8 | 2 |
| LC-C | 430 | 430_3 | ID2 | Yes | 1 | 40 | 30 | 5 | 4 | 8 | 2 |
| LC-C | 430 | 430_3 | ID2 | Yes | 1.5 | 60 | 45 | 7.5 | 4 | 8 | 2 |
| LC-C | 430 | 430_3 | ID2 | Yes | 3 | 120 | 90 | 15 | 3 | 8 | 2 |
| LC-E2 | 450 | 450_4 | ID2 | Yes | 1 | 40 | 30 | 5 | 4 | 8 | 2 |
| LC-E2 | 450 | 450_4 | ID2 | Yes | 1.5 | 60 | 45 | 7.5 | 4 | 8 | 2 |
| LC-E2 | 450 | 450_4 | ID2 | Yes | 3 | 120 | 90 | 15 | 3 | 8 | 2 |
| GD-G2 | 620 | 620_1 | OK | No | - | 50 | 20 | 10 | 9 | 16 | 4 |
| GD-G2 | 620 | 620_1 | OK | No | - | 75 | 30 | 10 | 5 | 16 | 4 |
| GD-G2 | 620 | 620_1 | OK | No | - | 75 | 30 | 10 | 5 | 16 | 4 |
| GD-G2 | 620 | 620_1 | OK | No | - | 115 | 45 | 15 | 1 | 16 | 4 |
| GD-GP2 | 625 | 625_1 | ID2 | No | - | 25 | 25 | 10 | 9 | 16 | 4 |
| GD-GP2 | 625 | 625_1 | ID2 | No | - | 40 | 40 | 10 | 5 | 16 | 4 |
| GD-GP2 | 625 | 625_1 | ID2 | No | - | 60 | 60 | 15 | 1 | 16 | 4 |
| GD-G3 | 630 | 630_1 | OK | No | - | 15 | 10 | 10 | 9 | 16 | 4 |
| GD-G3 | 630 | 630_1 | OK | No | - | 25 | 15 | 10 | 5 | 16 | 4 |
| GD-G3 | 630 | 630_1 | OK | No | - | 25 | 15 | 10 | 5 | 16 | 4 |
| GD-G3 | 630 | 630_1 | OK | No | - | 40 | 25 | 15 | 1 | 16 | 4 |
| GD-GP5 | 655 | 655_1 | OK | No | - | 20 | 15 | 10 | 9 | 16 | 4 |
| GD-GP5 | 655 | 655_1 | OK | No | - | 30 | 20 | 10 | 5 | 16 | 4 |
| GD-GP5 | 655 | 655_1 | OK | No | - | 30 | 20 | 10 | 5 | 16 | 4 |
| GD-GP5 | 655 | 655_1 | OK | No | - | 45 | 30 | 15 | 1 | 16 | 4 |
| GD-G6 | 660 | 660_1 | OK | No | - | 35 | 30 | 10 | 9 | 16 | 4 |
| GD-G6 | 660 | 660_1 | OK | No | - | 50 | 45 | 10 | 5 | 16 | 4 |
| GD-G6 | 660 | 660_1 | OK | No | - | 50 | 45 | 10 | 5 | 16 | 4 |
| GD-G6 | 660 | 660_1 | OK | No | - | 75 | 70 | 15 | 1 | 16 | 4 |
| GD-G7 | 670 | 670_1 | OK | No | - | 20 | 10 | 10 | 9 | 16 | 4 |
| | | | | |
Island Gold District – NI 43-101 Technical Report August 6, 2025 | 169
|
| | | | | | | | | | | | | | | | | | | | | | | | | | | | | | | | | | | |
Zone | Rock Code | Domain | Interpolant | DA | SVOL | Search Distance (m) | No. of Samples |
| 1 | 2 | 3 | Min | Max | MaxKey |
| GD-G7 | 670 | 670_1 | OK | No | - | 30 | 15 | 10 | 5 | 16 | 4 |
| GD-G7 | 670 | 670_1 | OK | No | - | 30 | 15 | 10 | 5 | 16 | 4 |
| GD-G7 | 670 | 670_1 | OK | No | - | 45 | 25 | 15 | 1 | 16 | 4 |
| GD-G9 | 690 | 690_1 | ID2 | No | - | 30 | 30 | 10 | 9 | 16 | 4 |
| GD-G9 | 690 | 690_1 | ID2 | No | - | 45 | 45 | 15 | 5 | 16 | 4 |
| GD-G9 | 690 | 690_1 | ID2 | No | - | 45 | 45 | 15 | 5 | 16 | 4 |
| GD-G9 | 690 | 690_1 | ID2 | No | - | 70 | 70 | 20 | 1 | 16 | 4 |
14.3.10 Block Model Validation
Validation of the interpolated model was undertaken to confirm estimation parameters, to verify that the model reflects the input data at both local and global scales and verify that the estimate is unbiased. Validation was performed using a combination of techniques, including:
•Visual inspection of block grades in plan and section views, with comparison against sample/composite grades;
•Comparison of global statistics (OK vs inverse distance squared (ID2) vs nearest neighbour (NN) vs composites) from each mineralized domain (Snowden Supervisor);
•Smoothing analysis using swath plots and histograms to compare the OK, ID, NN, and composite results (Snowden Supervisor); and
•Comparison of block model grades against reconciled production data where available.
14.3.11 Visual Validation
A visual comparison of block grades, composite grades and raw assay grades was performed with cross-sections, level plans and longitudinal views across both densely and sparsely drilled areas. Overall, no significant discrepancies were observed, and a good correlation in grade distribution was noted, with no evidence of excessive smoothing within the block model (see Figure 14-12).
Additional visual comparisons were made between OK, ID2, and NN interpolation scenarios. The selected OK interpolation produced a block grade distribution that reflects the style of mineralization observed in the deposit.
| | | | | |
Island Gold District – NI 43-101 Technical Report August 6, 2025 | 170
|
•Looking east
Figure 14-12 Interpolated Gold Grades (OK) vs Gold Composites Along Mine Grid 16240)
Source: Alamos (2025)
14.3.12 Statistical Validation
Table 14-11 compares the gold mean grade of the blocks using a zero cut-off grade with the mean composite grade of each mineralized domain. The comparison between composite and block grade distributions did not identify significant issues.
For all domains, the grade trends and local variations of the block models were reviewed against the composites or de-clustered composites using swath plots along multiple orientations (see Figure 14-13, Figure 14-14 and Figure 14-15). The models generally reproduced the grade trends observed in the composites, displaying the expected level of smoothing. In the higher-grade domains, the composite and NN mean grades were generally higher than the interpolated block grades, reflecting the impact of a strong nugget effect associated with high-grade gold mineralization.
| | | | | |
Island Gold District – NI 43-101 Technical Report August 6, 2025 | 171
|
Table 14-11 Comparison of the Block and Composite Mean Grades at a Zero Cut-Off Grade
| | | | | | | | | | | | | | | | | | | | | | | |
Zone |
Rockcode | Composite | Grade Model | Estimate vs Composites (%) |
| | No | Gold (g/t) | OK | ID2 | NN |
| E1D | 305 | 201 | 16.97 | - | 15.73 | 22.45 | -7 |
| E1D1 | 308 | 452 | 10.91 | - | 10.94 | 12.84 | 0 |
| E1E | 310 | 12,337 | 10.68 | 12.85 | | 13.39 | 20 |
| E1E-HG | 310 | 1,172 | 32.54 | 33.68 | 34.15 | 35.95 | 4 |
| E1E-LG | 310 | 4,562 | 1.94 | 2.16 | 2.13 | 2.43 | 11 |
| D | 720 | 129 | 6.46 | 6.93 | 7.22 | 8.21 | 7 |
| DW | 720 | 52 | 5.10 | 5.19 | 5.21 | 5.15 | 2 |
| D1 | 725 | 123 | 6.38 | - | 5.40 | 4.61 | -15 |
| C | 730 | 19,386 | 12.87 | 12.09 | 11.93 | 11.17 | -6 |
| CD1N | 732 | 1,199 | 15.11 | 15.48 | 16.39 | 15.65 | 2 |
| CW | 735 | 348 | 10.73 | - | 9.37 | 10.54 | -13 |
| G | 740 | 919 | 5.45 | - | 4.49 | 4.35 | -18 |
| GNW | 742 | 115 | 5.77 | 6.00 | 6.02 | 5.95 | 4 |
| G1 | 745 | 217 | 4.37 | - | 4.82 | 4.83 | 10 |
| DN3 | 746 | 6 | 5.95 | - | 2.97 | 3.38 | -50 |
| DN1 | 748 | 149 | 3.11 | - | 3.55 | 3.53 | 14 |
| DN2 | 749 | 41 | 3.67 | - | 2.97 | 3.38 | -19 |
| STH | 750 | 155 | 4.93 | - | 5.55 | 5.51 | 13 |
| H | 755 | 41 | 7.40 | - | 8.19 | 9.51 | 11 |
| B | 760 | 2,159 | 7.70 | 7.45 | 7.48 | 7.79 | -3 |
| B2 | 762 | 724 | 16.04 | 11.84 | 12.01 | 14.29 | -26 |
| NS1 | 780 | 524 | 11.34 | 10.26 | 10.30 | 9.31 | -10 |
| NS2 | 781 | 231 | 5.19 | - | 4.49 | 5.33 | -13 |
| NTH4 | 807_1 | 180 | 13.61 | 13.42 | 14.71 | 15.97 | -1 |
| NTH4 | 807_2 | 36 | 5.15 | 5.14 | 5.09 | 4.51 | 0 |
| NTH2 | 808 | 42 | 5.28 | - | 4.95 | 5.54 | -6 |
| NTH1 | 809 | 16 | 7.92 | - | 8.59 | 7.62 | 8 |
| NTH | 810 | 155 | 5.13 | 5.27 | 5.34 | 5.57 | 3 |
| NTH5 | 811 | 122 | 3.61 | - | 3.30 | 3.81 | -8 |
| NTH3 | 815 | 315 | 5.98 | 6.05 | 6.08 | 6.92 | 1 |
| IGU-E1E | 110 | 5,896 | 6.96 | 5.92 | 5.84 | 5.96 | -15 |
| IGU-D | 120 | 2,580 | 7.56 | 4.86 | 4.81 | 4.68 | -36 |
| IGU-C | 130 | 2,269 | 8.30 | 7.60 | 7.73 | 7.81 | -8 |
| IGU-E2 | 150 | 277 | 4.74 | 6.03 | 6.11 | 5.89 | 27 |
| IGU-D1 | 160 | 1,210 | 3.78 | 2.87 | 2.86 | 5.89 | -24 |
| IGU-EXT1-E1E | 210 | 2,434 | 7.71 | 5.79 | 5.70 | 6.03 | -25 |
| LC-E1E | 410 | 2,288 | 5.80 | - | 6.16 | 6.42 | 6 |
| LC-D | 420 | 40 | 7.17 | - | 8.71 | 5.23 | 22 |
| LC-C | 430 | 113 | 7.14 | - | 6.63 | 6.63 | -7 |
| | | | | |
Island Gold District – NI 43-101 Technical Report August 6, 2025 | 172
|
| | | | | | | | | | | | | | | | | | | | | | | |
Zone |
Rockcode | Composite | Grade Model | Estimate vs Composites (%) |
| | No | Gold (g/t) | OK | ID2 | NN |
| LC-E2 | 450 | 177 | 7.29 | - | 7.37 | 6.79 | 1 |
| GD-G2 | 620 | HISTORIC - NOT UPDATED |
| GD-G3 | 630 |
| GD-GP5 | 655 |
| GD-G6 | 660 |
| GD-G7 | 670 |
| GD-G9 | 690 |
Figure 14-13 Swath Plot (Across Strike) from the C Zone
Source: Alamos (2025)
| | | | | |
Island Gold District – NI 43-101 Technical Report August 6, 2025 | 173
|
Figure 14-14 Swath Plot (Z-Direction) from the C Zone
Source: Alamos (2025)
Figure 14-15 Log Histogram of Capped De-clustered Composites vs Block Grades, C Zone
Source: Alamos (2025)
| | | | | |
Island Gold District – NI 43-101 Technical Report August 6, 2025 | 174
|
14.3.13 Reconciliation with Production
In 2024, reconciliation efforts highlighted a systematic underestimation of the long-term reserve model grades (resource model with application of modifying factors) across most domains, particularly within the higher-grade areas of the mine and in the C Zone’s domain 730_8. Table 14-12 summarizes F3 and F1C factors, which compare final reconciled production values against long-term and short-term model predictions, respectively. Throughout the year, progressive adjustments were made to the short-term models including the limited implementation of a two-domain approach separating high-grade (vein) and low-grade mineralization. These updates were incorporated into the year-end 2024 model, which now serves as the baseline short-term model for early 2025.
Table 14-12 Reconciliation of Long- (F3) and Short-Term (F1C) Models to Production
| | | | | | | | | | | | | | | | | | | | | | | | | | | | | | | | | | | |
Quarter | Reserve | Short Term | Reconciliation |
(t) | Gold (g/t) | Gold (oz) | (t) | Gold (g/t) | Gold (oz) | (t) | Gold (g/t) | Gold (oz) |
1 | 60,233 | 9.9 | 19,114 | 68,814 | 11.0 | 24,385 | 74,910 | 12.5 | 30,164 |
2 | 61,191 | 11.1 | 21,847 | 64,338 | 13.6 | 28,197 | 77,615 | 15.4 | 38,401 |
3 | 43,913 | 13.4 | 18,857 | 41,586 | 17.0 | 22,790 | 48,061 | 18.9 | 29,164 |
4 | 51,516 | 12.3 | 20,298 | 59,551 | 14.5 | 27,779 | 78,800 | 12.5 | 31,757 |
Total | 216,853 | 11.5 | 80,116 | 234,289 | 13.7 | 103,151 | 279,386 | 14.4 | 129,486 |
|
|
|
|
|
|
| |
| | | | | | | | | | | | | | | | | | | | | | | | | | |
Quarter | F3 | F1C |
(t) | Gold (g/t) | Gold (oz) | (t) | Gold (g/t) | Gold (oz) |
1 | 124% | 127% | 158% | 109% | 114% | 124% |
2 | 127% | 139% | 176% | 121% | 113% | 136% |
3 | 109% | 141% | 155% | 116% | 111% | 128% |
4 | 153% | 102% | 156% | 132% | 86% | 114% |
Total | 129% | 125% | 162% | 119% | 105% | 126% |
14.3.14 Mineral Resource Classification
Mineral Resource classification at Island Gold has been updated using a revised methodology that reflects increased confidence in the Indicated Resources. Since the original Island Gold classification standards were introduced (RPA et al. 2004), there has been significant progress in understanding the continuity and geological controls of the gold mineralization. These earlier standards are now considered conservative - a view supported by long-term mill reconciliation data. In early 2025, a detailed drillhole spacing study confirmed that the criteria for classifying Indicated Resources could be updated. Based on extensive historical and current production data, reconciliation, underground mapping, and definition drilling, it is now demonstrable that resource continuity can be reliably established with an average drill spacing of up to 40 m compared to the previous limit of 25 m.
The classification of Mineral Resources is determined by the relative level of confidence in the grade estimates. This assessment is informed by multiple factors, including drillhole spacing, geological interpretations, geostatistical and spatial analyses of mineralization continuity, historical mining and milling performance, the precision of drill collar locations and downhole surveys, the quality of assay data, and other technical considerations that may impact the reliability of the resource estimates.
The Mineral Resources at Island Gold are classified into the Inferred, Indicated and Measured Mineral Resource categories. Mineral Resources are outlined manually to form contiguous blocks of potentially mineable shapes that have reasonable prospects for eventual economic
| | | | | |
Island Gold District – NI 43-101 Technical Report August 6, 2025 | 175
|
extraction. All resource classifications are at the discretion of the QP based on geologic continuity and confidence in the geologic interpretation, with the consideration of the estimation criteria detailed below.
The following classification parameters were applied to Island Gold’s resource block models:
•Inferred Mineral Resources: Blocks informed by at least two drillhole composites, with drillhole spacing of up to approximately 75 m, and that do not meet the criteria for Indicated classification, are categorized as Inferred. The lateral and down-dip extension of Inferred Resource wireframes is limited to a maximum of 30 m beyond the last drillhole intercept.
•Indicated Mineral Resources: Blocks are classified as Indicated if they are informed by at least two drillhole composites, with a maximum average block sample separation distance of 40 m, and that do not meet the criteria for Measured classification. The search requirements only allow for one sample per drillhole to be considered.
•Measured Mineral Resources: Mineralization must be exposed and continuity visually confirmed through mining development. Blocks within a 10 m distance from the underground excavations and that were informed by a minimum of four drillholes / face composites are classified as Measured.
Additional infill drilling or underground sampling is required to support re-classification from Inferred to Indicated Mineral Resources and from Indicated to Measured Mineral Resources. It cannot be assumed that all or any part of an Inferred Mineral Resource will be upgraded to an Indicated or Measured Mineral Resource because of additional drilling.
An illustration of the general Mineral Resource and Mineral Reserve classification assigned to the Island Gold deposit is provided in Figure 14-16.
Figure 14-16 Longitudinal Showing Island Gold Mineral Resource and Mineral Reserve Classification
Source: Alamos (2025)
| | | | | |
Island Gold District – NI 43-101 Technical Report August 6, 2025 | 176
|
14.3.15 Mineral Resource Statement
CIM Definition Standards for Mineral Resources and Mineral Reserves (May 2014) defines a Mineral Resource as:
“[A] concentration or occurrence of diamonds, natural solid inorganic material, or natural solid fossilized organic material including base and precious metals, coal, and industrial minerals in or on the Earth’s crust in such form and quantity and of such a grade or quality that it has reasonable prospects for economic extraction. The location, quantity, grade, geological characteristics, and continuity of a Mineral Resource are known, estimated, or interpreted from specific geological evidence and knowledge.”
The “reasonable prospects for economic extraction” requirement generally implies that the quantity and grade estimates meet certain economic thresholds and that the Mineral Resources are reported at an appropriate cut-off grade considering extraction scenarios and processing recoveries (see Table 14-13).
Table 14-13 Criteria Used to Demonstrate Reasonable Prospects for Eventual Economic Extraction
| | | | | | | | |
| Mineral Resource Parameters | Units | Value |
| Gold Price | US$ | $1,800 |
| Exchange Rate | US$:C$ | 0.75 |
| Gold Cut-Off Grade | g/t | 3.36 |
| Mining Recovery | % | 100 |
| Mining, Process, G&A Costs | C$ | $251.27 |
| Mill Recovery | % | 97.0 |
| Ore Specific Gravity | t/m3 | 2.78 |
| Minimum Mining Width | m | 2.0 |
Once interpolation has been carried out, the Mineral Resource areas were outlined on the vertical longitudinal section of the zone to a maximum lateral and vertical distance of approximately 30 m from drillhole intercepts for the C and E1E Zones while a maximum lateral and vertical distance of 20 m was applied to other zones. All blocks within the outlined Mineral Resource shapes are included in the estimation. Cut-off is applied to the overall Mineral Resource shapes and not to individual estimated blocks.
The estimation of Mineral Resources is a complex and subjective process, and the accuracy of any such estimate is a function of the quantity and quality of available data and of the assumptions made and judgments used in geological interpretation.
A summary of Island Gold Mineral Resources is presented in Table 14-14.
| | | | | |
Island Gold District – NI 43-101 Technical Report August 6, 2025 | 177
|
Table 14-14 Island Gold Mineral Resource Summary (as of December 31st, 2024)
| | | | | | | | | | | |
Category | Tonnes and Grade | Contained Gold |
| Tonnes (kt) | Gold Grade (g/t) | (koz) |
Measured Goudreau Upper Island Lochalsh Lower Island Gold Island Gold East Total |
16 58 1 318 78 470 |
11.61 8.56 7.16 16.07 14.17 14.66 |
6 16 0 164 35 222 |
Indicated Goudreau Upper Island Lochalsh Lower Island Gold Island Gold East Total |
104 120 68 817 1,530 2,640 |
12.08 9.93 7.30 8.62 10.28 9.75 |
41 38 16 227 506 827 |
Total Measured and Indicated Goudreau Upper Island Lochalsh Lower Island Gold Island Gold East Total |
120 178 69 1,135 1,608 3,110 |
12.01 9.48 7.30 10.70 10.47 10.49 |
46 54 16 391 541 1,049 |
Inferred Goudreau Upper Island Lochalsh Lower Island Gold Island Gold East Total |
24 21 43 586 1,776 2,449 |
10.80 8.04 10.43 15.26 17.75 16.88 |
8 5 14 287 1,013 1,329 |
Notes:
•CIM definition standards for Mineral Resources and Mineral Reserves (2014) were used for reporting of Mineral Resources.
•Mineral Resources are estimated using a long-term gold price of US$1,800 per troy ounce. The exchange rate used was 1.00 C$ = 0.75 US$.
•Underground Mineral Resources are estimated at cut-off grade of 3.36 g/t gold.
•Gold metallurgical recovery estimated as 97%.
•Underground assumptions include:
A minimum mining width of 2.00 m was used for all zones.
A specific gravity value of 2.78 t/m3 was used for all zones
•Mineral Resources, which are not Mineral Reserves, do not have demonstrated economic viability.
•Mineral Resources are exclusive of Mineral Reserves.
•Effective date of Mineral Resources is December 31st, 2024.
•The QP for the Island Gold underground Mineral Resource estimate is Mr. T. Poulin, P.Geo., Alamos Gold.
•Totals may not match due to rounding.
The Mineral Resources reported herein supersede the Mineral Resources reported previously at year-end 2024 by Alamos for the District on February 18th, 2025.
14.3.16 Comparison to Previous Mineral Resource and Updated Classification
The previous Mineral Resource, which was based on an earlier classification methodology, has been updated using a revised approach that more accurately reflects the geologic confidence of
| | | | | |
Island Gold District – NI 43-101 Technical Report August 6, 2025 | 178
|
Island Gold. The overall decrease in Mineral Resource ounces (including Inferred) is due to the reclassification of ounces into the Measured and Indicated categories, followed by their subsequent conversion into Mineral Reserves (see Table 14-15).
Table 14-15 Change in Resources between Resource Models
| | | | | | | | | | | |
| Category | Tonnes and Grade | Contained Gold |
| Tonnes (kt) | Gold Grade (g/t) | (koz) |
Previous Estimate (YE2024) [A] Measured Indicated Sub-Total Measured + Indicated Inferred |
237 1,892 2,129 7,106 |
10.90 8.46 8.73 16.52 |
83 514 598 3,774 |
Updated Estimate (YE2024) [B] Measured Indicated Sub-Total Measured + Indicated Inferred |
470 2,640 3,110 2,449 |
14.66 9.75 10.49 16.88 |
222 827 1,049 1,329 |
Delta [B] – [A] Measured Indicated Total Measured + Indicated Inferred |
96% 40% 46% (66)% |
34% 15% 20% 2% |
167% 61% 75% (65)% |
Notes:
•Mineral Resources reported exclusive of Mineral Reserves.
14.4 Magino Mine
This section describes the Mineral Resource estimation methodology and summarizes the key assumptions used for the estimate. In the opinion of the QP, the Mineral Resource evaluation reported herein is a reasonable representation of the gold Mineral Resources contained at Magino.
The Mineral Resource Estimates conform to CIM Definition Standards for Mineral Resources and Mineral Reserves (2014) and include Measured, Indicated and Inferred Resources.
Mineral Resources are not Mineral Reserves and do not have demonstrated economic viability. There is no certainty that all or any part of the Mineral Resources will be converted into Mineral Reserves.
14.4.1 Methodology
The Mineral Resource estimate was conducted using the following workflow:
•Visual and statistical inspection of raw drillhole data;
•Construction of lithology domains for constraining grade estimation;
•Construction of a locally varying anisotropy model for variable search orientation during grade estimation;
•Construction of a gold grade indicator wireframe solid for constraining grade estimation;
•Conducted variography study to assess continuity of mineralization;
•Block model construction and grade estimation;
| | | | | |
Island Gold District – NI 43-101 Technical Report August 6, 2025 | 179
|
•Mineral Resource classification; and,
•Statistical and visual block model validation.
The resource estimate has been constrained by a conceptual pit shell to demonstrate reasonable expectation for eventual economic extraction and Mineral Resources are stated at a calculated break-even cut-off grade of 0.28 g/t gold within this shell.
14.4.2 Drillhole Database
Alamos conducted an updated Mineral Resource estimate for the Magino deposit, which incorporates all drilling data from Alamos and predecessor drilling programs conducted through October 4th, 2024. The database was compiled using data from 1,507 drillholes, with collar, survey, geological and assay information, and containing a total of 393,547 m of assayed intervals. All holes were drilled from surface, and includes all drilling conducted since 2006 (see Section 11).
14.4.3 Topography
Original topography is based on a 2011 aerial survey and was used to code block percent below topography in the Mineral Resource block model. The topography surface was reviewed in cross-section slices together with the drillhole collars, with collar and topography elevations displaying close agreement. Actual aerial surveys were conducted to develop year-end 2024 topographies to delineate depletion volumes.
14.4.4 Historic Underground Excavations
A 3D wireframe model of the historic underground workings has been utilized to account for mined out volumes in the Mineral Resource block model. This solid is well constructed and of high resolution, and mining to date has generally confirmed the accuracy of these solids.
14.4.5 Coordinate System
All drillhole and project data is in UTM coordinate system (NAD 83 - Zone 16N).
14.4.6 Locally Varying Anisotropy Modeling
It is well documented through both field observations and visual inspection of raw drillhole assays that gold mineralization is controlled by both primary and secondary structural controls at a variety of scales exhibiting a broad northeast and more east-west strike orientations. Local grade estimation is best suited to the application of locally varying anisotropy (LVA) to define search orientation. This methodology assigns each model block a unique search orientation (bearing/plunge/dip) as opposed to an overall static search orientation. Often referred to as dynamic anisotropy (DA), which only considers the direction (not magnitude) of search, the broader term LVA is the preferred terminology and is used in this Section of the Report.
Orientation directions were generated by visually identifying spatial trends in higher grade assays. Assay cut-offs utilized in this analysis ranged from 1 - 3 ppm gold, depending on the local continuity of high grade. The observed grade trends were modelled in Leapfrog Geo using structural disks as the basis for generating surfaces which were grouped by general strike orientation (NE vs EW). Trends were subsequently manually edited to clean up overlaps and terminations. An oblique view of the resulting LVA surfaces (traces) is provided in Figure 14-17.
| | | | | |
Island Gold District – NI 43-101 Technical Report August 6, 2025 | 180
|
•Yellow traces are illustrated on the 390 m elevation.
•Mineral Resource pit limit has been determined at US$ 1,800/oz gold is indicated per the grey optimized pit shell.
•Black lines are clipping limits for LVA input surfaces
Figure 14-17 Oblique View Showing Interpeted LVA Surface Traces
Source: Alamos (2025)
14.4.7 Grade and Lithology Domain Modeling
A grade indicator solid was constructed using Leapfrog software at 0.18 g/t gold and manually edited to eliminate small volume solids and outlier artifacts. The LVA surface model was utilized to control the generation of the Leapfrog indicator. An example level plan (350 m elevation) is provided in Figure 14-18, showing the 0.18 g/t gold indicator solid and 5 m composite indicator values.
| | | | | |
Island Gold District – NI 43-101 Technical Report August 6, 2025 | 181
|
•Red indicates the 0.18 g/t Au isoshell and 5 m composite indicator values.
•US$ 1,800/oz resource pit is indicated in white.
•View is illustrated at the 350 m elevation.
Figure 14-18 Level Plan Indication Mineral Resource Isoshell and Composit Indicator Values.
Source: Alamos (2025)
A generalized lithologic estimation domain model was constructed using Leapfrog modeling software and was utilized to constrain grade estimation. These domains are based on simplified and grouped lithologies, and exhibit distinct statistical groupings based on analysis of raw gold assay data. These domains served as hard boundaries in the grade estimation process.
A total of four generalized lithology solids were constructed:
1.North volcanics;
2.South volcanics;
3.Granodiorite; and
4.Diabase dykes.
A plan view of the four domains is provided in Figure 14-19 showing drillholes used for resource estimation.
| | | | | |
Island Gold District – NI 43-101 Technical Report August 6, 2025 | 182
|
Figure 14-19 Plan View of Domains Used to Constrain Grade Estimation
Source: Alamos (2025)
14.4.8 Data Analysis
Data analysis was conducted using the exhaustive raw gold assay dataset from Magino grouped by the four lithologic domains. Table 14-16 shows the quantity of drilling above a series of cut-off grades and the corresponding mean grade, grade-thickness (grade x length), standard deviation, and coefficient of variation. The data generally exhibit high coefficients of variation ranging from 6.17 in the granodiorite to 7.76 in south volcanics. It can be observed that the granodiorite is the most favorable host for gold mineralization (primarily WLS) and contains most of the metal in the model area (85%) on a grade-thickness basis. The south volcanics also host minor zones of mineralization, but only accounts for ~9% of total metal.
It is also apparent that the diabase dykes, which transect the deposit at a variety of orientations, are essentially barren in terms of contained metal (on a grade-thickness basis). Model blocks coded as diabase were excluded from the grade estimation process and were assigned a zero-gold grade.
The raw gold assay data were also examined statistically with respect to the 0.18 g/t gold indicator solid to assess the grade solids’ performance in terms of constraining grade/contained metal. Table 14-17 summarizes the data at a series of cut-offs both internal and external to the 0.18 g/t gold indicator solid. It can be observed that above a 0.30 g/t gold cut-off, the grade wireframe captures 83,216 gram-metres out of a total of 95,889 gram-metres within the model area (~87% of total metal on a grade-thickness basis) at an average grade of 1.86 g/t gold.
| | | | | |
Island Gold District – NI 43-101 Technical Report August 6, 2025 | 183
|
Table 14-16 Gold Raw Assay Statistics: Grouped by Lithologic Domain
Table 14-17 Gold Raw Assay Statistics: Internal vs External to 0.18 g/t Gold Grade Wireframe
14.4.9 Specific Gravity Analysis
All model blocks were assigned specific gravity values based on a detailed 3D lithology model prepared by site geologists. Site geologist routinely conducted specific gravity determinations using the water immersion method on site. Beginning in 2023, samples were submitted to the commercial assay lab responsible for gold analyses. The detailed lithologic units were modeled as 46 separate solids, which were then consolidated into seven simplified geologic groupings. Table 14-18 provides the details of the lithologic groupings and assigned specific gravity values in the block model.
| | | | | |
Island Gold District – NI 43-101 Technical Report August 6, 2025 | 184
|
Table 14-18 Specific Gravity Assignments by Lithology Group
| | | | | | | | | | | |
Lithology |
Model Lithology Code | Specific Gravity Value | No of Samples |
|
| Overburden | OB | 1.80 | N.A. |
| Mafic Metavolcanics | 1A | 2.93 | 93 |
| Clastic/Chemical Metasediments | 4A, 5C, 5E | 3.11 | 99 |
| Granodiorite | 6 & 6C | 2.72 | 1,620 |
| Mafic Intrusives | 7A | 2.93 | 93 |
| Felsic Intrusives | 9A | 2.70 | 20 |
| Diabase Dykes | 11A | 3.02 | 61 |
All model blocks in the vicinity of historic underground mining workings were coded with a ‘mined percent’ field based on block volumes mined using the underground depletion solid and block specific gravity assignments adjusted using the following equation to account for mining depletion: SGmined = SGin-situ * (100-mined percent).
14.4.10 Evaluation of Outlier Data
The raw drillhole gold assay dataset was examined statistically to assess for the presence of high-grade outlier values that could adversely impact grade estimation. Several methods are commonly used to detect high-grade outliers, and determination of assay capping thresholds for Magino was based on review of cumulative probability plots. The dataset was examined within the three estimation domains and based on visual breaks in the cumulative probability distributions. The raw assays were capped using capping values as shown in Table 14-19.
Table 14-19 Assay Capping (Topcut) Statistics
| | | | | | | | | | | | | | | | | | | | | | | | | | | | | | | | | | | |
| Domain | No of Samples | Capping Value | Uncapped Mean | Capped Mean |
| Gold (g/t) | Gold (g/t) | Gold (g/t) | No |
| North Volcanics | 63,560 | 12.0 | 0.101 | 0.090 | 29 |
| South Volcanics | 52,480 | 20.0 | 0.203 | 0.179 | 62 |
| Granodiorite | 209,316 | 35.0 | 0.453 | 0.416 | 215 |
| | | |
| Domain | Coefficient of Variance | Metal Lost by Capping | Standard Deviation |
| Uncapped | Capped | (%) | Uncapped | Capped |
| North Volcanics | 9.76 | 5.53 | 10.84 | 0.99 | 0.50 |
| South Volcanics | 9.51 | 5.69 | 11.41 | 1.93 | 1.11 |
| Granodiorite | 6.77 | 4.35 | 7.46 | 3.06 | 1.81 |
14.4.11 Compositing
All capped raw data were composited into 5 m downhole intervals. Composites were back-flagged by the model blocks to assign an estimation domain code. The composites were also back-flagged with the block gold wireframe percentage values for retrieval during grade estimation (internal and external estimation passes, as described in a following section).
| | | | | |
Island Gold District – NI 43-101 Technical Report August 6, 2025 | 185
|
14.4.12 Variogram Analysis
Several gold grade variograms were generated using the capped and domained 5 m composites (correlograms and pairwise relative) to assess both direction and degree (range) of continuity. All variograms display a relatively high nugget (> 60% of sill) and short ranges. This is generally confirmed by field observations, with continuity of individual higher-grade zones quite limited (10’s of metres). Pairwise relative variograms were generated for gold using the 5 m capped composite data using the three grade estimation domains. Example fitted variograms in the granodiorite domain for the major, semi-major, minor axes and 3D omni-directional variogram are provided in Figure 14-20, respectively. Variogram ranges, expressed as a percentage of sill are also shown for 80, 85 and 90% of total sill. An omni-directional pairwise relative variogram using all (un-domained) 5 m composite data is also provided, to assess continuity on a global basis. Observed variogram ranges were used to assess the reasonableness of search ranges used for the grade estimate, and the 3D omni-directional variogram was used qualitatively to assign relative confidence as a function of block-composite separation distances (i.e. resource classification). A summary of variogram model parameters is provided in Table 14-20. As already discussed, variable search orientation was assigned to individual blocks using the previously described LVA surface model.
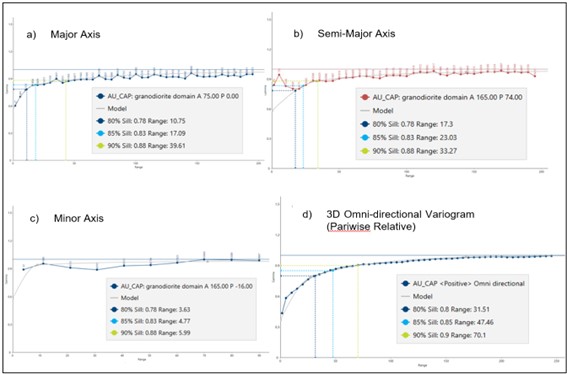
Figure 14-20 Pairwise Relative Variograms and Model – Granodiorite Domain
Source: Alamos (2025)
| | | | | |
Island Gold District – NI 43-101 Technical Report August 6, 2025 | 186
|
Table 14-20 Variogram Model Details
| | | | | | | | | | | |
Parameters | Gold (g/t) Pairwise Relative Variogram |
| Major | Semimajor | Minor |
| Azimuth * | 75° | 345° | 165° |
| Dip ** | 0° | -74° | -16° |
Nugget Effect C0 | 0.58 |
1st Structure C1 (sph) | 0.21 |
2nd Structure C2 (exp) | 0.19 |
1st Structure Range (m) | 12.6 | 15.9 | 46.5 |
2nd Structure Range (m) | 192.0 | 212.8 | 166.4 |
•* Positive from north
•** Negative below horizontal
14.4.13 Block Model Construction
A block model was constructed in Maptek Vulcan™ for the Magino deposit using the model limits and extents provided in Table 14-21. Block model construction utilized a constant block size of 5.0 m x 5.0 m x 5.0 m. Blocks were coded using the detailed lithology model for specific gravity assignment and coded by estimation domain and percentage of block internal to the gold indicator grade wireframe for block-composite match during the grade estimation process.
Table 14-21 Magino Model Limits and Extents
| | | | | | | | | | | |
| Parameter | Easting (X) | Northing (Y) | Elevation (Z) |
| Origin | 687,350 | 5,350,070 | -685 |
| Block Size | 5.0 m | 5.0 m | 5.0 m |
No of Blocks | 576 | 306 | 249 |
Model Rotation 1 | 75° |
Notes:
1. Model rotation is based on Vulcan designation. All blocks are rotated 65° clockwise about model origin.
14.4.14 Block Model Grade Estimation
The Mineral Resource estimate was undertaken using Maptek Vulcan™ software employing the inverse distance cubed weighting method (ID3). A multi-pass search was employed both internal and external to the grade wireframe, with the external pass more restrictive in search distance.
Model blocks were assigned a percentage of the block internal to the 0.18 g/t gold wireframe and only blocks whose volumes were ≥10% internal to the wireframe were available for grade estimation. Model blocks were also “mined” using the historic underground mining solids and both mined tonnage and grade were zeroed out for the final Mineral Resource tabulation.
Only composites with a wireframe percentage ≥10% were retrieved for use in grade estimation within the 0.18 g/t gold wireframe, with a secondary estimate conducted on blocks and composites <10% and external to the wireframe. This approach was used opposed to the more traditional 50% rule commonly employed in percentage-based models (i.e. either inside the wireframe or external) to incorporate a slightly higher proportion of edge dilution along the peripheral wireframe boundary blocks. All composites were length weighted during the grade estimation process.
| | | | | |
Island Gold District – NI 43-101 Technical Report August 6, 2025 | 187
|
A summary of the search parameters utilized is presented in Table 14-22. Model block grades were diluted to account for all volume external to the 0.18 g/t gold wireframe with this material assumed at a 0.00 g/t gold grade.
Table 14-22 Search Parameters for the Magino Grade Estimate
| | | | | | | | | | | | | | | | | | | | | | | | | | | | | | | | |
| Internal to 0.18 g/t Gold Grade Wireframe |
| Search Pass | Domain | Search Orientation | Search Distance (m) | Composite Selection | Max per DDH |
Bearing | Plunge | Dip | Major | Semimajor | Minor | Min | Max |
| 1 | granodiorite | dynamic anisotropy model | 15 | 15 | 5 | 3 | 12 | 1 |
| 2 | 30 | 30 | 5 | 2 | 12 | 1 |
| 3 | 45 | 45 | 5 | 2 | 12 | 1 |
| 4 | 60 | 60 | 10 | 2 | 12 | 1 |
| 5 | 90 | 90 | 10 | 1 | 12 | 1 |
| 1 | north volcanics | 15 | 15 | 5 | 3 | 12 | 1 |
| 2 | 30 | 30 | 5 | 2 | 12 | 1 |
| 3 | 45 | 45 | 5 | 2 | 12 | 1 |
| 4 | 60 | 60 | 10 | 2 | 12 | 1 |
| 5 | 90 | 90 | 10 | 1 | 12 | 1 |
| 1 | south volcanics | 15 | 15 | 5 | 3 | 12 | 1 |
| 2 | 30 | 30 | 5 | 2 | 12 | 1 |
| 3 | 45 | 45 | 5 | 2 | 12 | 1 |
| 4 | 60 | 60 | 10 | 2 | 12 | 1 |
| 5 | 90 | 90 | 10 | 1 | 12 | 1 |
| External to 0.18 g/t Gold Grade Wireframe |
| Search Pass | Domain | Search Orientation | Search Distance (m) | Composite Selection | Max per DDH |
Bearing | Plunge | Dip | Major | Semimajor | minor | min | max |
| 1 | all domains | dynamic anisotropy model | 15 | 15 | 5 | 3 | 12 | 2 |
| 2 | 30 | 30 | 10 | 2 | 12 | 2 |
14.4.15 Block Model Validation
Various measures have been utilized to validate the resultant Mineral Resource block model. These measures include the following:
•Visual inspection of drillhole composites with block grade estimates by zone, both in plan and section;
•Statistical comparisons between block and composite data and histogram block-composite comparisons; and,
| | | | | |
Island Gold District – NI 43-101 Technical Report August 6, 2025 | 188
|
•Swath plot analysis (drift analysis) comparing the ID3 block grades with the corresponding composite grades.
14.4.15.1 Visual Inspection
•Visual comparisons between block model grades and underlying composite grades in both plan and section views show strong agreement, as expected given the estimation methodology applied. Representative northwest–southeast cross-sections (Figure 14-21 and Figure 14-22Showing Block Grades and 5 m Composites (+/- 25 m Viewing Width)
Figure 14-22), a longitudinal section (Figure 14-23), and a level plan at the 310 m elevation (Figure 14-24) illustrate block and composite gold grades.
•Showing Block Grades and 5 m Composites (+/- 25 m Viewing Width)
Figure 14-21 NNW-SSE Cross-Section (NE Portion of Deposit) Viewed to East
Source: Alamos (2025)
| | | | | |
Island Gold District – NI 43-101 Technical Report August 6, 2025 | 189
|
•Showing Block Grades and 5 m Composites (+/- 25 m Viewing Width)
Figure 14-22 NNW-SSE Cross-Section (SE Portion of Deposit) Viewed to East
Source: Alamos (2025)
•Showing Block Grades, 5 m Composites (+/- 20 m Viewing Width)
Figure 14-23 WSW - ENE Long Section
Source: Alamos (2025)
| | | | | |
Island Gold District – NI 43-101 Technical Report August 6, 2025 | 190
|
•Showing Block Grades, 5 m Composites (+/- 20 m viewing width)
Figure 14-24 Level Plan - 310 m Elevation
Source: Alamos (2025)
14.4.15.2 Block-Composite Histogram Comparison
Alamos conducted statistical comparisons between the grades of the Measured, Indicated and Inferred ID3 blocks contained within the 0.18 g/t gold grade wireframe and the underlying 5 m gold composite grades. A cumulative frequency comparison between block and composite gold grades at the Magino deposit is provided in Figure 14-25.
Overall, this comparison shows that the model grade distribution for gold is appropriately smoothed when compared with the underlying composite distribution, and that the comparison of average grades and percentages above a series of cut-offs show close agreement in terms of both incremental and absolute grades above cut-off. Incremental tonnages/metres of blocks/composites above cut-off also show generally close agreement. As an example, within the cut-off increment 1.0 - 3.0 g/t gold, the blocks in that cut-off increment represent 10.9% of the total model tonnage, compared to 10.7% of the total 5 m composites within the same increment. The block grades within that increment average 1.580 g/t gold, with a corresponding 5 m composite grade of 1.617 g/t gold.
| | | | | |
Island Gold District – NI 43-101 Technical Report August 6, 2025 | 191
|
•Within 0.18 g/t gold grade wireframe
Figure 14-25 Frequency Distribution Comparison Between Block and Composite Grades
Source: Alamos (2025)
14.4.15.3 Block-Composite Statistical Comparison
Block-composite global statistics (Table 14-23) show a general smoothing of block grades as compared with the underlying composite grades with reduction in mean grade and in coefficient of variation, reflecting the smoothing of grade compared to the 5 m composites. This is considered appropriate given the erratic distribution of high-grade isolated composites.
| | | | | |
Island Gold District – NI 43-101 Technical Report August 6, 2025 | 192
|
Table 14-23 Composite and Block Gold Statistics: Internal to 0.18 g/t Gold Grade Wireframe
| | | | | | | | |
| Variable Name | Composite Gold (au_cap) | Block Gold (auid3) |
| Count | 26,034 | 1,843,363 |
| Mean | 0.66 | 0.57 |
| Standard deviation | 1.19 | 0.86 |
| Variance | 1.42 | 0.74 |
| CV | 1.81 | 1.52 |
| Max | 35.00 | 33.53 |
| Upper quartile | 0.65 | 0.60 |
| Median | 0.32 | 0.31 |
| Lower quartile | 0.17 | 0.17 |
| Min | 0.003 | 0.003 |
| Skewness | 7.50 | 5.47 |
| Kurtosis | 111.52 | 56.91 |
| Range | 35.00 | 33.53 |
| Sum of weights | 26,034 | 1,843,363 |
| Geometric mean | 0.32 | 0.32 |
| Geometric variance | 4.42 | 3.18 |
| Harmonic mean | 0.12 | 0.16 |
| Logarithmic mean | -1.14 | -1.15 |
| Logarithmic variance | 1.49 | 1.16 |
| Sichel t statistic | 0.67 | 0.56 |
14.4.15.4 Swath Plots (Drift Analysis)
A swath plot is a graphical display of the grade distribution derived from a series of bands, or swaths, generated in several directions through the deposit. Mean gold grades from the ID3 model are then compared to the mean grades of the underlying composites.
On a local scale, the 5 m composite swaths do not provide reliable estimations of local grade, but on a larger scale, they represent an unbiased average of the grade variations within the underlying data.
Swath plots have been generated in three orthogonal directions rotated 75° in alignment with the block model orientation. Swath plots for gold along the east-west, north-south and vertical model directions are shown in Figure 14-26, Figure 14-27, and Figure 14-28.
There is reasonable correspondence between model and composite grades in all orthogonal directions. The degree of smoothing in the ID3 model is evident when compared to the composite grades. This comparison shows general correspondence between the ID3 block grades and the underlying 5 m composite gold grades in terms of general peaks and troughs observed in the rotated X, Y and Z directions, with block grades displaying consistently lower average grades.
| | | | | |
Island Gold District – NI 43-101 Technical Report August 6, 2025 | 193
|
•5 m composites
Figure 14-26 E-W Swath Plot, Comparing ID3 Model Block Grades and Composite Gold Grades
Source: Alamos (2025)
•5 m composites
Figure 14-27 N-S Swath Plot, Comparing ID3 Model Block Grades and Composite Gold Grades
Source: Alamos (2025)
| | | | | |
Island Gold District – NI 43-101 Technical Report August 6, 2025 | 194
|
•5 m composites
Figure 14-28 Vertical Swath Plot, Comparing ID3 Model Block Grades and Composite Gold Grades
Source: Alamos (2025)
14.4.16 Mineral Resource Sensitivity
To assess the sensitivity of the Mineral Resource to changes in gold cut-off grade, Alamos has summarized undiluted tonnage and grade above cut-off for all estimated blocks, at a series of increasing gold cut-offs by Mineral Resource category. The cut-off grade sensitivity analysis for all Measured and Indicated blocks (depleted for past mining and inclusive of Mineral Reserves) within the Magino deposit are provided in Table 14-24. The cut-off grade sensitivity analysis for Inferred blocks within the Magino deposit are provided in Table 14-25. Note that these summaries are global and are not constrained by any pit.
Table 14-24 Cut-off Gold Grade Sensitivity – All Measured and Indicated Blocks in Model
| | | | | | | | | | | |
Cut-Off Grade (g/t Gold) | Tonnage (kt) | Gold Grade (g/t) | Gold Contained (koz) |
| 0.05 | 203,917 | 0.66 | 4,345 |
| 0.10 | 192,141 | 0.70 | 4,316 |
| 0.15 | 175,644 | 0.75 | 4,249 |
| 0.20 | 156,249 | 0.82 | 4,139 |
| 0.25 | 137,067 | 0.91 | 4,001 |
| 0.30 | 119,923 | 1.00 | 3,850 |
| 0.35 | 105,397 | 1.09 | 3,698 |
| 0.40 | 93,636 | 1.18 | 3,557 |
| 0.45 | 83,622 | 1.27 | 3,420 |
| 0.50 | 74,794 | 1.37 | 3,286 |
| 0.55 | 67,616 | 1.46 | 3,165 |
| 0.60 | 61,464 | 1.54 | 3,051 |
| 0.65 | 56,086 | 1.63 | 2,943 |
| 0.70 | 51,323 | 1.72 | 2,840 |
| | | | | |
Island Gold District – NI 43-101 Technical Report August 6, 2025 | 195
|
Table 14-25 Cut-off Gold Grade Sensitivity – All Inferred Blocks in Model
| | | | | | | | | | | |
Cut-Off Grade (g/t Gold) | Tonnage (kt) | Gold Grade (g/t) | Gold Contained (koz) |
| 0.05 | 58,582 | 0.68 | 1,288 |
| 0.10 | 56,008 | 0.71 | 1,281 |
| 0.15 | 51,888 | 0.76 | 1,265 |
| 0.20 | 46,530 | 0.83 | 1,234 |
| 0.25 | 41,126 | 0.90 | 1,195 |
| 0.30 | 36,205 | 0.99 | 1,152 |
| 0.35 | 31,900 | 1.08 | 1,107 |
| 0.40 | 28,312 | 1.17 | 1,064 |
| 0.45 | 25,083 | 1.26 | 1,020 |
| 0.50 | 22,419 | 1.36 | 979 |
| 0.55 | 20,234 | 1.45 | 942 |
| 0.60 | 18,430 | 1.53 | 909 |
| 0.65 | 16,798 | 1.62 | 876 |
| 0.70 | 15,495 | 1.70 | 848 |
14.4.17 Mineral Resource Classification
The Mineral Resources for Magino are classified under the categories of Measured, Indicated and Inferred according to the guidelines as defined by the “CIM Guidelines for Mineral Resources & Mineral Reserves Best Practice Guidelines”, prepared by the CIM Standing Committee on Reserve Definitions and adopted by CIM Council on November 29, 2019. Category definitions are provided in Section 14.2 of this Report.
Classification of the Mineral Resources reflects the relative confidence of the grade estimates. This is based on several factors, including sample spacing, geologic observations, geostatistical /spatial analysis related to qualifying continuity of mineralization, mining and milling history, specific gravity determinations, accuracy of drill collar locations, quality of the assay data and other factors which can influence the confidence of the Mineral Resource estimate.
The classification parameters are defined in relation to the number of drillholes used to estimate the block grades and the block-composite separation distance. These classification criteria are intended to encompass zones of reasonably continuous mineralization.
The following classification criteria were applied to the Magino block model:
Measured Mineral Resources
Blocks in the model that are within the 0.18 g/t gold solid that were informed by a minimum of three drillholes within a 20 m anisotropic search neighborhood
Indicated Mineral Resources
Blocks in the model that are within the 0.18 g/t gold solid do not meet the criteria for Measured Resources and have been informed by a minimum of two drillholes within a 35 m anisotropic search neighborhood.
| | | | | |
Island Gold District – NI 43-101 Technical Report August 6, 2025 | 196
|
Inferred Mineral Resources
Blocks in the model that are within the 0.18 g/t gold solid that do not meet the criteria for Measured or Indicated Resources and have been informed by a minimum of one drillhole within 35 m anisotropic search neighborhood. Additional tonnage external to the 0.18 g/t gold solid was also classified as inferred if a block is informed by one or more drillholes within a 35 m anisotropic search neighborhood.
An example level plan is provided Figure 14-29.
Figure 14-29 Resource Classification on Bench 340
Source: Alamos (2025)
It is recommended that these classification estimation parameters be reviewed and validated with historical data collected over the past several years of production.
14.4.18 Magino Mineral Resource Statement
The Mineral Resources for the Magino deposit have been estimated by Alamos at 60,270 thousand tonnes (kt) at an average grade of 0.91 g/t gold classified as Measured and Indicated Mineral Resources; with an additional 40,291 kt at an average grade of 0.92 g/t gold classified as Inferred Mineral Resources. Mineral Resources were constrained within a conceptual US$1,800/oz pit shell optimized using Measured, Indicated and Inferred Mineral Resources and using the parameters listed in Table 14-26. The Mineral Resources are stated above a 0.28 g/t gold cut-off and have been depleted using the mid-year 2025 mine position (as actual mining and ore control RC drilling has converted all H1-2025 to Measured) . Mineral Resources are exclusive of Mineral Reserves.
| | | | | |
Island Gold District – NI 43-101 Technical Report August 6, 2025 | 197
|
Table 14-26 Conceptual Resource Pit Optimization Parameters
| | | | | | | | |
| Parameters | Units | Value |
| Gold price | US$/oz | $1,800 |
| Gold recovery | % | 91.7 |
| Mining cost | $/t mined | $4.88 |
| Incremental haulage cost (per 5m bench below 390 m) | $/t mined | $0.012 |
| Processing + G&A cost | $/t processed | $16.20 |
| Slope angles | degrees | 43.8 - 54.1 |
The date of this Mineral Resource estimate is as of December 31st, 2024, and is based on drilling data finalized in October 2024. The Mineral Resource statement for Magino is presented in Table 14-27.
Table 14-27 Magino Mineral Resource Statement – as of December 31st, 2024
| | | | | | | | | | | |
| Category | Tonnes and Grade | Contained Gold |
Tonnes (kt) | Gold Grade (g/t) | (koz) |
| Measured | 5,061 | 0.87 | 141 |
| Indicated | 55,209 | 0.91 | 1,615 |
| Measured and Indicated | 60,270 | 0.91 | 1,756 |
| Inferred | 40,291 | 0.92 | 1,191 |
Notes:
•CIM definition standards for Mineral Resources and Mineral Reserves (2014) were used for reporting of Mineral Resources.
•Mineral Resources are estimated using a long-term gold price of US$1,800 per troy ounce. The exchange rate used was 1.00 C$ = 0.75 US$.
•Open pit Mineral Resources are estimated at a cut-off grade of 0.28 g/t gold and contained within a potentially economic open pit shell optimized on Measured, Indicated and Inferred material. Includes external dilution at 0.00 g/t gold for material external to the 0.18 g/t gold solid.
•Contained gold ounces are in-situ and do not include mining losses or metallurgical recovery losses.
•Mineral Resources, which are not Mineral Reserves, do not have demonstrated economic viability.
•Mineral Resources are exclusive of Mineral Reserves.
•Date of Mineral Resources is as of December 31st, 2024.
•The QP for the Magino open pit Mineral Resource estimate is Mr. Jeffrey Volk, CPG, FAusIMM, Director of Reserves and Resources for Alamos Gold Inc.
•Totals may not match due to rounding.
The Mineral Resources reported herein supersede the Mineral Resources reported previously at year-end 2024 by Alamos for the District on February 18th, 2025.
14.5 Consolidated District Mineral Resource Statement
The Mineral Resources, as of December 31st, 2024, for the consolidated District have been estimated by Alamos at 63,380 kt grading an average of 1.38 g/t gold classified as Measured and Indicated Mineral Resources; with an additional 42,740 kt grading an average of 1.83 g/t gold classified as Inferred Mineral Resources. The Mineral Resources are stated above a 3.36 g/t gold cut-off for Island Gold and 0.28 g/t gold cut-off for Magino. Mineral Resources are exclusive of Mineral Reserves.
| | | | | |
Island Gold District – NI 43-101 Technical Report August 6, 2025 | 198
|
Table 14-28 Consolidated District Mineral Resource Statement, as of December 31st, 2024
| | | | | | | | | | | |
| Category | Tonnes and Grade | Contained Gold |
| Tonnes (kt) | Gold Grade (g/t) | (koz) |
Island Gold - Underground Measured Indicated Sub-Total Measured + Indicated Inferred |
470 2,640 3,110 2,449 |
14.66 9.75 10.49 16.88 |
222 827 1,049 1,329 |
Magino – Open Pit Measured Indicated Sub-Total Measured + Indicated Inferred |
5,061 55,209 60,270 40,291 |
0.87 0.91 0.91 0.92 |
141 1,615 1,756 1,191 |
Total Island Gold District Measured Indicated Total Measured + Indicated Inferred |
5,531 57,849 63,380 42,740 |
2.04 1.31 1.38 1.83 |
363 2,442 2,805 2,520 |
Notes:
•CIM definition standards for Mineral Resources and Mineral Reserves (2014) were used for reporting of Mineral Resources.
•Mineral Resources are estimated using a long-term gold price of US$1,800 per troy ounce. The exchange rate used was 1.00 C$ = 0.75 US$.
•Island Gold underground assumptions include:
Underground Mineral Resources are estimated at an undiluted cut-off grade of 3.36 g/t gold and are constrained by potentially mineable zones of contiguous blocks.
Gold metallurgical recovery estimated as 97%.
A minimum mining width of 2.00 m was used for all zones.
A specific gravity value of 2.78 t/m3 was used for all zones.
•Magino open pit assumptions include:
Open pit Mineral Resources are estimated at a cut-off grade of 0.28 g/t gold and contained within a potentially economic open pit shell optimized on Measured, Indicated and Inferred material. Includes external dilution at 0.00 g/t gold for material external to the 0.18 g/t gold solid.
Gold metallurgical recovery estimated as 91.7%.
Contained gold ounces are in-situ and do not include mining losses or metallurgical recovery losses.
•Mineral Resources, which are not Mineral Reserves, do not have demonstrated economic viability.
•Mineral Resources are exclusive of Mineral Reserves.
•Effective date of Mineral Resources is December 31st, 2024.
•The QP for the Island Gold underground Mineral Resource estimate is Mr. T. Poulin, P.Geo., Alamos Gold.
•The QP for the Magino open pit Mineral Resource estimate is Mr. Jeffrey Volk, CPG, FAusIMM, Director of Reserves and Resources for Alamos Gold Inc.
•Totals may not match due to rounding.
The Mineral Resources reported herein supersede the Mineral Resources reported previously at year-end 2024 by Alamos for the District on February 18th, 2025.
14.6 QP Commentary
The Mineral Resource estimates conform to CIM Definition Standards for Mineral Resources and Mineral Reserves (2014).
Mineral Resources are not Mineral Reserves and do not have demonstrated economic viability. There is no certainty that all or any part of the Mineral Resources will be converted into Mineral
| | | | | |
Island Gold District – NI 43-101 Technical Report August 6, 2025 | 199
|
Reserves. Mineral Resources presented herein are in large part estimates and production of the anticipated tonnages and grades may not be achieved or the indicated level of recovery may not be realized. The estimation of Mineral Resources is a complex and subjective process and the accuracy of any such estimate is a function of the quantity and quality of available data and of the assumptions made and judgments used in engineering and geological interpretation. Mineral Resource estimates may require revision based on various factors such as actual production experience, exploration results, fluctuations in the market price of gold, results of drilling, metallurgical testing, production costs or recovery rates. These factors may render the Measured and Indicated Mineral Resources unprofitable to develop. Inferred Mineral Resources may not be converted to Measured or Indicated Mineral Resources.
The QPs are not aware of any environmental, legal, title, taxation, socioeconomic, marketing, political or other relevant factors that would materially affect the estimation of Mineral Resources that are not presented within this report.
| | | | | |
Island Gold District – NI 43-101 Technical Report August 6, 2025 | 200
|
15 MINERAL RESERVE ESTIMATES
The District is currently in operation, with production being provided by an underground mine (Island Gold) in combination with an adjacent open pit mine (Magino).
The Mineral Reserve Estimates conform to CIM Definition Standards for Mineral Resources and Mineral Reserves (2014) and only include Measured and Indicated Resources that have been converted to Proven and Probable Reserves.
The underground Mineral Reserves have been prepared by Island Gold under the guidance of Mr. Nathan Bourgeault, P.Eng., Technical Services Manager at the Island Gold District. Mr. Bourgeault is not independent of the issuer and takes QP responsibility as defined in NI 43-101 for the underground Mineral Reserve estimate.
The open pit Mineral Reserves have been prepared by Magino under the guidance of Mr. Christopher Bostwick, FAusIMM, Senior Vice President – Technical Services at Alamos. Mr. Bostwick is not independent of the issuer and takes QP responsibility as defined in NI 43-101 for the open pit Mineral Reserve estimate.
A summary of the Mineral Reserve estimate for the District is presented in Table 15-1.
Table 15-1 Summary of Island Gold District Mineral Reserves, as of December 31st, 2024
| | | | | | | | | | | |
| Category | Tonnes and Grade | Contained Gold |
| Tonnes (kt) | Gold Grade (g/t) | (koz) |
Island Gold Proven Probable Sub-Total Underground |
821 10,947 11,769 |
11.82 10.78 10.85 |
312 3,795 4,107 |
Magino Proven Probable Sub-Total Open Pit |
22,163 54,710 76,873 |
0.88 0.92 0.91 |
626 1,613 2,240 |
Total Island Gold District Proven Probable Total Mineral Reserves |
22,984 65,657 88,642 |
1.27 2.56 2.23 |
938 5,408 6,347 |
•CIM Definition Standards for Mineral Resources and Mineral Reserves (2014) were used for reporting of Mineral Reserves.
•Refer to the footnotes to Table 15-9 for prices, cut-off, metal recoveries, etc.
•Totals may not match due to rounding.
The Mineral Reserves reported herein supersede the Mineral Reserves reported previously at year-end 2024 by Alamos for the District on February 18th, 2025.
Alamos is not aware of any known mining, metallurgical, infrastructure, permitting and / or other relevant factors that could materially affect the stated Mineral Reserve estimates. However, Mineral Reserves presented herein are in large part estimates and production of the anticipated tonnages and grades may not be achieved or the indicated level of recovery may not be realized. The estimation of Mineral Reserves is a complex and subjective process and the accuracy of any such estimate is a function of the quantity and quality of available data and of the assumptions made and judgments used in engineering and geological interpretation.
| | | | | |
Island Gold District – NI 43-101 Technical Report August 6, 2025 | 201
|
Mineral Reserve estimates may require revision based on various factors such as actual production experience, exploration results, fluctuations in the market price of gold, results of drilling, metallurgical testing, production costs or recovery rates. These factors may render the Proven and Probable Mineral Reserves unprofitable to develop in the future. Also, the grade of ore mined may differ from that indicated by drilling results and this variation may have an adverse impact on production results.
15.1 Island Gold Underground Mineral Reserve Estimates
Mineral Reserve calculations estimate the volume and grade of ore which can be mined and processed at a potential profit. The Mineral Resource was reviewed by the Island Gold engineering department, with assistance from the geological staff, to define the Mineral Reserve blocks that could be economically extracted with a mining plan.
15.1.1 Cut-Off Grades
The conversion of Mineral Resources into Mineral Reserves is based on the economic parameters detailed in Table 15-2. Only Mineral Resources that are classified as Measured or Indicated are used in the economic calculations to estimate Mineral Reserves as of December 31st, 2024.
Table 15-2 Island Gold Underground Cut-Off Grade Parameters
| | | | | | | | |
| Parameter | Units | Value |
| Gold Price | US$ | $1,600 |
| Exchange Rate | US$:C$ | 0.75 |
| Stope Cut-off Grade | g/t | 3.78 |
| Development/Marginal Cut-off Grade | g/t | 2.95 |
Stope Dilution1 | % | 10 - 25% |
Development1 Dilution | % | 15 - 30% |
| Dilution Grade | g/t | 0.50 |
Mining Recovery1 | % | 50 - 95% |
| Process Recovery | % | 96.5% |
| Ore Density | t/m3 | 2.78 |
| Minimum Mining Width | m | 2.8 |
| Mining, Processing and G&A Cost (incl. royalties) | C$/t | $251 |
Notes:
1.Dependant on sector and mining method.
Mining costs and cut-off grades may vary depending on the mining method used and whether the ore block is already developed or not. The 3.78 g/t gold cut-off (stopes) and $251/t operating cost are for undeveloped zones utilizing the long hole mining method. Mining recovery also depends on the mining method and the sector.
The economic viability of the Mineral Resources converted into Mineral Reserves was determined by Island Gold’s engineering department. Dilution, recovery rates and mining costs used in the Mineral Reserve calculations represent Island Gold’s best estimates as of December 31st, 2024. These factors and parameters are revised each year to take into consideration actual or realized factors.
| | | | | |
Island Gold District – NI 43-101 Technical Report August 6, 2025 | 202
|
15.1.2 Methodology
Mineral Reserve shapes were built using Deswik Stope Optimizer (Deswik.SO). The software generates optimized stope shapes based on geological, geotechnical, and economic parameters. Geological parameters include the block model, rock density, mineralized zones and/or dykes. Geotechnical parameters include minimum/maximum strike length, level spacing, pillar widths and wall dip/dump angle. Economic parameters include cut-off grade and planned dilution. Multiple iterations were run through Deswik.SO before settling on final design parameters for stope shape design. Some parameters were chosen based on historical reconciliation data, general industry rules of thumb, and site-specific production experience.
15.1.2.1 Mining Recovery and Dilution
Mining recovery at Island Gold varies depending on the mining method employed. Mining recovery values are calculated based on reconciliation data and informed assumptions by engineering and are presented in Table 15-3. Remnant pillars, for geotechnical purposes, also affect mining recoveries although remnant pillars will become obsolete once paste backfill is utilized for backfilling.
Table 15-3 Island Gold – Mining Recovery
| | | | | | | | |
Mining Method | Remnant Pillar | Mining Recovery (%) |
Development | None | 100% |
Alimak Stope | None | 95% |
Downhole Stope | None | 90% |
Uphole Stope <10m | None | 90% |
Uphole Stope >10m | None | 85% |
Uphole Stope | Rib Pillar | 70% |
Uphole Stope | Sill Pillar | 60% |
Uphole Stope | Rib & Sill Pillar | 50% |
Dilution at Island Gold varies depending on the mining zone and mining method. Dilution for development varies from 15 - 30% and dilution for stopes ranges from 10 - 25%.
15.1.2.2 Reconciliation of 2024 Actuals with Mineral Reserve Model
Reconciliation is a measure of the quality of model accuracy, short-term planning reliability, and operational performance based on actual mining results. The Island Gold team conducts reconciliation reviews on a regular basis, ranging from individual stope close-outs to comprehensive monthly, quarterly, and annual evaluations. Reconciled values are adjusted to match the mill’s reported actuals for both tonnes and ounces.
The Geology Department focusses specifically on evaluating the accuracy of grade estimations and the quality of geological models. To support this, reconciliation reports are prepared that compare long-term models (Mineral Resource and Mineral Reserve), short-term models (grade control) and reconciled values. These reports commonly use F-series metrics (see Table 15-4, Table 15-5 and Table 15-6), a standard reconciliation method in mining introduced by Harry Parker (Parker, 2006).
Only stopes completed during the period and surveyed with a cavity monitoring system are included in the F-Factor analysis. Although development material is tracked and compared against forecasts, it is excluded from the F-Factor analysis due to the complexity of its reconciliation and the relatively minor contribution it makes to total tonnes and contained
| | | | | |
Island Gold District – NI 43-101 Technical Report August 6, 2025 | 203
|
ounces when compared to stopes. Approximately 15% of total reconciled gold ounces (23,828 oz) were recovered from development as opposed to approximately 85% from stopes (134,000 oz.) in 2024.
The F1-Factor compares the short-term (grade control design) model versus the long-term (diluted) Mineral Reserve model. In 2024, the grade control model forecasted approximately 232,469 t at 13.76 g/t gold for a total of 102,878 oz of gold, compared to the reserve model forecast of 218,999 t at 11.48 g/t gold for 80,811 oz. This represents an increase of 6% in tonnes, 20% in grade, and 27% in contained ounces, indicating an improvement in the model through adjustments made at the short-term planning level.
The F2-Factor represents a comparison between reconciled production (mill feed) and grade control forecasts based on muck assays. Reconciled tonnes are used to calculate ounces for the grade control mined category to ensure consistency. In 2024, reconciled stope production totaled 279,753 t at a grade of 14.26 g/t gold, for a total of 128,283 oz of contained gold. Muck assays for the same stopes reported an estimated grade of 14.94 g/t gold, equating to 134,375 oz contained gold. This results in an F2-Factor of 95% for both grade and contained ounces, based on the sum of 2024 stope performance.
The F3-Factor measures the accuracy of the long-term forecast by comparing the reconciled production (mill received) to the diluted reserve model. In 2024, a total of 279,753 t at 14.26 g/t gold for 128,283 oz contained gold were reconciled. The corresponding forecast from the year-end 2023 reserve model estimated 218,999 t at 11.48 g/t gold for 80,811oz contained gold. The resulting F3-Factors for tonnes, grade, and ounces are 128%, 124% and 159% respectively. These figures highlight a significant underestimation in the long-term model, particularly in the higher-grade zones.
The F1C Factor compares reconciled values to the short-term model estimates, highlighting a progressive improvement in Island Gold stope forecasts over the course of the year, particularly in terms of ounces, to better align with actual reconciled production.
| | | | | |
Island Gold District – NI 43-101 Technical Report August 6, 2025 | 204
|
Table 15-4 Island Underground 2022 F-Factors
| | | | | | | | | | | | | | | | | | | | | | | | | | | | | | | | | | | | | | | | | | | | | | | | | | | | | | | | | | | | | | | | | | | | |
| Q | Reserve | Short Term | F1-Factor | Reconciled Tonnes | Est. Grade | Est. Gold | Reconciled Grade | Reconciled Gold | F2-Factor | F3-Factor | F1C-Factor |
| Tonnes (t) | Grade (g/t) | Gold (oz) | Tonnes (t) | Grade (g/t) | Gold (oz) | (t) | (g) | (oz) | (t) | (g/t) | (oz) | (g/t) | (oz) | (g/t) | (oz) | (t) | (g/t) | (oz) | (g/t) | (t) | (oz) |
| 1 | 68,335 | 7.47 | 16,409 | 74,907 | 7.59 | 18,277 | 1.10 | 1.02 | 1.11 | 74,653 | 7.57 | 18,162 | 8.04 | 19,305 | 1.06 | 1.06 | 1.09 | 1.08 | 1.18 | 1.06 | 1.00 | 1.06 |
| 2 | 70,323 | 10.30 | 23,286 | 76,067 | 9.89 | 24,190 | 1.08 | 0.96 | 1.04 | 72,241 | 10.60 | 24,629 | 10.20 | 23,679 | 0.96 | 0.96 | 1.03 | 0.99 | 1.02 | 1.03 | 0.95 | 0.98 |
| 3 | 87,462 | 9.77 | 27,467 | 84,152 | 9.86 | 26,678 | 0.96 | 1.01 | 0.97 | 81,979 | 9.79 | 25,804 | 10.25 | 27,027 | 1.05 | 1.05 | 0.94 | 1.05 | 0.98 | 1.04 | 0.97 | 1.01 |
| 4 | 63,130 | 11.75 | 23,856 | 66,521 | 12.76 | 27,293 | 1.05 | 1.09 | 1.14 | 63,719 | 12.32 | 25,235 | 13.10 | 26,829 | 1.06 | 1.06 | 1.01 | 1.11 | 1.12 | 1.03 | 0.96 | 0.98 |
| 289,250 | 9.79 | 91,019 | 301,646 | 9.94 | 96,438 | 1.04 | 1.02 | 1.06 | 292,593 | 9.97 | 93,829 | 10.29 | 96,841 | 1.03 | 1.03 | 1.01 | 1.05 | 1.06 | 1.04 | 0.97 | 1.00 |
Table 15-5 Island Underground 2023 F-Factors
| | | | | | | | | | | | | | | | | | | | | | | | | | | | | | | | | | | | | | | | | | | | | | | | | | | | | | | | | | | | | | | | | | | | |
| Q | Reserve | Short Term | F1-Factor | Reconciled Tonnes | Est. Grade | Est. Oz | Reconciled Grade | Reconciled Oz | F2-Factor | F3-Factor | F1C-Factor |
| Tonnes (t) | Grade (g/t) | Gold (oz) | Tonnes (t) | Grade (g/t) | Gold (oz) | (t) | (g) | (oz) | (t) | (g/t) | (oz) | (g/t) | (oz) | (g/t) | (oz) | (t) | (g/t) | (oz) | (g/t) | (t) | (oz) |
| 1 | 56,065 | 8.98 | 16,183 | 63,867 | 8.46 | 17,370 | 1.14 | 0.94 | 1.07 | 65,891 | 8.44 | 17,885 | 8.06 | 17,067 | 0.95 | 0.95 | 1.18 | 0.90 | 1.05 | 0.95 | 1.03 | 0.98 |
| 2 | 59,539 | 10.18 | 19,485 | 69,356 | 9.71 | 21,658 | 1.16 | 0.95 | 1.11 | 74,214 | 9.25 | 22,066 | 9.93 | 23,683 | 1.07 | 1.07 | 1.25 | 0.98 | 1.22 | 1.02 | 1.07 | 1.09 |
| 3 | 63,098 | 10.16 | 20,609 | 76,268 | 9.17 | 22,480 | 1.21 | 0.90 | 1.09 | 89,899 | 8.42 | 24,334 | 7.86 | 22,718 | 0.93 | 0.93 | 1.42 | 0.77 | 1.10 | 0.86 | 1.18 | 1.01 |
| 4 | 53,856 | 11.38 | 19,700 | 57,911 | 10.17 | 18,938 | 1.08 | 0.89 | 0.96 | 83,326 | 9.56 | 25,601 | 8.72 | 23,354 | 0.91 | 0.91 | 1.55 | 0.77 | 1.19 | 0.86 | 1.44 | 1.23 |
| 232,558 | 10.16 | 75,977 | 267,402 | 9.36 | 80,446 | 1.15 | 0.92 | 1.06 | 313,330 | 8.92 | 89,886 | 8.62 | 86,822 | 0.97 | 0.97 | 1.35 | 0.85 | 1.14 | 0.92 | 1.17 | 1.08 |
| | | | | |
Island Gold District – NI 43-101 Technical Report August 6, 2025 | 205
|
Table 15-6 Island Underground 2024 F-Factors
| | | | | | | | | | | | | | | | | | | | | | | | | | | | | | | | | | | | | | | | | | | | | | | | | | | | | | | | | | | | | | | | | | | | |
| Q | Reserve | Short Term | F1-Factor | Reconciled Tonnes | Est. Grade | Est. Oz | Reconciled Grade | Reconciled Oz | F2-Factor | F3-Factor | F1C-Factor |
| Tonnes (t) | Grade (g/t) | Gold (oz) | Tonnes (t) | Grade (g/t) | Gold (oz) | (t) | (g) | (oz) | (t) | (g/t) | (oz) | (g/t) | (oz) | (g/t) | (oz) | (t) | (g/t) | (oz) | (g/t) | (t) | (oz) |
| 1 | 63,044 | 9.85 | 19,968 | 68,592 | 10.95 | 24,477 | 1.09 | 1.13 | 1.23 | 77,159 | 14.09 | 34,946 | 12.69 | 31,469 | 0.90 | 0.90 | 1.22 | 1.29 | 1.58 | 1.16 | 1.12 | 1.29 |
| 2 | 61,191 | 11.10 | 21,847 | 64,338 | 13.63 | 28,197 | 1.05 | 1.23 | 1.29 | 77,615 | 15.52 | 38,722 | 15.39 | 38,401 | 0.99 | 0.99 | 1.27 | 1.39 | 1.76 | 1.13 | 1.21 | 1.36 |
| 3 | 43,913 | 13.36 | 18,857 | 40,887 | 16.81 | 22,695 | 0.93 | 1.29 | 1.20 | 46,279 | 17.62 | 26,214 | 17.94 | 26,687 | 1.02 | 1.02 | 1.05 | 1.34 | 1.42 | 1.07 | 1.13 | 1.18 |
| 4 | 50,851 | 12.32 | 20,139 | 58,652 | 14.59 | 27,509 | 1.15 | 1.18 | 1.37 | 78,700 | 13.63 | 34,493 | 12.54 | 31,726 | 0.92 | 0.92 | 1.55 | 1.02 | 1.58 | 0.86 | 1.34 | 1.15 |
| 218,999 | 11.48 | 80,811 | 232,469 | 13.76 | 102,878 | 1.06 | 1.20 | 1.27 | 279,753 | 14.94 | 134,375 | 14.26 | 128,283 | 0.95 | 0.95 | 1.28 | 1.24 | 1.59 | 1.04 | 1.20 | 1.25 |
| | | | | |
Island Gold District – NI 43-101 Technical Report August 6, 2025 | 206
|
15.2 Magino Open Pit Mineral Reserve Estimate
Magino open pit Mineral Reserves were estimated by Alamos through the application of a mine design, phasing sequence, and subsequent mine plan to convert the Measured and Indicated Mineral Resources to Proven and Probable Mineral Reserves. The estimate is based upon the application of a typical truck-shovel open pit mining operation to extract the Mineral Reserve.
15.2.1 Mineral Resource Mine Planning Block Model
The underlying Mineral Resource model used for open pit mine design and planning is a regularized block model that was developed by Alamos in Vulcan as described in Section 14. The model block size is 5 m x 5 m x 5 m in height.
15.2.1.1 Mine Recovery and Dilution
Mine recovery and dilution applied to the year-end 2024 open pit Mineral Reserve estimation, as reported on February 18th, 2025, was based on an overall 15% dilution at 0.0 g/t gold grade, followed by application of a 5% ore loss, similar to factors developed and applied in previous studies and Mineral Reserve estimations. However, this application of mine recovery and dilution does not provide for a good understanding of the spatial impact on the underlying model.
In Q1-2025, AGP Mining Consultants Inc. was contracted to undertake a block model dilution study for the Magino open pit based upon a dilution skin analysis. Upon reviewing the results of the study, Alamos selected the application of a 1.0-metre dilution skin to the underlying Mineral Resource block model.
Estimated total applied dilution within the reserve pit is 8.8% on a tonnage basis, net of ore loss.
15.2.1.2 Reconciliation
2024 reconciliation of Measured and Indicated Mineral Resources within the mine planning Mineral Resource model to ore mined ex-pit, as measured by manually filled loading and trucking sheets early during Q1-2024 and transitioning to the full implementation of the fleet management system at Magino by Q4-2024 is presented in Table 15-7
Table 15-7 Magino Open Pit Reconciliation January – December 2024
| | | | | | | | | | | |
| Model | Tonnes and Grade | Contained Gold |
| Tonnes (kt) | Gold (g/t) | (koz) |
| Planning Model (A) | 3,565 | 1.06 | 121 |
| Declared Ex-Pit (B) | 4,683 | 0.82 | 123 |
| Delta (B) – (A) | 1,118 | n/a | 2 |
| Delta (B) – (A) | 31% | n/a | 2% |
•Planning model utilized is the updated mine planning Mineral Resource model, including modifying factors.
•Planning and declared ex-pit measurements are based on a cut-off grade of 0.45 g/t gold.
•n/a (or not applicable) as changes in grade can be miss-leading in this type of presentation.
| | | | | |
Island Gold District – NI 43-101 Technical Report August 6, 2025 | 207
|
A significant amount of dilution is noticed from the reconciliation, but contained gold is within predictions. Anticipated improvements in grade control practices, digging accuracy and blast heave control through the implementation of MS4M fleet management and OrePro™ 3D Predict software’s during H2/H3-2024 is expected to improve the reconciliation going forward.
As part of the attempts to improve reconciliation, it is recommended that a selective mining unit size study be conducted and compared against reconciliation results through 2025 to determine if a change in block dimensions in the Mineral Resource model is required to improve prediction of ore quantities and quality, and subsequently the reconciliation.
15.2.2 Metallurgical Recoveries
Predictive gold recovery curves have been developed for the open pit ores.
The predictive gold recovery formula for the open pit is as follows:
Au Rec = min(-0.0484 * Au6 + 0.3802 * Au5 -1.2424 * Au4 + 2.1852 * Au3 – 2.2309 * Au2 + 1.3202 * Au + 0.5812) * 100, 95.00) - 1.00
Where:
•Au Rec is the gold recovery in %
•Au is the gold head grade in g/t
Note that the proceeding formula includes a gold recovery cap of 95% prior to the application of a 1.0% recovery reduction to the entire algorithm. This has been done to take a slightly conservative approach to metal recoveries, pending an update based on mill operating results.
Note that this metallurgical accounting methodology differs from the information presented in Section 13 but is not sufficiently different and is deemed appropriate for the determination of pit optimisations and subsequent Mineral Reserves in this Report.
15.2.3 Cut-Off Grade
The open pit cut-off grade (COG) was calculated by Alamos using metal prices, operating costs, applicable sustaining capital cost and exchange rates provided as Corporate Guidance or developed from Alamos’ 2025 Budget and Life of Mine financial and cost models. Table 15-8 summarizes the open pit COG assumptions. A gold COG of 0.30 g/t was calculated for Mineral Reserves.
Table 15-8 Open Pit COG Calculation Parameters
| | | | | | | | |
Parameter Field | Unit | Value |
Metal Prices & FX Gold FX |
US $/oz (US$ : C$) |
1,600 0.75 |
Mining Cost Ore Base Cost Waste Base Cost Overburden Base Cost Inc. Cost per 5m Bench Below 390 Re-handle Long Term Stockpiles Sustaining Capital |
$/t ore $/t waste $/t overburden $/t mined $/t re-handle $/t mined |
3.65 3.59 1.68 0.01 1.96 1.29 |
| | | | | |
Island Gold District – NI 43-101 Technical Report August 6, 2025 | 208
|
| | | | | | | | |
Parameter Field | Unit | Value |
Process Cost Process Fixed Cost Process Variable Cost Sustaining Capital Tailings Management Facility |
$/t milled $/t milled $/t milled $/t milled |
- 11.29 0.55 2.41 |
Treatment and Refining Gold Deductable (@99.9 % Payable) Freight, refining and representation |
$/oz recoverable $/oz recoverable |
2.13 5.09 |
Royalties IBAs Franco Nevada Osisko South Osisko East |
% NSR % NSR % NSR % NSR |
0.84 3.00 2.00 3.00 |
| Gold Recovery at COG | % | 82.6 |
COG | g/t | 0.30 |
The COG represents an incremental open pit COG calculation, which removes the process fixed costs and General & Administration (G&A) costs from the calculation. Alamos is treating the open pit as supplementary ore feed to the underground, with the underground picking up all associated fixed process and G&A costs. This ensures that the combined underground and open pit operations have sufficient ore feed to supply the mill to nominal capacity over the projected life of the project.
15.2.4 Pit Optimization
The open pit optimization was conducted by Alamos on the mine planning Mineral Resource model described in Section 14.4 using a gold metal price of US$ 1,600/oz. The parameters used for open pit optimization are provided in Table 15-8. Only Measured and Indicated Mineral Resources were included in the pit optimization process. Dassault Systemes GEOVIA Whittle was the software used for the open pit optimization.
Preliminary slope estimates were included in the open pit optimization process utilizing overburden and hard rock slope recommendations provided from Golder Associates, as presented in Section 16.
The overburden slopes varied between 2H:1V in the north of the open pit to 2.5H:1V for the remainder of the open pit. These angles were adjusted slightly shallower to provide accommodation for a 10 m wide catch berm constructed at the overburden – bedrock contact.
The hard rock design criteria were similarly adjusted shallower to convert the design inter-ramp angles (IRA) to overall slope angles (OSA). This was accomplished through the conceptual superposition of mine haul road and geotechnical safety berm positions required per the design criteria. Hard rock OSAs vary by zone from 43.8° to 54.1°.
Near Goudreau Lake, an offset of 50 m was applied as a pit limit restriction, thereby maintaining a minimum 50 m distance of the pit crest from the lake.
Open pit optimization results at incremental gold price are provided in Figure 15-1 and Figure 15-2.
The results indicate that at the gold metal decision price of US$ 1,600/oz the results of the optimization are relatively stable over a range of gold metal prices.
| | | | | |
Island Gold District – NI 43-101 Technical Report August 6, 2025 | 209
|
Figure 15-1 Open Pit Size vs Contained Gold
Source: Alamos (2025)
•Pit optimization profit is indicative only – represents metal sales minus costs included within Table 15-8. This is not a cash flow estimate. To be used for pit limit selection only. Interpret results accordingly.
•All pit shells have been evaluated on the gold metal decision price of US$ 1,600/oz.
Figure 15-2 Pit Size vs Pit Optimization Profit
Source: Alamos (2025)
| | | | | |
Island Gold District – NI 43-101 Technical Report August 6, 2025 | 210
|
15.2.5 Reserve Pit Design
The optimized pit solution resulting from the criteria presented in the preceding sections was rationalized into a feasible mining geometry, and haulage ramps were superimposed. Haulage ramps were designed nominally at a 30 m width and with a maximum ± 10% grade. Figure 15-3 illustrates the resulting open pit final limit design.
Figure 15-3 Open Pit Final Pit Limit Design
Source: Alamos (2025)
| | | | | |
Island Gold District – NI 43-101 Technical Report August 6, 2025 | 211
|
The reserve pit limit spans approximately 1,800 m in the southwest to northeast axis and 700 m along the northwest to southeast direction. Maximum pit depth is approximately 320 m.
Total material within the final pit limit design as of end-2024, including waste, is 340 Mt.
15.3 District Mineral Reserves
District Mineral Reserves are summarized in Table 15-9.
Table 15-9 District Mineral Reserve Estimate as of Dec 31st, 2024
| | | | | | | | | | | |
| Category | Tonnes and Grade | Contained Gold |
| Tonnes (kt) | Gold Grade (g/t) | (koz) |
Island Gold Proven Probable Sub-Total Underground |
821 10,947 11,769 |
11.82 10.78 10.85 |
312 3,795 4,107 |
Magino Proven Probable Sub-Total Open Pit |
22,163 54,710 76,873 |
0.88 0.92 0.91 |
626 1,613 2,240 |
Total Island Gold District Proven Probable Total Mineral Reserves |
22,984 65,657 88,642 |
1.27 2.56 2.23 |
938 5,408 6,347 |
Notes:
•CIM definition standards for Mineral Resources and Mineral Reserves (2014) were used for reporting of Mineral Reserves.
•Mineral Reserves are estimated using a long-term gold price of US$1,600 per troy ounce. The exchange rate used was 1.00 C$ = 0.75 US$.
•Underground Mineral Reserves are estimated at cut-off grade of 2.95 g/t gold for developed areas and 3.78 g/t gold for undeveloped areas.
•Underground assumptions include:
A minimum mining width of 2.80 m.
A specific gravity value of 2.78 t/m3 was used for all zones
Planned dilution ranged between 15% and 35% depending on mining objective, method and zone at an average grade of 0.5 g/t gold.
Mining recovery ranged between 50% and 95% depending on mining objective, method and zone.
Average gold recovery estimated as 96.5%.
Cut-off value of 251/t, inclusive of costs for mining, processing, G&A, refining & transport, and royalties.
•Open pit Mineral Reserves are estimated at a cut-off grade of 0.30 g/t gold.
•Open pit assumptions include:
A 1.0-metre dilution skin applied to above COG block sides adjacent to below COG blocks. Dilution grade is applied per the grade present in below COG blocks.
Gold recovery is variable per a recovery algorithm. At COG, metal recovery is estimated as 82.6%.
•Effective date of Mineral Reserves is December 31st, 2024.
•The QP for the Island Gold underground estimate is Mr. N. Bourgeault, P.Eng., Alamos Gold.
•The QP for the Magino open pit estimate is Mr. C. Bostwick, FAusIMM, Alamos Gold.
•Totals may not match due to rounding.
| | | | | |
Island Gold District – NI 43-101 Technical Report August 6, 2025 | 212
|
15.4 QP Commentary
The Mineral Reserve Estimates conform to CIM Definition Standards for Mineral Resources and Mineral Reserves (2014).
Mineral Reserves presented herein are in large part estimates and production of the anticipated tonnages and grades may not be achieved or the indicated level of recovery may not be realized. The estimation of Mineral Reserves is a complex and subjective process, and the accuracy of any such estimate is a function of the quantity and quality of available data and of the assumptions made and judgments used in engineering and geological interpretation. Mineral Reserve estimates may require revision based on various factors such as actual production experience, exploration results, fluctuations in the market price of gold, results of drilling, metallurgical testing, production costs or recovery rates. These factors may render the Proven and Probable Mineral Reserves unprofitable to develop. Also, the grade of ore mined may differ from that indicated by drilling results and this variation may have an adverse impact on production results.
The QPs are not aware of any environmental, legal, title, taxation, socioeconomic, marketing, political or other relevant factors that would materially affect the estimation of Mineral Reserves that are not presented within this report.
| | | | | |
Island Gold District – NI 43-101 Technical Report August 6, 2025 | 213
|
16 MINING METHODS
Mining at the District is conducted using both underground and open pit mining methods. As the combined operations integrate and commence processing through only the Magino mill, the processing rate is expected to increase from a combined 11,200 tpd in 2025 to 12,400 tpd by late 2026.
Over the life of mine (LOM), the underground and open pit operations (including stockpiles) are scheduled to provide 13.3% and 86.7% of the ore tonnage processed with 64.7% and 35.3% of the contained ounces processed, respectively.
The underground mine is currently accessed via a single decline from surface down to the 425L, at which point multiple ramps are developed to internally access different zones of the mine at generally 26 m level intervals. A shaft is currently in development with completion scheduled in 2026 which will permit hoisting of ore and waste from the 1350L and provide services for the transport of personnel and services to any of three shaft stations.
Multiple underground mining methods are employed, including: longitudinal longhole open stoping (principal method), transverse longhole open stoping, and alimak stoping. The selection of mining method is based on a variety of considerations including mineralization geometry, width of the ore zone, local stresses, etc.
The open pit mine is a conventional truck and shovel mining operation, with a fleet of 139 t payload class haul trucks combined with diesel powered hydraulic shovels and excavators, supported by front-end loaders (FELs). The open pit operates at a peak mining rate of 74 ktpd ore and waste and has an overall strip ratio of 3.7:1 (waste:ore).
The combined open pit and underground operation have a remaining mine life through 2039. Processing of Magino stockpiles continues afterwards through 2044.
16.1 Island Gold Underground Mining
There are currently four active mining areas at Island Gold: the Alimak Zone, the West Zone, the Main Island Zone, and the East Zone. The overall mine configuration is shown in Figure 16-1 below, which outlines the various mining zones as well as future stopes and development included in the LOM.
| | | | | |
Island Gold District – NI 43-101 Technical Report August 6, 2025 | 214
|
Figure 16-1 Life of Mine Design Looking North
Source: Alamos (2025)
16.1.1 Mine Access and Development
The Island Gold deposit is accessed via a single decline from surface down to the 425L, at which point multiple ramps are utilized to access the main Island, West, and East zones. These ramps are also connected at numerous points throughout the mine allowing for easy travel between mining zones.
The LOM includes the development of a mine shaft which is currently under construction and is scheduled to be completed during 2026. Currently, the shaft connects to the mine at 840L and 1050L East for purposes of emergency egress only, and a third shaft station will be excavated at 1265L East. Once commissioned, the shaft will be utilized to hoist ore and waste from the 1350L loading pocket to surface. Additionally, the shaft will be used to transport personnel and materials to any of the three shaft stations. From the shaft collar location, ore and waste will be trucked to either the mill or the surface waste stockpile.
Level accesses are typically developed at 26 m intervals (floor to floor) and are designed south of internal ramps providing access to the footwall of the deposit. Once the ore is reached, sills are developed along the ore contact, with their direction controlled by geology. Sill development is used as a drilling, mucking and backfilling platform for stope extraction. On some levels, additional footwall and cross-cut development is required when the width of the mineralization exceeds 10 m. Standard excavation dimensions are shown in Table 16-1.
| | | | | |
Island Gold District – NI 43-101 Technical Report August 6, 2025 | 215
|
Table 16-1 Standard Excavation Dimensions
| | | | | |
| Excavation Type | Dimensions |
| Lateral Development |
| Jumbo sill | 4.6 m W x 4.6 m H (6.5 m W max on variable width) (Arch) |
| Jumbo ramp | 4.75 m W x 4.75 m H (Arch) |
| Level sump | 4.5 m W x 4.5 m H x 13.5 m L |
| Secondary access sump | 4.5 m W x 4.5 m H x 7.0 m L |
| Electrical sub station | 6.0 m W x 4.75 m H x 15.0 m L |
| Electrical bay | 4.75 m W x 4.75 m H x 15.0 m L |
| Gear bay | 8.5 m W x 5.5 m H x 20.0 m L |
| Remuck in level | 5.0 m W x 6.5 m H x 13.5 m L |
| R-muck in ramp | 5.0 m W x 5.0 m H x 13.5 m L |
| Secondary re-muck | 5.0 m W x 4.75 m H x 13.5 m L |
| Vent access #1 | 7.0 m W x 4.5 m H |
| Vent access #2 (to raise) | 7.0 m W x 4.5 m H |
| Safety bay | 1.8 m W x 2.0 m H x 1.8 m L |
| DDH bay | 6.0 m W x 5.0 m H x 13.5 m L |
| DDH bay used as turn-out | 5.5 m W x 5.0 m H x 13.5 m L |
| Minimum turning radius for jumbo corner | 3.5 m |
| Minimum turning radius for truck corner | 5.0 m |
| Turning radius in ramp | 20 m |
| Turning radius in sill | 10 m / 5 m |
| Level intersection in ramp | 5.5 m W x 5.5 m H x 42.5 m L |
| Truck load out | 5.0 m W x 6.5 m H |
| Scoop load-out | 5.0 m W x 5.5 m H |
| Truck turn-out | 5.0 m W x 4.5 m H |
| Level entrance | 5.5 m W x 5.5 m H |
| Vertical Development |
| Alimak raises | 3.0 m W x 3.0 m L |
| Drop raise (ventilation) | 4.0 m W x 4.0 m L |
A total of 140 km of lateral and vertical development are planned as part of the LOM plan. Of this total approximately 21% is operating development, 75% is capital development and 4% is planned to support exploration activities.
Presently, level accesses are designed towards the center of the ore vein and stopes are mined longitudinally from sill extremities towards the level intersection. As mining progresses deeper, level accesses are designed to access the extents of the deposit with stopes being mined from the center towards the extremities to support improved mining stress management.
A standard level configuration is shown in Figure 16-2.
| | | | | |
Island Gold District – NI 43-101 Technical Report August 6, 2025 | 216
|
Figure 16-2 Typical Level Design
Source: Alamos (2025)
16.1.2 General Design Considerations
Island Gold has various tools and systems in place to gather and analyze geotechnical data for each new design. Underground geologists and ground control engineers perform regular mapping campaigns to keep the structural data up to date as mining advances deeper into the orebody. Face mapping and sampling is performed in all ore drives and major structures - quartz veining and shear zones are identified. This data is then digitized and shared with the planning team for future development and stoping designs. Each design is optimized by considering and mitigating risk with instability drivers such as faults, dykes, discontinuity families and changes in lithology. Scanline mapping is also conducted underground to characterize rock mass domains. In general, the rock mass is considered blocky in nature and can be rated as “Good” to “Very Good” (geological strength index = 71 - 77), with a Q’ range (at the 50th percentile) of 25 - 50 for dykes and 16 - 24 for the host rock (tuffs) (RockEng 2024).
In addition to mapping, Island Gold has also evaluated intact rock properties through several laboratory testing campaigns and has analyzed results from core samples at depth. The rock strength for tuffs varies from 100 - 250 megapascal (MPa), which is considered Grade R5, very strong rock. Dykes can range from 230 - 338 MPa.
As the mine progresses deeper and new mining horizons are met, new testing campaigns are planned to ensure designs are created with accurate geotechnical information. This ensures that the design shape or sequence of excavation is optimized without compromising safety or the integrity of future excavations.
| | | | | |
Island Gold District – NI 43-101 Technical Report August 6, 2025 | 217
|
16.1.3 Stope Dimensions
Several different empirical assessments are performed on a regular basis at Island Gold. Empirical assessments allow the ground control department to quickly reference industry standards and published literature to ensure the initial design is in line with past experiences. The Matthews Stability Graph is the main empirical tool used to determine optimal stope dimensions that will yield a stable shape.
Geotechnical parameters (Q’, N’) are calculated by using specific underground details of rock mass ratings or major geological intrusions. The N’ parameter is then plotted on the stability graph, where an approximation of the ideal hydraulic radius is obtained for each face of the excavation. From there, the strike length of the stope can be calculated by using the fixed dimensions of the shape (level spacing and ore width). Stopes at Island Gold are typically designed with an approximate strike length of 18 m. This stope size has proven to be successful in various zones throughout the mine; however, this analysis is regularly performed to account for any new structures and geological features.
16.1.4 Stope Design
Mineral Resource shapes are created by the geology team then submitted to the production engineering team for design. A mineable stope shape is produced by engineering and is optimized by maximizing ore recovery and minimizing planned dilution. Recovery and external dilution factors are applied to the stope shape and its economic viability is evaluated. Stope shapes that have proven to be economically feasible are converted to Mineral Reserves and are mined using the most favorable mining method.
16.1.5 Mining Methods
The mining method for a particular stope is selected based on a variety of factors such as overall geometry of the mineralization, width of the ore zone, local stresses, mapping and geotechnical data, spatial location of the stope, and existing nearby development and infrastructure. Other factors considered include equipment size and limitations as well as available fill type. Ultimately, each stope is evaluated individually, and a stope package is produced to include detailed drilling plans, blast letters, ventilation, gas check instructions, mucking plans as well as backfilling directives.
16.1.5.1 Open Stoping
The predominant mining method used at the Island Gold mine is longhole open stoping. This mining method is conducive to tabular, steeply dipping orebodies and is highly productive with low mining costs. The average dip of the orebody at Island Gold ranges from 75 - 85°, making this a favorable mining method for ore extraction.
Longhole mining consists of drilling a series of sub-vertical down holes between two mining platforms, also known as the overcut and undercut sills. These holes are drilled with electric-hydraulic drill rigs. The top sill is typically used as the drilling and backfilling horizon, and the bottom sill is used as the mucking horizon. In some cases where there is no top sill development, up-holes are drilled from the bottom sill which acts as both the drilling and mucking platform. Once the stope is drilled, the ore is blasted in vertical slices towards an open void and retrieved from the bottom sill using remote load-haul-dump units. The material from the stope is currently trucked to surface; upon completion of the shaft, ore will be trucked or trammed to an ore pass. The stope is then backfilled with unconsolidated rock fill (UCF), cemented rock fill (CRF) or paste fill. The backfilling process will be further discussed in Section 16.1.7.
| | | | | |
Island Gold District – NI 43-101 Technical Report August 6, 2025 | 218
|
There are two types of longhole stoping methods utilized at Island Gold: longitudinal open stoping and transverse open stoping. These two methods employ the same mining principles mentioned above; however, they differ by the stope’s mining direction. Longitudinal stopes are mined along the strike of the ore vein and follow either a modified Avoca technique or a traditional blast hole stoping technique, whereas transverse stopes are mined perpendicular to the vein.
Longitudinal Open Stoping
Stopes are typically mined longitudinally when the ore width is narrow (usually under 10 m). For every first stope on a horizontal sublevel, a primary slot raise is drilled at the extremity of the ore contact. This raise is drilled using an in-the-hole drill with a large reaming head that produces a large diameter hole. This large hole is used as a free face for the first blast. The stope is then fired towards the open void in several blasts (2 - 3 typically) which is achieved by retreating longitudinally towards the main level access (retreat is done in an east/west direction). The broken ore is extracted after each blast is taken to ensure ample void for the following blast. Once the stope is empty, UCF, CRF, or paste fill is placed in the void to fill the opened excavation. This is shown in Figure 16-3, Figure 16-4, and Figure 16-5 below.
Figure 16-3 Drilling - Longhole Stope, Longitudinally Drilled and Mucked
Source: Alamos (2025)
| | | | | |
Island Gold District – NI 43-101 Technical Report August 6, 2025 | 219
|
Figure 16-4 Blasting and Mucking - Longhole Stope, Longitudinally Drilled and Mucked
Source: Alamos (2025)
Figure 16-5 UCF Backfilling - Longhole Stope, Longitudinally Drilled and Mucked
Source: Alamos (2025)
To mine the adjacent stope, the UCF material from the first stope on the level is removed until an open brow is established and angle of repose of approximately 50° is achieved. This creates a primary free face for blasting of the second stope, also known as a “pull void”. The second stope is then blasted, mucked, and backfilled. The process is repeated until the entire sublevel is mined out. Figure 16-6 illustrates the concept of this mining method. This method is commonly known as Modified Avoca Mining. Cavity monitoring surveys are performed regularly to distinguish between the ore and backfill material. The cavity surveys along with the judgement of underground geologists help control grade dilution while mucking.
| | | | | |
Island Gold District – NI 43-101 Technical Report August 6, 2025 | 220
|
Figure 16-6 Pull Void - Longhole Stope, Longitudinally Drilled and Mucked
Source: Alamos (2025)
When CRF or paste fill is used, the backfill material solidifies due to the cement which acts as a binding agent. Therefore, the adjacent stope requires a slot raise for blasting. In this case, the stope must be mined in the same fashion as the first stope on the level and ultimately follows the same process until the entire level is mined out. This is shown in Figure 16-7.
Figure 16-7 CRF or Paste Fill - Longhole Stope, Longitudinally Drilled and Mucked
Source: Alamos (2025)
| | | | | |
Island Gold District – NI 43-101 Technical Report August 6, 2025 | 221
|
Transverse Open Stoping
Stopes are typically mined transversely when the ore width is too wide to mine efficiently and safely using a longitudinal method. Island Gold employs transverse mining where the mining direction runs perpendicular to the strike of the orebody (North/South). Stope mucking is done via multiple draw points that allow for line-of-sight mucking from the remote stand which optimizes mucking productivity. Furthermore, this method allows for production holes to be drilled parallel to the hanging wall and footwall and only requires fanning into the vertical stope ends which are inherently more stable. Each block is split into different panels employing a true primary/secondary sequence. Figure 16-8 displays how each block is accessed by its own drawpoint or access.
Figure 16-8 Transverse Mining Access
Source: Alamos (2025)
This mining method requires the use of a raise as an initial void for blasting. This raise is typically designed in line with the drawpoint, which facilitates mucking as the material is blasted towards the drawpoint. Once the stope has been blasted and emptied, the void must be backfilled with UCF, CRF or paste fill. The primary stopes require a consolidated fill that creates solid end walls to withstand the blast energy while extracting adjacent stopes. The secondary stopes can be filled with UCF if there is no remnant mineralization nearby. One advantage of this method is it allows concurrent activities to take place on a single level improving mining cycle times and productivities.
16.1.5.2 Alimak Stoping
Alimak mining is being utilized in a portion of the West Zone. This method consists of using an Alimak climber as a means of development and production drilling instead of conventional horizontal development.
The process starts by driving a raise along the height of the stope that will serve for secondary support and production drilling access. The raise dimensions will typically be 2.7 m x 3.0 m.
| | | | | |
Island Gold District – NI 43-101 Technical Report August 6, 2025 | 222
|
Once the raise is completely driven, the raise screening is installed. Cable bolts are then drilled and installed as secondary support.
Production drilling is conducted on a horizontal axis on both sides of the raise. The blasting sequence consists of taking horizontal slices followed by void mucking only. Once the entire stope is blasted, continuous mucking can begin. Maintaining the stope filled with blasted material allows for better dilution control. Once mucking is completed, the Alimak stope will be backfilled with CRF or UCF depending on whether it is a primary or secondary stope as Alimak stoping allows for a similar stoping sequence as transverse open stoping. Figure 16-9 shows the Alimak mining sequence.
Figure 16-9 Alimak Stoping
Alimak mining has been employed at Island Gold since 2023 in the West Zone. Additional alimak accesses and nests continue to be developed for further alimak stoping as set out by the LOM plan.
16.1.6 Ground Control
As mentioned in Section 16.1.2, the latest geotechnical scanline mapping results were received in 2024 which summarizes rock mass characterization combining all historical data. With additional analysis of mine seismic data, the results are used to build and calibrate a site stress model. An update to this model was completed in 2022 to incorporate updated geotechnical structural features and mine designs. Regular third party geomechanical studies are completed involving the collection of new core samples underground, implementation of seismic data, as well as the development and review of new geomechanical models for the updated LOM plan and proposed underground infrastructure (shaft and ore/waste handling systems).
| | | | | |
Island Gold District – NI 43-101 Technical Report August 6, 2025 | 223
|
Computerized numerical modeling programs are being utilized as a tool to assist in determining ground control practices and risk management of possible ground failures.
An update of the ground support standard was implemented in 2021 to address the increased stress levels with depth and to add robustness to the ground support standards. Ground support standards are regularly reviewed and updated based on observations and communications between engineering and mine operations.
A microseismic system was implemented in 2017 and 2018, with full commissioning of the system achieved in 2019. The microseismic system covers every zone of the mine with regular expansion programs occurring as the mining front progresses deeper and laterally. A stope re-entry protocol has been implemented based on the micro seismic activity that stopes create after being blasted. The re-entry protocol limits access to areas deemed higher risk once a stope blast is taken (usually levels near the stope or sill levels), until the micro seismic activity returns to background activity. At this point, the “all clear” is given for workers to re-enter the barricaded levels to begin regular operations.
Stope ground support is used to control dilution. Dilution may come from a local structural failure or from inadequate drilling and blasting practices. Cable bolts are used to limit stope wall dilution, and this method has provided good results. Cable bolts are installed along the undercut and overcut. Cables being used range from 6 - 12 m in length.
Level access and stoping sequence methodologies were investigated below the 920L with a planned transition from the current practice of outside-in (Figure 16-10), to a centre-out stope sequence (Figure 16-11). This is expected to improve mining stress management, as mining moves deeper, by shedding stress outward.
Figure 16-10 Upper Mine Outside-In Mining Sequence
Source: Alamos (2025)
| | | | | |
Island Gold District – NI 43-101 Technical Report August 6, 2025 | 224
|
Figure 16-11 Deep Mine Centre-Out Sequence
Source: Alamos (2025)
16.1.7 Backfill
Island Gold is currently using two types of backfill methods: UCF and CRF with the addition of paste fill as a third type upon completion of the Phase 3+ Expansion. Both UCF and CRF fill methods are placed from the top cut of a stope by a load-haul-dump unit. In the event of a hanging wall failure, a Rammer Jammer is employed to “ram” (push) muck tighter against the hanging wall to fill the voids.
16.1.7.1 Unconsolidated Fill
Using UCF to fill empty stopes helps with mine waste management and minimizes stope wall failures by providing stabilization for the stope. UCF is not screened and comes directly from development faces. The angle of repose for UCF ranges between 45 - 54°; however, 45° is usually used when modelling or estimating fill angles to maintain conservative estimates.
16.1.7.2 Consolidated Rock Fill
CRF was implemented at Island Gold in 2019, with placement focused on transverse mining zones, sill pillar recovery and problematic stopes that require CRF instead of UCF. Waste is hauled from development faces to the underground cement plant, where cement slurry is poured directly in the box of the haul trucks. The trucks then haul the CRF over to the top cut level of the stope being backfilled, where it is dumped in a re-muck. The LHD then picks up the CRF and dumps it into the stope.
It has been observed that the driving cycle from the underground cement plant to when the load-haul-dump unit picks up the muck and dumps is enough to mix the waste rock and slurry. BASF’s Master Builders Solutions Masteroc MF 701 is being added into the slurry mixture to help stabilize the cement’s reactivity. This product increases the CRF strength and increases workability time with the slurry to 4 - 6 hours.
| | | | | |
Island Gold District – NI 43-101 Technical Report August 6, 2025 | 225
|
Like the UCF, the CRF is still not considered an engineered product as there is limited quality control on the aggregates being used and no gradation curve has been obtained. However, samples of the cement slurry are sent out for analysis.
16.1.7.3 Paste Fill
Island Gold does not currently utilize paste fill onsite. The construction of a paste plant and an underground paste distribution system is currently being undertaken and is included in the LOM plan which will be utilized for filling future stopes and improving sill pillar recovery.
Filtered tailings from the Magino process plant will be used as aggregate for paste backfill. The paste plant is incorporated into the process tailings dewatering circuit and includes the required thickening, filtration, mixing, and batching equipment. The delivery of paste will be gravity-fed to the stopes via the underground distribution system (UDS) as shown in Figure 16-12.
Figure 16-12 Paste Backfill Underground Distribution System
Source: Alamos (2025)
16.1.7.4 Stope Sequencing
Island Gold has multiple active stoping horizons in the Island, West, and East Zones. This allows for flexibility in the production schedule as each mining horizon follows its own sequence and is independent of mining activities in other zones or horizons.
In areas where longitudinal retreat with UCF is employed, stopes are blasted, mucked, and backfilled starting from the eastern or western most extent of the sill on the bottom horizon. This process repeats itself until the last intersection stope (at the level access and sill
| | | | | |
Island Gold District – NI 43-101 Technical Report August 6, 2025 | 226
|
intersection) is excavated. Figure 16-13 shows a typical longitudinal retreat mining sequence at Island Gold.
Figure 16-13 Example of Longitudinal Retreat Mining Sequence
Source: Alamos (2025)
Once three stopes are taken on the bottom level of a horizon, production can begin on the level above, by retreating towards the level access. This process is repeated until the top horizon of the zone is reached.
Up-hole stopes are taken on the top horizon where sill and rib pillars are left behind for stability purposes. With the addition of paste fill as a backfill method, future sill and rib pillars will be recovered by mining full up-hole stopes to the paste fill. The addition of paste fill will allow for accelerated fill times, improved pillar recovery, and concurrent activities (filling and drilling) resulting in improved cycle times.
Transverse mining zones typically include a mix of transverse and longitudinally accessed mining blocks. These zones follow a traditional primary-secondary mining sequence with primary stopes being filled with a consolidated fill such as CRF or paste fill and secondary stopes being filled with either UCF or a form of consolidated fill, as required.
16.1.8 Void Management Plan
Due to the nature of Island Gold’s mining sequence and use of UCF in many areas, backfill subsidence and backfill run-of-muck is possible. To mitigate this risk, a void management plan has been developed as part of the Island Gold Ground Control Management Plan. This plan helps to track and manage voids as well as defines a series of steps to be taken when an unfillable or unexpected void occurs. A backfill action plan is developed and implemented, and a series of steps are taken afterwards to ensure the void is logged and considered during future designs.
16.1.9 Material Movement & Equipment
Island Gold currently utilizes an internal ramp system to haul ore and waste to surface. The ore is brought to the surface by a combination of 30 t and 42 t haul trucks using a ramp system. Once on the surface, ore is hauled by surface trucks to the Magino mill, located approximately 3.4 km from the portal of the ramp. After the shaft sinking project is complete, the shaft will be
| | | | | |
Island Gold District – NI 43-101 Technical Report August 6, 2025 | 227
|
utilized to hoist ore and waste from the 1350L loading pocket to surface. From the shaft collar location, ore will be trucked to the Magino mill (approximately 6.6 km) and waste will be trucked to the surface waste stockpile.
A detailed list of primary equipment was developed indicating the current fleet and the post-Phase 3+ Expansion fleet requirements which can be found in Table 16-2. The post-Phase 3+ Expansion represents the period after the shaft sinking project is complete and the mine is operating at 2,400 tpd.
Table 16-2 Island Gold Current and Post Expansion Underground Equipment Fleet
| | | | | | | | | | | |
| Equipment Type | Application | Current Fleet | Post-Phase 3+ |
| Jumbo | Development | 5 | 4 |
| Bolter | Ground support | 8 | 6 |
| Scissor lift | Ground support / services | 9 | 6 |
| UG haulage truck | Ore/waste transport | 20 | 7 |
LHD 8 yd3 | Production / development | 11 | 13 |
LHD 3.5 yd3 | U/G maintenance | 3 | 3 |
| Grader | Ramp maintenance | 3 | 3 |
| Lube truck/water Truck | Maintenance | 2 | 3 |
| Boom truck | Material logistics | 8 | 5 |
| U/G personnel vehicles | Personnel transport | 48 | 29 |
| Tractor | Maintenance | 10 | 8 |
| Loader | Surface works | 6 | 4 |
A general decrease in mine equipment results post-Phase 3+ Expansion and is due to the increased productivity efficiencies achieved by the ability to transport ore / waste, materials and personnel via the completed mine shaft. However, loading equipment units increase due to the increase in ore tonnage required as mining expands from 1,200 tpd to 2,400 tpd ore by late 2026.
16.1.10 Island Gold Life of Mine Plan
The LOM plan for Island Gold is presented in Table 16-3.
| | | | | |
Island Gold District – NI 43-101 Technical Report August 6, 2025 | 228
|
Table 16-3 Life of Mine Underground Production Physicals
| | | | | | | | | | | | | | | | | | | | | | | | | | | | | | | | | | | | | | | | | | | | | | | | | | | | | |
| Units | Total LOM | 2025 | 2026 | 2027 | 2028 | 2029 | 2030 | 2031 | 2032 | 2033 | 2034 | 2035 | 2036 | 2037 | 2038 | 2039 |
| Stope Tonnes | kt | 9,871 | 323 | 509 | 640 | 663 | 716 | 712 | 744 | 772 | 770 | 770 | 770 | 755 | 737 | 619 | 371 |
| Stope Grade | g/t | 11.38 | 13.06 | 11.25 | 11.99 | 13.81 | 13.68 | 13.33 | 10.93 | 12.92 | 13.54 | 11.62 | 10.28 | 8.25 | 8.82 | 7.44 | 9.67 |
| Development Tonnes | kt | 1,882 | 159 | 182 | 236 | 214 | 159 | 164 | 132 | 106 | 106 | 106 | 106 | 105 | 104 | 3 | - |
| Development Grade | g/t | 8.10 | 9.38 | 9.83 | 7.20 | 8.06 | 9.29 | 9.12 | 11.19 | 7.34 | 6.56 | 7.22 | 5.97 | 7.33 | 4.29 | 2.29 | - |
| Total Ore Tonnes | kt | 11,769 | 482 | 699 | 878 | 878 | 876 | 876 | 876 | 878 | 876 | 876 | 876 | 861 | 841 | 625 | 371 |
| Total Ore Grade | g/t | 10.85 | 11.83 | 10.85 | 10.69 | 12.42 | 12.88 | 12.54 | 10.97 | 12.24 | 12.70 | 11.09 | 9.76 | 8.14 | 8.25 | 7.41 | 9.67 |
| | | | | | | | | | | | | | | | | |
| | | | | | | | | | | | | | | | | |
| Waste Tonnes | kt | 7,287 | 520 | 656 | 724 | 728 | 726 | 700 | 704 | 606 | 579 | 597 | 392 | 279 | 71 | 5 | - |
| | | | | | | | | | | | | | | | | |
| Ore Development | m | 29,927 | 2,894 | 2,890 | 3,671 | 3,331 | 2,486 | 2,596 | 2,035 | 1,671 | 1,659 | 1,669 | 1,697 | 1,658 | 1,618 | 53 | - |
| Waste Development | m | 99,382 | 5,987 | 8,477 | 9,651 | 10,356 | 10,145 | 10,003 | 9,886 | 7,517 | 7,949 | 8,637 | 5,615 | 4,023 | 1,070 | 64 | - |
| Exploration Development | m | 5,509 | 888 | 960 | 991 | 186 | 372 | 197 | 267 | 1,215 | 432 | - | - | - | - | - | - |
| Total Lateral Development | m | 134,818 | 9,769 | 12,327 | 14,313 | 13,873 | 13,003 | 12,797 | 12,188 | 10,402 | 10,041 | 10,306 | 7,313 | 5,682 | 2,688 | 117 | - |
| | | | | | | | | | | | | | | | | |
| Raise Development | m | 5,305 | 364 | 1,039 | 367 | 459 | 454 | 278 | 430 | 453 | 374 | 312 | 344 | 263 | - | 168 | - |
| | | | | |
Island Gold District – NI 43-101 Technical Report August 6, 2025 | 229
|
16.2 Magino Open Pit Mining
The Magino open pit mine is a conventional truck and shovel mining operation, with a fleet of 139 t payload class haul trucks combined with diesel powered hydraulic shovels and excavators, supported by FELs. The open pit operates at a peak mining rate of 74 ktpd of ore and waste and has an overall strip ratio of 3.7:1 (waste:ore).
16.2.1 Slope Stability Considerations
16.2.1.1 Overburden Pit Slope Stability
Slope angles are based on the report “Feasibility Open Pit Slope Design for the Magino Project” by Golder Associates and dated April 19th, 2017.
In general, the overburden at the Magino site is characterized by a thin layer of topsoil, underlain by roughly 2 - 11 m of silty sand from glaciofluvial / glaciolacustrine deposits, underlain by a gravel and sand layer, to gravel and silty sand from moraine deposits ranging in thickness from roughly 0.5 - 6 m, overlying the bedrock. The overburden soils are generally cohesionless (or with very low cohesion) and consequently, the main mechanism for failure of the overburden materials would likely be raveling or planar failure.
The stability of the overburden slopes would be reduced by increased pore pressures; therefore, it is important to maintain adequate drainage. Overburden is excavated using 2H:1V (horizontal:vertical) or 26.7° slope for the north of the pit and 2.5H:1V or 21.8° configuration for the rest of the pit perimeter. It is also important to take measures as necessary to prevent potential erosion or seepage on the exposed face.
A minimum 10 m wide catch berm will be constructed at the overburden – bedrock contact in areas in front of lakes and where the overburden thickness is greater than 10 m. In all other areas, an 8 m wide catch berm will be applied.
Drainage ditches are installed along the outside perimeter of the pit (where required) to collect and convey surface water away from the open pit slopes.
16.2.1.2 Rock Pit Slope Stability
The main rock types along the open pit walls are granodiorite and mafic volcanics and are, in general, comprised of strong to very strong rocks (uniaxial compressive strength (UCS) > 50 MPa) of good quality (rock mass rating (RMR) >70) with mostly healed contacts. No major continuous weak features (or faults) are anticipated. As a result, the potential for slope instability will be structurally controlled; in essence, no deep seated (large scale) rock mass failure is anticipated for the proposed rock slopes of the open pit.
Local instability (bench scale) may occur due to kinematic controls (the most important being toppling), localized poor quality zones due to minor shears, where the pit walls intersect underground openings, and where there is rock mass damage caused by blasting. As a result, the main consideration for rock slope failure mechanisms would be structurally controlled mechanisms (kinematics), in particular due to the foliation, which is roughly parallel to the ore zone and, therefore, roughly parallel to the north and south walls of the pit, with the potential for toppling on a bench-scale being the dominant mode of failure in the north and south walls.
The hydraulic conductivity, which was assessed by packer testing, was combined with previous data and shows a trend of decreasing conductivity with depth. In general, hydraulic conductivities are observed to be greater than 10-7 metre/second (m/s) from the surface of bedrock to a vertical depth of approximately 100 m. At depths greater than 100 m (vertical), the
| | | | | |
Island Gold District – NI 43-101 Technical Report August 6, 2025 | 230
|
hydraulic conductivity was observed to reduce to less than 10-7 m/s. Pore pressure grids exported from the detailed hydrogeology model created by Robertson GeoConsultants Inc. were used in slope stability modelling.
Two structural domains (south wall, and the combined center and north walls) were identified, and the pit was divided into six design sectors for kinematic assessment. The feasibility level pit slope design recommendations are presented for each design sector in Table 16-4 and Figure 16-14. Inter-ramp slope angles are generally specified as 54o or 56o depending on the area of the pit.
Table 16-4 Recommended Feasibility Open Pit Slope Angles (Golder 2017)
| | | | | | | | | | | | | | | | | | | | |
Design Sector | Wall Dip Direction (o) (Average Range) | Wall Azimuth (o) (Average Range) | BFA (o) Proposed (Potential) | Vertical Bench Separation (m) (Double Bench) | Bench Width (m) Proposed (Potential) | IRA (o) Proposed (Potential) |
I: Northwest Wall | 145 (100-150) | 325 (280-330) | 73(76) | 20 | 8.5 | 54 (56) |
II: North Wall | 175 (150-190) | 355 (330-010) | 73 | 20 | 8.5 | 54 |
III: Northeast Wall | 220 (190-250) | 040 (010-070) | 76 (80) | 20 | 8.5 (9) | 56 (58) |
IV: Southeast Wall | 295 (250-325) | 115 (070-145) | 76 (80) | 20 | 8.5 (9) | 56 (58) |
V: South Wall | 355 (325- 030) | 175 (145-210) | 76 | 20 | 8.5 | 56 |
VI: West Wall | 065 (030-100) | 245 (210-280) | 76 | 20 | 8.5 | 56 |
•BFA = Bench Face Angle and IRA = Inter-Ramp Angle
The design includes 18 m wide geotechnical safety berms every 140 m vertical interval of uninterrupted inter-ramp slopes and considers that the slopes will be excavated using controlled blasting techniques. The potential for steepening the pit slopes, represented between brackets in Table 16-4, are generally dependent on good performance of benches, blasting and control of pore water pressures.
On a portion of the central south wall of Phase 1 / 2, some over-breaking of bench faces to north dipping foliation has been observed. This has resulted in a reduction in the catch bench width in this section of the wall and the ability of the catch bench to function as designed. A geotechnical investigation has been recommended and is planned for 2025 to review the geotechnical controls in this section of wall to identify any required design and / or operational modifications required to ensure compliance with the objectives of slope design.
| | | | | |
Island Gold District – NI 43-101 Technical Report August 6, 2025 | 231
|
Figure 16-14 Recommended Feasibility Open Pit Slope Angles
Source: Golder (2017)
16.2.2 Mine Recovery and Dilution
Dilution occurs through two different forms during mining:
1)Internal block dilution; and
2)Mining dilution.
Internal block dilution is incurred during the Mineral Resource block modelling process whereby model blocks that did not fall completely inside the interpolation grade shell were discounted based on the percentage of the block that falls outside of the grade shell. The discount occurs as the percentage of material outside of the grade shell is incorporated into a block and assigned a grade of 0.00 g/t gold.
Mining dilution occurs when material below the COG cannot be selectively separated from the ore during mining and results in the mixing of waste along the perimeter of the ore due to geometry of the ore / waste contact, blasting and overmining.
During Q1-2025 AGP Mining Consultants Inc. was contracted to investigate the impact that mining dilution would have on the block model by undertaking a dilution skin analysis. This contemplated developing a series of diluted block models whereby skins of 0.5 m through 2.0 m on 0.5 m intervals were developed, whereby Measured and Indicated ore blocks above a 0.30 g/t gold COG were permitted to be diluted by waste. The added tonnage and corresponding metal content from the dilution skin of the adjacent waste block was included in the overall diluted ore tonnage (and was subsequently removed from the affected waste block). Upon review of the results, Alamos selected the application of a 1.0 m dilution skin to the underlying
| | | | | |
Island Gold District – NI 43-101 Technical Report August 6, 2025 | 232
|
resource block model, considering the spatial nature of the mineralization and the current grade control methods and model reconciliation. Alamos also contemplated anticipated improvements in minimizing dilution through improved digging accuracy and blast heave control through the implementation of the MS4M fleet management system and OrePro™ 3D Predict software’s during H2-2024.
Dilution, net of ore loss, is estimated at 9% on a tonnage basis accompanied by a reduction in average grade by approximately 7%.
No additional ore loss is applied beyond that which occurs should the diluted block grade fall below a 0.30 g/t gold COG.
16.2.3 Open Pit Limit Constraints
Adjacent to Goudreau Lake, an offset of 50 m was applied as a pit limit restriction, thereby maintaining a minimum 50 m distance of the pit crest from the lake.
16.2.4 Underground Voids
The open pit will encounter underground workings primarily through the mining of Phase 1 and Phase 2 of the development sequence (see Section 16.2.5). These underground workings include ramps, raises, drifts and stopes (non-backfilled). Alamos has a 3D excavation model of all known workings which has been reliable to-date in indicating the location of openings.
Alamos has developed a series of standard operating procedures to manage development of the open pit through the existing workings, focused on:
•The detection and delineation of anticipated underground openings in advance of mining operations; and
•The safe operation of equipment and personnel in the vicinity of underground workings.
Figure 16-15 illustrates the extent of the underground workings within Phase 1 and Phase 2 of the open pit.
Figure 16-15 Underground Workings Within Phase 1 / 2 of the Open Pit
Source: Alamos (2025)
| | | | | |
Island Gold District – NI 43-101 Technical Report August 6, 2025 | 233
|
16.2.5 Open Pit Mine Design
The mine design was developed on the optimized pit shell detailed in Section 15 by rationalizing the shape into a feasible mining geometry and incorporating haulage ramps and detailed slope design criteria as presented in Section 16.2.1. Haulage ramps were designed nominally at 30 m width and a maximum ± 10% grade.
Phases were subsequently developed on a series of selected nested pits developed during the pit optimization process based upon an incremental analysis of optimized pit solutions generated at increasing gold prices. The nested pits for phase design were selected based upon geometric considerations for safe and efficient mining and access to the primary crusher, ore stockpiles and mine waste rock management facilities. The resulting selection of nested pits indicates the preferred presentation of ore and waste that maximize net present value (NPV).
Five phases were identified for the development of the open pit, with Phase 1 having already been completed and Phase 2 being the currently active phase of the open pit. Phase 5 represents the final pit limit design. Figure 16-16, Figure 16-17, Figure 16-18, and Figure 16-19 illustrate the phase designs developed for the open pit (Phase 2 through Phase 5).
| | | | | |
Island Gold District – NI 43-101 Technical Report August 6, 2025 | 234
|
Figure 16-16 Open Pit Phase 2
Source: Alamos (2025)
| | | | | |
Island Gold District – NI 43-101 Technical Report August 6, 2025 | 235
|
Figure 16-17 Open Pit Phase 3
Source: Alamos (2025)
| | | | | |
Island Gold District – NI 43-101 Technical Report August 6, 2025 | 236
|
Figure 16-18 Open Pit Phase 4
Source: Alamos (2025)
| | | | | |
Island Gold District – NI 43-101 Technical Report August 6, 2025 | 237
|
Figure 16-19 Open Pit Phase 5
Source: Alamos (2025)
| | | | | |
Island Gold District – NI 43-101 Technical Report August 6, 2025 | 238
|
16.2.6 Mining Method
The open pit mine is a conventional truck and shovel mining operation, with a fleet of 139 t payload haul trucks combined with diesel powered hydraulic shovels, large backhoe excavators and FELs as the primary loading units. The open pit operates at a peak mining rate of 74 ktpd of ore and waste and has an overall strip ratio of 3.7:1 (waste:ore).
16.2.6.1 Drilling
Production drilling is carried out by a fleet of Sandvik diesel powered blasthole drill units. The fleet consists of two DR410i rotary drills which drill 200 mm diameter holes and four Dl650i down-the-hole drills which drill 140 mm to 200 mm diameter holes depending on their assignation between production, wall control and pre-split drilling. Blasthole drills are configured to drill the 10 m height of the bench plus one additional metre of subdrill. Production drill patterns (200 mm holes) are designed as 5.10 m x 5.90 m.
Presplit drilling of open pit walls is accomplished preferentially using the Sandvik Dl650i with a 140 mm diameter drillhole spaced every 1.8 m. Pre-splits are drilled to 20 m (double-benched).
Two DX900i top hammer drills are available for pioneering and secondary boulder blasting.
Drill productivities are estimated at a rate of 16 - 21 m/operating hour, dependent on drill type and hole diameter drilled.
16.2.6.2 Blasting
A complete down-the-hole explosives loading and initiation service is performed by a contractor. Services include the provision of explosive products, accessories and site storage magazines. Emulsion explosives are used exclusively due to the design energy requirements. Explosive delivery trucks (capable of mixing emulsion), in-hole explosive priming (electronic detonator and boosters), emulsion pumping and electronic initiation services are provided by the contractor’s blasting crew.
Powder factors range from 0.36 kilogram per tonne (kg/t) for production drilling to 0.40 kg/t around underground voids to improve fragmentation.
16.2.6.3 Loading
Primary loading activities are performed using a Komatsu fleet consisting of large diesel-powered hydraulic excavators in both a front-shovel and backhoe configuration, accompanied by large FELs. The front-shovel configured excavator fleet consists of two PC3000s (16 cubic metre (m3) bucket). The backhoe configured fleet consists of one PC2000 (12 m3 bucket) and two PC1250s (6.7 m3 bucket). The FEL fleet consists of one WA900 (11.5 m3 bucket). Preferentially, the PC3000s are scheduled in waste, with the PC2000 and PC1250 preferentially scheduled in ore and as required, waste. The FEL, due to mobility, is assigned to ore or waste as required and is utilized for stockpile rehandle.
An additional two WA600s are also part of the fleet and provide rehandle support at the crusher as well as providing ancillary services.
16.2.6.4 Hauling
Hauling is performed by a fleet of Komatsu HD1500 mechanical drive rear-dump haul trucks in the 139 t payload class. The fleet is primarily used for mine production and long-term stockpile rehandle; however, it is also involved in tasks such as clean-up, snow-handling and other
| | | | | |
Island Gold District – NI 43-101 Technical Report August 6, 2025 | 239
|
support functions. The fleet is also utilized to haul waste material to the tailings management facility (TMF) for construction purposes, as required.
A fleet of smaller haul units for site support functions, includes three Komatsu HD605 mechanical drive rear-dump haul trucks in the 70 t payload class and three Komatsu HM400 articulated haul trucks in the 40 t payload class.
16.2.7 Mine Planning
The mine plan is executed to take advantage of the installed mine fleet productive capacity, allowing an elevated COG policy to be adapted, whereby higher-grade ores are preferentially sent to the mill for processing while lower grade ores are sent to stockpile for deferred processing. This results in an open pit life extending to 2039, with stockpile rehandling occurring through 2044 to fulfill available process plant capacity.
Waste from the open pit is identified as either overburden, non-acid generating waste (NAG), chert-NAG (CNAG) or potentially acid generating waste (PAG). Overburden is stored in the southwest storage facility (SWSF), NAG and CNAG in the mine rock management facility (MRMF) where CNAG is preferentially encapsulated and PAG is stored within the TMF such that its final deposition is sub-aqueous.
A significant proportion of NAG is direct deposited within the TMF embankment as required for construction and raising of the TMF dam to meet increasing tailings storage requirements.
All mine waste storage facilities are designed to accommodate the various material storage requirements.
Table 16-5 presents the open pit mine production schedule.
| | | | | |
Island Gold District – NI 43-101 Technical Report August 6, 2025 | 240
|
Table 16-5 Life of Mine Open Pit Production Physicals
| | | | | | | | | | | | | | | | | | | | | | | | | | | | | | | | | | | | | | | | | |
| Units | Total | Period |
| 2025 | 2026 | 2027 | 2028 | 2029 | 2030 | 2031 | 2032 | 2033 | 2034 | 2035 |
| Ore Tonnes | kt | 72,511 | 5,309 | 8,555 | 7,676 | 5,659 | 6,288 | 5,364 | 941 | 1,549 | 3,735 | 5,436 | 7,392 |
| Gold Grade | g/t | 0.92 | 0.85 | 0.82 | 0.94 | 1.00 | 0.80 | 1.08 | 0.66 | 0.73 | 1.00 | 0.99 | 1.03 |
| Gold Contained | koz | 2,142 | 146 | 224 | 233 | 183 | 162 | 186 | 20 | 36 | 120 | 173 | 244 |
| Waste Tonnes | kt | 267,977 | 15,456 | 15,037 | 18,727 | 21,266 | 20,637 | 21,561 | 23,275 | 23,275 | 19,600 | 17,899 | 15,943 |
| Total Tonnes Mined | kt | 340,488 | 20,765 | 23,592 | 26,403 | 26,925 | 26,925 | 26,925 | 24,216 | 24,824 | 23,335 | 23,335 | 23,335 |
| Strip Ratio | t:t | 3.70 | 3.91 | 2.76 | 3.44 | 4.76 | 4.28 | 5.02 | 25.74 | 16.02 | 6.25 | 4.29 | 3.16 |
| Re-handle Tonnes | kt | 35,925 | - | 337 | 1,648 | 740 | 730 | 730 | 2,709 | 2,111 | 0 | 0 | 0 |
| Total Tonnes Moved | kt | 376,413 | 20,765 | 23,929 | 28,051 | 27,665 | 27,655 | 27,655 | 26,925 | 26,935 | 23,335 | 23,335 | 23,335 |
| | | | | | | | | | | | | |
| Units | Total | Period |
| 2036 | 2037 | 2038 | 2039 | 2040 | 2041 | 2042 | 2043 | 2044 | 2045 | 2046 |
| Ore Tonnes | kt | | 5,932 | 2,667 | 5,602 | 406 | - | - | - | - | - | - | - |
| Gold Grade | g/t | | 1.02 | 0.87 | 0.76 | 0.74 | - | - | - | - | - | - | - |
| Gold Contained | koz | | 194 | 74 | 136 | 10 | - | - | - | - | - | - | - |
| Waste Tonnes | kt | | 17,403 | 19,685 | 17,733 | 480 | - | - | - | - | - | - | - |
| Total Tonnes Mined | kt | | 23,335 | 22,352 | 23,335 | 886 | - | - | - | - | - | - | - |
| Strip Ratio | t:t | | 3.93 | 8.38 | 4.17 | 2.18 | - | - | - | - | - | - | - |
| Re-handle Tonnes | kt | | 27 | 1,018 | 251 | 3,747 | 4,538 | 4,526 | 4,526 | 4,526 | 3,759 | - | - |
| Total Tonnes Moved | kt | | 23,362 | 23,370 | 23,586 | 4,634 | 4,538 | 4,526 | 4,526 | 4,526 | 3,759 | - | - |
| | | | | |
Island Gold District – NI 43-101 Technical Report August 6, 2025 | 241
|
16.2.8 Equipment Requirements
Mine equipment requirements are based upon the annual mine plan production schedule, equipment availability, utilization and equipment productivities.
Equipment productivities were determined for drills, shovels, and loaders based on historical operating parameters and reasonable productivity improvements as the operation matures. Haul truck productivity is also dependent on annual cycle times. Required production hours were calculated for all primary equipment as well as support equipment. A summary of principal open pit mining equipment requirements is presented in Table 16-6.
Table 16-6 Principal Open Pit Mining Equipment Requirements
| | | | | | | | | | | |
Description | Manufacturer | Model | Current Units |
Drill | Sandvik Sandvik Sandvik | DR410i Dl650i Dx900i | 2 4 2 |
Hydraulic Excavator | Komatsu Komatsu Komatsu | PC3000 PC2000 PC1250 | 2 1 2 |
Wheel Loader | Komatsu Komatsu | WA900 WA600 | 1 2 |
Haul Truck | Komatsu Komatsu Komatsu | HD1500 HD605 HM400 | 15 3 3 |
Dozer | Liebherr Liebherr | PR776 PR766 | 3 1 |
Grader | Komatsu Komatsu | GD655 GD955 | 1 1 |
Water Truck | Komatsu | HD605 | 2 |
Lube Truck | Komatsu | HM400 | 2 |
Light Plants | Atlas Copco | - | 14 |
Except for the number of haulage units which increase to a peak level of 18 units, the peak open pit mining equipment requirements correspond to the current fleet size.
Note that in addition to the principal fleet, a support fleet of smaller equipment is available for miscellaneous activities and jobs at the mine site. This miscellaneous fleet consists of small FELs, excavators, backhoes, etc.
| | | | | |
Island Gold District – NI 43-101 Technical Report August 6, 2025 | 242
|
17 RECOVERY METHODS
During H1-2025, both the Island Gold and Magino mills are used to process ore corresponding to each operation. In July 2025, the Island Gold mill will be put into a care-and-maintenance mode and eventually closed and dismantled.
Due to the limited use of the Island Gold mill in relation to the LOM presented within this Report, only the Magino mill process is presented.
17.1 Overview
The existing Magino processing facility will begin blending and processing Island Gold ore and Magino ore together in July of 2025. This will be described as Step 1 “Existing Magino Processing Facility”. In 2025 and 2026, Island Gold ore will be pre-crushed at the existing Island Gold crushing plant and hauled to Magino via an approximate 2.7 km dedicated haul road at an initial rate of 1,200 tpd, increasing to 1,400 tpd by the end of 2025. Magino ore will fluctuate between 9,800 - 10,000 tpd resulting in a combined Step 1 mill throughput of 11,200 tpd through the Magino processing facility. Starting in 2027 Island Gold ore will be crushed underground as opposed to at the existing Island Gold crushing plant and will be transported 6.6 km from the shaft complex to the Magino mill for processing.
The mill feed head grade is based on a 9:1 blend ratio of Magino lower-grade ore at a nominal 1.0 g/t gold and Island Gold higher-grade ore at a nominal 10 g/t gold, on average. This produces an average feed grade of approximately 1.9 g/t gold. The overall gold recovery from the blend is expected to be approximately 96.0%.
The existing Step 1 Magino process plant utilizes a crushing and grinding configuration consisting of a primary jaw and secondary cone crusher followed by a SAG mill and ball mill grinding configuration. Ball mill discharge is in closed circuit with cyclones for classification and a gravity circuit to remove coarse gold. Cyclone overflow product is thickened and pumped to the existing carbon-in-leach (CIL) circuit where oxygen, lime and cyanide are added for cyanidation. The carbon-in-pulp (CIP) circuit recovers the dissolved gold and silver from the leached slurry. Loaded carbon from the CIP circuit is acid washed, followed by carbon stripping using an Anglo American Research Laboratories (AARL) elution process and electrowinning to recover the gold. Gravity concentrate is processed via an intensive leaching reactor (ILR). Pregnant solution from the AARL has two electrowinning cells and the ILR has its own electrowinning cell. This is followed by smelting of the filtered electrowinning sludge to produce gold doré.
CIP slurry tailings are pumped to the cyanide destruction circuit which uses a sulphur dioxide (SO2) process to reduce the CNWAD concentration to acceptable environmental levels prior to pumping of the plant tailings to the TMF.
Magino process plant performance over the last three years is summarized in Table 17-1.
Table 17-1 Plant Performance (2023-2025)
| | | | | | | | | | | | | | |
| Units | 2023 Jun - Dec | 2024 Jan - Dec | 2025 Jan - May |
| Tonnes Milled (dry) | kt | 1,494 | 2,567 | 1,161 |
| Mill Feed Gold Grade | g/t | 0.86 | 0.95 | 0.91 |
| Recovery – Gold | % | 88.0 | 94.4 | 93.6 |
| Poured – Gold | oz | 32,948 | 76,012 | 30,911 |
| | | | | |
Island Gold District – NI 43-101 Technical Report August 6, 2025 | 243
|
The Magino process plant Step 2 expansion phase will utilize underground crushing of Island Gold ore along with existing Magino ore being processed through the existing Magino crushing plant. Grinding will include the addition of a pebble crusher and auxiliary mill to re-crush the oversize product. The ball mill will be retrofitted with a new gear reducer to speed up the ball mill to 78% of critical speed. These additions will help improve mill throughput to 12,400 tpd. The Step 2 expansion will also include an expanded gold recovery plant to support additional gold production. The gold recovery plant consists of pre-oxidation, leaching, CIP elution, electrowinning and smelting. This expansion is expected to be completed in Q3-2026 and is linked to the completion of the Island Gold underground shaft and ore handling system, which is scheduled for completion in phases between Q3-2026 and H1-2027.
The Step 2 blending and crushing process at Magino will remain similar to Step 1. This will consist of blending 2,400 tpd Island Gold ore and 10,000 tpd Magino ore through the crushing and grinding system, resulting in a combined throughput of 12,400 tpd. The mill feed head grade is based on Magino lower grade ore at a nominal 1.0 g/t gold and Island Gold high grade ore at a nominal 10 g/t gold, producing an average feed grade of approximately 2.7 g/t gold. The overall gold recovery from the blend is expected to be approximately 96.0%.
An underground crushing system to be implemented as part of the Phase 3+ Expansion, is expected to produce a 125 mm crushed product. The ore will be skipped to surface, loaded into 40 t haul trucks (three Komatsu HM400 and two Western Star 40 t haul trucks) and transported to the Magino crusher utilizing a designated 6.6 km haul road. When completed, this underground crushing system will replace the existing surface crusher at Island Gold.
The existing Step 1 Magino process plant consists of the following unit operations:
•Primary and secondary crushing circuit and associated material handling equipment;
•Crushed ore storage reclaim tent and associated reclaim systems;
•SAG mill and ball mill circuits that produce a primary grind size P80 of 75 µm, gravity concentrators, cyclone classification and associated pumping and material handling systems;
•Pre-leach thickening;
•Cyanidation (5 leach tanks) circuit providing approximately 27 hours residence time;
•CIP carousel (7 tanks) circuit;
•Acid wash, elution, and carbon reactivation (4.0 t AARL plant);
•Gold electrowinning and smelting (gold room);
•SO2 cyanide destruction (2 DETOX tanks); and
•Tailings pumping to the primary TMF.
The Step 2 Magino process plant expansion includes the following additions to the unit operations:
•Installation of a pebble crusher and auxiliary mill to the existing grinding circuit to increase throughput to 12,400 tpd;
•Conversion of one existing leach tank into a pre-oxidation tank;
•Installation of a leach feed transfer pump to split the feed between the existing leach circuit and Step 2 leach circuit;
| | | | | |
Island Gold District – NI 43-101 Technical Report August 6, 2025 | 244
|
•Installation of four additional leach tanks, providing approximately 48 hours additional residence time;
•Installation of an additional CIL carousel circuit (eight pump cell tanks);
•Installation of an additional 6.0 t adsorption-desorption-recovery (ADR) plant consisting of acid wash, elution (6.0 t ZADRA), and carbon reactivation;
•Replacement of the existing gold room with a new gold room for the increased doré production;
•Installation of an additional cyanide destruction circuit; and
•Installation of a new tailings pumping system for the increased throughput.
A simplified process flowsheet of the existing Step 1 and proposed Step 2 expanded Magino process plant is shown in Figure 17-1.
Figure 17-1 Simplified Process Flowsheet – Existing and Proposed Expansion
Source: Halyard (2025)
17.2 Process Description
A general layout of the current Magino mill is provided in Figure 17-2.
| | | | | |
Island Gold District – NI 43-101 Technical Report August 6, 2025 | 245
|
Figure 17-2 Magino Mill Layout
Source: Ausenco (2021)
17.2.1 Hauling, Crushing and Crushed Ore Storage
The existing crushing circuit at Magino will not be modified during the Step 1 transition. The circuit consists of a primary jaw crusher, sizing screens, secondary cone crusher and associated material handling equipment.
17.2.1.1 Island Ore Crushing / Hauling
The existing Island Gold crushing plant consists of a Clemro 18” x 54” – 75 kilowatt (kW) primary crusher, sizing screen, Metso HP 200 – 150 kW, secondary cone crusher and associated material handling equipment.
This is accomplished by loading and hauling Island Gold underground run-of-mine (ROM) ore to the primary crusher feed bin using a CAT 980 FEL and a CAT 745 haul truck. The ore is direct dumped into the primary crusher’s 100 t storage feed bin. The crushed ore is weighed by a calibrated belt scale and belt cut sampled every hour for head grade analysis. Ore is then hauled on day shift down a 2.7 km haul road with 40 t haul trucks to the Magino processing facility and is blended with the Magino ore into the primary crusher ROM bin. The haulage fleet currently consists of three 40 t Komatsu HM400 and two Western Star 40 t haul trucks.
| | | | | |
Island Gold District – NI 43-101 Technical Report August 6, 2025 | 246
|
17.2.1.2 Magino Ore Hauling
Magino ROM ore has a nominal top size of 1000 mm and is crushed at a rate of 10,000 tpd producing a product size of 42 mm. Komatsu HD1500 139 t haul trucks bring ROM ore from the open pit mining operations to the crushing plant. The ore is currently dumped adjacent to the crusher’s grizzly feeder and then rehandled into the grizzly feeder with a FEL as feed for primary crushing.
17.2.1.3 Blending and Crushing
The blending process will be a 9:1 ratio of Magino ROM ore and Island Gold pre-crushed ore. Magino ore is fed to the crusher feed bin using a Komatsu WA900 FEL along with Island Gold ore. The Island Gold blending sequence consists of ore direct dumping every 2nd truck on dayshift and stockpiling every other truck for night shift, blending with the Komatsu WA900 FEL.
Ore is dumped by haul truck and / or FEL into the primary crusher ROM bin and withdrawn from the bin by an apron feeder and passes over a vibrating grizzly with 100 mm spaced bar openings before feeding the jaw crusher. The jaw crusher is a Metso C-150 with a 220 kW motor that has the capacity to process 650 tph of material with a close-size-setting of 125 mm at a 67% utilization factor. The jaw crusher discharge product is conveyed to the 1.8 m x 6.1 m secondary crusher scalping screen. The scalping screen is a double deck vibrating screen with 60 mm apertures on the top deck and 35 mm apertures on the bottom deck. The scalping screen is designed to remove 30% of the jaw crusher product to the undersize. Scalping screen undersize is collected on the stockpile feed conveyor. Combined oversize from the secondary scalping screen is fed to the secondary crusher feed bin. The secondary crusher is fed using a variable speed belt feeder. The secondary crusher is a Metso HP 500 cone crusher with a 370 kW motor and has the capacity to process 550 tph at 67% utilization factor. Cone crusher discharge is collected on the stockpile feed conveyor where the combined feed of 630 tph is dumped into a 30,000 t fine ore storage fabric tent building to provide mill feed surge capacity. This tent also provides dust containment and cold weather protection minimizing the risk of stockpile freezing. The crushed ore stockpile surge capacity allows for a steady feed of ore to the process plant. Material is reclaimed by two 7,800 mm x 1,200 mm (length x width) apron feeders at a controlled rate to meet the SAG mill feed requirements. The variable speed apron feeders supply the mill feed conveyor to the SAG mill. The mill feed conveyor is equipped with a belt weigh scale which, in conjunction with the mill feed control algorithm in the process control system, controls and records the feed rate to the SAG mill.
Figure 17-3 and Figure 17-4 illustrates the primary and secondary crushing installations at Magino.
| | | | | |
Island Gold District – NI 43-101 Technical Report August 6, 2025 | 247
|
Figure 17-3 Primary Crushing Installation
Source: Ausenco (2021)
Figure 17-4 Secondary Crushing Installation
Source: Ausenco (2021)
17.2.2 Grinding / Gravity
The SAG mill is 7.92 m in diameter and has an effective grinding length of 4.42 m with a 5 megawatt (MW) variable speed drive. The ball mill is 6.10 m in diameter and has an effective grinding length of 8.84 m with a 6.3 MW drive. Both mills are equipped with squirrel cage induction motors. A common variable speed drive is used to first start the ball mill and then start
| | | | | |
Island Gold District – NI 43-101 Technical Report August 6, 2025 | 248
|
and operate the SAG mill in variable speed mode. Both mills were supplied by FLS. The grinding circuit in Step 1 will initially process 11,200 tpd and produce a primary grind size of P80 of 75 µm. At the completion of Step 2 expansion, the production will increase to 12,400 tpd.
The Step 1 grinding process is a SAG and ball mill crushing circuit designed to operate at a nominal throughput of 500 tph. Water is added to the SAG mill feed to maintain the slurry density at 75% solids. SAG mill product passes over a 2,000 mm diameter x 2,400 mm trommel discharge screen with openings of 12 x 50 mm. The oversize from the trommel is conveyed back to the SAG mill feed conveyor. Step 2 will have a pebble crusher and auxiliary mill installed which re-crushes the oversize product. This will help increase throughput up to approximately 550 tph. The trommel screen undersize flows to the cyclone feed pump box where it is combined with the ball mill discharge product. The ball mill operates in closed circuit with ten classifying cyclones (8 operating + 2 standby). The cyclone underflow returns to the ball mill and the cyclone overflow passes over a vibrating trash removal screen (wood chips, etc.) before gravitating to the 23 m diameter pre-leach thickener.
The gravity circuit utilizes two FLS Knelson concentrators resulting in approximately 40% recovery of the gold from the mill feed. This is accomplished by pumping a slurry side stream off the ball mill discharge pump box up to a 2.1 m x 4.8 m gravity feed scalping screen. The screen is fitted with 2 mm x 13.5 mm slotted polyurethane panels. The scalping screen undersize is divided between two FLS Knelson KC-QS40 centrifugal gravity concentrators. The gravity concentrators operate on a batch basis and the concentrate flows by gravity to the ILR circuit. The ILR is a Consep Acacia Model CS3000. Scalping screen oversize and gravity tailings report to the cyclone feed pump box. The Knelson’s concentrate is collected in the gravity concentrate storage cone. Once a full batch of concentrate is collected it is discharged into the ILR reaction vessel. The concentrate is deslimed and then leached with NaCN, caustic and LeachAid™ at 40 °C. The leached pregnant solution is pumped from the reaction vessel feed tank to the ILR pregnant tank, located in the gold room. The leached residue within the reaction vessel is washed and returned to the grinding circuit.
17.2.3 Pre-Leach Thickening
The slurry product from the grinding circuit cyclone overflow trash screen flows to a 23 m diameter thickener unit where flocculant is added to assist in settling of the slurry to produce an underflow density of 55% solids. This underflow is pumped using an 8 x 6 inch slurry pump to a series of five leach tanks where the remaining gold in the ore is treated with lime, cyanide and oxygen. Clear thickener overflow water returns to the process water tank for distribution, primarily to the grinding circuit for water addition.
17.2.4 Leach and Carbon-in-Pulp
During Step 1, the thickener underflow slurry is pumped to five agitated 3,300 m3 leach tanks with 90 kW dual impeller agitators in series and leached with cyanide under alkaline conditions to dissolve the gold present in the thickened slurry. Overall leach residence time is currently around 27 hours depending on throughput. Approximately 40% gold will be recovered in the gravity circuit while the leach/CIP circuit will recover 94% of the remaining gold. This results in an overall gold recovery from gravity and leach / CIP circuits of approximately 96%.
Vaporized liquid oxygen is added to the first three CIL tanks to improve leach kinetics. Slaked lime slurry is added to the leach feed distribution box, as required, to maintain the slurry pH value between 10.5 - 11.0. Cyanide solution is also added to achieve the required cyanide concentration at the first tank of the leach train. Cyanide is added as required throughout the leach process to ensure the free cyanide concentration is maintained at or above 150 milligram per litre (mg/L) throughout the leach circuit.
| | | | | |
Island Gold District – NI 43-101 Technical Report August 6, 2025 | 249
|
At the completion of the Step 2 expansion, the existing #1 leach tank will be converted to a pre-oxidation tank where only oxygen will be added prior to cyanidation. This will help condition the slurry prior to leaching, improving leach kinetics and reducing cyanide consumption. Leach feed slurry from this tank is split to feed both the existing Step 1 leach circuit and the Step 2 expansion circuit. This is achieved by pumping two thirds of the feed using a variable speed 200 mm x 150 mm slurry pump to the Step 2 expansion leach feed distribution box while the remaining slurry will gravitate through each of the four existing leach tanks. Total residence time between the two streams is expected to be 48 hours.
There will be two Kemix Pumpcell carousel CIP circuits. The existing Step 1 circuit uses a 7 x 150 m3 Kemix Pumpcell carousel while the Step 2 expansion circuit will be an 8 x 150 m3 Kemix Pumpcell carousel circuit. In a carousel circuit, carbon is not transferred from tank to tank like a traditional CIP circuit, rather the feed is progressively moved through a distribution launder. The distribution launder, consisting of valves and piping, is sequenced to adjust the feed leach slurry to the appropriate lead Pumpcell. The remaining valving in the distributor is configured to have slurry flow through the six other Pumpcells in a predetermined order. The lead Pumpcell is taken offline once the carbon is fully loaded and the slurry feed is redirected to the next cell in-line. The loaded carbon transfer pump moves the loaded carbon to the elution circuit acid wash column via the loaded carbon screen and is forwarded to the stripping circuit. This process is repeated daily keeping the sequencing in order and ensuring the maximum loaded carbon is transferred to the elution circuit and barren or fresh carbon is returned to the last tank in the sequence.
Each Pumpcell has a single inter-stage screen / agitator to retain carbon particles in the tank and to allow discharge of slurry to the next tank. The carousel provides approximately 1.1 hours of total retention time for gold adsorption. The slurry tailings stream from the carousel circuit flows by gravity to the carbon safety screen to capture any carbon particles that may have escaped from the final Pumpcell before transfer to the cyanide detoxification circuit. Captured carbon particles are collected in bins and refined offsite, depending on the contained gold value. Safety screen undersize is collected in the CIP tailings pump box where the CIP tailings pump transfers the slurry to the cyanide detox feed box.
17.2.5 Acid Wash and Elution
In the existing AARL circuit, loaded carbon slurry is pumped to the loaded carbon recovery screen which is in the elution area above the acid wash vessel. Slurry containing loaded carbon is washed on the loaded carbon recovery screen with the loaded carbon reporting to the 4 t acid wash column. Screen undersize is collected in the loaded carbon screen undersize pump box where the screen undersize pump transfers the slurry back to the CIP carousel feed launder. Loaded carbon is transferred on a batch basis, typically once per day.
17.2.5.1 Existing Acid Wash
Prior to carbon stripping in the elution column, loaded carbon is treated with a 3% hydrochloric acid (HCL) solution to remove calcium, magnesium and other salt deposits that would otherwise render the elution less efficient. Entrained water is drained from the column and the column then refilled with a 3% v/v HCL solution, from the bottom up. Once the column is filled, the carbon is left to soak in the acid for 30 minutes after which the spent acid is rinsed from the carbon and discarded to the tailings pump box. The acid washed carbon is then transferred to the 4 t elution column for carbon stripping utilizing the AARL process.
17.2.5.2 Existing Elution
The AARL elution sequence begins with a pre-soak cycle utilizing 2.5% w/w sodium hydroxide (NaOH) and 2% w/w NaCN solution. Once the prescribed volume has been added, the pre–
| | | | | |
Island Gold District – NI 43-101 Technical Report August 6, 2025 | 250
|
soak period commences. During the pre-soak, the caustic / cyanide solution is circulated through the column and the elution heater until a temperature of 95 °C is achieved. Upon completion of the pre–soak period, elution water is pumped through the heat recovery heat exchanger and elution heater, then through the elution column to the pregnant eluate tank at a rate of two bed volumes per hour. At this stage the temperature of the eluent passing through the column is raised to 120 °C by using a propane fired solution heater. Gold is stripped off the loaded carbon and the eluate flows up and out of the top of the column, passing through the recovery heat exchanger via the elution discharge strainers and to the pregnant eluate tank. Upon completion of the cool down sequence, the carbon is hydraulically transferred to the carbon regeneration kiln feed hopper via a de-watering screen.
In the Step 2 expansion carbon elution will use the modified Pressure-Zadra elution system.
17.2.5.3 Step 2 Acid Wash
In Step 2 loaded, carbon from the CIP circuit will be screened through a loaded carbon screen prior to reporting to a 6 t acid wash vessel. Diluted 3.0% w/v nitric acid will be passed through the carbon in the vessel to remove acid soluble contaminants from the loaded carbon. The carbon will then be rinsed with water. Both the spent acid solution and water will be sent to the tailings pump box and mixed with final tail slurry. The acid-washed and rinsed carbon will then be transferred to the 6 t elution pressure vessel for stripping using the Pressure-Zadra process.
17.2.5.4 Step 2 Elution
The Pressure-Zadra process will use a 1% w/v sodium hydroxide solution and 0.2 %w/v NaCN solution that will be prepared in an elution barren storage tank. This solution will be pre-heated until solution reaches temperature of 95 ºC. This is accomplished by using three electric immersion heaters. The barren elution solution will then be redirected to the bottom of the 6 t pressure vessel which allows the solution to flow upward, fluidizing the loaded carbon and producing good surface contact with the loaded carbon. The temperature and pressure will then be increased to 140 ºC and 350 kilopascal (kPa) at a controlled flowrate through the elution column. The gold pregnant solution will be cooled through a heat exchanger cooling system below a boiling point of 100 °C and flows to a pregnant solution tank for electrowinning.
The stripped carbon will be transferred from the elution column to a static dewatering screen. The dewatered carbon will be collected in a hopper and conveyed by means of a screw feeder to reach a regeneration kiln. The kiln will be used to remove organic contaminants from the carbon before returning it to the CIP circuit.
17.2.6 Electrowinning and Gold Room
Gold is recovered from the pregnant eluate by electrowinning and smelted to produce doré bars for shipment and sale. The pregnant eluate is pumped through two electrowinning cells with stainless steel mesh cathodes. Gold and silver are deposited on the cathodes and the resulting barren solution flows back into the barren solution tank for reuse or is pumped to the CIP circuit. The electrowinning cathodes are washed with a high-pressure washer to dislodge gold sludge from the cathodes. The sludge is filtered by a filter press and the filter cake is dried in a drying oven. The resulting filtrate is pumped back to the barren solution pump box within the refinery. Dried filter cake is then transferred manually into the induction smelting furnace with flux materials where it is batch smelted into doré bars and stored in a secure vault.
Gold recovered from the gravity circuit is dissolved in an ILR producing a pregnant leach solution. This is pumped to a dedicated electrowinning cell, to produce a gold sludge. The sludge is then combined with the sludge from the elution electrowinning cells or may be smelted
| | | | | |
Island Gold District – NI 43-101 Technical Report August 6, 2025 | 251
|
separately for metallurgical accounting purposes. ILR electrowinning barren solution is pumped to the CIP circuit.
The electrowinning and smelting process takes place within a secure and supervised gold room equipped with access control, intruder detection and closed-circuit television equipment.
The existing electrowinning circuit and gold room will be replaced with a newer and larger circuit in the Step 2 expansion circuit to be able to manage the increased metal load.
17.2.7 Carbon Regeneration Circuit
Carbon reactivation in the existing circuit uses a propane fired rotary kiln. Dewatered barren carbon from the stripping circuit is held in the kiln feed hopper. A screw feeder meters the carbon into the reactivation kiln where it is heated to 650 - 750 °C in an atmosphere of superheated steam to restore the activity of the carbon. Carbon discharges from the kiln into a 2 t capacity quench tank filled with water and screened to remove carbon fines. Reactivated carbon is returned to the CIP circuit via the 8 t regenerated carbon tank. To compensate for carbon losses by attrition, new carbon is added to the circuit after attrition in the carbon quench tank and passed over the carbon sizing screen to remove fines.
The Step 2 expansion will utilize an electric rotary kiln with similar process conditions as the existing system.
17.2.8 Cyanide Destruction
Both the existing and Step 2 expansion utilize the conventional SO2/air process for cyanide destruction. The cyanide destruction circuit treats leach residue from the CIL circuits and consists of two agitated detox tanks in series. Air is sparged into the cyanide destruction tanks. Lime (CaO) is added to maintain a pH of 8.5 and copper sulphate (CuSO4) is added as a catalyst. SO2 gas is sparged into the tanks. The process reduces CNWAD levels to <10 mg/L.
Treated slurry from the existing circuit is pumped to the expansion tailings pump box where both streams are combined and pumped to the TMF.
17.2.9 Reagents
The Step 1 and Step 2 expansion process plant will utilize the existing reagents and reagent make up system that will be modified to accommodate the Step 2 expansion.
The following reagent systems are required for the process: CaO, flocculant, NaCN, HCl acid, NaOH, CuSO4, and liquid SO2.
SO2 is delivered as a liquid in bulk tankers and transferred to the bulk storage tank. A vendor supplied vaporizer package is installed near the tankers to convert the liquid to SO2 gas.
Bulk liquid oxygen is delivered in tankers and transferred to a vendor supplied storage tank. A vendor supplied vaporizer package is installed near the tanks to convert the liquid to gaseous oxygen. Oxygen is metered to the leach circuit and cyanide detox circuit.
CuSO4 is delivered in powder form in 1 t bulk bags and stored in the reagent shed. CuSO4 is mixed with raw water to make a 15% solution for plant dosing.
NaOH is bulk delivered in a 36 t tanker as a bulk liquid at 50% concentration. The liquid is transferred to the insulated 42 m3 storage tank located in the mill building. The solution is metered to the elution circuit for stripping and electrowinning processes.
| | | | | |
Island Gold District – NI 43-101 Technical Report August 6, 2025 | 252
|
NaCN is delivered as a 30 % NaCN liquid in 30 t tankers into two 80 m3 storage and distribution tanks. Cyanide is added to the leach feed of each leaching circuit and additional top up points in leach tank #3.
CaO is delivered to site in a 40 t tanker and is pneumatically conveyed from the tanker to the 75 t CaO storage silo. The CaO is extracted from the storage silo via a rotary valve and screw feeder and fed into a slaking Verti-mill, with process water, to make a slurry (milk of lime). Hydrated lime produced by slaking is stored in the distribution storage tank where it is pumped into grinding, leach and detoxification circuits via a ring main, which returns to the storage tank.
Powdered flocculant is delivered to site in 1 t tote bulk bags. A vendor supplied mixing and dosing system is used, which includes a flocculant storage hopper, flocculant screw feeder, flocculant blower, flocculant wetting head, and flocculant mixing tank. Flocculant solution, at 0.5% w/v is aged in the flocculant mixing tank for a pre-set period before transfer to the flocculant storage tank for dosing to the thickeners. Flocculant solution is diluted to 0.05% w/v at the point of use.
HCl acid is delivered in bulk by 30 t tanker trucks and transferred to a bulk storage tank in the acid reagent area of the mill. The storage tank is fitted with a vent and scrubber to capture any vapour emissions. Acid is metered to the elution circuit as required.
Activated carbon is delivered in 500 kg bulk bags. The carbon is introduced into the carbon quench tank where the carbon is conditioned by removing the friable edges of the carbon particles and the adhering carbon dust generated in transport. The slurry is pumped over the sizing / dewatering screen with the coarse carbon particles added to the CIP circuit and the carbon fines discharged to the fine carbon hopper.
17.2.10 Air
Air compressors currently supply plant and instrument air for the mill. This system will be upgraded, and piping rerouted for the additional equipment installed for the Step 2 expansion.
17.2.11 Water
The following water networks exist at the process plant:
•Process water – sourced from the pre-leach thickener overflow;
•Fresh water – sourced from an on-site pond;
•Reclaim water – sourced from the existing primary pond; and
•Gland seal water – reclaimed water from the existing primary pond.
The water networks will be upgraded, and the piping rerouted for new and modified areas required for the Step 2 expansion.
17.3 Metallurgical Accounting
Sample points throughout the plant have been identified to generate composite shift samples from key process streams. Two types of sampling are performed:
1)Metallurgical sampling; and
2)Process control sampling.
| | | | | |
Island Gold District – NI 43-101 Technical Report August 6, 2025 | 253
|
Metallurgical samplers are used to generate shift composite samples that are assayed for plant metallurgical accounting. The following process streams are manually sampled hourly to produce shift composites:
•Primary cyclone overflow;
•ILR pregnant solution; and
•Final tailings.
The sampling of these three streams allows an accurate metal balance for the plant to be completed.
Process control samplers generate samples used to monitor unit processes in the plant. The process control samplers are used to generate shift composite samples on process streams that will provide plant operation performance data.
The following process streams are sampled daily:
•CIL feed;
•CIL tailings;
•Pregnant solution to electrowinning; and
•Barren solution after electrowinning.
The Step 1 Island Gold ore process through the Magino mill is sampled by taking manual belt cuts on the Island Gold crusher product, allowing for the collection of a mill feed head grade sample for cross-checking of the Island Gold ore fed to the Magino mill. This sample will also be utilized to establish the moisture content of the mill feed.
During Step 2 the Island Gold ore will be sampled underground by an automatic sampling system.
Regular monthly surveys of the gold in circuit are conducted to allow a reconciliation of precious metals in the feed compared to doré production.
Water supplied and used in the various areas will continue to be continuously monitored.
Reconciliation of the reagents used over relatively long periods is achieved by delivery receipts and stock takes. On an instantaneous basis, reagent usage rates to unit operations are measured and accumulated using flowmeters.
Solution samples are currently run at Magino utilizing atomic absorption while solids are transported daily to MSA Labs in Timmins. Samples are assayed using the Proton Activation method.
A new assay / metallurgical facility is currently being built at Magino and is scheduled to come online in Q3-2025. It will include sample preparation, fire assay and chemical facilities along with a metallurgical lab. The assay lab will be able to process 400 solid assays per day, consisting primarily of ore control RC drilling pit samples, underground muck samples, and mill processing samples.
| | | | | |
Island Gold District – NI 43-101 Technical Report August 6, 2025 | 254
|
17.4 Plant Consumption
17.4.1 Water
Reclaim water is currently pumped using two of three 112 kW, 5-stage vertical turbine pumps located on a reclaim barge at the TMF. Reclaim water is pumped at a nominal flowrate of 450 cubic metres per hour (m3/h) to a process water tank for distribution throughout the plant. Fresh water makeup currently comes from two submersible sump pumps located at an on-site pond. Both systems will supply sufficient water for Step 1 and Step 2.
17.4.2 Energy
Power is currently supplied by four 5.56 MW compressed natural gas (CNG) Wartsila generators (three operating, one on standby). An additional 44 kV grid power line is currently being installed and is expected to come online in Q3-2025. This will allow the plant to drop 2 – 4 MW from the generator supplied power once this grid power is tied into the plant.
17.4.3 Reagents
Existing reagent storage, mixing and pumping facilities are provided for all reagents for the process plant. Reagents usage for the Step 1 and Step 2 expansion plant is summarized in Table 17-2.
Table 17-2 Reagent Consumption
| | | | | | | | |
| Reagent | Step 1 Unit Consumption kg/t ore | Step 2 Unit Consumption Kg/t ore |
| Quick Lime | 0.93 | 1.90 |
| Sodium Cyanide | 0.56 | 0.14 (with pre-oxidation) |
| Activated Carbon | 0.037 | 0.05 |
| Sodium Hydroxide | 0.12 | 0.15 |
| Flocculant | 0.010 | 0.020 |
| Copper Sulphate | 0.15 | 0.13 |
SO2 | 0.31 | 0.58 |
| Oxygen | 0.31 | 0.81 |
| | | | | |
Island Gold District – NI 43-101 Technical Report August 6, 2025 | 255
|
18 PROJECT INFRASTRUCTURE
The District infrastructure is designed to support the operation of a 2,400 tpd ore Island Gold underground mine, a 10,000 tpd ore Magino open pit mine and 12,400 tpd processing plant, operating on a 24 hour per day, 7 day per week basis. It has been developed for the most economical operation at this production rate. The overall site layout showing the location of the Island Gold and Magino principal infrastructure is provided in Figure 18-1
This section summarizes the principal project infrastructure, excluding the Magino mill complex which is described in Section 17.
18.1 Dubreuilville Infrastructure
18.1.1 Main Administration Building
The main administration building is located in the Town of Dubreuilville. The main administration building houses District management and administrative staff, including Health and Safety, Environmental, Finance, Human Resources, Community Relations, etc.
18.1.2 Camp Facilities
Two dormitory facilities (camps) having a total capacity for 989 people are located in the Town of Dubreuilville. The North Camp is a 511 person facility and the South Camp is a 478 person facility. The two camps are both self-contained with kitchen and dining facilities, laundry, recreation, potable water and sewer. Utility service connections are from the Town and are under a Site Plan Control Agreement with the Town of Dubreuilville. The District also has a limited number of properties in the Town of Dubreuilville, consisting of houses, apartments and bunkhouses.
18.2 Security and Emergency Services
Security offices are located at the entrances to both Island Gold and Magino off of the Goudreau Road, where entrance and exit from the sites are controlled.
Emergency services for the District are as follows:
•In the Town of Dubreuilville, Alamos rents a garage where the District fire truck, water truck and a compressor for recharging mine rescue breathing cylinders are stored;
•Island Gold has a firehall which contains two emergency personnel carriers and a foam fire response unit. Personnel gear for both underground and surface emergencies are stored in this facility;
•Magino has a site ambulance, an emergency response truck and a container with emergency response equipment; and
•Two nurses are on duty during the day at the District, and on emergency call during the evenings.
| | | | | |
Island Gold District – NI 43-101 Technical Report August 6, 2025 | 256
|
Figure 18-1 Island Gold District General Site Layout
Source: Alamos (2025)
| | | | | |
Island Gold District – NI 43-101 Technical Report August 6, 2025 | 257
|
18.3 Access to District
18.3.1 Access Road
Access to the District is via Goudreau Road for transport of crew, supplies, and other transport to and from the site. Vehicles are a combination of buses, personal vehicles (cars, pick-up trucks), tractor-trailers, and armoured vehicles. Goudreau Road is an all-weather road that connects directly to provincial Highway 519, and in turn, the Trans-Canada Highway 17.
18.3.2 Mine Haul and Service Roads
Mine haul roads have been constructed on site for transporting ore and waste from the pit to their designated destinations. Mine haul roads are constructed to accommodate 139 t trucks carrying ore from the pit to the primary crusher and stockpile, and waste to the MRMF, SWRF and TMF as well as to pertinent mine facilities (truck shop, truck wash, fuel farm, etc.).
An additional haul road was constructed in 2025 to connect Island Gold to the Magino mill to allow the transport of ore via 40 t articulated dump trucks, as well as various pipelines for tailings and water movement between the mine sites. This haul road connects to the existing haul road that exists connecting the shaft site to other facilities at Island Gold, including the waste rock storage site and the Island Gold mill crusher.
Various service roads exist to manage light vehicle traffic flowing within the District and as required for inspection and maintenance of site facilities.
18.3.3 Wawa Airport
Alamos currently operates charter flights for non-local staff from Toronto, Rouyn-Noranda, Sudbury and Thunder Bay. Charter flights land at the Wawa airport and personnel are bused to site.
Alamos is contemplating the construction of an airstrip on-site to improve transportation time for select non-local personnel by eliminating ground transport from Wawa to site. In addition, due to the complication or near-lake climate condition disruptions at the Wawa airport, a site airstrip could improve the ability of flights to arrive and depart as scheduled. A study is planned, and it is recommended that this study be completed during 2025.
18.4 Principal Mine & Maintenance Operation Facilities
In general, separate mine & maintenance operational facilities exist for Island Gold and Magino due to the different mining methods employed and distance between operations.
18.4.1 Island Gold
The principal mine and maintenance facilities for Island Gold include the underground portal, shaft complex, shaft and shaft stations, ore / waste handling system, paste plant, compressed air plant, ventilation systems and maintenance facilities.
18.4.1.1 Underground Portal
Island Gold is currently accessed only via a singular portal (Main Portal) and decline (pending completion of the Phase 3+ Expansion shaft complex and shaft). The Kremzar Portal which is detached from the current underground mine, accesses old mine workings and is utilized to
| | | | | |
Island Gold District – NI 43-101 Technical Report August 6, 2025 | 258
|
access the bottom of the surface ore bins which are used to feed the crusher section of the Island Gold mill.
18.4.1.2 Shaft Complex
The shaft complex is currently under construction and scheduled for completion in the H2-2026. The site when completed will house the required infrastructure to support operations and maintenance of the shaft, an ore and waste handling system as well as basic infrastructure to support a dry and administrative office complex. Figure 18-2 displays the planned general arrangement, which also outlines location of the hoist house with respect to the shaft and collar house
The shaft complex includes the following facilities:
•The hoist house & hoist drive cooling building;
•Headframe with bin house and collar house;
•Substation and electrical supply;
•Ventilation plenum, fans and heaters;
•Administration and dry building;
•Warehouse, and
•Water handling and treatment facilities for the dry and fire water
Figure 18-2 Shaft Site General Arrangement
Source: Alamos (2025)
The shaft complex is composed of the headframe, hoist house and collar house. The hoist house is composed of an insulated pre engineered building and will house the two hoists (one production and one service hoist). An electrical house south of the hoist house not only feeds the shaft complex, but also is the main underground feed for the deep portion of the mine,
| | | | | |
Island Gold District – NI 43-101 Technical Report August 6, 2025 | 259
|
complementing the already existing electrical system underground. The production hoist will be centered square to the shaft whilst the service hoist will be flanked. The hoisting/conveyance system is designed for 2000 m in depth operating at 3,500 tpd (ore and waste). At the currently planned loading pocket at 1350L, it will have a 5,500 tpd operating capacity, more than enough to withstand peak mining rates. The service hoist will allow all underground mine personnel to access the underground workings in under 30 minutes, greatly increasing underground productivity when compared to the current ramp access system. The shaft will house two 15.5 t skips in dedicated compartments for ore and waste movement, along with a double deck service cage for the transport of personnel and materials.
The steel headframe has been erected to 65 m in height and is insulated. It has two sheave deck levels to serve the production and service hoists, as well as the sinking winches with one set of rear structural supports. The service hoist sheave deck is located at 46 m in elevation while the production hoist sheave deck is located at 57 m in elevation. Figure 18-3 displays an isometric view of the headframe and hoist.
Figure 18-3 Headframe and Hoisting Plant Isometric View
Source: Hatch (2022)
The concrete shaft sub collar will be primarily used for routing services in and out of the shaft, as well as for the ventilation plenum. The collar house has been constructed with metal cladding and will be insulated. It will be located on the cage side of the shaft and will be the primary access point for personnel and material.
| | | | | |
Island Gold District – NI 43-101 Technical Report August 6, 2025 | 260
|
18.4.1.3 Shaft and Shaft Stations
The shaft layout is shown in Figure 18-4. The shaft will be concrete lined, measuring 5 m internal finished diameter. The shaft size has been determined based on several parameters including ore and waste production requirements, intake ventilation, installed permanent services, service hoisting and constructability during shaft sinking.
Figure 18-4 Production Configuration Shaft Cross Section
Source: Hatch (2022)
The shaft will have four shaft stations (840L, 1050L, 1265L and 1350L). The loading pocket is on 1350L, which connects to the main ramp and access ramp to the shaft bottom on 1380L. Each shaft station (except 1350L) will be utilized to access the main mine horizons and coincide with the main exploration drifts underground. Figure 18-5 displays a shaft riser diagram.
All shaft stations will have an electrical substation as well as other main mine services. The 1265L shaft station will also have a slickline discharge station, to be used for construction of the crusher and loading pocket infrastructure, and future transport of wet shotcrete.
The initial sinking depth has been set at 1,380 m from the collar, with the loading pocket set at the 1350L. It is important to note that Island Gold is not limited to this initial sinking depth and has the option of extending the shaft bottom to as deep as 2,000 m, with the possibility of repositioning the loading pocket/bin arrangement to a deeper level, should the orebody prove out at depth (beyond the 1,500 m elevation).
| | | | | |
Island Gold District – NI 43-101 Technical Report August 6, 2025 | 261
|
Figure 18-5 Shaft Riser Diagram
Source: Alamos (2025)
| | | | | |
Island Gold District – NI 43-101 Technical Report August 6, 2025 | 262
|
18.4.1.4 Ore & Waste Handling System
The underground ore and waste handling system is designed to accommodate the mine plan’s 2,400 tpd of ore and an additional 1,100 tpd of waste for any future mine expansion.
Those numbers are based on the mine plan, not ore and waste handling infrastructure capacity, which is in line with the shaft hoisting capacity (5,500 tpd from the current 1350L loading pocket and 3,500 tpd from design criteria shaft depth of 2,000 m, should expansion be required in the future resulting from successful exploration and Mineral Resource conversion. The system will have a truck dump with rock breaker for ore on 840L, a truck dump with rock breaker for ore on 1050L, and truck dumps with rock breakers for ore and waste on 1265L. Those ore passes will arrive at a primary jaw crusher on 1265L. The crusher will discharge to a fine ore bin which feeds the loading pocket on 1350L. All waste reports to a bin which in turn feeds the 1350L loading pocket. All ore and waste passes will have grizzlies with 400mm x 400mm openings.
The loading pocket will be a conventional design with vibratory feeders and a conveyor feeding measuring flasks and is shown in Figure 18-6. The conveyor will discharge to a transfer car to alternatively divert material to one of two measuring flasks, which also weigh the payload. Each measuring box discharges into the parked skip in the shaft via dedicated discharge gates and arc gate controls. The skips will be stabilized using the levelock system.
Figure 18-6 1265 Level Rock Breaker Station – Section View
Source: Alamos (2025)
An isometric view of the ore and waste handling system is shown in Figure 18-7.
| | | | | |
Island Gold District – NI 43-101 Technical Report August 6, 2025 | 263
|
Figure 18-7 Underground Ore and Waste Handling System Isometric
Source: Alamos (2025)
| | | | | |
Island Gold District – NI 43-101 Technical Report August 6, 2025 | 264
|
18.4.1.5 Paste Backfill Plant
The paste plant is part of the Phase 3+ Expansion and is currently under construction with completion scheduled in Q4-2025 and commissioning schedule for Q1-2026.
Paste backfill is required for the mine expansion and increased mining rate. CIL tailings from the Magino mill will be dewatered and mixed with cement and binders to produce a paste in the paste plant that will be located between the Magino mill and Island Gold shaft sites. Paste will be pumped to the stopes via a new underground distribution system (UDS).
The past plant is located near the northwest corner of the new haul road intersection at Goudreau Road as shown in Figure 18-8.
Figure 18-8 Paste Plant Location
Source: Alamos (2025)
The key elements for selecting this site included the proximity to an existing electrical supply, the surface paste boreholes will be directly adjacent to the paste plant, ease of access for cement and binder supply trucks, and suitable ground conditions (geotechnical) for construction. The plant is under construction and is expected to be ready to commission in Q1-2026.
The paste plant has been designed to utilize the full instantaneous nominal tailings available at 2,400 tpd with a maximum instantaneous throughput of 2,600 tpd. This equates to a flow rate range of 70 to 90 m3/h using whole tailings after year 2026. The design availability of the paste plant is 92% and is expected to have a maximum utilization of 60%.
| | | | | |
Island Gold District – NI 43-101 Technical Report August 6, 2025 | 265
|
Treated CIL slurry tailings from the paste plant feed pump box to be located in the existing Magino mill will be pumped to an agitated paste plant feed tank located at the paste plant via an overland pipeline. The slurry tailings will then be pumped to the thickener feed box before thickening in an 18 m diameter high-rate thickener.
Thickener underflow will be pumped to the filter feed tank at approximately 60% solids and then pumped to the conventional vacuum disc filters for further dewatering. Thickener overflow will flow by gravity to a process water tank at the paste plant.
There will be a vacuum disc filter at the paste plant. The vacuum disc filter will further dewater the thickened slurry tailings to produce a filter cake with a maximum moisture content of 25.5% moisture by weight. The filter cake will then be conveyed to a continuous paste mixer and the filtrate will be pumped to the tailings thickener feed box.
Cement and binder from the binder silo will be added together with process water and the filter cake in the paste mixer at predetermined recipes based on requirements for the underground mine. Paste is then discharged to the paste hopper. A positive displacement paste pump is provided to pump the paste underground via the UDS. A gravity system is provided as a backup to the paste pump.
A dust collector will be provided at the paste mixer to collect any dust that will be reused in the process.
The paste plant will include two 600 t silos for the binder and a flocculant mix and storage facility.
Excess process water and any used slurry tailings from the paste plant will be collected in an agitated return tank and then be pumped back to the Magino mill via an overland pipeline.
Process water, gland seal water and potable water systems will be provided at the new paste plant. A dedicated air compressor system will be provided for plant air users and instrument air.
To ensure paste quality and strengths are consistent and meet the required strength targets, quality assurance and control functions will include periodic slump, filter cake moisture content and UCS cylinders testing at set intervals.
A general arrangement drawing of the paste plant is provided in Figure 18-9 for reference.
A preliminary UDS has been designed to accommodate future mining needs (see Figure 18-10).
The paste will flow through the UDS piping network at a flow rate dependent on the paste plant production rate. The UDS design will include pressure instrumentation throughout the pipeline to allow for real-time monitoring and observation of the pour behaviour and for troubleshooting in the case of upsets. Cameras will be provided for monitoring the pour discharge at the stope and other key locations. Emergency dump clean-out tees will be provided at critical locations, which allow for remote pressure release of the pipeline in the case of blockage. Manual valves near the discharge to the stopes will be used to divert water during a flush for small stopes. Rupture disks will be provided at the base of every borehole to prevent over pressurizing the pipeline.
Paste backfill will be pumped underground from boreholes drilled adjacent to the paste plant with an angle of approximately 60° from horizontal. Provisions have been made for a total of four surface boreholes (initial one duty and one stand-by, with provision for an additional two if required in the future). Two holes have been drilled, and geotechnical liners have been installed and grouted. The holes will be lined with hard-faced steel pipe prior to commissioning.
| | | | | |
Island Gold District – NI 43-101 Technical Report August 6, 2025 | 266
|
Figure 18-9 Paste Plant General Arrangement Overview
Source: Patterson & Cooke (2025)
Figure 18-10 Underground Distribution System (Long Section View)
Source: Alamos (2025)
Additionally, if the paste pump fails, the system can resume operations in a limited capacity as a gravity-fed system only as an emergency back-up while the paste pump is being serviced.
| | | | | |
Island Gold District – NI 43-101 Technical Report August 6, 2025 | 267
|
The surface boreholes will breakthrough into a dedicated paste fill cut-out within a new development located approximately 430 m from the existing underground drift on the 340L. From there, paste fill piping will be routed into the new mining areas, with multiple boreholes that will be drilled at an approximate 60 - 70° angle from horizontal. This angular range allows the paste to slide down the footwall of the hole and absorbs some of the energy while avoiding a free fall drop that may be common with vertical holes. Free falling ‘batches’ of paste tend to act as a piston and compress the air ahead which creates a pressurized local area that can lead to blowback, drying out, and potentially segregation of the paste.
The boreholes will branch off main levels (340L, 620L, 840L and 1090L) to the required filling areas. Mining and paste filling will advance from multiple ramps, resulting in several borehole systems running through different areas of the same levels.
Underground, distribution of the paste to the various working areas will be via inter-level boreholes and manual switchovers from the main trunk lines to the stope piping. Automated diverter valves will be added in areas where frequent pipe route changes are required, to reduce labour and time requirements. The pipeline routes and deposition points analysed are as shown in Figure 18-10.
18.4.1.6 Compressed Air Plant
Island Gold’s underground mine operations are serviced via one surface compressed air plant. The plant is located adjacent to the portal and is composed of a series of 200, 300 and 600 horsepower (hp) compressors totalling 2,100 hp and produces approximately 9,920 cfm of compressed air flow. One backup diesel unit provides 1,600 cfm in case of emergency. Underground workings are fed via one 8” air line down the ramp, stepping down to 6” lines to deliver air to the mine’s auxiliary levels. The shaft is also supplied with a packaged three-compressor skid used for shaft sinking, which will remain as auxiliary supply for the permanent configuration.
18.4.1.7 Ventilation System
The current underground mine ventilation is via two surface fresh air fans and raises located adjacent to Goudreau Road, approximately 2.5 km away from the main site along with two exhaust raises located across from the fresh air fans.
The current primary ventilation system consists of a push-pull type system served with two fresh air raises (FARs). FAR #1 currently supplies approximately 140,000 cubic feet per minute (cfm) while FAR #2 supplies approximately 350,000 cfm, totalling 490,000 cfm. Return air raise (RAR) #2, RAR #3 and the main underground portal serve as the main exhaust routes for the return air. Table 18-1 provides a summary of the surface fan arrangement at Island Gold.
Table 18-1 Key Surface Ventilation Fans Data
| | | | | | | | | | | | | | |
| Item | RAR #2 | RAR #3 | FAR #2 | FAR #1 |
| Fan Type | Axial | Axial | Centrifugal | Axial |
| Fan Arrangement | Single | Parallel | Parallel | Parallel |
| Fan Location | 125L | 125L | Surface | Surface |
| Number of Fans | 1 | 2 | 2 | 2 |
| Total Horsepower | 800 HP | 1,600 HP | 2,400 HP | 400 HP |
| Variable Frequency Drive | No | No | Yes | Yes |
| | | | | |
Island Gold District – NI 43-101 Technical Report August 6, 2025 | 268
|
Propane powered mine air heaters are located on both surface fresh air fans. FAR #1 has a 30 million British thermal unit (MBTU) heater while FAR #2 has a 20 MBTU heater which serves to heat the air to 7 °C during the winter months
At the shaft, a plenum has been constructed which will direct the air into the shaft in the sub-collar. Two axial fans in parallel will be used to supply approximately 540,000 cfm to the bottom of the shaft. A series of airlock doors and booster fans will be installed at each shaft station to direct the fresh air from the shaft to active mine workings.
Once the shaft is fully commissioned FAR #2 will be converted into an exhaust raise and the ventilation system will become a primarily pull system with the RAR #2 and RAR #3 fans located at 125L and the modified FAR #2 exhaust fans exhausting air from the mine with fresh air provided via FAR #1, the existing main portal and completed shaft. The ventilation system is expected to provide approximately 1M cfm of fresh air to the mine with the main portal supplying the upper workings and west zones while the shaft provides fresh air to the lower mine and eastern sections of the mine.
Propane powered mine air heaters will be installed at the main portal and shaft to heat the air during winter months, in addition to that already installed at FAR #1.
18.4.1.8 Automation, Communications and Control
The primary means of communication underground is via a 16-channel leaky feeder system. Femco lines are also installed in every refuge station as a secondary communication system. Island Gold is currently in the process of installing long-term evolution (LTE) underground to increase wireless data capacity and coverage. On surface, leaky feeder, phone lines and voice over internet protocol (VoIP) are utilized.
Island Gold has a fibre-optic network installed underground (and on surface) servicing the main ramps, underground infrastructure and microseismic system. This system also serves as the backbone for the ventilation on demand network. The blasting system is also routed via the fiber network with the leaky feeder network as backup.
Island Gold also has a comprehensive microseismic system installed throughout its underground workings. This allows for continuous monitoring of microseismic activity underground, and the implementation of re-entry protocols based on seismicity intensity induced by underground mining activities, particularly following blasts.
A central control room exists at the Kremzar site, where all communication and automation reports. The central control room is used as the heart of the operation through which all information flows. This allows for the optimization of traffic flow, monitoring of microseismic activity, monitoring the ventilation on demand system as well as to relay key information to underground workers as required. The central control room will be moved to the shaft complex upon completion of the construction of the facility.
18.4.1.9 Underground Dewatering System
Underground process water is collected in a naturally filling cavity (via groundwater and diamond drillholes) near the 190L and the 735 Extension Ramp. Process water is distributed via pipeline down the ramp to working horizons via gravity, employing pressure reducing valves to control pressure. A process water reserve is employed in the 315L and 630L underground maintenance facility fire suppression systems.
Island Gold employs a dirty water dewatering system. Water is collected in level sumps on each operating level where coarse sediments are allowed to settle. Water cascades down level
| | | | | |
Island Gold District – NI 43-101 Technical Report August 6, 2025 | 269
|
sumps, via boreholes or pumps, until it reaches an intermediate dewatering pump station, at which point all water is pumped via the ramp or boreholes to the main dewatering pump stations, located on the 740L West, 425L and the 125L. The main pump stations pump the water directly to either the primary or secondary pond on surface depending on pond status and water quality. On average, Island Gold dewaters approximately 1,200 m3/day from the underground workings.
Island Gold is currently designing and implementing a new main dewatering station in the deep portion of the mine to sustain its operations at depth. This system will employ a series of pump stations to allow pumping of water to surface.
18.4.1.10 Fuel Storage
Principal fuel tanks are located at the Island Gold warehouse as well as at the shaft complex installations. At the Island Gold warehouse, an 80,000 litre (L) dyed diesel tank exists and at the shaft complex a 66,000 L dyed diesel tank is located in addition to a 13,000 L regular gasoline tank.
At the entrance to site at the security installations, light vehicle fuel storage tanks consisting of a 13,000 L regular gasoline and an 8,850 L clear diesel tank are located.
Smaller, miscellaneous storage tanks are located around the property.
18.4.1.11 Explosives Storage
The Island Gold explosive storage facility consists of a main explosives and detonator magazine located underground near the 840L shaft station. Smaller storage magazines in each of the main mining zones (West, IG Ramp and East Ramp) are supplied from the principal magazine as required.
No surface explosives storage magazine exists for the Island Gold underground. Received explosives from the supplier are directly stored underground.
18.4.1.12 Miscellaneous Underground Infrastructure
There are currently two underground workshops, one located on the 315L, and one located on the 620L. The 315L workshop provides basic mechanical services to Island Gold’s primary production fleet as well as secondary vehicles. The 620L workshop is substantially larger and allows Island Gold to perform major mechanical work underground, not having to bring equipment to surface or offsite. The 620L workshop is composed of two mechanical bays, a welding bay, a warehouse, a waste bin, hose bay, tire bay and a wash bay. Construction of a third workshop is planned in the vicinity of the 1265L shaft station to allow equipment to be serviced closer to the active mine workings as mining progresses deeper. It is expected that this shop will be constructed after the shaft is fully commissioned.
Two underground cement plants exit, one on the 580L and the other on the 720L which provide cement to produce cemented rockfill. Both plants were designed to facilitate the movement of cement and truck traffic on the level. Trucks pull onto the level loaded with waste and get backfilled with slurry, to then haul the cemented rock fill to the backfill site. It is expected these plants will be decommissioned once the permanent paste plant is commissioned.
18.4.1.13 Principal Offices and Buildings
With the ceasing of processing activities at Island Gold due to the transfer of these activities to Magino mill, there is a re-organisation of principal offices planned.
| | | | | |
Island Gold District – NI 43-101 Technical Report August 6, 2025 | 270
|
Mine operations, Technical Services and Maintenance Department offices will be located at the Shaft Complex when completed, which will include rooms for training / meetings and a dry facility. A reduced quantity of personnel will be based out of offices located near the main portal.
Warehousing will remain near the entrance of the Island Gold property.
18.4.2 Magino
The principal mine and maintenance facilities for Magino include the truck shop, truck wash, fuel bay and explosives storage and mixing facilities.
18.4.2.1 Truck Shop and Truck Wash
A truck shop, shown in Figure 18-11, has commenced construction to the east of the Magino mill to service the mine mobile equipment fleet, with completion expected in Q2-2026.
Figure 18-11 Truck Shop
Source: Alamos (2025)
The shop will include four main drive through bays, each bay being two workspaces long. The shop will service the main haul truck fleet, as well as service equipment and light vehicles. The shop will also include warehouse space, as well as office space for the Mine Operations, Technical Services and Mobile Maintenance Departments, training space, and a dry.
Separate from, and adjacent to the shop, will be a wash bay, which consists of a building, and a pre-engineered equipment wash system package.
| | | | | |
Island Gold District – NI 43-101 Technical Report August 6, 2025 | 271
|
18.4.2.2 Fuel Storage
The mine operations fuel bay is located north of the open pit adjacent to the haul road. The fuel bay consists of three 68,870 L dyed diesel tanks and one 25,000 L clear diesel tank. All tanks have double-wall construction. The total dyed diesel storage capacity of 206,610 L will provide mine operations with approximately four days of storage capacity.
18.4.2.3 Explosives Storage
Explosives are currently stored at a temporary surface facility north of the site and meets the storage requirements of Natural Resources Canada. The installation consists of two platforms, one containing four 35,000 kg ISO tanks of unsensitized emulsion product (140,000 kg total) and the other platform consisting of four magazines as follows: one magazine for detonator storage (10,000 units) and three other magazines for packaged product (one x 10,000 kg and two x 2,000 kg). The explosives magazine is managed by the explosive provider.
A new, permanent storage facility location is currently being identified and subsequently designed for construction in 2026.
18.4.2.4 Communications and Control
Current communications on-site are via a Motorola radio system. The system includes two repeaters to ensure comprehensive site coverage and utilizes both digital and analog radios. Wifi calling is also available on site and Mircrosoft Teams phones are being implemented site wide. Two satellite phones are available on site as a contingency communication system should the radio systems be unavailable (one with the nurse on-site and one in the Administration Building in the Town of Dubreuilville).
A review of the current radio system at Magino is underway with plans to transition to an LTE-based system and standardize across the District.
A fleet management system has been installed for the monitoring, control and capture of operating information from the principal mine fleet.
18.4.2.5 Assay Laboratory
A new assay / metallurgical facility is currently being built at Magino adjacent to the process plant and is scheduled to come online in Q3-2025. It will include sample preparation, fire assay and chemical facilities along with a metallurgical lab. The assay lab will be able to process 400 solid assays per day, consisting primarily of geology pit samples and mill processing samples.
18.4.2.6 Principal Offices and Buildings
The Magino mill facility itself contains offices for Process Operations, Metallurgy and Process Maintenance, together with training / meeting rooms and a dry.
As described in Section 18.4.2.1, Mine Operations, Technical Services and Mine Maintenance Department offices will be located within the truck shop when completed in Q2-2026. At present these Departments are staffed in temporary mobile construction trailers combined into modular workspaces.
| | | | | |
Island Gold District – NI 43-101 Technical Report August 6, 2025 | 272
|
18.5 Power Supply
18.5.1 Island Gold
Site power at Island Gold is supplied by API via one 44 kV transmission line. Two 44 kV / 4160 V transformers (7.5 megavolt amperes (MVA) each) are located at the main portal and mill complex, respectively. One 44 kV / 13.8 kV (10 MVA) skid transformer with an off-line spare is located off the main site not far from the surface fans.
The main portal transformer feeds the compressor room, FAR #1 fans and two underground feeders. The two underground feeders are 3C 4/0 American Wire Gauge (AWG), 5 kV and feed the upper portion of the mine down to the 620L and the new east ramp descending from 340L. The compressed air is backed up by a diesel compressor in the event of a power loss.
The mill transformer feeds the Island Gold mill, surface shops, warehouse, water treatment plant, dry complexes, fire hall, tailings pond, core shack and office complex. A portion of the mill (critical equipment) and the surface buildings are backed up with a 600 V, 1 MW diesel generator.
The 13.8 kV skid transformer feeds the FAR #2 fans and one 3C 350MCM, 15 kV underground feeder that descends down a borehole to the 620L where it is distributed to the bottom portion of the mine.
A new 44 kV / 15 kV substation, as well as a pole line tying into the API supply, has been installed and commissioned at the shaft complex. The substation provides power to the surface infrastructure on the shaft site, as well as underground to the deeper portion of the mine.
An emergency diesel generator has been installed at the shaft complex to supply power to the service hoist for emergency back up power, should it be required.
18.5.2 Magino
Power for the site is operated with an on-site natural gas fueled power generating plant. CNG is trucked to site under a supply contract. The Magino connected load is approximately 22 MW, with an average operating demand of approximately 15 MW. The power plant generates 100% of Magino’s present requirements.
Each of four engine/generator units in the power plant generates 5.56 MW of electricity at 13.8 kV for a total of 22.2 MW. The generating units are housed in a pre-engineered metal building with the necessary heating and ventilation units, sufficient maintenance/service area and an overhead crane. Each unit has an exhaust stack and silencer located adjacent to the building plus an engine coolant heat exchanger. A small control room and the required electrical switch gear are in a prefabricated electrical room located adjacent to the engine building. The plant has been designed such that one engine/generator unit is held in hot standby reserve with the other three units online.
A 13.8 kV overhead line from the power plant terminates at the primary electrical room near the process plant. Electrical service to the process plant and site distribution system are from the electrical room.
The power from the 13.8 kV switchgear in the process plant electrical room is distributed throughout the plant site to electrical rooms located at the process plant, refinery and reagent areas utilizing underground conduits and cables. The secondary power distribution consists of 13.8 kV to 4160 V transformers and 13.8 kV to 600 V transformers as required. A 13.8 kV overhead power line system is fed from the electrical room.
| | | | | |
Island Gold District – NI 43-101 Technical Report August 6, 2025 | 273
|
The electrical loads away from the process building area are supplied by a 13.8 kV overhead line using wooden poles and structures. The overhead lines provide service to the following areas:
•Primary crusher area;
•Secondary crusher area; and
•TMF area seepage and reclaim pumps.
A 2 MW diesel generator is connected to the site power distribution system at the primary electrical room to supply emergency power to the site. Power distribution from the back-up generator is controlled from the process control room. Utilizing the process control system, the plant operator can monitor the load on the generator and select which motors in the plant are to be run.
18.5.3 Island Gold and Magino Sites Power Integration
Projects are underway to connect Magino to the 44 kV API power system, including a 44 kV overhead line to connect Magino into the API demarcation point and a rearrangement of loads on Magino’s 13.8 kV switchgear. This will allow for 2 – 4 MW to be fed off API. API / IESO / Hydro One are presently studying the possibility of paralleling the Magino natural gas generators with the grid; this will serve as a contingency plan to power the combined Magino / Island Gold loads.
Further integration between the Island Gold and Magino power systems will occur when the 115 kV project (stations + transmission line) is fully completed.
The new 115 kV transmission line will be constructed from the Hollingsworth Station tap point, located approximately 23 km east of the community of Wawa. The tap point will feed a 115 kV switching station located within 1.5 km of the Hollingworth Station. The 115 kV overhead transmission line will run from the new switching station for 43 km to a new 115 kV/44 kV 2 x 85 MVA substation located near the Island Gold existing 44 kV shaft substation. The 115 kV transmission line project will supply a 47 MW load increase at the District.
The 115:44 kV substation will have two dedicated feeders – one to feed the Phase 3+ Expansion shaft site, and another that will feed the paste plant and all present and future expansion loads at Magino via a 44 kV overhead line that runs along the north haul road between the Island Gold and Magino sites. This overhead line will tie into a newly constructed 40 MVA 44:13.8 kV substation at Magino located nearby to the existing 13.8 kV electrical room.
It is expected that the Island Gold underground / portal / mill substations and voltage regulating plant will remain fed by the API 44 kV network once the 115 kV project has been completed.
Figure 18-12 is a graphic for the current power supply, as well as future expansions to the system which includes all 44 kV and 115 kV system upgrades for the Island District.
| | | | | |
Island Gold District – NI 43-101 Technical Report August 6, 2025 | 274
|
Figure 18-12 Current and Future Power Supply
Source: Alamos (2025)
18.6 Water Supply
18.6.1.1 Island Gold
Island Gold is supplied water from several sources: One, is a pumphouse which draws from Goudreau Lake and feeds the shaft site at a permitted rate of 100 m3/day; a second source for operations is recycled water from the secondary treatment pond, and seepage through historical mine workings. Island Gold also uses water from Maskinonge Lake for the Island Gold mill and surface facilities.
18.6.1.2 Magino
Fresh water for the plant and potable water for the facilities will be required on an ongoing basis during operations. Fresh makeup water requirements (fresh water that is required in addition to the recycled water from the TMF and Water Quality Control Pond (WCQP)) are estimated to be approximately 1,680 m³/day during early operations. As the pit expands, more recycled water will become available and the need for makeup water will reduce. This fresh make-up water will be obtained by pumping from an on-site pond. A relatively small quantity of potable water amounting for approximately 25 m3/day is required for the mine, and the process plant. This supply is obtained from local lakes and/or groundwater wells in the District area and is filtered and treated as necessary before use.
18.6.2 Mine Water Treatment
During operations, the primary objectives are to control the suspended sediments from active areas, but also to collect seepage from the Island Gold and Magino TMF and MRMF that may contain elevated levels of dissolved solids, metals, and potentially processing chemicals.
Water impacted by mining activities can contain elevated levels of suspended solids and dissolved metals and salts, as well as nitrates and ammonia associated with blasting activities.
| | | | | |
Island Gold District – NI 43-101 Technical Report August 6, 2025 | 275
|
If necessary, the water will be treated by a biological or physical/chemical treatment plant. The standards to be applied to site discharge will meet Metal and Diamond Mining Effluent Regulations (MDMER) and the requirements of the provincial Environmental Compliance Approval. Ambient water quality standards (as per the Canadian Council of Ministers of the Environment (CCME) or Provincial Water Quality Objectives (PWQO)) and site-specific water quality objectives, or background concentrations will also be met in the receiving streams and lakes.
18.6.2.1 Water Treatment – Island Gold
Water treatment is managed through natural degradation in the primary pond and secondary pond. Natural degradation is primarily active during ice-free periods, and batch discharge cycles are timed to accommodate the natural processes. Cycle duration is typically 40 days:
•10 days transfer from the primary pond to the secondary pond;
•20 days of final polishing at the secondary pond, and
•10 days discharge of treated water from the Secondary Pond to the receiving environment in a series of streams, wetlands, and ponds, eventually discharging into the central part of Goudreau Lake.
This process can be expedited with the introduction of coagulant and flocculent in the transfer process to reduce total suspended solids and metals. Total cyanide and ammonia naturally break down via sunlight which is enhanced by adding sulphuric acid to control pH levels and thus increasing microbial activity. Based on these processes, the water treatment is known to reduce site-wide water inventory all while meeting water quality limits prior to discharge.
Water quality is routinely monitored in the Primary Pond and Secondary Pond, and in Goudreau Lake at the discharge point and downstream. A comprehensive water monitoring program has been implemented for the site, and includes twelve compliance sampling locations, and effluent limits as mandated by the Ministry of the Environment, Conservation and Parks (MECP). Limits have been established for total suspended solids, total cyanide, copper, nickel, lead, zinc, un-ionized ammonia, oil and grease, arsenic, and pH. Effluent objectives have also been established for iron, phosphorus, total ammonia, and oil and grease (daily). Notwithstanding, Island Gold also conducts sampling and analyses for other parameters of concern, for example: metals, anions, hydrocarbons.
18.6.2.2 Water Treatment – Magino
Surface water runoff and water from the open pit at Magino is captured in various ponds on site, and either pumped or gravity drained through channels downstream to the WQCP. The WQCP allows for the settling of suspended solids. Water is also fed through a natural wetland which removes nutrients and metals. Once water quality meets the permit requirements it is pumped to the environment at Otto Lake.
Water discharge to the environment is limited to ice-free periods of the year, typically starting in April or May and ending on 30 November as per permit conditions.
Water quality is measured at numerous locations on site with a comprehensive set of parameters analyzed for including total suspended solids, cyanide, metals and nutrients.
| | | | | |
Island Gold District – NI 43-101 Technical Report August 6, 2025 | 276
|
18.7 Waste Rock Management
Over the life of mine, a total of approximately 273 Mt of waste rock will be produced requiring surface storage, including 267 Mt from Magino and 6.0 Mt from Island Gold.
Of the total 273 Mt, the waste is classified as follows:
•265 Mt of non-acid generating rock;
•2 Mt of potentially acid generating rock; and
•6 Mt of organics, soils, etc.
18.7.1 Mine Rock Management Facility (MRMF)
The MRMF is a non-acid generating rock storage facility. The MRMF wraps around the TMF to the south, east and north. The MRMF is required to store an additional 201 Mt of non-acid generating waste (including that from Island Gold) during the remaining LOM described in this Report.
The proceeding amounts exclude an estimated 64 Mt of non-acid generating material excavated that will be used for TMF construction purposes.
A small proportion of massive sulphide waste rock (< 1.0% or approximately 2 Mt of all waste mined) is classified as potentially acid generating and will be deposited subaqueous in the TMF.
A small MRMF also exists at Island Gold adjacent to the portal facility and is anticipated to be used for temporary storage of development waste rock being hauled from the portal. All development waste rock hauled to surface is expected to be trucked and disposed of within the Magino MRMF with some material being used for site construction activities given the smaller fragmentation relative to the open pit waste material. It is expected that Island Gold underground operations will generate approximately 7.3 Mt of waste rock with an estimated 1.3 Mt remaining underground as backfill.
18.7.2 Southwest Management Facility (SWMF)
The SWMF is an organics and soils storage facility located to the southwest of the TMF. The SWMF is required to store an additional 6 Mt of organics and soils during the remaining LOM described in this report from the mine, in addition to soils that are required to be removed from the expansion of the MRMF and TMF foundations during expansion.
Material from this facility will be re-handled as required to provide progressive and final closure cover for reclaimed areas of the mines in the District.
18.8 Stockpile Facilities
The LOM plan requires that lower-grade ore be stockpiled during the LOM to permit the preferential treatment of higher-grade ores through the mill to optimize project value. Stockpile capacity reaches a maximum requirement of 26 Mt.
The principal location for the stockpile will be along the eastern side of the MRMF and will form an integral part of the facility. Sequencing of the combined MRMF and stockpile will be such that waste and ore are not mixed, but that the stockpiled ore is deposited on top of the MRMF eastern slope to prevent material mixing.
| | | | | |
Island Gold District – NI 43-101 Technical Report August 6, 2025 | 277
|
Some stockpiling capacity will exist to the south and east of the primary crusher installation to minimize haulage distances.
18.9 Tailings Management Facility (TMF)
18.9.1 Island Gold
The TMF represents the main water retention structures on the mine site. It consists of two ponds: the primary pond and the secondary pond which acts as a polishing pond in addition to water transfer systems via a siphon system. The primary pond (built in the former Miller Lake basin) occupies an area of 109 ha. The secondary pond has an area of 22 ha. The TMF is operated in accordance with ECA No. 5775-CVTHWE which was issued in September 2023, by the MECP.
Tailings slurry is conveyed by a pressurized pipeline from the mill and spigotted around the inside perimeter of the primary pond. The surface of the tailings forms a sloped beach allowing for a pond to form at the lowest part. Water is reclaimed (pumped) from the primary pond to the mill. Both the primary tailings and reclaim pipes are placed in an engineered ditch, with drainage to an emergency catchment section (with an area of 0.8 ha) at its lowest points and reinforced by construction of earthen berms. The TMF also includes seepage collection and pump back systems at dykes #1 and #2 at the primary pond; these were built to prevent any migration of seepage to Maskinonge Lake and the surrounding environment.
The initial TMF was constructed in 1988 under the direct supervision of engineers of Gibson and Associates Inc. The primary pond capacity was increased in 2011 by raising, expanding, and adding additional dams or dykes under the supervision of AMEC Environmental. The capacity of the primary pond of the TMF was further augmented in November 2015 to provide an extra six years of tailings deposition by increasing the height of all existing dykes to an elevation of 424 masl, as well as by adding a new dyke, to accommodate an additional storage capacity of up to 2.5 Mm3. A 3 m tertiary dam raise was undertaken in 2020 to bring the dam to elevation to 427 masl. All five dykes were raised 3 m by the downstream construction method.
The maximum operating water level is 425.5 masl, with the emergency spillway located 0.3 m above at an elevation of 425.8 masl. The minimum operating water level is 417 masl to ensure enough water is present in the pond for reclaiming continuously throughout winter.
The secondary pond was initially constructed in 1988 alongside the primary pond and with Dam A built to capture tailings solution transferred from the primary pond and subsequently discharged as effluent to the environment pending passing water quality. A subsequent raise was done on the secondary pond in 2011 with Dam B and Dam C constructed to an elevation of 399 masl. A spillway was constructed at an elevation of 398.8 masl to convey any water during upset conditions. The minimum operating water level is 396.4 masl while the maximum operating water level is 398.8 masl.
The dams at the primary pond have been designed and constructed using the downstream construction method. The body of the dam consists of engineered granular fill, placed in controlled lifts, and compacted. The embankment consists of a partially zoned construction, consisting of an exterior shell, an upstream membrane, a cut-off below grade, and filter systems.
During Q3-2025 the Island Gold mill will be shut down and correspondingly tailings to the primary pond will cease. At this time the primary pond will be placed into care & maintenance and the focus will be on water management. The site team will determine timing for any progressive rehabilitation and final closure of this TMF.
| | | | | |
Island Gold District – NI 43-101 Technical Report August 6, 2025 | 278
|
18.9.2 Magino
The TMF is located northwest of the open pit. The facility has been designed to meet or exceed the requirements of the Canadian Dam Association (CDA) Dam Safety Guidelines. In accordance with the dam classification methodology presented in the CDA Dam Safety Guidelines, the proposed TMF dam has been classified as having a “High” consequence of failure, based on the potential environmental impact and population at risk. The Ontario Ministry of Natural Resources (MNR) also has a hazard classification system. The TMF is also assigned a “High” hazard classification using the MNR criteria.
The design of the TMF was carried out to exceed minimum allowable factors of safety under static and pseudo-static loading conditions recommended in the current CDA Dam Safety Guidelines. Seepage and stability analyses were carried out as part of the design. Based on the model results, the TMF dam is expected to be stable under the assumed loading and foundation conditions.
The TMF has been designed to a Feasibility Study level of design to contain 150 Mt of tailings (SLR 2017) as well as a reduced capacity of 66 Mt of tailings (SLR 2022), both dependent on the strategy presented in the respective Technical Reports in which they were presented. Currently, the mine plan requires the deposition of 89 Mt of tailings, a quantity between the two Feasibility Study Reports. Alamos is currently updating the TMF construction design requirements for this quantity with the Engineer of Record.
The overall design objective of the TMF is to protect the regional groundwater and surface water resources during both operations and over the long term (after closure), and to achieve effective reclamation upon mine closure.
The TMF will be constructed in stages over the LOM using the downstream raise methodology. Stage 1A and Stage 1B have been completed to-date, with Stage 2 currently under construction. Conceptually, the dam will be constructed through a series of subsequent expansions leading to possibly a Stage 4 – 6, depending on scheduling requirements and working area available to raise the stages.
The TMF embankment is a zoned earth-fill embankment with a maximum upstream slope inclination of 2.5H:1V, a maximum downstream slope inclination of 2H:1V, and a minimum crest width of 10 m with the filter material in place.
The TMF embankment and subsequent expansions will be constructed with engineered fill defined as select waste rock materials. The embankment is being founded on bedrock or an acceptable firm base as defined by a qualified professional observing the stripping of the overburden. Based on observations to date during construction, the overburden thickness has varied from 0 - 8 m within the footprint of the TMF embankment.
The overburden material is being excavated, segregated, and stockpiled. The degree of cleaning of bedrock and additional work that may be needed for the foundation of the TMF is decided during construction and approved by a qualified professional. The embankment will be keyed in as required to existing steep topography at the abutments and the foundation.
The upstream face of the embankment includes a low permeability liner to act as a barrier limiting seepage through the embankment and will reduce the risk of water quality impacts due to tailings water migration. Double-sided, textured 1.5 mm linear low-density polyethylene geomembrane liner is being used as the upstream slope liner material. A filter and drain system are being installed on the upstream slope of the embankment (underneath the geomembrane liner) to prevent release of tailings to the environment in the event of damage to the
| | | | | |
Island Gold District – NI 43-101 Technical Report August 6, 2025 | 279
|
geomembrane and to facilitate drainage of any seepage that may occur through the liner. The filter and drain system will be comprised of (from upstream to downstream):
1)A minimum 0.3 m thick (perpendicular to the face of the embankment) filter material zone (i.e., sand);
2)A minimum 0.5 m thick drain gravel zone; and
3)Free-draining engineered fill.
Tailings will be conveyed as a slurry by pipeline from the mill to spigots positioned around the perimeter of the TMF. Deposition of the tailings along the embankment will push the water pond away from the TMF embankment, providing protection to the geomembrane and filters and facilitating management of the water. The surface of the tailings will form a sloped “beach” allowing for a pond to form at the lowest part. Water will be collected from the tailings pond using barge-mounted pumps and be recycled to the mill.
The solid to liquid ratio in the slurry is designed for the specific characteristics of the ore properties and processing circuit and will be 50 - 55% tailings particles by total slurry weight. The tailings particles/liquid ratio for the tailings slurry is controlled at the process plant.
During operation of the mine, a subsurface drainage system provides capture in pipes and trenches, controlling seepage migration. Subsurface drains will be located around the outer edges of the TMF embankment and in low points beneath the MRMF, with subsurface conveyance beneath the TMF impoundment. The subsurface drainage system will collect infiltration through the TMF embankment and the MRMF. Monitoring of the effectiveness of the subsurface drainage system will be conducted, and adaptive management, as appropriate, will be employed. Captured infiltration will be collected in collection sumps located downstream of the TMF/MRMF embankment and will either be pumped directly to the WQCP or pumped to the surface water drainage structures that gravity flow to the WQCP.
It should be noted that the MRMF will be constructed on the final downstream facing slope of the TMF on the south and east portions of the TMF, providing additional buttress support to the TMF embankment (although not necessary for stability of the TMF embankment itself).
18.9.2.1 Historical Facilities
An historical TMF exists at Magino from previous operations. It has been estimated that historical production was in the range of 0.8 Mt, which is assumed to be the quantity of tailings stored in the historical TMF. This historical TMF is required to be removed to facilitate open pit expansion to the north. Options are being investigated as to whether the historical tailings should be processed through the current Magino mill (if tailings are of sufficient quality) or if they should be directly sent to the Magino TMF for final storage.
18.10 Water Quality Control Pond (WQCP)
The WQCP is located downstream and to the northwest of the TMF and has a footprint area of approximately 30 ha. The facility has been designed to meet or exceed the requirements of the CDA Dam Safety Guidelines. In accordance with the dam classification methodology presented in the CDA Dam Safety Guidelines, the proposed WQCP dams have been classified as having a “Significant” consequence of failure, based on the potential environmental impact and population at risk. The MNR also has a hazard classification system. The WQCP is assigned a “Moderate” hazard classification using the MNR criteria.
| | | | | |
Island Gold District – NI 43-101 Technical Report August 6, 2025 | 280
|
The WQCP has an operational capacity of approximately 1.5 Mm3. There are four embankments for the WQCP: north, northwest, southwest and south. The purpose of the south embankment is to prevent inflow of water from an upstream catchment. These dams are founded on bedrock after the stripping of overburden. The final crest width is 8 m. The dams have a 2.5H:1V upstream slope and 2H:1V downstream slope. An upstream cushion/filter layer of 0.3 m thick is placed on the upstream slopes prior to lining with a 1.5 mm double textured high-density polyethylene geomembrane. The maximum final crest elevation is 385 masl and the maximum embankment height is approximately 20 m.
The south dam is designed with a crest elevation of 386.5 masl and is covered on the upstream (south) face with shotcrete. The south embankment is founded on competent overburden rather than bedrock. The south dam has been constructed with the same side slopes and fill material as the other WQCP dams.
An emergency discharge spillway and run-out channel are provided at the northwest embankment. The spillway is concrete lined and designed to convey the intensity-duration-frequency which is a 1/1,000-year event. The design allows for a minimum freeboard of 1.5 m above the maximum operating water level. The design of the WQCP was carried out to exceed minimum allowable factors of safety under static and pseudo-static loading conditions recommended in the current CDA Dam Safety Guidelines. Seepage and stability analyses were carried out as part of the design. Based on the model results, the dams are expected to be stable under the assumed loading and expected foundation conditions.
| | | | | |
Island Gold District – NI 43-101 Technical Report August 6, 2025 | 281
|
19 MARKET STUDIES AND CONTRACTS
19.1 Market Studies
The principal commodity produced in the District is gold accompanied by silver as a by-product. Both metals are freely traded commodities on the world market for which there is a steady demand from numerous buyers. As such, Alamos has not conducted any formal market studies for this Report.
19.2 Metal Price Assumptions
Alamos sets metal prices for Mineral Resources and Mineral Reserves as well as for economic evaluation purposes through a consideration of historical and current commodity prices, public metal price disclosures of peer mining companies and future consensus pricing developed by analysts and banks.
Historical 3-year gold metal price (2022 through 2024) has ranged from a low of approximately US$ 1,629/oz to a high of US$ 2,778/oz and has averaged US$ 2,044/oz.
Historical 3-year silver metal price (2022 through 2024) has ranged from a low of US$ 17.77/oz to a high of US$ 34.51/oz and has averaged US$ 24.47/oz.
The long-term metal price assumptions and foreign exchange rates used to support the Mineral Resource and Mineral Reserve presented in Section 14 and Section 15 respectively of this Report, as well as the economic evaluation presented in Section 22 are provided in Table 19-1.
Table 19-1 Metal Price and Foreign Exchange Assumptions
| | | | | | | | | | | |
| Gold (US$/oz) | Silver (US$/oz) | US$:C$ |
Mineral Resource | 1,800 | - | 0.750 |
Mineral Reserve | 1,600 | - | 0.750 |
Economic Evaluation 2025 2026 2027 2028+ |
3,000 3,000 3,000 2,400 |
33.00 33.00 33.00 28.00 |
0.725 0.740 0.740 0.750 |
All metal price assumptions are below the current market spot price as of the date of this Report.
19.3 Contracts
19.3.1 Gold Prepayment and Gold Hedges
Upon closing of the acquisition of Argonaut, Alamos inherited Argonaut’s hedge book which included gold forward purchase contracts totaling 329,417 oz between 2024 and 2027. The average forward prices on the contracts ranged between US$1,821 and US$1,860 per ounce (Table 19-2). In July 2024 Alamos closed out all the 2024 and 2025 forward purchase contracts.
To fund the closing out of the hedges, Alamos entered into a gold prepayment agreement. Under the terms of the gold prepayment, Alamos received total consideration of US$116 million
| | | | | |
Island Gold District – NI 43-101 Technical Report August 6, 2025 | 282
|
in exchange for the delivery of 49,384 ounces in 2025, settled monthly, based on average forward curve prices of US$2,524 per ounce.
Table 19-2 Forward Purchase Contracts – Pre and Post Transaction
| | | | | | | | | | | | | | | | | |
| Maturity | Contract | Argonaut Gold Forward Purchase Contracts (Pre-Transaction) | Alamos Gold Forward Purchase Contracts (Post-Transaction) |
| | Volume (oz) | Price (US$/oz) | Volume (oz) | Price (US$/oz) |
| H2-2024 | Forward | 79,417 | 1,860 | - | - |
| 2025 | Forward Pre-Pay | 100,000 - | 1,821 - | - 49,3841 | - - |
| 2026 | Forward | 100,000 | 1,821 | 100,000 | 1,821 |
| 2027 | Forward | 50,000 | 1,821 | 50,000 | 1,821 |
Note: 1 – 24,692 ounces remain to be delivered as of June 30th, 2025
The remaining Argonaut hedge book, inherited by Alamos on the close of the acquisition, consists of forward purchase contracts totaling 150,000 ounces in 2026 and 2027. This is expected to account for less than 12% of total consolidated production over that time frame. Both the gold prepayment and the Argonaut legacy gold hedges are all booked under Alamos and can be either fulfilled through District and / or Young-Davidson production.
19.3.2 Other Contracts
The District consists of two modern operating mines that have a series of supply contracts currently in place related to day-to-day operation, the Phase 3+ Expansion Project at Island Gold, and the expansion of the Magino mill from 10,000 tpd to 12,400 tpd. Currently, the only material contract is as follows:
•On June 17, 2021, the Company entered into a construction contract with Redpath Canada Limited (“Redpath”) pursuant to which Redpath will perform construction and development for shaft sinking and headworks with respect to the Company’s Phase 3+ Expansion Project at Island Gold. The contract value remaining as of the effective date of this Report is approximately $30 million, which amount may be subject to increase due to a variety of factors, including but not limited to equipment supply costs and additional required labour.
Alamos and the District have policies and procedures in place for the letting of contracts. These are awarded based on pricing, supplier competencies and their ability to address where applicable, commitments with respect to Indigenous Communities regarding business, employment, and other opportunities relating to the operation of the District.
19.4 QP Commentary
The QP has reviewed marketing and metal price studies and analyses and is of the opinion that the assumptions stated within Section 19 are acceptable to be used in the estimating of Mineral Resources and Mineral Reserves.
The QP is of the opinion that the contracts for the District are competitive and are within industry norms.
| | | | | |
Island Gold District – NI 43-101 Technical Report August 6, 2025 | 283
|
20 ENVIRONMENTAL STUDIES, PERMITTING, AND SOCIAL OR COMMUNITY IMPACT
From exploration to operations to closure, one of the goals at the District is to safeguard the environment, educate its employees and the communities about the company’s environmental programs and commitments, and apply best management practices to prevent or mitigate any potential environmental impacts.
This section will provide a description of the environmental, permitting, social and community, and sustainability components relating to the District mining operations, and will also cover mine closure and reclamation of the District, including the Island Gold and Magino Mines.
Numerous baseline studies have been completed across the District in the past 10 years as part of the various Island Gold expansion studies as well as the Magino Mine development which included a Federal Environmental Assessment process that was concluded in January 2019. Monitoring programs at both mine sites have been developed over time in collaboration with the numerous Indigenous Communities with whom Alamos has formal agreements.
20.1 Existing Conditions
The District is located within the unorganized Finan Township and Jacobson Township, in the district of Algoma. The site is located approximately 12 km southeast of Dubreuilville via Goudreau Road and 78 km northwest of Wawa via Highway 17 and Highway 519.
The environmental conditions are summarized below.
20.1.1 Past and Current Land Use
The Goudreau area has a history of mining dating back to the discovery of gold in the early 1900s. Several small gold mines and open pit pyrite mines have been active in the area in the past. Between the late 1920s and early 1940s, the area was also subjected to intensive prospecting for gold.
Current land use in the District consists primarily of forestry operations, mining and exploration activities, tourism, and recreation. The District area is occupied and surrounded by historically and periodically harvested forest lands.
Exploration programs have periodically occurred throughout the region’s past to support potential future mining operations.
Recreational activity consists primarily of fishing, hunting, and snowmobiling. A hunting/fishing camp, for summer cottagers, is in the Lochalsh town site, approximately 15 km northeast of the District. Summer cottage homes also exist approximately 8 km west of the District, near the old town of Goudreau.
20.1.2 Topography and Soils
The site is located within a physiographical region described as a bedrock-drift complex. Regional topography is bedrock-controlled and is characterized by a sequence of east-northeast trending rounded hills and ridges. The valleys and low-lying areas between ridges are generally characterized by the presence of interconnected wetlands, streams, and lakes (such as Maskinonge Lake and Goudreau Lake). Site relief is generally low, with low to moderate surface slopes and elevation differentials typically in the range of 5 - 10 m. The site’s
| | | | | |
Island Gold District – NI 43-101 Technical Report August 6, 2025 | 284
|
highest elevations are encountered north of the primary pond area (approximately 490 masl) and the site’s lowest elevation is at Goudreau Lake (approximately 380 masl).
Overburden soils are relatively uniform with types generally being topsoil, sand, and till. These overlay bedrock at greater depths.
20.1.3 Climate
The Wawa region climate is humid continental. Temperature extremes are moderated, and precipitation patterns are altered by its proximity to Lake Superior. The mean annual temperature is about 10 °C, with extremes of -51 °C and 38 °C being recorded. January is the coldest month and July the warmest month.
Precipitation is in the range of 980 mm/y, with about 600 mm as rainfall and evaporation at 517 mm/y principally during the summer months. Peak months for rainfall are August and September, with over 100 mm typically in September. Snow cover generally persists from late October to early May, with 50 – 60 mm (water equivalent) occurring monthly.
20.1.4 Water
20.1.4.1 Island Gold Mine
Island Gold is located within the Maskinonge Lake and Goudreau Lake sub-watersheds (total area of 48.2 km2), approximately 40 km south of the Arctic drainage divide. Both sub-watersheds are part of the Michipicoten - Magpie watershed and Lake Superior Drainage Basin. Surface water drainage at the site is bedrock-controlled, generally flowing from northeast to southwest within the valleys between the elongated hills and ridges.
The Maskinonge Lake catchment covers the northeastern part of Island Gold. Drainage from the northeast part of Island Gold reports to this catchment, including drainage north of the Island Gold mill and the wetland area to the northeast of the primary pond. The water flows in a southerly direction through the upper stretches of Goudreau Creek via meandering stream and wetland, eventually reporting to Bearpaw Lake and, ultimately, to Goudreau Lake. The Goudreau Lake catchment covers the entire site, including both the Island Gold TMF and Maskinonge Lake catchments, and drainage areas to the east of the site. Goudreau Lake outflows to a creek in a southerly direction towards the Michipicoten river and ultimately discharges to Lake Superior.
Water depths in Goudreau Lake vary substantially. A 2019 bathymetry was conducted on Goudreau Lake. Goudreau Lake can be divided into two distinct sections based on its bathymetry; an upstream basin, where depths between 14 - 23 m are observed in deeper pool sections, and a second, much shallower basin, where depths do not exceed 2 m. The second basin is connected to the lake discharge and to the first deeper basin by a narrow and shallow corridor.
Water quality studies have been conducted since 1985, and they show some alteration in water quality in Goudreau Lake because of the impact of two historical mining operations in the area. Historically, sampling at stations upstream of Goudreau Lake (i.e., Maskinonge Lake, Miller Lake and Goudreau Creek) showed lower background levels of pH, conductivity, and alkalinity similar to the Goudreau lake downstream stations. Additionally, the former Magino Mine discharged tailings directly to the west of the upper basin of Goudreau Lake during the middle to late 1930s. Sediments in this portion of the lake are composed of natural sediments and historic tailings. Despite these increased loadings, data has indicated that the water quality in the upper basin of Goudreau Lake is quite good. Historic tailings have been also deposited into Pine Lake from the operations of the Edwards Mine. Drainage from historic abandoned iron
| | | | | |
Island Gold District – NI 43-101 Technical Report August 6, 2025 | 285
|
mines which flows from Teare Lake into Goudreau Lake impacts the downstream portion of Goudreau Lake.
The mine is required to have an on-going water balance model which tracks all inputs and outputs out of the system.
Final treated effluent from the mine flows into the upper portion of Goudreau Lake via Goudreau Creek. Fresh water is taken from Maskinonge Lake, which is then treated via a domestic water treatment plant to provide water for Island Gold and makeup water for processing at the Island Gold mill. Water for Island Gold mill use is reclaimed from the Primary Pond of the Island Gold TMF. Water in the mine is currently reused, any excess is pumped, via a multi-stage pumping system (comprised of sumps/pumps at various levels in the mine) to the Primary Pond on the surface. Underground water from the Lochalsh workings is pumped to either the Primary or Secondary Pond. A visual representation of the site’s hydrologic system site is shown in Figure 20-1.
Figure 20-1 Island Gold Mine Hydrologic System
Source: WSP (2023)
Tailings, water management and final effluent monitoring and quality requirements are regulated under an amended Environmental Compliance Approval No. 5775-CBTHWE in September 2023. This allows for a mill production rate of up to 461,760 tonnes per year (tpy) and up to a 27,214 m3 / day water discharge rate to the environment.
Additional monthly surface water quality monitoring is conducted by Island Gold at three locations in Goudreau Lake (the receiving water body), one on Maskinonge Lake and one on Pine Lake. Both Maskinonge Lake and the upper basins of Goudreau Lake would be characterized as meeting provincial objectives. The majority of metal concentrations were below their respective provincial water quality objectives. Annual results have been comparable from 2007 to 2022.
In addition to the monitoring completed in conjunction with environmental compliance approval requirements, the site is subject to the MDMER. As required under MDMER, environmental
| | | | | |
Island Gold District – NI 43-101 Technical Report August 6, 2025 | 286
|
effects monitoring studies started in 2005 and have continued since then, with the most recent field program planned to occur for the Cycle 7 Study in the fall of 2025 (final report is expected in late 2026).
20.1.4.2 Magino Mine
Magino is located within the Magpie – Michipicoten River Basin. The line dividing the river basins bisects the property, with surface flows in the northwestern portion of Magino draining to the Magpie River, and surface flows in the southeastern portion of site draining to the Michipicoten River. Both catchments eventually drain to Lake Superior.
Magino and surrounding areas are drained by four sub-watersheds. These sub-watersheds cover land that is upstream of the District, and land that is beyond the potential downstream influence of the mine operations. These sub-watersheds are:
•Dreany Lake sub-watershed (offsite; drains to Magpie River Basin);
•Herman-Otto sub-watershed (onsite; drains to Magpie River Basin);
•Webb-Goudreau sub-watershed (onsite; drains to Michipicoten River Basin); and
•Spring-Lovell sub-watershed (onsite; drains to Michipicoten River Basin).
Catchments at Magino are primarily characterized by lakes and low-lying wetlands, with an average runoff coefficient of 0.56. A second runoff pattern was identified in the upper portion of the Spring Lake catchment, where mine related facilities such as the Magino TMF has been established. This area is characterized by dryer upland areas with minimal lake and low-lying wetland areas and has a higher average runoff coefficient at 0.82. The runoff patterns are bimodal, with the highest peak in water flows occurring in spring in response to freshet, and a second, lower peak occurring in late fall in response to rainfall events prior to freeze-up.
The Spring-Lovell sub-watershed contains nine waterbodies within Magino boundaries as shown on Figure 20-2, including two lakes (Lovell Lake and Spring Lake), five low-lying areas (Waterbodies 1 to 5), and two historical mining ponds (Tailings Pond and Polishing Pond). Lovell Lake and Waterbody 3 are receivers for the construction phase Environmental Compliance Approval #5113-BWZKRY. This Environmental Compliance Approval was replaced by #2066-CQLN6X on May 24th, 2023, for the operations phase of Magino, which shifts the receiver to Otto Lake.
Within Magino site boundaries, the Herman-Otto sub-watershed includes five lakes (Herman Lake, Otto Lake, Waterbody 7, Waterbody 8, and Waterbody 9), and one low-lying area (Waterbody 6). Waterbody 7 has been authorized for deposition of mine effluent under Schedule 2 of the MDMER and is now acting as the site of the WQCP.
The Webb-Goudreau sub-watershed within the project boundary includes two lakes (Webb Lake and Goudreau Lake) and one low-lying area (Waterbody 10). Webb Lake has been authorized for removal under Fisheries Act Authorization 20-HCAA-02291 to allow for development of the Magino open pit. Flows from Waterbody 10 will be diverted directly to Goudreau Lake by way of a diversion channel which incorporates fish habitat offset and compensation measures in accordance with the accepted Fish Habitat Offset and Compensation Plan.
Magino developed a Goldsim water balance in 2023 and was using this as part of the site-wide water management plan. A schematic of the model is presented in Figure 20-2.
| | | | | |
Island Gold District – NI 43-101 Technical Report August 6, 2025 | 287
|
Figure 20-2 Magino Mine Hydrologic System
Source: Alamos (2025)
20.1.4.3 Integrated Water Balance
Since the integration of the Island Gold and Magino mines, an integrated water balance is being developed. This is still a work in progress and will allow for optimization of water management between the combined mine sites. A schematic of the current integrated flow diagram is presented in Figure 20-3.
| | | | | |
Island Gold District – NI 43-101 Technical Report August 6, 2025 | 288
|
Figure 20-3: District Flow Diagram
Source: WSP (2024)
20.1.5 Groundwater
20.1.5.1 Island Gold Mine
Island Gold is located within a bedrock-drift complex physiographical region characterized by thin overburden or exposed bedrock in the highland areas and waterlogged wetlands in low-lying areas. There are no known or potential groundwater users within several kilometres of the site. There is no current usage of groundwater resources on site.
A hydrogeological study of Island Gold was conducted by Exp Services Inc. in 2013 with additional monitoring wells drilled in 2017. This included installation of ten groundwater monitoring wells across the site. Depth to groundwater ranged from 1.32 - 11.7 m below ground surface. Regional groundwater flow direction in both overburden and bedrock is southward toward Goudreau Lake.
A groundwater monitoring program has been in place since 2013 with regular monitoring of groundwater levels and quality. Additional wells were installed from 2022 to 2024. Samples from the groundwater wells have been tested for various parameters including metals, cyanide, hydrocarbons, and anions, with no exceedances of the Ontario drinking water quality guidelines.
20.1.5.2 Magino Mine
Overburden on site ranges from thicknesses of 0 - 16 m and is primarily composed of till and glaciofluvial deposits. Both the till and the glaciofluvial deposits at Magino are generally free draining and are composed of sand to silty-sand matrices with hydraulic conductivities on the
| | | | | |
Island Gold District – NI 43-101 Technical Report August 6, 2025 | 289
|
order of 10-4 to 10-3 m/s. The hydraulic conductivity of the till deposits is estimated to be approximately 1.3 x 10⁻⁴ to 8.4 x 10⁻⁴ m/s (EBA 2013), while the hydraulic conductivity of the glaciofluvial deposits is estimated at approximately 1.4 x 10⁻⁴ to 8.4 x 10⁻⁴ m/s (AMEC 2010). Thin (<0.5 m thick), discontinuous glaciolacustrine deposits with lower permeability are found throughout site in low-lying poorly drained areas, often flanking lakes and watercourses.
Hydraulic conductivities of bedrock throughout site were estimated using depth-discrete packer testing, full-borehole packer testing and slug testing.
The geometric mean of depth-discrete packer testing, full-borehole packer testing and slug testing are 1.1 x 10⁻⁶ m/s, 3.4 x 10⁻⁷ m/s and 1.2 x 10⁻⁶ m/s, respectively. The overall hydraulic conductivity for bedrock on site, estimated using the geometric mean of all three data sets, is 8.0 x 10⁻⁷ m/s. In general, the results of the hydraulic testing indicate that fracturing in the upper bedrock is relatively uniform and hydraulic conductivities in this zone are independent of depth. After the upper 60 m, hydraulic conductivities in bedrock generally decrease with depth.
Groundwater quality was monitored in 28 groundwater wells located at Magino starting in 2013 and continuing in several wells through the present. An additional 7 wells were sampled only in 2013, and one in 2016, with no subsequent sampling and are not considered further. These wells provided groundwater quality data for the overburden, shallow bedrock (upper 60 m), and deep bedrock. When analyzing, these wells were further subdivided into three groups given their locations relative to proposed mine infrastructure: TMF, MRMF and the open pit. Groundwater quality at the open pit footprint is potentially impacted by historical mining activities.
Overall, groundwater quality sampling results indicate that the groundwater in the project area is of good quality. Note that the high concentrations of total metal concentrations compared to dissolved concentrations are assumed to be due to the digestion of sediment by acid either as preservatives in the sample bottles or by the lab, and only the dissolved metal concentrations are discussed here. The groundwater quality improves with depth.
20.1.6 Air & Noise
Air & noise from a mine site is regulated through an environmental compliance approval. The environmental compliance approval requires that the mine must be in compliance with Ontario Regulation 419/05, applicable MECP guidelines for air and noise, and other performance requirements as specified in their conditions. It allows modifications such as process changes, de-bottlenecking, or addition of new equipment subject to limits on operational flexibility.
Emission summary and dispersion modelling (ESDM) reports have been prepared in accordance with Section 26 of Ontario Reg. 419/05 for the District. These reports were prepared to support applications for the air environmental compliance agreement and to demonstrate ongoing compliance. ESDM considers the potential contaminants from the various air emission sources generated at site, modelled downstream effects along the District property boundary, and is updated annually to include additions/deletions of equipment across the site. The potential contaminants included ammonia, carbon monoxide, copper, lead, nickel, nitrogen oxides, sulphur dioxides and total suspended particulates. All modelled potential contaminants were compared against the MECP criteria, with all below their respective limits.
The Province of Ontario and Federal government have released different green house gas (GHG) management programs; Ontario with the Emission Performance Standards and the Federal government with the Output Based Pricing system with the goal to encourage industries to transition from high-intensity to low-intensity GHG emissions generation. Island Gold has registered with both the systems; Magino registered under Ontario’s Emission Performance Standards in December 2024.
| | | | | |
Island Gold District – NI 43-101 Technical Report August 6, 2025 | 290
|
The completion of the Phase 3+ Expansion is expected to reduce the Island Gold District GHG emissions intensity from already low levels. In 2024, the Island Gold District emission intensity was 57% lower than the industry average. The transition to a shaft operation from hauling ore to surface and fully connecting the Magino mill to the electric grid, is expected to drive a further 29% decrease in GHG emissions per ounce produced. This will represent an emission intensity 70% lower than the industry average.
20.1.6.1 Island Gold Mine
Air and noise discharges are regulated under an amended Environmental Compliance Approval No. 1821 BAWLAC which was issued in May 2019 to Island Gold, allowing for an annual ore processing rate of 461,760 tpy.
20.1.6.2 Magino Mine
Air and noise discharges are regulated under Environmental Compliance Approval No. 5420-BKFMGV which was issued to Magino in December 2020, allowing for up to 45,200 t of ore extracted per day and 35,000 t of ore input into the mill per day.
20.1.7 Terrestrial Plant and Animal Life
The area is largely composed of trembling aspen, white birch, balsam poplar, black spruce, white spruce, balsam fir, and jack pine.
Wildlife populations in the area are regionally typical with the noted presence of moose, wolves, foxes, black bears, beavers, otters, muskrats, mink, snowshoe hares and red squirrels.
Habitats are generally favourable to moose because of past and ongoing forestry operations. Local moose populations are subject to considerable hunting pressure because of easy road access. Black bears and moose are prominent in the mine area and are sighted regularly. The beaver, otter and mink that inhabit the local area are the focus of trapping activity. Other organisms like owls have been reported.
20.1.7.1 Island Gold Mine
Tree clearing was conducted in 2020 and 2022 for the Phase 3+ Expansion. Various consultants completed the species at risk screening survey in June 2015, with a desktop review to compile data from the area to assess the potential for species at risk to utilize the habitat. Based on the desktop review, there was a potential for thirty-four designated species to occur within the Wawa District. Seven of these species have a moderate potential to inhabit the study area and twenty-seven species have a low potential to inhabit the site. Three of the species with moderate potential to occur on site have been listed as either endangered or threatened under both the Species at Risk Act and the Endangered Species Act. These species are Whip-Poor-Will, Northern Myotis and Little Brown Myotis bats, with field surveys conducted by Golder and Blue Heron at Island Gold in June and July 2015 (Golder, 2015). Northern Myotis and Little Brown Myotis were introduced onto the species at risk list both federally and provincially in 2014.
An expanded desktop study was conducted by Golder in early 2020 (Golder ,2020) as part of the Phase 3+ Expansion Study. Golder’s study area covers approximately 3,800 ha. During this study and from a review of historical information for neighbouring mines, potential habitat areas for species at risk were identified. The potential species at risk are found in Table 20-1.
| | | | | |
Island Gold District – NI 43-101 Technical Report August 6, 2025 | 291
|
Table 20-1 Identified Species at Risk – Island Gold
| | | | | | | | |
| Species at Risk Observed | Ontario Endangered Species Act Status | Federal Species at Risk Act Status |
| Bald Eagle | Special concern | Not listed |
| Canada Warbler | Special concern | Threatened |
| Chimney Swift | Threatened | Threatened |
| Common Nighthawk | Special concern | Special concern |
| Eastern Whip-Poor-Will | Threatened | Threatened |
| Little Brown Bat | Endangered | Endangered |
| Northern Long-Eared Bat | Endangered | Endangered |
| Olive-Sided Flycatcher | Special concern | Special concern |
Further fieldwork in 2020 confirmed Northern Myotis and Little Brown Myotis were around the Phase 3+ Expansion Area. To offset the potential loss in bat habitat, 225 bat houses were installed to provide alternate habitat.
20.1.7.2 Magino Mine
Seven species at risk were observed, heard or recorded in the Magino project study area (SLR, 2016): Whip-Poor-Will and Common Nighthawk were largely noted in areas of patchy forest cover. The majority of Bald Eagles were observed in Herman-Otto sub-watershed over the large bodies of water that characterize Herman-Otto. One Chimney Swift was observed in Webb-Goudreau near abandoned mine infrastructure. This species may have nested in some relict infrastructure; however, no nests were detected. It is noteworthy, apart from observations in 2013, no Whip-Poor-Will were observed in subsequent survey years (i.e., 2014 and 2016). Therefore, it is currently understood that this species does not use the project study area (it is at the extreme northern edge of known habitat) but could utilize other suitable habitat known to be present in the local study area and regional study area and likely beyond. With respect to the Northern Long-Eared Bat, survey results indicated low numbers in 2014 and none recorded in 2015. Similarly, Little Brown Bats were recorded in low numbers in 2014, and there were only 4 registrations in 2015, possibly recorded from outside the audit.
The potential species at risk are found in Table 20-2.
Table 20-2 Identified Species at Risk - Magino
| | | | | | | | |
Species at Risk Observed | Ontario Endangered Species Act Status | Federal Species at Risk Act Status |
| Whip-Poor-Will | Threatened | Threatened |
| Common Nighthawk | Special Concern | Threatened |
| Olive-sided Flycatcher | Special Concern | Threatened |
| Bald Eagle | Special Concern | Not listed |
| Canada Warbler | Special Concern | Threatened |
| Chimney Swift | Threatened | Threatened |
| Rusty Blackbird | Not Listed | Special Concern |
| Northern Long- Eared Bat | Endangered | Endangered |
| Little Brown Bat | Endangered | Endangered |
Significant wildlife habitat was also identified on site. Significant wildlife habitat identified on site includes: amphibian breeding habitat, moose aquatic feeding habitat, and moose late winter cover.
| | | | | |
Island Gold District – NI 43-101 Technical Report August 6, 2025 | 292
|
20.1.8 Aquatic Life
20.1.8.1 Island Gold Mine
Lake trout are restricted to Mountain Lake, where a self-sustaining population exists. Walleye has been introduced into both Pine and Goudreau Lakes. Goudreau Lake, which constitutes the receiving water body for the treated effluent discharge from the Secondary Pond, supports Northern Pike, White Sucker, and various minnow species. Yellow Perch occurs in Pine Lake. Maskinonge Lake supports a Northern Pike population.
Fish surveys have been conducted as part of on-going environmental effects monitoring studies in Goudreau Lake, Maskinonge Lake, and Pine Lake. Based on the field program conducted in 2023, the most abundant species found in Goudreau Lake was the Common Shiner and secondly was the Yellow Perch. Occasional White Sucker, Walleye and Northern Pike were collected. In Maskinonge Lake, Yellow Perch was the most abundant fish species and second was the Common Shiner. Occasional White Sucker, Pike and Walleye were collected.
20.1.8.2 Magino Mine
Lovell Lake
Lovell Lake is a shallow small lake located downstream from the polishing pond via a small stream. The lake is an oligotrophic system with sediments largely comprised of organic matter and detritus, with a substantial amount of in-water cover, and a maximum depth of 3 m. Aquatic vegetation and other structures such as deep pools and undercut banks provide abundant opportunities for minnow spawning habitat and instream cover. However, few opportunities for spawning and refuge exist for the two-resident large-bodies species (Yellow Perch and White Sucker) due to low habitat diversity.
A total of eight species of fish were captured in this waterbody, mainly represented by small-bodied cyprinids and other forage species, with the exception of Yellow Perch and White Sucker, which were both found to be abundant during the Summer 2012 sampling effort. Lovell Lake was classified as a low diversity sportfish community.
McVeigh Creek- Downstream from Spring Lake
The principally affected portion of McVeigh Creek originates in Spring Lake and flows to Summit Lake, approximately 1 km southwest of the Magino footprint. The upstream section of McVeigh Creek within the Magino footprint is characterized by a shallow profile, deposits of organic material, dense emergent macrophyte cover and a rocky riparian area with mature birch and spruce. The downstream section of McVeigh Creek within the Magino footprint is characterized by fast flowing water, cobble and boulder substrate. Numerous beaver dams are present within McVeigh Creek, with deep pools. Habitat (flow, substrate and depth) is diverse enough to support both cyprinid and larger bodied (White Sucker) cool water baitfish / forage species, as well as some smaller bodied sportfish species.
A total of ten cool water species of fish were captured in this watercourse during the summer 2013 sampling program. The fish community is characterized by small-bodied cyprinids and other forage species, with Yellow Perch and White Sucker present as larger bodied species. Accordingly, the waterbody is classified as a low diversity sportfish community.
| | | | | |
Island Gold District – NI 43-101 Technical Report August 6, 2025 | 293
|
McVeigh Creek Tributaries
McVeigh Creek Tributary 1 consists of a 2nd order stream that flows from the confluence of the drainages from Waterbody 1 and Waterbody 2 to Spring Lake, and the Lovell Lake outlet stream. The small watercourse which flows from Waterbody 3 to Spring Lake and McVeigh Creek Tributary 2 is also included in this characterization. Although direct fish community sampling was not conducted on either McVeigh Creek Tributary 2 or Waterbody 3, baitfish are inferred to be present based on adjacent fish communities and the habitat present. The maximum depth and width of McVeigh Creek tributaries are 1 m and 11 m, respectively in the impounded reaches, but the majority of the watercourse length is less than 1 m in width and shallow in nature. As such, fish presence and abundance in the tributaries is expected to be fragmented. The tributaries have been assigned an inferred baitfish community classification.
20.1.9 Waste Management
District strategy is to reduce consumption, reuse any waste generated, and dispose final waste in a safe and responsible manner. A waste management procedure has been developed and implemented for the District (Internal Document); it provides guidance to District and non-District personnel on the handling, processing, and disposal of waste, including hazardous waste and domestic materials generated during the normal operations of the facility.
The internal waste management procedure is consistent with the requirements of Reg. 347 (Waste Management), Reg. 207/96 (burning of domestic waste), and Dubreuilville By-Law No. 2012-44 (domestic waste produced by the mine site and the camp).
20.1.10 Geochemistry of Waste Rock and Tailings
20.1.10.1 Island Gold Mine
Excess underground waste rock is transported to the surface and stockpiled for use as future backfill and for constructing site roads and ongoing/future dam raise projects for the Island Gold TMF.
In 2019, Golder was subcontracted to conduct an assessment on the geochemistry of Island Gold tailings and waste rock. Historical documentation, from Wood PLC, (formally AMEC – Wood 2017, Wood 2018, Wood 2019) was also reviewed. Golder determined that the waste rock did not generate any ARD nor metal leaching and recommended reducing the sample analyses to monthly.
Weekly analyses were conducted for tailings and ore for metal leaching and acid-rock drainage. The tailings did not generate any mobile metals, but results show an unknown potential to generate acid due to static neutralization potential ratio (NPR) testing. The NPR is a ratio of the neutralizing potential to acid potential driven by the concentration of sulphides. Acid generation criteria are discussed in Table 20-3.
Table 20-3 Acid Generation Criteria
| | | | | | | | |
| Acid Generation Potential | Criteria | Comments |
| Potentially Acid Generating (PAG) | NPR<1 | Potentially acid generating, unless sulphide minerals are non-reactive |
| Uncertain | 1<NPR<2 | Possibly acid generating, if neutralizing potential is insufficiently reactive or is depleted at a rate faster than sulphides |
| Non-Acid Generating (NAG) | NPR>2 | Not expected to generate acidity |
| | | | | |
Island Gold District – NI 43-101 Technical Report August 6, 2025 | 294
|
From the 75 results analyzed, 54% of the samples are classified as NAG while 46% are classified as uncertain or PAG. Therefore, Golder recommended to continue weekly analysis of tailings static geochemistry and initiate four 60-week humidity cells, two if NPR is less than 1 and two when NPR is between 1 and 2. Three humidity cell tests were completed (two at week 60 and another to week 80). No net-acid generation was observed. Weekly analyses will continue for the tailings with future decisions being made on the need for additional humidity cell tests.
20.1.10.2 Magino Mine
Numerous geochemistry studies have taken place during the various stages of Magino. Key results obtained from the geochemical work carried out to date for Magino can be summarized as follows:
•Except for Unit 5e (Banded Sulphide), which represents less than 0.9% of rock to be mined, all waste rock is non-acid generating;
•Unit 5e (Banded Sulphide) waste rock will be permanently submerged within the tailings management facility;
•Waste rock is not expected to generate metals leaching at concentrations that would present impacts to surface water quality; and
•Tailings are non-acid generating.
While the data reported sufficiently characterizes the geochemistry of the mine rock and ore, previously Prodigy had elected to have SLR and later Lorax prepare a Mined Materials Management Plan (MMMP) to assure that handling and disposal of mining residues are protective of the environment (SLR 2016b, Lorax 2022). The MMMP includes the future collection of additional data relevant to acid rock drainage and mineral leaching issues.
Over 99% of the mine rock is anticipated to be NAG based on static acid-base accounting testing. Humidity cell testing of both the mine rock and the ore was performed to characterize the sulphide oxidation potential of the various rock types which produces sulfate and possibly dissolved metals.
Given the geotechnical and geochemical properties of the mine rock, it is not necessary to develop an additional aggregate source on site to supply rock and aggregate material for construction of Magino infrastructure. The MMMP outlines procedures for the screening of the mine rock and overburden for acid rock drainage and mineral leaching potential. NAG will be used, crushed and sized as required, for the construction of site roads, the construction of the Magino TMF embankment, to backfill areas of the site, to construct infrastructure pads, and, wherever construction or fill material is required. Overburden material (NAG material) from the stockpiles may also be used, as appropriate and necessary. Thus, a large percentage of the mine rock will be utilized to construct the facilities.
The expected surplus of mine rock will be stockpiled in the MRMF located on the south, east and northeast side of the TMF. The stockpiled mine rock will serve as additional buttress on the southeast side of the TMF embankment.
The mine rock will be handled and stockpiled based on its acid rock drainage classification and according to whether it is classified as NAG, uncertain, or PAG in accordance with the criteria described in the Closure Plan (WSP, 2024). Based on the mine production schedule for ore and mine rock, mining of PAG rock will occur over the entire period of mining. Therefore, there is a need to provide for ongoing classification of the rock that is mined so that appropriate placement can occur without the risk of causing acid rock drainage runoff or seepage that could enter receiving waters both during operation and after closure.
| | | | | |
Island Gold District – NI 43-101 Technical Report August 6, 2025 | 295
|
20.2 Permitting Activities
Relevant regulatory agencies for the anticipated District permitting needs include the provincial MECP, MNR, and MEM. There may also be permitting requirements from the Federal Department of Fisheries and Oceans and the Impact Assessment Agency of Canada if Alamos triggers any substantial changes to the current federal environmental assessment.
All permitting activities will cover modifications and/or additions to the site including but not limited to:
•Increased production rates;
•Updated water management and effluent discharge strategies;
•New air and noise discharges;
•Infrastructure additions/modifications related to the paste fill plant and new shaft area;
•New access roads;
•Aggregate sources; and
•Potential impacts to terrestrial habitats and natural water bodies including related fisheries resources.
20.2.1 Existing Permits – Island Gold
Island Gold is fully permitted to be operated at a production rate of 461,760 tpy of gold-bearing ore. An amended Environmental Compliance Approval for Air & Noise (No. 1821 BAWLAC) was issued in July 2024 allowing for an annual ore processing rate of 461,760 tpy. The Environmental Compliance Approval requires that Island Gold be in compliance with Ontario Regulation 419/05, applicable MECP Guidelines for Air and Noise, and other performance requirements as specified in permit conditions. It also allows modifications such as process changes, de-bottlenecking, or addition of new equipment subject to limits on operational flexibility.
An amended Environmental Compliance Approval for Industrial Sewage Works (ISW) (No. 5775-CVTHWE) was also issued in September 2023 to allow for an Island Gold mill production rate of up to 461,760 tpy. This permit includes all components for site water management, tailings management and domestic sewage treatment. The Limited Operational Flexibility clause was used for the most recent tailings lift construction to 427 m in 2020/21.
In addition to the Environmental Compliance Approvals, the site is permitted for water taking activities under various permits to take water. Table 20-4 lists the permits to take water for the various locations.
Table 20-4 List of Permits to Take Water
| | | | | | | | | | | |
Permit Id | Location | Maximum Allowable Water Taking (litres/day) | Expiry |
| 8571-8PENN8 | Lochalsh | 10,000,000 | September 8, 2027 |
| 6138-9ABJ9Z | Kremzar | 1,500,000 | August 7, 2023 |
| 4231-A8BNM7 | Maskinonge Lake | 434,500 | April 5, 2026 |
| P-300-187434989 | Exploration Drills | 360,000 | April 21, 2027 |
Within Ontario, both Environmental Compliance Approvals and Permits to Take Water fall under the regulatory mandate of MECP. Environmental Compliance Approvals are issued under the
| | | | | |
Island Gold District – NI 43-101 Technical Report August 6, 2025 | 296
|
Environmental Protection Act. Permits to Take Water are issued under the Ontario Water Resources Act.
Proponents in Ontario are required to file and maintain an updated Closure Plan under the authority of the Mining Act, which falls under the mandate of the MEM. The latest Closure Plan Amendment was filed in December 2023 which covered all construction activities for the Phase 3+ Expansion. Further information on closure planning can be found in Section 20.5.
The site has also acquired numerous other constructions related permits including Work Permits, Land Use Permits, Forest Resource Licenses and Request for Review Approvals through Fisheries and Oceans Canada to allow for tree clearing, haul road construction and various water crossings.
20.2.2 Existing Permits – Magino
Federal and Provincial Environmental Assessments
On July 8, 2013, the Canadian Environmental Assessment Agency (CEAA) accepted the submitted project description. The CEAA determined that an environmental assessment was required and commenced the assessment on September 3, 2013. The Agency issued Environmental Impact Statement (EIS) Guidelines. on November 1, 2013. Argonaut subsequently completed a standard Environmental Assessment (EA) under the Canadian Environmental Assessment Act, 2012 (CEAA 2012).
Consultation and engagement were conducted during preparation of the EIS report with a wide range of stakeholders and Indigenous communities through various methods to gather feedback on Magino and the preliminary environmental assessment findings. Comments received during the draft EIS report reviews were responded to as appropriate and subsequently addressed in the final EIS report.
The EIS report was initially submitted on January 23, 2017, and required revisions in June 2017. The CEAA determined that the revised report was in conformity with the EIS Guidelines in July 2017. All comments received on the final EIS report were addressed by Argonaut. The majority of the comments were from regulatory agencies and Indigenous communities. A register of District commitments related to the Federal environmental assessment process was provided to the public in December of 2018. After extensive Federal review the Minister of Environment and Climate Change issued a positive EA decision in January 2019, determining that Magino was not likely to cause significant adverse environmental effects as per CEAA (2012). The Decision Statement contains conditions related to Federal regulatory agencies associated with the project that Magino must report on annually to demonstrate compliance with the Decision Statement.
In consultation with the Province of Ontario, the MNR Class EA for Resource Stewardship and Facility Development Projects was applied to the project since the Magino site is a former mine site. Argonaut submitted a revised project description to the MNR in November 2016. After conclusion of the Class EA and associated consultation process, the MNR issued the Approval of the Statement of Completion (Category B Project) during March 2019, enabling Provincial permitting associated with the Magino project to be initiated.
Provincial Permits
Magino has an operations Environmental Compliance Approvals – Industrial Sewage Works (Number 2066-CQLN6X) which allows for the processing of 10,000 tpd through the mill and tailings facility. It also allows for discharge of effluent from the water quality control pond to Otto Lake at a rate of up to 42,000 m3/d.
| | | | | |
Island Gold District – NI 43-101 Technical Report August 6, 2025 | 297
|
Magino has an historic Environmental Compliance Approval – Waste Management which was amended in December 2021 (Number 6370-A66RJB) which permits the operation of a site landfill for non-hazardous waste. As part of the pit expansion this landfill was relocated off-site and the site landfill permit has been revoked through the MECP.
Magino has an operations Environmental Compliance Approval – Air & Noise issued in December 2020 (Number 5420-BKFMGV) which allows for a production limit of 45,200 tpd of ore extracted per day and 35,000 tpd ore input to the mill.
The site has a permit to take water – construction, issued in April 2022 (Number 0121-CCXHDL) which allows for the pumping of water from up to 21 sources of water on the mine site. The permit is currently being amended for long-term operations and is under government review. In the meantime, the construction permit to take water has been extended indefinitely.
The site has also acquired numerous other constructions related permits including Work Permits, Land Use Permits, Forest Resource Licenses, Lakes & Rivers Improvement Act Authorizations, and Request for Review Approvals through Fisheries and Oceans Canada to allow for tree clearing, haul road construction and various water crossings.
20.2.3 Future Anticipated Permit Requirements
In addition to amending these operational permits, Alamos will likely be required to acquire new permits or authorizations for future operations and to support construction activities outside the scope of operational permits.
Alamos would be required to obtain a new permit to take water for any domestic water supply needed to service the shaft surface facilities. In addition, given the potential for new disturbance associated with the shaft area, access roads, and aggregate sources there may be permits required under the Ontario Endangered Species Act. These permitting activities fall under the regulatory authority of the MECP.
Additional permits or authorizations would also need to be acquired through the different legislative requirements that fall under the mandate of the MNR. Included within the MNR mandate would be aggregate permits for till for TMF dam lifts. These types of materials would typically be reserved to the Crown (i.e., Ontario) and their use is regulated under the Aggregate Resources Act. Other approvals include Forest Resource Licenses (tree clearing activities) issued under the Crown Forest Sustainability Act, Work Permits issued under the Public Lands Act for activities such as culvert installations or constructing portions of the new access road where it crosses public lands. There may also be a requirement for Land Use Permits under the Public Lands Act to allow temporary occupation of Crown Land for site development activities such as powerlines.
Alamos may also require an amendment to the authorization issued under Section 35 the Federal Fisheries Act from the Federal Department of Fisheries and Oceans.
For the 12,400 tpd mill expansion, the likely permit amendments include:
•Closure Plan Amendment for Magino for any major changes to Closure Boundary, MRMF expansion, and / or TMF expansion;
•Environmental Compliance Approval Industrial Sewage Works to allow for increased mill tonnage to 12,400 tpd, potential new discharge location, water treatment plant addition and / or other related changes;
•Class Environmental Assessment for airstrip plus any additional associated baselines studies, provincial and federal permitting and consultation;
| | | | | |
Island Gold District – NI 43-101 Technical Report August 6, 2025 | 298
|
•Permit to take water amendment for Magino based on recent water balance update plus any amendments for pumping of water between the Island Gold and Magino sites;
•Fisheries and Ocean Canada amendment to fish habitat compensation; and
•Potential notice of changes to the federal EIS for water management and treatment.
20.3 Environmental Emergency Response
The District’s environmental programs are designed with the goal of preventing all environmental incidents. However, in the event of unplanned incidents, the mine maintains a high degree of emergency preparedness with appropriate plans, resources, and training to minimize the impact on workers, operations, the environment, and the community should an unplanned incident occur. A spill prevention and control plan is mandated under the regulatory requirements of Ontario Reg. 224/07 Spill Prevention and Contingency Plans, the primary purpose of which is to prevent and reduce the risk of spills of pollutants, and to prevent, eliminate or ameliorate any adverse effects that result from spills of pollutants that is updated annually.
A spill prevention and control plan (Internal Document b), as part of the environmental emergency response program, is in place for the overall District site. It outlines/mandates response to a leak or spill, to limit effects on employees, the community, and the environment.
It also includes roles and responsibilities of all employees, containment procedures, reporting aspects (both to internal management and external agencies), and follow-up/close-out procedures. Additional steps are taken to complete remediation and clean-up of a spill once the emergency containment has been completed.
20.4 Social and Community Considerations
20.4.1 Communities
The two communities in closest proximity to the District are the Town of Dubreuilville and the Municipality of Wawa, both in the Algoma District. Two other communities situated in the Algoma District include the Township of White River, which is 93 km north of Wawa, and the small community of Hawk Junction, which is approximately 30 km northeast of Wawa. Seasonal cottagers use the area as well.
The District is located 12 km from the Town of Dubreuilville which has a population of approximately 576 permanent residents (2021 Census of Population). The District is accessible from Dubreuilville by an all-weather road from Highway 519. The town contains accommodations for some mine personnel. Dubreuilville is accessible by car.
Historically, forestry and to a lesser degree mining, have been major contributors to Dubreuilville’s economy. In November 2007, Dubreuil Lumber Inc. filed for bankruptcy protection and ceased its logging operations. In 2008, Dubreuil Lumber Inc. was reduced to four employees. The collapse of the forestry industry dramatically impacted the town, leaving hundreds without work.
Statistics Canada data shows that the Town of Dubreuilville population steadily decreased from 990 people in 1996 to 576 people in 2021 (a decline of 42%). The median age of the total population in 2016 was 42 years. The majority of the Town’s citizens are bilingual and speak French as their primary language.
Educational facilities include a Catholic elementary school and a public high school, both of which are francophone and have small class sizes. Students must travel to Wawa for English
| | | | | |
Island Gold District – NI 43-101 Technical Report August 6, 2025 | 299
|
education. Daycare services are also offered. Residents have access to Contact North, which offers access to university and college courses through distance learning and online education.
The Dubreuilville Health Centre has two full-time registered nurses and receives six physician visits per month. The community also offers homecare, tele-health video consultations and mental health referrals. Dubreuilville provides community support services such as a food bank. The nearest hospital is the Lady Dunn Health Centre, approximately 66 km away by road in Wawa.
20.4.2 Industry
The District mines are the primary mining operations in the area. Other junior exploration programs are on-going. Previous operations include the Kremzar, the Magino, the Edwards, and Cline Lake Gold Mines. Other activity included small bulk sample extraction such as Markes, Vega, and Morrison Mines.
The District is in the southeast corner of the timber management area controlled by Dubreuil Forest Products, of Dubreuilville. No forestry operations are taking place in the mine area at present, and none are expected in the near term as the area has been extensively harvested. There is a local sawmill located in Dubreuilville which has been closed since 2008.
20.4.3 Recreation
Within 100 km of the Town of Dubreuilville there are numerous lakes that provide for recreational boating and fishing opportunities. Locally, fishing has been restricted on Goudreau Lake in recent years following the stocking of the lake with Walleye by local conservation organizations, limiting fishing in the immediate mine area to Pine Lake, which has reasonable public access. Maskinonge Lake is restricted by access through the District. All three lakes support Northern Pike, White Sucker, Common Shiner, and a variety of minnow species. Yellow Perch also occur in Pine Lake, as well as Walleye. Relatively easy access has resulted in intense fishing pressure by residents, as well as the presence of some non-resident anglers who return to the area annually.
Moose and Partridge are the primary game animals and hunting pressure is considerable by both residents of Dubreuilville and non-residents. There are other game animals like Marten, Mink, and Beaver. A Grouse population also attracts hunters. Black Bear hunting is popular in the area with a local outfitter operating out of Dubreuilville.
The District is adjacent to a provincial snowmobile trail route, with lodging in Dubreuilville, resulting in increased traffic in the area during winter.
20.4.4 Community and Benefits
Alamos philosophy is to maximize local hiring of employees from the labour pool in the surrounding communities. This has increased the economic stability of the local communities of Dubreuilville, Wawa and White River who have been hit hard by the downturn of the forestry industry.
As of end of December 2024 there were 910 employees and approximately 248 contractors employed by the District. This increase in contractors has largely been due to supporting contractors for the Phase 3+ Expansion construction. District employees have significantly augmented the local economy by living locally or supporting the local businesses when residing at the mine workforce accommodation facilities in Dubreuilville for approximately six months out of the year.
| | | | | |
Island Gold District – NI 43-101 Technical Report August 6, 2025 | 300
|
The District supports the local businesses and various non-profit organizations through its substantial local donations, purchase of goods, services, and materials, use of area motels and many home and apartment rentals for workforce accommodations. Support is also reflected through company programs such as the health and wellness program which provides yearly funds to encourage employees to join a fitness centre along with rental of local facilities such as the arena and school gym for employee activities or events. The recreational committee’s various activities with the local communities (curling & golfing tournaments) aid in developing relations with the town and supporting their economic development which is of important need to reconnect post the COVID-19 pandemic.
The District encourages employees to relocate to the local community. The District helps to supplement the local health care system by securing the services of a registered nurse on-site to provide health care services and a health and wellness program onsite for our employees to promote a healthy lifestyle. The services include health care, referrals to local doctors, awareness training and a vaccination program (that includes hepatitis, COVID-19, TWINRIX and flu shots).
The District has made donations to various initiatives in the communities, most recently with support for meals-on wheels and most recently, the District has made a $1 million commitment to hospitals in Wawa and Sault Ste. Marie for imaging equipment.
Public consultation activities are ongoing. Several information sessions are held in Dubreuilville, to provide updates of mine activities and to outline any proposed changes to the mine. Feedback garnered from consultation activities have been incorporated into the decision-making processes. Primary feedback has been related to employment opportunities at the District for residents of Dubreuilville.
There have also been regular meetings with the Dubreuilville Town Council to discuss common interests such as the Town’s landfill and incentives to the District’s employees to buy a house in Dubreuilville.
20.4.5 Indigenous Engagement
Indigenous engagement initiatives for the District were initiated in December 2003 by Patricia and continued with Richmont. Alamos has increased Indigenous engagement efforts since acquiring Island Gold in 2017 and Magino in 2024. The corporation’s site and executive management team is actively engaged with all Indigenous engagement initiatives.
To date the following Indigenous groups have been identified as having varying degrees of interest around the District: Batchewana First Nation, Garden River First Nation, Metis Nation of Ontario, Michipicoten First Nation, Missanabie Cree First Nation, and Red Sky Metis Independent Nation. Agreements are in place with all these groups.
As part of the EA and Indigenous engagement process, Traditional Knowledge and Traditional Knowledge Land Use assessments were provided to Magino by the Michipicoten First Nation, Missanabie Cree First Nation, Métis Nation of Ontario, Batchewana First Nation, Red Sky Métis Independent Nation and Garden River First Nation. Each of the assessments were used to assist in evaluating the extent of project-related potential impacts to individual communities.
Implementation of all the Indigenous agreements continues as part of the overall District, with regular meetings and consultations providing the communities regular updates on activities at the District. There have also been engagement activities to outline any proposed significant changes to the District due to the integration of Island Gold and Magino. Discussions have centered on the opportunities for employment, contracting, training, environmental effects of the project, and community development.
| | | | | |
Island Gold District – NI 43-101 Technical Report August 6, 2025 | 301
|
Consultation is an integral part of our business. Environment committees with each Indigenous Community have been a part of our process which allows for meaningful relationship building, ongoing dialogue to deal with any community concerns and a formal process to track and integrate feedback into our environmental permitting and systems.
20.5 Mine Closure
Island Gold and Magino have separate closure plans, whose boundaries are adjacent to one another. Island Gold has a filed Closure Plan Amendment from December 2023, with Magino’s most recent Closure Plan Amendment filed in September 2024.
As required by Ontario's Mining Act and Ontario Regulation 35/24 financial assurance must be provided for closure and rehabilitation of the District along with the certified closure plan.
The financial assurance amount will cover the cost of closure and rehabilitation and be provided as part of the filing of a certified closure plan to be acknowledged by the MEM to satisfy the requirements under the Mining Act.
20.5.1 Island Gold
The current Closure Plan Amendment details the decommissioning strategy for Island Gold. It reflects the current and expected site conditions and defines a program which ensures the long-term chemical and physical stability of the site. The goal of the closure plan is to ensure that chemical and physical impacts to the site are minimized during operations and that the site is returned as closely as possible to pre-development conditions at close-out. The closure plan has been developed using data collected during physical, chemical, and biological studies of the site (treated effluent, surface water, ground water, ore/waste rock characterization, etc.) and the surrounding environment during the production phases. As detailed in the closure plan the total cost estimate for remediation of Island Gold in its current state stands at $27M.
20.5.2 Magino
Based upon the detail provided as part of both the 2017 Magino Feasibility Study as well as the associated EA report, a draft closure plan was developed for Magino in 2019. The final closure plan was filed in 2021, and an Amendment was filed in 2024. A total cost estimate for remediation of Magino in its current state stands at $35M.
20.5.3 Historic Mines
Within the District there is a collection of historic mining properties. Past producing mines, advanced exploration projects and other smaller exploration sites make up a collection of historic liabilities managed by the District. Sites include the following:
•Edwards Mine,
•Cline Mine,
•Vega Mine,
•Markes Mine,
•Goudreau Pits,
•Emily Bay,
•Morrison,
| | | | | |
Island Gold District – NI 43-101 Technical Report August 6, 2025 | 302
|
•Michael Syndicate,
•Reid,
•Ego, and
•Murphy.
The closure cost or liability for these non-operating properties has been captured in the District Asset Retirement Obligation at the end of 2024. These closure costs have been estimated at $22M.
| | | | | |
Island Gold District – NI 43-101 Technical Report August 6, 2025 | 303
|
21 CAPITAL AND OPERATING COSTS
Capital and operating costs have been estimated by Alamos. All costs presented in this section are presented in constant Q1-2025 C$, with no inflation or escalation factors considered. Where applicable, a variable foreign exchange rate was used as follows: 2025 C$ = US$ 0.725, 2026 and 2027 C$ = US$ 0.740 and thereafter for 2028+ C$ = US$ 0.750.
21.1 Capital Costs
Capital costs have been estimated based on existing work contracts, manufacturer / provider quotes or recent actual construction / installation costs. Where none of the preceding were available, budgetary estimates were made by Alamos based on experience.
21.1.1 Summary
Total LOM capital costs are estimated to total $3,040M as summarized in Table 21-1. This includes $2,420M in sustaining capital and $620M in growth capital. This includes $62M identified for progressive and final closure. Details for each category follow in this section.
Table 21-1 Life of Mine Capital Cost Summary
| | | | | | | | |
| Description | Units | Total |
| Underground | $ million | 1,340.3 |
| Open Pit | $ million | 754.2 |
| Process + TMF | $ million | 263.6 |
| Phase 3+ Expansion | $ million | 476.8 |
| Other | $ million | 80.2 |
| Capital Leases | $ million | 63.0 |
| Reclamation / Closure | $ million | 61.9 |
| Total | $ million | 3,039.9 |
| Growth Capital | $ million | 619.9 |
| Sustaining Capital | $ million | 2,419.9 |
| Total | $ million | 3,039.9 |
•Totals may not match due to rounding.
21.1.2 Underground Capital Cost Estimate
The underground LOM capital cost is estimated to total $1,340M as summarized Table 21-2.
Principal underground capital costs include, but are not limited to the following principal items:
•Lateral and vertical mine development to expand into new mining horizons;
•Mobile equipment required for new and / or replacement mobile equipment including, but not limited to haul trucks, LHD units, drills and miscellaneous support equipment;
•Capitalized parts and component replacement / repairs as well as larger equipment rebuilds to maintain the mobile fleet;
•Development of the 1265L main maintenance facility; and
•Capitalized underground mine support services related to ventilation, electrical and dewatering.
| | | | | |
Island Gold District – NI 43-101 Technical Report August 6, 2025 | 304
|
Table 21-2 Life of Mine Underground Capital Costs
| | | | | | | | |
| Description | Units | Total |
| Capital Development | $ million | 924.4 |
| Mobile Equip. & Maintenance | $ million | 212.6 |
| Infrastructure | $ million | 203.3 |
| Total | $ million | 1,340.3 |
•Totals may not match due to rounding.
21.1.3 Open Pit Capital Cost Estimate
The open pit LOM capital cost is estimated to total $754M as summarized in Table 21-3.
Table 21-3 Life of Mine Open Pit Capital Costs
| | | | | | | | |
| Description | Units | Total |
| Mine Equipment | $ million | 30.3 |
| Parts & Components | $ million | 363.9 |
| Truck Shop | $ million | 38.3 |
| Capitalized Stripping | $ million | 321.7 |
| Total | $ million | 754.2 |
•Totals may not match due to rounding.
Principal open pit capital costs include, but are not limited to the following principal items:
•Mobile equipment required for new and / or replacement mobile equipment including, but not limited to haul trucks and miscellaneous support equipment;
•Capitalized parts and component replacement / repairs as well as larger equipment rebuilds to maintain the mobile fleet;
•Construction of a truck shop and separate truck wash bay; and
•Capitalized deferred stripping costs associated with the extraction of 77 Mt of waste.
21.1.4 Process Capital Cost Estimate
The process LOM capital cost is estimated to total $264M as summarized in Table 21-4.
Table 21-4 Life of Mine Process Capital Cost Estimate
| | | | | | | | |
| Description | Units | Total |
| Pebble Crusher & Auxiliary Mill | $ million | 55.0 |
| Mill Maintenance | $ million | 49.0 |
| TMF | $ million | 159.6 |
| Total | $ million | 263.6 |
•Totals may not match due to rounding.
Process capital costs include, but are not limited to the following principal items:
•The installation of a pebble crusher and auxiliary mill which are required to increase the mill throughput to 12.400 tpd without a loss in gold recovery;
•A general allocation of $2.8M per annum for miscellaneous mill capitalized parts and components replacement / repair; and
| | | | | |
Island Gold District – NI 43-101 Technical Report August 6, 2025 | 305
|
•Expansion of the Magino TMF to accommodate the tailings generated from the processing of an additional 89 Mt of ore in the current mine plan.
21.1.5 Phase 3+ Expansion Project
The Phase 3+ Expansion LOM capital cost is estimated to total $477M as summarized in Table 21-5.
Table 21-5 Phase 3+ Expansion Capital Costs
| | | | | | | | |
| Description | Units | Total |
| Shaft Complex | $ million | 145.5 |
| Paste Plant | $ million | 58.5 |
| Grid Power Upgrade | $ million | 27.1 |
| Magino Mill Expansion | $ million | 57.7 |
| Indirect Costs | $ million | 50.7 |
| Accelerated Capital Dev. | $ million | 137.3 |
| Total | $ million | 476.8 |
•Totals may not match due to rounding.
Principal Phase 3+ Expansion capital costs include, but are not limited to the following principal items:
•Completion of the shaft to the 1380 m depth and completion of the shaft complex infrastructure;
•Completion of the paste plant;
•Connection of the Magino mill to grid power to minimize use of the CNG plant; and
•Expansion of the Magino mill to 11,200 tpd in 2025 followed by a further expansion to 12,400 tpd by late 2026.
21.1.6 General & Administrative and Miscellaneous Capital Costs
The G&A and miscellaneous LOM capital cost is estimated to total $80M as summarized in Table 21-6.
Table 21-6 Life of Mine General and Administrative Capital Costs
| | | | | | | | |
| Description | Units | Total |
| Miscellaneous | $ million | 80.2 |
| Total | $ million | 80.2 |
•Totals may not match due to rounding.
Principal G&A capital costs contain a grouping of smaller capital items spanning environmental, site services, infrastructure and land management. Includes allocations for the fish habitat, permanent explosives magazine and minor ancillary equipment.
21.1.7 Closure and Reclamation
The closure and reclamation LOM capital cost is estimated to total $62M as summarized in Table 21-7.
| | | | | |
Island Gold District – NI 43-101 Technical Report August 6, 2025 | 306
|
Table 21-7 Life of Mine Closure and Reclamation Capital Costs
| | | | | | | | |
| Description | Units | Total |
| Island Gold Mine | $ million | 26.9 |
| Magino Mine | $ million | 35.0 |
| Total | $ million | 61.9 |
•Totals may not match due to rounding.
Principal closure and reclamation capital costs include, but are not limited to the following principal items:
•Closure and reclamation costs related to Island Gold; and
•Closure and reclamation costs related to Magino.
Excluded is the closure of historical mining areas within the District which are acknowledged as Alamos obligations irrespective of the economics of the District.
21.2 Operating Costs
Operating costs have been estimated using the District’s 2025 Budget as a reference point where applicable and were developed from first principle estimates and / or upon recent historical costs and key consumable consumption rates. Principal reagent costs and contractor rates utilized have been based on current contract prices and agreements where available.
The District’s 2025 Budget costs were adjusted to reflect key future operational changes such as:
•Increases in mining depth for both the underground and open pit;
•Increases in operational efficiencies associated with completion of the Phase 3+ Expansion shaft access and resulting increased underground production levels;
•Increases in operational efficiencies associated with the expansion of the Magino mill to 11,200 tpd and further to 12,400 tpd;
•Lower energy costs as the Magino mill transitions to line power and CNG generation of energy is minimized;
•Increases in operational efficiencies as Island Gold and Magino continue to integrate; and
•Reduction in labour related costs as the Phase 3+ Expansion is concluded, underground capital development activities decrease in the future, and the completion of mining at both Island Gold and Magino with transition into stockpile re-handle for the last years of the District’s operating life.
21.2.1 Summary
The estimated District operating costs total $5,360M over the LOM and averages $60.46/t of ore milled. A summary of the estimated District LOM operating costs is shown in Table 21-8.
. Estimated District unit operating costs are shown in Table 21-9
| | | | | |
Island Gold District – NI 43-101 Technical Report August 6, 2025 | 307
|
Table 21-8 Life of Mine Operating Cost Summary
| | | | | | | | |
| Description | Units | Total |
| Underground | $ million | 1,454.6 |
| Open Pit | $ million | 1,204.4 |
| Process | $ million | 1,483.9 |
| G&A | $ million | 1,216.7 |
| Total | $ million | 5,359.7 |
•Operating costs are exclusive of underground capitalized development and open pit capitalized stripping.
•Totals may not match due to rounding.
| | | | | |
Island Gold District – NI 43-101 Technical Report August 6, 2025 | 308
|
Table 21-9 Unit Operating Cost Summary
| | | | | | | | | | | | | | | | | | | | | | | | | | | | | | | | | | | | | | | | | |
| Description | Units | Total | Period |
| 2025 | 2026 | 2027 | 2028 | 2029 | 2030 | 2031 | 2032 | 2033 | 2034 | 2035 |
| Underground | $/t ore | 123.59 | 166.17 | 132.66 | 115.85 | 116.72 | 115.86 | 117.29 | 119.45 | 121.83 | 121.95 | 121.79 | 123.90 |
| Open Pit | $/t mined | 4.24 | 5.84 | 3.98 | 3.72 | 3.91 | 3.86 | 3.91 | 4.13 | 3.93 | 4.16 | 4.31 | 4.40 |
| Mine | $/t milled | 30.00 | 45.15 | 33.42 | 26.42 | 26.58 | 26.45 | 26.78 | 27.30 | 27.71 | 27.86 | 27.86 | 28.35 |
| Process | $/t milled | 16.74 | 24.66 | 20.70 | 16.96 | 16.96 | 16.96 | 16.96 | 16.96 | 16.96 | 16.96 | 16.96 | 16.96 |
| G&A | $/t milled | 13.73 | 20.25 | 14.47 | 13.84 | 13.79 | 13.61 | 13.89 | 13.20 | 13.70 | 14.15 | 14.11 | 15.41 |
| Total | $/t milled | 60.46 | 90.07 | 68.59 | 57.22 | 57.33 | 57.02 | 57.62 | 57.46 | 58.37 | 58.97 | 58.93 | 60.71 |
| | | | | | | | | | | | | |
| Description | Units | Total | Period |
| 2036 | 2037 | 2038 | 2039 | 2040 | 2041 | 2042 | 2043 | 2044 | 2045 | 2046 |
| Underground | $/t ore | | 127.71 | 133.90 | 136.85 | 85.04 | - | - | - | - | - | - | - |
| Open Pit | $/t mined | | 4.38 | 3.93 | 4.02 | 38.99 | - | - | - | - | - | - | - |
| Mine | $/t milled | | 29.11 | 30.45 | 31.12 | 27.40 | - | - | - | - | - | - | - |
| Process | $/t milled | | 16.91 | 16.86 | 16.25 | 15.55 | 14.50 | 14.50 | 14.50 | 14.50 | 14.50 | - | - |
| G&A | $/ t milled | | 16.07 | 17.64 | 17.66 | 14.14 | 11.96 | 10.95 | 9.31 | 7.61 | 9.09 | - | - |
| Total | $/t milled | | 62.08 | 64.95 | 65.04 | 57.09 | 26.46 | 25.45 | 23.81 | 22.11 | 23.59 | - | - |
•Operating costs are exclusive of underground capitalized development and open pit capitalized stripping.
•Open pit mining transitions during 2039 to full stockpile re-handle thereafter as the open pit is depleted and stockpiles are all that remain.
•Totals may not match due to rounding.
| | | | | |
Island Gold District – NI 43-101 Technical Report August 6, 2025 | 309
|
21.2.2 Mine Operating Costs
21.2.2.1 Underground Operating Costs
The underground estimated mining costs total $1,455M over the LOM and averages $123.59/t of ore mined. Underground mining costs are summarized in Table 21-10 and unit mining costs in Table 21-11.
Table 21-10 Life of Mine Total Underground Operating Costs
| | | | | | | | |
| Description | Units | Total |
| Mine Overhead | $ million | 315.4 |
| Engineering | $ million | 44.8 |
| Geology | $ million | 78.3 |
| Production | $ million | 393.9 |
| Development | $ million | 187.2 |
| Services | $ million | 434.9 |
| Total | $ million | 1,454.6 |
•Totals may not match due to rounding.
As the Phase 3+ Expansion comes to completion in 2026, total operating dollars spent reduce in Mine Overhead as the shaft is commissioned and ramp haulage costs are reduced but this is accompanied by an increase in production costs as the backfill paste plant comes online. This cost is offset by increased mining recoveries obtained using paste fill.
Meanwhile, fixed costs increase as the mine is developed due primarily to a lower proportion of capital development occurring as the mine matures. Island Gold uses an allocation system to allocate a portion of overheads to capital costs, and as capital development decreases, more of these costs are classified as operating costs.
Unit mining costs reflect the proceeding cost movements, offset by an increase in underground production from 1,319 tpd in 2025 to 2,400 tpd in 2027.
| | | | | |
Island Gold District – NI 43-101 Technical Report August 6, 2025 | 310
|
Table 21-11 Underground Unit Operating Costs
| | | | | | | | | | | | | | | | | | | | | | | | | | | | | | | | | | | | | | | | | |
| Description | Units | Total | Period |
| 2025 | 2026 | 2027 | 2028 | 2029 | 2030 | 2031 | 2032 | 2033 | 2034 | 2035 |
| Mine Overhead | $/t ore | 26.80 | 34.80 | 29.74 | 21.82 | 21.58 | 21.55 | 21.86 | 22.99 | 24.17 | 24.57 | 24.66 | 27.14 |
| Engineering | $/t ore | 3.81 | 4.99 | 3.60 | 3.37 | 3.36 | 3.37 | 3.43 | 3.41 | 3.64 | 3.71 | 3.56 | 3.97 |
| Geology | $/t ore | 6.65 | 6.13 | 5.67 | 5.66 | 5.64 | 5.65 | 5.74 | 5.73 | 6.11 | 6.22 | 6.14 | 7.13 |
| Production | $/t ore | 33.46 | 40.77 | 31.07 | 31.71 | 33.82 | 34.19 | 35.12 | 36.59 | 36.98 | 36.54 | 36.45 | 36.43 |
| Development | $/t ore | 15.91 | 30.08 | 24.42 | 20.40 | 19.73 | 18.65 | 18.37 | 17.95 | 17.02 | 16.57 | 16.23 | 11.94 |
| Services | $/t ore | 36.95 | 49.40 | 38.15 | 32.89 | 32.58 | 32.45 | 32.77 | 32.79 | 33.92 | 34.35 | 34.74 | 37.27 |
| Total | $/t ore | 123.59 | 166.17 | 132.66 | 115.85 | 116.72 | 115.86 | 117.29 | 119.45 | 121.83 | 121.95 | 121.79 | 123.90 |
| | | | | | | | | | | | | |
| Description | Units | Total | Period |
| 2036 | 2037 | 2038 | 2039 | 2040 | 2041 | 2042 | 2043 | 2044 | 2045 | 2046 |
| Mine Overhead | $/t ore | | 29.58 | 34.77 | 45.28 | 28.20 | - | - | - | - | - | - | - |
| Engineering | $/t ore | | 4.40 | 5.48 | 4.32 | 2.45 | - | - | - | - | - | - | - |
| Geology | $/t ore | | 7.84 | 9.64 | 9.62 | 8.53 | - | - | - | - | - | - | - |
| Production | $/t ore | | 35.24 | 32.69 | 25.66 | - | - | - | - | - | - | - | - |
| Development | $/t ore | | 11.28 | 6.69 | 4.48 | - | - | - | - | - | - | - | - |
| Services | $/t ore | | 39.36 | 44.63 | 47.49 | 45.86 | - | - | - | - | - | - | - |
| Total | $/t ore | | 127.71 | 133.90 | 136.85 | 85.04 | - | - | - | - | - | - | - |
•Totals may not match due to rounding.
| | | | | |
Island Gold District – NI 43-101 Technical Report August 6, 2025 | 311
|
21.2.2.2 Open Pit Operating Costs
The open pit estimated net mining costs total $1,204M over the LOM (including stockpile re-handle) and averages $4.24/t mined, excluding post-mine operational stockpile re-handle. Operating costs are presented net of capitalized deferred strip cost distribution. Open pit mining costs are summarized in Table 21-12 and unit mining costs in Table 21-13.
Table 21-12 Life of Mine Total Open Pit Operating Costs
| | | | | | | | |
| Description | Units | Total |
| Overhead | $ million | 121.9 |
| Engineering | $ million | 67.5 |
| Geology and Ore Control | $ million | 163.8 |
| Drill | $ million | 176.9 |
| Blast | $ million | 243.4 |
| Load | $ million | 152.9 |
| Haul | $ million | 300.1 |
| Support | $ million | 254.2 |
| Miscellaneous | $ million | 45.4 |
| Gross Mining Cost | $ million | 1,526.1 |
| Capitalized Deferred Strip | $ million | (321.7) |
| Net Mining Cost | $ million | 1,204.4 |
•Totals may not match due to rounding.
Mining fixed cost remains relatively constant over the mine life, decreasing only as the operation transitions into a stockpile re-handle operation in 2039. Meanwhile, variable costs fluctuate, due to mining rate increases / decreases over the LOM, influenced partially by generally increasing haulage costs due to increasing mining depth and ex-pit haulage distances. These cost movements are reflected in the corresponding unit operating costs.
| | | | | |
Island Gold District – NI 43-101 Technical Report August 6, 2025 | 312
|
Table 21-13 Open Pit Unit Operating Costs
| | | | | | | | | | | | | | | | | | | | | | | | | | | | | | | | | | | | | | | | | |
| Description | Units | Total | Period |
| 2025 | 2026 | 2027 | 2028 | 2029 | 2030 | 2031 | 2032 | 2033 | 2034 | 2035 |
| Overhead | $/t mined | 0.31 | 0.41 | 0.30 | 0.27 | 0.26 | 0.26 | 0.26 | 0.29 | 0.28 | 0.30 | 0.30 | 0.30 |
| Engineering | $/t mined | 0.20 | 0.27 | 0.20 | 0.18 | 0.17 | 0.17 | 0.17 | 0.19 | 0.19 | 0.20 | 0.20 | 0.20 |
| Geology and Ore Control | $/t mined | 0.47 | 0.98 | 0.45 | 0.41 | 0.40 | 0.40 | 0.40 | 0.44 | 0.43 | 0.46 | 0.46 | 0.46 |
| Drill | $/t mined | 0.52 | 0.69 | 0.51 | 0.50 | 0.49 | 0.49 | 0.49 | 0.50 | 0.49 | 0.50 | 0.50 | 0.51 |
| Blast | $/t mined | 0.71 | 0.86 | 0.70 | 0.68 | 0.68 | 0.68 | 0.68 | 0.70 | 0.69 | 0.70 | 0.70 | 0.70 |
| Load | $/t mined | 0.40 | 0.57 | 0.36 | 0.34 | 0.35 | 0.35 | 0.35 | 0.39 | 0.38 | 0.40 | 0.40 | 0.41 |
| Haul | $/t mined | 0.85 | 0.98 | 0.71 | 0.68 | 0.89 | 0.85 | 0.89 | 0.88 | 0.76 | 0.85 | 0.98 | 1.05 |
| Support | $/t mined | 0.65 | 0.92 | 0.62 | 0.56 | 0.56 | 0.56 | 0.56 | 0.62 | 0.59 | 0.63 | 0.64 | 0.65 |
| Miscellaneous | $/t mined | 0.13 | 0.16 | 0.12 | 0.11 | 0.11 | 0.11 | 0.11 | 0.12 | 0.12 | 0.13 | 0.13 | 0.13 |
| Total | $/t mined | 4.24 | 5.84 | 3.98 | 3.72 | 3.91 | 3.86 | 3.91 | 4.13 | 3.93 | 4.16 | 4.31 | 4.40 |
| | | | | | | | | | | | | |
| Description | Units | Total | Period |
| 2036 | 2037 | 2038 | 2039 | 2040 | 2041 | 2042 | 2043 | 2044 | 2045 | 2046 |
| Overhead | $/t mined | | 0.30 | 0.32 | 0.30 | 7.23 | - | - | - | - | - | - | - |
| Engineering | $/t mined | | 0.20 | 0.21 | 0.20 | 1.66 | - | - | - | - | - | - | - |
| Geology and Ore Control | $/t mined | | 0.46 | 0.48 | 0.46 | 2.23 | - | - | - | - | - | - | - |
| Drill | $/t mined | | 0.48 | 0.50 | 0.50 | 4.21 | - | - | - | - | - | - | - |
| Blast | $/t mined | | 0.70 | 0.71 | 0.70 | 4.93 | - | - | - | - | - | - | - |
| Load | $/t mined | | 0.41 | 0.41 | 0.39 | 5.53 | - | - | - | - | - | - | - |
| Haul | $/t mined | | 1.06 | 0.52 | 0.71 | 2.86 | - | - | - | - | - | - | - |
| Support | $/t mined | | 0.65 | 0.65 | 0.63 | 8.99 | - | - | - | - | - | - | - |
| Miscellaneous | $/t mined | | 0.13 | 0.13 | 0.13 | 1.34 | - | - | - | - | - | - | - |
| Total | $/t mined | | 4.38 | 3.93 | 4.02 | 38.99 | - | - | - | - | - | - | - |
•Operating costs presented are net of capitalized deferred strip but include rehandle during years when actual mining occurs.
•Rehandle costs post-mining are in the range of $3.75/t rehandled (including mine overhead costs).
•Totals may not match due to rounding.
| | | | | |
Island Gold District – NI 43-101 Technical Report August 6, 2025 | 313
|
21.2.3 Process Operating Costs
The process costs total $1,484M over the LOM and averages $16.74/t of ore milled. Process costs are summarized in Table 21-14 and unit processing costs in Table 21-15
Table 21-14 Life of Mine Total Process Operating Cost
| | | | | | | | |
| Description | Units | Total |
| Process Overhead | $ million | 473.2 |
| Laboratory | $ million | 2.9 |
| IG Crushing + Transport | $ million | 150.1 |
| Comminution | $ million | 396.5 |
| Thickening + Leaching | $ million | 59.3 |
| CIP | $ million | 38.5 |
| Acid Wash / EW / Refinery | $ million | 50.2 |
| CN Destruction | $ million | 146.5 |
| Tailings | $ million | 8.1 |
| Energy | $ million | 236.4 |
| Reagents/Air/Water | $ million | 8.5 |
| Total | $ million | 1,483.9 |
•Totals may not match due to rounding.
In general, fixed and variable processing costs increase as the production rate increases from 10,437 tpd in 2025 to 12,400 tpd in 2027, however, these cost increases are more than offset by the transition from CNG fuelled generators providing energy to the Magino mill to line power, expected to be connected to the provincial grid fully in late 2026. Thereafter, process costs remain constant, only reducing once Island Gold has ceased production, leaving only Magino re-handle ore available for processing.
| | | | | |
Island Gold District – NI 43-101 Technical Report August 6, 2025 | 314
|
Table 21-15 Process Unit Operating Costs
| | | | | | | | | | | | | | | | | | | | | | | | | | | | | | | | | | | | | | | | | |
| Description | Units | Total | Period |
| 2025 | 2026 | 2027 | 2028 | 2029 | 2030 | 2031 | 2032 | 2033 | 2034 | 2035 |
| Process Overhead | $/t milled | 5.34 | 6.68 | 5.28 | 5.28 | 5.28 | 5.28 | 5.28 | 5.28 | 5.28 | 5.28 | 5.28 | 5.28 |
| Laboratory | $/t milled | 0.03 | 0.04 | 0.03 | 0.03 | 0.03 | 0.03 | 0.03 | 0.03 | 0.03 | 0.03 | 0.03 | 0.03 |
| IG Crushing + Transport | $/t milled | 1.69 | 1.80 | 2.17 | 2.46 | 2.46 | 2.46 | 2.46 | 2.46 | 2.46 | 2.46 | 2.46 | 2.46 |
| Comminution | $/t milled | 4.47 | 4.94 | 4.45 | 4.45 | 4.45 | 4.45 | 4.45 | 4.45 | 4.45 | 4.45 | 4.45 | 4.45 |
| Thickening + Leaching | $/t milled | 0.67 | 0.74 | 0.67 | 0.67 | 0.67 | 0.67 | 0.67 | 0.67 | 0.67 | 0.67 | 0.67 | 0.67 |
| CIP | $/t milled | 0.43 | 0.48 | 0.43 | 0.43 | 0.43 | 0.43 | 0.43 | 0.43 | 0.43 | 0.43 | 0.43 | 0.43 |
| Acid Wash / EW / Refinery | $/t milled | 0.57 | 0.07 | 0.06 | 0.06 | 0.06 | 0.06 | 0.06 | 0.06 | 0.06 | 0.06 | 0.06 | 0.06 |
| CN Destruction | $/t milled | 1.65 | 1.31 | 1.18 | 1.18 | 1.18 | 1.18 | 1.18 | 1.18 | 1.18 | 1.18 | 1.18 | 1.18 |
| Tailings | $/t milled | 0.09 | 0.10 | 0.09 | 0.09 | 0.09 | 0.09 | 0.09 | 0.09 | 0.09 | 0.09 | 0.09 | 0.09 |
| Energy | $/t milled | 2.67 | 8.42 | 6.25 | 2.21 | 2.21 | 2.21 | 2.21 | 2.21 | 2.21 | 2.21 | 2.21 | 2.21 |
| Reagents/Air/Water | $/t milled | 0.10 | 0.11 | 0.09 | 0.09 | 0.09 | 0.09 | 0.09 | 0.09 | 0.09 | 0.09 | 0.09 | 0.09 |
| Total | $/t milled | 16.74 | 24.66 | 20.70 | 16.96 | 16.96 | 16.96 | 16.96 | 16.96 | 16.96 | 16.96 | 16.96 | 16.96 |
| | | | | | | | | | | | | |
| Description | Units | Total | Period |
| 2036 | 2037 | 2038 | 2039 | 2040 | 2041 | 2042 | 2043 | 2044 | 2045 | 2046 |
| Process Overhead | $/t milled | | 5.28 | 5.28 | 5.28 | 5.28 | 5.28 | 5.28 | 5.28 | 5.28 | 5.28 | - | - |
| Laboratory | $/t milled | | 0.03 | 0.03 | 0.03 | 0.03 | 0.03 | 0.03 | 0.03 | 0.03 | 0.03 | - | - |
| IG Crushing + Transport | $/t milled | | 2.41 | 2.36 | 1.75 | 1.05 | - | - | - | - | - | - | - |
| Comminution | $/t milled | | 4.45 | 4.45 | 4.45 | 4.45 | 4.45 | 4.45 | 4.45 | 4.45 | 4.45 | - | - |
| Thickening + Leaching | $/t milled | | 0.67 | 0.67 | 0.67 | 0.67 | 0.67 | 0.67 | 0.67 | 0.67 | 0.67 | - | - |
| CIP | $/t milled | | 0.43 | 0.43 | 0.43 | 0.43 | 0.43 | 0.43 | 0.43 | 0.43 | 0.43 | - | - |
| Acid Wash / EW / Refinery | $/t milled | | 0.06 | 0.06 | 0.06 | 0.06 | 0.06 | 0.06 | 0.06 | 0.06 | 0.06 | - | - |
| CN Destruction | $/t milled | | 1.18 | 1.18 | 1.18 | 1.18 | 1.18 | 1.18 | 1.18 | 1.18 | 1.18 | - | - |
| Tailings | $/t milled | | 0.09 | 0.09 | 0.09 | 0.09 | 0.09 | 0.09 | 0.09 | 0.09 | 0.09 | - | - |
| Energy | $/t milled | | 2.21 | 2.21 | 2.21 | 2.21 | 2.21 | 2.21 | 2.21 | 2.21 | 2.21 | - | - |
| Reagents/Air/Water | $/t milled | | 0.09 | 0.09 | 0.09 | 0.09 | 0.09 | 0.09 | 0.09 | 0.09 | 0.09 | - | - |
| Total | $/t milled | | 16.91 | 16.86 | 16.25 | 15.55 | 14.50 | 14.50 | 14.50 | 14.50 | 14.50 | - | - |
•Totals may not match due to rounding
| | | | | |
Island Gold District – NI 43-101 Technical Report August 6, 2025 | 315
|
21.2.4 General and Administrative Operating Cost
The G&A costs total $1,217M over the LOM and averages $13.73/t of ore milled. Process costs are summarized in Table 21-16 and unit G&A costs in Table 21-17.
Table 21-16 Life of Mine Total G&A Operating Costs
| | | | | | | | |
| Description | Units | Total |
| Administration | $ million | 129.4 |
| Community Relations | $ million | 106.2 |
| Human Resources | $ million | 40.4 |
| Information Technology | $ million | 91.9 |
| Health and Safety | $ million | 144.2 |
| Lodging &Transportation | $ million | 301.4 |
| Warehouse & Procurement | $ million | 69.0 |
| Surface Maintenance | $ million | 186.8 |
| Environment | $ million | 147.4 |
| Total | $ million | 1,216.7 |
•Totals may not match due to rounding
Costs start to decrease in 2026 as integration between Island Gold and Magino advances and remain generally consistent through 2032. Thereafter, some unit costs increase as a lower proportion of capital development occurs to which some G&A costs were proportionally assigned.
Unit G&A costs reflect the proceeding cost movements, offset by an increase in mill production from 10,437 tpd 2025 to 12,400 tpd in 2027.
| | | | | |
Island Gold District – NI 43-101 Technical Report August 6, 2025 | 316
|
Table 21-17 G&A Unit Operating Costs
| | | | | | | | | | | | | | | | | | | | | | | | | | | | | | | | | | | | | | | | | |
| Description | Units | Total | Period |
| 2025 | 2026 | 2027 | 2028 | 2029 | 2030 | 2031 | 2032 | 2033 | 2034 | 2035 |
| Administration | $/t milled | 1.46 | 2.70 | 1.72 | 1.55 | 1.55 | 1.55 | 1.55 | 1.55 | 1.55 | 1.55 | 1.55 | 1.55 |
| Community Relations | $/t milled | 1.20 | 1.65 | 1.53 | 1.76 | 1.80 | 1.64 | 1.79 | 1.48 | 1.49 | 1.62 | 1.55 | 1.46 |
| Human Resources | $/t milled | 0.46 | 0.96 | 0.63 | 0.57 | 0.57 | 0.57 | 0.57 | 0.57 | 0.56 | 0.56 | 0.56 | 0.47 |
| Information Technology | $/t milled | 1.04 | 1.98 | 1.31 | 1.17 | 1.18 | 1.18 | 1.18 | 1.17 | 1.16 | 1.16 | 1.17 | 1.15 |
| Health and Safety | $/t milled | 1.63 | 1.98 | 1.37 | 1.31 | 1.31 | 1.31 | 1.33 | 1.33 | 1.41 | 1.44 | 1.42 | 1.65 |
| Lodging &Transportation | $/t milled | 3.40 | 5.10 | 3.66 | 3.45 | 3.47 | 3.41 | 3.48 | 3.36 | 3.53 | 3.60 | 3.60 | 4.06 |
| Warehouse & Procurement | $/t milled | 0.78 | 1.15 | 0.97 | 0.90 | 0.79 | 0.82 | 0.79 | 0.56 | 0.63 | 0.76 | 0.85 | 1.11 |
| Surface Maintenance | $/t milled | 2.11 | 2.63 | 1.82 | 1.75 | 1.74 | 1.74 | 1.77 | 1.77 | 1.88 | 1.92 | 1.90 | 2.20 |
| Environment | $/t milled | 1.66 | 2.10 | 1.45 | 1.39 | 1.38 | 1.39 | 1.41 | 1.41 | 1.50 | 1.53 | 1.51 | 1.75 |
| Total | $/t milled | 13.73 | 20.25 | 14.47 | 13.84 | 13.79 | 13.61 | 13.89 | 13.20 | 13.70 | 14.15 | 14.11 | 15.41 |
| | | | | | | | | | | | | |
| Description | Units | Total | Period |
| 2036 | 2037 | 2038 | 2039 | 2040 | 2041 | 2042 | 2043 | 2044 | 2045 | 2046 |
| Administration | $/t milled | | 1.55 | 1.55 | 1.55 | 1.19 | 1.18 | 1.03 | 0.88 | 0.88 | 1.15 | - | - |
| Community Relations | $/t milled | | 1.27 | 1.03 | 1.31 | 0.88 | 0.72 | 0.19 | 0.22 | 0.23 | 0.28 | - | - |
| Human Resources | $/t milled | | 0.47 | 0.45 | 0.43 | 0.36 | 0.22 | 0.22 | 0.19 | 0.10 | 0.12 | - | - |
| Information Technology | $/t milled | | 1.14 | 1.11 | 1.07 | 0.80 | 0.63 | 0.63 | 0.49 | 0.44 | 0.75 | - | - |
| Health and Safety | $/t milled | | 1.80 | 2.21 | 2.37 | 2.03 | 1.97 | 1.90 | 1.47 | 1.18 | 1.79 | - | - |
| Lodging &Transportation | $/t milled | | 4.41 | 5.01 | 4.87 | 3.74 | 2.19 | 2.07 | 1.83 | 1.57 | 1.56 | - | - |
| Warehouse & Procurement | $/t milled | | 1.11 | 1.08 | 1.29 | 0.66 | 0.59 | 0.50 | 0.42 | 0.33 | 0.27 | - | - |
| Surface Maintenance | $/t milled | | 2.40 | 2.86 | 2.25 | 2.59 | 2.58 | 2.59 | 2.46 | 1.62 | 1.66 | - | - |
| Environment | $/t milled | | 1.91 | 2.34 | 2.52 | 1.89 | 1.87 | 1.81 | 1.34 | 1.28 | 1.51 | - | - |
| Total | $/t milled | | 16.07 | 17.64 | 17.66 | 14.14 | 11.96 | 10.95 | 9.31 | 7.61 | 9.09 | - | - |
•Totals may not match due to rounding
| | | | | |
Island Gold District – NI 43-101 Technical Report August 6, 2025 | 317
|
____________________________________________________________________________________
22 ECONOMIC ANALYSIS
An engineering economic model was developed to estimate annual cash flows and sensitivities for the District. After-tax estimates were developed to approximate the true investment value.
Sensitivity analyses were performed for a variation in metal prices, foreign exchange rate, operating costs, and capital costs to determine their relative importance as value drivers.
The estimates of capital and operating costs have been developed specifically for the District and are summarized in Section 21 of this report. They are presented in Q1-2025 C$ unless otherwise stated. The economic analysis has been run with no additional inflation (constant dollar basis).
22.1 Assumptions
All costs and economic results are reported as C$, unless otherwise noted. Table 22-1 outlines the planned life of mine tonnage and grade estimates.
Table 22-1 Life of Mine Plan Summary
| | | | | | | | |
| Parameters | Unit | Value |
| Mine Life | Years | 15 |
| Process Life | Years | 20 |
| Total Mill Feed | kt | 88,642 |
| Processing Rate (2027+) | tpd | 12,400 |
| Average Gold Head Grade | g/t | 2.23 |
| Average Gold Recovery | % | 96.3 |
| Total Gold Production over Life of Mine | koz | 6,112 |
| Au Production (Years 2026 to 2037) | Average koz/year | 411 |
| Au Production (Life of Mine) | Average koz/year | 306 |
•Totals may not match due to rounding.
The economic analysis was performed using the following assumptions and basis:
•The financial analysis was performed on Proven and Probable Mineral Reserves as outlined in this Report for the open pit and underground mines.
•The LOM presented in the financial analysis covers 2025 through 2044.
•The Phase 3+ Expansion shaft project will be completed in 2026, at which time the mill throughput will ramp up to 12,400 tpd.
•Gold and silver metal prices vary through time in the analysis as follows:
| | | | | |
•2025 – 2027 | US$ 3,000/oz gold, US$ 33.00/oz silver |
•2028+ | US$ 2,400/oz gold, US$ 28.00/oz silver |
•The foreign exchange rate varies through time in the analysis as follows:
| | | | | |
Island Gold District – NI 43-101 Technical Report August 6, 2025 | 318
|
____________________________________________________________________________________
| | | | | |
•2026 – 2027 | US$0.740 US$:C$ |
•2028+ | S0.750 US$:C$ |
•The NPV was calculated from the cash flow generated by the project based on a discount rate of 5%.
•Closure costs are included for Island Gold and Magino totalling $62M.
•No salvage value has been assumed at the end of project life.
•All related payments and disbursements incurred prior to 2025 are considered sunk costs and excluded from the financial analysis. However, 70% of Alamos’ Canadian tax pools at December 31st, 2024 are utilized in the tax calculations.
22.2 Revenue and Working Capital
Although the mine is currently operating with adequate working capital, an assumption was included in the cash flow model reflecting the in-kind royalty impact.
Mine revenue is derived from the sale of gold doré into the international marketplace. The mine has contractual arrangements for refining. The parameters used in the economic analysis are consistent with current agreements, as shown in Table 22-2.
Table 22-2 NSR Assumptions Used in the Economic Analysis
| | | | | | | | |
| Assumptions | Unit | Value |
Au Payable | % | 99.96% |
Au Refining and Transportation Charge | $/oz | 4.20 |
Figure 22-1 illustrates the annual recovered gold and cumulative recovered gold by project year.
Figure 22-1 Annual and Cumulative Gold Production
Source: Alamos (2025)
| | | | | |
Island Gold District – NI 43-101 Technical Report August 6, 2025 | 319
|
____________________________________________________________________________________
22.3 Summary of Operating Costs
Total life of mine operating costs, as presented in Table 22-3, amount to $5,568M, including silver by-product credits, royalties and refining and transportation charges. A detailed analysis of the operating costs can be found in Section 21 of this report.
Table 22-3 Summary of Operating Costs
| | | | | | | | | | | |
| Operating Cost | Unit Operating Cost | LOM $M |
| Units | Value |
| Mining – Underground | $/t ore mined | 123.59 | 1,455 |
| Mining – Open Pit | $/t mined | 4.24 | 1,204 |
| Processing | $/t processed | 16.74 | 1,484 |
| G&A | $/t processed | 13.73 | 1,217 |
| Sub-Total | 5,360 |
| Silver Credit | $/t processed | (0.45) | ($40) |
| Royalties | $/t processed | 2.81 | 249 |
| Total Operating Costs | 5,568 |
•Totals may not match due to rounding.
22.4 Summary of Capital Costs
The capital costs used for the economic analysis are set out below. Table 22-4 summarizes the capital costs used in the economic analysis, and Table 22-5 shows a breakdown by sustaining and growth capital. Detailed information can be found in Section 21 of this report.
Table 22-4 Total Capital Costs
| | | | | |
| Total Capital Cost | LOM $M |
| Sustaining Capital | 2,357 |
| Sustaining Capital Leases | 62 |
| Growth Capital | 620 |
| Total Capital Costs | 3,040 |
•Totals may not match due to rounding.
| | | | | |
Island Gold District – NI 43-101 Technical Report August 6, 2025 | 320
|
____________________________________________________________________________________
Table 22-5 Sustaining Capital Costs
| | | | | |
| Sustaining Capital Cost | LOM $M |
| Underground Capital Development | 924 |
| Open Pit Mobile Equipment and Maintenance | 394 |
| Open Pit Capitalized Deferred Strip | 322 |
| Underground Mobile Equipment and Maintenance | 213 |
| Underground Infrastructure | 203 |
| Tailings Facility | 152 |
| Mill Maintenance | 49 |
| Other | 38 |
| Total Sustaining Capital | 2,295 |
| Capital Leases | 63 |
| Reclamation | 62 |
| Total Sustaining Capital (including Capital Leases and Reclamation) | 2,420 |
•Totals may not match due to rounding.
Table 22-6 Growth Capital Costs
| | | | | |
| Growth Capital Cost | LOM $M |
| Phase 3+ Expansion, including accelerated capital development | 477 |
| Pebble Crusher and Auxiliary Mill | 55 |
| Open Pit Truck Shop | 39 |
| Other | 49 |
| Total Growth Capital | 620 |
•Totals may not match due to rounding.
22.5 Reclamation and Mine Closure Plan
The closure plan anticipates a cost of $62M for reclamation and closure. The bulk of the closure costs and reclamation activity will occur beyond 2043, after mining and processing have been completed.
22.6 Taxes
The District will be subject to provincial, federal, and mining taxes as follows:
•Ontario Mining Tax: 10%;
•Ontario Provincial Income Tax: 10%; and
•Federal Income Tax: 15%.
The rates above are current as of the date of this report and are subject to change in the future. Based on these rates and the financial assumptions used in this report, the District is expected to have payable income and mining taxes of $2,882M over its 20-year life. Alamos has various Canadian tax pools that could be applied against future income from its Canadian operations,
| | | | | |
Island Gold District – NI 43-101 Technical Report August 6, 2025 | 321
|
____________________________________________________________________________________
and 70% of the tax pools as of December 31st, 2024 were used in this study to reduce taxes payable in the economic analysis.
22.7 Royalties
Production from both Island Gold and Magino are subject to third party NSR royalties. At Island Gold, the total effective NSR royalty averages approximately 2.5% over the LOM, based on ounces produced, with approximately 90% of this royalty paid in-kind (as ounces). Magino is subject to a total effective NSR royalty averaging approximately 3.8% over the mine life based on ounces produced, with 100% of Franco-Nevada’s 3.0% NSR royalty paid in-kind (as ounces). The accounting treatment requires that in-kind royalties be recorded at production cost which lowers royalty expense, with an offsetting reduction in revenue given in-kind ounces transferred to royalty holders do not meet the definition of sales. As a result, the average NSR included in the LOM for Island Gold is approximately 0.8% of revenue over the life of mine, and 2.2% of revenue for Magino over the life of mine.
22.8 Economic Analysis
The after-tax net present value at 5% (NPV5%) is $5,991M (US $4,477M).
Figure 22-2 shows the projected cash flows used in the economic analysis and is based on the assumptions in Section 22.1. Table 22-7 shows the summary results of this evaluation.
Figure 22-2 Annual and Cumulative After-Tax Cash Flow
Source: Alamos (2025)
| | | | | |
Island Gold District – NI 43-101 Technical Report August 6, 2025 | 322
|
____________________________________________________________________________________
Table 22-7 Summary of Economic Results
| | | | | | | | |
| Category | Unit | Value |
| Revenues | $M | 19,922 |
Operating Costs1 | $M | 5,568 |
After-Tax Cash Flow from Operations2 | $M | 11,619 |
| Total Capital, Leases & Closure Costs | $M | 3,040 |
Total Cash Cost (2026-2037)3 | US$/oz | 581 |
Mine Site All-In Sustaining Cost (2026-2037)3 | US$/oz | 915 |
| Total Cash Cost (Life of Mine) | US$/oz | 699 |
| Mine Site All-In Sustaining Cost (Life of Mine) | US$/oz | 1,003 |
| Net After-Tax Cash Flow | $M | 8,579 |
| After-Tax NPV5% | $M | 5,991 |
| After-Tax NPV5% | US$M | 4,477 |
Notes:
1.Operating costs include mining, processing, G&A, royalties, transport & refining costs, and silver credit.
2.Cash flow from operations includes payable taxes.
3.Post-shaft completion in 2026.
4.Totals may not match due to rounding.
22.9 Sensitivities
A sensitivity analysis was performed to test value drivers on the District’s NPV using a 5% discount rate. The results of this analysis are demonstrated in Table 22-8 and Table 22-9 and illustrated in Figure 22-3
Table 22-8 After-Tax NPV5% Sensitivity Results (C$)
| | | | | | | | | | | | | | | | | |
| ($M of C$) | -10% | -5% | 100% | 5% | 10% |
| Gold Price | $4,464 | $5,214 | $5,991 | $6,799 | $7,634 |
| Canadian Dollar | $7,067 | $6,502 | $5,991 | $5,529 | $5,106 |
| Capital Costs | $6,092 | $6,042 | $5,991 | $5,941 | $5,890 |
| Operating Costs | $6,308 | $6,150 | $5,991 | $5,833 | $5,674 |
Table 22-9 After-Tax NPV5% Sensitivity Results (US$)
| | | | | | | | | | | | | | | | | |
| ($M of US$) | -10% | -5% | 100% | 5% | 10% |
| Gold Price | $3,337 | $3,897 | $4,477 | $5,080 | $5,704 |
| Canadian Dollar | $4,752 | $4,616 | $4,477 | $4,339 | $4,198 |
| Capital Costs | $4,552 | $4,514 | $4,477 | $4,440 | $4,403 |
| Operating Costs | $4,722 | $4,600 | $4,477 | $4,355 | $4,232 |
| | | | | |
Island Gold District – NI 43-101 Technical Report August 6, 2025 | 323
|
____________________________________________________________________________________
Figure 22-3 After-Tax NPV5% Sensitivity Results
Source: Alamos (2025)
The District proved to be most sensitive to changes in metal price followed by foreign exchange, capital costs and operating costs. A sensitivity analysis of the after-tax results was performed using various gold prices as provided in Table 22-10.
| | | | | |
Island Gold District – NI 43-101 Technical Report August 6, 2025 | 324
|
____________________________________________________________________________________
Table 22-10 Gold Price Sensitivity on NPV
| | | | | | | | |
| Gold Price in US$ | After-Tax NPV (C$M) | After-Tax NPV (US$M) |
| $2,000 | $3,926 | $2,942 |
$2,4001 | $5,991 | $4,477 |
| $2,750 | $6,814 | $5,098 |
| $3,000 | $7,770 | $5,811 |
| $3,300 | $8,915 | $6,667 |
| $3,500 | $9,678 | $7,236 |
1 Gold price of $3,000/oz in 2025 through to 2027, and a long-term (2028+) gold price of $2,400/oz
A summary of the District financial model is shown in Table 22-11 .
An economic evaluation of the District was performed at the Mineral Reserve gold price of USD 1,600/oz. The economic evaluation result was positive and supports the Mineral Reserve statement presented in this Report.
| | | | | |
Island Gold District – NI 43-101 Technical Report August 6, 2025 | 325
|
Table 22-11 Island Gold District Life-of-Mine Cash Flow
| | | | | | | | | | | | | | | | | | | | | | | | | | | | | | | | | | | | | | | | | | | | | | | | | | | | | | | | | | | | | | | | | | | | |
| Units | LOM | 2025 | 2026 | 2027 | 2028 | 2029 | 2030 | 2031 | 2032 | 2033 | 2034 | 2035 | 2036 | 2037 | 2038 | 2039 | 2040 | 2041 | 2042 | 2043 | 2044 |
| Underground Ore Milled | kt | 11,769 | | 482 | | 699 | | 878 | | 878 | | 876 | | 876 | | 876 | | 878 | | 876 | | 876 | | 876 | | 861 | | 841 | | 625 | | 371 | | - | | - | | - | | - | | - | |
| Underground Grade Milled | g/t | 10.85 | | 11.83 | | 10.85 | | 10.69 | | 12.42 | | 12.88 | | 12.54 | | 10.97 | | 12.24 | | 12.70 | | 11.09 | | 9.76 | | 8.14 | | 8.25 | | 7.41 | | 9.67 | | - | | - | | - | | - | | - | |
| Open Pit Ore Milled | kt | 76,873 | | 3,324 | | 3,389 | | 3,648 | | 3,660 | | 3,650 | | 3,650 | | 3,650 | | 3,660 | | 3,650 | | 3,650 | | 3,650 | | 3,677 | | 3,685 | | 3,901 | | 4,153 | | 4,538 | | 4,526 | | 4,526 | | 4,526 | | 3,759 | |
| Open Pit Grade Milled | g/t | 0.91 | | 0.95 | | 1.08 | | 0.96 | | 1.14 | | 1.00 | | 1.24 | | 0.70 | | 0.72 | | 1.01 | | 1.25 | | 1.23 | | 1.20 | | 0.83 | | 0.91 | | 0.70 | | 0.69 | | 0.69 | | 0.69 | | 0.69 | | 0.69 | |
| Total Ore Milled | kt | 88,642 | | 3,806 | | 4,088 | | 4,526 | | 4,538 | | 4,526 | | 4,526 | | 4,526 | | 4,538 | | 4,526 | | 4,526 | | 4,526 | | 4,538 | | 4,526 | | 4,526 | | 4,524 | | 4,538 | | 4,526 | | 4,526 | | 4,526 | | 3,759 | |
| Total Grade Milled | g/t | 2.23 | | 2.33 | | 2.75 | | 2.85 | | 3.32 | | 3.30 | | 3.43 | | 2.69 | | 2.95 | | 3.27 | | 3.16 | | 2.88 | | 2.51 | | 2.21 | | 1.81 | | 1.43 | | 0.69 | | 0.69 | | 0.69 | | 0.69 | | 0.69 | |
| | | | | | | | | | | | | | | | | | | | | | |
| Gold Production | koz | 6,112 | | 276 | | 347 | | 395 | | 471 | | 466 | | 485 | | 378 | | 417 | | 462 | | 445 | | 405 | | 353 | | 308 | | 252 | | 199 | | 93 | | 93 | | 93 | | 93 | | 79 | |
| Gold Sales | koz | 5,955 | | 265 | | 339 | | 385 | | 459 | | 456 | | 473 | | 369 | | 407 | | 451 | | 435 | | 396 | | 345 | | 301 | | 245 | | 194 | | 91 | | 90 | | 90 | | 90 | | 75 | |
| | | | | | | | | | | | | | | | | | | | | | |
| Operating Costs | | | | | | | | | | | | | | | | | | | | | | |
Underground Costs | $ million | 1,455 | | 80 | | 93 | | 102 | | 102 | | 101 | | 103 | | 105 | | 107 | | 107 | | 107 | | 109 | | 110 | | 113 | | 86 | | 32 | | - | | - | | - | | - | | - | |
Open Pit Costs | $ million | 1,204 | | 102 | | 94 | | 70 | | 69 | | 104 | | 61 | | 23 | | 36 | | 92 | | 101 | | 92 | | 86 | | 63 | | 94 | | 35 | | 18 | | 17 | | 16 | | 16 | | 15 | |
Mill Costs | $ million | 1,484 | | 94 | | 85 | | 77 | | 77 | | 77 | | 77 | | 77 | | 77 | | 77 | | 77 | | 77 | | 77 | | 76 | | 74 | | 70 | | 66 | | 66 | | 66 | | 66 | | 55 | |
G&A Costs | $ million | 1,217 | | 77 | | 59 | | 63 | | 63 | | 62 | | 63 | | 60 | | 62 | | 64 | | 64 | | 70 | | 73 | | 80 | | 80 | | 64 | | 54 | | 50 | | 42 | | 34 | | 34 | |
Royalties and Silver Credits | $ million | 210 | | 11 | | 13 | | 13 | | 14 | | 13 | | 14 | | 10 | | 10 | | 12 | | 14 | | 14 | | 14 | | 11 | | 11 | | 8 | | 6 | | 6 | | 6 | | 6 | | 5 | |
| | | | | | | | | | | | | | | | | | | | | | |
| Total Cash Costs | USD/oz | 699 | | 886 | | 626 | | 523 | | 469 | | 516 | | 451 | | 624 | | 586 | | 582 | | 568 | | 587 | | 698 | | 888 | | 966 | | 999 | | 1,696 | | 1,649 | | 1,584 | | 1,520 | | 1,590 | |
| Mine-site AISC | USD/oz | 1,003 | | 1,247 | | 1,006 | | 933 | | 842 | | 814 | | 773 | | 1,116 | | 990 | | 850 | | 871 | | 875 | | 941 | | 1,117 | | 1,098 | | 1,114 | | 1,742 | | 1,724 | | 1,649 | | 1,551 | | 1,950 | |
| | |
| | | | | | | | | | | | | | | | | | | |
| Capital Expenditures | | |
| | | | | | | | | | | | | | | | | | | |
Sustaining | $ million | 2,357 | | 109 | | 158 | | 203 | | 226 | | 180 | | 202 | | 241 | | 218 | | 160 | | 174 | | 150 | | 111 | | 91 | | 43 | | 29 | | 5 | | 9 | | 8 | | 4 | | 36 | |
Sustaining - Leases | $ million | 63 | | 23 | | 16 | | 10 | | 2 | | 1 | | 1 | | 1 | | 2 | | 1 | | 2 | | 1 | | 1 | | 0 | | 0 | | 0 | | 0 | | - | | - | | - | | - | |
Growth | $ million | 620 | | 416 | | 188 | | 16 | | - | | - | | - | | - | | - | | - | | - | | - | | - | | - | | - | | - | | - | | - | | - | | - | | - | |
Total Capex | $ million | 3,040 | | 548 | | 362 | | 229 | | 228 | | 181 | | 203 | | 242 | | 219 | | 161 | | 176 | | 152 | | 112 | | 91 | | 43 | | 30 | | 6 | | 9 | | 8 | | 4 | | 36 | |
| | | | | | | | | | | | | | | | | | | | | | |
| After-tax Free Cash Flow | $ million | 8,579 | | 190 | | 522 | | 755 | | 681 | | 674 | | 715 | | 492 | | 579 | | 675 | | 606 | | 534 | | 462 | | 402 | | 304 | | 311 | | 143 | | 144 | | 148 | | 152 | | 90 | |
| After-tax Free Cash Flow | USD million | 6,417 | | 138 | | 386 | | 558 | | 510 | | 506 | | 536 | | 369 | | 434 | | 506 | | 454 | | 401 | | 346 | | 301 | | 228 | | 233 | | 107 | | 108 | | 111 | | 114 | | 68 | |
•Totals may not match due to rounding.
| | | | | |
Island Gold District – NI 43-101 Technical Report August 6, 2025 | 326
|
____________________________________________________________________________________
23 ADJACENT PROPERTIES
No adjacent properties are considered relevant to the scope of this Report.
| | | | | |
Island Gold District – NI 43-101 Technical Report August 6, 2025 | 327
|
____________________________________________________________________________________
24 OTHER RELEVANT DATA AND INFORMATION
There is no additional information or explanation necessary to make the Report understandable and not misleading.
| | | | | |
Island Gold District – NI 43-101 Technical Report August 6, 2025 | 328
|
____________________________________________________________________________________
25 INTERPRETATION AND CONCLUSIONS
The QPs note the following interpretations and conclusions in their respective areas of expertise, based on the review of data available for this Report.
25.1 Geology and Mineral Resources
•The understanding of the deposit settings, lithologies, geologic and structural controls on mineralization is sufficient to support the estimation of Mineral Resources within the District.
•Sample collection, preparation, analytical, and security procedures, along with QA/QC insertion rates and performance of blanks, CRMs, and check assays meet industry standards. The District databases are considered suitable for use in Mineral Resource estimation.
•Island Gold Mineral Resources are estimated as 3.1 Mt of Measured and Indicated material grading 10.49 g/t gold resulting in 1.0 Moz of contained gold. Inferred material is estimated as 2.4 Mt grading 16.88 g/t gold resulting in 1.3 Moz of contained gold.
•Magino Mineral Resources are estimated as 60.3 Mt of Measured and Indicated material grading 0.91 g/t gold resulting in 1.8 Moz of contained gold. Inferred material is estimated as 40.3 Mt grading 0.92 g/t gold resulting in 1.2 Moz of contained gold.
•District Mineral Resources are estimated as 63.4 Mt of Measured and Indicated material grading 1.38 g/t gold resulting in 2.8 Moz of contained gold. Inferred material is estimated as 42.7 Mt grading 1.83 g/t gold resulting in 2.5 Moz of contained gold.
•The Mineral Resources have been estimated in conformity with the Canadian Institute of Mining, Metallurgy and Petroleum CIM (2014) Standards as well as using the guidance outlined in the CIM Estimation of Mineral Resources and Mineral Reserves Best Practice Guidelines 2019 and are reported in accordance with the Canadian Securities Administrators’ National Instrument 43-101. Mineral Resources are not Mineral Reserves and do not have demonstrated economic viability.
•Mineral Resources are reported exclusive of Mineral Reserves.
25.2 Mining and Mineral Reserves
•Island Gold employs underground mining methods typically utilized in global mining operations, consisting primarily of longitudinal longhole open stoping and transverse longhole open stoping, both which are deemed suitable considering the geometry and quality of the orebody.
The Island Gold Mineral Reserves are estimated as 11.8 Mt grading 10.85 g/t gold resulting in 4.1 Moz of contained gold.
Island Gold performs regular reconciliations between production and the diluted Mineral Reserve block model (based upon the Mineral Resource Model with modifying factors applied) and results over 2024 indicate a general underestimation of the diluted Mineral Reserve model in both tonnes and grade, particularly in the higher-grade zones.
•Magino employs conventional open pit truck and shovel mining methods typically utilized in global mining operations.
| | | | | |
Island Gold District – NI 43-101 Technical Report August 6, 2025 | 329
|
____________________________________________________________________________________
The Magino Mineral Reserves are estimated as 76.9 Mt grading 0.91 g/t gold resulting in 2.2 Moz of contained gold.
Magino performs regular reconciliations between production and the diluted Mineral Reserve block model (based upon the Mineral Resource model with modifying factors applied) and results in an underestimation of the amount of dilution and its impact on grade, however, overall, the reconciliation results in a reasonable indication of total contained gold ounces.
•District Mineral Reserves, including both Island Gold and Magino is estimated as 88.6 Mt grading 2.23 g/t gold resulting in 6.3 Moz of contained gold.
•District Mineral Reserves were estimated at gold prices that are below current spot prices and therefore considered resilient to changes in commodity prices.
•The Mineral Reserves have been estimated in conformity with the Canadian Institute of Mining, Metallurgy and Petroleum CIM (2014) Standards as well as using the guidance outlined in CIM Estimation of Mineral Resources and Mineral Reserves Best Practice Guidelines 2019 and are reported in accordance with the Canadian Securities Administrators’ National Instrument 43-101.
25.3 Metallurgy and Recovery Methods
•Historical metallurgical recoveries and recent laboratory and bulk sample test work supports the use of a District average gold recovery of approximately 96% for processed ore.
•All process equipment is in place and operating to support the current 10,000 tpd plant and expansion to 11,200 tpd during 2025. Additional equipment is being sourced and a plant expansion being executed to expand the Magino mill from 11,200 tpd to 12,400 tpd by late 2026. The expansion considers the inclusion of additional equipment to manage the higher tonnage and grade delivered to the Magino mill through the integration of Island Gold ore through the facility.
25.4 Infrastructure
•Principal infrastructure is in place to achieve mining rates required to achieve current 10,000 tpd processing rates, including an increase to 11,200 tpd during H2-2025. To achieve the 2027 average process rate of 12,400 tpd, the following infrastructure construction is being executed:
o Continued development of the shaft complex infrastructure and shaft to 1,380 m in depth;
o Development / implementation of a new underground ore and waste handling system;
o Upgrade to the District power supply, including the connection of the Magino mill to the provincial power grid to reduce dependence on CNG generated power;
o Continued construction of the paste backfill plant and the corresponding underground distribution system;
o Expansion of the Magino mill to 12,400 tpd, including assay lab complex;
o Construction of the Magino truck shop, truck wash and associated warehousing and office facilities; and
o Continued expansion of the District MRMF, SWMF and TMF to meet future, ongoing waste storage requirements.
| | | | | |
Island Gold District – NI 43-101 Technical Report August 6, 2025 | 330
|
____________________________________________________________________________________
25.5 Environmental and Community Considerations
•The District is operating within environmental compliance.
•A number of operational permits will need to be amended to allow for the planned expansion of the District to 12,400 tpd milling capacity as outlined in this Report.
•The District has been and will continue to be, a major contributor to the local economy. Alamos will continue to engage and work with area Indigenous communities and other communities of interest.
25.6 Capital and Operating Costs
•Capital and operating costs have been undertaken to a Feasibility Study level of detail (±15%) and are estimated in Q1-2025 constant dollars. Capital and operating costs estimates are considered appropriate for the purpose of this Technical Report and the declaration of Mineral Reserves.
•Capital costs represent District growth and sustaining capital cost estimated for Island Gold and Magino, including the Phase 3+ Expansion and the Magino mill expansion to 12,400 tpd. Total LOM capital costs are estimated as $3,040M. This includes $2,420M in sustaining capital and $620M in growth capital. Also included is $62M identified for progressive and final closure.
•Operating costs represent District costs and total $5,360M over the LOM and averages $60.46/t of ore milled. Operating costs contemplate all operational activities required for the mining, processing, general and administrative costs, and offsite costs (including freight & refining and royalties) for all the forecasted production.
25.7 Economic Analysis
•An economic analysis has been undertaken which demonstrates that the LOM presented in this report generates an after-tax, free cash flow of US$ 6,417M and a resultant NPV @5% of US$ 4,477M. LOM total cash costs and AISC are estimated as US$699/oz and US$1,003/oz, respectively.
•The after-tax NPV is most sensitive to changes in the gold price, with relatively lower sensitivity to changes in capital and operating costs.
| | | | | |
Island Gold District – NI 43-101 Technical Report August 6, 2025 | 331
|
____________________________________________________________________________________
26 RECOMMENDATIONS
The Island Gold and Magino mines within the District are properties in active operation. Unless indicated with a corresponding monetary value, recommendations are currently budgeted within Alamos’ current LOM plan or are assumed to be able to be undertaken as an everyday task within the corresponding department at site without additional cost.
•Conduct additional drilling within the areas of the Mineral Resources with the objective of converting Inferred Mineral Resources to Measured and Indicated Mineral Resources.
•Continue mine and near-mine exploration activities with the objective of adding to the Mineral Resource inventory.
•Continue to advance a pipeline of regional targets within the district with the objective of defining additional Mineral Resources in proximity to the Magino mill.
•Review and validate with historical data collected over the past several years of production the estimation parameters used in relation to Mineral Resource classification for Magino.
•Execute a geotechnical investigation program on the south wall of the Magino pit to ensure compliance of the design with the underlying objectives of slope design.
•Island Gold has significant positive reconciliation, meanwhile Magino is incurring above planned ore dilution. It is recommended to continually track and analyze reconciliation and operational results and apply learnings to subsequent Mineral Resource estimations.
•A selective mining unit size study is recommended to be conducted at Magino to compare against reconciliation results through 2025 to determine if a change in block dimensions in the Mineral Resource model is warranted.
•Undertake metallurgical test work of Magino samples in the vicinity of the Mineral Reserve COG of 0.30 g/t gold to confirm recovery of gold at low grades.
•Complete the District airstrip study.
•An opportunity has been identified to potentially increase Magino mill throughput. It is recommended that this study be completed in 2025 such that District value can be maximized should the opportunity be confirmed to be attractive. Early determination of an economically feasible expansion would allow the pebble crusher and auxiliary mill to be removed from the Step 2 capital identified in this Report.
| | | | | |
Island Gold District – NI 43-101 Technical Report August 6, 2025 | 332
|
____________________________________________________________________________________
27 REFERENCES
National Instrument 43-101, Standards of Disclosure for Mineral Projects (NI 43-101), of the Canadian Securities Administrators (CSA)
AMEC, 2010, Hydrogeological Study, Magino Mine Project, Finan Township, District of Wawa, Ontario, AMEC Earth and Environmental, March 2010.
Arias, Z.G., and Helmstaedt, H. 1990. Grant 343 Structural Evolution of the Michipicoten (Wawa) Greenstone Belt, Superior Province: Evidence for an Archean Fold and Thrust Belt. In Geoscience Research Grant Program Summary of Research 1989-1990. Edited by V.G. Milne. Ontario Geological Survey, Miscellaneous Paper 150, pp. 107-114.
Bloom, L., 2015, ASL Canada, 2015 Review of the Island Gold Project Assay Quality Control Program (January – December 2015), January 2016.
Bloom & Jolette, 2019, Lab Expert Review, internal report, Island Gold, September 2019
BML, 2023, Metallurgical Evaluation of Island Gold Project, February 3, 2023.
BML, 2025, Effect of Blending Material from Magino and Island Gold
Boissonneau, A.N., Glacial History of Northeastern Ontario. The Cochrane-Heast Area. Canadian Journal of Earth Sciences, 3, 559 – 578, 1966.
Campos, I.C., Lafrance, B., Sherlock, R., Dunbar, P., Mclaughlin, B., Kruse, S., Creaser, R., and Leung, D.V. (2024). The Magino Gold Deposit, Ontario, Canada: An Overprinted Archean Intrusion-Related Gold Deposit: Economic Geology, v. 119, no. 7, p. 1563–1585.
Corfu, F., and Sage R.P. 1992. U-Pb age constraints for deposition of clastic metasedimentary rocks and late tectonic plutonism, Michipicoten Belt, Superior Province. Canadian Journal of Earth Sciences, 29: 1640-1651.
Ciufo, T. J., Yakymchuk, C., Lin, S., Jellicoe, K. & Mercier-Langevin, P. (2018). Hydrothermal alteration and vectors at the orogenic Island Gold deposit, Michipicoten Greenstone Belt, Wawa, Ontario. In Rogers, N. (eds.), Targeted Geoscience Initiative: 2017 report of activities, volume 1, Geological Survey of Canada, Open File, 8358, 117-120. Natural Resources Canada.
Cuifo, T, Hydrothermal Alteration and Exploration Vectors at the Island Gold Deposit, Michipicoten Greenstone Belt, Wawa, Ontario. University of Waterloo Master’s Thesis, 2019.
EBA, 2013, Magino Gold Project – Interim Hydrogeology Baseline Report, March 2013
Edgar, B. (2007). Detailed mapping on the East Main Zone area; Patricia Mining Corporation, Assessment File 20003692.
Gartner, J.F. and McQuay, D.F, Northern Ontario Engineering Geology Terrain Study 73, Goudreau Area (NTS 42C/SE) District of Algoma, Ontario Geological Survey, 1979.
Golder Associates, 2015, SAR Survey Summary Report for Island Gold Mine Dam Raise Project, September 2015.
| | | | | |
Island Gold District – NI 43-101 Technical Report August 6, 2025 | 333
|
____________________________________________________________________________________
Golder Associates, 2017, Feasibility Open Pit Slope Design for the Magino Project, Report Number: 1659673 (4000), April 19, 2017.
Golder Associates, 2020, 19129998 GAL-027_Alamos IG_Terrestrial SAR_Rev3, 10 March 2021.
Haroldson, E.L. (2014). Fluid Inclusions and Stable Isotope Study of Magino; A Magmatic Related Archean Gold Deposit: MSc thesis, University of Wisconsin-Madison: 108 p.
Heather, K. B., 1989. The geological and structural setting of gold mineralization in the Renabie portion of the Missanabie-Renabie gold district, Wawa gold camp; in Summary of Field Work and Other Activities 1989, Ontario Geological Survey, Miscellaneous Paper 146, pages 99-107.
Heather K.B and Arias Z., 1992, Geological and Structural Setting of Gold Mineralization if the Goudreau-Lochalsh Area, Wawa Gold Camp, Ontario Geological Survey Open File Report, 5832, 159p.
IMC, 2022, Magino Gold Projcet NI 43-101 Technical Report Mineral Resource and Mineral Reserve Update, March 3, 2022.
Internal Document, ENV-001, Waste Management SOP Final_Rev3, 8 August 2022.
Internal Document b, Spill Prevention and Contingency Plan_Rev15_Final, September 2023.
DS Energy & Mining Inc., 2017, Feasibility Study Technical Report on the Magino Project, Ontario, Canada. December 21, 2017
JDS, 2017, Feasibility Study Technical Report on the Magino Project, Ontario, Canada, December 21, 2017.
Jellicoe, K, Structural Controls and Deformation History of the Orogenic Island Gold Deposit, Michipicoten Greenstone Belt Ontario, University of Waterloo Master’s Thesis, 2019.
Jellicoe, K., Ciufo, T.J., Lin, S., Wodicka, N., Wu, N., Mercier-Langevin, P., and Yakymchuk, C. (2022). Genesis of the Island Gold Deposit, Ontario, Canada: Implications for Gold Mineralization in the Wawa Subprovince of the Superior Province: Economic Geology, v. 117, no. 7, p. 1597–1612.
Kallio, E.A. (2003). Recent exploration work on the East Extension of the Main Zone, Patricia Mining Corp. Ego Claims; Patricia Mining Corporation, Assessment File 42C02NE2002.
Koskitalo, L. O., 1983. Magino Gold Project, Wawa Area, Ontario. Report presented to McNellen Resources Inc. James Wade Engineering Ltd. Toronto. Project No. WE83 068. Internal Report. 67 pages.
Lorax Environmental, 2022, Magino Mine Waste Rock Metal Leaching and Acid Rock Drainage Management Plan, 12 January 2022.
McClelland Laboratories, 2013, Milling / Cyanidation and Gravity Concentration Testing – Magino Drill Core Composites, December 18, 2013.
| | | | | |
Island Gold District – NI 43-101 Technical Report August 6, 2025 | 334
|
____________________________________________________________________________________
McClelland Laboratories, 2014, Milling / Cyanidation and Gravity Concentration Testing – Magino Ore Grade Drill Core Composites, March 25, 2015
McClelland Laboratories, 2017, Feasibility Study Metallurgical Testing Program – Magino Drill Core Composites, July 11, 2017.
McClelland Laboratories, 2019, Gravity / Cyanidation Testing Results – Magino Drill Core Composites, November 12, 2019.
MacMillan, D. (2012). Diamond drilling on the Ego Property; Richmont Mining Limited, Assessment File 20013748.
McBride, D. E., 1991. Report of the geology, reserves and potential of the Magino Deposit, Finan township, Ontario. Internal Report. 19 pages.
Mole, D.R., Thurston, P.C., Marsh, J.H., Stern, R.A., Ayer, J.A., Martin, L.A.J., and Lu, Y.J. (2021). The formation of Neoarchean continental crust in the south-east Superior Craton by two distinct geodynamic processes: Precambrian Research, v. 356, no. 106104, p. 23.
Montsion, R.M., Thurston, P.C. and Ayer, J.A. 2018. 1:2 000 000 scale geological compilation of the Superior Craton – version 1; Mineral Exploration Research Centre, Harquil School of Earth Sciences, Laurentian University Document Number MERC-ME-2018-017.
Nielsen, F. W., 1995. Summary and Review of Past Work and Options for Future Work, Magino Mine, Wawa Area, Ontario. Report presented to Muscocho Explorations Ltd. Prepared by R. Bruce Graham and Associates Ltd. Internal Report. 38 pages.
Ontario Geological Survey 2011. 1:250 000 scale bedrock geology of Ontario; Ontario Geological Survey, Miscellaneous Release – Data 126 – Revision 1.
Parker, H., 2006, Resource and reserve reconciliation procedures for open pit mines. 2006: AMEC report.
Patterson & Cooke, 2025, Drawing No. 32-0473-PP0000-ME-GAR-0101 Rev 0.pdf, April 11th, 2025.
Perkins, M. J., 1999. Structural Geology and Gold Magino Mine Project, Wawa Area, Ontario. Report prepared for Golden Goose Resources Inc. Internal Report 9 pages.
Qualitica, 2005, Quality Control Review, Island Gold District: Magino Mine, Qualitica Consulting Inc., Report AGI-2025-R01 (Internal Report), May 2025.
Robertson Geoconsultants Inc (2014), 2013 Hydrogeological Field Investigation, Dubreuilville, Ontario.
RockEng, 2024, IGM Geotechnical Mapping and Site Characterization Update, RockEng Report #23004-101, March 28th, 2024.
Ross, A.F., 2011. Mineral Resource Estimate, Magino Gold Project, Sault Ste. Marie Mining District, Ontario. Report presented to Prodigy Gold Inc. Report prepared by Snowden Mining Industry Consultants Inc. Report published on SEDAR website dated 28 February 2011. 93 pages.
| | | | | |
Island Gold District – NI 43-101 Technical Report August 6, 2025 | 335
|
____________________________________________________________________________________
RPA and W.A. Hubacheck Consultants, 2004, Technical Report on the Island Deposit Mineral Resource Estimate, Ontario, prepared for Patricia Mining Corp., Roscoe Postle Associates Inc., Luke Evans, and W.A. Hubacheck Consultant – Peter C. Hubacheck, November 29, 2004
Sage, R. P., 1993. Geology of Aguonie, Bird, Finan and Jacobson townships, District of Algoma. Ontario Geological Survey, Open File Report 5588, 286 pages.
Sage, R. P., 1993a. Geology of Abotossaway, Corbiere, LeClaire and Musquash and part of Dunphy township. Ontario Geological Survey, Open File Report 5587, 308 pages.
Sage, R. P., 1993b. Precambrian geology Aguonie Township. Ontario Geological Survey, Open File Map 217, Scale 1: 15 840.
Sage, R. P., 1994. Geology of the Michipicoten greenstone belt. Ontario Geological Survey, Open File Report 5888, 592 pages.
Sage, R. P., Lightfoot, P. C., and Doherty, W., 1996a. Bimodal cyclical Archean basalts and rhyolites from the Michipicoten(Wawa) greenstone belt, Ontario: Geochemical evidence for magma contributions from asthenospheric mantle and ancient continental lithosphere near southern margin of the Superior Province. Precambrian Research, v. 76, page 119-153.
Sage, R. P., Lightfoot, P. C., and Doherty, W., 1996b. Geochemical characteristics of granitoid rocks from within Archean Michipicoten greenstone belt, Wawa Subprovince, Superior Province, Canada: Imlications for source regions and tectonic evolution. Precambrian Research, v. 76, page 155-190.
SLR, 2016, Magino TSD-17-Terrestrial Ecology Baseline, November 2016
SLR, 2016b, Magino Gold Project Environmental Management System Mine Material Management Plan Technical Support Document 20-8, November 2016.
Tindale, J.L. (1988). Summary report on the Ego Resources Limited Mining Property, Abotossaway Township, Sault Ste. Marie Mining Division, District of Algoma, Ontario, Canada; Ego Resources Limited, Assessment File 42C02NE0200.
Turcotte, B., and Pelletier, C., 2009. Technical Report and Mineral Resource Estimate for the Magino Mine (according to Regulation 43-101 and 43-101F1). Report prepared by InnovExplo for Golden Goose Resources Inc. Report published on SEDAR website dated 29 May, 2009. 116 pages.
Turcotte, B., Pelletier, C., and Poirier S., 2010. Technical Report on the Preliminary Economic Assessment prepared by InnovExplo for Golden Goose Resources Inc. Unpublished draft report dated 3 June, 2010. Internal Report, Golden Goose Resources Inc. 176 pages.
Turek, A., Sage, R.P., and Schmus, W.R.V., (1992), Advances in the U-Pb zircon geochronology of the Michipicoten greenstone belt, Superior province, Ontario: Canadian Journal of Earth Sciences, v. 29, p. 1154–1165.
Vice, L.E.D., Perrouty, S., and Robichaud, L., 2022, Project NE-22-002. Introduction to a Geochronological and Structural Study of Supracrustal Assemblages in the Northeastern Michipicoten Greenstone Belt: Ontario Geological Survey Summary of Field Work and Other Activities 6390, p.8–1 to 8–8.
| | | | | |
Island Gold District – NI 43-101 Technical Report August 6, 2025 | 336
|
____________________________________________________________________________________
Williams, H.R., Scott, G.M., Heather, K.B., Muir, T.L., Sage, R.P. 1991. Wawa Subprovince. Chapter 12 in Geology of Ontario. Edited by P.C. Thurston, H.R. Williams, R.H. Sutcliffe, and G.M. Stott. Ontario Geological Survey, Special Volume 4, Part 1, pp. 485- 539.
Wood, 2017, 2017 Desktop Study of ML/ARD Waste Rock and Tailings Island Gold Mine. Prepared for. Richmont Mines Inc – Island Gold Division 25 August 2017
Wood, 2018, Geochemical and geotechnical characterization of historic tailings. Island Gold Mine. Prepared for: Alamos Gold Inc. – Island Gold Division. 26 September 2018.
Wood, 2019, Geochemical characterization of surface waste rock stockpile. Island Gold Mine. Prepared for: Alamos Gold Inc. – Island Gold Division. 12 March 2019.
WSP, 2024, Prodigy Gold Inc. Magino Project Closure Plan Amendment, August 2024
| | | | | |
Island Gold District – NI 43-101 Technical Report August 6, 2025 | 337
|
____________________________________________________________________________________
28 UNITS OF MEASURE, ABBREVIATIONS AND ACRONYMS
28.1 Abbreviations and Acronyms
| | | | | |
| Abbreviation / Acronyms | Description |
| AARL | Anglo American Research Laboratories |
| Accurassay | Accurassay Laboratories Ltd. |
| Actlabs | Activision Laboratories Ltd. |
| ADR | Adsorption-desorption-recovery |
| Ag | Silver |
| AGAT | AGAT Laboratories Ltd. |
| Alamos | Alamos Gold Inc. |
| Algoma | Algoma Ore Properties Limited |
| ALS | ALS Canada Ltd. |
| ALS Chemex | ALS Ltd. |
| API | Algoma Power Inc. |
| Argonaut | Argonaut Gold Inc. |
| Au | Gold |
| AWG | American wire gauge |
| BML | Base Metallurgical Laboratories Ltd. |
| Bureau Veritas | Bureau Veritas Canada Inc. |
| C$ | Canadian dollars |
| CaO | Calcium oxide / lime |
| Cavendish | Cavendish Investing Ltd. |
| CCME | Canadian Council of Ministers of the Environment |
| CDA | Canadian Dam Association |
| CEAA | Canadian Environmental Assessment Agency |
| CIL | Carbon in leach |
| CIM | Canadian Institute of Mining, Metallurgy and Petroleum |
| CIP | Carbon-in-pulp |
| CNAG | Chert non-acid generating |
| CNG | Compressed natural gas |
| CNWAD | Weak acid dissociable cyanides |
| COG | Cut-off grade |
| CRF | Cemented rock fill |
| CRM | Certified reference materials |
| CSA | Canadian Securities Administrators |
| CSV | Comma separated value |
CuSO4 | Copper sulphate |
| DA | Dynamic anisotropy |
| District | Island Gold District |
| | | | | |
Island Gold District – NI 43-101 Technical Report August 6, 2025 | 338
|
____________________________________________________________________________________
| | | | | |
| Abbreviation / Acronyms | Description |
| EA | Environmental assessment |
| E-GRG | Extended gravity gold recovery (or extended gravity recoverable gold) |
| EIS | Environmental impact statement |
| ESDM | Emission summary and dispersion modelling |
| FAAA | Flame atomic absorption assay |
| FAR | Fresh Air Raise |
| FEL | Front-end loader |
| Franco-Nevada | Franco-Nevada Corporation |
| G&A | General and Administrative |
| GHG | Green house gas |
| GLDZ | Goudreau Lake Deformation Zone |
| Golden Goose | Golden Goose Resources Inc. |
| GPS | Global positioning system |
| GRG | Gravity gold recovery (or gravity recoverable gold) |
| HCL | Hydrochloric acid |
| ICP | Inductively coupled plasma |
| ID2 | Inverse distance squared |
| ID3 | Inverse distance cubed |
| IEC | International Electrotechnical Commission |
| ILR | Intensive leaching reactor |
| Island Gold | Island Gold Mine |
| ISO | International Standards Organization |
| LabExpert | Laboratorie Expert Inc. |
| LiDAR | Light detection and ranging |
| LOM | Life of Mine |
| LTE | Long-term evolution |
| LVA | Locally varying anisotropy |
| Magino | Magino Gold Mine |
| McNellen | McNellen Resources Incorporated |
| MDMER | Metal and Diamond Mining Effluent Regulations |
| MECP | Ministry of the Environment, Conservation and Parks |
| MEM | Ontario Ministry of Energy and Mines |
| MGB | Michipicoten Greenstone Belt |
| MLO | Mining Licenses of Occupation |
| MMMP | Mined materials management plan |
| MNR | Ministry of Natural Resources |
| MRMF | Mine rock management facility |
| MSA Labs | MSALABS Inc. |
| MWG Mines | McCarthy-Webb Goudreau Mines Ltd. |
| NaCN | Sodium cyanide |
| | | | | |
Island Gold District – NI 43-101 Technical Report August 6, 2025 | 339
|
____________________________________________________________________________________
| | | | | |
| Abbreviation / Acronyms | Description |
| NAD | North American Datum |
| NaOH | Sodium hydroxide or caustic soda |
| NI 43-101 | National Instrument 43-101, Standards of Disclosure for Mineral Projects |
| NN | Nearest neighbour |
| NAG | Non-acid generating |
| NPR | Neutralization potential ratio |
| NPV | Net present value |
| NSR | Net smelter return |
| OK | Ordinary kriging |
| Osisko | Osisko Gold Royalties Ltd. |
| PAG | Potentially acid generating |
| Patricia | Patricia Mining Corp. |
| PDF | Portable document format |
| PPM | Parts per million |
| Prodigy | Prodigy Gold Inc. |
| QA/QC | Quality assurance / quality control |
| QP | Qualified Person |
| Qualitica | Qualitica Consulting Inc. |
| RAR | Return Air Raise |
| Richmont | Richmont Mining Corp. |
| RC | Reverse circulation |
| RMR | Rock mass rating |
| ROM | Run of mine |
| RQD | Rock quality designation |
S2 | Sulphide Sulphur |
| SAG | Semi-Autogenous Grinding (mills) |
| SEDAR+ | System for Electronic Document Analysis and Retrieval |
| SMBS | Sodium metabisulphide |
SO2 | Sulphur dioxide |
| SWSF | Southwest storage facility |
| TMF | Tailings management facility |
| US$ | United States Dollars |
| UCF | Unconsolidated Rock Fill |
| UCS | Uniaxial compressive strength |
| UDS | Underground distribution system |
| UTM | Universal transverse mercator |
| VLF | Very low frequency |
| VoIP | Voice over internet protocol |
| Wesdome | Wesdome Gold Mines Inc. |
| WLS | Webb Lake Stock |
| | | | | |
Island Gold District – NI 43-101 Technical Report August 6, 2025 | 340
|
____________________________________________________________________________________
| | | | | |
| Abbreviation / Acronyms | Description |
| WQCP | Water quality control pond |
| YD Lab | Young-Davidson Mine assay laboratory |
28.2 Units of Measurement
| | | | | |
| Abbreviation / Acronyms | Description |
| ˚ | Degrees |
| ˚C | Degrees Celsius |
| % | Percent |
| cfm | Cubic feet per minute |
| µm | Micrometre (Micron) |
| G-Force | Gravitational force equivalent |
| g/L | Grams per litre |
| g/t | Grams per tonne |
| h | Hour |
| ha | Hectare |
| hp | Horsepower |
| kg | Kilogram |
| Kg/t | Kilogram per tonne |
| km | Kilometre |
| Km/h | Kilometre per hour |
km2 | Square kilometre |
| kPa | Kilopascal |
| kt | Thousand tonnes |
| kV | Kilovolt |
| kW | Kilowatt |
| kWh/t | Kilowatt hour per tonne |
| L | Litre |
| L/min | Litre per minute |
| m | Metre |
| m/h | Metres per hour |
| Ma | Million years |
m2 | Square metre |
m3 | Cubic metre |
m3/h | Cubic metre per hour |
| Ma | Millions of Years Before Present |
| masl | Metres above sea level |
| MBtu | Million British thermal units |
| | | | | |
Island Gold District – NI 43-101 Technical Report August 6, 2025 | 341
|
____________________________________________________________________________________
| | | | | |
| Abbreviation / Acronyms | Description |
| mg/L | Milligram per litre |
| mL | Millilitre |
| mm | Millimetre |
| Mm/s | Millimetre per second |
| MPa | Megapascal |
| m/s | Metre per second |
| MVA | Megavolt amperes |
| MW | Megawatt |
| oz | Troy ounce |
| ppb | Parts per billion |
| ppm | Parts per million |
| t | Tonnes |
t/m3 | Tonnes per cubic metre |
| tpd | Tonnes per day |
| tpy | Tonnes per year |
| µm | micron |
| UCF | Unconsolidated rock fill |
| V | Volt |
| VLF | Very low frequency |
| w/w | Weight for weight |
| | | | | |
Island Gold District – NI 43-101 Technical Report August 6, 2025 | 342
|
____________________________________________________________________________________
29 CERTIFICATES OF QUALIFIED PERSONS
| | | | | |
Island Gold District – NI 43-101 Technical Report August 6, 2025 | 343
|
____________________________________________________________________________________
CERTIFICATE OF QUALIFIED PERSON
I, Christopher John Bostwick, B.Sc., FAusIMM, as an author of this report entitled "2025 Base Case Island Gold District NI 43-101 Technical Report, Dubreuilville, Ontario, Canada" prepared for Alamos Gold Inc. and with an effective date of June 23rd, 2025, do hereby certify that:
1.I am employed as Senior Vice President, Technical Services for Alamos Gold Inc., located at 181 Bay Street, Suite 3910, Toronto, Ontario, M5J 2T3;
2.I received a Bachelor of Applied Science in Mining Engineering from Queen's University (Ontario, Canada) in 1986;
3.I am a registered Fellow of the Australasian Institute of Mining and Metallurgy (FAusIMM no 306761). I have worked for mine operating companies for more than 35 years since my graduation. I have worked mainly in operations, project development, technical services, and corporate development for Rio Tinto, Barrick Gold Corporation and Alamos Gold Inc., with increasing levels of responsibilities;
4.I have read the definition of "qualified person" set out in National Instrument 43-101 ("NI 43-101") and certify that by reason of my education, affiliation with a professional association (as defined in NI 43-101) and past relevant work experience, I fulfill the requirements to be a "qualified person" for the purposes of NI 43-101;
5.I have been an employee of Alamos since January 2009;
6.I last visited the Island Gold District Property on June 19th, 2025;
7.I am the author of Sections 2, 3, 4, 5, 13, 17, 19, 22, and 24, and co-author of Sections 1, 15, 16, 25, 26 and 27 of the NI 43-101 report entitled “2025 Base Case Island Gold District NI 43-101 Technical Report, Dubreuilville, Ontario, Canada", with an effective date of June 23rd, 2025;
8.I have no personal knowledge, as of the date of this certificate, of any material fact or change, which is not reflected in this report;
9.I am not independent of the issuer, as described in Section 1.5 of NI 43-101;
10.I have prepared this Technical Report in compliance with National Instrument 43-101 and in conformity with generally accepted Canadian mining industry practices. As of the date of this certificate, to the best of my knowledge, information and belief, the Technical Report contains all scientific and technical information that is required to be disclosed to make the Technical Report not misleading; and
11.I consent to the filing of the Technical Report with any stock exchange and other regulatory authority and any publication by them for regulatory purposes, including electronic publication in the public company files on their websites accessible by the public.
Dated this 6th day of August, 2025
(Signed) “Christopher John Bostwick”
(Original signed)
Christopher John Bostwick, FAusIMM (FAusIMM no 306761)
| | | | | |
Island Gold District – NI 43-101 Technical Report August 6, 2025 | 344
|
____________________________________________________________________________________
CERTIFICATE OF QUALIFIED PERSON
I, Nathan Eugene Gerard Bourgeault, M.Eng, P.Eng., PMP, as an author of this report entitled “2025 Base Case Island Gold District NI 43-101 Technical Report, Dubreuilville, Ontario, Canada” prepared for Alamos Gold Inc. and with an effective date of June 23rd, 2025, do hereby certify that:
1.I am a licensed Mining Engineer employed for Alamos Gold Inc. as Technical Services Manager, Engineering of the Island Gold District, located at Goudreau Road, Dubreuilville, Ontario;
2.I received a Bachelor of Engineering in Mining Engineering from Laurentian University (Ontario, Canada) in 2007 and a Master of Engineering with a specialization in Natural Resources Engineering from Laurentian University (Ontario, Canada) in 2014;
3.I am a registered member of the Professional Engineers of Ontario (PEO licence no 100149936). I have worked as an Engineer for more than 18 years since my graduation. I have worked mainly in project development and operations in the mining industry for different companies with increasing levels of responsibilities;
4.I have read the definition of “qualified person” set out in National Instrument 43-101 (“NI 43-101”) and certify that by reason of my education, affiliation with a professional association (as defined in NI 43-101) and past relevant work experience, I fulfill the requirements to be a “qualified person” for the purposes of NI 43-101;
5.I have worked at the Island Gold District since December, 2017;
6.I am the author of Sections 18 and 21, and co-author of Sections 1, 15, 16, 25, 26, and 27 of the NI 43-101 report entitled “2025 Base Case Island Gold District NI 43-101 Technical Report, Dubreuilville, Ontario, Canada " with an effective date of June 23rd, 2025;
7.I have no personal knowledge, as of the date of this certificate, of any material fact or change, which is not reflected in this report;
8.I am not independent of the issuer, as described in Section 1.5 of NI 43-101;
9.I have prepared this Technical Report in compliance with National Instrument 43-101 and in conformity with generally accepted Canadian mining industry practices. As of the date of this certificate, to the best of my knowledge, information and belief, the Technical Report contains all scientific and technical information that is required to be disclosed to make the Technical Report not misleading; and
10.I consent to the filing of the Technical Report with any stock exchange and other regulatory authority and any publication by them for regulatory purposes, including electronic publication in the public company files on their websites accessible by the public.
Dated this 6th day of August, 2025
(Signed & Sealed) “Nathan Eugene Gerard Bourgeault”
(Original signed and sealed)
Nathan Eugene Gerard Bourgeault, P.Eng. (PEO no 100149936)
| | | | | |
Island Gold District – NI 43-101 Technical Report August 6, 2025 | 345
|
____________________________________________________________________________________
CERTIFICATE OF QUALIFIED PERSON
I, Tyler Joseph Poulin, B.Sc., P.Geo, as an author of this report entitled "2025 Base Case Island Gold District NI 43-101 Technical Report, Dubreuilville, Ontario, Canada " prepared for Alamos Gold Inc. and with an effective date of June 23rd, 2025, do hereby certify that:
1.I am employed as Geology Superintendent of Island Gold District, for Alamos Gold Inc., located at Goudreau Road, Dubreuilville, Ontario;
2.I received a Bachelor of Earth Science from Laurentian University (Ontario, Canada) in 2014;
3.I am a registered member of the Professional Geoscientists Ontario (PGO no 3039). I have worked as a Geologist for more than 10 years since my graduation. I have worked mainly in exploration and operations geology with increasing levels of responsibilities;
4.I have read the definition of "qualified person" set out in National Instrument 43-101 ("NI 43-101") and certify that by reason of my education, affiliation with a professional association (as defined in NI 43-101) and past relevant work experience, I fulfill the requirements to be a "qualified person" for the purposes of NI 43-101;
5.I have been an employee of Alamos since November, 2014;
6.I have been working at the Island Gold District Property for the past 10 years.
7.I am the author of Sections 6-12, and 23, and co-author of Sections 1, 14, and 25-27 of the NI 43-101 report entitled "2025 Base Case Island Gold District NI 43-101 Technical Report, Dubreuilville, Ontario, Canada " with an effective date of June 23rd, 2025;
8.I have no personal knowledge, as of the date of this certificate, of any material fact or change, which is not reflected in this report;
9.I am not independent of the issuer, as described in Section 1.5 of NI 43-101;
10.I have prepared this Technical Report in compliance with National Instrument 43-101 and in conformity with generally accepted Canadian mining industry practices. As of the date of this certificate, to the best of my knowledge, information and belief, the Technical Report contains all scientific and technical information that is required to be disclosed to make the Technical Report not misleading; and
11.I consent to the filing of the Technical Report with any stock exchange and other regulatory authority and any publication by them for regulatory purposes, including electronic publication in the public company files on their websites accessible by the public.
Dated this 6th day of August, 2025
(Signed & Sealed) “Tyler Joseph Poulin
(Original signed and sealed)
Tyler Joseph Poulin, P.Geo (PGO no 3039)
| | | | | |
Island Gold District – NI 43-101 Technical Report August 6, 2025 | 346
|
____________________________________________________________________________________
CERTIFICATE OF QUALIFIED PERSON
I, Jeffrey Volk, M.Sc. CPG, FAuslMM, as an author of this report entitled “2025 Base Case Island Gold District NI 43-101 Technical Report, Dubreuilville, Ontario, Canada” prepared for Alamos Gold Inc. (“Alamos”) and with an effective date of June 23rd, 2025, do hereby certify that:
1.I am employed as Director, Reserves and Resources for Alamos, located at 181 Bay Street, Suite 3910, Toronto, Ontario, M5J 2T3;
2.I graduated with a Master of Science degree in Structural Geology from the Washington State University in 1986. In addition, I have obtained a Bachelor of Arts degree in geology from the University of Vermont in 1983. I have over 36 years of operational and consulting experience and continuous employment in the minerals industry, specifically in mineral resource estimation, production geology, feasibility studies and economic evaluations. I am knowledgeable in all aspects of public reserve/resource disclosure and compliance. I have completed resource modelling, due diligence, acquisition and evaluations assignments for precious and base metals, platinum group metals, laterite and uranium in Russia and the Former Soviet Union, Australia, Africa, Peru, Philippines, Mexico, Chile and North America gained with Barrick Gold, SRK and Alamos;
3.I am a fellow of the Society of Economic Geologists and a Certified Professional Geologist and member of the American Institute of Professional Geologists (AIPG #CPG-10835). I am also a Fellow and Member of the Australian Institute of Mining and Metallurgy (FAusIMM #304113);
4.I have read the definition of “qualified person” set out in National Instrument 43-101 (“NI 43-101”) and certify that by reason of my education, affiliation with a professional association (as defined in NI 43-101) and past relevant work experience, I fulfill the requirements to be a “qualified person” for the purposes of NI 43-101;
5.I have been an employee of Alamos since August 2012;
6.I last visited the Island Gold District Property from May 12th to 14th, 2025;
7.I am the co-author of Sections 1, 14, 25, 26 and 27 of the NI 43-101 report entitled “2025 Base Case Island Gold District NI 43-101 Technical Report, Dubreuilville, Ontario, Canada” with an effective date of June 23rd, 2025;
8.I have no personal knowledge, as of the date of this certificate, of any material fact or change, which is not reflected in this report;
9.I am not independent of the issuer, as described in Section 1.5 of NI 43-101;
10.I have prepared this Technical Report in compliance with National Instrument 43-101 and in conformity with generally accepted Canadian mining industry practices. As of the date of this certificate, to the best of my knowledge, information and belief, the Technical Report contains all scientific and technical information that is required to be disclosed to make the Technical Report not misleading; and
11.I consent to the filing of the Technical Report with any stock exchange and other regulatory authority and any publication by them for regulatory purposes, including electronic publication in the public company files on their websites accessible by the public.
Dated this 6th day of August, 2025
(Signed & Sealed) “Jeffrey Volk”
(Original signed and sealed)
Jeffrey Volk, M.Sc. CPG, FAuslMM (FAusIMM no 304113)
| | | | | |
Island Gold District – NI 43-101 Technical Report August 6, 2025 | 347
|
____________________________________________________________________________________
CERTIFICATE OF QUALIFIED PERSON
I, David Nicholas Bucar, M.Sc. P.Eng., as an author of this report entitled “2025 Base Case Island Gold District NI 43-101 Technical Report, Dubreuilville, Ontario, Canada” prepared for Alamos Gold Inc.(“Alamos”) and with an effective date of June 23rd, 2025, do hereby certify that:
1.I am employed as Director, Environmental Sustainability for Alamos, located at 181 Bay Street, Suite 3910, Toronto, Ontario, M5J 2T3;
2.I received a Bachelor of Applied Science in Civil Engineering from Queen’s University (Ontario, Canada) in 1996 and Masters of Applied Science in Environmental Engineering from Queen’s University (Ontario, Canada) in 1997;
3.I am a registered Professional Engineer in Ontario, Canada, (P. Eng. no 90474008). I have worked for mine operating companies for more than 23 years since my graduation. I have worked mainly in environmental, project management, and operations, for Kinross, Placer Dome, Goldcorp, Newmont and Alamos, with increasing levels of responsibilities;
4.I have read the definition of “qualified person” set out in National Instrument 43-101 (“NI 43-101”) and certify that by reason of my education, affiliation with a professional association (as defined in NI 43-101) and past relevant work experience, I fulfill the requirements to be a “qualified person” for the purposes of NI 43-101;
5.I have been an employee of Alamos since January 2021;
6.I last visited the Island Gold District on June 11th, 2025;
7.I am the author of Section 20 and co-author of Sections 1, 25, 26, and 27 of the NI 43-101 report entitled “2025 Base Case Island Gold District NI 43-101 Technical Report, Dubreuilville, Ontario, Canada " with an effective date of June 23rd, 2025;
8.I have no personal knowledge, as of the date of this certificate, of any material fact or change, which is not reflected in this report;
9.I am not independent of the issuer, as described in Section 1.5 of NI 43-101;
10.I have prepared this technical report in compliance with NI 43-101 and in conformity with generally accepted Canadian mining industry practices. As of the date of this certificate, to the best of my knowledge, information and belief, the technical report contains all scientific and technical information that is required to be disclosed to make the technical report not misleading; and
11.I consent to the filing of the technical report with any stock exchange and other regulatory authority and any publication by them for regulatory purposes, including electronic publication in the public company files on their websites accessible by the public.
Dated this 6th day of August, 2025
(Signed & Sealed) “David Nicholas Bucar”
(Original signed and sealed)
David Nicholas Bucar, M.Sc., P.Eng. (P.Eng. no 90474008)
| | | | | |
Island Gold District – NI 43-101 Technical Report August 6, 2025 | 348
|