Shareholder Report
|
12 Months Ended |
|
May 31, 2025
USD ($)
Holding
|
|---|
| Shareholder Report [Line Items] |
|
| Document Type |
N-CSR
|
| Amendment Flag |
false
|
| Registrant Name |
Ultimus Managers Trust
|
| Entity Central Index Key |
0001545440
|
| Entity Investment Company Type |
N-1A
|
| Document Period End Date |
May 31, 2025
|
| C000202991 |
|
| Shareholder Report [Line Items] |
|
| Fund Name |
Adler Value Fund
|
| Class Name |
Institutional Class
|
| Trading Symbol |
ADLVX
|
| Annual or Semi-Annual Statement [Text Block] |
This annual shareholder report contains important information about Adler Value Fund for the period of June 1, 2024 to May 31, 2025.
|
| Shareholder Report Annual or Semi-Annual |
Annual Shareholder Report
|
| Additional Information [Text Block] |
You can find additional information about the Fund at https://www.adlervaluefund.com/fund-literature. You can also request this information by contacting us at (800) 408-4682.
|
| Additional Information Phone Number |
(800) 408-4682
|
| Additional Information Website |
https://www.adlervaluefund.com/fund-literature
|
| Expenses [Text Block] |
What were the Fund’s annualized costs for the last year?(based on a hypothetical $10,000 investment) Fund Name | Costs of a $10,000 investment | Costs paid as a percentage of a $10,000 investment |
|---|
Adler Value Fund - Institutional Class | $130 | 1.25% |
|---|
|
| Expenses Paid, Amount |
$ 130
|
| Expense Ratio, Percent |
1.25%
|
| Factors Affecting Performance [Text Block] |
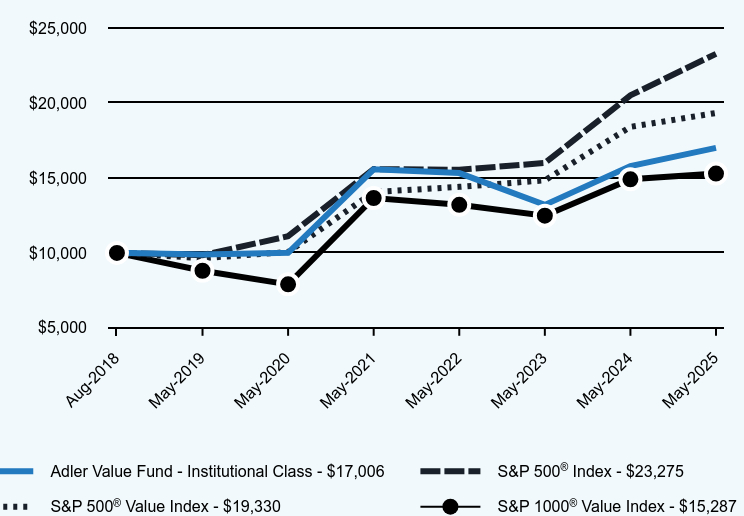
How did the Fund perform during the reporting period? As the fiscal year progressed, the market narrative began to shift from inflation, the slowing pace of growth in the U.S. economy, and the likelihood and number of cuts in the federal funds rate to include the impact of trade and tariff policies on the U.S. economy. With continued U.S. job growth, moderate U.S. unemployment, and U.S. inflation above the Federal Reserve’s 2% target, the U.S. capital markets reflected expectations for fewer federal funds rate cuts. This development was balanced against the impact of tariff and trade policies. This competition between the level of interest rates (higher for longer) and the relative strength of the U.S. economy (continued growth vs. possibility of a recession) remained a durable theme in U.S. equity markets. For the fiscal year ended May 31, 2025, the Fund’s performance reflected its differences with the S&P 500® Index. The Fund owns one Megacap company (defined by S&P as the top 50 market capitalization companies in the S&P 500® Index) representing 0.3% of the Fund’s assets. Megacap companies represent in excess of 50% of the S&P 500® Index. Information Technology represents 32% of the S&P 500® Index. Information Technology companies represent 2.5% of the Fund’s assets. The Fund’s holdings in the S&P 500® Index represent 45% of the Fund’s assets. The mean market capitalization of the S&P 500® Index is approximately $104 billion. The Fund’s weighted average mean market capitalization is approximately $48 billion. |
| Performance Past Does Not Indicate Future [Text] |
The Fund's past performance is not a good predictor of how the Fund will perform in the future.
|
| Line Graph [Table Text Block] |
| Adler Value Fund - Institutional Class | S&P 500® Index | S&P 500® Value Index | S&P 1000® Value Index |
|---|
Aug-2018 | $10,000 | $10,000 | $10,000 | $9,997 |
|---|
May-2019 | $9,890 | $9,844 | $9,644 | $8,807 |
|---|
May-2020 | $10,000 | $11,108 | $10,051 | $7,898 |
|---|
May-2021 | $15,578 | $15,587 | $14,055 | $13,658 |
|---|
May-2022 | $15,321 | $15,540 | $14,402 | $13,202 |
|---|
May-2023 | $13,201 | $15,994 | $14,837 | $12,477 |
|---|
May-2024 | $15,787 | $20,502 | $18,403 | $14,905 |
|---|
May-2025 | $17,006 | $23,275 | $19,330 | $15,287 |
|---|
|
| Average Annual Return [Table Text Block] |
| 1 Year | 5 Years | Since Inception (August 16, 2018) |
|---|
Adler Value Fund - Institutional Class | 7.72% | 11.20% | 8.14% |
|---|
S&P 500® Index | 13.52% | 15.94% | 13.25% |
|---|
S&P 500® Value Index | 5.04% | 13.97% | 10.19% |
|---|
S&P 1000® Value Index | 2.48% | 14.12% | 6.45% |
|---|
|
| Performance Inception Date |
Aug. 16, 2018
|
| No Deduction of Taxes [Text Block] |
The graph and table do not reflect the deduction of taxes that a shareholder would pay on fund distributions or redemption of fund shares.
|
| AssetsNet |
$ 3,918,923
|
| Holdings Count | Holding |
39
|
| Advisory Fees Paid, Amount |
$ 0
|
| InvestmentCompanyPortfolioTurnover |
22.00%
|
| Additional Fund Statistics [Text Block] |
- Net Assets$3,918,923
- Number of Portfolio Holdings39
- Advisory Fee (net of waivers)$0
- Portfolio Turnover22%
|
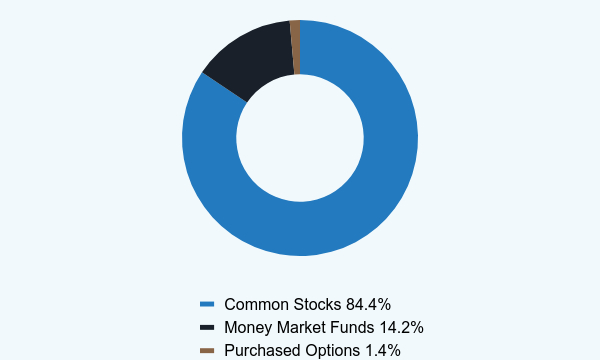
| Holdings [Text Block] |
Asset Weighting (% of total investments)Value | Value |
|---|
Common Stocks | 84.4% | Money Market Funds | 14.2% | Purchased Options | 1.4% |
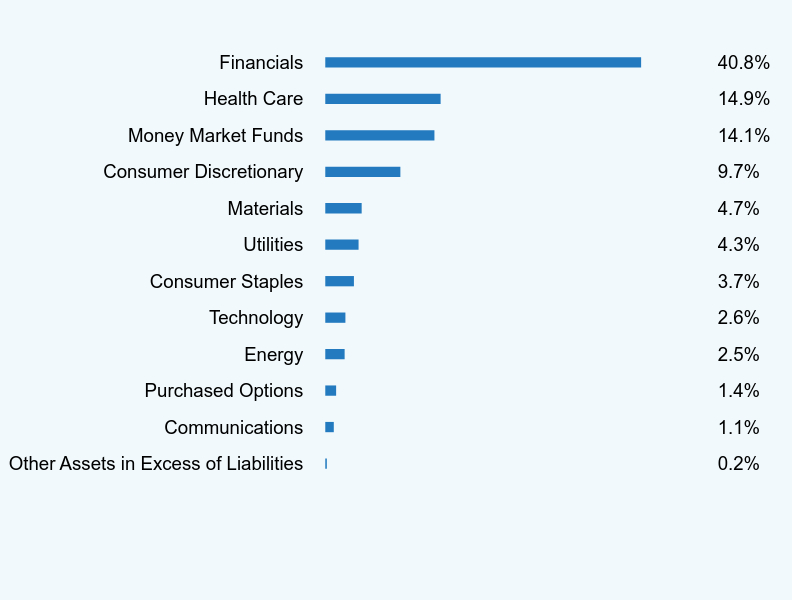
Sector Weighting (% of net assets)Value | Value |
|---|
Other Assets in Excess of Liabilities | 0.2% | Communications | 1.1% | Purchased Options | 1.4% | Energy | 2.5% | Technology | 2.6% | Consumer Staples | 3.7% | Utilities | 4.3% | Materials | 4.7% | Consumer Discretionary | 9.7% | Money Market Funds | 14.1% | Health Care | 14.9% | Financials | 40.8% |
Top 10 Holdings (% of net assets)Holding Name | % of Net Assets |
|---|
Jackson Financial, Inc. - Class A | 11.5% |
|---|
Aflac, Inc. | 6.6% |
|---|
Equitable Holdings, Inc. | 6.5% |
|---|
Citigroup, Inc. | 6.2% |
|---|
Charles Schwab Corporation (The) | 6.1% |
|---|
Coupang, Inc. | 5.4% |
|---|
Alibaba Group Holding Ltd. - ADR | 4.3% |
|---|
PG&E Corporation | 4.3% |
|---|
Walgreens Boots Alliance, Inc. | 3.7% |
|---|
XP, Inc. - Class A | 3.5% |
|---|
|
| Material Fund Change [Text Block] |
No material changes occurred during the year ended May 31, 2025. |
| C000234765 |
|
| Shareholder Report [Line Items] |
|
| Fund Name |
Evolutionary Tree Innovators Fund
|
| Class Name |
A Class Shares
|
| Trading Symbol |
INVTX
|
| Annual or Semi-Annual Statement [Text Block] |
This annual shareholder report contains important information about Evolutionary Tree Innovators Fund (the "Fund") for the period of June 1, 2024 to May 31, 2025.
|
| Shareholder Report Annual or Semi-Annual |
Annual Shareholder Report
|
| Additional Information [Text Block] |
You can find additional information about the Fund at https://mutualfund.evolutionarytree.com/resources-materials. You can also request this information by contacting us at (833) 517-1010.
|
| Additional Information Phone Number |
(833) 517-1010
|
| Additional Information Website |
<span style="font-weight: 700; box-sizing: border-box; color: rgb(63, 69, 62); display: inline; flex-wrap: nowrap; font-size: 10.6667px; grid-area: auto; line-height: 16px; margin: 0px; overflow: visible; text-align: left; text-align-last: auto; white-space-collapse: preserve-breaks;">https://mutualfund.evolutionarytree.com/resources-materials</span>
|
| Expenses [Text Block] |
What were the Fund’s annualized costs for the last year?(based on a hypothetical $10,000 investment) Class Name | Costs of a $10,000 investment | Costs paid as a percentage of a $10,000 investment |
|---|
A Class
Shares | $136 | 1.22% |
|---|
|
| Expenses Paid, Amount |
$ 136
|
| Expense Ratio, Percent |
1.22%
|
| Factors Affecting Performance [Text Block] |
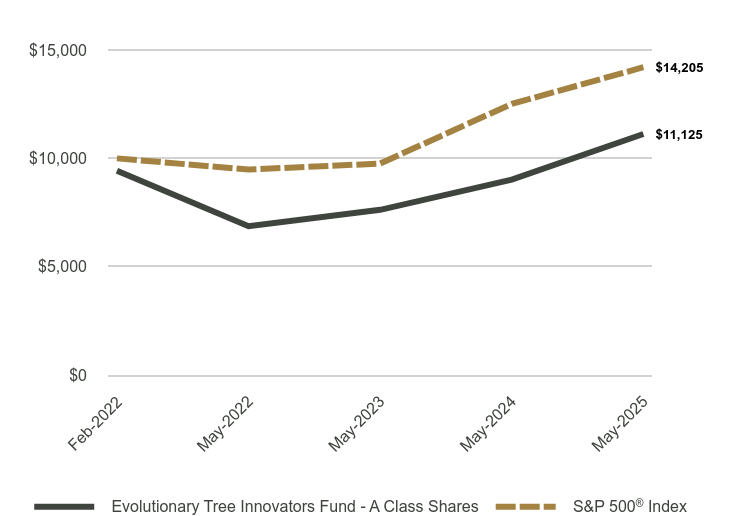
How did the Fund perform during the reporting period? The Fund delivered positive investment results for the fiscal year, significantly ahead of the benchmark despite various economic headwinds. Across holdings, business fundamentals continue to be strong (revenue growth of 20-25% growth on average) and the companies in aggregate are expanding margins while reinvesting in their businesses, sustaining healthy earnings growth. These are the signals we focus on as long-term investors, and it is gratifying to see business drivers contributing to investment results. The strong business results by Fund holdings were sustained despite multiple geopolitical headwinds, including the trade war. We believe many portfolio holdings are well-positioned because of the following characteristics we tend to prioritize, such as: 1. Secular growth drivers: We believe each company in the portfolio benefits from a combination of multi-year secular trends and important innovations—growth drivers that are less reliant on the general economy—that can sustain growth over coming years. 2. Mission-critical businesses: We own many companies whose products or services are essential to their customers—often viewed as “must have” solutions versus “nice to have.” 3. Pricing power: Companies we own in the portfolio often have pricing power—the ability to pass on higher costs (such as tariffs) or adjust their pricing to protect profitability. 4. Imperative demand drivers: We own a number of companies that are experiencing durable demand because their offerings are “imperative” in the current environment. Clear-cut examples include cybersecurity, AI technology, and public safety technology. 5. Resilient business models with lower risk of supply chain disruption: While no business is entirely immune to broader economic pressures, the majority of our companies held in the portfolio have durable, recurring-revenue business models that tend to be less sensitive to dips in spending. Our assessment of supply chain risk also reveals a generally lower risk of disruption for our companies. We want you to know that we remain at the helm and are navigating various headwinds in a thoughtful and prudent fashion. As you might expect, we recommend staying the course as history has shown that markets eventually recover from various economic and geopolitical events—and that reacting to them out of fear can lead to sub-optimal outcomes. Overall, we remain confident in Fund holdings because they are generally supported by long term secular growth drivers, in many cases have mission critical products, often exhibit pricing power, and predominantly offer recurring revenue models with limited supply chain exposure. |
| Line Graph [Table Text Block] |
| Evolutionary Tree Innovators Fund - A Class Shares | S&P 500® Index |
|---|
Feb-2022 | $9,427 | $10,000 |
|---|
May-2022 | $6,868 | $9,484 |
|---|
May-2023 | $7,626 | $9,761 |
|---|
May-2024 | $9,020 | $12,513 |
|---|
May-2025 | $11,125 | $14,205 |
|---|
|
| Average Annual Return [Table Text Block] |
| 1 Year | Since Inception (February 28, 2022) |
|---|
Evolutionary Tree Innovators Fund - A Class Shares | | |
|---|
Without Load | 23.34% | 5.22% |
|---|
With Load* | 16.23% | 3.33% |
|---|
S&P 500® Index | 13.52% | 11.40% |
|---|
|
| Performance Inception Date |
Feb. 28, 2022
|
| AssetsNet |
$ 24,266,963
|
| Holdings Count | Holding |
27
|
| Advisory Fees Paid, Amount |
$ 7,449
|
| InvestmentCompanyPortfolioTurnover |
38.00%
|
| Additional Fund Statistics [Text Block] |
- Net Assets$24,266,963
- Number of Portfolio Holdings27
- Advisory Fee (net of waivers)$7,449
- Portfolio Turnover38%
|
| Holdings [Text Block] |
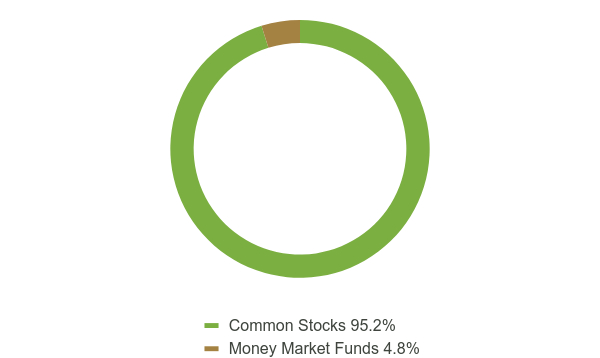
Asset Weighting (% of total investments)Value | Value |
|---|
Common Stocks | 95.2% | Money Market Funds | 4.8% |
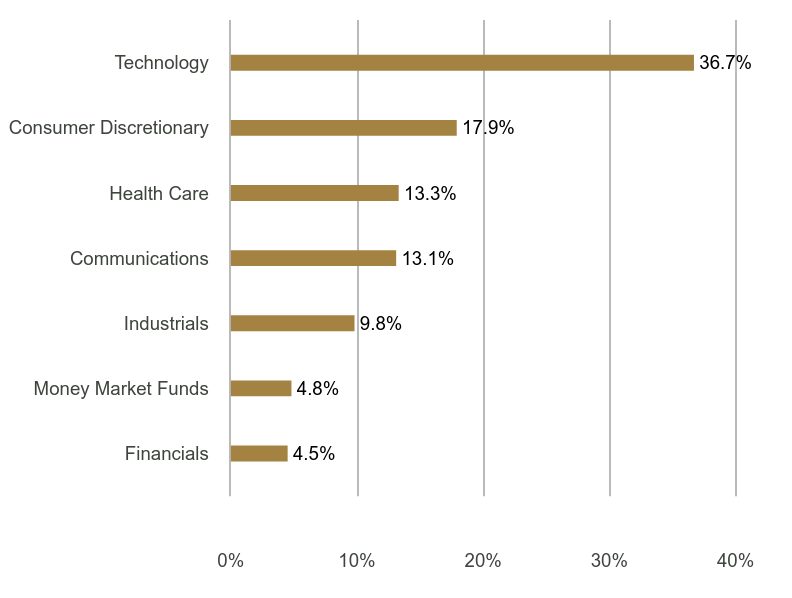
Sector Weighting (% of net assets)Value | Value |
|---|
Financials | 4.5% | Money Market Funds | 4.8% | Industrials | 9.8% | Communications | 13.1% | Health Care | 13.3% | Consumer Discretionary | 17.9% | Technology | 36.7% |
Top 10 Holdings (% of net assets)Holding Name | % of Net Assets |
|---|
Microsoft Corporation | 9.2% |
|---|
Amazon.com, Inc. | 8.8% |
|---|
ServiceNow, Inc. | 6.2% |
|---|
CyberArk Software Ltd. | 5.4% |
|---|
Netflix, Inc. | 5.1% |
|---|
MercadoLibre, Inc. | 4.9% |
|---|
PROCEPT BioRobotics Corporation | 4.6% |
|---|
Meta Platforms, Inc. - Class A | 4.3% |
|---|
Synopsys, Inc. | 4.2% |
|---|
Uber Technologies,
Inc. | 4.2% |
|---|
|
| Material Fund Change [Text Block] |
No material changes occurred during the year ended May 31, 2025. |
| C000221442 |
|
| Shareholder Report [Line Items] |
|
| Fund Name |
Evolutionary Tree Innovators Fund
|
| Class Name |
I Class Shares
|
| Trading Symbol |
INVNX
|
| Annual or Semi-Annual Statement [Text Block] |
This annual shareholder report contains important information about Evolutionary Tree Innovators Fund (the "Fund") for the period of June 1, 2024 to May 31, 2025.
|
| Shareholder Report Annual or Semi-Annual |
Annual Shareholder Report
|
| Additional Information [Text Block] |
You can find additional information about the Fund at https://mutualfund.evolutionarytree.com/resources-materials. You can also request this information by contacting us at (833) 517-1010.
|
| Additional Information Phone Number |
(833) 517-1010
|
| Additional Information Website |
<span style="font-weight: 700; box-sizing: border-box; color: rgb(63, 69, 62); display: inline; flex-wrap: nowrap; font-size: 10.6667px; grid-area: auto; line-height: 16px; margin: 0px; overflow: visible; text-align: left; text-align-last: auto; white-space-collapse: preserve-breaks;">https://mutualfund.evolutionarytree.com/resources-materials</span>
|
| Expenses [Text Block] |
What were the Fund’s annualized costs for the last year?(based on a hypothetical $10,000 investment) Class Name | Costs of a $10,000 investment | Costs paid as a percentage of a $10,000 investment |
|---|
I Class Shares | $108 | 0.97% |
|---|
|
| Expenses Paid, Amount |
$ 108
|
| Expense Ratio, Percent |
0.97%
|
| Factors Affecting Performance [Text Block] |
How did the Fund perform during the reporting period? The Fund delivered positive investment results for the fiscal year, significantly ahead of the benchmark despite various economic headwinds. Across holdings, business fundamentals continue to be strong (revenue growth of 20-25% growth on average) and the companies in aggregate are expanding margins while reinvesting in their businesses, sustaining healthy earnings growth. These are the signals we focus on as long-term investors, and it is gratifying to see business drivers contributing to investment results. The strong business results by Fund holdings were sustained despite multiple geopolitical headwinds, including the trade war. We believe many portfolio holdings are well-positioned because of the following characteristics we tend to prioritize, such as: 1. Secular growth drivers: We believe each company in the portfolio benefits from a combination of multi-year secular trends and important innovations—growth drivers that are less reliant on the general economy—that can sustain growth over coming years. 2. Mission-critical businesses: We own many companies whose products or services are essential to their customers—often viewed as “must have” solutions versus “nice to have.” 3. Pricing power: Companies we own in the portfolio often have pricing power—the ability to pass on higher costs (such as tariffs) or adjust their pricing to protect profitability. 4. Imperative demand drivers: We own a number of companies that are experiencing durable demand because their offerings are “imperative” in the current environment. Clear-cut examples include cybersecurity, AI technology, and public safety technology. 5. Resilient business models with lower risk of supply chain disruption: While no business is entirely immune to broader economic pressures, the majority of our companies held in the portfolio have durable, recurring-revenue business models that tend to be less sensitive to dips in spending. Our assessment of supply chain risk also reveals a generally lower risk of disruption for our companies. We want you to know that we remain at the helm and are navigating various headwinds in a thoughtful and prudent fashion. As you might expect, we recommend staying the course as history has shown that markets eventually recover from various economic and geopolitical events—and that reacting to them out of fear can lead to sub-optimal outcomes. Overall, we remain confident in Fund holdings because they are generally supported by long term secular growth drivers, in many cases have mission critical products, often exhibit pricing power, and predominantly offer recurring revenue models with limited supply chain exposure. |
| Performance Past Does Not Indicate Future [Text] |
The Fund's past performance is not a good predictor of how the Fund will perform in the future.
|
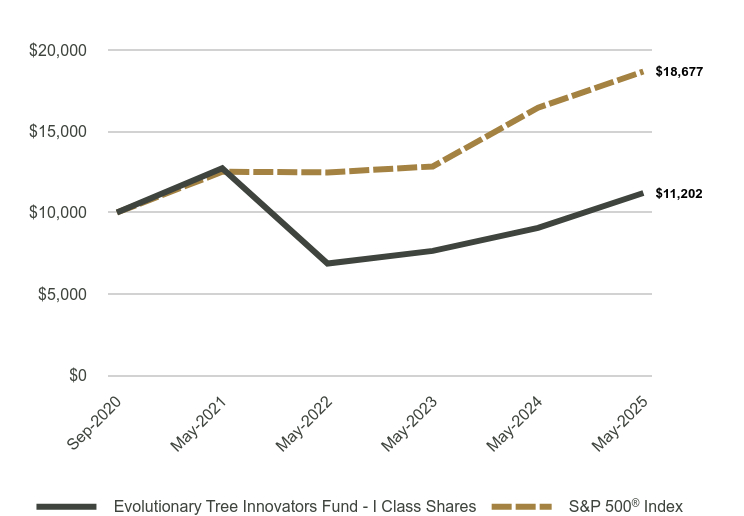
| Line Graph [Table Text Block] |
| Evolutionary Tree Innovators Fund - I Class Shares | S&P 500® Index |
|---|
Sep-2020 | $10,000 | $10,000 |
|---|
May-2021 | $12,730 | $12,508 |
|---|
May-2022 | $6,863 | $12,470 |
|---|
May-2023 | $7,641 | $12,835 |
|---|
May-2024 | $9,058 | $16,452 |
|---|
May-2025 | $11,202 | $18,677 |
|---|
|
| Average Annual Return [Table Text Block] |
| 1 Year | Since Inception (September 9, 2020) |
|---|
Evolutionary Tree Innovators Fund - I Class Shares | 23.66% | 2.43% |
|---|
S&P 500® Index | 13.52% | 14.14% |
|---|
|
| Performance Inception Date |
Sep. 09, 2020
|
| No Deduction of Taxes [Text Block] |
The graph and table do not reflect the deduction of taxes that a shareholder would pay on fund distributions or redemption of fund shares.
|
| AssetsNet |
$ 24,266,963
|
| Holdings Count | Holding |
27
|
| Advisory Fees Paid, Amount |
$ 7,449
|
| InvestmentCompanyPortfolioTurnover |
38.00%
|
| Additional Fund Statistics [Text Block] |
- Net Assets$24,266,963
- Number of Portfolio Holdings27
- Advisory Fee (net of waivers)$7,449
- Portfolio Turnover38%
|
| Holdings [Text Block] |
Asset Weighting (% of total investments)Value | Value |
|---|
Common Stocks | 95.2% | Money Market Funds | 4.8% |
Sector Weighting (% of net assets)Value | Value |
|---|
Financials | 4.5% | Money Market Funds | 4.8% | Industrials | 9.8% | Communications | 13.1% | Health Care | 13.3% | Consumer Discretionary | 17.9% | Technology | 36.7% |
Top 10 Holdings (% of net assets)Holding Name | % of Net Assets |
|---|
Microsoft Corporation | 9.2% |
|---|
Amazon.com, Inc. | 8.8% |
|---|
ServiceNow, Inc. | 6.2% |
|---|
CyberArk Software Ltd. | 5.4% |
|---|
Netflix, Inc. | 5.1% |
|---|
MercadoLibre, Inc. | 4.9% |
|---|
PROCEPT BioRobotics Corporation | 4.6% |
|---|
Meta Platforms, Inc. - Class A | 4.3% |
|---|
Synopsys, Inc. | 4.2% |
|---|
Uber Technologies, Inc. | 4.2% |
|---|
|
| Material Fund Change [Text Block] |
No material changes occurred during the year ended May 31, 2025. |
| C000182952 |
|
| Shareholder Report [Line Items] |
|
| Fund Name |
Kempner Multi-Cap Deep Value Fund
|
| Class Name |
Institutional Class
|
| Trading Symbol |
FIKDX
|
| Annual or Semi-Annual Statement [Text Block] |
This annual shareholder report contains important information about Kempner Multi-Cap Deep Value Fund (the "Fund") for the period of June 1, 2024 to May 31, 2025.
|
| Shareholder Report Annual or Semi-Annual |
Annual Shareholder Report
|
| Additional Information [Text Block] |
You can find additional information about the Fund under Mutual Fund Documents at https://kempnercapital.com/. You can also request this information by contacting us at (800) 665-9778.
|
| Additional Information Phone Number |
(800) 665-9778
|
| Additional Information Website |
<span style="font-weight: 700; box-sizing: border-box; color: rgb(0, 0, 0); display: inline; flex-wrap: nowrap; font-size: 12px; grid-area: auto; line-height: 18px; margin: 0px; overflow: visible; text-align: left; text-align-last: left; white-space-collapse: preserve-breaks;">https://kempnercapital.com/</span>
|
| Expenses [Text Block] |
What were the Fund’s annualized costs for the last year?(based on a hypothetical $10,000 investment) Class Name | Costs of a $10,000 investment | Costs paid as a percentage of a $10,000 investment |
|---|
Institutional Class | $95 | 0.94% |
|---|
|
| Expenses Paid, Amount |
$ 95
|
| Expense Ratio, Percent |
0.94%
|
| Performance Past Does Not Indicate Future [Text] |
The Fund's past performance is not a good predictor of how the Fund will perform in the future.
|
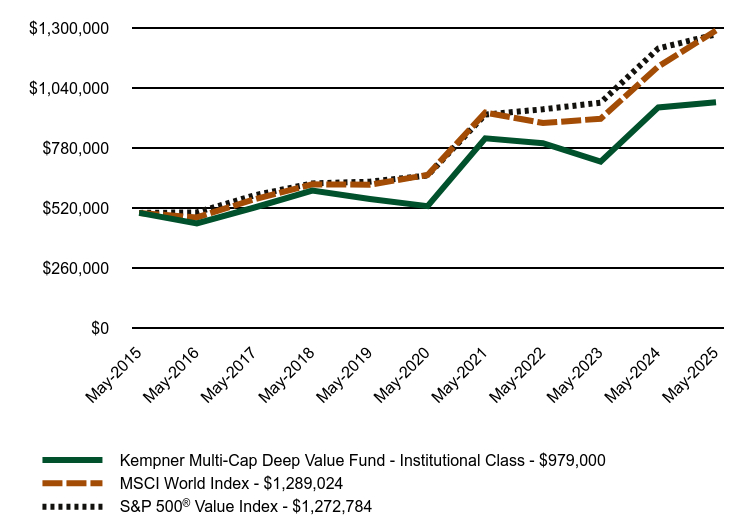
| Line Graph [Table Text Block] |
| Kempner Multi-Cap Deep Value Fund - Institutional Class | MSCI World Index | S&P 500® Value Index |
|---|
May-2015 | $500,000 | $500,000 | $500,000 |
|---|
May-2016 | $454,595 | $480,180 | $502,263 |
|---|
May-2017 | $523,432 | $559,042 | $576,144 |
|---|
May-2018 | $596,293 | $623,711 | $627,634 |
|---|
May-2019 | $559,968 | $621,900 | $635,021 |
|---|
May-2020 | $529,119 | $664,160 | $661,785 |
|---|
May-2021 | $822,867 | $933,982 | $925,468 |
|---|
May-2022 | $801,392 | $889,000 | $948,270 |
|---|
May-2023 | $721,500 | $907,418 | $976,925 |
|---|
May-2024 | $956,346 | $1,133,541 | $1,211,722 |
|---|
May-2025 | $979,000 | $1,289,024 | $1,272,784 |
|---|
|
| Average Annual Return [Table Text Block] |
Average Annual Total Returns | 1 Year | 5 Years | 10 Years |
|---|
Kempner Multi-Cap Deep Value Fund - Institutional Class | 2.37% | 13.10% | 6.95% |
|---|
MSCI World Index | 13.72% | 14.18% | 9.93% |
|---|
S&P 500® Value Index | 5.04% | 13.97% | 9.79% |
|---|
The Fund's past performance is not a good predictor of how the Fund will perform in the future. The graph and table do not reflect the deduction of taxes that a shareholder would pay on fund distributions or redemption of fund shares. |
| No Deduction of Taxes [Text Block] |
The graph and table do not reflect the deduction of taxes that a shareholder would pay on fund distributions or redemption of fund shares.
|
| AssetsNet |
$ 89,966,318
|
| Holdings Count | Holding |
38
|
| Advisory Fees Paid, Amount |
$ 550,032
|
| InvestmentCompanyPortfolioTurnover |
44.00%
|
| Additional Fund Statistics [Text Block] |
- Net Assets$89,966,318
- Number of Portfolio Holdings38
- Advisory Fee $550,032
- Portfolio Turnover44%
|
| Holdings [Text Block] |
Asset Weighting (% of total investments)Value | Value |
|---|
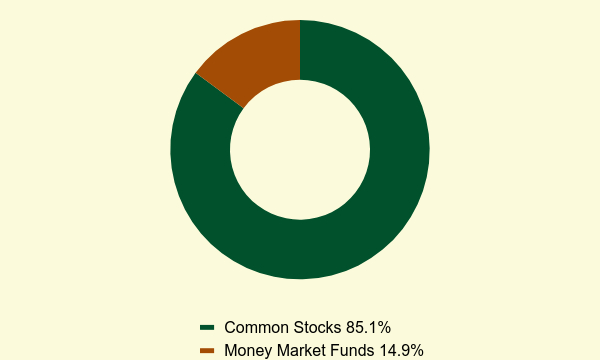
Common Stocks | 85.1% | Money Market Funds | 14.9% |
Sector Weighting (% of net assets)Value | Value |
|---|
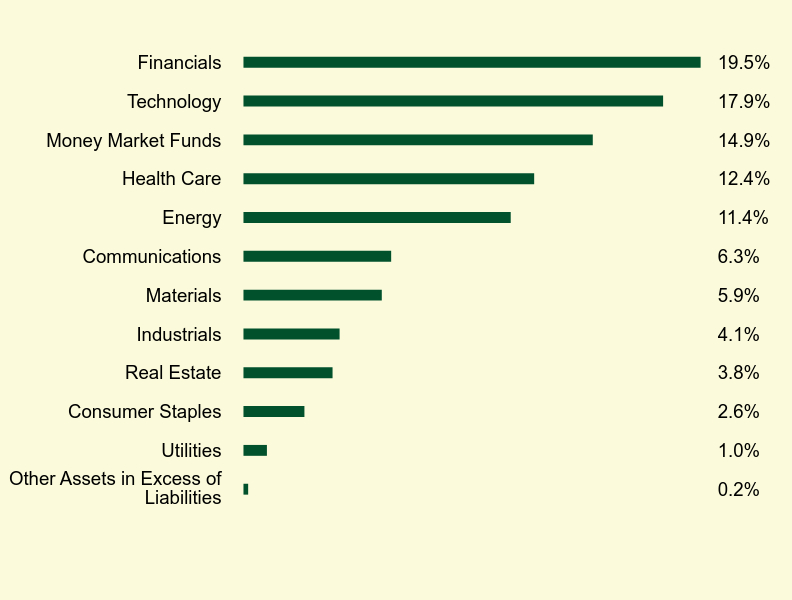
Other Assets in Excess of Liabilities | 0.2% | Utilities | 1.0% | Consumer Staples | 2.6% | Real Estate | 3.8% | Industrials | 4.1% | Materials | 5.9% | Communications | 6.3% | Energy | 11.4% | Health Care | 12.4% | Money Market Funds | 14.9% | Technology | 17.9% | Financials | 19.5% |
Top 10 Holdings (% of net assets)Holding Name | % of Net Assets |
|---|
Taiwan Semiconductor Manufacturing Company Ltd. - ADR | 6.0% |
|---|
Micron Technology, Inc. | 4.6% |
|---|
Walt Disney Company (The) | 3.6% |
|---|
Bank of America Corporation | 3.4% |
|---|
Citigroup, Inc. | 3.1% |
|---|
Global Payments, Inc. | 3.0% |
|---|
Shell plc - ADR | 2.9% |
|---|
Sensata Technologies Holding plc | 2.8% |
|---|
Lincoln National Corporation | 2.8% |
|---|
Exxon Mobil Corporation | 2.8% |
|---|
|
| Material Fund Change [Text Block] |
No material changes occurred during the year ended May 31, 2025. |
| C000182953 |
|
| Shareholder Report [Line Items] |
|
| Fund Name |
Kempner Multi-Cap Deep Value Fund
|
| Class Name |
Investor Class
|
| Trading Symbol |
FAKDX
|
| Annual or Semi-Annual Statement [Text Block] |
This annual shareholder report contains important information about Kempner Multi-Cap Deep Value Fund (the "Fund") for the period of June 1, 2024 to May 31, 2025.
|
| Shareholder Report Annual or Semi-Annual |
Annual Shareholder Report
|
| Additional Information [Text Block] |
You can find additional information about the Fund under Mutual Fund Documents at https://kempnercapital.com/. You can also request this information by contacting us at (800) 665-9778.
|
| Additional Information Phone Number |
(800) 665-9778
|
| Additional Information Website |
<span style="font-weight: 700; box-sizing: border-box; color: rgb(0, 0, 0); display: inline; flex-wrap: nowrap; font-size: 12px; grid-area: auto; line-height: 18px; margin: 0px; overflow: visible; text-align: left; text-align-last: left; white-space-collapse: preserve-breaks;">https://kempnercapital.com/</span>
|
| Expenses [Text Block] |
What were the Fund’s annualized costs for the last year?(based on a hypothetical $10,000 investment) Class Name | Costs of a $10,000 investment | Costs paid as a percentage of a $10,000 investment |
|---|
Investor Class | $120 | 1.19% |
|---|
|
| Expenses Paid, Amount |
$ 120
|
| Expense Ratio, Percent |
1.19%
|
| Performance Past Does Not Indicate Future [Text] |
The Fund's past performance is not a good predictor of how the Fund will perform in the future.
|
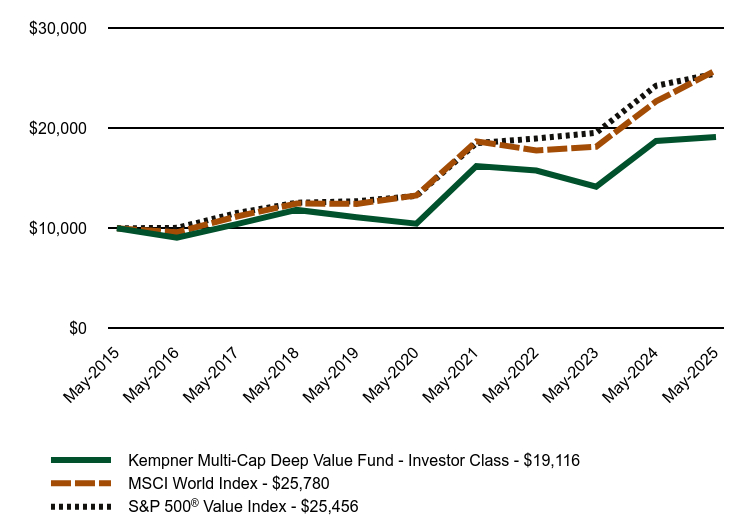
| Line Graph [Table Text Block] |
| Kempner Multi-Cap Deep Value Fund - Investor Class | MSCI World Index | S&P 500® Value Index |
|---|
May-2015 | $10,000 | $10,000 | $10,000 |
|---|
May-2016 | $9,070 | $9,604 | $10,045 |
|---|
May-2017 | $10,422 | $11,181 | $11,523 |
|---|
May-2018 | $11,838 | $12,474 | $12,553 |
|---|
May-2019 | $11,098 | $12,438 | $12,700 |
|---|
May-2020 | $10,459 | $13,283 | $13,236 |
|---|
May-2021 | $16,220 | $18,680 | $18,509 |
|---|
May-2022 | $15,768 | $17,780 | $18,965 |
|---|
May-2023 | $14,157 | $18,148 | $19,539 |
|---|
May-2024 | $18,724 | $22,671 | $24,234 |
|---|
May-2025 | $19,116 | $25,780 | $25,456 |
|---|
|
| Average Annual Return [Table Text Block] |
Average Annual Total Returns | 1 Year | 5 Years | 10 Years |
|---|
Kempner Multi-Cap Deep Value Fund - Investor Class | 2.09% | 12.82% | 6.69% |
|---|
MSCI World Index | 13.72% | 14.18% | 9.93% |
|---|
S&P 500® Value Index | 5.04% | 13.97% | 9.79% |
|---|
The Fund's past performance is not a good predictor of how the Fund will perform in the future. The graph and table do not reflect the deduction of taxes that a shareholder would pay on fund distributions or redemption of fund shares. |
| No Deduction of Taxes [Text Block] |
The graph and table do not reflect the deduction of taxes that a shareholder would pay on fund distributions or redemption of fund shares.
|
| AssetsNet |
$ 89,966,318
|
| Holdings Count | Holding |
38
|
| Advisory Fees Paid, Amount |
$ 550,032
|
| InvestmentCompanyPortfolioTurnover |
44.00%
|
| Additional Fund Statistics [Text Block] |
- Net Assets$89,966,318
- Number of Portfolio Holdings38
- Advisory Fee $550,032
- Portfolio Turnover44%
|
| Holdings [Text Block] |
Asset Weighting (% of total investments)Value | Value |
|---|
Common Stocks | 85.1% | Money Market Funds | 14.9% |
Sector Weighting (% of net assets)Value | Value |
|---|
Other Assets in Excess of Liabilities | 0.2% | Utilities | 1.0% | Consumer Staples | 2.6% | Real Estate | 3.8% | Industrials | 4.1% | Materials | 5.9% | Communications | 6.3% | Energy | 11.4% | Health Care | 12.4% | Money Market Funds | 14.9% | Technology | 17.9% | Financials | 19.5% |
Top 10 Holdings (% of net assets)Holding Name | % of Net Assets |
|---|
Taiwan Semiconductor Manufacturing Company Ltd. - ADR | 6.0% |
|---|
Micron Technology, Inc. | 4.6% |
|---|
Walt Disney Company (The) | 3.6% |
|---|
Bank of America Corporation | 3.4% |
|---|
Citigroup, Inc. | 3.1% |
|---|
Global Payments, Inc. | 3.0% |
|---|
Shell plc - ADR | 2.9% |
|---|
Sensata Technologies Holding plc | 2.8% |
|---|
Lincoln National Corporation | 2.8% |
|---|
Exxon Mobil Corporation | 2.8% |
|---|
|
| Material Fund Change [Text Block] |
No material changes occurred during the year ended May 31, 2025. |
| C000130673 |
|
| Shareholder Report [Line Items] |
|
| Fund Name |
Wavelength Fund
|
| Trading Symbol |
WAVLX
|
| Annual or Semi-Annual Statement [Text Block] |
This annual shareholder report contains important information about Wavelength Fund (the "Fund") for the period of June 1, 2024 to May 31, 2025.
|
| Shareholder Report Annual or Semi-Annual |
Annual Shareholder Report
|
| Additional Information [Text Block] |
You can find additional information about the Fund at https://www.wavelengthfunds.com/fund-resources. You can also request this information by contacting us at (866) 896-9292.
|
| Material Fund Change Notice [Text Block] |
This report describes changes to the Fund that occurred during the reporting period.
|
| Additional Information Phone Number |
(866) 896-9292
|
| Additional Information Website |
<span style="font-weight: 700; box-sizing: border-box; color: rgb(0, 0, 0); display: inline; flex-wrap: nowrap; font-size: 10.6667px; grid-area: auto; line-height: 16px; margin: 0px; overflow: visible; text-align: left; text-align-last: auto; white-space-collapse: preserve-breaks;">https://www.wavelengthfunds.com/fund-resources</span>
|
| Expenses [Text Block] |
What were the Fund’s annualized costs for the last year?(based on a hypothetical $10,000 investment) Fund Name | Costs of a $10,000 investment | Costs paid as a percentage of a $10,000 investment |
|---|
Wavelength Fund | $103 | 0.99% |
|---|
|
| Expenses Paid, Amount |
$ 103
|
| Expense Ratio, Percent |
0.99%
|
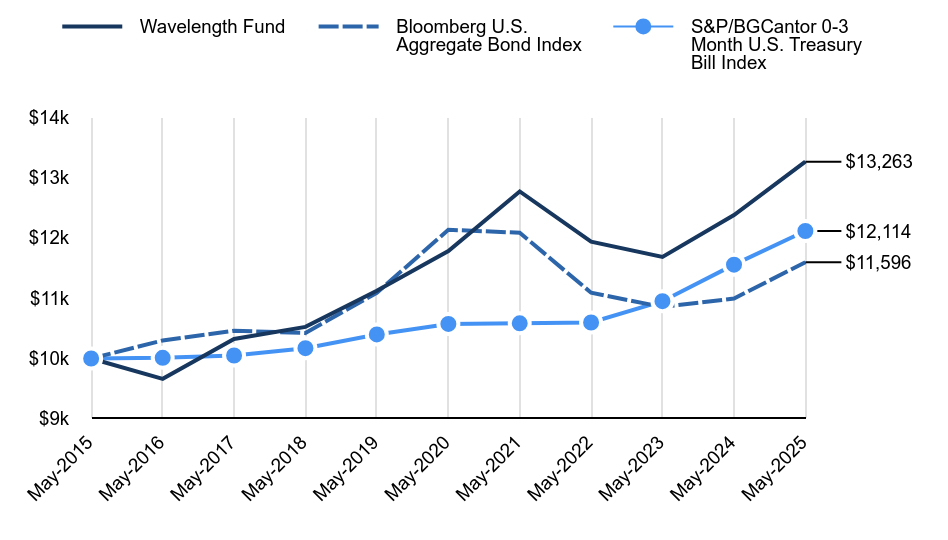
| Line Graph [Table Text Block] |
| Wavelength Fund | Bloomberg U.S. Aggregate Bond Index | S&P/BGCantor 0-3 Month U.S. Treasury Bill Index |
|---|
May-2015 | $10,000 | $10,000 | $10,000 |
|---|
May-2016 | $9,663 | $10,299 | $10,011 |
|---|
May-2017 | $10,323 | $10,462 | $10,050 |
|---|
May-2018 | $10,525 | $10,423 | $10,172 |
|---|
May-2019 | $11,123 | $11,090 | $10,399 |
|---|
May-2020 | $11,781 | $12,134 | $10,573 |
|---|
May-2021 | $12,769 | $12,085 | $10,583 |
|---|
May-2022 | $11,936 | $11,091 | $10,597 |
|---|
May-2023 | $11,683 | $10,854 | $10,950 |
|---|
May-2024 | $12,378 | $10,995 | $11,556 |
|---|
May-2025 | $13,263 | $11,596 | $12,114 |
|---|
|
| Average Annual Return [Table Text Block] |
Average Annual Total Returns | 1 Year | 5 Years | 10 Years |
|---|
Wavelength Fund | 7.15% | 2.40% | 2.86% |
|---|
Bloomberg U.S. Aggregate Bond Index | 5.46% | -0.90% | 1.49% |
|---|
S&P/BGCantor 0-3 Month U.S. Treasury Bill Index | 4.83% | 2.76% | 1.94% |
|---|
|
| AssetsNet |
$ 70,313,166
|
| Holdings Count | Holding |
30
|
| Advisory Fees Paid, Amount |
$ 439,185
|
| InvestmentCompanyPortfolioTurnover |
72.00%
|
| Additional Fund Statistics [Text Block] |
- Net Assets$70,313,166
- Number of Portfolio Holdings30
- Advisory Fee (net of waivers)$439,185
- Portfolio Turnover72%
|
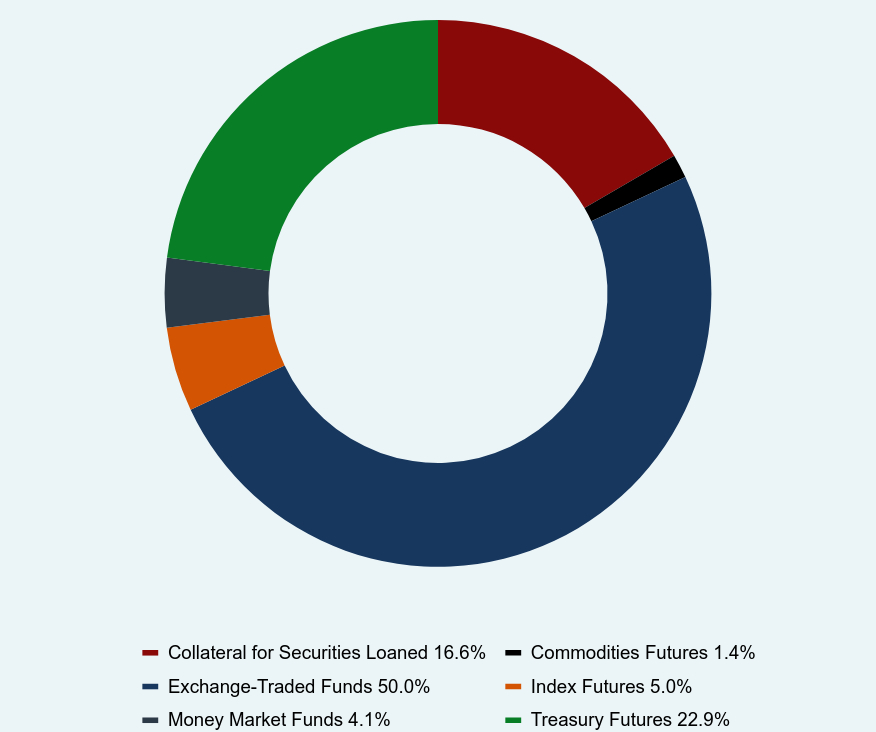
| Holdings [Text Block] |
Asset Weighting (% of total investments exposure)Value | Value |
|---|
Collateral for Securities Loaned | 16.6% | Commodities Futures | 1.4% | Exchange-Traded Funds | 50.0% | Index Futures | 5.0% | Money Market Funds | 4.1% | Treasury Futures | 22.9% |
Top 10 Holdings (% of net assets)Holding Name | % of Net Assets |
|---|
Vanguard Mortgage-Backed Securities ETF | 12.5% |
|---|
Invesco Senior Loan ETF | 10.8% |
|---|
SPDR Bloomberg Short Term High Yield Bond ETF | 10.1% |
|---|
Vanguard Short-Term Inflation-Protected Securities ETF | 9.4% |
|---|
iShares Broad USD High Yield Corporate Bond ETF | 7.5% |
|---|
VanEck J.P. Morgan EM Local Currency Bond ETF | 6.8% |
|---|
iShares TIPS Bond ETF | 6.3% |
|---|
VanEck Emerging Markets High Yield Bond ETF | 5.4% |
|---|
iShares National Muni Bond ETF | 4.6% |
|---|
SPDR Bloomberg Convertible Securities ETF | 3.9% |
|---|
|
| Material Fund Change [Text Block] |
Effective July 31, 2025, the Fund changed its distribution frequency from quarterly to monthly and reduced the minimum initial investment from $10,000 for regular accounts to $2,500 for regular accounts. |
| Updated Prospectus Phone Number |
(866) 896-9292
|
| Updated Prospectus Web Address |
https://www.wavelengthfunds.com/fund-resources
|