Shareholder Report
May 31, 2025
USD ($)
Holding
What were the Fund costs for the last year?
(based on a hypothetical $10,000 investment)
| Class name | Costs of a $10,000 investment |
Costs paid as a percentage of a $10,000 investment |
| $68 | 0.67% |
How did the Fund perform last year?
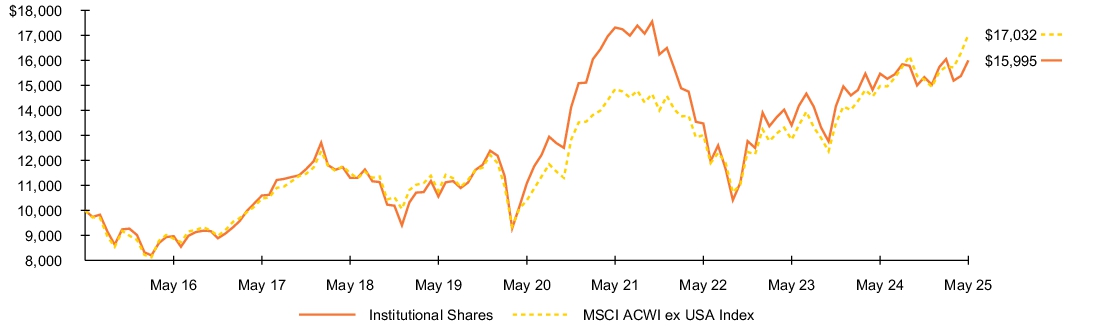
- For the reporting period ended May 31, 2025, the Fund's Institutional Shares returned 3.41%.
- For the same period, the Fund’s benchmark, the MSCI ACWI ex USA Index, returned 13.75%.
What contributed to performance?
In sector terms, stock selection within energy and an overweight to materials contributed to absolute performance. At the individual stock level, Sony Inc. delivered a series of strong earnings reports driven by robust sales for its PlayStation 5 gaming console and growth in its network services business, leading analysts to upgrade estimates. The stock also reacted positively to management changes announced in early 2025. Deutsche Telekom’s strong performance was largely driven by its U.S. subsidiary T-Mobile, in which it holds a 50% stake. T-Mobile had seen significant profitability improvements as U.S. competitive dynamics eased, even as it had been gaining market share from AT&T. Deutsche Telekom also benefited from broadening its European footprint. Off-benchmark exposure to Mastercard proved additive as the company delivered strong earnings while exceeding revenue expectations. Mastercard remained a market leader and was well-positioned to benefit from the ongoing secular shift from cash to electronic payments.
What detracted from performance?
Stock selection within and overweights to both healthcare and information technology were the top sector detractors. At the individual stock level, Novo Nordisk A/S declined on disappointing trial data for CagriSema, its next generation weight loss drug, along with market share gains by competitor Eli Lilly. The Fund continued to hold the stock, given CagriSema’s comparable efficacy to Eli Lilly’s incumbent drug and the expanding weight loss market. LVMH Moet Hennessy Louis Vuitton SA suffered from a challenging backdrop for luxury goods amid weakening U.S. consumer demand and a slowdown in China. The Fund exited the position on the view that LVMH’s business mix had become less diversified, even as its pricing power waned. U.K. housebuilder Taylor Wimpey plc saw its results suffer from cost inflation along with a less favorable interest rate environment. Taylor Wimpey remained well positioned within a cyclical industry with high barriers to entry from economies of scale.
The views expressed reflect the opinions of BlackRock as of the date of this report and are subject to change based on changes in market, economic or other conditions. These views are not intended to be a forecast of future events and are no guarantee of future results.
Fund performance
Cumulative performance: June 1, 2015 through May 31, 2025
Initial investment of $10,000
See “Average annual total returns” for additional information on fund performance.
Average annual total returns
| 1 Year | 5 Years | 10 Years | |||
| 3.41 | % | 7.60 | % | 4.81 | % |
| 13.75 | 10.37 | 5.47 |
Key Fund statistics
| $1,199,946,293 |
| 40 |
| $8,167,899 |
| 95% |
What did the Fund invest in?
(as of May 31, 2025)
Geographic allocation
| Country | Percent of Net Assets |
|
| 15.7 | % | |
| 11.4 | ||
| 8.5 | ||
| 7.4 | ||
| 7.1 | ||
| 7.1 | ||
| 6.5 | ||
| 6.5 | ||
| 5.6 | ||
| 5.2 | ||
| 18.0 | ||
| 0.8 | ||
| 0.2 |
Ten largest holdings
| Security(a) | Percent of Net Assets |
|
| 5.1 | % | |
| 4.0 | ||
| 3.4 | ||
| 3.2 | ||
| 3.2 | ||
| 3.1 | ||
| 3.1 | ||
| 3.1 | ||
| 3.1 | ||
| 3.1 |
| Excludes short-term securities. |
| Ten largest countries are presented. Additional countries are found in Other. |
Ten largest holdings
| Security(a) | Percent of Net Assets |
|
| 5.1 | % | |
| 4.0 | ||
| 3.4 | ||
| 3.2 | ||
| 3.2 | ||
| 3.1 | ||
| 3.1 | ||
| 3.1 | ||
| 3.1 | ||
| 3.1 |
What were the Fund costs for the last year?
(based on a hypothetical $10,000 investment)
| Class name | Costs of a $10,000 investment |
Costs paid as a percentage of a $10,000 investment |
| $93 | 0.92% |
How did the Fund perform last year?
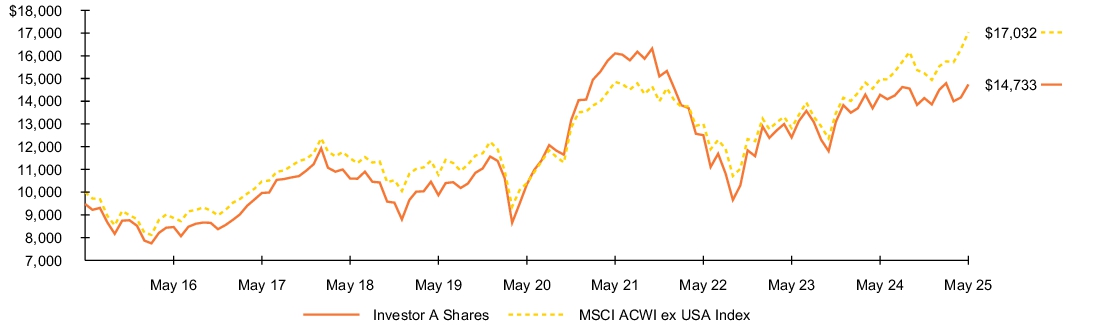
- For the reporting period ended May 31, 2025, the Fund's Investor A Shares returned 3.14%.
- For the same period, the Fund’s benchmark, the MSCI ACWI ex USA Index, returned 13.75%.
What contributed to performance?
In sector terms, stock selection within energy and an overweight to materials contributed to absolute performance. At the individual stock level, Sony Inc. delivered a series of strong earnings reports driven by robust sales for its PlayStation 5 gaming console and growth in its network services business, leading analysts to upgrade estimates. The stock also reacted positively to management changes announced in early 2025. Deutsche Telekom’s strong performance was largely driven by its U.S. subsidiary T-Mobile, in which it holds a 50% stake. T-Mobile had seen significant profitability improvements as U.S. competitive dynamics eased, even as it had been gaining market share from AT&T. Deutsche Telekom also benefited from broadening its European footprint. Off-benchmark exposure to Mastercard proved additive as the company delivered strong earnings while exceeding revenue expectations. Mastercard remained a market leader and was well-positioned to benefit from the ongoing secular shift from cash to electronic payments.
What detracted from performance?
Stock selection within and overweights to both healthcare and information technology were the top sector detractors. At the individual stock level, Novo Nordisk A/S declined on disappointing trial data for CagriSema, its next generation weight loss drug, along with market share gains by competitor Eli Lilly. The Fund continued to hold the stock, given CagriSema’s comparable efficacy to Eli Lilly’s incumbent drug and the expanding weight loss market. LVMH Moet Hennessy Louis Vuitton SA suffered from a challenging backdrop for luxury goods amid weakening U.S. consumer demand and a slowdown in China. The Fund exited the position on the view that LVMH’s business mix had become less diversified, even as its pricing power waned. U.K. housebuilder Taylor Wimpey plc saw its results suffer from cost inflation along with a less favorable interest rate environment. Taylor Wimpey remained well positioned within a cyclical industry with high barriers to entry from economies of scale.
The views expressed reflect the opinions of BlackRock as of the date of this report and are subject to change based on changes in market, economic or other conditions. These views are not intended to be a forecast of future events and are no guarantee of future results.
Fund performance
Cumulative performance: June 1, 2015 through May 31, 2025
Initial investment of $10,000
See “Average annual total returns” for additional information on fund performance.
Average annual total returns
| 1 Year | 5 Years | 10 Years | |||
| 3.14 | % | 7.33 | % | 4.51 | % |
| (2.28 | ) | 6.18 | 3.95 | ||
| 13.75 | 10.37 | 5.47 |
Key Fund statistics
| $1,199,946,293 |
| 40 |
| $8,167,899 |
| 95% |
What did the Fund invest in?
(as of May 31, 2025)
Geographic allocation
| Country | Percent of Net Assets |
|
| 15.7 | % | |
| 11.4 | ||
| 8.5 | ||
| 7.4 | ||
| 7.1 | ||
| 7.1 | ||
| 6.5 | ||
| 6.5 | ||
| 5.6 | ||
| 5.2 | ||
| 18.0 | ||
| 0.8 | ||
| 0.2 |
Ten largest holdings
| Security(a) | Percent of Net Assets |
|
| 5.1 | % | |
| 4.0 | ||
| 3.4 | ||
| 3.2 | ||
| 3.2 | ||
| 3.1 | ||
| 3.1 | ||
| 3.1 | ||
| 3.1 | ||
| 3.1 |
| Excludes short-term securities. |
| Ten largest countries are presented. Additional countries are found in Other. |
Ten largest holdings
| Security(a) | Percent of Net Assets |
|
| 5.1 | % | |
| 4.0 | ||
| 3.4 | ||
| 3.2 | ||
| 3.2 | ||
| 3.1 | ||
| 3.1 | ||
| 3.1 | ||
| 3.1 | ||
| 3.1 |
What were the Fund costs for the last year?
(based on a hypothetical $10,000 investment)
| Class name | Costs of a $10,000 investment |
Costs paid as a percentage of a $10,000 investment |
| $169 | 1.67% |
How did the Fund perform last year?
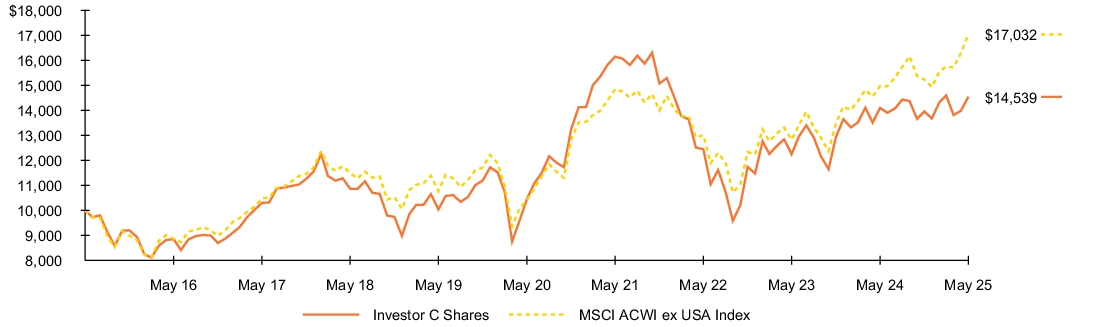
- For the reporting period ended May 31, 2025, the Fund's Investor C Shares returned 2.32%.
- For the same period, the Fund’s benchmark, the MSCI ACWI ex USA Index, returned 13.75%.
What contributed to performance?
In sector terms, stock selection within energy and an overweight to materials contributed to absolute performance. At the individual stock level, Sony Inc. delivered a series of strong earnings reports driven by robust sales for its PlayStation 5 gaming console and growth in its network services business, leading analysts to upgrade estimates. The stock also reacted positively to management changes announced in early 2025. Deutsche Telekom’s strong performance was largely driven by its U.S. subsidiary T-Mobile, in which it holds a 50% stake. T-Mobile had seen significant profitability improvements as U.S. competitive dynamics eased, even as it had been gaining market share from AT&T. Deutsche Telekom also benefited from broadening its European footprint. Off-benchmark exposure to Mastercard proved additive as the company delivered strong earnings while exceeding revenue expectations. Mastercard remained a market leader and was well-positioned to benefit from the ongoing secular shift from cash to electronic payments.
What detracted from performance?
Stock selection within and overweights to both healthcare and information technology were the top sector detractors. At the individual stock level, Novo Nordisk A/S declined on disappointing trial data for CagriSema, its next generation weight loss drug, along with market share gains by competitor Eli Lilly. The Fund continued to hold the stock, given CagriSema’s comparable efficacy to Eli Lilly’s incumbent drug and the expanding weight loss market. LVMH Moet Hennessy Louis Vuitton SA suffered from a challenging backdrop for luxury goods amid weakening U.S. consumer demand and a slowdown in China. The Fund exited the position on the view that LVMH’s business mix had become less diversified, even as its pricing power waned. U.K. housebuilder Taylor Wimpey plc saw its results suffer from cost inflation along with a less favorable interest rate environment. Taylor Wimpey remained well positioned within a cyclical industry with high barriers to entry from economies of scale.
The views expressed reflect the opinions of BlackRock as of the date of this report and are subject to change based on changes in market, economic or other conditions. These views are not intended to be a forecast of future events and are no guarantee of future results.
Fund performance
Cumulative performance: June 1, 2015 through May 31, 2025
Initial investment of $10,000
See “Average annual total returns” for additional information on fund performance.
Average annual total returns
| 1 Year | 5 Years | 10 Years | |||
| 2.32 | % | 6.52 | % | 3.81 | % |
| 1.32 | 6.52 | 3.81 | |||
| 13.75 | 10.37 | 5.47 |
Key Fund statistics
| $1,199,946,293 |
| 40 |
| $8,167,899 |
| 95% |
What did the Fund invest in?
(as of May 31, 2025)
Geographic allocation
| Country | Percent of Net Assets |
|
| 15.7 | % | |
| 11.4 | ||
| 8.5 | ||
| 7.4 | ||
| 7.1 | ||
| 7.1 | ||
| 6.5 | ||
| 6.5 | ||
| 5.6 | ||
| 5.2 | ||
| 18.0 | ||
| 0.8 | ||
| 0.2 |
Ten largest holdings
| Security(a) | Percent of Net Assets |
|
| 5.1 | % | |
| 4.0 | ||
| 3.4 | ||
| 3.2 | ||
| 3.2 | ||
| 3.1 | ||
| 3.1 | ||
| 3.1 | ||
| 3.1 | ||
| 3.1 |
| Excludes short-term securities. |
| Ten largest countries are presented. Additional countries are found in Other. |
Ten largest holdings
| Security(a) | Percent of Net Assets |
|
| 5.1 | % | |
| 4.0 | ||
| 3.4 | ||
| 3.2 | ||
| 3.2 | ||
| 3.1 | ||
| 3.1 | ||
| 3.1 | ||
| 3.1 | ||
| 3.1 |
What were the Fund costs for the last year?
(based on a hypothetical $10,000 investment)
| Class name | Costs of a $10,000 investment |
Costs paid as a percentage of a $10,000 investment |
| $63 | 0.62% |
How did the Fund perform last year?
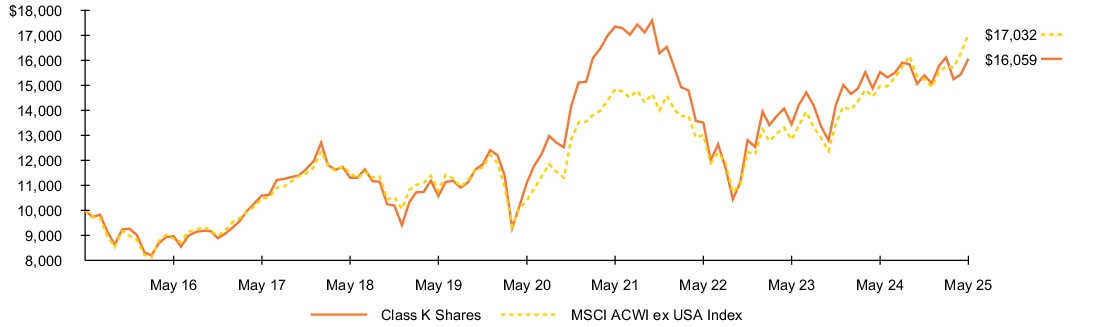
- For the reporting period ended May 31, 2025, the Fund's Class K Shares returned 3.42%.
- For the same period, the Fund’s benchmark, the MSCI ACWI ex USA Index, returned 13.75%.
What contributed to performance?
In sector terms, stock selection within energy and an overweight to materials contributed to absolute performance. At the individual stock level, Sony Inc. delivered a series of strong earnings reports driven by robust sales for its PlayStation 5 gaming console and growth in its network services business, leading analysts to upgrade estimates. The stock also reacted positively to management changes announced in early 2025. Deutsche Telekom’s strong performance was largely driven by its U.S. subsidiary T-Mobile, in which it holds a 50% stake. T-Mobile had seen significant profitability improvements as U.S. competitive dynamics eased, even as it had been gaining market share from AT&T. Deutsche Telekom also benefited from broadening its European footprint. Off-benchmark exposure to Mastercard proved additive as the company delivered strong earnings while exceeding revenue expectations. Mastercard remained a market leader and was well-positioned to benefit from the ongoing secular shift from cash to electronic payments.
What detracted from performance?
Stock selection within and overweights to both healthcare and information technology were the top sector detractors. At the individual stock level, Novo Nordisk A/S declined on disappointing trial data for CagriSema, its next generation weight loss drug, along with market share gains by competitor Eli Lilly. The Fund continued to hold the stock, given CagriSema’s comparable efficacy to Eli Lilly’s incumbent drug and the expanding weight loss market. LVMH Moet Hennessy Louis Vuitton SA suffered from a challenging backdrop for luxury goods amid weakening U.S. consumer demand and a slowdown in China. The Fund exited the position on the view that LVMH’s business mix had become less diversified, even as its pricing power waned. U.K. housebuilder Taylor Wimpey plc saw its results suffer from cost inflation along with a less favorable interest rate environment. Taylor Wimpey remained well positioned within a cyclical industry with high barriers to entry from economies of scale.
The views expressed reflect the opinions of BlackRock as of the date of this report and are subject to change based on changes in market, economic or other conditions. These views are not intended to be a forecast of future events and are no guarantee of future results.
Fund performance
Cumulative performance: June 1, 2015 through May 31, 2025
Initial investment of $10,000
See “Average annual total returns” for additional information on fund performance.
Average annual total returns
| 1 Year | 5 Years | 10 Years | |||
| 3.42 | % | 7.66 | % | 4.85 | % |
| 13.75 | 10.37 | 5.47 |
Key Fund statistics
| $1,199,946,293 |
| 40 |
| $8,167,899 |
| 95% |
What did the Fund invest in?
(as of May 31, 2025)
Geographic allocation
| Country | Percent of Net Assets |
|
| 15.7 | % | |
| 11.4 | ||
| 8.5 | ||
| 7.4 | ||
| 7.1 | ||
| 7.1 | ||
| 6.5 | ||
| 6.5 | ||
| 5.6 | ||
| 5.2 | ||
| 18.0 | ||
| 0.8 | ||
| 0.2 |
Ten largest holdings
| Security(a) | Percent of Net Assets |
|
| 5.1 | % | |
| 4.0 | ||
| 3.4 | ||
| 3.2 | ||
| 3.2 | ||
| 3.1 | ||
| 3.1 | ||
| 3.1 | ||
| 3.1 | ||
| 3.1 |
| Excludes short-term securities. |
| Ten largest countries are presented. Additional countries are found in Other. |
Ten largest holdings
| Security(a) | Percent of Net Assets |
|
| 5.1 | % | |
| 4.0 | ||
| 3.4 | ||
| 3.2 | ||
| 3.2 | ||
| 3.1 | ||
| 3.1 | ||
| 3.1 | ||
| 3.1 | ||
| 3.1 |
What were the Fund costs for the last year?
(based on a hypothetical $10,000 investment)
| Class name | Costs of a $10,000 investment |
Costs paid as a percentage of a $10,000 investment |
| $119 | 1.17% |
How did the Fund perform last year?
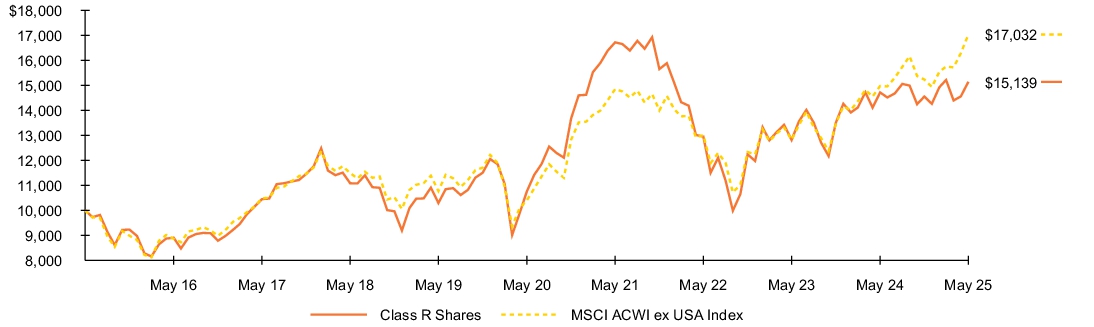
- For the reporting period ended May 31, 2025, the Fund's Class R Shares returned 2.88%.
- For the same period, the Fund’s benchmark, the MSCI ACWI ex USA Index, returned 13.75%.
What contributed to performance?
In sector terms, stock selection within energy and an overweight to materials contributed to absolute performance. At the individual stock level, Sony Inc. delivered a series of strong earnings reports driven by robust sales for its PlayStation 5 gaming console and growth in its network services business, leading analysts to upgrade estimates. The stock also reacted positively to management changes announced in early 2025. Deutsche Telekom’s strong performance was largely driven by its U.S. subsidiary T-Mobile, in which it holds a 50% stake. T-Mobile had seen significant profitability improvements as U.S. competitive dynamics eased, even as it had been gaining market share from AT&T. Deutsche Telekom also benefited from broadening its European footprint. Off-benchmark exposure to Mastercard proved additive as the company delivered strong earnings while exceeding revenue expectations. Mastercard remained a market leader and was well-positioned to benefit from the ongoing secular shift from cash to electronic payments.
What detracted from performance?
Stock selection within and overweights to both healthcare and information technology were the top sector detractors. At the individual stock level, Novo Nordisk A/S declined on disappointing trial data for CagriSema, its next generation weight loss drug, along with market share gains by competitor Eli Lilly. The Fund continued to hold the stock, given CagriSema’s comparable efficacy to Eli Lilly’s incumbent drug and the expanding weight loss market. LVMH Moet Hennessy Louis Vuitton SA suffered from a challenging backdrop for luxury goods amid weakening U.S. consumer demand and a slowdown in China. The Fund exited the position on the view that LVMH’s business mix had become less diversified, even as its pricing power waned. U.K. housebuilder Taylor Wimpey plc saw its results suffer from cost inflation along with a less favorable interest rate environment. Taylor Wimpey remained well positioned within a cyclical industry with high barriers to entry from economies of scale.
The views expressed reflect the opinions of BlackRock as of the date of this report and are subject to change based on changes in market, economic or other conditions. These views are not intended to be a forecast of future events and are no guarantee of future results.
Fund performance
Cumulative performance: June 1, 2015 through May 31, 2025
Initial investment of $10,000
See “Average annual total returns” for additional information on fund performance.
Average annual total returns
| 1 Year | 5 Years | 10 Years | |||
| 2.88 | % | 7.07 | % | 4.23 | % |
| 13.75 | 10.37 | 5.47 |
Key Fund statistics
| $1,199,946,293 |
| 40 |
| $8,167,899 |
| 95% |
What did the Fund invest in?
(as of May 31, 2025)
Geographic allocation
| Country | Percent of Net Assets |
|
| 15.7 | % | |
| 11.4 | ||
| 8.5 | ||
| 7.4 | ||
| 7.1 | ||
| 7.1 | ||
| 6.5 | ||
| 6.5 | ||
| 5.6 | ||
| 5.2 | ||
| 18.0 | ||
| 0.8 | ||
| 0.2 |
Ten largest holdings
| Security(a) | Percent of Net Assets |
|
| 5.1 | % | |
| 4.0 | ||
| 3.4 | ||
| 3.2 | ||
| 3.2 | ||
| 3.1 | ||
| 3.1 | ||
| 3.1 | ||
| 3.1 | ||
| 3.1 |
| Excludes short-term securities. |
| Ten largest countries are presented. Additional countries are found in Other. |
Ten largest holdings
| Security(a) | Percent of Net Assets |
|
| 5.1 | % | |
| 4.0 | ||
| 3.4 | ||
| 3.2 | ||
| 3.2 | ||
| 3.1 | ||
| 3.1 | ||
| 3.1 | ||
| 3.1 | ||
| 3.1 |