Shareholder Report
May 31, 2025
USD ($)
Holding
What were the Fund costs for the last year?
(based on a hypothetical $10,000 investment)
| Class name | Costs of a $10,000 investment |
Costs paid as a percentage of a $10,000 investment |
| $84 | 0.80% |
How did the Fund perform last year?
- For the reporting period ended May 31, 2025, the Fund's Institutional Shares returned 9.61%.
- For the same period, the Fund’s benchmark, the MSCI All Country World Index, returned 13.65%.
What contributed to performance?
In sector terms, leading contributors included stock selection in energy along with an overweight to, and stock selection within, materials. At the individual stock level, semiconductor company Broadcom Inc. had been a prime beneficiary of optimism around artificial intelligence (“AI”). Broadcom remains well-positioned as the market shifts toward application-specific chips, which are increasingly critical to improving AI model efficiency. Philip Morris International Inc. delivered strong results driven by the expansion of its smoke-free portfolio. The Fund exited the position due to rising competition in U.S. nicotine pouches and concerns that Philip Morris may need to cut prices to remain competitive. Shares of Spanish Bank BBVA rose notably since the start of 2025 as European financials have benefited from higher interest rates and plans for fiscal stimulus. In addition, BBVA posted earnings beats for both the fourth quarter of 2024 and first quarter of 2025, driven by its trading division.
What detracted from performance?
Stock selection in consumer discretionary weighed on return, along with overweights to, and stock selection within, healthcare and consumer staples. At the individual stock level, Novo Nordisk A/S declined on disappointing trial data for CagriSema, its next generation weight loss drug, along with market share gains by competitor Eli Lilly. The Fund continued to hold the stock given CagriSema’s comparable efficacy to Eli Lilly’s incumbent drug and the expanding weight loss market. Shares of U.S. managed care company United Health Group Inc. declined late in the period, following downgraded guidance driven by higher-than-expected claims activity. The current valuation appeared compelling given structural tailwinds for Medicare Advantage broadly and potential levers available to the company to help improve profitability. U.S. semiconductor manufacturer Texas Instruments Inc. declined sharply following weak fourth quarter 2024 results driven by softness in the industrial and auto markets, which led to elevated inventories and lower revenue and net income. The Fund exited the position.
The views expressed reflect the opinions of BlackRock as of the date of this report and are subject to change based on changes in market, economic or other conditions. These views are not intended to be a forecast of future events and are no guarantee of future results.
Fund performance
Cumulative performance: June 1, 2015 through May 31, 2025
Initial investment of $10,000
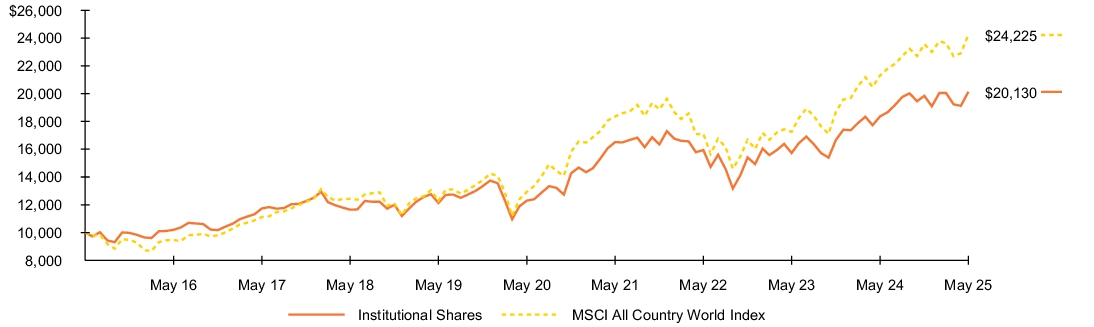
See “Average annual total returns” for additional information on fund performance.
Average annual total returns
| 1 Year | 5 Years | 10 Years | |||
| 9.61 | % | 10.35 | % | 7.25 | % |
| 13.65 | 13.37 | 9.25 |
Key Fund statistics
| $1,009,586,312 |
| 48 |
| $6,627,287 |
| 44% |
What did the Fund invest in?
(as of May 31, 2025)
Geographic allocation
| Country | Percent of Net Assets |
|
| 66.4 | % | |
| 10.8 | ||
| 5.3 | ||
| 3.8 | ||
| 2.5 | ||
| 2.2 | ||
| 2.1 | ||
| 2.0 | ||
| 2.0 | ||
| 1.5 | ||
| 1.6 | ||
| (0.2 | ) |
Ten largest holdings
| Security(a) | Percent of Net Assets |
|
| 5.9 | % | |
| 3.9 | ||
| 3.8 | ||
| 3.4 | ||
| 2.8 | ||
| 2.7 | ||
| 2.7 | ||
| 2.7 | ||
| 2.6 | ||
| 2.6 |
| Excludes short-term securities. |
Ten largest holdings
| Security(a) | Percent of Net Assets |
|
| 5.9 | % | |
| 3.9 | ||
| 3.8 | ||
| 3.4 | ||
| 2.8 | ||
| 2.7 | ||
| 2.7 | ||
| 2.7 | ||
| 2.6 | ||
| 2.6 |
| Excludes short-term securities. |
What were the Fund costs for the last year?
(based on a hypothetical $10,000 investment)
| Class name | Costs of a $10,000 investment |
Costs paid as a percentage of a $10,000 investment |
| $74 | 0.71% |
How did the Fund perform last year?
- For the reporting period ended May 31, 2025, the Fund's Class K Shares returned 9.68%.
- For the same period, the Fund’s benchmark, the MSCI All Country World Index, returned 13.65%.
What contributed to performance?
In sector terms, leading contributors included stock selection in energy along with an overweight to, and stock selection within, materials. At the individual stock level, semiconductor company Broadcom Inc. had been a prime beneficiary of optimism around artificial intelligence (“AI”). Broadcom remains well-positioned as the market shifts toward application-specific chips, which are increasingly critical to improving AI model efficiency. Philip Morris International Inc. delivered strong results driven by the expansion of its smoke-free portfolio. The Fund exited the position due to rising competition in U.S. nicotine pouches and concerns that Philip Morris may need to cut prices to remain competitive. Shares of Spanish Bank BBVA rose notably since the start of 2025 as European financials have benefited from higher interest rates and plans for fiscal stimulus. In addition, BBVA posted earnings beats for both the fourth quarter of 2024 and first quarter of 2025, driven by its trading division.
What detracted from performance?
Stock selection in consumer discretionary weighed on return, along with overweights to, and stock selection within, healthcare and consumer staples. At the individual stock level, Novo Nordisk A/S declined on disappointing trial data for CagriSema, its next generation weight loss drug, along with market share gains by competitor Eli Lilly. The Fund continued to hold the stock given CagriSema’s comparable efficacy to Eli Lilly’s incumbent drug and the expanding weight loss market. Shares of U.S. managed care company United Health Group Inc. declined late in the period, following downgraded guidance driven by higher-than-expected claims activity. The current valuation appeared compelling given structural tailwinds for Medicare Advantage broadly and potential levers available to the company to help improve profitability. U.S. semiconductor manufacturer Texas Instruments Inc. declined sharply following weak fourth quarter 2024 results driven by softness in the industrial and auto markets, which led to elevated inventories and lower revenue and net income. The Fund exited the position.
The views expressed reflect the opinions of BlackRock as of the date of this report and are subject to change based on changes in market, economic or other conditions. These views are not intended to be a forecast of future events and are no guarantee of future results.
Fund performance
Cumulative performance: June 1, 2015 through May 31, 2025
Initial investment of $10,000
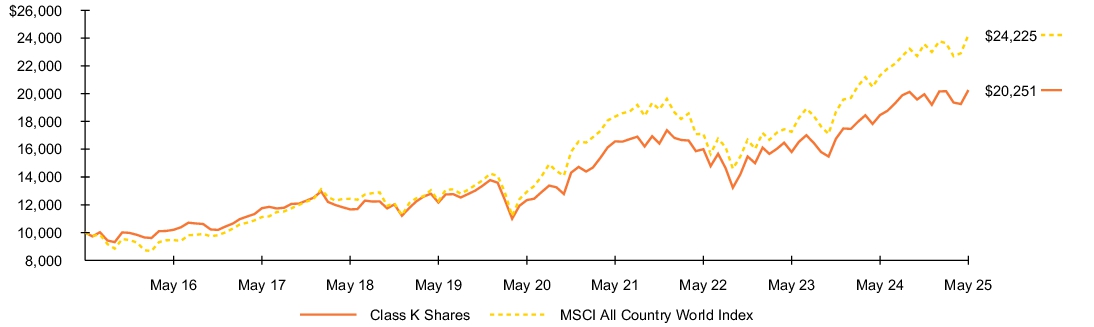
See “Average annual total returns” for additional information on fund performance.
Average annual total returns
| 1 Year | 5 Years | 10 Years | |||
| 9.68 | % | 10.42 | % | 7.31 | % |
| 13.65 | 13.37 | 9.25 |
Key Fund statistics
| $1,009,586,312 |
| 48 |
| $6,627,287 |
| 44% |
What did the Fund invest in?
(as of May 31, 2025)
Geographic allocation
| Country | Percent of Net Assets |
|
| 66.4 | % | |
| 10.8 | ||
| 5.3 | ||
| 3.8 | ||
| 2.5 | ||
| 2.2 | ||
| 2.1 | ||
| 2.0 | ||
| 2.0 | ||
| 1.5 | ||
| 1.6 | ||
| (0.2 | ) |
Ten largest holdings
| Security(a) | Percent of Net Assets |
|
| 5.9 | % | |
| 3.9 | ||
| 3.8 | ||
| 3.4 | ||
| 2.8 | ||
| 2.7 | ||
| 2.7 | ||
| 2.7 | ||
| 2.6 | ||
| 2.6 |
| Excludes short-term securities. |
Ten largest holdings
| Security(a) | Percent of Net Assets |
|
| 5.9 | % | |
| 3.9 | ||
| 3.8 | ||
| 3.4 | ||
| 2.8 | ||
| 2.7 | ||
| 2.7 | ||
| 2.7 | ||
| 2.6 | ||
| 2.6 |
| Excludes short-term securities. |
What were the Fund costs for the last year?
(based on a hypothetical $10,000 investment)
| Class name | Costs of a $10,000 investment |
Costs paid as a percentage of a $10,000 investment |
| $191 | 1.83% |
How did the Fund perform last year?
- For the reporting period ended May 31, 2025, the Fund's Investor C Shares returned 8.46%.
- For the same period, the Fund’s benchmark, the MSCI All Country World Index, returned 13.65%.
What contributed to performance?
In sector terms, leading contributors included stock selection in energy along with an overweight to, and stock selection within, materials. At the individual stock level, semiconductor company Broadcom Inc. had been a prime beneficiary of optimism around artificial intelligence (“AI”). Broadcom remains well-positioned as the market shifts toward application-specific chips, which are increasingly critical to improving AI model efficiency. Philip Morris International Inc. delivered strong results driven by the expansion of its smoke-free portfolio. The Fund exited the position due to rising competition in U.S. nicotine pouches and concerns that Philip Morris may need to cut prices to remain competitive. Shares of Spanish Bank BBVA rose notably since the start of 2025 as European financials have benefited from higher interest rates and plans for fiscal stimulus. In addition, BBVA posted earnings beats for both the fourth quarter of 2024 and first quarter of 2025, driven by its trading division.
What detracted from performance?
Stock selection in consumer discretionary weighed on return, along with overweights to, and stock selection within, healthcare and consumer staples. At the individual stock level, Novo Nordisk A/S declined on disappointing trial data for CagriSema, its next generation weight loss drug, along with market share gains by competitor Eli Lilly. The Fund continued to hold the stock given CagriSema’s comparable efficacy to Eli Lilly’s incumbent drug and the expanding weight loss market. Shares of U.S. managed care company United Health Group Inc. declined late in the period, following downgraded guidance driven by higher-than-expected claims activity. The current valuation appeared compelling given structural tailwinds for Medicare Advantage broadly and potential levers available to the company to help improve profitability. U.S. semiconductor manufacturer Texas Instruments Inc. declined sharply following weak fourth quarter 2024 results driven by softness in the industrial and auto markets, which led to elevated inventories and lower revenue and net income. The Fund exited the position.
The views expressed reflect the opinions of BlackRock as of the date of this report and are subject to change based on changes in market, economic or other conditions. These views are not intended to be a forecast of future events and are no guarantee of future results.
Fund performance
Cumulative performance: June 1, 2015 through May 31, 2025
Initial investment of $10,000
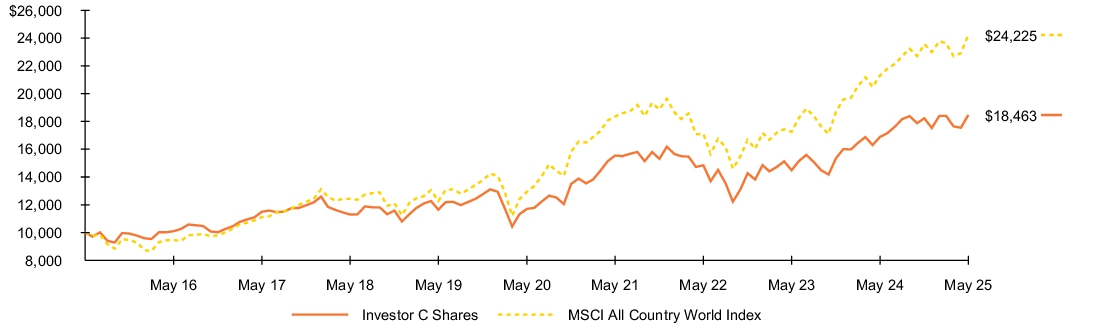
See “Average annual total returns” for additional information on fund performance.
Average annual total returns
| 1 Year | 5 Years | 10 Years | |||
| 8.46 | % | 9.20 | % | 6.32 | % |
| 7.46 | 9.20 | 6.32 | |||
| 13.65 | 13.37 | 9.25 |
Key Fund statistics
| $1,009,586,312 |
| 48 |
| $6,627,287 |
| 44% |
What did the Fund invest in?
(as of May 31, 2025)
Geographic allocation
| Country | Percent of Net Assets |
|
| 66.4 | % | |
| 10.8 | ||
| 5.3 | ||
| 3.8 | ||
| 2.5 | ||
| 2.2 | ||
| 2.1 | ||
| 2.0 | ||
| 2.0 | ||
| 1.5 | ||
| 1.6 | ||
| (0.2 | ) |
Ten largest holdings
| Security(a) | Percent of Net Assets |
|
| 5.9 | % | |
| 3.9 | ||
| 3.8 | ||
| 3.4 | ||
| 2.8 | ||
| 2.7 | ||
| 2.7 | ||
| 2.7 | ||
| 2.6 | ||
| 2.6 |
| Excludes short-term securities. |
Ten largest holdings
| Security(a) | Percent of Net Assets |
|
| 5.9 | % | |
| 3.9 | ||
| 3.8 | ||
| 3.4 | ||
| 2.8 | ||
| 2.7 | ||
| 2.7 | ||
| 2.7 | ||
| 2.6 | ||
| 2.6 |
| Excludes short-term securities. |
What were the Fund costs for the last year?
(based on a hypothetical $10,000 investment)
| Class name | Costs of a $10,000 investment |
Costs paid as a percentage of a $10,000 investment |
| $108 | 1.03% |
How did the Fund perform last year?
- For the reporting period ended May 31, 2025, the Fund's Investor A Shares returned 9.31%.
- For the same period, the Fund’s benchmark, the MSCI All Country World Index, returned 13.65%.
What contributed to performance?
In sector terms, leading contributors included stock selection in energy along with an overweight to, and stock selection within, materials. At the individual stock level, semiconductor company Broadcom Inc. had been a prime beneficiary of optimism around artificial intelligence (“AI”). Broadcom remains well-positioned as the market shifts toward application-specific chips, which are increasingly critical to improving AI model efficiency. Philip Morris International Inc. delivered strong results driven by the expansion of its smoke-free portfolio. The Fund exited the position due to rising competition in U.S. nicotine pouches and concerns that Philip Morris may need to cut prices to remain competitive. Shares of Spanish Bank BBVA rose notably since the start of 2025 as European financials have benefited from higher interest rates and plans for fiscal stimulus. In addition, BBVA posted earnings beats for both the fourth quarter of 2024 and first quarter of 2025, driven by its trading division.
What detracted from performance?
Stock selection in consumer discretionary weighed on return, along with overweights to, and stock selection within, healthcare and consumer staples. At the individual stock level, Novo Nordisk A/S declined on disappointing trial data for CagriSema, its next generation weight loss drug, along with market share gains by competitor Eli Lilly. The Fund continued to hold the stock given CagriSema’s comparable efficacy to Eli Lilly’s incumbent drug and the expanding weight loss market. Shares of U.S. managed care company United Health Group Inc. declined late in the period, following downgraded guidance driven by higher-than-expected claims activity. The current valuation appeared compelling given structural tailwinds for Medicare Advantage broadly and potential levers available to the company to help improve profitability. U.S. semiconductor manufacturer Texas Instruments Inc. declined sharply following weak fourth quarter 2024 results driven by softness in the industrial and auto markets, which led to elevated inventories and lower revenue and net income. The Fund exited the position.
The views expressed reflect the opinions of BlackRock as of the date of this report and are subject to change based on changes in market, economic or other conditions. These views are not intended to be a forecast of future events and are no guarantee of future results.
Fund performance
Cumulative performance: June 1, 2015 through May 31, 2025
Initial investment of $10,000
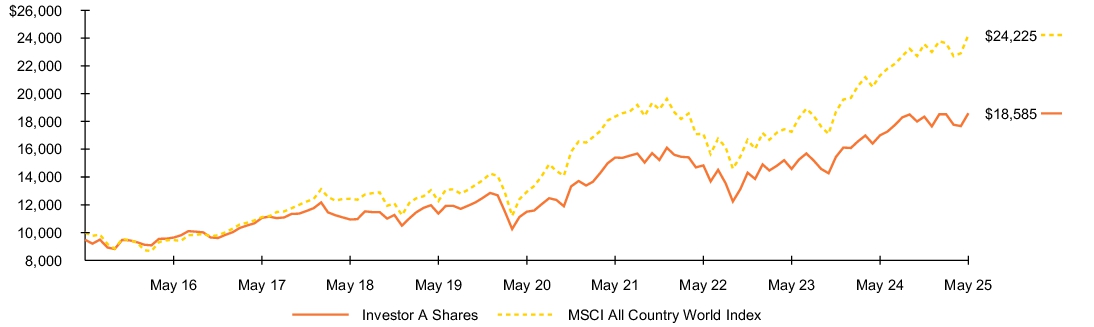
See “Average annual total returns” for additional information on fund performance.
Average annual total returns
| 1 Year | 5 Years | 10 Years | |||
| 9.31 | % | 10.07 | % | 6.97 | % |
| 3.57 | 8.89 | 6.39 | |||
| 13.65 | 13.37 | 9.25 |
Key Fund statistics
| $1,009,586,312 |
| 48 |
| $6,627,287 |
| 44% |
What did the Fund invest in?
(as of May 31, 2025)
Geographic allocation
| Country | Percent of Net Assets |
|
| 66.4 | % | |
| 10.8 | ||
| 5.3 | ||
| 3.8 | ||
| 2.5 | ||
| 2.2 | ||
| 2.1 | ||
| 2.0 | ||
| 2.0 | ||
| 1.5 | ||
| 1.6 | ||
| (0.2 | ) |
Ten largest holdings
| Security(a) | Percent of Net Assets |
|
| 5.9 | % | |
| 3.9 | ||
| 3.8 | ||
| 3.4 | ||
| 2.8 | ||
| 2.7 | ||
| 2.7 | ||
| 2.7 | ||
| 2.6 | ||
| 2.6 |
| Excludes short-term securities. |
Ten largest holdings
| Security(a) | Percent of Net Assets |
|
| 5.9 | % | |
| 3.9 | ||
| 3.8 | ||
| 3.4 | ||
| 2.8 | ||
| 2.7 | ||
| 2.7 | ||
| 2.7 | ||
| 2.6 | ||
| 2.6 |
| Excludes short-term securities. |