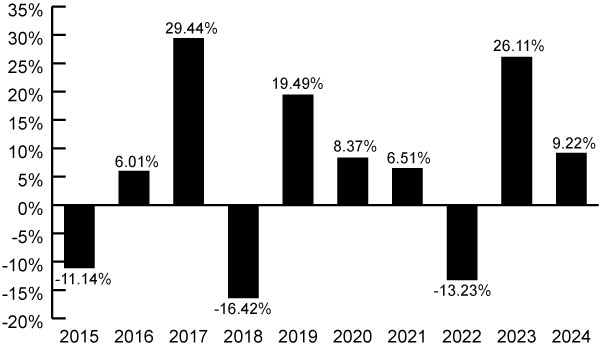
The following bar chart shows the total return of the Emerging Markets High Dividend Fund from year to year (on a calendar year-to-date basis) and the table shows the Emerging Markets High Dividend Fund’s average annual total return over time compared to one or more broad measures of market performance. Both the bar chart and the table assume that all dividends and distributions are reinvested in the Emerging Markets High Dividend Fund and, by comparing the Fund’s Retail Class performance (the class with the longest period of annual returns) to one or more broad measures of market performance, give some indication of the risks of an investment in the Fund. The Emerging Markets High Dividend Fund’s past performance, before and after taxes, is not necessarily an indication of how the Emerging Markets High Dividend Fund will perform in the future.
Updated performance information is available at www.cullenfunds.com or by calling 1-877-485-8586.
| Best and Worst Quarter Returns (for the period reflected in the bar chart above) | ||
| Return | Quarter/Year | |
| Highest Return | 21.08% | Q |
| Lowest Return | -26.19% | Q |
| Average Annual Total Returns as of December 31, 2024b | |||
| Emerging Markets High Dividend Fund, Retail Class | 1 Year | 5 Year | 10 Year |
| Returns before taxes | 9.22% | 6.65% | 5.32% |
| Returns after taxes on distributionsc | 8.40% | 5.57% | 4.19% |
| Returns after taxes on distributions and sale of Fund shares | 6.01% | 4.87% | 3.80% |
| MSCI Emerging Markets Stock Index (reflects no deduction for fees, expenses or taxes) | 7.50% | 1.70% | 3.64% |
| a | The Emerging Markets High Dividend Fund’s 2025 year-to-date total return through June 30, 2025 was 11.77%.
|
| b | The bar chart and table disclose returns only for Retail Class shares which are not offered by this prospectus. No information is shown for Class R6 shares because they are newly organized. Annual returns for Class R6 shares would have been substantially similar to those shown here because the shares are invested in the same portfolio of securities and the annual returns would differ only to the extent that Class R6 shares do not have the same expenses. Return information for the Fund’s Class R6 shares will be shown in future prospectuses offering the Fund’s Class R6 shares after the shares have a full calendar year of return information to report.
|
| c | After-tax returns are shown for Retail Class shares only. After-tax returns for other share class shares will differ. After-tax returns are calculated using the historical highest individual federal marginal income tax rates and do not reflect the impact of state and local taxes. Actual after-tax returns depend on your tax situation and may differ from those shown. Furthermore, the after-tax returns shown are not relevant to those who hold their shares through tax-deferred arrangements such as 401(k) plans or individual retirement accounts (“IRAs”). |