Fiscal Year 2026 First Quarter Results August 5, 2025

2Hamilton Lane | Global Leader in the Private Markets Today's Speakers Erik Hirsch Co-CEO Jeff Armbrister Chief Financial Officer John Oh Head of Shareholder Relations
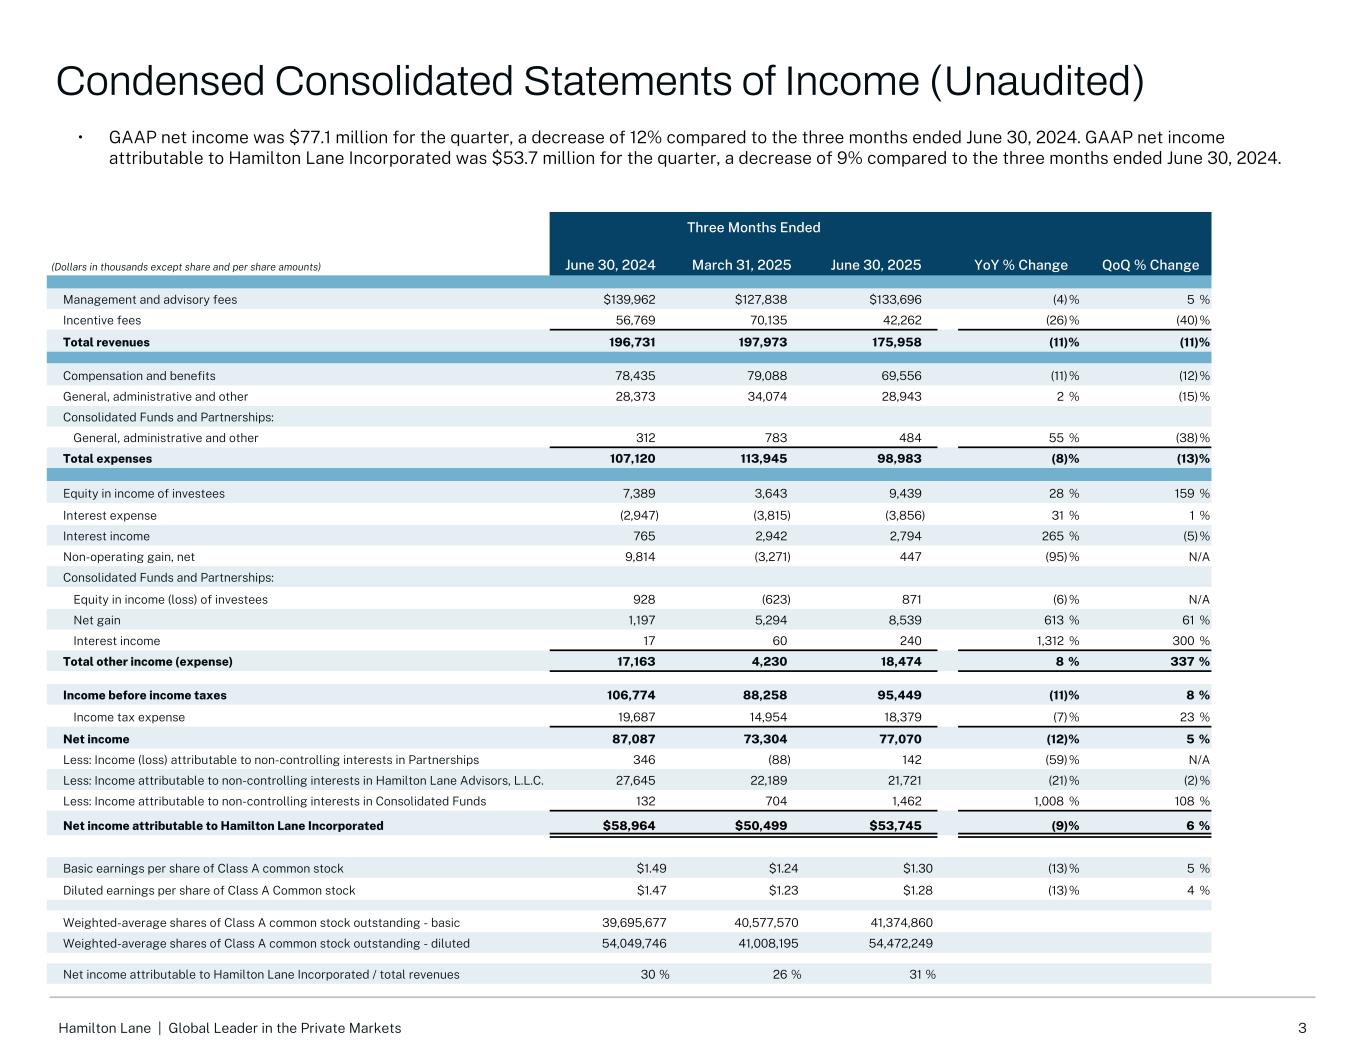
3Hamilton Lane | Global Leader in the Private Markets • GAAP net income was $77.1 million for the quarter, a decrease of 12% compared to the three months ended June 30, 2024. GAAP net income attributable to Hamilton Lane Incorporated was $53.7 million for the quarter, a decrease of 9% compared to the three months ended June 30, 2024. Condensed Consolidated Statements of Income (Unaudited) Three Months Ended (Dollars in thousands except share and per share amounts) June 30, 2024 March 31, 2025 June 30, 2025 YoY % Change QoQ % Change Management and advisory fees $139,962 $127,838 $133,696 (4) % 5 % Incentive fees 56,769 70,135 42,262 (26) % (40) % Total revenues 196,731 197,973 175,958 (11) % (11) % Compensation and benefits 78,435 79,088 69,556 (11) % (12) % General, administrative and other 28,373 34,074 28,943 2 % (15) % Consolidated Funds and Partnerships: General, administrative and other 312 783 484 55 % (38) % Total expenses 107,120 113,945 98,983 (8) % (13) % Equity in income of investees 7,389 3,643 9,439 28 % 159 % Interest expense (2,947) (3,815) (3,856) 31 % 1 % Interest income 765 2,942 2,794 265 % (5) % Non-operating gain, net 9,814 (3,271) 447 (95) % N/A Consolidated Funds and Partnerships: Equity in income (loss) of investees 928 (623) 871 (6) % N/A Net gain 1,197 5,294 8,539 613 % 61 % Interest income 17 60 240 1,312 % 300 % Total other income (expense) 17,163 4,230 18,474 8 % 337 % Income before income taxes 106,774 88,258 95,449 (11) % 8 % Income tax expense 19,687 14,954 18,379 (7) % 23 % Net income 87,087 73,304 77,070 (12) % 5 % Less: Income (loss) attributable to non-controlling interests in Partnerships 346 (88) 142 (59) % N/A Less: Income attributable to non-controlling interests in Hamilton Lane Advisors, L.L.C. 27,645 22,189 21,721 (21) % (2) % Less: Income attributable to non-controlling interests in Consolidated Funds 132 704 1,462 1,008 % 108 % Net income attributable to Hamilton Lane Incorporated $58,964 $50,499 $53,745 (9) % 6 % Basic earnings per share of Class A common stock $1.49 $1.24 $1.30 (13) % 5 % Diluted earnings per share of Class A Common stock $1.47 $1.23 $1.28 (13) % 4 % Weighted-average shares of Class A common stock outstanding - basic 39,695,677 40,577,570 41,374,860 Weighted-average shares of Class A common stock outstanding - diluted 54,049,746 41,008,195 54,472,249 Net income attributable to Hamilton Lane Incorporated / total revenues 30 % 26 % 31 %
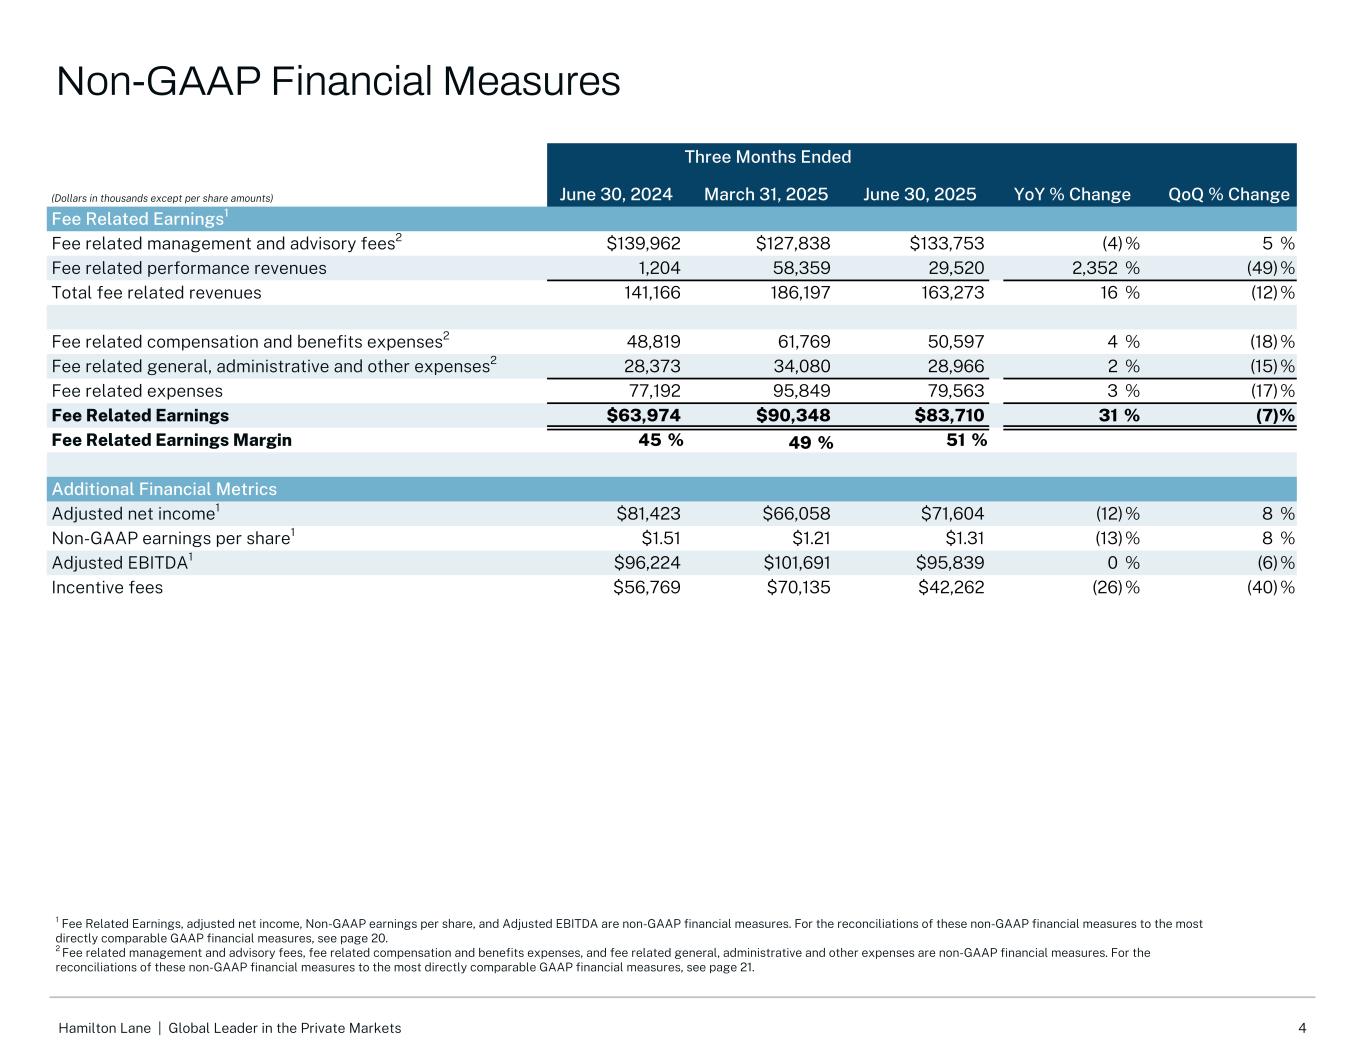
4Hamilton Lane | Global Leader in the Private Markets 1 Fee Related Earnings, adjusted net income, Non-GAAP earnings per share, and Adjusted EBITDA are non-GAAP financial measures. For the reconciliations of these non-GAAP financial measures to the most directly comparable GAAP financial measures, see page 20. 2 Fee related management and advisory fees, fee related compensation and benefits expenses, and fee related general, administrative and other expenses are non-GAAP financial measures. For the reconciliations of these non-GAAP financial measures to the most directly comparable GAAP financial measures, see page 21. Three Months Ended (Dollars in thousands except per share amounts) June 30, 2024 March 31, 2025 June 30, 2025 YoY % Change QoQ % Change Fee Related Earnings1 Fee related management and advisory fees2 $139,962 $127,838 $133,753 (4) % 5 % Fee related performance revenues 1,204 58,359 29,520 2,352 % (49) % Total fee related revenues 141,166 186,197 163,273 16 % (12) % Fee related compensation and benefits expenses2 48,819 61,769 50,597 4 % (18) % Fee related general, administrative and other expenses2 28,373 34,080 28,966 2 % (15) % Fee related expenses 77,192 95,849 79,563 3 % (17) % Fee Related Earnings $63,974 $90,348 $83,710 31 % (7) % Fee Related Earnings Margin 45 % 49 % 51 % Additional Financial Metrics Adjusted net income1 $81,423 $66,058 $71,604 (12) % 8 % Non-GAAP earnings per share1 $1.51 $1.21 $1.31 (13) % 8 % Adjusted EBITDA1 $96,224 $101,691 $95,839 0 % (6) % Incentive fees $56,769 $70,135 $42,262 (26) % (40) % Non-GAAP Financial Measures
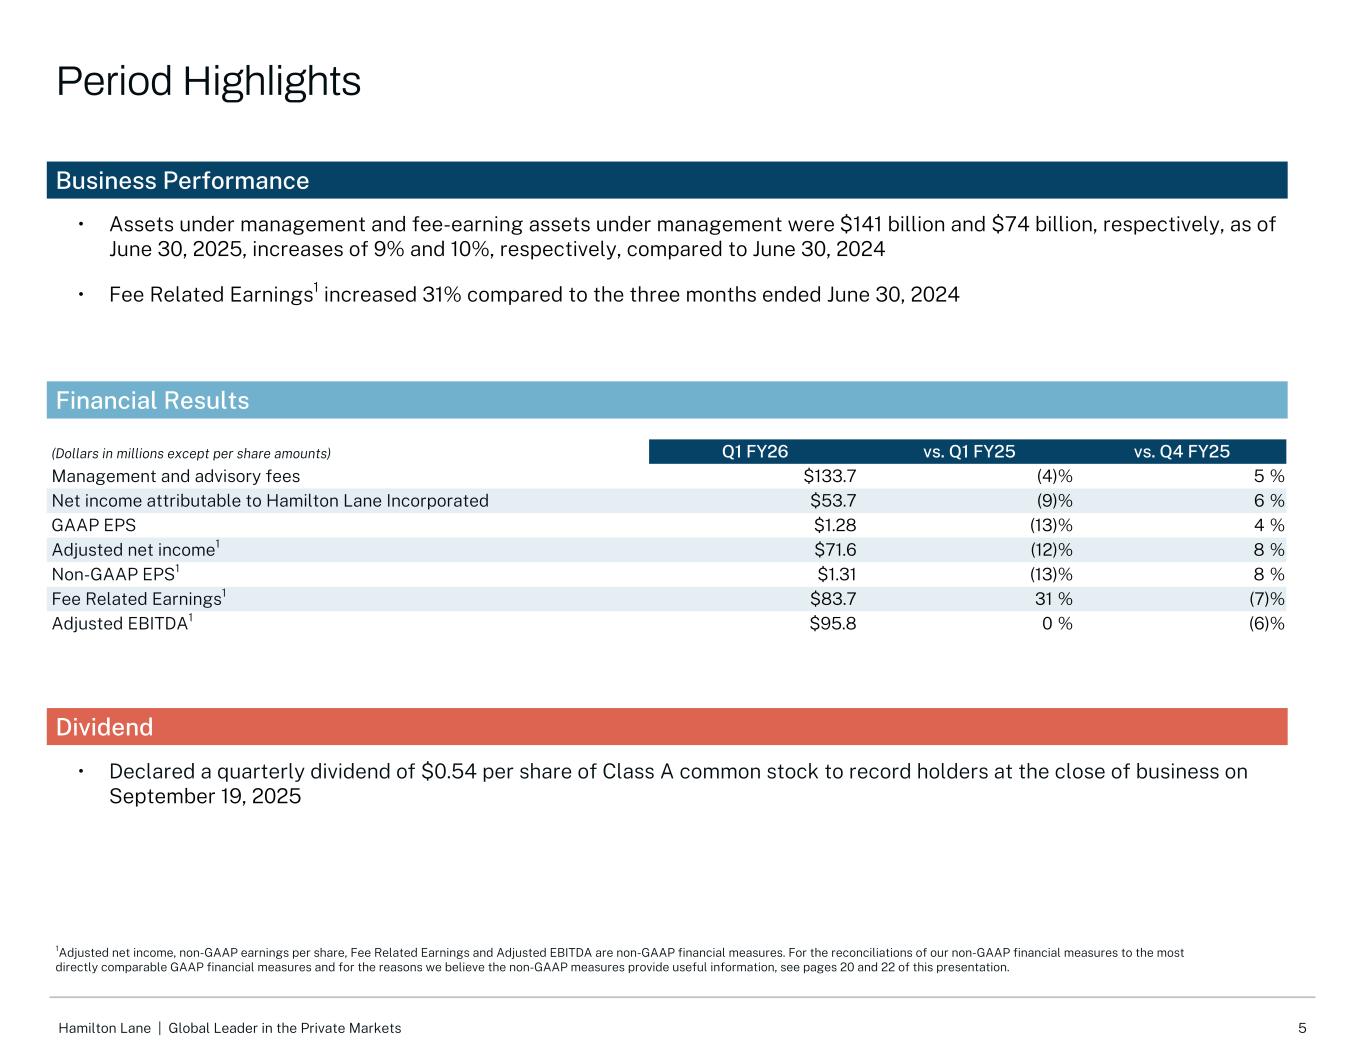
5Hamilton Lane | Global Leader in the Private Markets Business Performance Financial Results Dividend • Assets under management and fee-earning assets under management were $141 billion and $74 billion, respectively, as of June 30, 2025, increases of 9% and 10%, respectively, compared to June 30, 2024 • Fee Related Earnings1 increased 31% compared to the three months ended June 30, 2024 (Dollars in millions except per share amounts) Q1 FY26 vs. Q1 FY25 vs. Q4 FY25 Management and advisory fees $133.7 (4) % 5 % Net income attributable to Hamilton Lane Incorporated $53.7 (9) % 6 % GAAP EPS $1.28 (13) % 4 % Adjusted net income1 $71.6 (12) % 8 % Non-GAAP EPS1 $1.31 (13) % 8 % Fee Related Earnings1 $83.7 31 % (7) % Adjusted EBITDA1 $95.8 0 % (6) % • Declared a quarterly dividend of $0.54 per share of Class A common stock to record holders at the close of business on September 19, 2025 1Adjusted net income, non-GAAP earnings per share, Fee Related Earnings and Adjusted EBITDA are non-GAAP financial measures. For the reconciliations of our non-GAAP financial measures to the most directly comparable GAAP financial measures and for the reasons we believe the non-GAAP measures provide useful information, see pages 20 and 22 of this presentation. Period Highlights
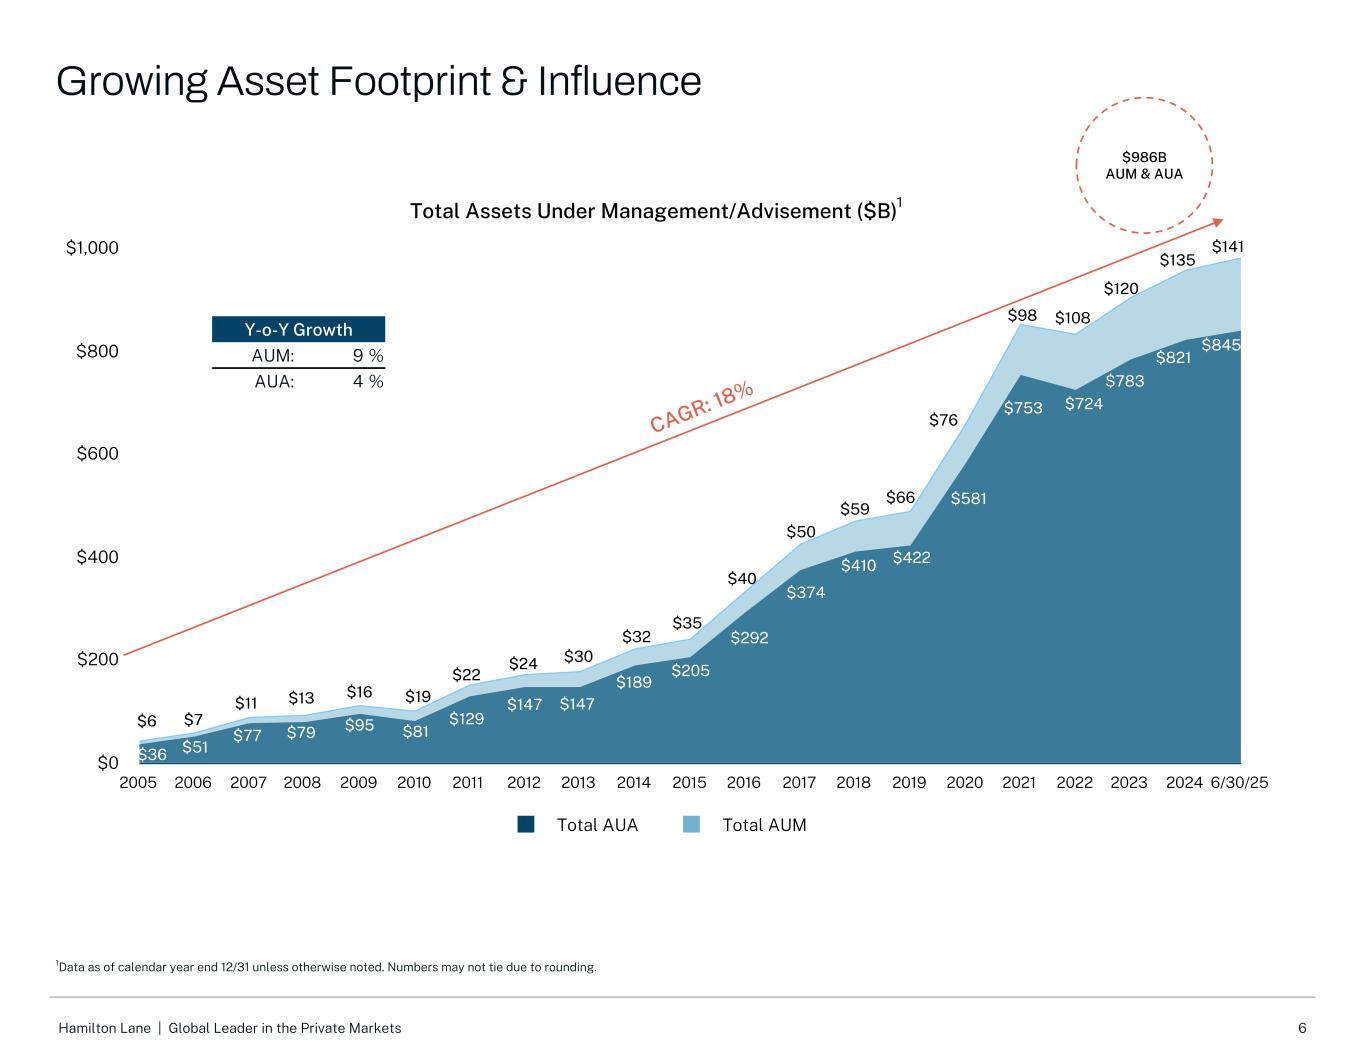
6Hamilton Lane | Global Leader in the Private Markets Total Assets Under Management/Advisement ($B) Total AUA Total AUM 2005 2006 2007 2008 2009 2010 2011 2012 2013 2014 2015 2016 2017 2018 2019 2020 2021 2022 2023 2024 6/30/25 $0 $200 $400 $600 $800 $1,000 Y-o-Y Growth AUM: 9 % AUA: 4 % $986B AUM & AUA 1 CAGR: 18% $6 $7 $11 $13 $16 $19 $22 $24 $30 $32 $35 $40 $50 $59 $66 $76 $98 $108 $36 $51 $77 $79 $95 $81 $129 $147 $147 $189 $205 $292 $374 $410 $422 $581 $753 $724 $845 $141 Growing Asset Footprint & Influence 1Data as of calendar year end 12/31 unless otherwise noted. Numbers may not tie due to rounding. $783 $120 $821 $135
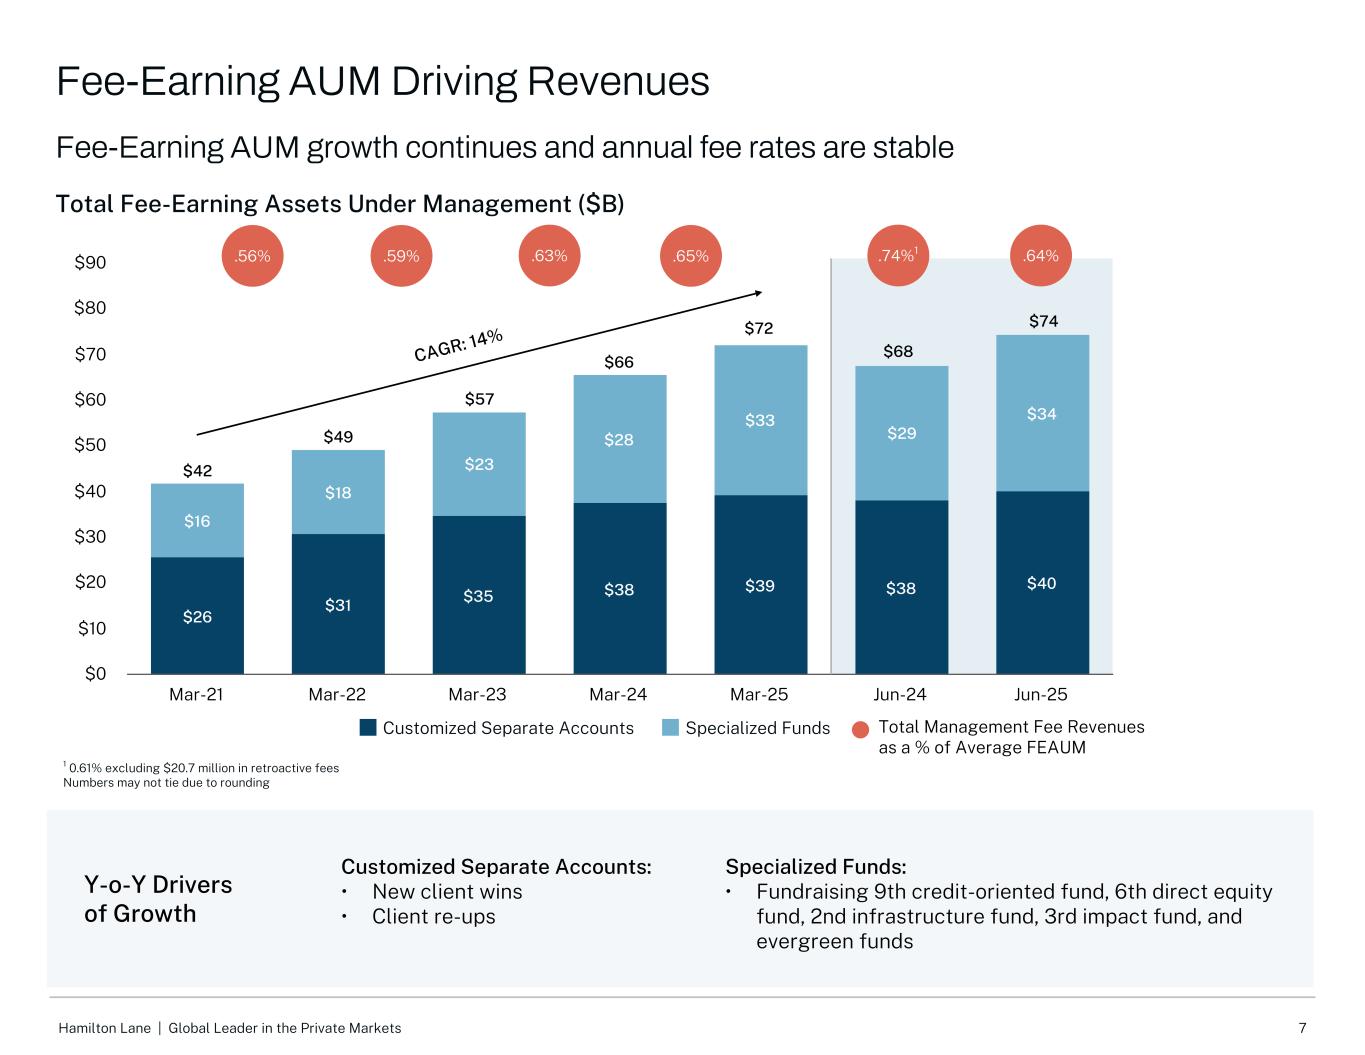
7Hamilton Lane | Global Leader in the Private Markets Y-o-Y Drivers of Growth Total Fee-Earning Assets Under Management ($B) $26 $31 $35 $38 $39 $38 $40 $16 $18 $23 $28 $33 $29 $34 Customized Separate Accounts Specialized Funds Mar-21 Mar-22 Mar-23 Mar-24 Mar-25 Jun-24 Jun-25 $0 $10 $20 $30 $40 $50 $60 $70 $80 $90 Fee-Earning AUM growth continues and annual fee rates are stable CAGR: 14% 1 0.61% excluding $20.7 million in retroactive fees Numbers may not tie due to rounding Total Management Fee Revenues as a % of Average FEAUM Customized Separate Accounts: • New client wins • Client re-ups Specialized Funds: • Fundraising 9th credit-oriented fund, 6th direct equity fund, 2nd infrastructure fund, 3rd impact fund, and evergreen funds .56% $42 $72 $57 $49 $68 Fee-Earning AUM Driving Revenues .59% .63% .65% .64%.74%1 $66 $74
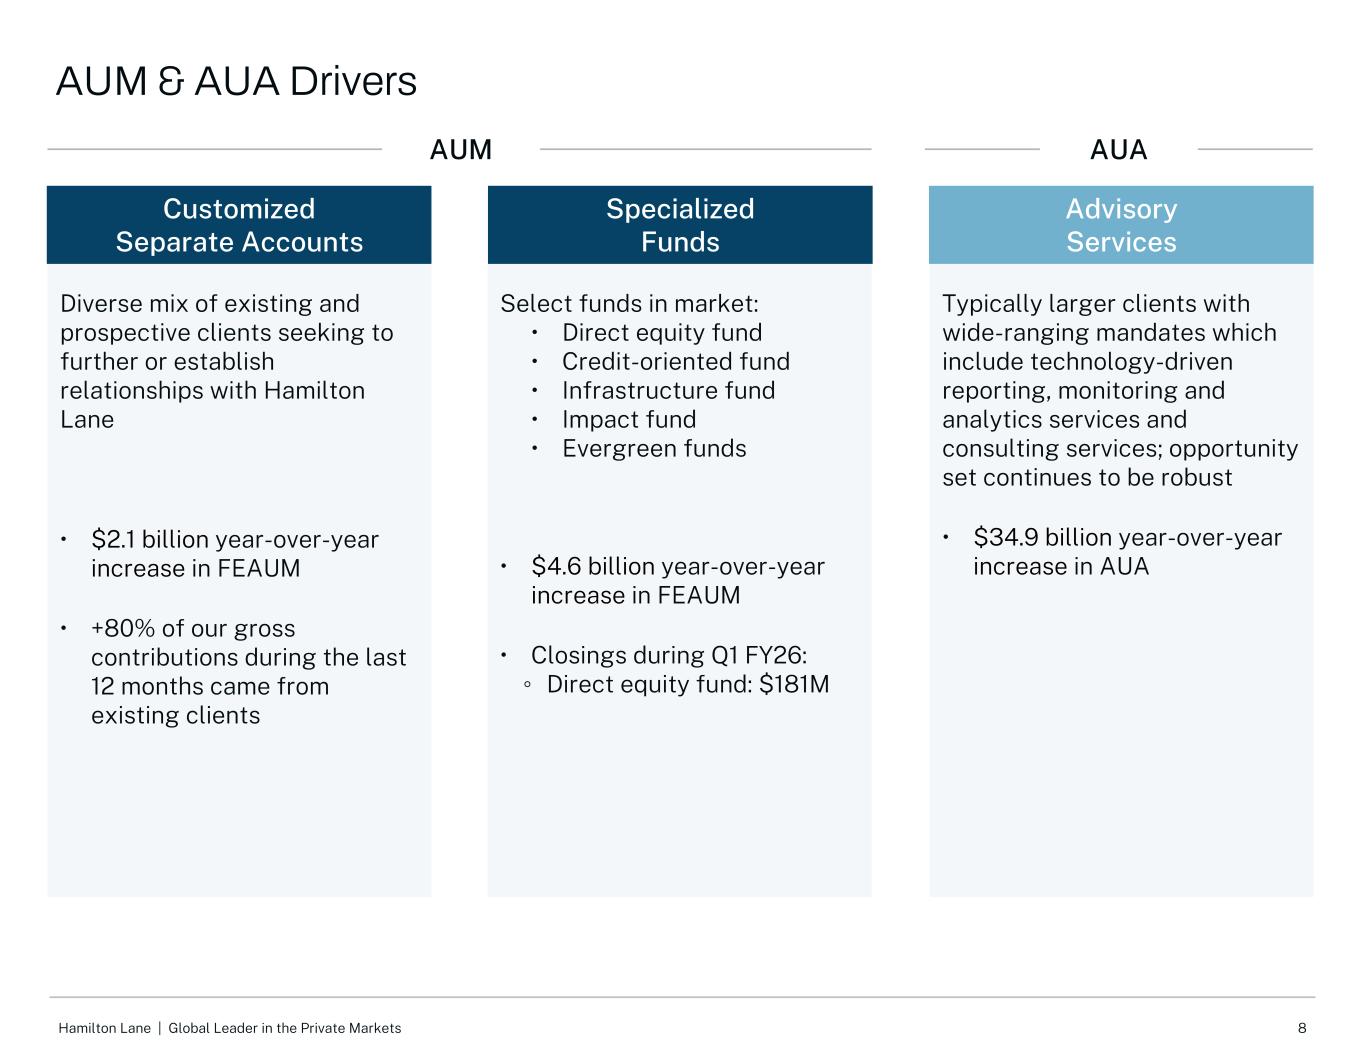
8Hamilton Lane | Global Leader in the Private Markets Customized Separate Accounts Specialized Funds Advisory Services Diverse mix of existing and prospective clients seeking to further or establish relationships with Hamilton Lane • $2.1 billion year-over-year increase in FEAUM • +80% of our gross contributions during the last 12 months came from existing clients AUM AUM & AUA Drivers AUA Select funds in market: • Direct equity fund • Credit-oriented fund • Infrastructure fund • Impact fund • Evergreen funds • $4.6 billion year-over-year increase in FEAUM • Closings during Q1 FY26: ◦ Direct equity fund: $181M Typically larger clients with wide-ranging mandates which include technology-driven reporting, monitoring and analytics services and consulting services; opportunity set continues to be robust • $34.9 billion year-over-year increase in AUA

Financial Highlights
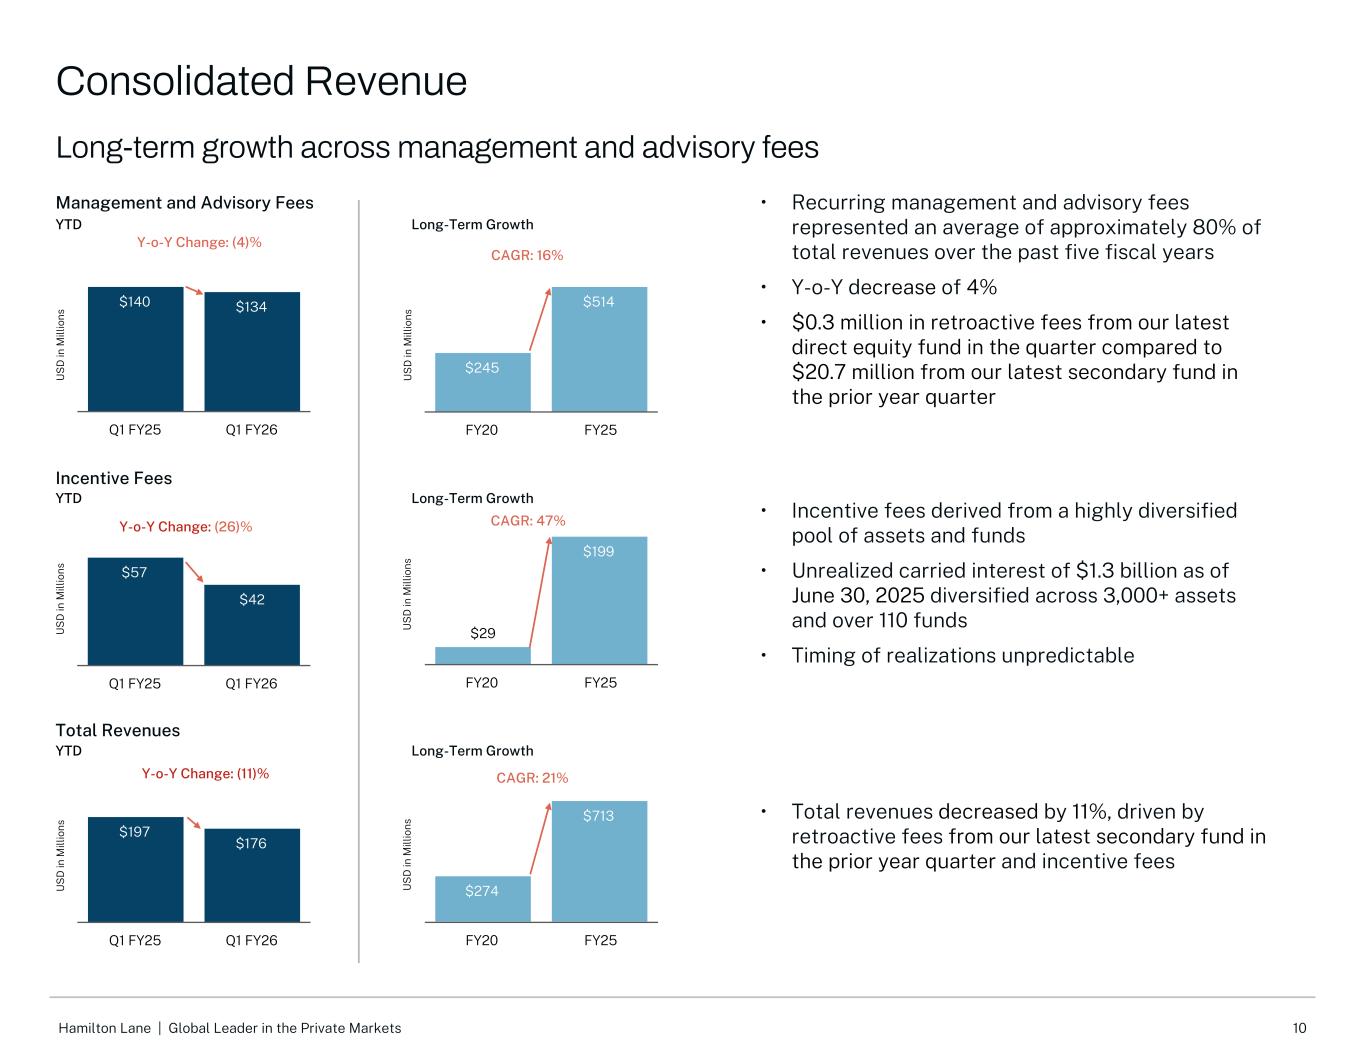
10Hamilton Lane | Global Leader in the Private Markets • Total revenues decreased by 11%, driven by retroactive fees from our latest secondary fund in the prior year quarter and incentive fees U S D in M ill io ns $197 $176 Q1 FY25 Q1 FY26 U S D in M ill io ns $57 $42 Q1 FY25 Q1 FY26 U S D in M ill io ns $140 $134 Q1 FY25 Q1 FY26 Management and Advisory Fees Incentive Fees Total Revenues YTD YTD Y-o-Y Change: (4)% YTD Y-o-Y Change: (11)% Y-o-Y Change: (26)% • Recurring management and advisory fees represented an average of approximately 80% of total revenues over the past five fiscal years • Y-o-Y decrease of 4% • $0.3 million in retroactive fees from our latest direct equity fund in the quarter compared to $20.7 million from our latest secondary fund in the prior year quarter • Incentive fees derived from a highly diversified pool of assets and funds • Unrealized carried interest of $1.3 billion as of June 30, 2025 diversified across 3,000+ assets and over 110 funds • Timing of realizations unpredictable U S D in M ill io ns $245 $514 FY20 FY25 Long-Term Growth U S D in M ill io ns $29 $199 FY20 FY25 Long-Term Growth CAGR: 16% U S D in M ill io ns $274 $713 FY20 FY25 Long-Term Growth CAGR: 21% CAGR: 47% Consolidated Revenue Long-term growth across management and advisory fees
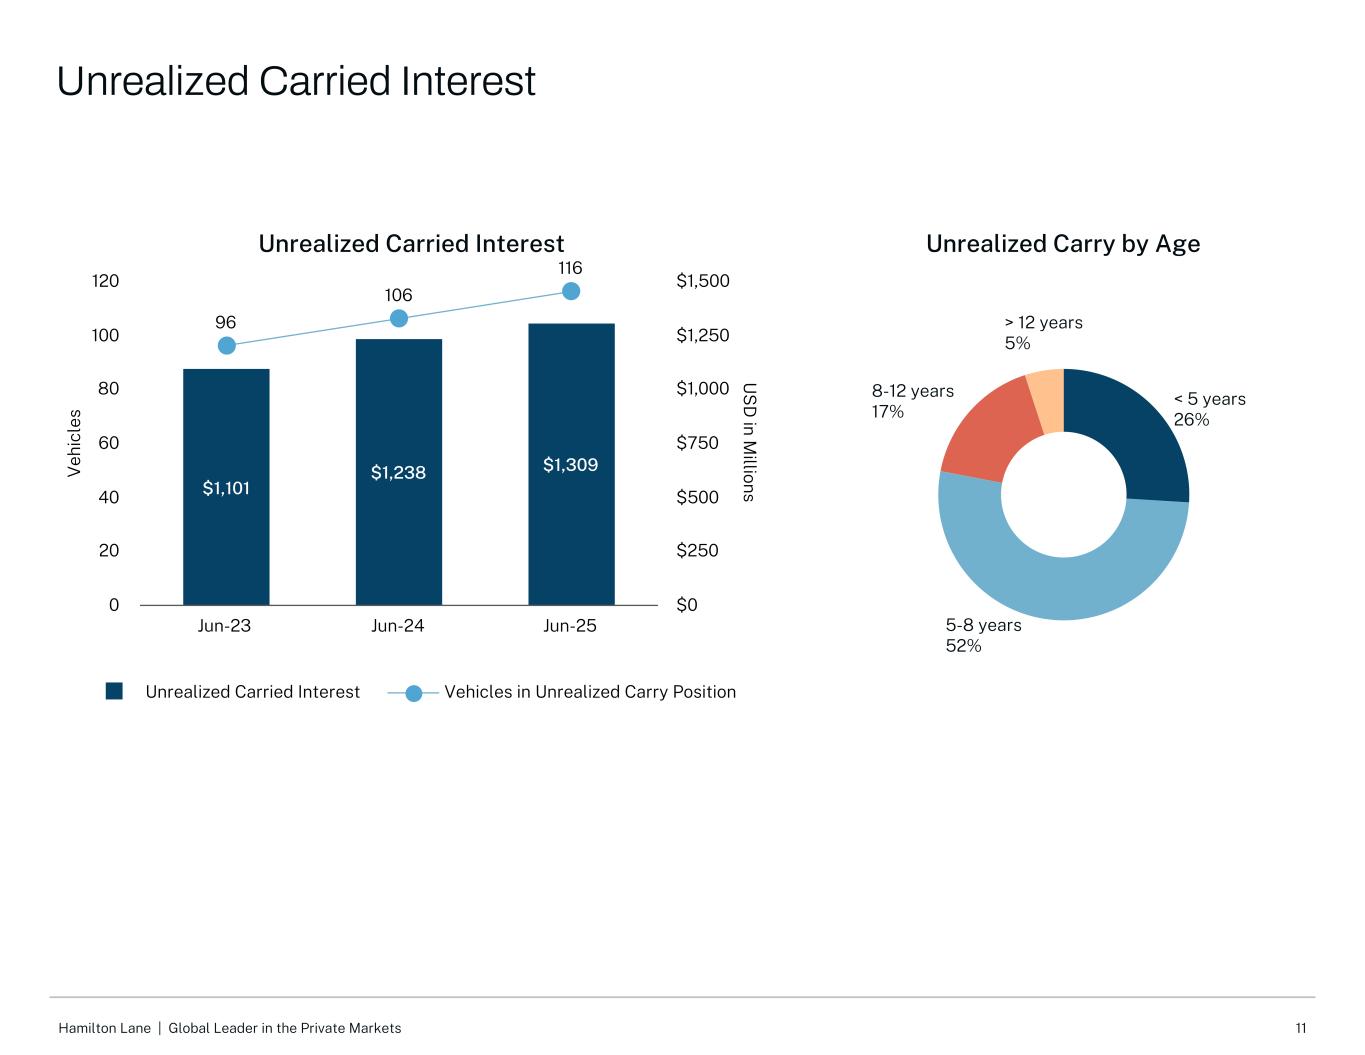
11Hamilton Lane | Global Leader in the Private Markets Period Ending V eh ic le s U S D in M illions Unrealized Carried Interest $1,101 $1,238 $1,309 96 106 116 Unrealized Carried Interest Vehicles in Unrealized Carry Position Jun-23 Jun-24 Jun-25 0 20 40 60 80 100 120 $0 $250 $500 $750 $1,000 $1,250 $1,500 Unrealized Carry by Age < 5 years 26% 5-8 years 52% 8-12 years 17% > 12 years 5% Unrealized Carried Interest
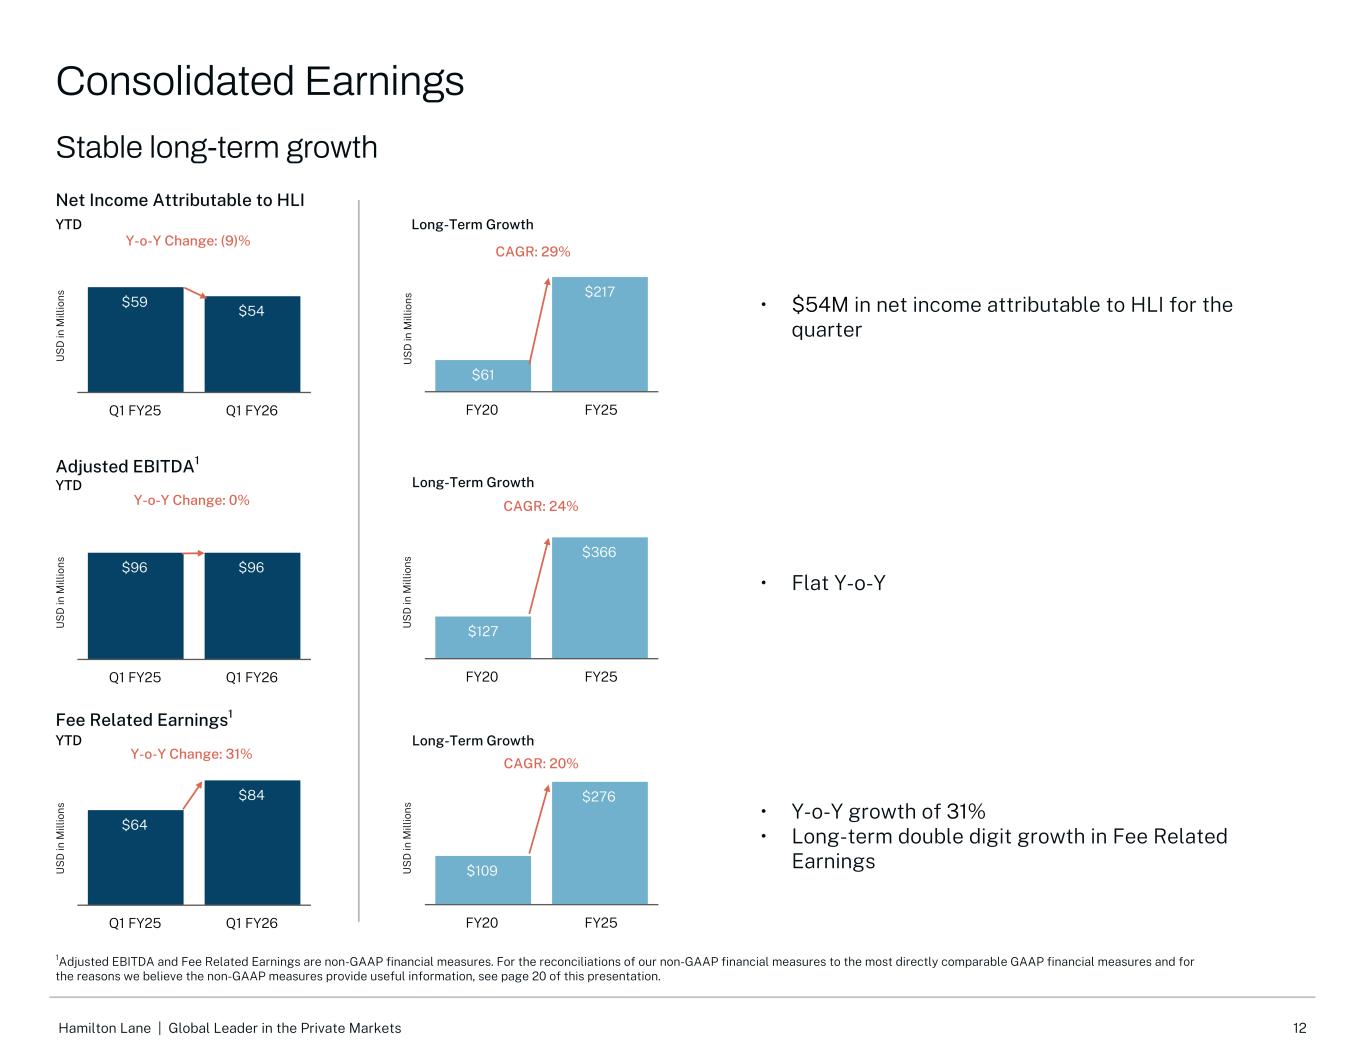
12Hamilton Lane | Global Leader in the Private Markets U S D in M ill io ns $61 $217 FY20 FY25 Net Income Attributable to HLI Adjusted EBITDA1 Fee Related Earnings1 U S D in M ill io ns $96 $96 Q1 FY25 Q1 FY26 U S D in M ill io ns $59 $54 Q1 FY25 Q1 FY26 U S D in M ill io ns $127 $366 FY20 FY25 U S D in M ill io ns $64 $84 Q1 FY25 Q1 FY26 U S D in M ill io ns $109 $276 FY20 FY25 Y-o-Y Change: (9)% 1Adjusted EBITDA and Fee Related Earnings are non-GAAP financial measures. For the reconciliations of our non-GAAP financial measures to the most directly comparable GAAP financial measures and for the reasons we believe the non-GAAP measures provide useful information, see page 20 of this presentation. Y-o-Y Change: 0% Y-o-Y Change: 31% CAGR: 20% CAGR: 24% Consolidated Earnings Stable long-term growth YTD YTD YTD Long-Term Growth Long-Term Growth Long-Term Growth • $54M in net income attributable to HLI for the quarter • Flat Y-o-Y • Y-o-Y growth of 31% • Long-term double digit growth in Fee Related Earnings CAGR: 29%
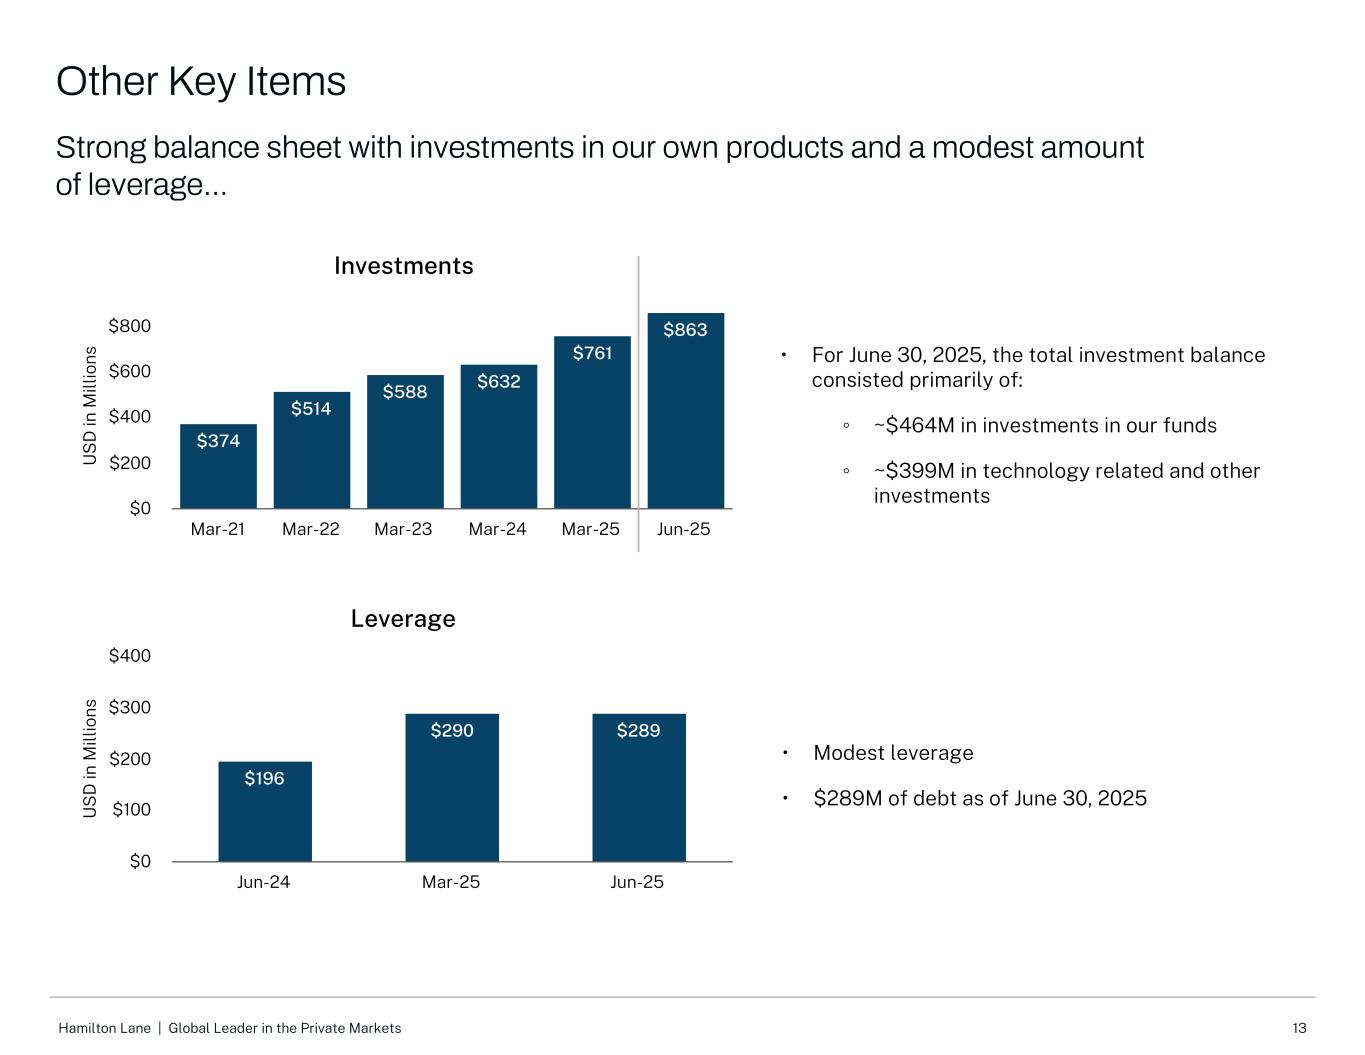
13Hamilton Lane | Global Leader in the Private Markets U S D in M ill io ns Investments $374 $514 $588 $632 $761 $863 Mar-21 Mar-22 Mar-23 Mar-24 Mar-25 Jun-25 $0 $200 $400 $600 $800 • For June 30, 2025, the total investment balance consisted primarily of: ◦ ~$464M in investments in our funds ◦ ~$399M in technology related and other investments • Modest leverage • $289M of debt as of June 30, 2025 U S D in M ill io ns Leverage $196 $290 $289 Jun-24 Mar-25 Jun-25 $0 $100 $200 $300 $400 Other Key Items Strong balance sheet with investments in our own products and a modest amount of leverage...

Appendix
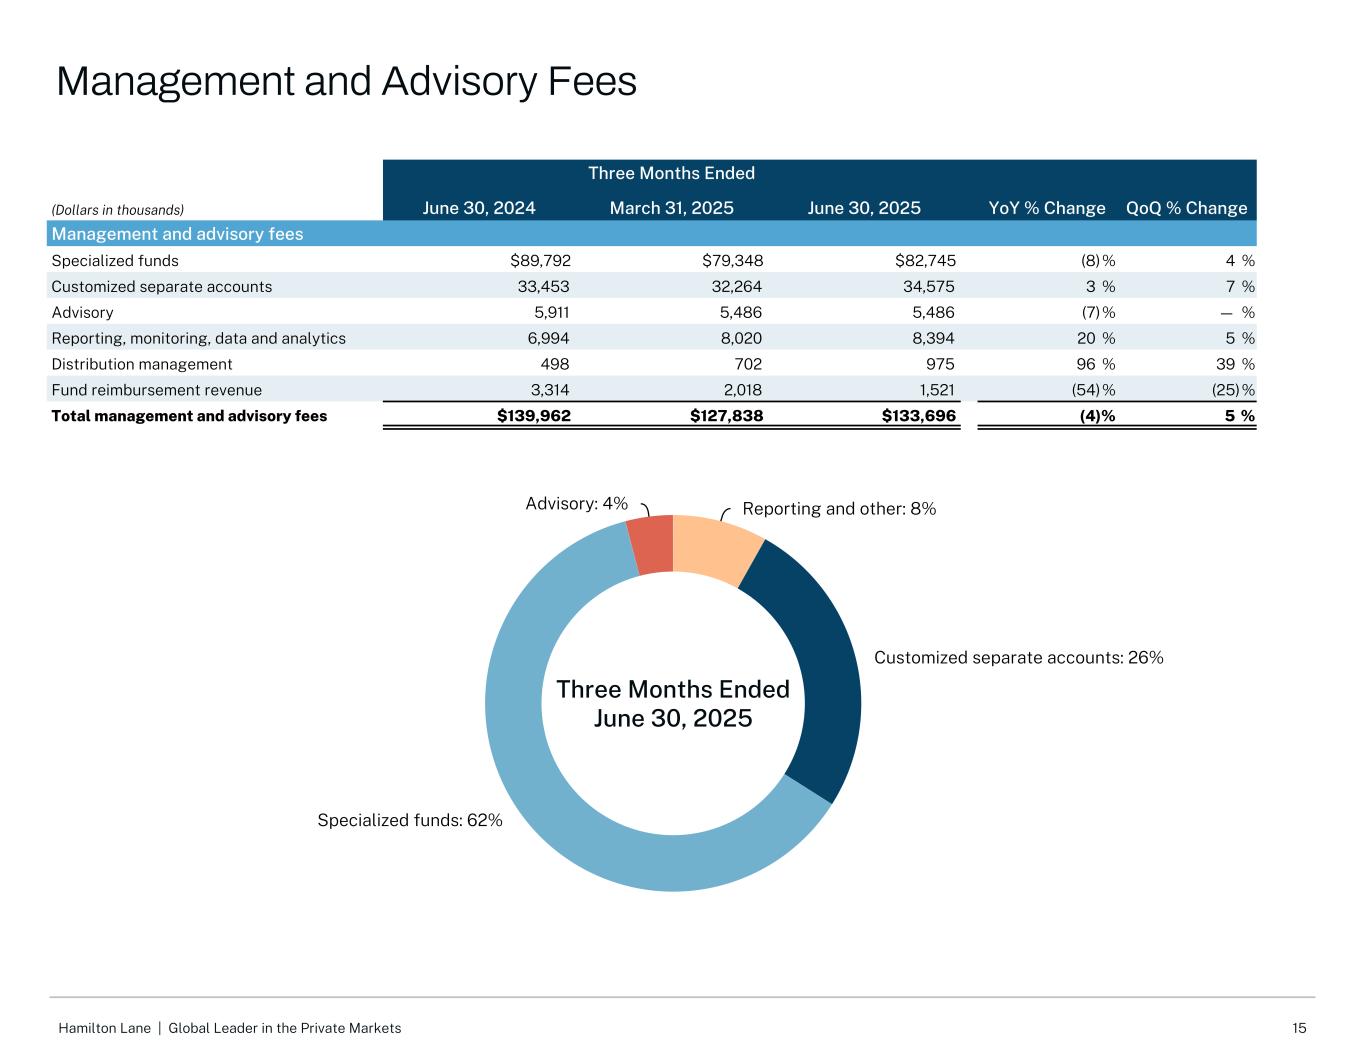
15Hamilton Lane | Global Leader in the Private Markets Three Months Ended (Dollars in thousands) June 30, 2024 March 31, 2025 June 30, 2025 YoY % Change QoQ % Change Management and advisory fees Specialized funds $89,792 $79,348 $82,745 (8) % 4 % Customized separate accounts 33,453 32,264 34,575 3 % 7 % Advisory 5,911 5,486 5,486 (7) % — % Reporting, monitoring, data and analytics 6,994 8,020 8,394 20 % 5 % Distribution management 498 702 975 96 % 39 % Fund reimbursement revenue 3,314 2,018 1,521 (54) % (25) % Total management and advisory fees $139,962 $127,838 $133,696 (4) % 5 % Reporting and other: 8% Customized separate accounts: 26% Specialized funds: 62% Advisory: 4% Three Months Ended June 30, 2025 Management and Advisory Fees
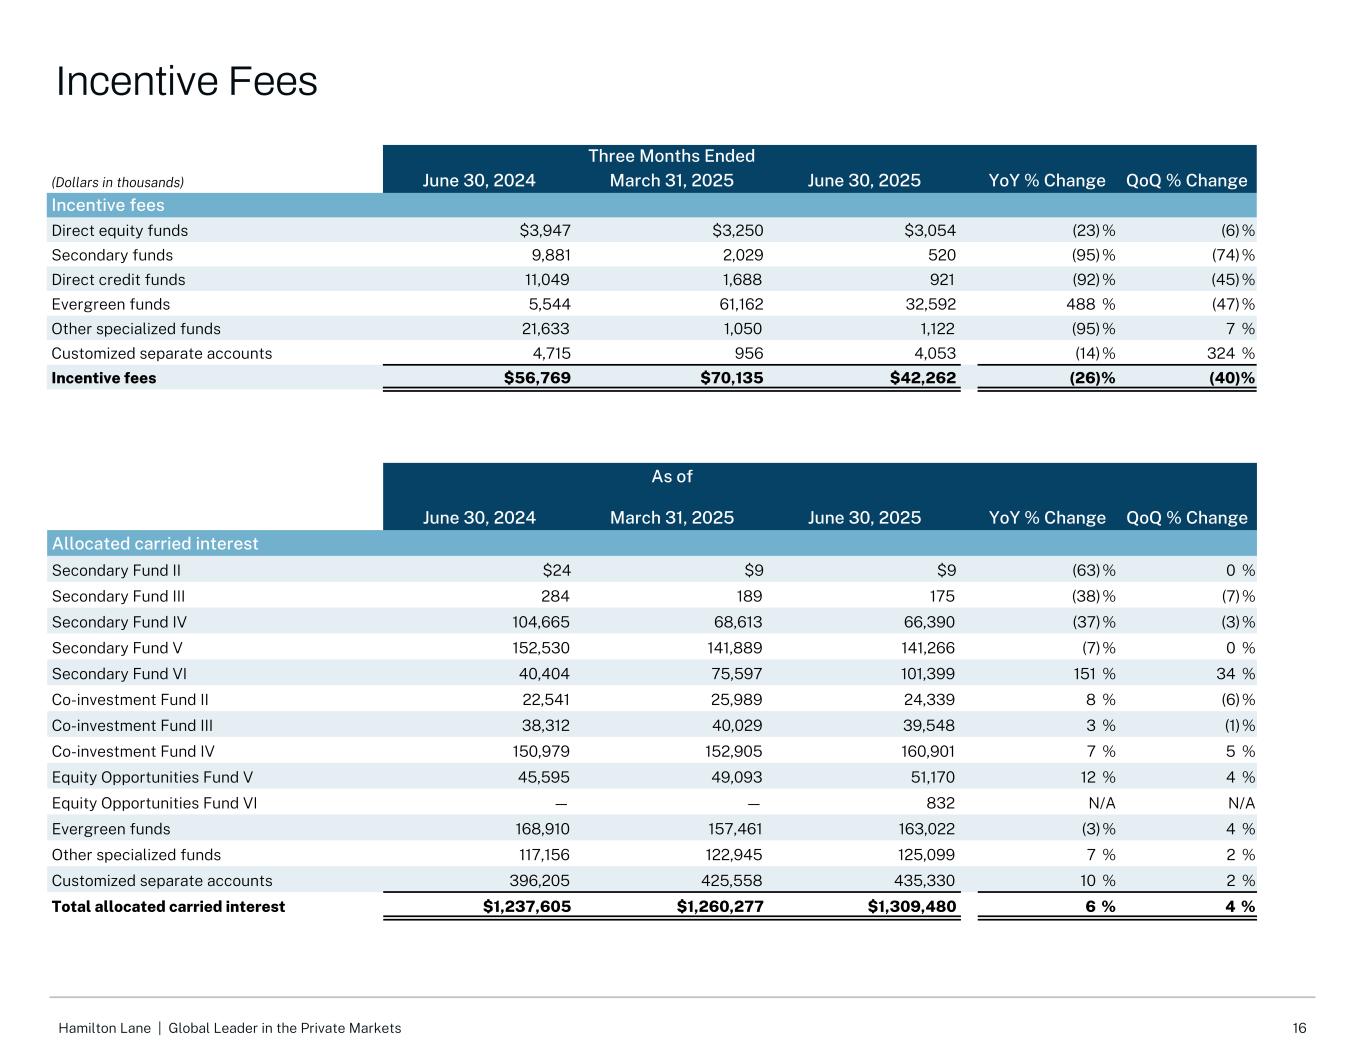
16Hamilton Lane | Global Leader in the Private Markets Three Months Ended (Dollars in thousands) June 30, 2024 March 31, 2025 June 30, 2025 YoY % Change QoQ % Change Incentive fees Direct equity funds $3,947 $3,250 $3,054 (23) % (6) % Secondary funds 9,881 2,029 520 (95) % (74) % Direct credit funds 11,049 1,688 921 (92) % (45) % Evergreen funds 5,544 61,162 32,592 488 % (47) % Other specialized funds 21,633 1,050 1,122 (95) % 7 % Customized separate accounts 4,715 956 4,053 (14) % 324 % Incentive fees $56,769 $70,135 $42,262 (26) % (40) % As of June 30, 2024 March 31, 2025 June 30, 2025 YoY % Change QoQ % Change Allocated carried interest Secondary Fund II $24 $9 $9 (63) % 0 % Secondary Fund III 284 189 175 (38) % (7) % Secondary Fund IV 104,665 68,613 66,390 (37) % (3) % Secondary Fund V 152,530 141,889 141,266 (7) % 0 % Secondary Fund VI 40,404 75,597 101,399 151 % 34 % Co-investment Fund II 22,541 25,989 24,339 8 % (6) % Co-investment Fund III 38,312 40,029 39,548 3 % (1) % Co-investment Fund IV 150,979 152,905 160,901 7 % 5 % Equity Opportunities Fund V 45,595 49,093 51,170 12 % 4 % Equity Opportunities Fund VI — — 832 N/A N/A Evergreen funds 168,910 157,461 163,022 (3) % 4 % Other specialized funds 117,156 122,945 125,099 7 % 2 % Customized separate accounts 396,205 425,558 435,330 10 % 2 % Total allocated carried interest $1,237,605 $1,260,277 $1,309,480 6 % 4 % Incentive Fees
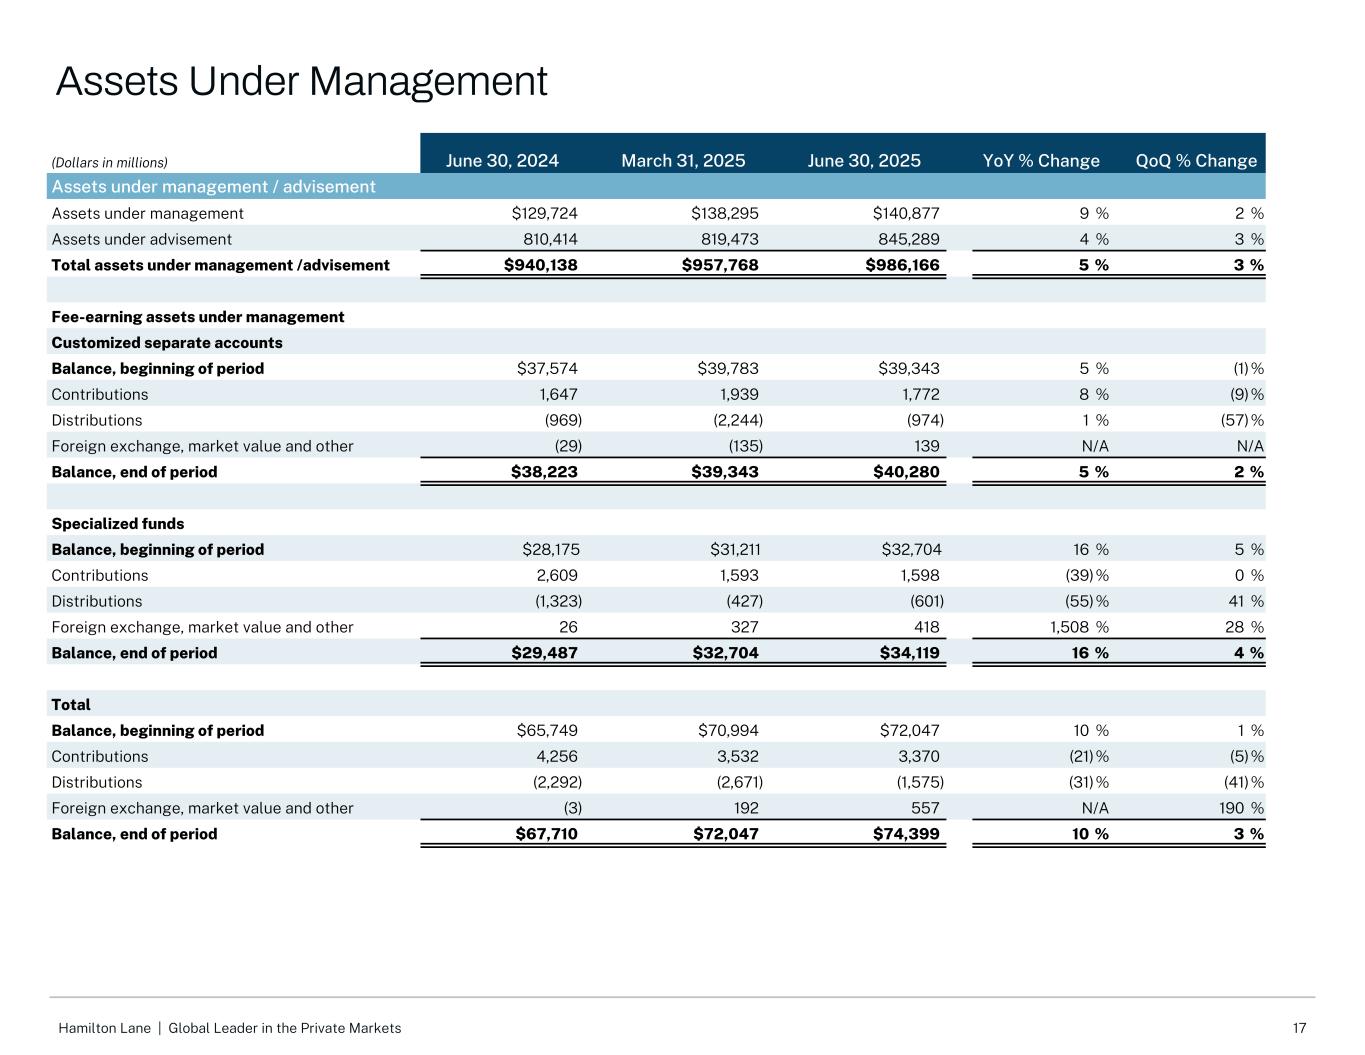
17Hamilton Lane | Global Leader in the Private Markets (Dollars in millions) June 30, 2024 March 31, 2025 June 30, 2025 YoY % Change QoQ % Change Assets under management / advisement Assets under management $129,724 $138,295 $140,877 9 % 2 % Assets under advisement 810,414 819,473 845,289 4 % 3 % Total assets under management /advisement $940,138 $957,768 $986,166 5 % 3 % Fee-earning assets under management Customized separate accounts Balance, beginning of period $37,574 $39,783 $39,343 5 % (1) % Contributions 1,647 1,939 1,772 8 % (9) % Distributions (969) (2,244) (974) 1 % (57) % Foreign exchange, market value and other (29) (135) 139 N/A N/A Balance, end of period $38,223 $39,343 $40,280 5 % 2 % Specialized funds Balance, beginning of period $28,175 $31,211 $32,704 16 % 5 % Contributions 2,609 1,593 1,598 (39) % 0 % Distributions (1,323) (427) (601) (55) % 41 % Foreign exchange, market value and other 26 327 418 1,508 % 28 % Balance, end of period $29,487 $32,704 $34,119 16 % 4 % Total Balance, beginning of period $65,749 $70,994 $72,047 10 % 1 % Contributions 4,256 3,532 3,370 (21) % (5) % Distributions (2,292) (2,671) (1,575) (31) % (41) % Foreign exchange, market value and other (3) 192 557 N/A 190 % Balance, end of period $67,710 $72,047 $74,399 10 % 3 % Assets Under Management
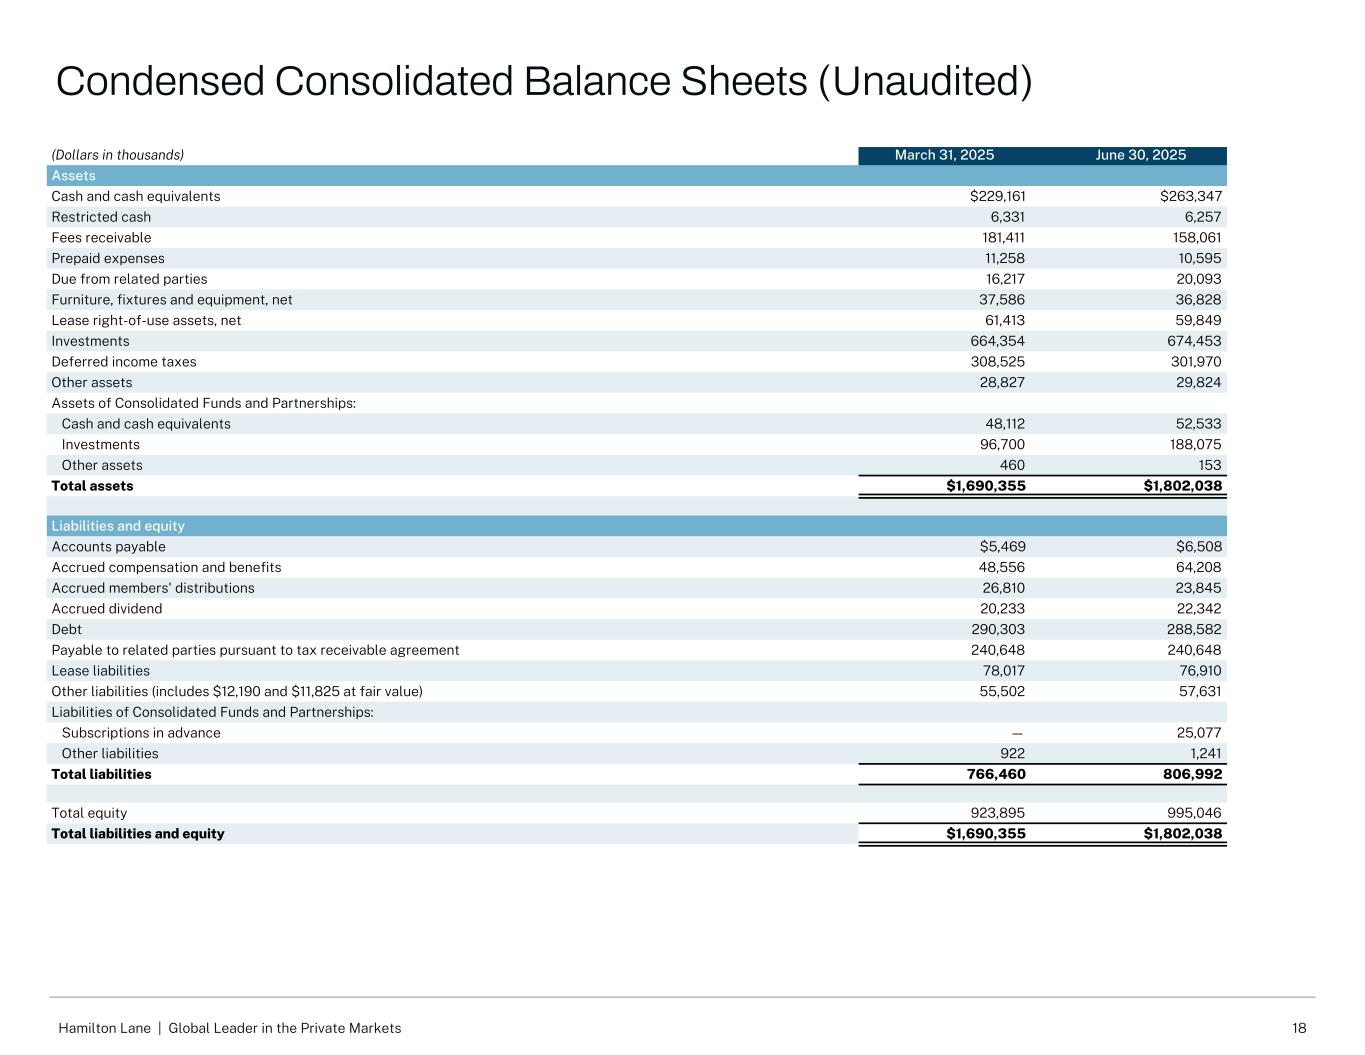
18Hamilton Lane | Global Leader in the Private Markets (Dollars in thousands) March 31, 2025 June 30, 2025 Assets Cash and cash equivalents $229,161 $263,347 Restricted cash 6,331 6,257 Fees receivable 181,411 158,061 Prepaid expenses 11,258 10,595 Due from related parties 16,217 20,093 Furniture, fixtures and equipment, net 37,586 36,828 Lease right-of-use assets, net 61,413 59,849 Investments 664,354 674,453 Deferred income taxes 308,525 301,970 Other assets 28,827 29,824 Assets of Consolidated Funds and Partnerships: Cash and cash equivalents 48,112 52,533 Investments 96,700 188,075 Other assets 460 153 Total assets $1,690,355 $1,802,038 Liabilities and equity Accounts payable $5,469 $6,508 Accrued compensation and benefits 48,556 64,208 Accrued members' distributions 26,810 23,845 Accrued dividend 20,233 22,342 Debt 290,303 288,582 Payable to related parties pursuant to tax receivable agreement 240,648 240,648 Lease liabilities 78,017 76,910 Other liabilities (includes $12,190 and $11,825 at fair value) 55,502 57,631 Liabilities of Consolidated Funds and Partnerships: Subscriptions in advance — 25,077 Other liabilities 922 1,241 Total liabilities 766,460 806,992 Total equity 923,895 995,046 Total liabilities and equity $1,690,355 $1,802,038 Condensed Consolidated Balance Sheets (Unaudited)
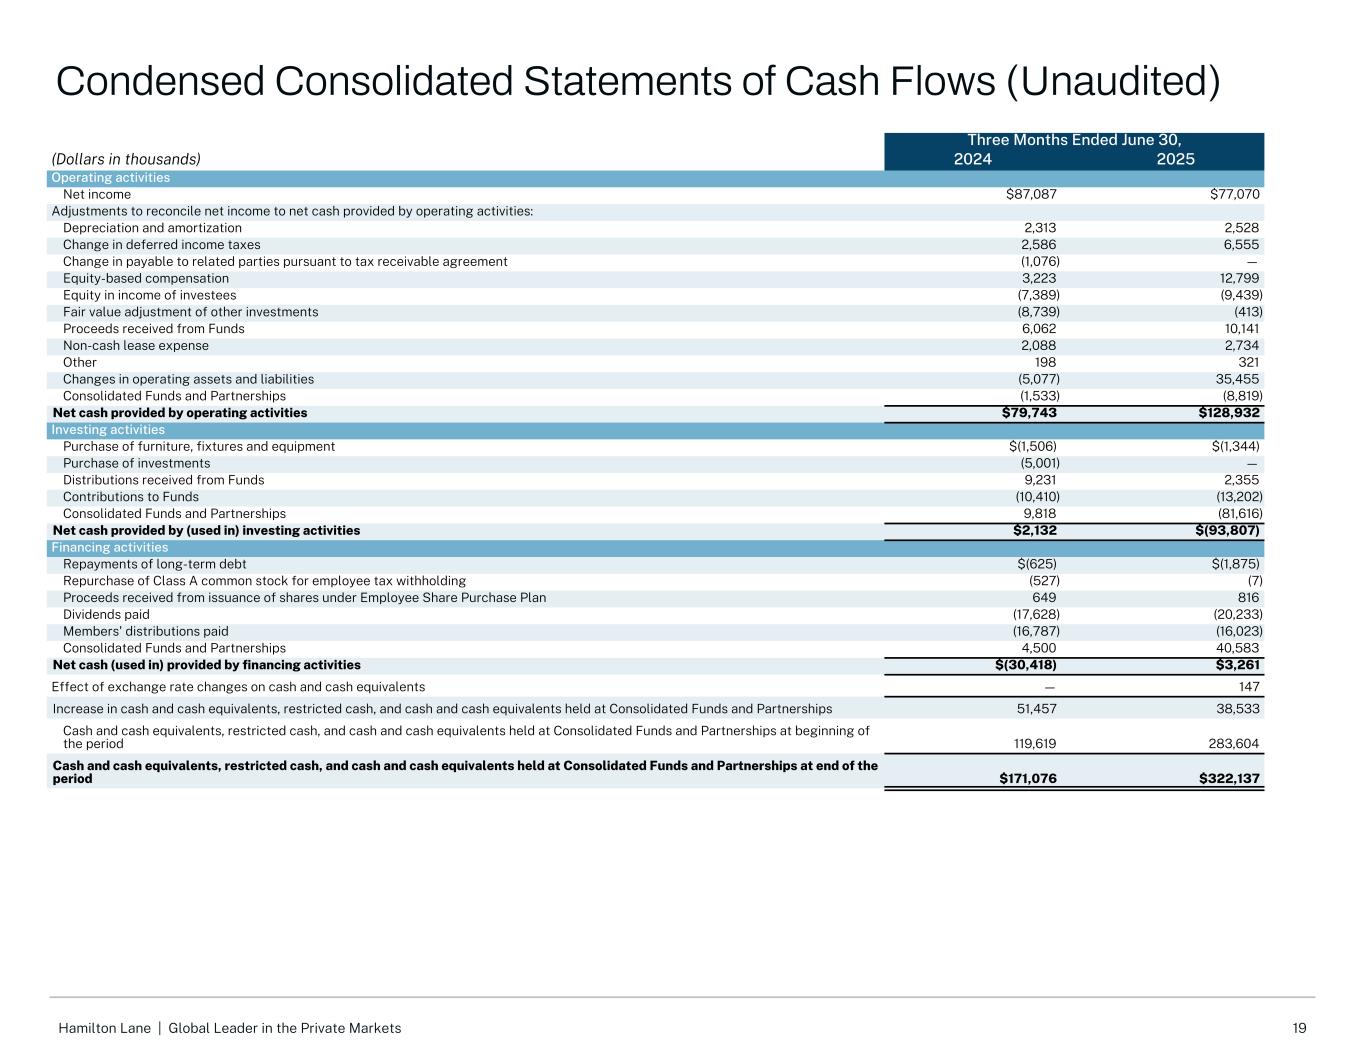
19Hamilton Lane | Global Leader in the Private Markets Three Months Ended June 30, (Dollars in thousands) 2024 2025 Operating activities Net income $87,087 $77,070 Adjustments to reconcile net income to net cash provided by operating activities: Depreciation and amortization 2,313 2,528 Change in deferred income taxes 2,586 6,555 Change in payable to related parties pursuant to tax receivable agreement (1,076) — Equity-based compensation 3,223 12,799 Equity in income of investees (7,389) (9,439) Fair value adjustment of other investments (8,739) (413) Proceeds received from Funds 6,062 10,141 Non-cash lease expense 2,088 2,734 Other 198 321 Changes in operating assets and liabilities (5,077) 35,455 Consolidated Funds and Partnerships (1,533) (8,819) Net cash provided by operating activities $79,743 $128,932 Investing activities Purchase of furniture, fixtures and equipment $(1,506) $(1,344) Purchase of investments (5,001) — Distributions received from Funds 9,231 2,355 Contributions to Funds (10,410) (13,202) Consolidated Funds and Partnerships 9,818 (81,616) Net cash provided by (used in) investing activities $2,132 $(93,807) Financing activities Repayments of long-term debt $(625) $(1,875) Repurchase of Class A common stock for employee tax withholding (527) (7) Proceeds received from issuance of shares under Employee Share Purchase Plan 649 816 Dividends paid (17,628) (20,233) Members' distributions paid (16,787) (16,023) Consolidated Funds and Partnerships 4,500 40,583 Net cash (used in) provided by financing activities $(30,418) $3,261 Effect of exchange rate changes on cash and cash equivalents — 147 Increase in cash and cash equivalents, restricted cash, and cash and cash equivalents held at Consolidated Funds and Partnerships 51,457 38,533 Cash and cash equivalents, restricted cash, and cash and cash equivalents held at Consolidated Funds and Partnerships at beginning of the period 119,619 283,604 Cash and cash equivalents, restricted cash, and cash and cash equivalents held at Consolidated Funds and Partnerships at end of the period $171,076 $322,137 Condensed Consolidated Statements of Cash Flows (Unaudited)
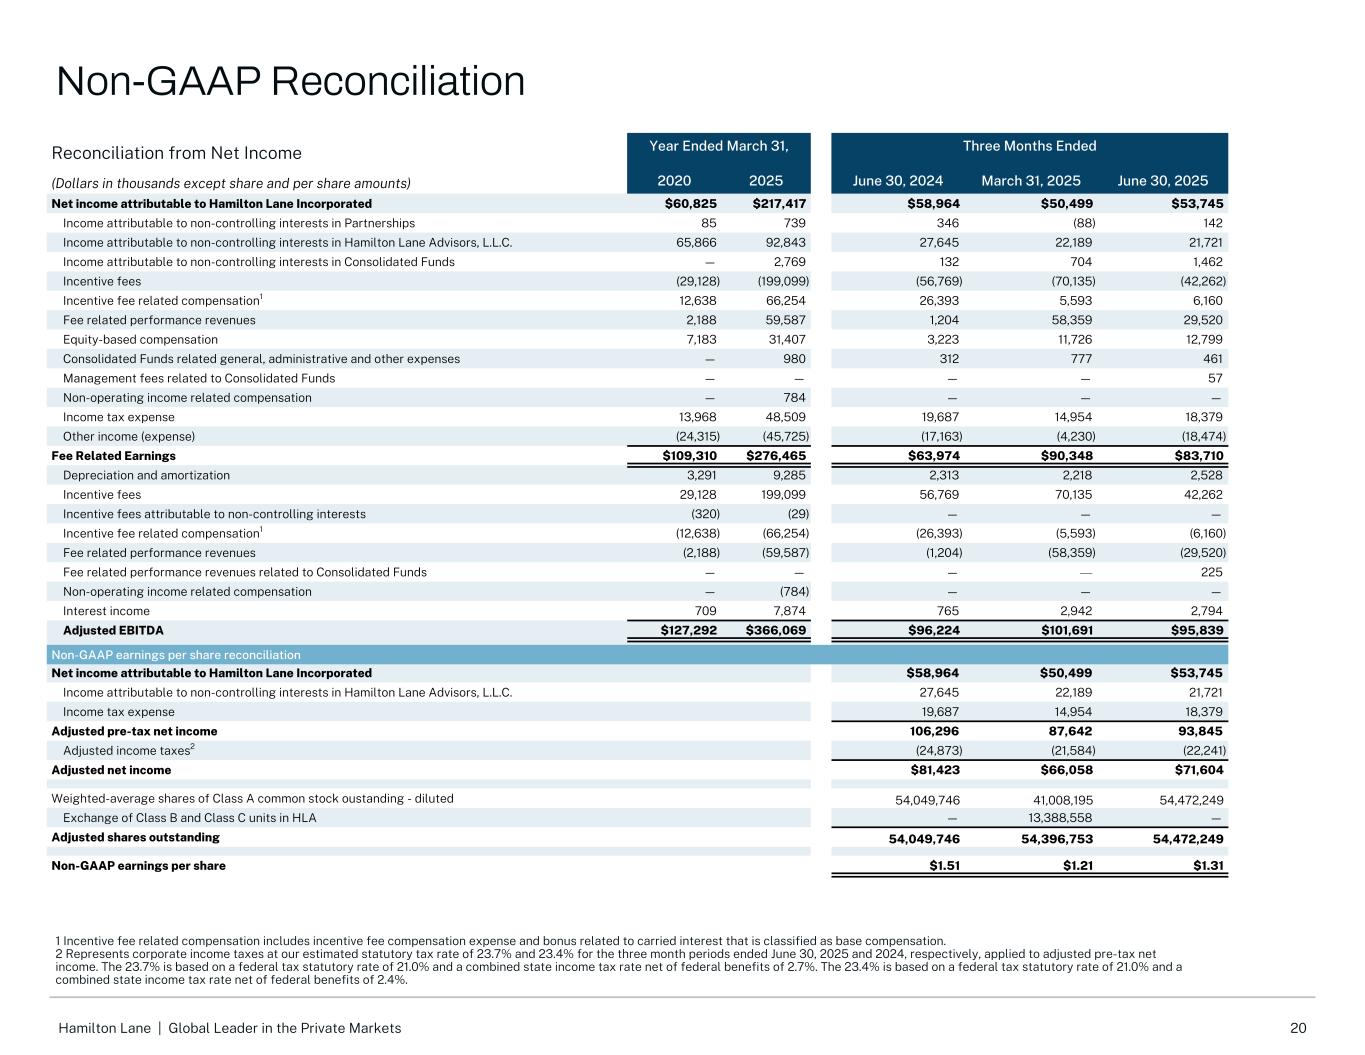
20Hamilton Lane | Global Leader in the Private Markets Reconciliation from Net Income Year Ended March 31, Three Months Ended (Dollars in thousands except share and per share amounts) 2020 2025 June 30, 2024 March 31, 2025 June 30, 2025 Net income attributable to Hamilton Lane Incorporated $60,825 $217,417 $58,964 $50,499 $53,745 Income attributable to non-controlling interests in Partnerships 85 739 346 (88) 142 Income attributable to non-controlling interests in Hamilton Lane Advisors, L.L.C. 65,866 92,843 27,645 22,189 21,721 Income attributable to non-controlling interests in Consolidated Funds — 2,769 132 704 1,462 Incentive fees (29,128) (199,099) (56,769) (70,135) (42,262) Incentive fee related compensation1 12,638 66,254 26,393 5,593 6,160 Fee related performance revenues 2,188 59,587 1,204 58,359 29,520 Equity-based compensation 7,183 31,407 3,223 11,726 12,799 Consolidated Funds related general, administrative and other expenses — 980 312 777 461 Management fees related to Consolidated Funds — — — — 57 Non-operating income related compensation — 784 — — — Income tax expense 13,968 48,509 19,687 14,954 18,379 Other income (expense) (24,315) (45,725) (17,163) (4,230) (18,474) Fee Related Earnings $109,310 $276,465 $63,974 $90,348 $83,710 Depreciation and amortization 3,291 9,285 2,313 2,218 2,528 Incentive fees 29,128 199,099 56,769 70,135 42,262 Incentive fees attributable to non-controlling interests (320) (29) — — — Incentive fee related compensation1 (12,638) (66,254) (26,393) (5,593) (6,160) Fee related performance revenues (2,188) (59,587) (1,204) (58,359) (29,520) Fee related performance revenues related to Consolidated Funds — — — — 225 Non-operating income related compensation — (784) — — — Interest income 709 7,874 765 2,942 2,794 Adjusted EBITDA $127,292 $366,069 $96,224 $101,691 $95,839 Non-GAAP earnings per share reconciliation Net income attributable to Hamilton Lane Incorporated $58,964 $50,499 $53,745 Income attributable to non-controlling interests in Hamilton Lane Advisors, L.L.C. 27,645 22,189 21,721 Income tax expense 19,687 14,954 18,379 Adjusted pre-tax net income 106,296 87,642 93,845 Adjusted income taxes2 (24,873) (21,584) (22,241) Adjusted net income $81,423 $66,058 $71,604 Weighted-average shares of Class A common stock oustanding - diluted 54,049,746 41,008,195 54,472,249 Exchange of Class B and Class C units in HLA — 13,388,558 — Adjusted shares outstanding 54,049,746 54,396,753 54,472,249 Non-GAAP earnings per share $1.51 $1.21 $1.31 1 Incentive fee related compensation includes incentive fee compensation expense and bonus related to carried interest that is classified as base compensation. 2 Represents corporate income taxes at our estimated statutory tax rate of 23.7% and 23.4% for the three month periods ended June 30, 2025 and 2024, respectively, applied to adjusted pre-tax net income. The 23.7% is based on a federal tax statutory rate of 21.0% and a combined state income tax rate net of federal benefits of 2.7%. The 23.4% is based on a federal tax statutory rate of 21.0% and a combined state income tax rate net of federal benefits of 2.4%. Non-GAAP Reconciliation
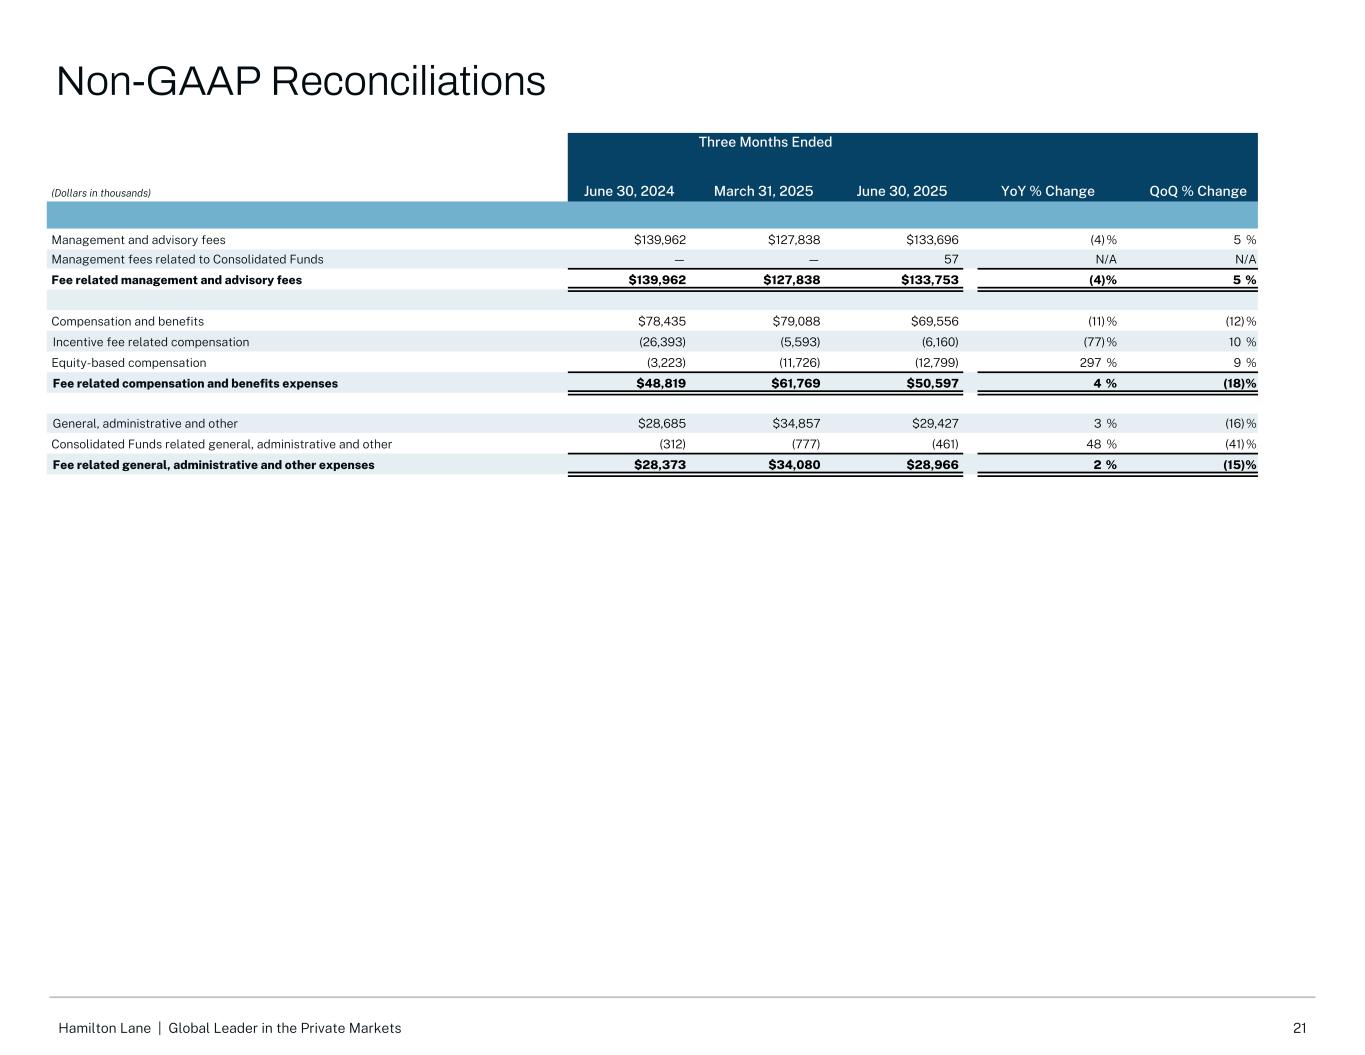
21Hamilton Lane | Global Leader in the Private Markets Three Months Ended (Dollars in thousands) June 30, 2024 March 31, 2025 June 30, 2025 YoY % Change QoQ % Change Management and advisory fees $139,962 $127,838 $133,696 (4) % 5 % Management fees related to Consolidated Funds — — 57 N/A N/A Fee related management and advisory fees $139,962 $127,838 $133,753 (4) % 5 % Compensation and benefits $78,435 $79,088 $69,556 (11) % (12) % Incentive fee related compensation (26,393) (5,593) (6,160) (77) % 10 % Equity-based compensation (3,223) (11,726) (12,799) 297 % 9 % Fee related compensation and benefits expenses $48,819 $61,769 $50,597 4 % (18) % General, administrative and other $28,685 $34,857 $29,427 3 % (16) % Consolidated Funds related general, administrative and other (312) (777) (461) 48 % (41) % Fee related general, administrative and other expenses $28,373 $34,080 $28,966 2 % (15) % Non-GAAP Reconciliations
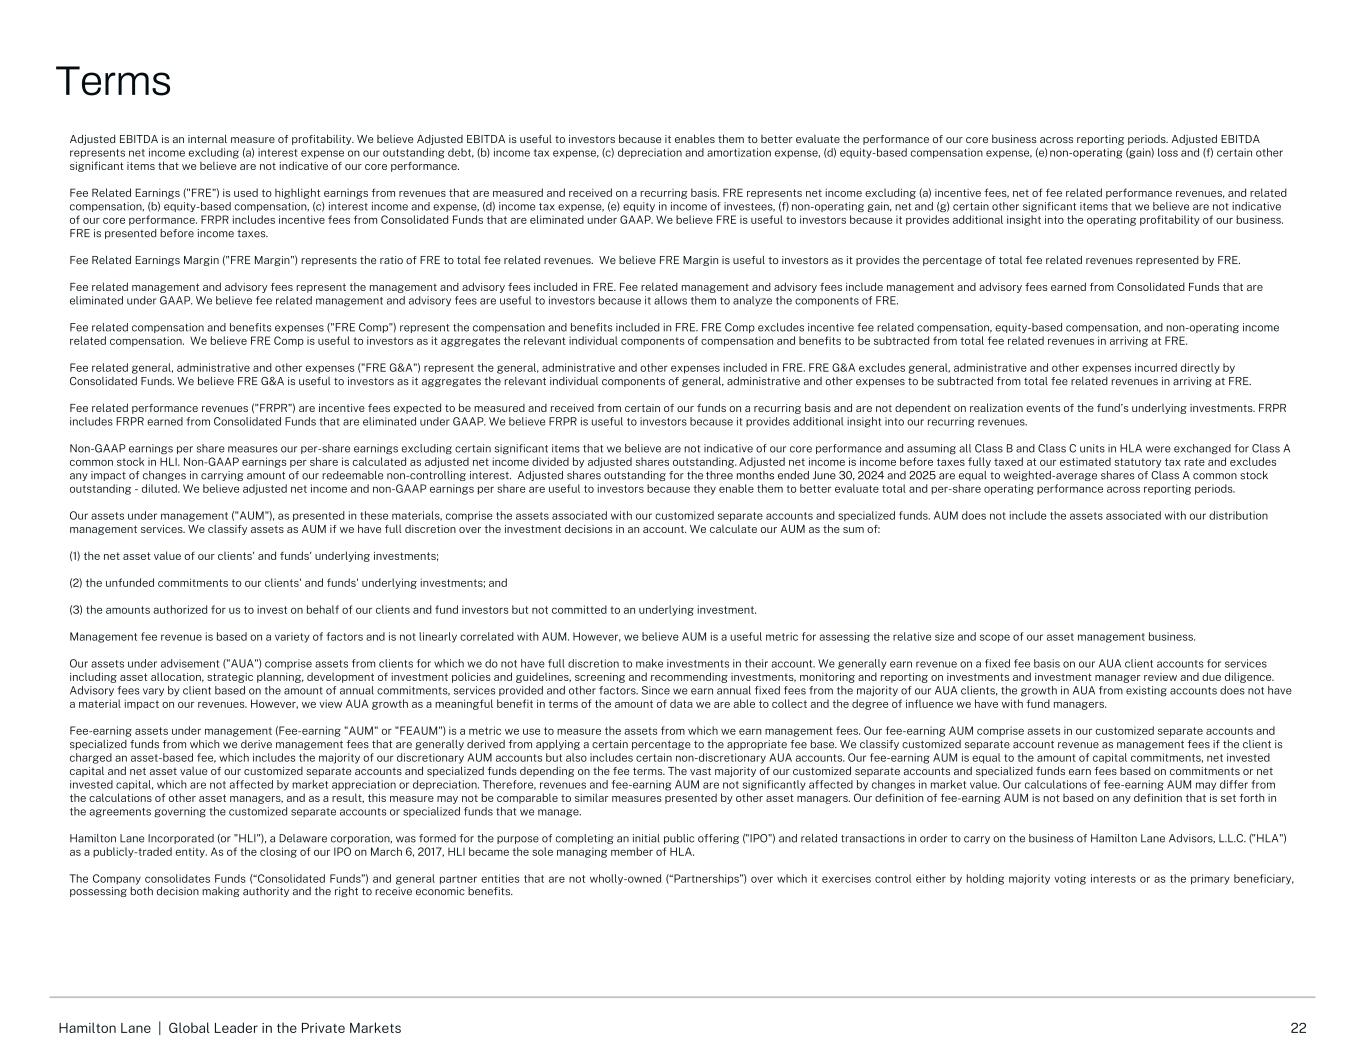
22Hamilton Lane | Global Leader in the Private Markets Adjusted EBITDA is an internal measure of profitability. We believe Adjusted EBITDA is useful to investors because it enables them to better evaluate the performance of our core business across reporting periods. Adjusted EBITDA represents net income excluding (a) interest expense on our outstanding debt, (b) income tax expense, (c) depreciation and amortization expense, (d) equity-based compensation expense, (e) non-operating (gain) loss and (f) certain other significant items that we believe are not indicative of our core performance. Fee Related Earnings ("FRE") is used to highlight earnings from revenues that are measured and received on a recurring basis. FRE represents net income excluding (a) incentive fees, net of fee related performance revenues, and related compensation, (b) equity-based compensation, (c) interest income and expense, (d) income tax expense, (e) equity in income of investees, (f) non-operating gain, net and (g) certain other significant items that we believe are not indicative of our core performance. FRPR includes incentive fees from Consolidated Funds that are eliminated under GAAP. We believe FRE is useful to investors because it provides additional insight into the operating profitability of our business. FRE is presented before income taxes. Fee Related Earnings Margin ("FRE Margin") represents the ratio of FRE to total fee related revenues. We believe FRE Margin is useful to investors as it provides the percentage of total fee related revenues represented by FRE. Fee related management and advisory fees represent the management and advisory fees included in FRE. Fee related management and advisory fees include management and advisory fees earned from Consolidated Funds that are eliminated under GAAP. We believe fee related management and advisory fees are useful to investors because it allows them to analyze the components of FRE. Fee related compensation and benefits expenses ("FRE Comp") represent the compensation and benefits included in FRE. FRE Comp excludes incentive fee related compensation, equity-based compensation, and non-operating income related compensation. We believe FRE Comp is useful to investors as it aggregates the relevant individual components of compensation and benefits to be subtracted from total fee related revenues in arriving at FRE. Fee related general, administrative and other expenses ("FRE G&A") represent the general, administrative and other expenses included in FRE. FRE G&A excludes general, administrative and other expenses incurred directly by Consolidated Funds. We believe FRE G&A is useful to investors as it aggregates the relevant individual components of general, administrative and other expenses to be subtracted from total fee related revenues in arriving at FRE. Fee related performance revenues ("FRPR") are incentive fees expected to be measured and received from certain of our funds on a recurring basis and are not dependent on realization events of the fund’s underlying investments. FRPR includes FRPR earned from Consolidated Funds that are eliminated under GAAP. We believe FRPR is useful to investors because it provides additional insight into our recurring revenues. Non-GAAP earnings per share measures our per-share earnings excluding certain significant items that we believe are not indicative of our core performance and assuming all Class B and Class C units in HLA were exchanged for Class A common stock in HLI. Non-GAAP earnings per share is calculated as adjusted net income divided by adjusted shares outstanding. Adjusted net income is income before taxes fully taxed at our estimated statutory tax rate and excludes any impact of changes in carrying amount of our redeemable non-controlling interest. Adjusted shares outstanding for the three months ended June 30, 2024 and 2025 are equal to weighted-average shares of Class A common stock outstanding - diluted. We believe adjusted net income and non-GAAP earnings per share are useful to investors because they enable them to better evaluate total and per-share operating performance across reporting periods. Our assets under management ("AUM"), as presented in these materials, comprise the assets associated with our customized separate accounts and specialized funds. AUM does not include the assets associated with our distribution management services. We classify assets as AUM if we have full discretion over the investment decisions in an account. We calculate our AUM as the sum of: (1) the net asset value of our clients' and funds' underlying investments; (2) the unfunded commitments to our clients' and funds' underlying investments; and (3) the amounts authorized for us to invest on behalf of our clients and fund investors but not committed to an underlying investment. Management fee revenue is based on a variety of factors and is not linearly correlated with AUM. However, we believe AUM is a useful metric for assessing the relative size and scope of our asset management business. Our assets under advisement ("AUA") comprise assets from clients for which we do not have full discretion to make investments in their account. We generally earn revenue on a fixed fee basis on our AUA client accounts for services including asset allocation, strategic planning, development of investment policies and guidelines, screening and recommending investments, monitoring and reporting on investments and investment manager review and due diligence. Advisory fees vary by client based on the amount of annual commitments, services provided and other factors. Since we earn annual fixed fees from the majority of our AUA clients, the growth in AUA from existing accounts does not have a material impact on our revenues. However, we view AUA growth as a meaningful benefit in terms of the amount of data we are able to collect and the degree of influence we have with fund managers. Fee-earning assets under management (Fee-earning "AUM" or "FEAUM") is a metric we use to measure the assets from which we earn management fees. Our fee-earning AUM comprise assets in our customized separate accounts and specialized funds from which we derive management fees that are generally derived from applying a certain percentage to the appropriate fee base. We classify customized separate account revenue as management fees if the client is charged an asset-based fee, which includes the majority of our discretionary AUM accounts but also includes certain non-discretionary AUA accounts. Our fee-earning AUM is equal to the amount of capital commitments, net invested capital and net asset value of our customized separate accounts and specialized funds depending on the fee terms. The vast majority of our customized separate accounts and specialized funds earn fees based on commitments or net invested capital, which are not affected by market appreciation or depreciation. Therefore, revenues and fee-earning AUM are not significantly affected by changes in market value. Our calculations of fee-earning AUM may differ from the calculations of other asset managers, and as a result, this measure may not be comparable to similar measures presented by other asset managers. Our definition of fee-earning AUM is not based on any definition that is set forth in the agreements governing the customized separate accounts or specialized funds that we manage. Hamilton Lane Incorporated (or "HLI"), a Delaware corporation, was formed for the purpose of completing an initial public offering ("IPO") and related transactions in order to carry on the business of Hamilton Lane Advisors, L.L.C. ("HLA") as a publicly-traded entity. As of the closing of our IPO on March 6, 2017, HLI became the sole managing member of HLA. The Company consolidates Funds (“Consolidated Funds”) and general partner entities that are not wholly-owned (“Partnerships”) over which it exercises control either by holding majority voting interests or as the primary beneficiary, possessing both decision making authority and the right to receive economic benefits. Terms
23Hamilton Lane | Global Leader in the Private Markets Some of the statements in this presentation may constitute “forward-looking statements” within the meaning of Section 27A of the Securities Act of 1933, Section 21E of the Securities Exchange Act of 1934 and the Private Securities Litigation Reform Act of 1995. Words such as “will,” “expect,” “believe,” “estimate,” “continue,” “anticipate,” “intend,” “plan” and similar expressions, or the negative version of these words or other comparable words, are intended to identify these forward-looking statements. Forward-looking statements discuss management’s current expectations and projections relating to our financial position, results of operations, plans, objectives, future performance and business. All forward-looking statements are subject to known and unknown risks, uncertainties and other important factors that may cause actual results to be materially different, including: the historical performance of our investments should not be considered as indicative of future results or future returns on our Class A common stock; our ability to identify available and suitable investment opportunities for our clients; competition for access to investment funds and other investments we make for our clients is intense; customized separate account and advisory account fee revenue is not a long-term contracted source of revenue and is subject to intense competition; our failure to appropriately deal with conflicts of interest; our ability to retain our senior management team and attract additional qualified investment professionals; our ability to expand our business and formulate new business strategies; our ability to manage our obligations under our debt agreements; volatile market, economic and geopolitical conditions can adversely affect our business and the investments made by our funds or accounts; defaults by clients and third-party investors on their obligations to fund commitments; our ability to comply with the investment guidelines set by our clients; the exercise of redemption or repurchase rights by investors in certain of our funds; extensive government regulation, compliance failures and changes in law or regulation could adversely affect us; our ability to maintain our desired fee structure; failure to maintain the security of our information technology networks, or those of our third-party service providers, or data security breaches; our only material asset is our interest in Hamilton Lane Advisors, L.L.C., and we are accordingly dependent upon distributions from such entity to pay dividends, taxes and other expenses. The foregoing list of factors is not exhaustive and should be read in conjunction with the other cautionary statements that are included in our filings with the Securities and Exchange Commission (the “SEC”). For more information regarding these risks and uncertainties as well as additional risks we face, you should refer to the “Risk Factors” detailed in Part I, Item 1A of our Annual Report on Form 10-K for the fiscal year ended March 31, 2025 and in our subsequent reports filed from time to time with the SEC, which are accessible on the SEC’s website at www.sec.gov. The forward-looking statements included in this presentation are made only as of the date hereof. We undertake no obligation to update or revise any forward-looking statement as a result of new information or future events, except as otherwise required by law. Values appearing in this presentation that are whole numbers are rounded approximations. As of August 5, 2025 Disclosures