Exhibit 99.2
Neuronetics COMPANY PRESENTATION NASDAQ: STIM August 2025 Transforming Lives Through NeuroHealth
Exhibit 99.2
Neuronetics COMPANY PRESENTATION NASDAQ: STIM August 2025 Transforming Lives Through NeuroHealth
Forward Looking Statements This presentation contains estimates and other statistical data prepared by independent parties and by Neuronetics, Inc. (“Neuronetics” or the “Company”) relating to market size and growth and other data about the industry in which the Company operates. These estimates and data involve a number of assumptions and limitations, and you are cautioned not to give undue weight to such estimates and data. Certain statements in this presentation, including the documents incorporated by reference herein, include “forward-looking statements” within the meaning of Section 27A of the Securities Act of 1933, as amended (the “Securities Act”), Section 21E of the Securities Exchange Act of 1934, as amended, which are intended to be covered by the safe harbors created by those laws and other applicable laws and “forward-looking information” within the meaning of applicable Canadian securities laws. Statements in this presentation that are not historical facts constitute “forward-looking statements” within the meaning of the Private Securities Litigation Reform Act of 1995. These forward-looking statements may be identified by terms such as “may,” “will,” “would,” “should,” “expect,” “plan,” “design,” “anticipate,” “could,” “intend,” “target,” “project,” “contemplate,” “believe,” “estimate,” “predict,” “potential,” “outlook” or “continue” as well as the negative of these terms and similar expressions. These statements include those relating to the Company’s business outlook and current expectations for upcoming quarters and fiscal year 2025, including with respect to revenue, expenses, growth, and any statements of assumptions underlying any of the foregoing items. These statements are subject to significant risks and uncertainties and actual results could differ materially from those projected. The Company cautions investors not to place undue reliance on the forward-looking statements contained in this presentation. These risks and uncertainties include, without limitation, risks and uncertainties related to: the effect of the transaction with Greenbrook TMS Inc. (“Greenbrook”) on our business relationships; operating results and business generally; our ability to execute our business strategy; our ability to achieve or sustain profitable operations due to our history of losses; our ability to successfully complete the announced restructuring plans; our reliance on the sale and usage of our NeuroStar Advanced Therapy System to generate revenues; the scale and efficacy of our salesforce; our ability to retain talent; availability of coverage and reimbursement from third-party payors for treatments using our products; physician and patient demand for treatments using our products; developments in respect of competing technologies and therapies for the indications that our products treat; product defects; our revenue has been concentrated among a small number of customers; our ability to obtain and maintain intellectual property protection for our technology; developments in clinical trials or regulatory review of the NeuroStar Advanced Therapy System for additional indications; developments in regulation in the U.S. and other applicable jurisdictions; the terms of our credit facility; our ability to successfully roll-out our Better Me Provider Program on the planned timeline; our self-sustainability and existing cash balances; and our ability to achieve cash flow breakeven in the fourth quarter of 2025. For a discussion of these and other related risks, please refer to the Company’s recent filings with the U.S. Securities and Exchange Commission (the “SEC”), which are available on the SEC’s website at www.sec.gov, including, without limitation, the factors described under the heading “Risk Factors” in Neuronetics’ Annual Report on Form 10-K for the fiscal year ended December 31, 2024, as may be updated or supplemented by subsequent reports that Neuronetics has filed or files with the SEC. These forward-looking statements are based on the Company’s expectations and assumptions as of the date of this presentation. Except as required by law, the Company undertakes no duty or obligation to update any forward-looking statements contained in this presentation as a result of new information, future events, or changes in the Company’s expectations. Company Confidential 2
Non-GAAP Financial Measures In addition to financial measures prepared in accordance with accounting principles generally accepted in the United States (“GAAP”), from time to time we may use or publicly disclose certain non-GAAP financial measures in the course of our financial presentations, earnings releases, earnings conference calls, and otherwise. For these purposes, the SEC defines a non-GAAP financial measure as a numerical measure of historical or future financial performance, financial positions, or cash flows that (i) exclude amounts, or is subject to adjustments that effectively exclude amounts, included in the most directly comparable measure calculated and presented in accordance with GAAP in financial statements, and (ii) include amounts, or is subject to adjustments that effectively include amounts, that are excluded from the most directly comparable measure so calculated and presented. Non-GAAP financial measures are provided as additional information to investors to provide an alternative method for assessing our financial condition and operating results. We believe that these non-GAAP measures, when taken together with our GAAP financial measures, allow us and our investors to better evaluate our performance and profitability. These measures are not in accordance with, or a substitute for, GAAP, and may be different from or inconsistent with non-GAAP financial measures used by other companies. These measures should be used in addition to and in conjunction with results presented in accordance with GAAP, and should not be relied upon to the exclusion of GAAP financial measures. Pursuant to the requirements of Regulation G, whenever we refer to a non-GAAP financial measure, we will also generally present, the most directly comparable financial measure calculated and presented in accordance with GAAP, along with a reconciliation of the differences between the non-GAAP financial measure we reference with such comparable GAAP financial measure. Company Confidential 3
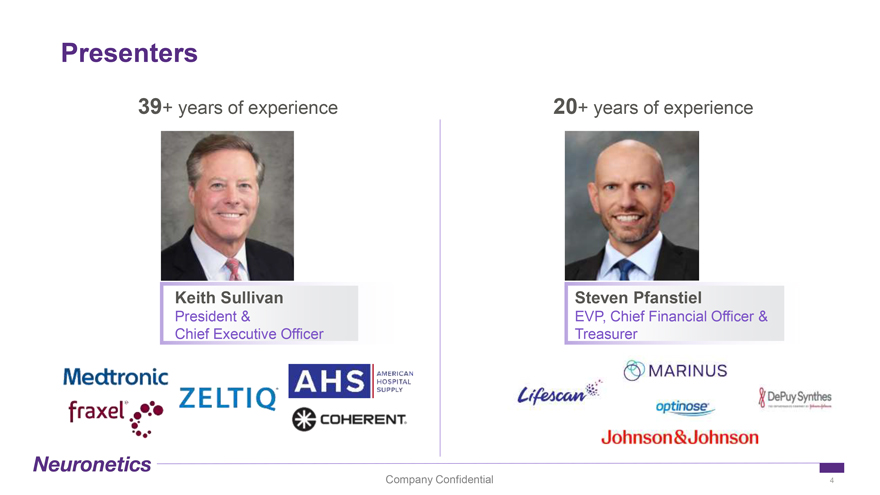
Presenters 39+ years of experience 20+ years of experience Keith Sullivan Steven Pfanstiel President & EVP, Chief Financial Officer & Chief Executive Officer Treasurer Company Confidential 4
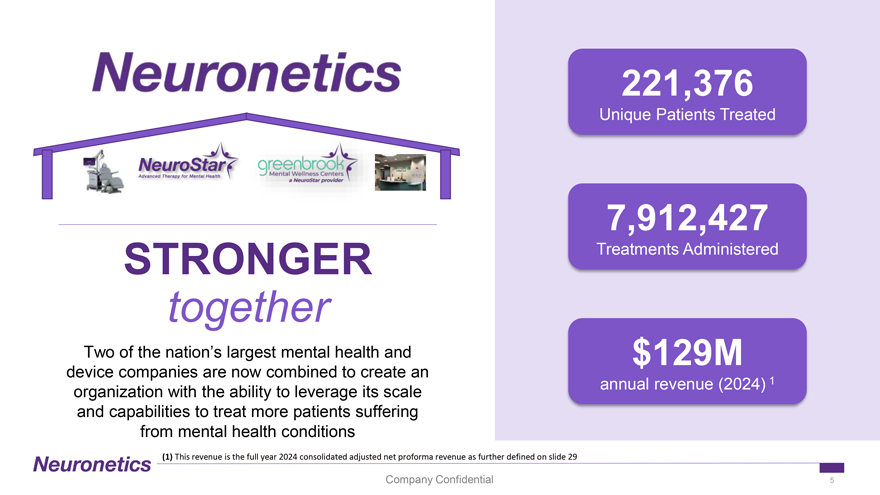
221,376 Unique Patients Treated 7,912,427 STRONGER Treatments Administered together Two of the nation’s largest mental health and $129M device companies are now combined to create an annual revenue (2024) 1 organization with the ability to leverage its scale and capabilities to treat more patients suffering from mental health conditions (1) This revenue is the full year 2024 consolidated adjusted net proforma revenue as further defined on slide 29 Company Confidential 5
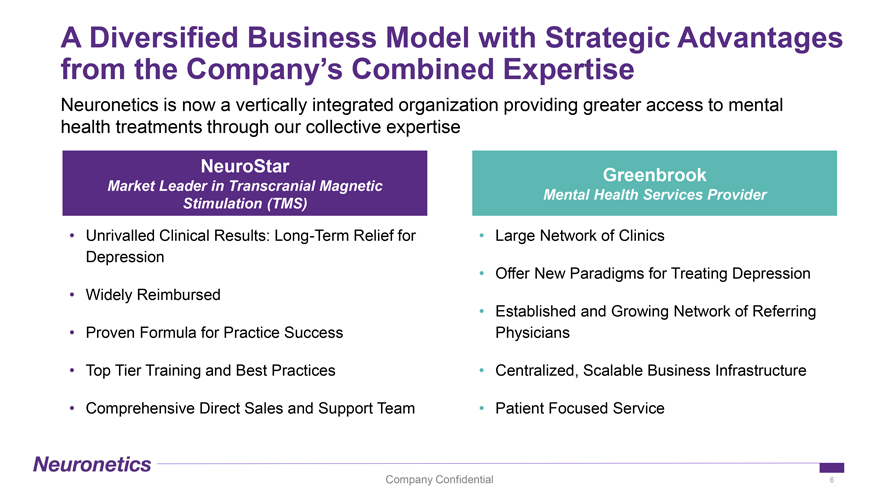
A Diversified Business Model with Strategic Advantages from the Company’s Combined Expertise Neuronetics is now a vertically integrated organization providing greater access to mental health treatments through our collective expertise NeuroStar Market Leader in Transcranial Magnetic Stimulation (TMS) • Unrivalled Clinical Results: Long-Term Relief for Depression • Widely Reimbursed • Proven Formula for Practice Success • Top Tier Training and Best Practices • Comprehensive Direct Sales and Support Team Greenbrook Mental Health Services Provider • Large Network of Clinics • Offer New Paradigms for Treating Depression • Established and Growing Network of Referring Physicians • Centralized, Scalable Business Infrastructure • Patient Focused Service Company Confidential 6
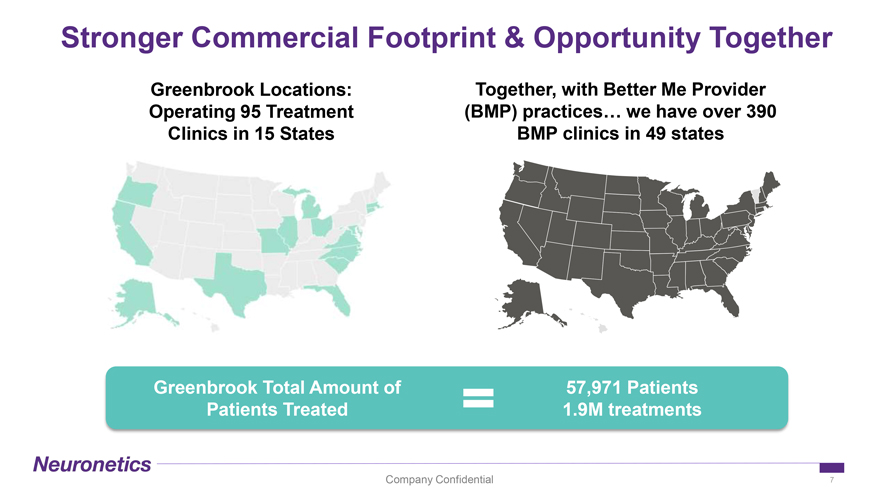
Stronger Commercial Footprint & Opportunity Together Greenbrook Locations: Together, with Better Me Provider Operating 95 Treatment (BMP) practices… we have over 390 Clinics in 15 States BMP clinics in 49 states Greenbrook Total Amount of 57,971 Patients Patients Treated 1.9M treatments Company Confidential 7
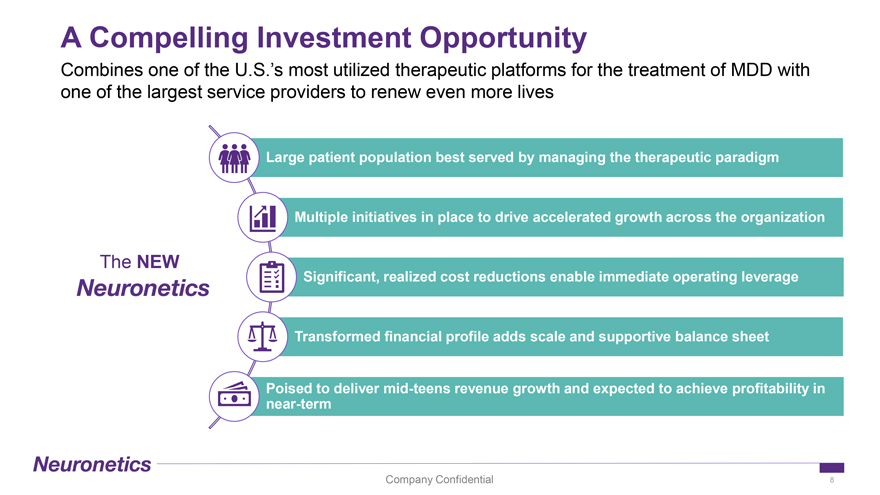
A Compelling Investment Opportunity Combines one of the U.S.’s most utilized therapeutic platforms for the treatment of MDD with one of the largest service providers to renew even more lives Large patient population best served by managing the therapeutic paradigm Multiple initiatives in place to drive accelerated growth across the organization The NEW Significant, realized cost reductions enable immediate operating leverage Transformed financial profile adds scale and supportive balance sheet Poised to deliver mid-teens revenue growth and expected to achieve profitability in near-term Company Confidential 8
Senior Leadership Management Team Board of Directors Keith Sullivan Cory Anderson Sara Grubbs Jeff Jones Rob Cascella Avinash Amin, MD Sheryl Conley Sasha Cucuz President & CEO SVP, Chief SVP, Chief SVP, Chief Board Chairman Technology Officer Revenue Officer of Operations Bill Leonard Andrew Macan Steven Pfanstiel Lisa Metzner-Rosas Glenn Muir Megan Keith Sullivan EVP, Chief EVP, GC & Chief EVP, Chief Financial SVP, Chief Rosengarten Clinic Officer Compliance Officer Officer & Treasurer Marketing Officer Company Confidential 9
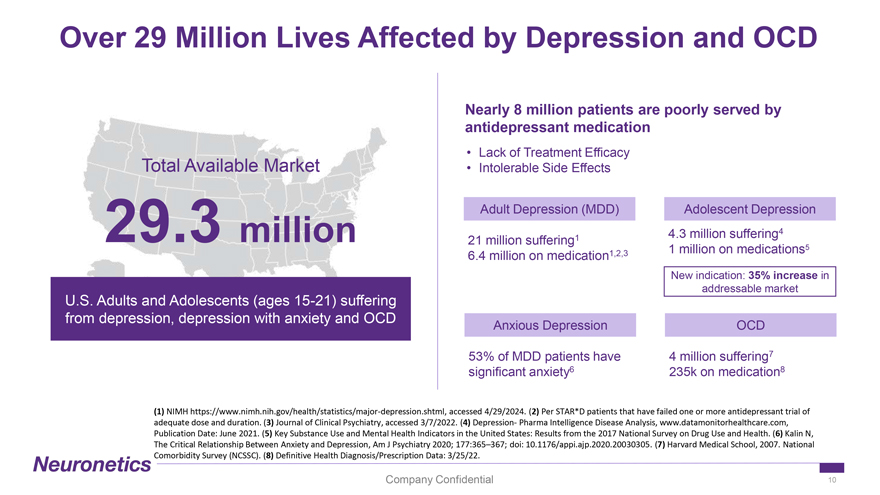
Over 29 Million Lives Affected by Depression and OCD Nearly 8 million patients are poorly served by antidepressant medication • Lack of Treatment Efficacy Total Available Market • Intolerable Side Effects Adult Depression (MDD) Adolescent Depression 4.3 million suffering4 29.3 million 21 million suffering1 1 million on medications5 6.4 million on medication1,2,3 New indication: 35% increase in addressable market U.S. Adults and Adolescents (ages 15-21) suffering from depression, depression with anxiety and OCD Anxious Depression OCD 53% of MDD patients have 4 million suffering7 significant anxiety6 235k on medication8 (1) NIMH https://www.nimh.nih.gov/health/statistics/major-depression.shtml, accessed 4/29/2024. (2) Per STAR*D patients that have failed one or more antidepressant trial of adequate dose and duration. (3) Journal of Clinical Psychiatry, accessed 3/7/2022. (4) Depression- Pharma Intelligence Disease Analysis, www.datamonitorhealthcare.com, Publication Date: June 2021. (5) Key Substance Use and Mental Health Indicators in the United States: Results from the 2017 National Survey on Drug Use and Health. (6) Kalin N, The Critical Relationship Between Anxiety and Depression, Am J Psychiatry 2020; 177:365–367; doi: 10.1176/appi.ajp.2020.20030305. (7) Harvard Medical School, 2007. National Comorbidity Survey (NCSSC). (8) Definitive Health Diagnosis/Prescription Data: 3/25/22. Company Confidential 10
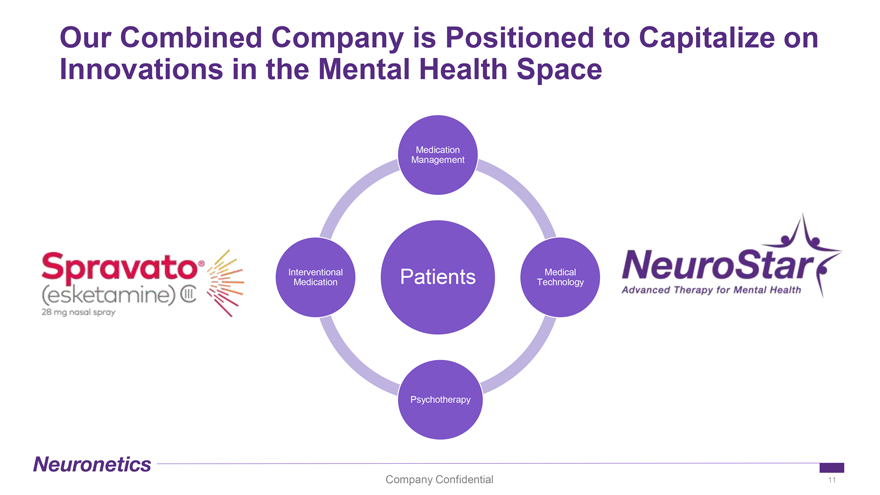
Our Combined Company is Positioned to Capitalize on Innovations in the Mental Health Space Medication Management Interventional Patients Medical Medication Technology Psychotherapy Company Confidential 11
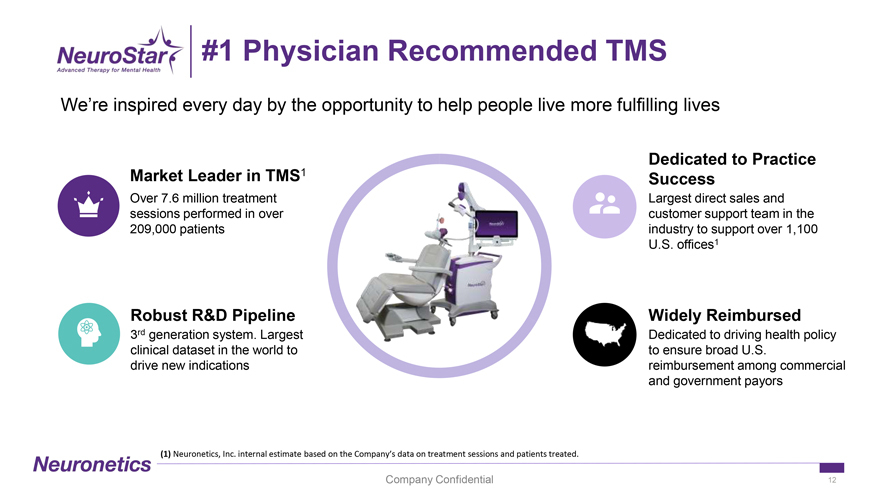
#1 Physician Recommended TMS We’re inspired every day by the opportunity to help people live more fulfilling lives Dedicated to Practice Market Leader in TMS1 Success Over 7.6 million treatment Largest direct sales and sessions performed in over customer support team in the 209,000 patients industry to support over 1,100 U.S. offices1 Robust R&D Pipeline Widely Reimbursed 3rd generation system. Largest Dedicated to driving health policy clinical dataset in the world to to ensure broad U.S. drive new indications reimbursement among commercial and government payors (1) Neuronetics, Inc. internal estimate based on the Company’s data on treatment sessions and patients treated. Company Confidential 12
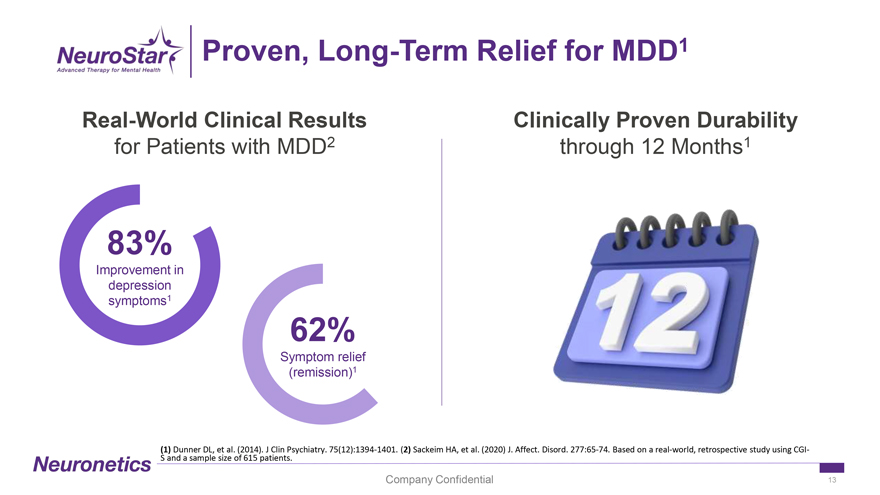
Proven, Long-Term Relief for MDD1 Real-World Clinical Results Clinically Proven Durability for Patients with MDD2 through 12 Months1 83% Improvement in depression symptoms1 62% Symptom relief (remission)1 (1) Dunner DL, et al. (2014). J Clin Psychiatry. 75(12):1394-1401. (2) Sackeim HA, et al. (2020) J. Affect. Disord. 277:65-74. Based on a real-world, retrospective study using CGI-S and a sample size of 615 patients. Company Confidential 13
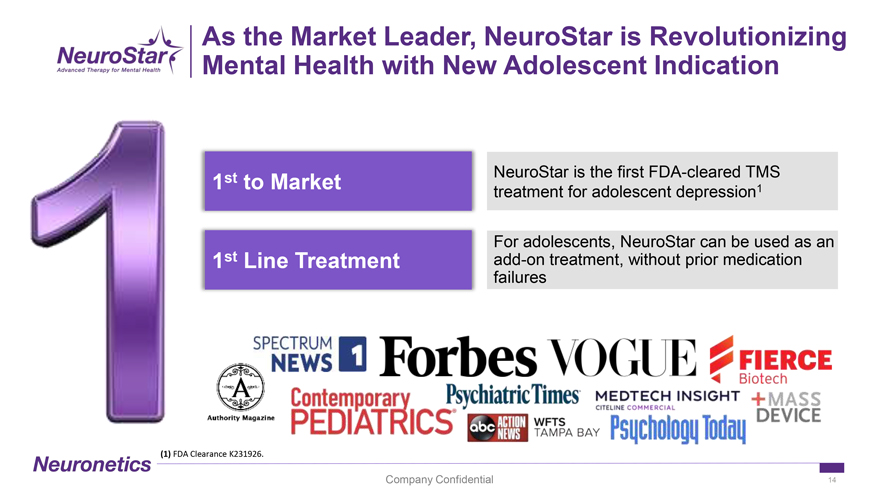
As the Market Leader, NeuroStar is Revolutionizing Mental Health with New Adolescent Indication st NeuroStar is the first FDA-cleared TMS 1 to Market 1 treatment for adolescent depression For adolescents, NeuroStar can be used as an 1st Line Treatment add-on treatment, without prior medication failures (1) FDA Clearance K231926. Company Confidential 14
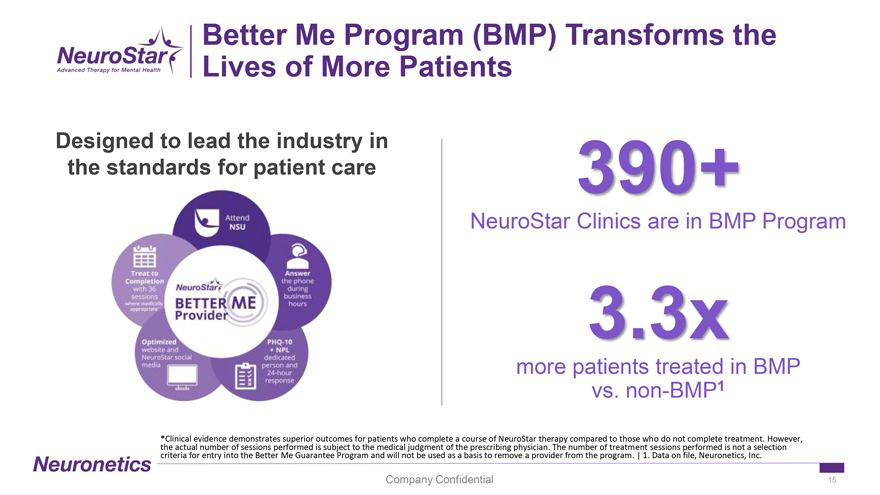
Better Me Program (BMP) Transforms the Lives of More Patients Designed to lead the industry in the standards for patient care 390+ NeuroStar Clinics are in BMP Program 3.3x more patients treated in BMP vs. non-BMP1 *Clinical evidence demonstrates superior outcomes for patients who complete a course of NeuroStar therapy compared to those who do not complete treatment. However, the actual number of sessions performed is subject to the medical judgment of the prescribing physician. The number of treatment sessions performed is not a selection criteria for entry into the Better Me Guarantee Program and will not be used as a basis to remove a provider from the program. | 1. Data on file, Neuronetics, Inc. Company Confidential 15
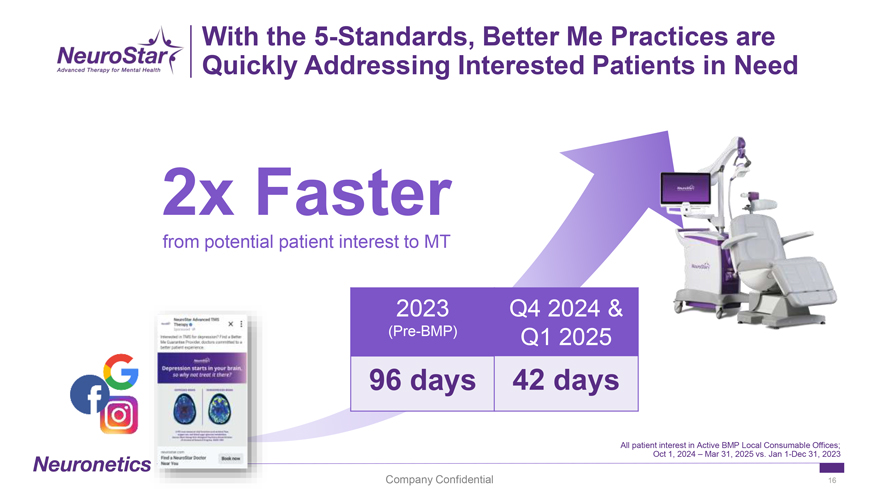
With the 5-Standards, Better Me Practices are Quickly Addressing Interested Patients in Need 2x Faster from potential patient interest to MT 2023 Q4 2024 & (Pre-BMP) Q1 2025 96 days 42 days All patient interest in Active BMP Local Consumable Offices; Oct 1, 2024 – Mar 31, 2025 vs. Jan 1-Dec 31, 2023 Company Confidential 16
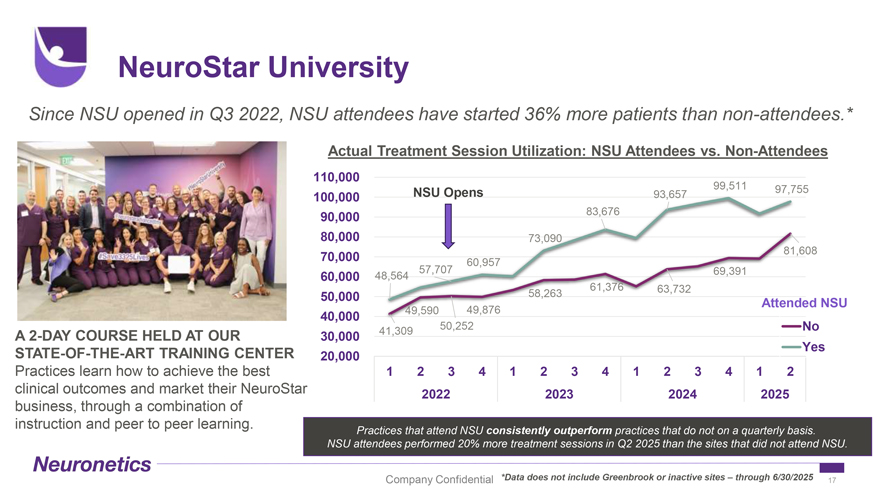
NeuroStar University Since NSU opened in Q3 2022, NSU attendees have started 36% more patients than non-attendees.* Actual Treatment Session Utilization: NSU Attendees vs. Non-Attendees 110,000 99,511 97,755 100,000 NSU Opens 93,657 90,000 83,676 80,000 73,090 81,608 70,000 60,957 57,707 69,391 60,000 48,564 61,376 63,732 50,000 58,263 Attended NSU 49,590 49,876 40,000 50,252 No A 2-DAY COURSE HELD AT OUR 30,000 41,309 STATE-OF-THE-ART TRAINING CENTER Yes 20,000 Practices learn how to achieve the best 1 2 3 4 1 2 3 4 1 2 3 4 1 2 clinical outcomes and market their NeuroStar 2022 2023 2024 2025 business, through a combination of instruction and peer to peer learning. Practices that attend NSU consistently outperform practices that do not on a quarterly basis. NSU attendees performed 20% more treatment sessions in Q2 2025 than the sites that did not attend NSU. Company Confidential *Data does not include Greenbrook or inactive sites – through 6/30/2025 17
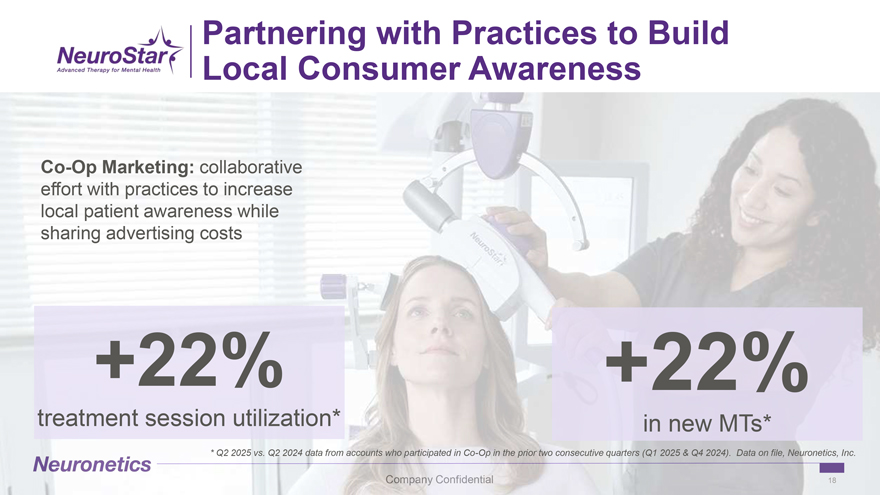
Partnering with Practices to Build Local Consumer Awareness1 – this one Co-Op Marketing: collaborative effort with practices to increase local patient awareness while sharing advertising costs +22% +22% treatment session utilization* in new MTs* * Q2 2025 vs. Q2 2024 data from accounts who participated in Co-Op in the prior two consecutive quarters (Q1 2025 & Q4 2024). Data on file, Neuronetics, Inc. 18
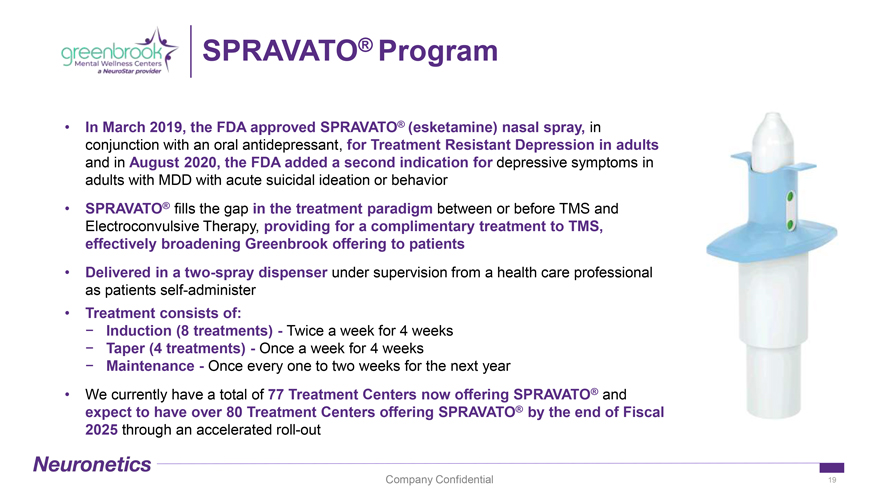
SPRAVATO® Program In March 2019, the FDA approved SPRAVATO® (esketamine) nasal spray, in conjunction with an oral antidepressant, for Treatment Resistant Depression in adults and in August 2020, the FDA added a second indication for depressive symptoms in adults with MDD with acute suicidal ideation or behavior SPRAVATO® fills the gap in the treatment paradigm between or before TMS and Electroconvulsive Therapy, providing for a complimentary treatment to TMS, effectively broadening Greenbrook offering to patients Delivered in a two-spray dispenser under supervision from a health care professional as patients self-administer Treatment consists of: Induction (8 treatments)—Twice a week for 4 weeks Taper (4 treatments)—Once a week for 4 weeks Maintenance—Once every one to two weeks for the next year We currently have a total of 77 Treatment Centers now offering SPRAVATO® and expect to have over 80 Treatment Centers offering SPRAVATO® by the end of Fiscal 2025 through an accelerated roll-out Company Confidential 19
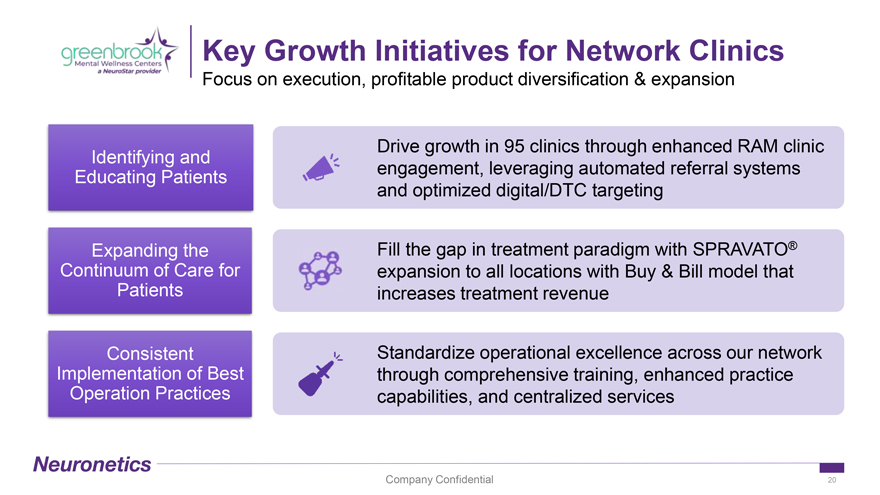
Key Growth Initiatives for Network Clinics Focus on execution, profitable product diversification & expansion Drive growth in 95 clinics through enhanced RAM clinic Identifying and engagement, leveraging automated referral systems Educating Patients and optimized digital/DTC targeting Expanding the Fill the gap in treatment paradigm with SPRAVATO® Continuum of Care for expansion to all locations with Buy & Bill model that Patients increases treatment revenue Consistent Standardize operational excellence across our network Implementation of Best through comprehensive training, enhanced practice Operation Practices capabilities, and centralized services Company Confidential 20
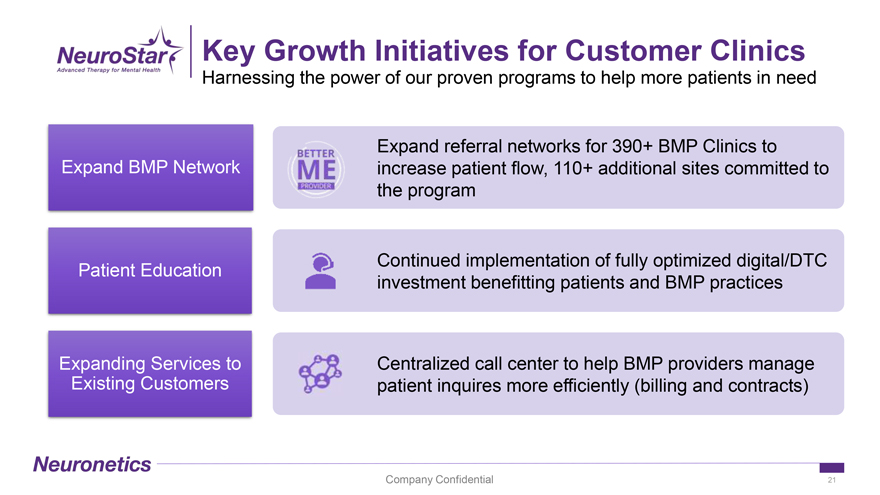
Key Growth Initiatives for Customer Clinics Harnessing the power of our proven programs to help more patients in need Expand referral networks for 390+ BMP Clinics to Expand BMP Network increase patient flow, 110+ additional sites committed to the program Continued implementation of fully optimized digital/DTC Patient Education investment benefitting patients and BMP practices Expanding Services to Centralized call center to help BMP providers manage Existing Customers patient inquires more efficiently (billing and contracts) Company Confidential 21
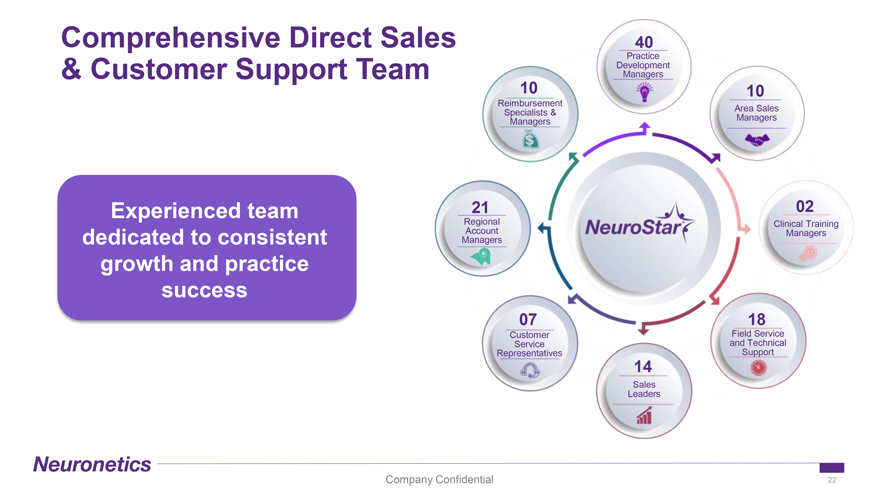
Comprehensive Direct Sales 40 Practice Development & Customer Support Team Managers 10 10 Reimbursement Area Sales Specialists & Managers Managers Experienced team 21 02 Regional Clinical Training Account Managers dedicated to consistent Managers growth and practice success 07 18 Customer Field Service Service and Technical Representatives Support 14 Sales Leaders Company Confidential 22
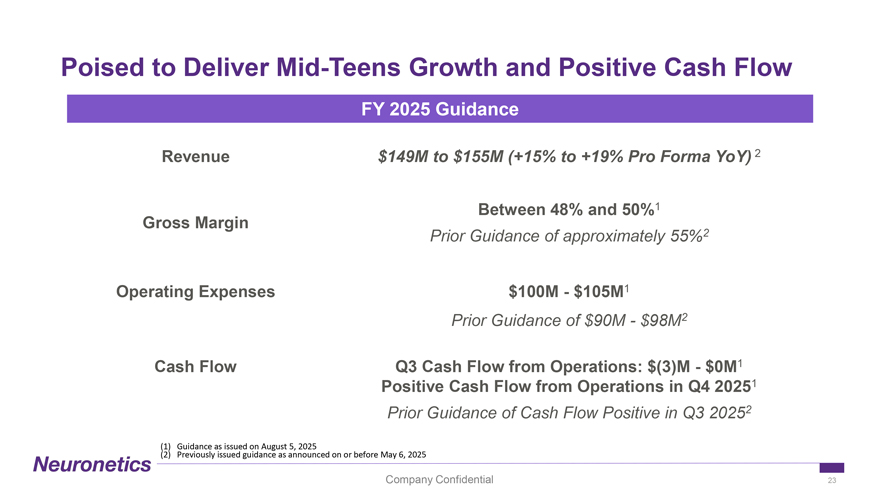
Poised to Deliver Mid-Teens Growth and Positive Cash Flow FY 2025 Guidance Revenue $149M to $155M (+15% to +19% Pro Forma YoY) 2 Between 48% and 50%1 Gross Margin Prior Guidance of approximately 55%2 Operating Expenses $100M—$105M1 Prior Guidance of $90M—$98M2 Cash Flow Q3 Cash Flow from Operations: $(3)M—$0M1 Positive Cash Flow from Operations in Q4 20251 Prior Guidance of Cash Flow Positive in Q3 20252 (1) Guidance as issued on August 5, 2025 (2) Previously issued guidance as announced on or before May 6, 2025 Company Confidential 23
Financial Overview Neuronetics transforming lives through NeuroHealth Neuronetics Company Confidential 24 24
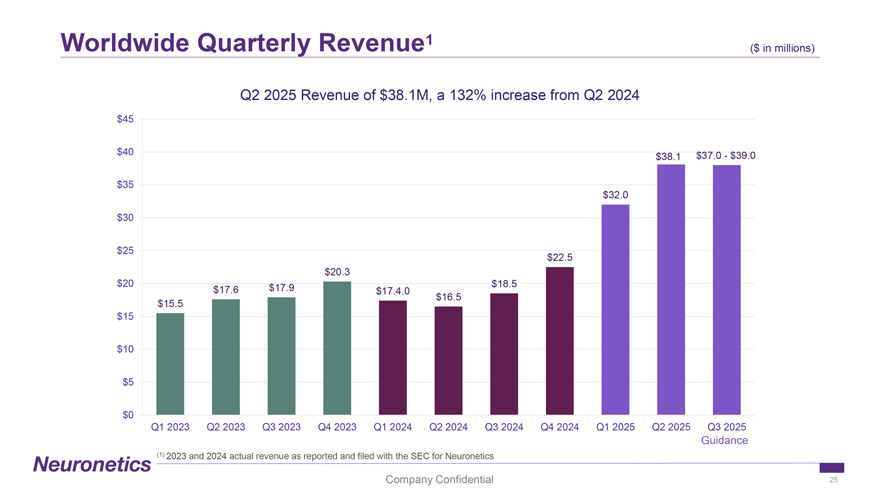
Worldwide Quarterly Revenue1 ($ in ($ millions) in millions) Q2 2025 Revenue of $38.1M, a 132% increase from Q2 2024 $45 $40 $37.0—$39.0 $38.1 $35 $32.0 $30 $25 $22.5 $20.3 $20 $17.9 $18.5 $17.6 $17.4.0 $16.5 $15.5 $15 $10 $5 $0 Q1 2023 Q2 2023 Q3 2023 Q4 2023 Q1 2024 Q2 2024 Q3 2024 Q4 2024 Q1 2025 Q2 2025 Q3 2025 Guidance (1) 2023 and 2024 actual revenue as reported and filed with the SEC for Neuronetics Company Confidential 25
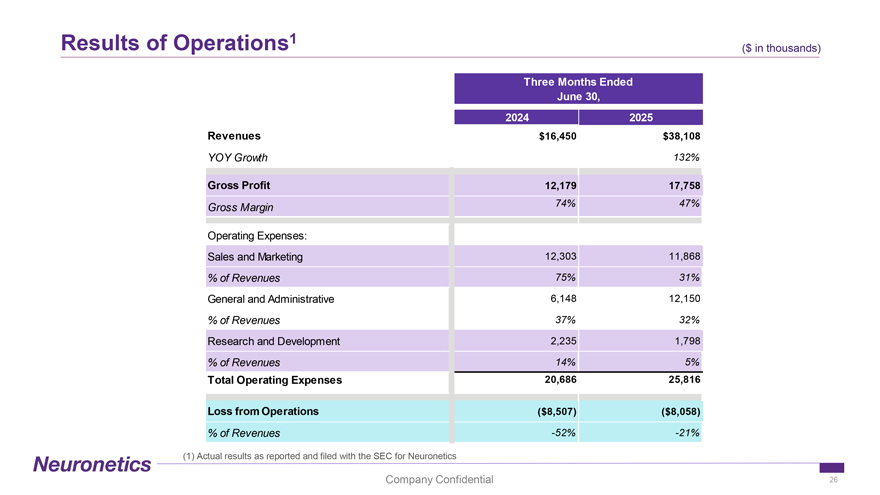
Results of Operations1 ($ in ( thousands) $ in thousands) Three Months Ended June 30, 2024 2025 Revenues $16,450 $38,108 YOY Growth 132% Gross Profit 12,179 17,758 Gross Margin 74% 47% Operating Expenses: Sales and Marketing 12,303 11,868 % of Revenues 75% 31% General and Administrative 6,148 12,150 % of Revenues 37% 32% Research and Development 2,235 1,798 % of Revenues 14% 5% Total Operating Expenses 20,686 25,816 Loss from Operations ($8,507) ($8,058) % of Revenues -52% -21% (1) Actual results as reported and filed with the SEC for Neuronetics Company Confidential 26
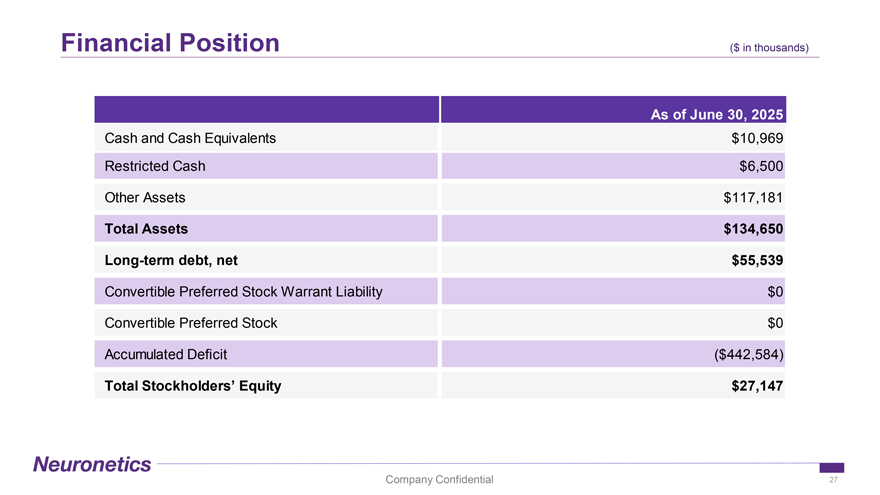
Financial Position ($ in ($ in thousands thousands) As of June 30, 2025 Cash and Cash Equivalents $10,969 Restricted Cash $6,500 Other Assets $117,181 Total Assets $134,650 Long-term debt, net $55,539 Convertible Preferred Stock Warrant Liability $0 Convertible Preferred Stock $0 Accumulated Deficit ($442,584) Total Stockholders’ Equity $27,147 Company Confidential 27
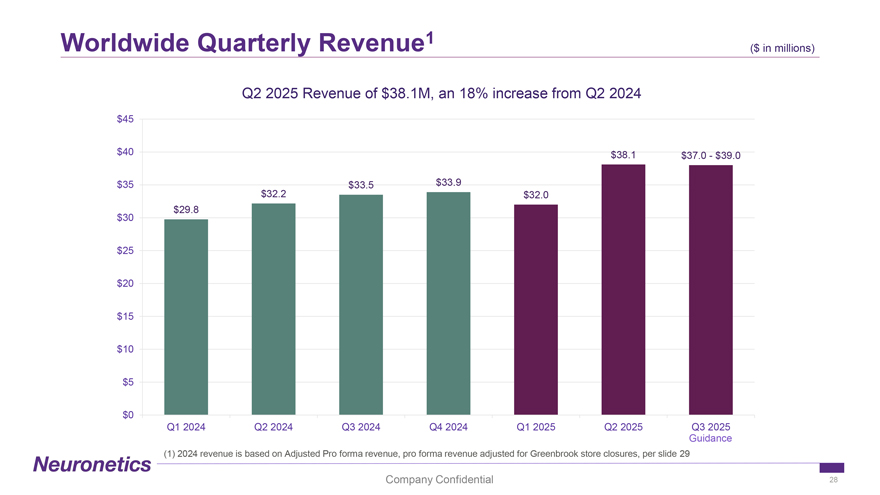
Worldwide Quarterly Revenue1 ($ in ($ millions) in millions) Q2 2025 Revenue of $38.1M, an 18% increase from Q2 2024 $45 $40 $38.1 $37.0—$39.0 $35 $33.5 $33.9 $32.2 $32.0 $29.8 $30 $25 $20 $15 $10 $5 $0 Q1 2024 Q2 2024 Q3 2024 Q4 2024 Q1 2025 Q2 2025 Q3 2025 Guidance (1) 2024 revenue is based on Adjusted Pro forma revenue, pro forma revenue adjusted for Greenbrook store closures, per slide 29 Company Confidential 28
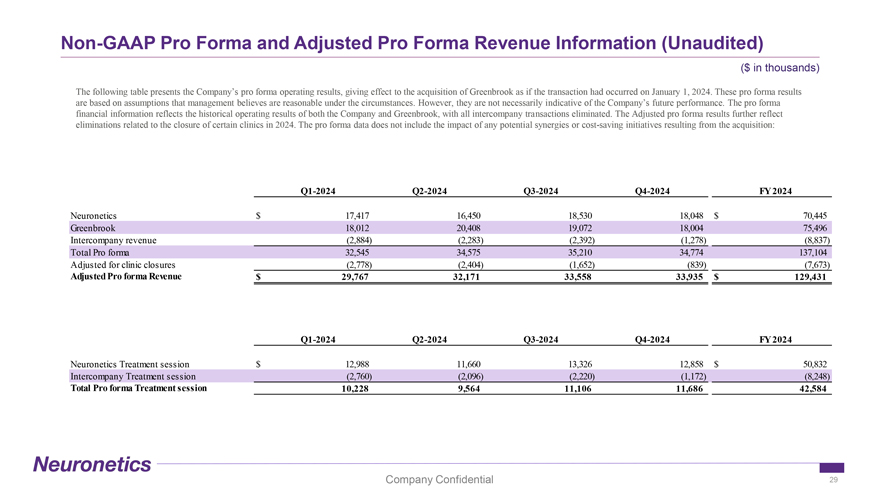
Non-GAAP Pro Forma and Adjusted Pro Forma Revenue Information (Unaudited) ($ in thousands) The following table presents the Company’s pro forma operating results, giving effect to the acquisition of Greenbrook as if the transaction had occurred on January 1, 2024. These pro forma results are based on assumptions that management believes are reasonable under the circumstances. However, they are not necessarily indicative of the Company’s future performance. The pro forma financial information reflects the historical operating results of both the Company and Greenbrook, with all intercompany transactions eliminated. The Adjusted pro forma results further reflect eliminations related to the closure of certain clinics in 2024. The pro forma data does not include the impact of any potential synergies or cost-saving initiatives resulting from the acquisition: Q1-2024 Q2-2024 Q3-2024 Q4-2024 FY 2024 Neuronetics $ 17,417 16,450 18,530 18,048 $ 70,445 Greenbrook 18,012 20,408 19,072 18,004 75,496 Intercompany revenue (2,884) (2,283) (2,392) (1,278) (8,837) Total Pro forma 32,545 34,575 35,210 34,774 137,104 Adjusted for clinic closures (2,778) (2,404) (1,652) (839) (7,673) Adjusted Pro forma Revenue $ 29,767 32,171 33,558 33,935 $ 129,431 Q1-2024 Q2-2024 Q3-2024 Q4-2024 FY 2024 Neuronetics Treatment session $ 12,988 11,660 13,326 12,858 $ 50,832 Intercompany Treatment session (2,760) (2,096) (2,220) (1,172) (8,248) Total Pro forma Treatment session 10,228 9,564 11,106 11,686 42,584 Company Confidential 29
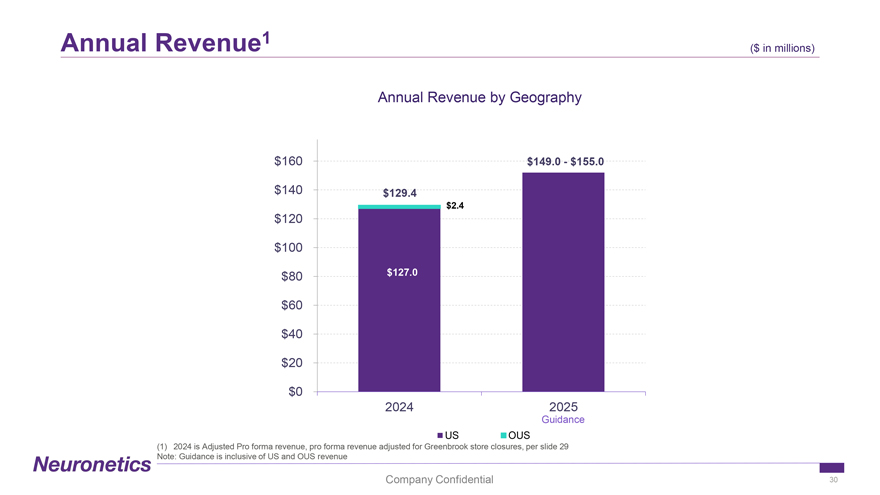
Annual Revenue1 ($ in ($ millions) in millions) Annual Revenue by Geography $160 $149.0—$155.0 $140 $129.4 $2.4 $120 $100 $80 $127.0 $60 $40 $20 $0 2024 2025 Guidance US OUS (1) 2024 is Adjusted Pro forma revenue, pro forma revenue adjusted for Greenbrook store closures, per slide 29 Note: Guidance is inclusive of US and OUS revenue Company Confidential 30
Supplemental Information Neuronetics, Inc. . Company Confidential 31
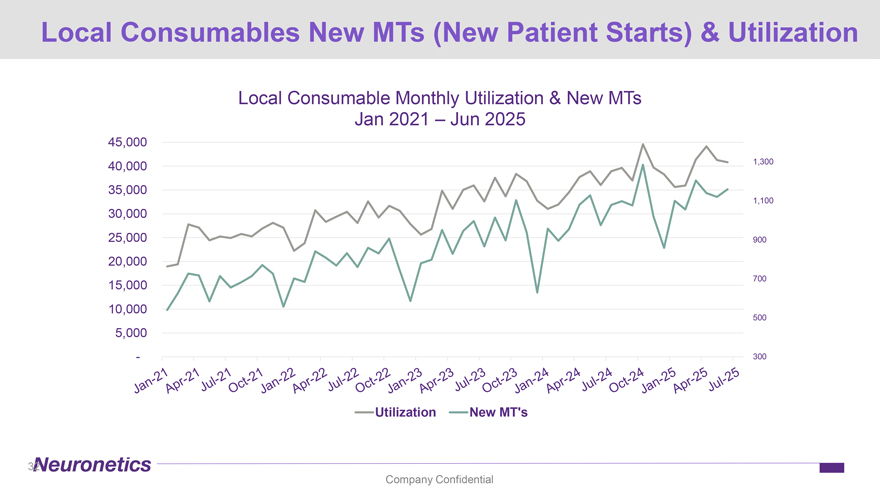
Local Consumables New MTs (New Patient Starts) & Utilization Local Consumable Monthly Utilization & New MTs Jan 2021 – Jun 2025 45,000 40,000 1,300 35,000 1,100 30,000 25,000 900 20,000 700 15,000 10,000 500 5,000 —300 Utilization New MT’s 32 Company Confidential
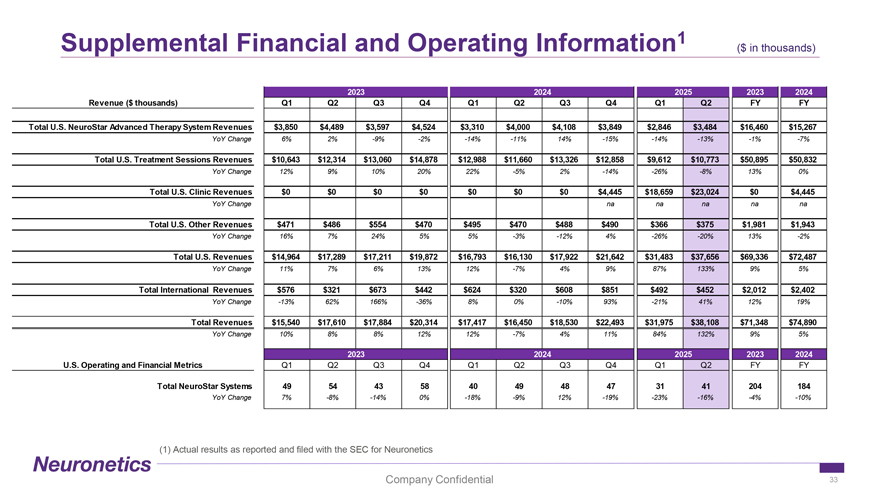
Supplemental Financial and Operating Information 1 ($ in thousands) 2023 2024 2025 2023 2024 Revenue ($ thousands) Q1 Q2 Q3 Q4 Q1 Q2 Q3 Q4 Q1 Q2 FY FY Total U.S. NeuroStar Advanced Therapy System Revenues $3,850 $4,489 $3,597 $4,524 $3,310 $4,000 $4,108 $3,849 $2,846 $3,484 $16,460 $15,267 YoY Change 6% 2% -9% -2% -14% -11% 14% -15% -14% -13% -1% -7% Total U.S. Treatment Sessions Revenues $10,643 $12,314 $13,060 $14,878 $12,988 $11,660 $13,326 $12,858 $9,612 $10,773 $50,895 $50,832 YoY Change 12% 9% 10% 20% 22% -5% 2% -14% -26% -8% 13% 0% Total U.S. Clinic Revenues $0 $0 $0 $0 $0 $0 $0 $4,445 $18,659 $23,024 $0 $4,445 YoY Change na na na na na Total U.S. Other Revenues $471 $486 $554 $470 $495 $470 $488 $490 $366 $375 $1,981 $1,943 YoY Change 16% 7% 24% 5% 5% -3% -12% 4% -26% -20% 13% -2% Total U.S. Revenues $14,964 $17,289 $17,211 $19,872 $16,793 $16,130 $17,922 $21,642 $31,483 $37,656 $69,336 $72,487 YoY Change 11% 7% 6% 13% 12% -7% 4% 9% 87% 133% 9% 5% Total International Revenues $576 $321 $673 $442 $624 $320 $608 $851 $492 $452 $2,012 $2,402 YoY Change -13% 62% 166% -36% 8% 0% -10% 93% -21% 41% 12% 19% Total Revenues $15,540 $17,610 $17,884 $20,314 $17,417 $16,450 $18,530 $22,493 $31,975 $38,108 $71,348 $74,890 YoY Change 10% 8% 8% 12% 12% -7% 4% 11% 84% 132% 9% 5% 2023 2024 2025 2023 2024 U.S. Operating and Financial Metrics Q1 Q2 Q3 Q4 Q1 Q2 Q3 Q4 Q1 Q2 FY FY Total NeuroStar Systems 49 54 43 58 40 49 48 47 31 41 204 184 YoY Change 7% -8% -14% 0% -18% -9% 12% -19% -23% -16% -4% -10% (1) Actual results as reported and filed with the SEC for Neuronetics Company Confidential 33
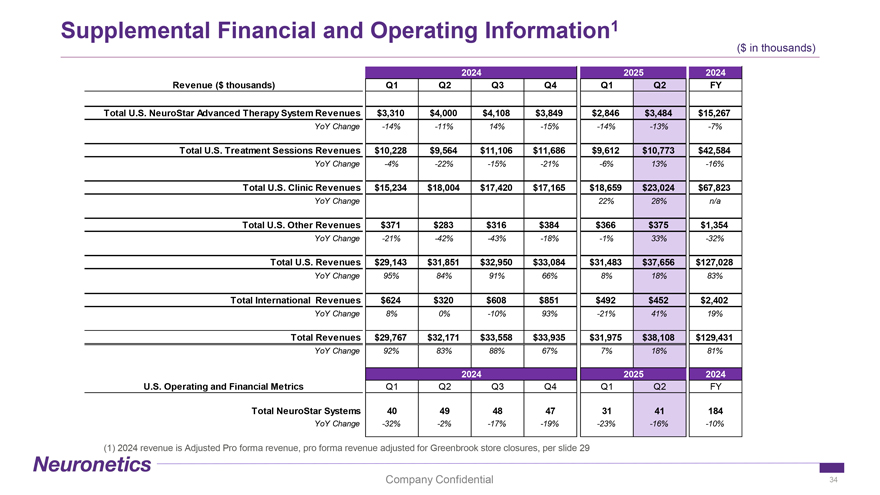
Supplemental Financial and Operating Information 1 ($ in thousands) 2024 2025 2024 Revenue ($ thousands) Q1 Q2 Q3 Q4 Q1 Q2 FY Total U.S. NeuroStar Advanced Therapy System Revenues $3,310 $4,000 $4,108 $3,849 $2,846 $3,484 $15,267 YoY Change -14% -11% 14% -15% -14% -13% -7% Total U.S. Treatment Sessions Revenues $10,228 $9,564 $11,106 $11,686 $9,612 $10,773 $42,584 YoY Change -4% -22% -15% -21% -6% 13% -16% Total U.S. Clinic Revenues $15,234 $18,004 $17,420 $17,165 $18,659 $23,024 $67,823 YoY Change 22% 28% n/a Total U.S. Other Revenues $371 $283 $316 $384 $366 $375 $1,354 YoY Change -21% -42% -43% -18% -1% 33% -32% Total U.S. Revenues $29,143 $31,851 $32,950 $33,084 $31,483 $37,656 $127,028 YoY Change 95% 84% 91% 66% 8% 18% 83% Total International Revenues $624 $320 $608 $851 $492 $452 $2,402 YoY Change 8% 0% -10% 93% -21% 41% 19% Total Revenues $29,767 $32,171 $33,558 $33,935 $31,975 $38,108 $129,431 YoY Change 92% 83% 88% 67% 7% 18% 81% 2024 2025 2024 U.S. Operating and Financial Metrics Q1 Q2 Q3 Q4 Q1 Q2 FY Total NeuroStar Systems 40 49 48 47 31 41 184 YoY Change -32% -2% -17% -19% -23% -16% -10% (1) 2024 revenue is Adjusted Pro forma revenue, pro forma revenue adjusted for Greenbrook store closures, per slide 29 Company Confidential 34