| SECOND QUARTER 2025 EARNINGS SUPPLEMENTAL www.globalmedicalreit.com NYSE: GMRE Atrium Health – Winston-Salem, NC |
| Forward-Looking Statements Certain statements contained herein may be considered “forward-looking statements” within the meaning of the Private Securities Litigation Reform Act of 1995, and it is the Company’s intent that any such statements be protected by the safe harbor created thereby. These forward-looking statements are identified by their use of terms and phrases such as "anticipate," "believe," "could," "estimate," "expect," "intend," "may," "should," "plan," "predict," "project," "will," "continue" and other similar terms and phrases, including references to assumptions and forecasts of future results. Except for historical information, the statements set forth herein including, but not limited to, any statements regarding our earnings, our liquidity, our tenants’ ability to pay rent to us, our ability to refinance our indebtedness, expected financial performance (including future cash flows associated with our joint venture, new tenants or the expansion of current properties), 2025 AFFO guidance, future dividends or other financial items; any other statements concerning our plans, strategies, objectives and expectations for future operations and future portfolio occupancy rates, our pipeline of acquisition opportunities and expected acquisition activity, including the timing and/or successful completion of any acquisitions and expected rent receipts on these properties, our expected disposition activity, including the timing and/or successful completion of any dispositions and the expected use of proceeds therefrom, and any statements regarding future economic conditions or performance are forward-looking statements. These forward-looking statements are based on our current expectations, estimates and assumptions and are subject to certain risks and uncertainties. Although the Company believes that the expectations, estimates and assumptions reflected in its forward-looking statements are reasonable, actual results could differ materially from those projected or assumed in any of the Company’s forward-looking statements. Additional information concerning us and our business, including additional factors that could materially and adversely affect our financial results, include, without limitation, the risks described under Part I, Item 1A - Risk Factors, in our Annual Report on Form 10-K, our Quarterly Reports on Form 10-Q, and in our other filings with the SEC. You are cautioned not to place undue reliance on forward-looking statements. The Company does not intend, and undertakes no obligation, to update any forward-looking statement. TABLE OF CONTENTS Company Overview 3 Select Quarterly Financial Data 6 Business Summary 7 Acquisitions / Dispositions 8 Portfolio Summary 9 Key Tenants 11 Debt and Hedging Summary 12 Total Capitalization and Equity Summary 14 Condensed Consolidated Statements of Operations 15 Condensed Consolidated Balance Sheets 16 Condensed Consolidated Statements of Cash Flows 17 Non-GAAP Reconciliations 18 Sustainability Summary 20 Reporting Definitions and Other Disclosures 21 Legent Hospital for Special Surgery – Plano, TX 2Q-2025 | Earnings Supplemental 2 |
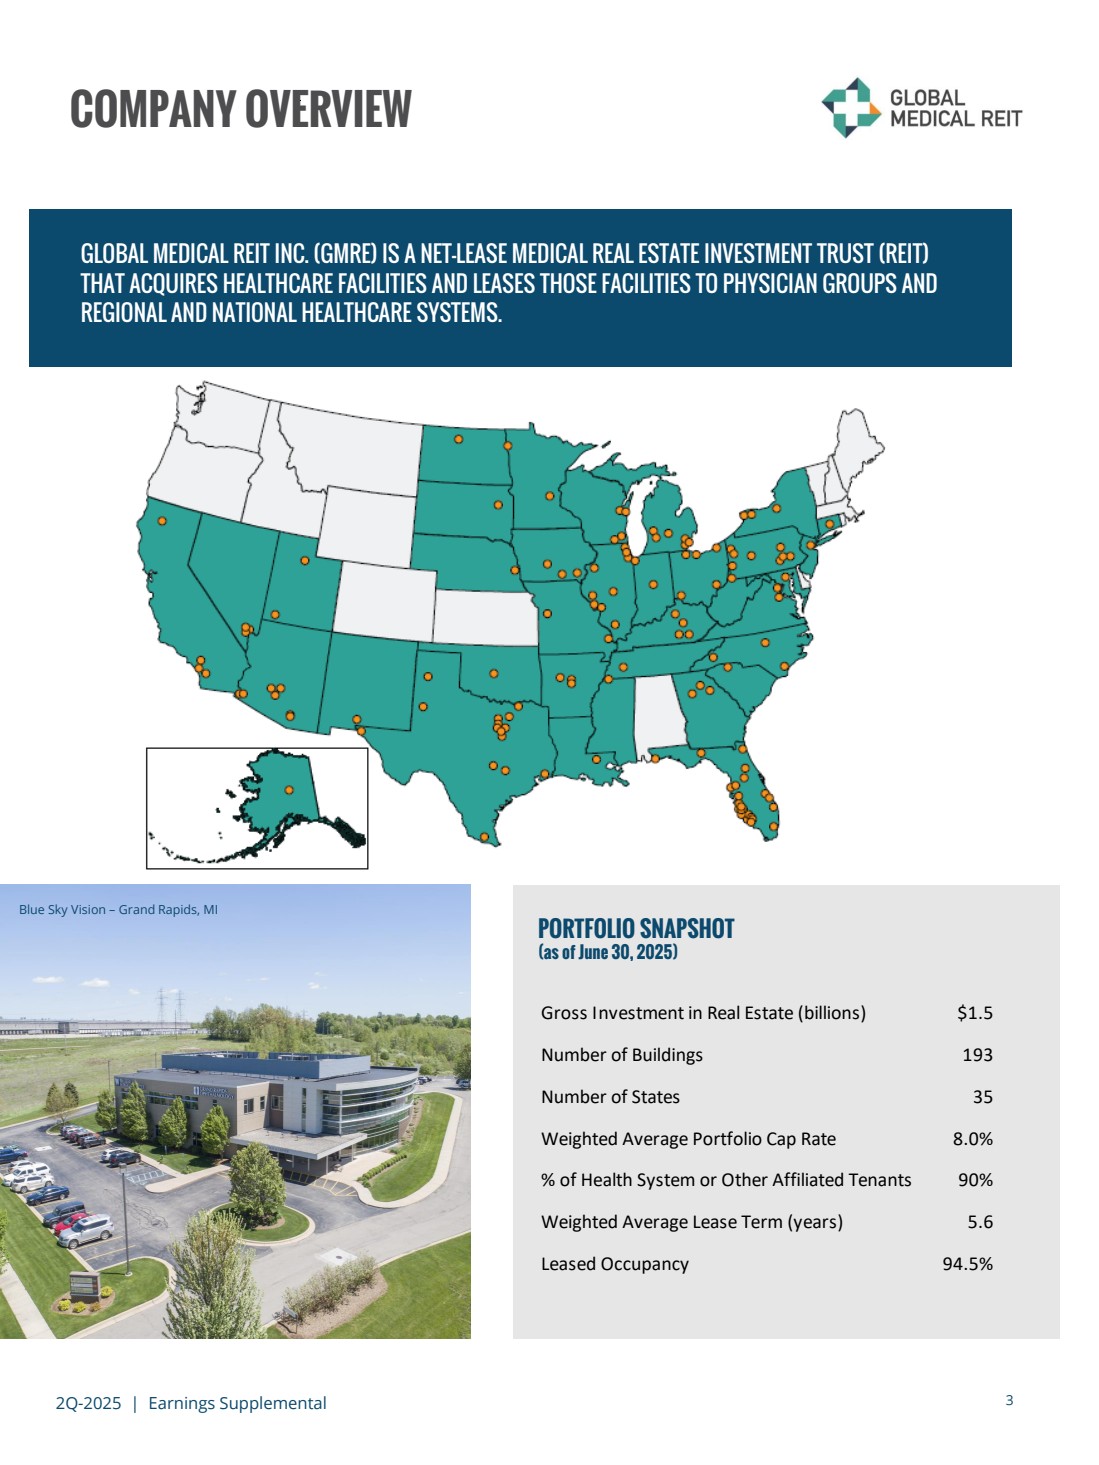
| 2Q-2025 | Earnings Supplemental 3 COMPANY OVERVIEW GLOBAL MEDICAL REIT INC. (GMRE) IS A NET-LEASE MEDICAL REAL ESTATE INVESTMENT TRUST (REIT) THAT ACQUIRES HEALTHCARE FACILITIES AND LEASES THOSE FACILITIES TO PHYSICIAN GROUPS AND REGIONAL AND NATIONAL HEALTHCARE SYSTEMS. PORTFOLIO SNAPSHOT (as of June 30, 2025) Blue Sky Vision – Grand Rapids, MI Gross Investment in Real Estate (billions) $1.5 Number of Buildings 193 Number of States 35 Weighted Average Portfolio Cap Rate 8.0% % of Health System or Other Affiliated Tenants 90% Weighted Average Lease Term (years) 5.6 Leased Occupancy 94.5% |
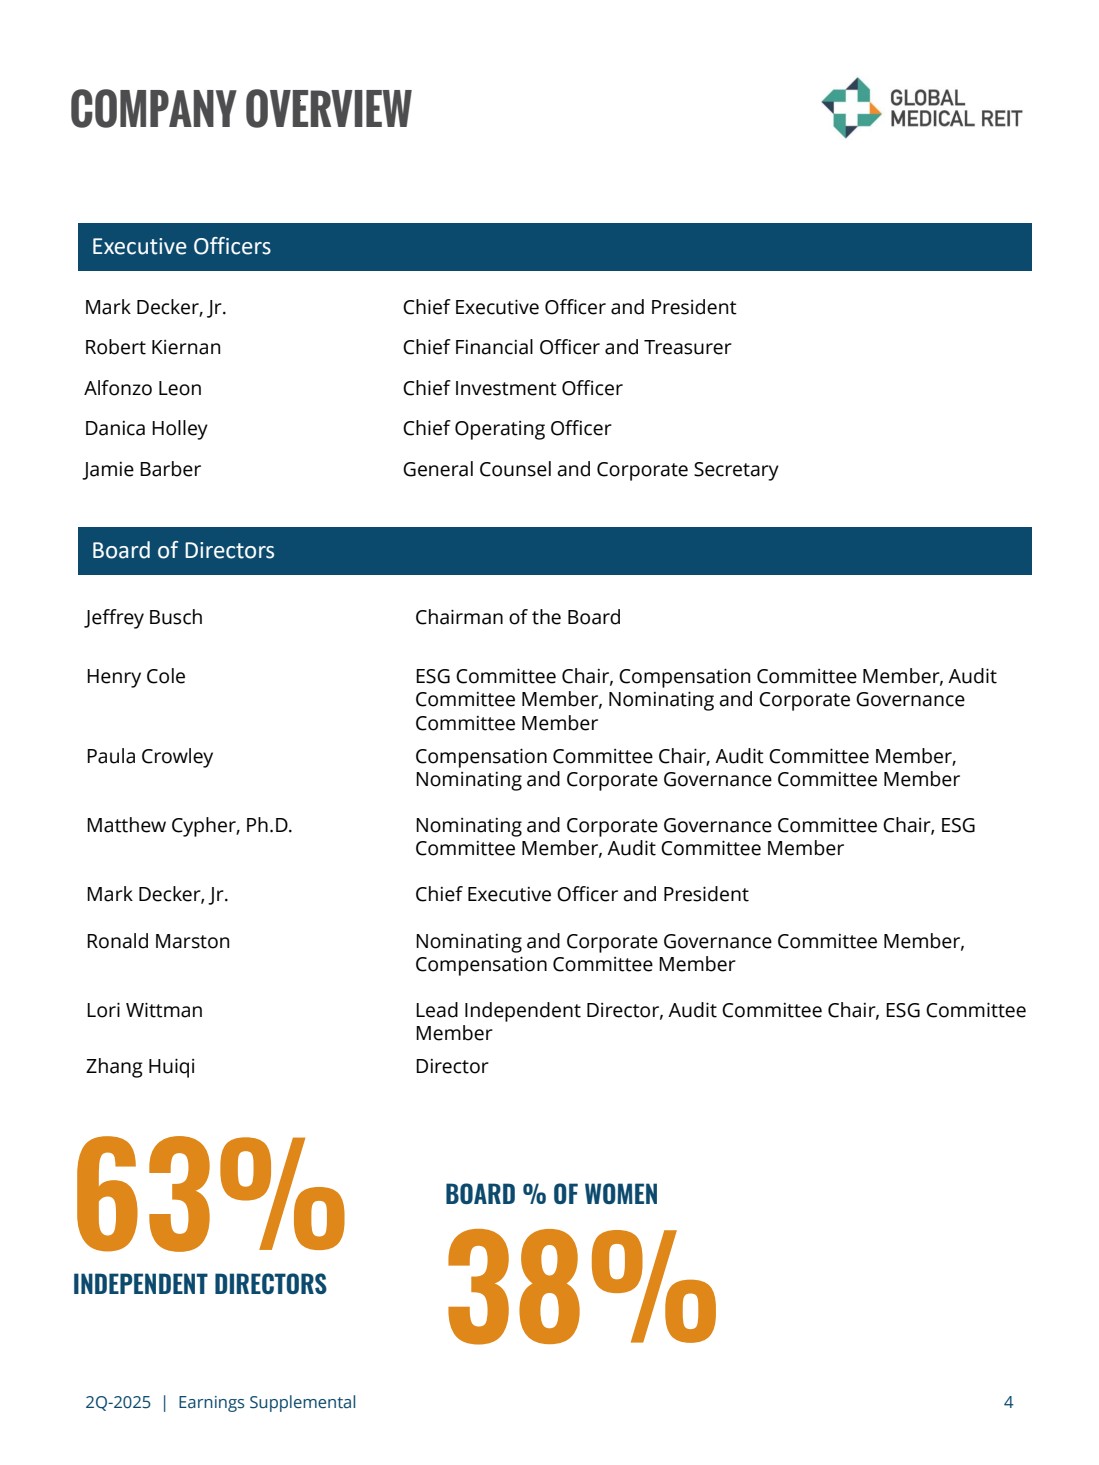
| 63% 2Q-2025 | Earnings Supplemental 4 Mark Decker, Jr. Chief Executive Officer and President Robert Kiernan Chief Financial Officer and Treasurer Alfonzo Leon Chief Investment Officer Danica Holley Chief Operating Officer Jamie Barber General Counsel and Corporate Secretary Board of Directors Jeffrey Busch Chairman of the Board Henry Cole ESG Committee Chair, Compensation Committee Member, Audit Committee Member, Nominating and Corporate Governance Committee Member Paula Crowley Compensation Committee Chair, Audit Committee Member, Nominating and Corporate Governance Committee Member Matthew Cypher, Ph.D. Nominating and Corporate Governance Committee Chair, ESG Committee Member, Audit Committee Member Mark Decker, Jr. Chief Executive Officer and President Ronald Marston Nominating and Corporate Governance Committee Member, Compensation Committee Member Lori Wittman Lead Independent Director, Audit Committee Chair, ESG Committee Member Zhang Huiqi Director INDEPENDENT DIRECTORS BOARD % OF WOMEN COMPANY OVERVIEW 38% Executive Officers |
| 2Q-2025 | Earnings Supplemental 5 COMPANY OVERVIEW Corporate Headquarters Global Medical REIT Inc. 7373 Wisconsin Avenue, Suite 800 Bethesda, MD 20814 Phone: 202.524.6851 www.globalmedicalreit.com Stock Exchange New York Stock Exchange Ticker: GMRE Investor Relations Email: investors@globalmedicalreit.com Phone: 202.524.6869 Independent Registered Public Accounting Firm Deloitte & Touche LLP Corporate and REIT Tax Counsel Vinson & Elkins LLP Transfer Agent Equiniti Trust Company Phone: 800.468.9716 Cobalt Rehabilitation Hospital – Surprise, AZ Firm Name Alliance Global Partners Guarav Mehta B Riley John Massocca BMO Juan Sanabria Baird Wes Golladay Berenberg Kai Klose Citizens Aaron Hecht Colliers Securities Barry Oxford Compass Point Merrill Ross Janney Robert Stevenson KeyBanc Austin Wurschmidt Sell-Side Analyst Coverage |
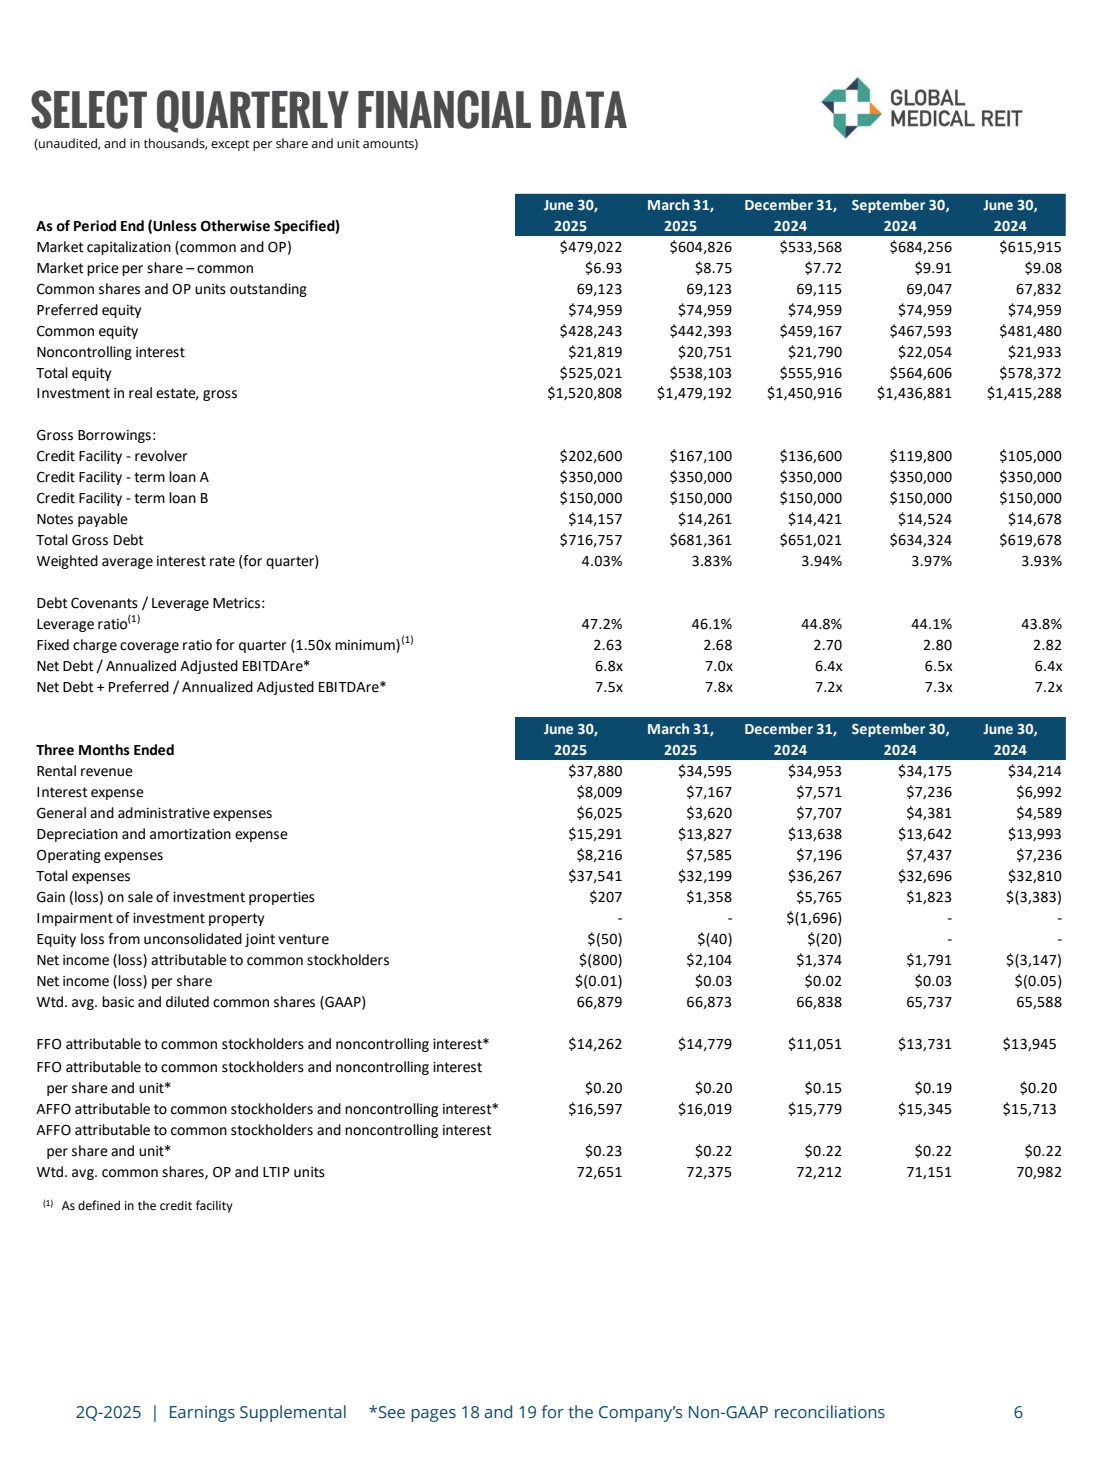
| 2Q-2025 | Earnings Supplemental *See pages 18 and 19 for the Company’s Non-GAAP reconciliations 6 (unaudited, and in thousands, except per share and unit amounts) SELECT QUARTERLY FINANCIAL DATA (1) As defined in the credit facility June 30, March 31, December 31, September 30, June 30, As of Period End (Unless Otherwise Specified) 2025 2025 2024 2024 2024 Market capitalization (common and OP) $479,022 $604,826 $533,568 $684,256 $615,915 Market price per share – common $6.93 $8.75 $7.72 $9.91 $9.08 Common shares and OP units outstanding 69,123 69,123 69,115 69,047 67,832 Preferred equity $74,959 $74,959 $74,959 $74,959 $74,959 Common equity $428,243 $442,393 $459,167 $467,593 $481,480 Noncontrolling interest $21,819 $20,751 $21,790 $22,054 $21,933 Total equity $525,021 $538,103 $555,916 $564,606 $578,372 Investment in real estate, gross $1,520,808 $1,479,192 $1,450,916 $1,436,881 $1,415,288 Gross Borrowings: Credit Facility - revolver $202,600 $167,100 $136,600 $119,800 $105,000 Credit Facility - term loan A $350,000 $350,000 $350,000 $350,000 $350,000 Credit Facility - term loan B $150,000 $150,000 $150,000 $150,000 $150,000 Notes payable $14,157 $14,261 $14,421 $14,524 $14,678 Total Gross Debt $716,757 $681,361 $651,021 $634,324 $619,678 Weighted average interest rate (for quarter) 4.03% 3.83% 3.94% 3.97% 3.93% Debt Covenants / Leverage Metrics: Leverage ratio(1) 47.2% 46.1% 44.8% 44.1% 43.8% Fixed charge coverage ratio for quarter (1.50x minimum)(1) 2.63 2.68 2.70 2.80 2.82 Net Debt / Annualized Adjusted EBITDAre* 6.8x 7.0x 6.4x 6.5x 6.4x Net Debt + Preferred / Annualized Adjusted EBITDAre* 7.5x 7.8x 7.2x 7.3x 7.2x June 30, March 31, December 31, September 30, June 30, Three Months Ended 2025 2025 2024 2024 2024 Rental revenue $37,880 $34,595 $34,953 $34,175 $34,214 Interest expense $8,009 $7,167 $7,571 $7,236 $6,992 General and administrative expenses $6,025 $3,620 $7,707 $4,381 $4,589 Depreciation and amortization expense $15,291 $13,827 $13,638 $13,642 $13,993 Operating expenses $8,216 $7,585 $7,196 $7,437 $7,236 Total expenses $37,541 $32,199 $36,267 $32,696 $32,810 Gain (loss) on sale of investment properties $207 $1,358 $5,765 $1,823 $(3,383) Impairment of investment property - - $(1,696) - - Equity loss from unconsolidated joint venture $(50) $(40) $(20) - - Net income (loss) attributable to common stockholders $(800) $2,104 $1,374 $1,791 $(3,147) Net income (loss) per share $(0.01) $0.03 $0.02 $0.03 $(0.05) Wtd. avg. basic and diluted common shares (GAAP) 66,879 66,873 66,838 65,737 65,588 FFO attributable to common stockholders and noncontrolling interest* $14,262 $14,779 $11,051 $13,731 $13,945 FFO attributable to common stockholders and noncontrolling interest per share and unit* $0.20 $0.20 $0.15 $0.19 $0.20 AFFO attributable to common stockholders and noncontrolling interest* $16,597 $16,019 $15,779 $15,345 $15,713 AFFO attributable to common stockholders and noncontrolling interest per share and unit* $0.23 $0.22 $0.22 $0.22 $0.22 Wtd. avg. common shares, OP and LTIP units 72,651 72,375 72,212 71,151 70,982 |
| 2Q-2025 | Earnings Supplemental See pages 18 and 19 for the Company’s Non-GAAP reconciliations 7 BUSINESS SUMMARY SECOND QUARTER 2025 OPERATING SUMMARY • Net loss attributable to common stockholders was $0.8 million, or $0.01 per diluted share, as compared to $3.1 million, or $0.05 per diluted share, in the comparable prior year period. • Funds from operations attributable to common stockholders and noncontrolling interest (“FFO”) of $14.3 million, or $0.20 per share and unit, as compared to $13.9 million, or $0.20 per share and unit, in the comparable prior year period. • Adjusted funds from operations attributable to common stockholders and noncontrolling interest (“AFFO”) of $16.6 million, or $0.23 per share and unit, as compared to $15.7 million, or $0.22 per share and unit, in the comparable prior year period. INVESTMENT AND PORTFOLIO ACTIVITY • In April 2025, the Company completed the acquisition of the remaining two properties in a previously announced five-property medical portfolio encompassing an aggregate of 297,724 leasable square feet for an aggregate purchase price of $38.1 million with aggregate annualized base rent of $3.6 million. • In April 2025, the Company sold a medical facility in Chipley, Florida, receiving gross proceeds of $1.4 million, resulting in a gain of $0.2 million, completing our exit of investments in the Panama City, FL market. • In May 2025, an affiliate of CHRISTUS Health began fully occupying our 84,674 square foot Beaumont, TX facility pursuant to its fifteen-year triple-net lease. Annual base rent for the first lease year will be $2.9 million with 2.5% annual rent increases thereafter. CAPITAL MARKETS AND DEBT ACTIVITY • The Company’s leverage was 47.2% as of June 30, 2025, and Net Debt / Annualized Adjusted EBITDAre was 6.8x for the second quarter of 2025. • On July 31, 2025, the Company fully repaid the $12.9 million Rosedale loan using borrowings from the revolving credit facility. • As of August 4, 2025, the Company’s borrowing capacity under the credit facility was $177 million. • Regarding the $350 million Term Loan A component of the credit facility that matures in May 2026, the Company is in active discussions with our credit facility lenders related to refinancing this obligation. As part of this process, the Company is also discussing extending the maturity date of the Revolver. Based on various factors, including current market conditions, the performance of our assets, and our lender discussions to date, the Company is not anticipating any significant adverse changes to the financial terms of the credit facility and expects to complete these transactions during the fourth quarter of 2025. Although the Company expects to complete the refinancing during the fourth quarter of 2025, subject to market and other conditions, there can be no assurance that the refinancing will be completed as expected or at all. • The Company did not issue any shares of common stock under its ATM program during the second quarter of 2025 or from July 1, 2025 through August 4, 2025. 2025 GUIDANCE • The Company is reaffirming its full year 2025 AFFO per share and unit guidance of $0.89 to $0.93. Guidance is based on the following primary assumptions and other factors: o No additional acquisitions or dispositions other than activity that has been either completed or announced. o No additional equity or debt issuances other than normal course Revolver borrowing/repayments. o AFFO guidance excludes one-time obligations related to the CEO succession plan. |
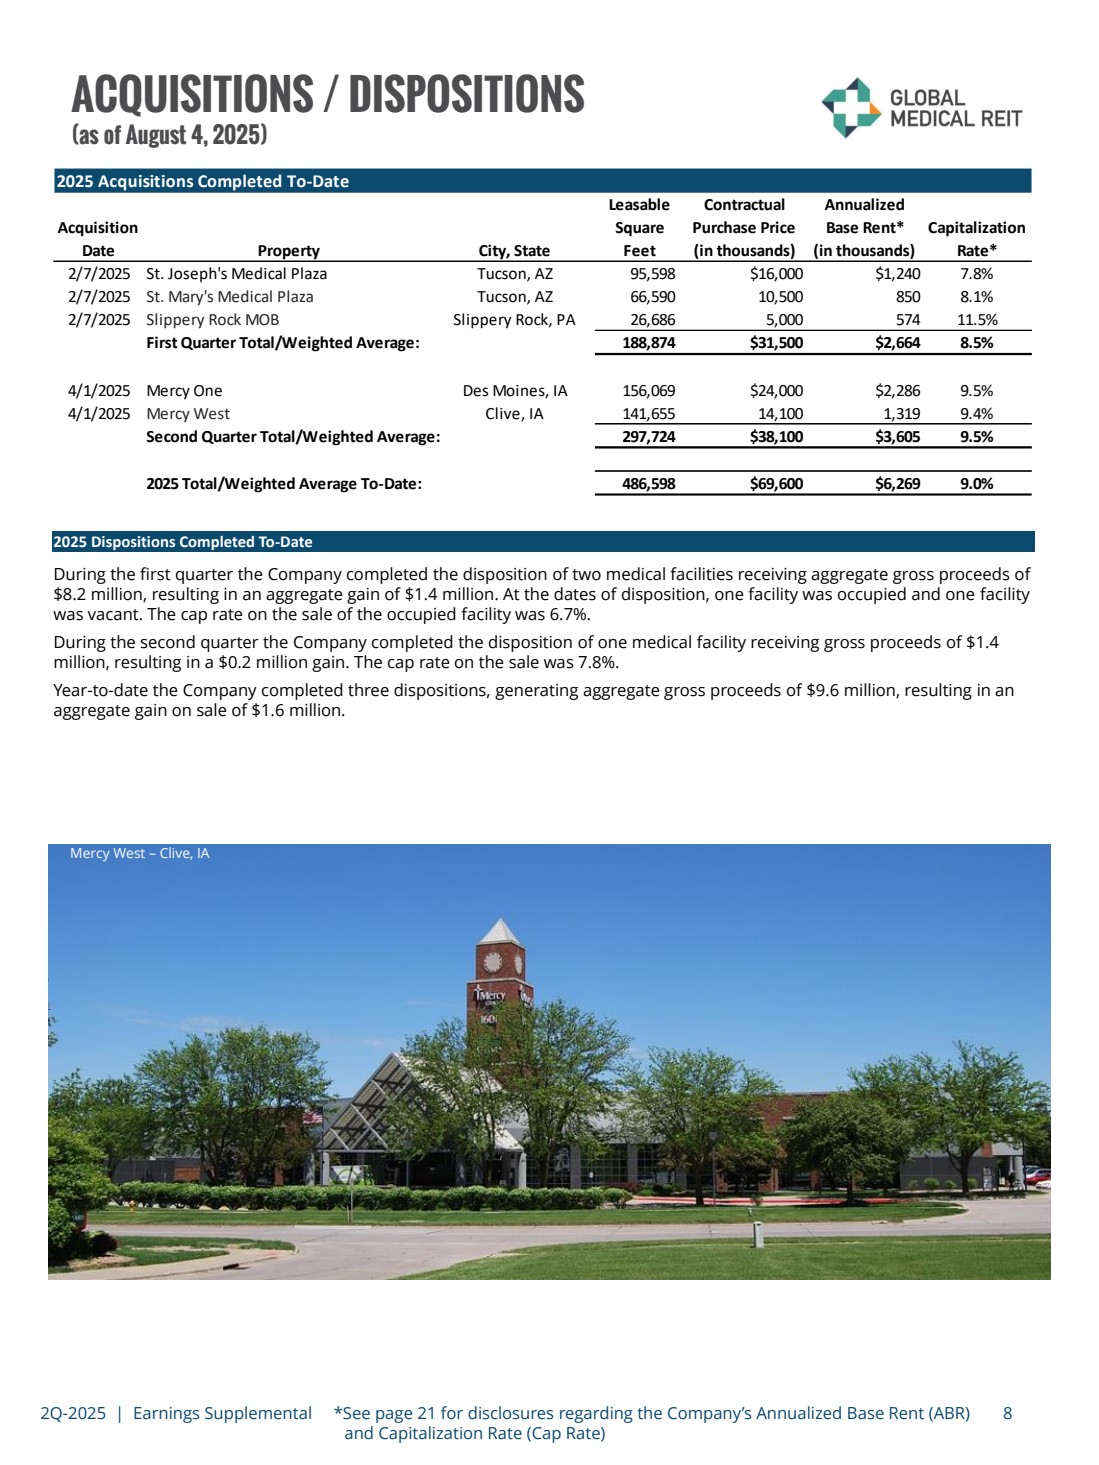
| 2Q-2025 | Earnings Supplemental *See page 21 for disclosures regarding the Company’s Annualized Base Rent (ABR) and Capitalization Rate (Cap Rate) 8 ACQUISITIONS / DISPOSITIONS (as of August 4, 2025) Pediatrics Plus – Russellville, AR 2025 Dispositions Completed To-Date During the first quarter the Company completed the disposition of two medical facilities receiving aggregate gross proceeds of $8.2 million, resulting in an aggregate gain of $1.4 million. At the dates of disposition, one facility was occupied and one facility was vacant. The cap rate on the sale of the occupied facility was 6.7%. During the second quarter the Company completed the disposition of one medical facility receiving gross proceeds of $1.4 million, resulting in a $0.2 million gain. The cap rate on the sale was 7.8%. Year-to-date the Company completed three dispositions, generating aggregate gross proceeds of $9.6 million, resulting in an aggregate gain on sale of $1.6 million. Mercy West – Clive, IA Acquisition Date Property City, State Leasable Square Feet Contractual Purchase Price (in thousands) Annualized Base Rent* (in thousands) Capitalization Rate* 2/7/2025 St. Joseph's Medical Plaza Tucson, AZ 95,598 $16,000 $1,240 7.8% 2/7/2025 St. Mary's Medical Plaza Tucson, AZ 66,590 10,500 850 8.1% 2/7/2025 Slippery Rock MOB Slippery Rock, PA 26,686 5,000 574 11.5% First Quarter Total/Weighted Average: 188,874 $31,500 $2,664 8.5% 4/1/2025 Mercy One Des Moines, IA 156,069 $24,000 $2,286 9.5% 4/1/2025 Mercy West Clive, IA 141,655 14,100 1,319 9.4% Second Quarter Total/Weighted Average: 297,724 $38,100 $3,605 9.5% 2025 Total/Weighted Average To-Date: 486,598 $69,600 $6,269 9.0% 2025 Acquisitions Completed To-Date |
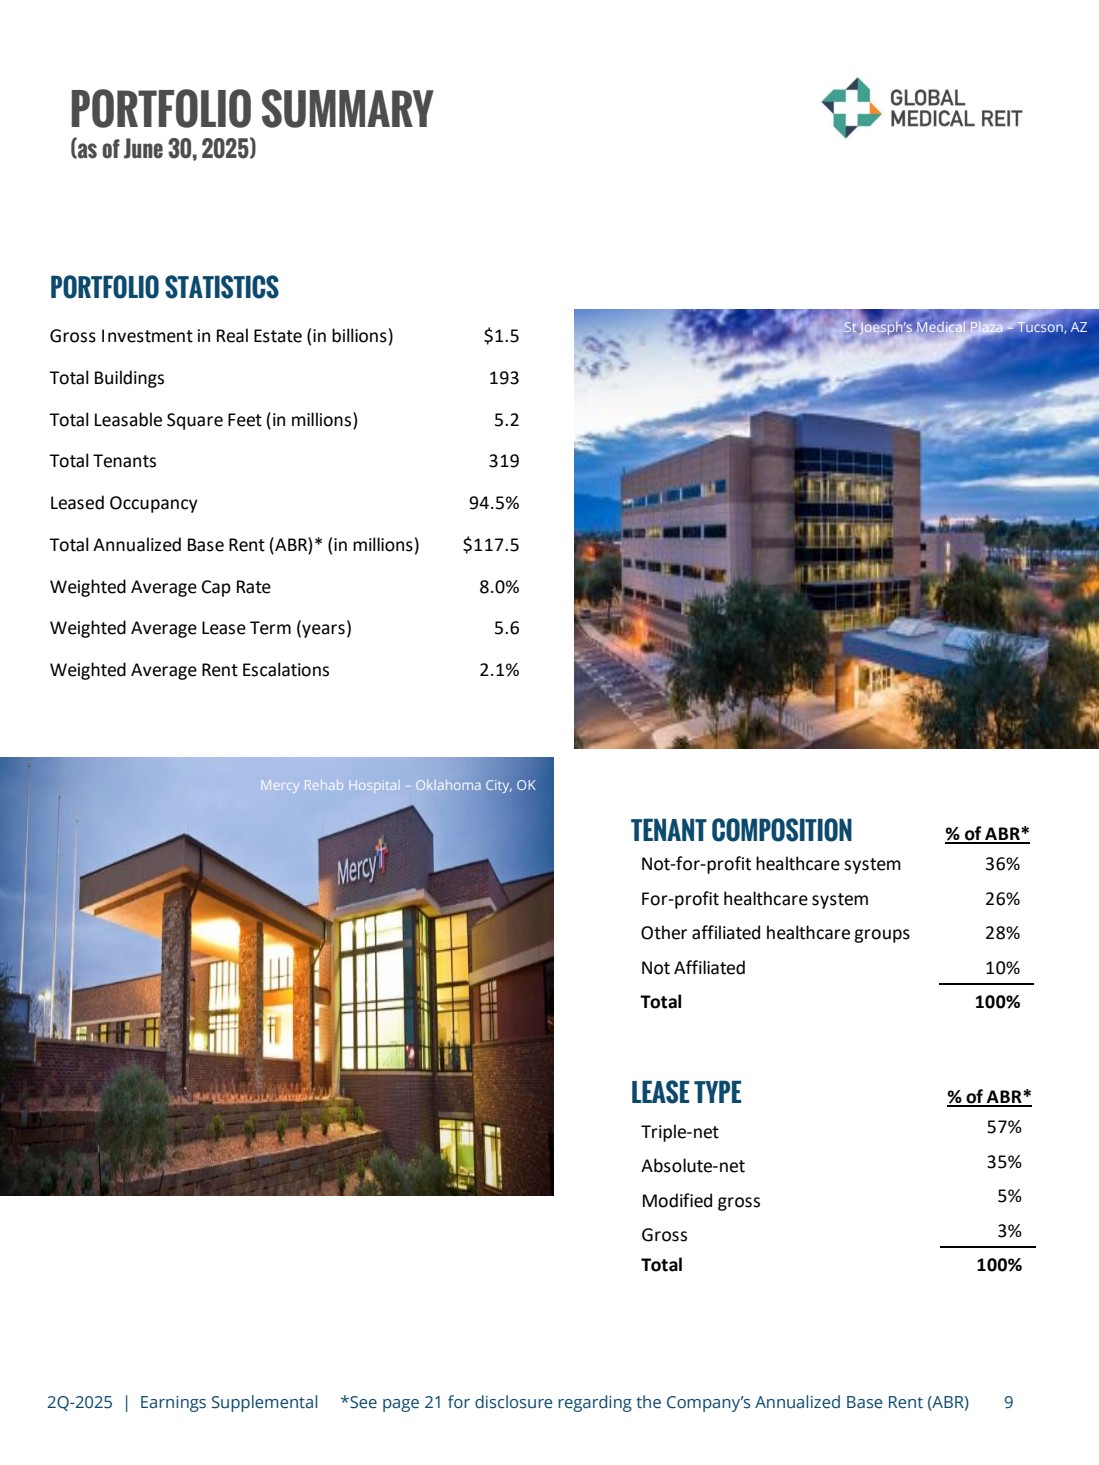
| 2Q-2025 | Earnings Supplemental *See page 21 for disclosure regarding the Company’s Annualized Base Rent (ABR) 9 PORTFOLIO SUMMARY (as of June 30, 2025) PORTFOLIO STATISTICS TENANT COMPOSITION Texas Digestive Disease Consultants– Ft. Worth, TX Indiana Eye Clinic – Greenwood, IN Mercy Rehab Hospital – Oklahoma City, OK St Joesph’s Medical Plaza – Tucson, AZ Gross Investment in Real Estate (in billions) $1.5 Total Buildings 193 Total Leasable Square Feet (in millions) 5.2 Total Tenants 319 Leased Occupancy 94.5% Total Annualized Base Rent (ABR)* (in millions) $117.5 Weighted Average Cap Rate 8.0% Weighted Average Lease Term (years) 5.6 Weighted Average Rent Escalations 2.1% LEASE TYPE % of ABR* Not-for-profit healthcare system 36% For-profit healthcare system 26% Other affiliated healthcare groups 28% Not Affiliated 10% Total 100% % of ABR* Triple-net 57% Absolute-net 35% Modified gross 5% Gross 3% Total 100% |
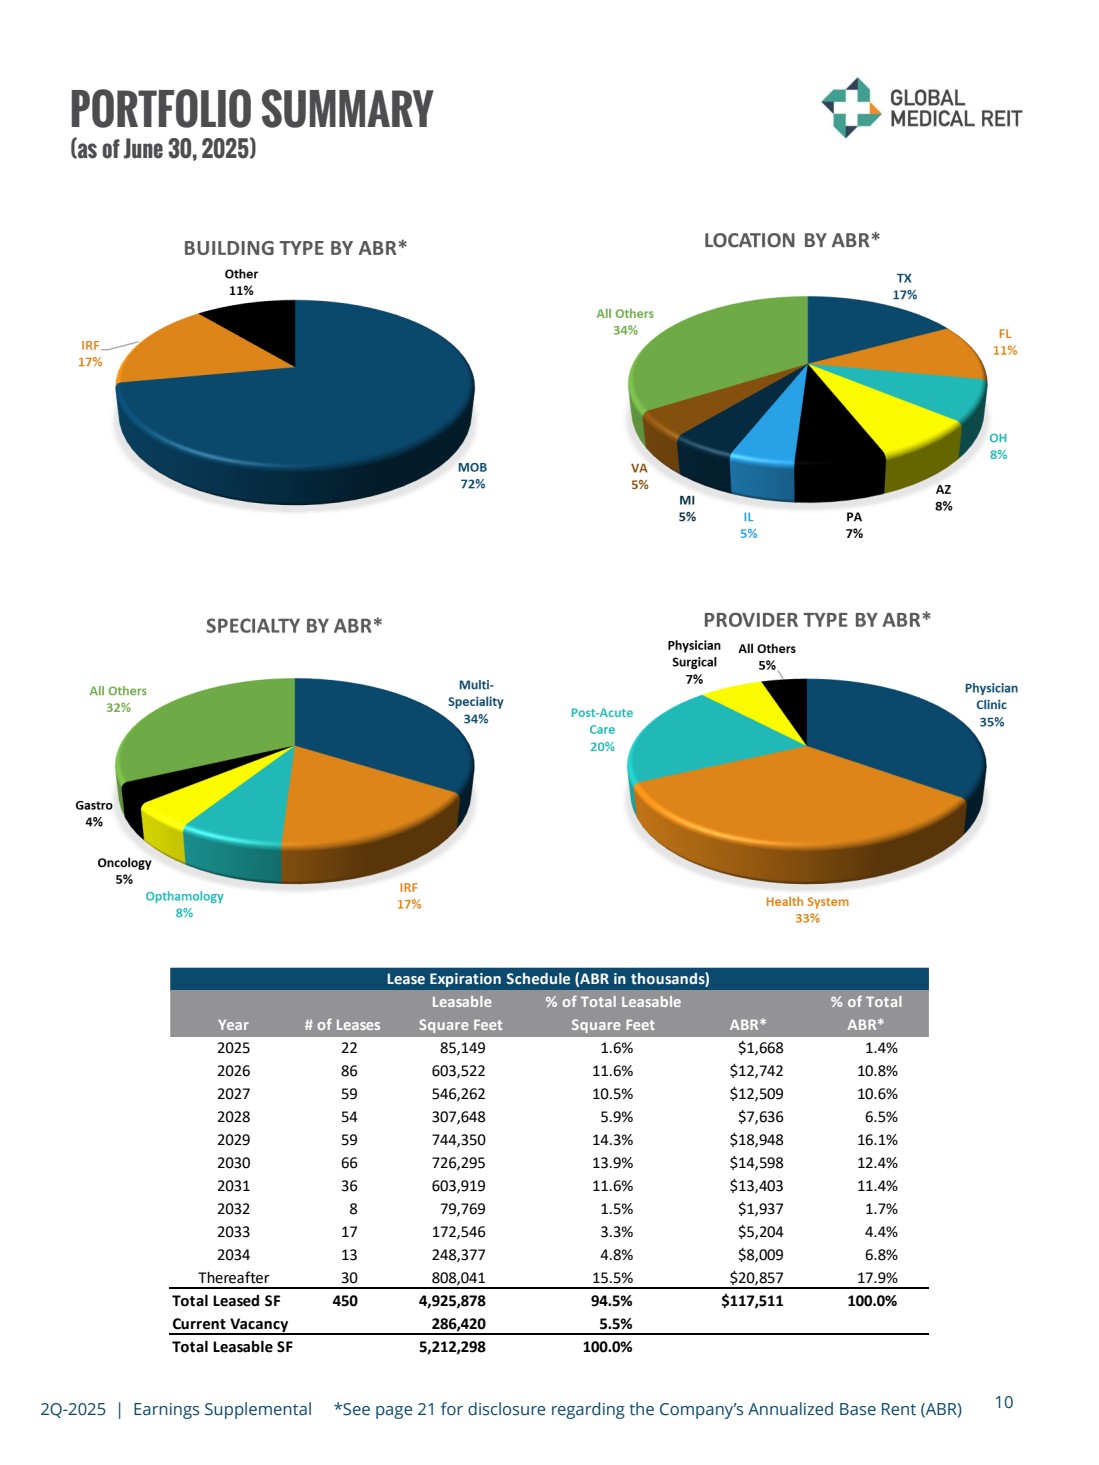
| 10 PORTFOLIO SUMMARY (as of June 30, 2025) 2Q-2025 | Earnings Supplemental *See page 21 for disclosure regarding the Company’s Annualized Base Rent (ABR) Leasable % of Total Leasable % of Total Year # of Leases Square Feet Square Feet ABR* ABR* 2025 22 85,149 1.6% $1,668 1.4% 2026 86 603,522 11.6% $12,742 10.8% 2027 59 546,262 10.5% $12,509 10.6% 2028 54 307,648 5.9% $7,636 6.5% 2029 59 744,350 14.3% $18,948 16.1% 2030 66 726,295 13.9% $14,598 12.4% 2031 36 603,919 11.6% $13,403 11.4% 2032 8 79,769 1.5% $1,937 1.7% 2033 17 172,546 3.3% $5,204 4.4% 2034 13 248,377 4.8% $8,009 6.8% Thereafter 30 808,041 15.5% $20,857 17.9% Total Leased SF 450 4,925,878 94.5% $117,511 100.0% Current Vacancy 286,420 5.5% Total Leasable SF 5,212,298 100.0% Lease Expiration Schedule (ABR in thousands) |
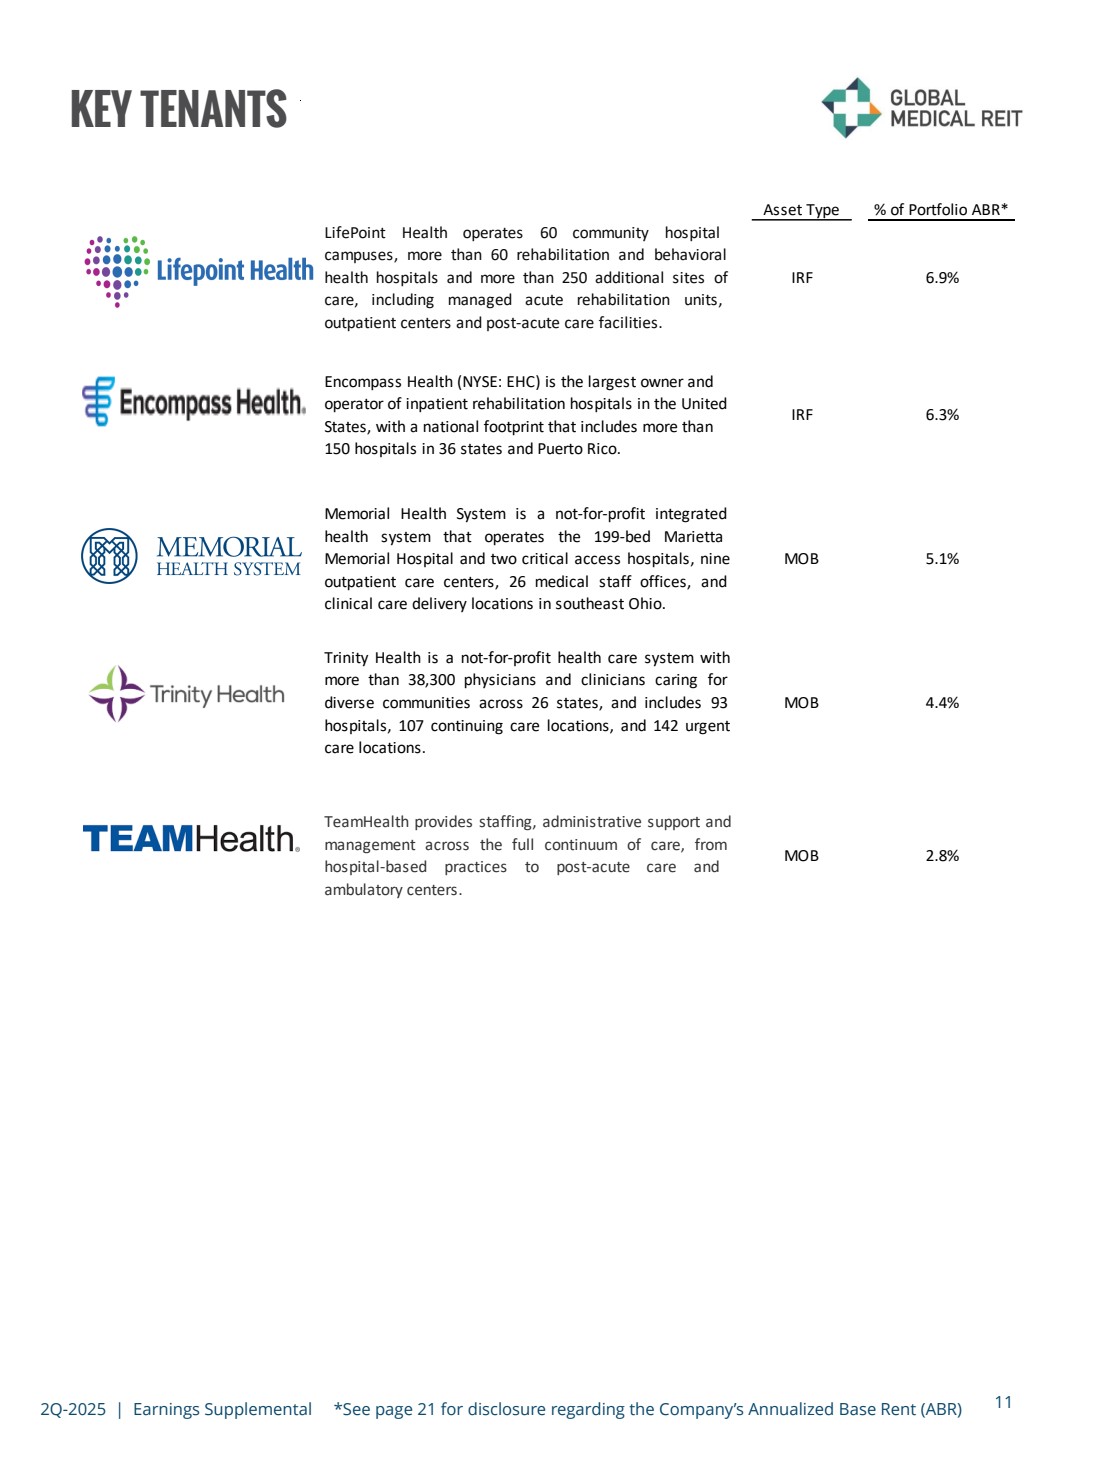
| 11 KEY TENANTS 2Q-2025 | Earnings Supplemental *See page 21 for disclosure regarding the Company’s Annualized Base Rent (ABR) Asset Type % of Portfolio ABR* LifePoint Health operates 60 community hospital campuses, more than 60 rehabilitation and behavioral health hospitals and more than 250 additional sites of care, including managed acute rehabilitation units, outpatient centers and post-acute care facilities. IRF 6.9% Encompass Health (NYSE: EHC) is the largest owner and operator of inpatient rehabilitation hospitals in the United States, with a national footprint that includes more than 150 hospitals in 36 states and Puerto Rico. IRF 6.3% Memorial Health System i s a not-for-profit integrated health system that operates the 199-bed Marietta Memorial Hospital and two critical access hospitals, nine outpatient care centers, 26 medical staff offices, and clinical care delivery locations in southeast Ohio. MOB 5.1% Trinity Health i s a not-for-profit health care system with more than 38,300 physicians and clinicians caring for diverse communities across 26 states, and includes 93 hospitals, 107 continuing care locations, and 142 urgent care locations. MOB 4.4% TeamHealth provides staffing, administrative support and management across the full continuum of care, from hospital-based practices to post-acute care and ambulatory centers. MOB 2.8% |
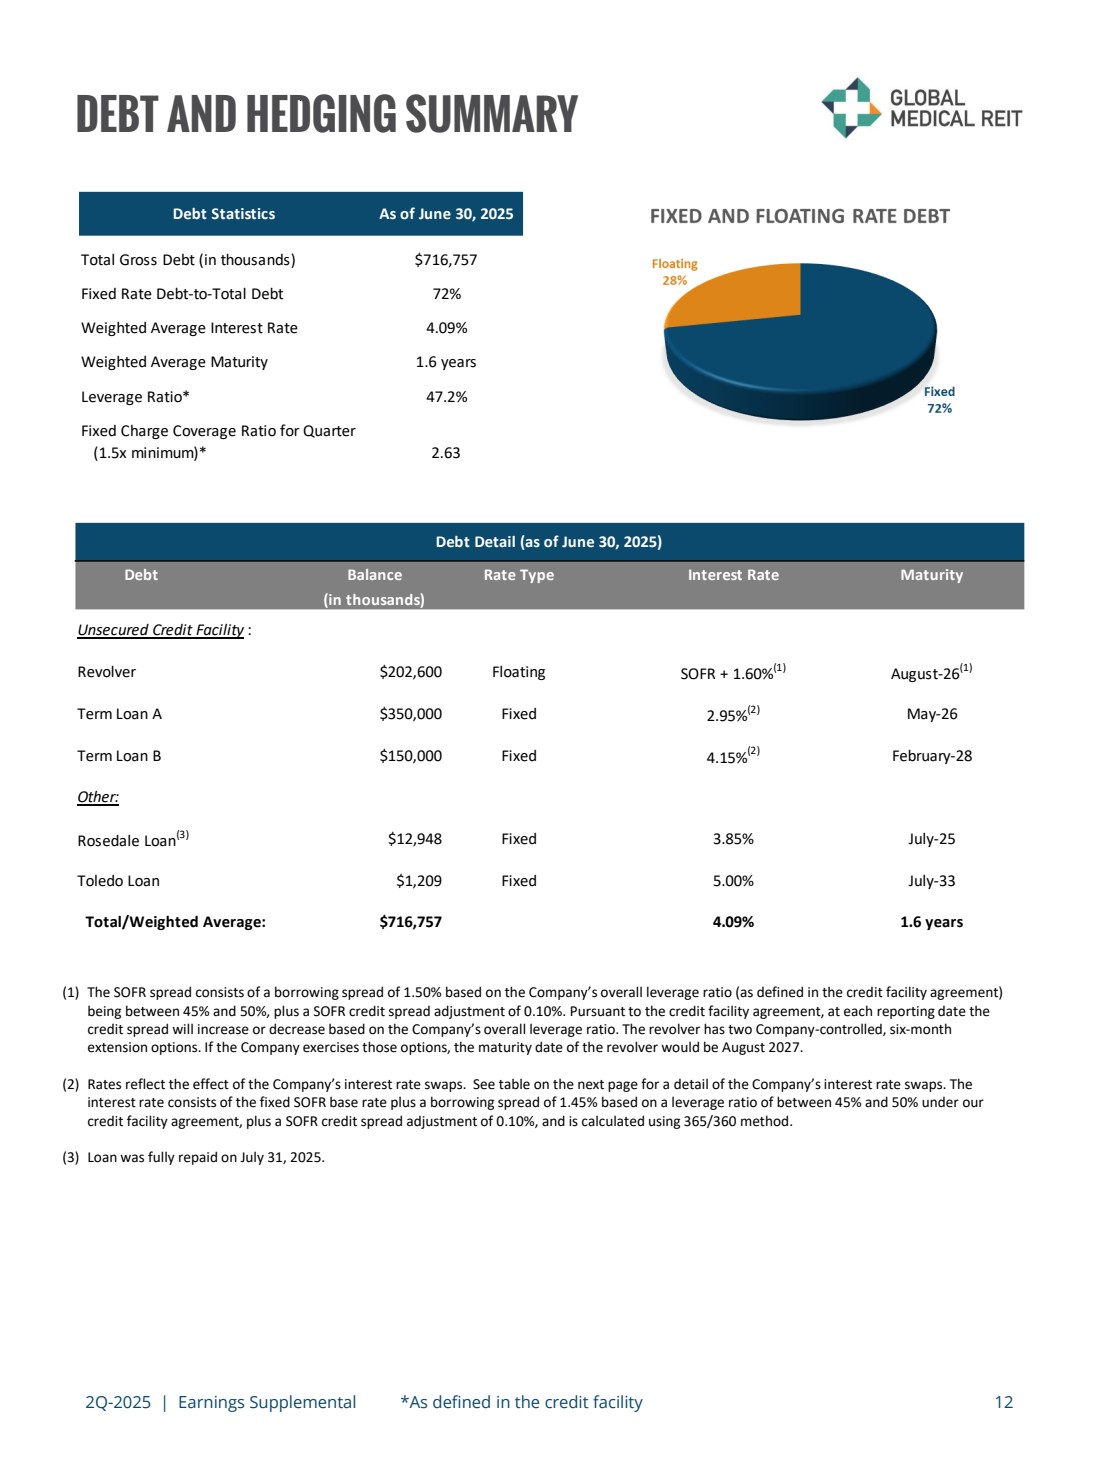
| 2Q-2025 | Earnings Supplemental *As defined in the credit facility 12 DEBT AND HEDGING SUMMARY (1) The SOFR spread consists of a borrowing spread of 1.50% based on the Company’s overall leverage ratio (as defined in the credit facility agreement) being between 45% and 50%, plus a SOFR credit spread adjustment of 0.10%. Pursuant to the credit facility agreement, at each reporting date the credit spread will increase or decrease based on the Company’s overall leverage ratio. The revolver has two Company-controlled, six-month extension options. If the Company exercises those options, the maturity date of the revolver would be August 2027. (2) Rates reflect the effect of the Company’s interest rate swaps. See table on the next page for a detail of the Company’s interest rate swaps. The interest rate consists of the fixed SOFR base rate plus a borrowing spread of 1.45% based on a leverage ratio of between 45% and 50% under our credit facility agreement, plus a SOFR credit spread adjustment of 0.10%, and is calculated using 365/360 method. (3) Loan was fully repaid on July 31, 2025. Debt Balance Rate Type Interest Rate Maturity (in thousands) Unsecured Credit Facility : Revolver $202,600 Floating SOFR + 1.60%(1) August-26(1) Term Loan A $350,000 Fixed 2.95%(2) May-26 Term Loan B $150,000 Fixed 4.15%(2) February-28 Other: Rosedale Loan(3) $12,948 Fixed 3.85% July-25 Toledo Loan $1,209 Fixed 5.00% July-33 Total/Weighted Average: $716,757 4.09% 1.6 years Debt Detail (as of June 30, 2025) Debt Statistics As of June 30, 2025 Total Gross Debt (in thousands) $716,757 Fixed Rate Debt-to-Total Debt 72% Weighted Average Interest Rate 4.09% Weighted Average Maturity 1.6 years Leverage Ratio* 47.2% Fixed Charge Coverage Ratio for Quarter (1.5x minimum)* 2.63 |
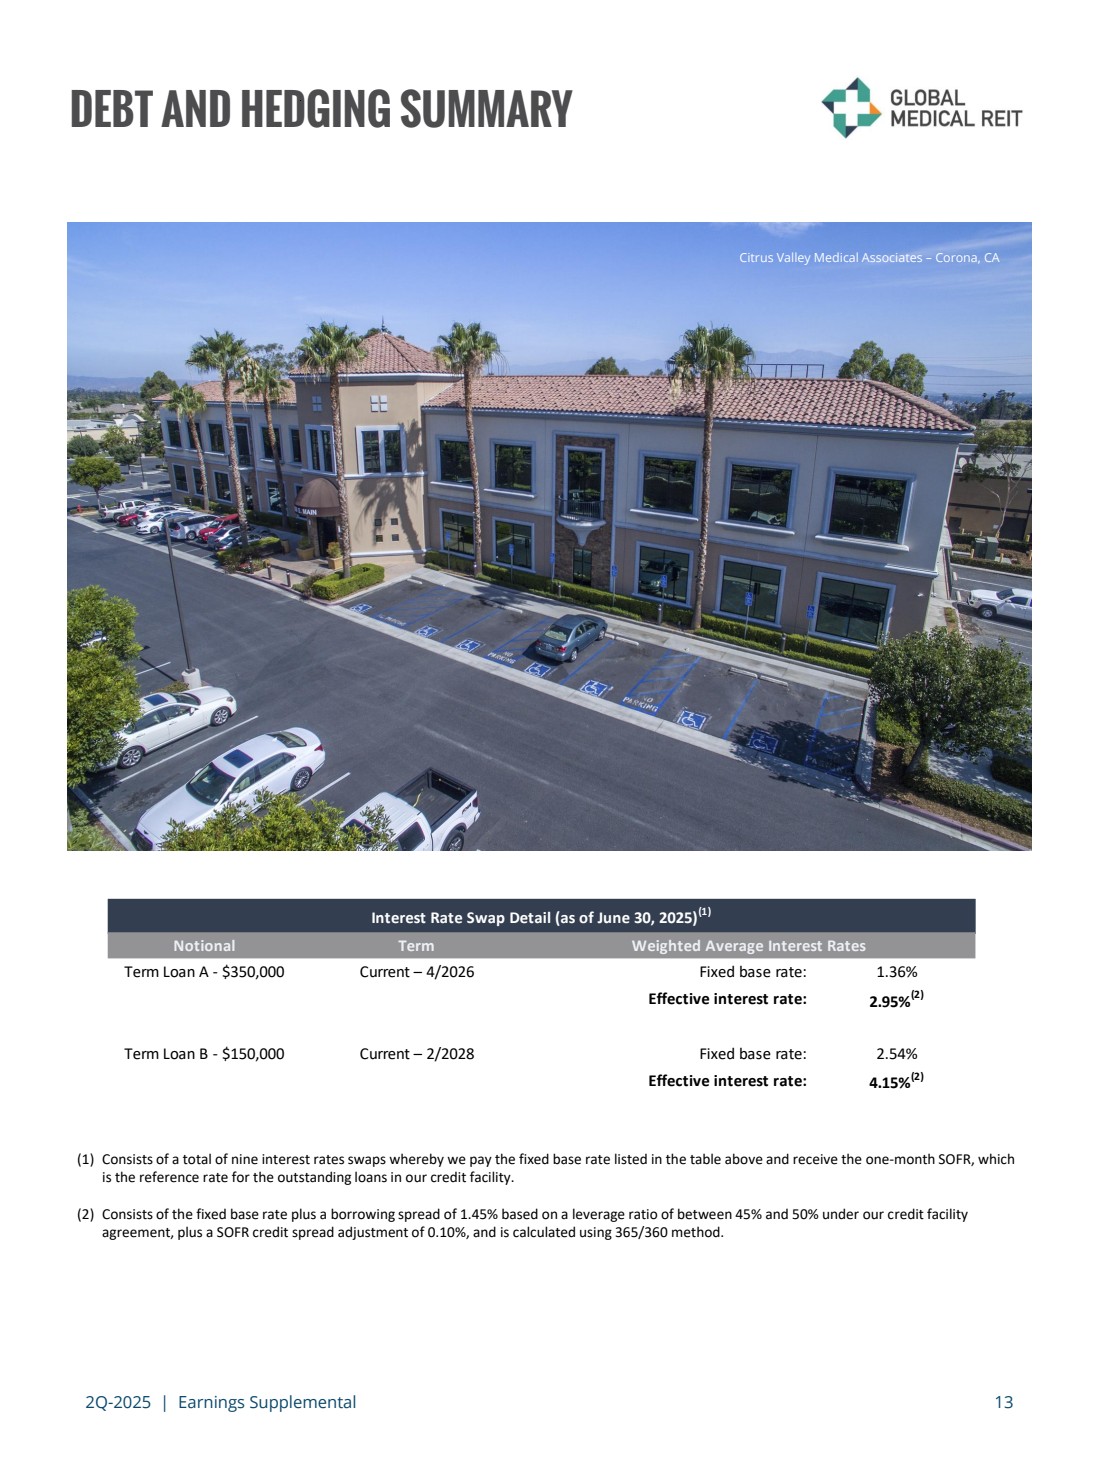
| 2Q-2025 | Earnings Supplemental 13 DEBT AND HEDGING SUMMARY (1) Consists of a total of nine interest rates swaps whereby we pay the fixed base rate listed in the table above and receive the one-month SOFR, which is the reference rate for the outstanding loans in our credit facility. (2) Consists of the fixed base rate plus a borrowing spread of 1.45% based on a leverage ratio of between 45% and 50% under our credit facility agreement, plus a SOFR credit spread adjustment of 0.10%, and is calculated using 365/360 method. Citrus Valley Medical Associates – Corona, CA Notional Term Term Loan A - $350,000 Current – 4/2026 Fixed base rate: 1.36% Effective interest rate: 2.95%(2) Term Loan B - $150,000 Current – 2/2028 Fixed base rate: 2.54% Effective interest rate: 4.15%(2) Interest Rate Swap Detail (as of June 30, 2025)(1) Weighted Average Interest Rates |
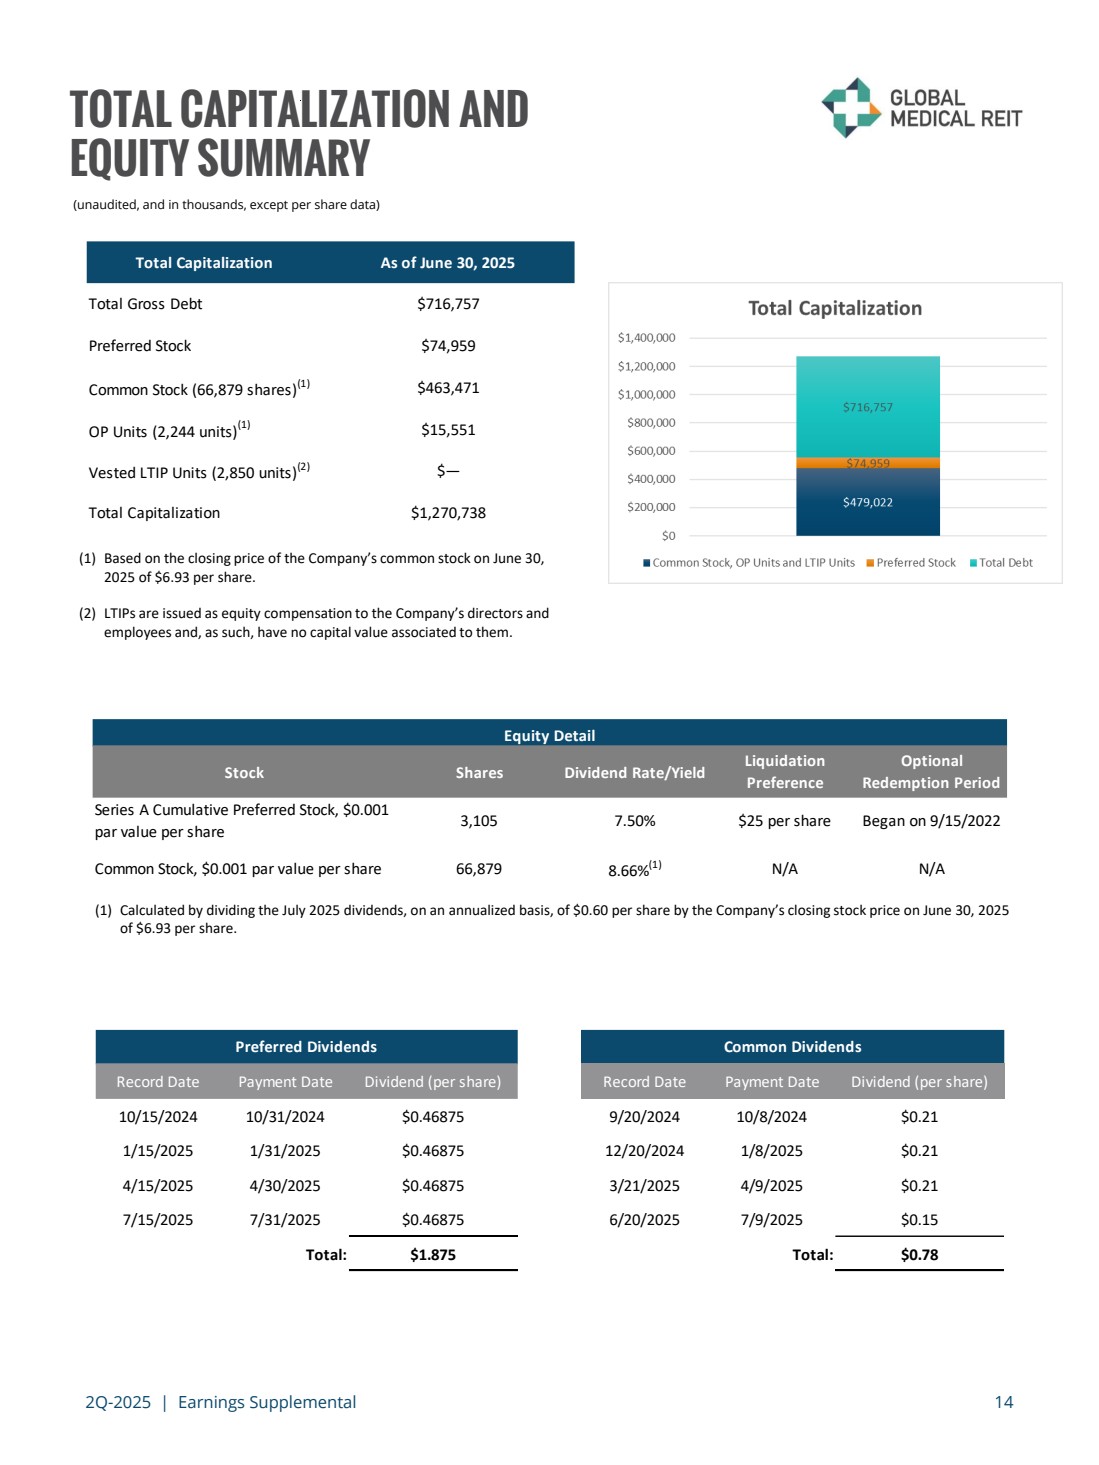
| 2Q-2025 | Earnings Supplemental 14 TOTAL CAPITALIZATION AND EQUITY SUMMARY (unaudited, and in thousands, except per share data) (1) Based on the closing price of the Company’s common stock on June 30, 2025 of $6.93 per share. (2) LTIPs are issued as equity compensation to the Company’s directors and employees and, as such, have no capital value associated to them. (1) Calculated by dividing the July 2025 dividends, on an annualized basis, of $0.60 per share by the Company’s closing stock price on June 30, 2025 of $6.93 per share. Total Capitalization As of June 30, 2025 Total Gross Debt $716,757 Preferred Stock $74,959 Common Stock (66,879 shares)(1) $463,471 OP Units (2,244 units)(1) $15,551 Vested LTIP Units (2,850 units) (2) $— Total Capitalization $1,270,738 Stock Shares Dividend Rate/Yield Liquidation Preference Optional Redemption Period Series A Cumulative Preferred Stock, $0.001 par value per share 3,105 7.50% $25 per share Began on 9/15/2022 Common Stock, $0.001 par value per share 66,879 8.66%(1) N/A N/A Equity Detail Record Date Payment Date Dividend (per share) Record Date Payment Date Dividend (per share) 10/15/2024 10/31/2024 $0.46875 9/20/2024 10/8/2024 $0.21 1/15/2025 1/31/2025 $0.46875 12/20/2024 1/8/2025 $0.21 4/15/2025 4/30/2025 $0.46875 3/21/2025 4/9/2025 $0.21 7/15/2025 7/31/2025 $0.46875 6/20/2025 7/9/2025 $0.15 Total: $1.875 Total: $0.78 Preferred Dividends Common Dividends |
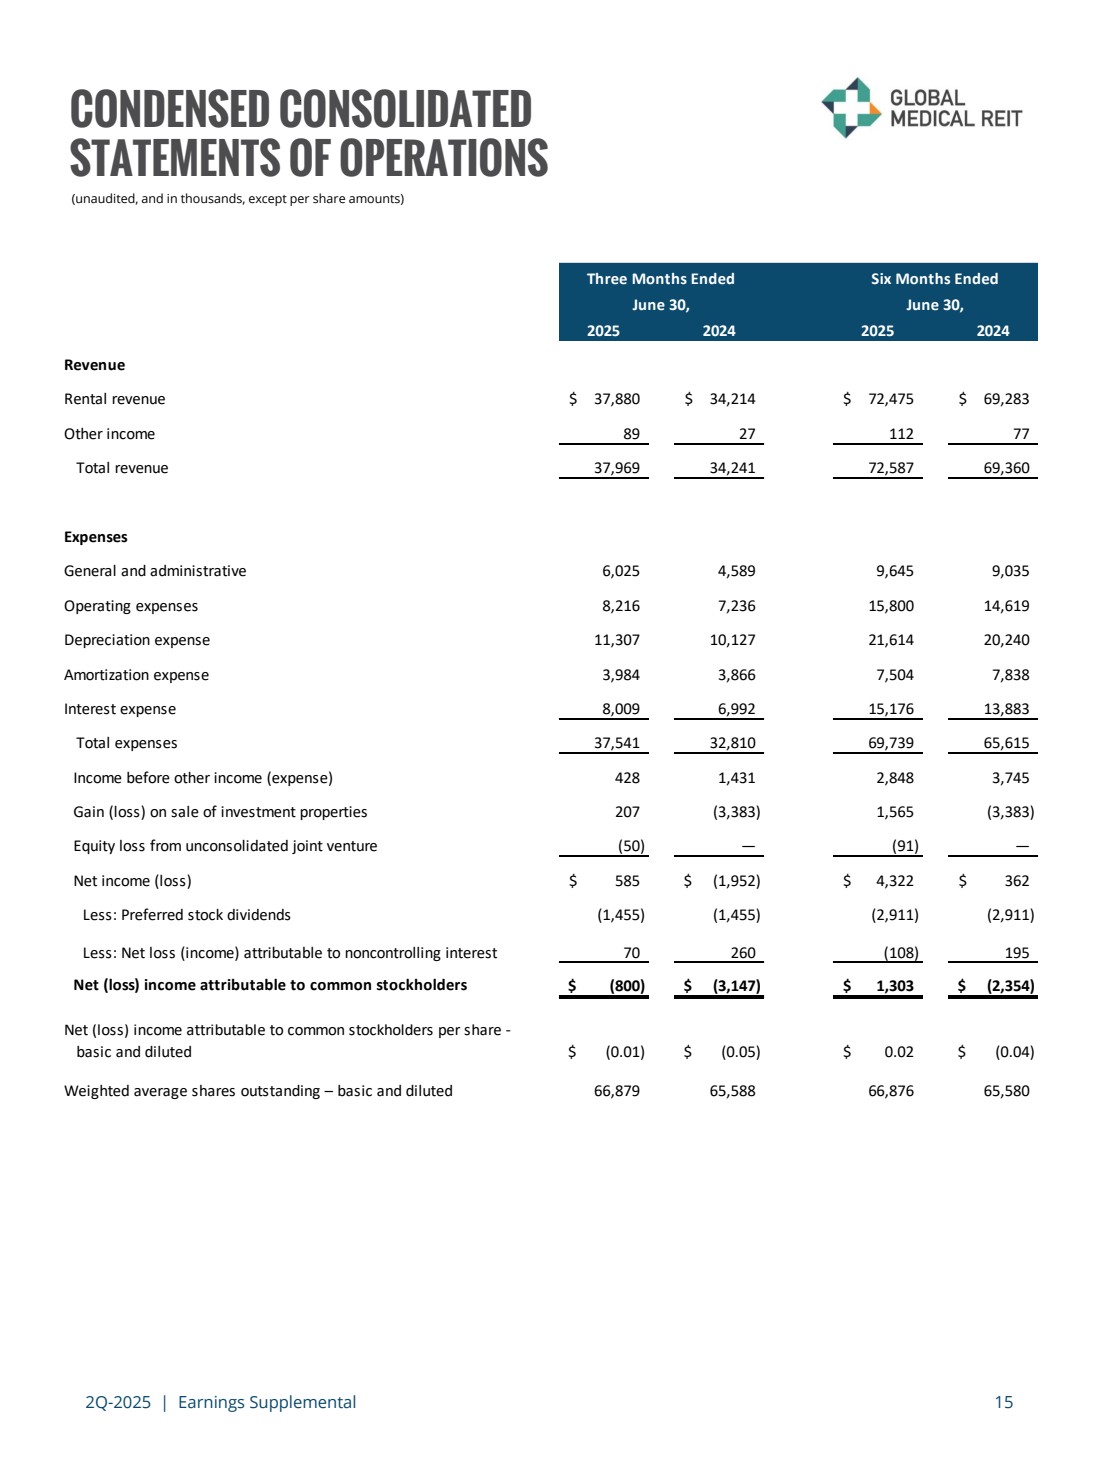
| 2Q-2025 | Earnings Supplemental 15 CONDENSED CONSOLIDATED STATEMENTS OF OPERATIONS (unaudited, and in thousands, except per share amounts) 2025 2024 2025 2024 Revenue Rental revenue $ 37,880 $ 34,214 $ 72,475 $ 69,283 Other income 89 27 112 77 Total revenue 37,969 34,241 72,587 69,360 Expenses General and administrative 6,025 4,589 9,645 9,035 Operating expenses 8,216 7,236 15,800 14,619 Depreciation expense 11,307 10,127 21,614 20,240 Amortization expense 3,984 3,866 7,504 7,838 Interest expense 8,009 6,992 15,176 13,883 Total expenses 37,541 32,810 69,739 65,615 Income before other income (expense) 428 1,431 2,848 3,745 Gain (loss) on sale of investment properties 207 (3,383) 1,565 (3,383) Equity loss from unconsolidated joint venture (50) — (91) — Net income (loss) $ 585 $ (1,952) $ 4,322 $ 362 Less: Preferred stock dividends (1,455) (1,455) (2,911) (2,911) Less: Net loss (income) attributable to noncontrolling interest 70 260 (108) 195 Net (loss) income attributable to common stockholders $ (800) $ (3,147) $ 1,303 $ (2,354) Net (loss) income attributable to common stockholders per share - basic and diluted $ (0.01) $ (0.05) $ 0.02 $ (0.04) Weighted average shares outstanding – basic and diluted 66,879 65,588 66,876 65,580 Three Months Ended Six Months Ended June 30, June 30, |
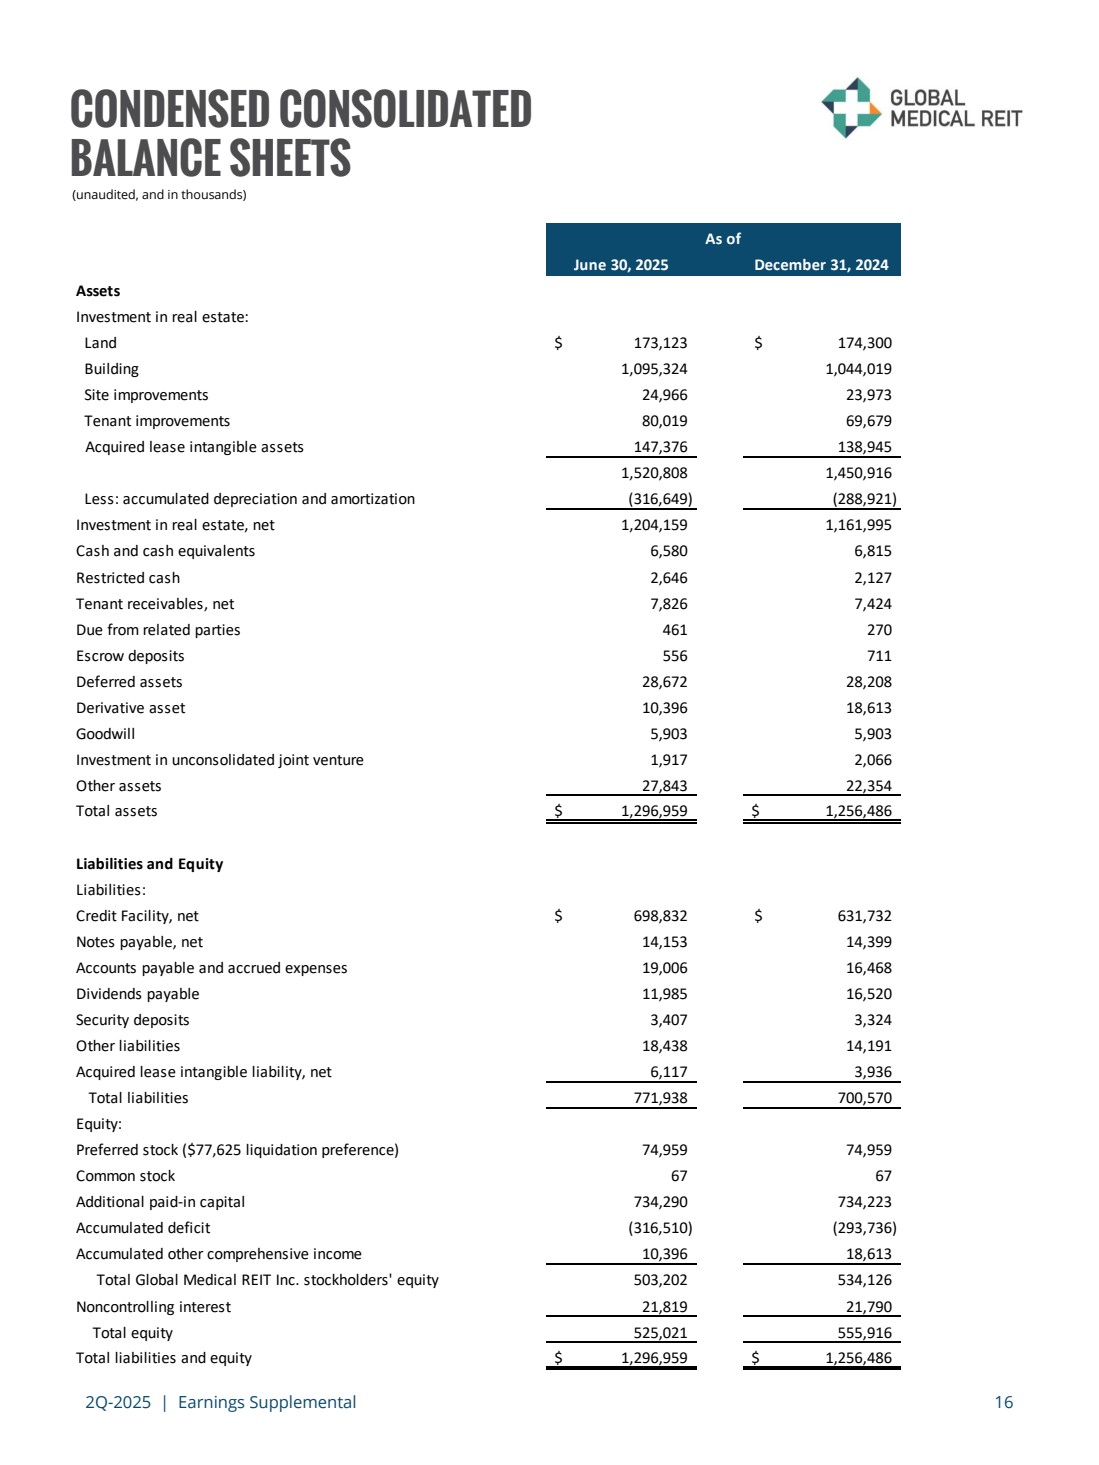
| 2Q-2025 | Earnings Supplemental 16 CONDENSED CONSOLIDATED BALANCE SHEETS (unaudited, and in thousands) June 30, 2025 December 31, 2024 Assets Investment in real estate: Land $ 173,123 $ 174,300 Building 1,095,324 1,044,019 Site improvements 24,966 23,973 Tenant improvements 80,019 69,679 Acquired lease intangible assets 147,376 138,945 1,520,808 1,450,916 Less: accumulated depreciation and amortization (316,649) (288,921) Investment in real estate, net 1,204,159 1,161,995 Cash and cash equivalents 6,580 6,815 Restricted cash 2,646 2,127 Tenant receivables, net 7,826 7,424 Due from related parties 461 270 Escrow deposits 556 711 Deferred assets 28,672 28,208 Derivative asset 10,396 18,613 Goodwill 5,903 5,903 Investment in unconsolidated joint venture 1,917 2,066 Other assets 27,843 22,354 Total assets $ 1,296,959 $ 1,256,486 Liabilities and Equity Liabilities: Credit Facility, net $ 698,832 $ 631,732 Notes payable, net 14,153 14,399 Accounts payable and accrued expenses 19,006 16,468 Dividends payable 11,985 16,520 Security deposits 3,407 3,324 Other liabilities 18,438 14,191 Acquired lease intangible liability, net 6,117 3,936 Total liabilities 771,938 700,570 Equity: Preferred stock ($77,625 liquidation preference) 74,959 74,959 Common stock 67 67 Additional paid-in capital 734,290 734,223 Accumulated deficit (316,510) (293,736) Accumulated other comprehensive income 10,396 18,613 Total Global Medical REIT Inc. stockholders' equity 503,202 534,126 Noncontrolling interest 21,819 21,790 Total equity 525,021 555,916 Total liabilities and equity $ 1,296,959 $ 1,256,486 As of |
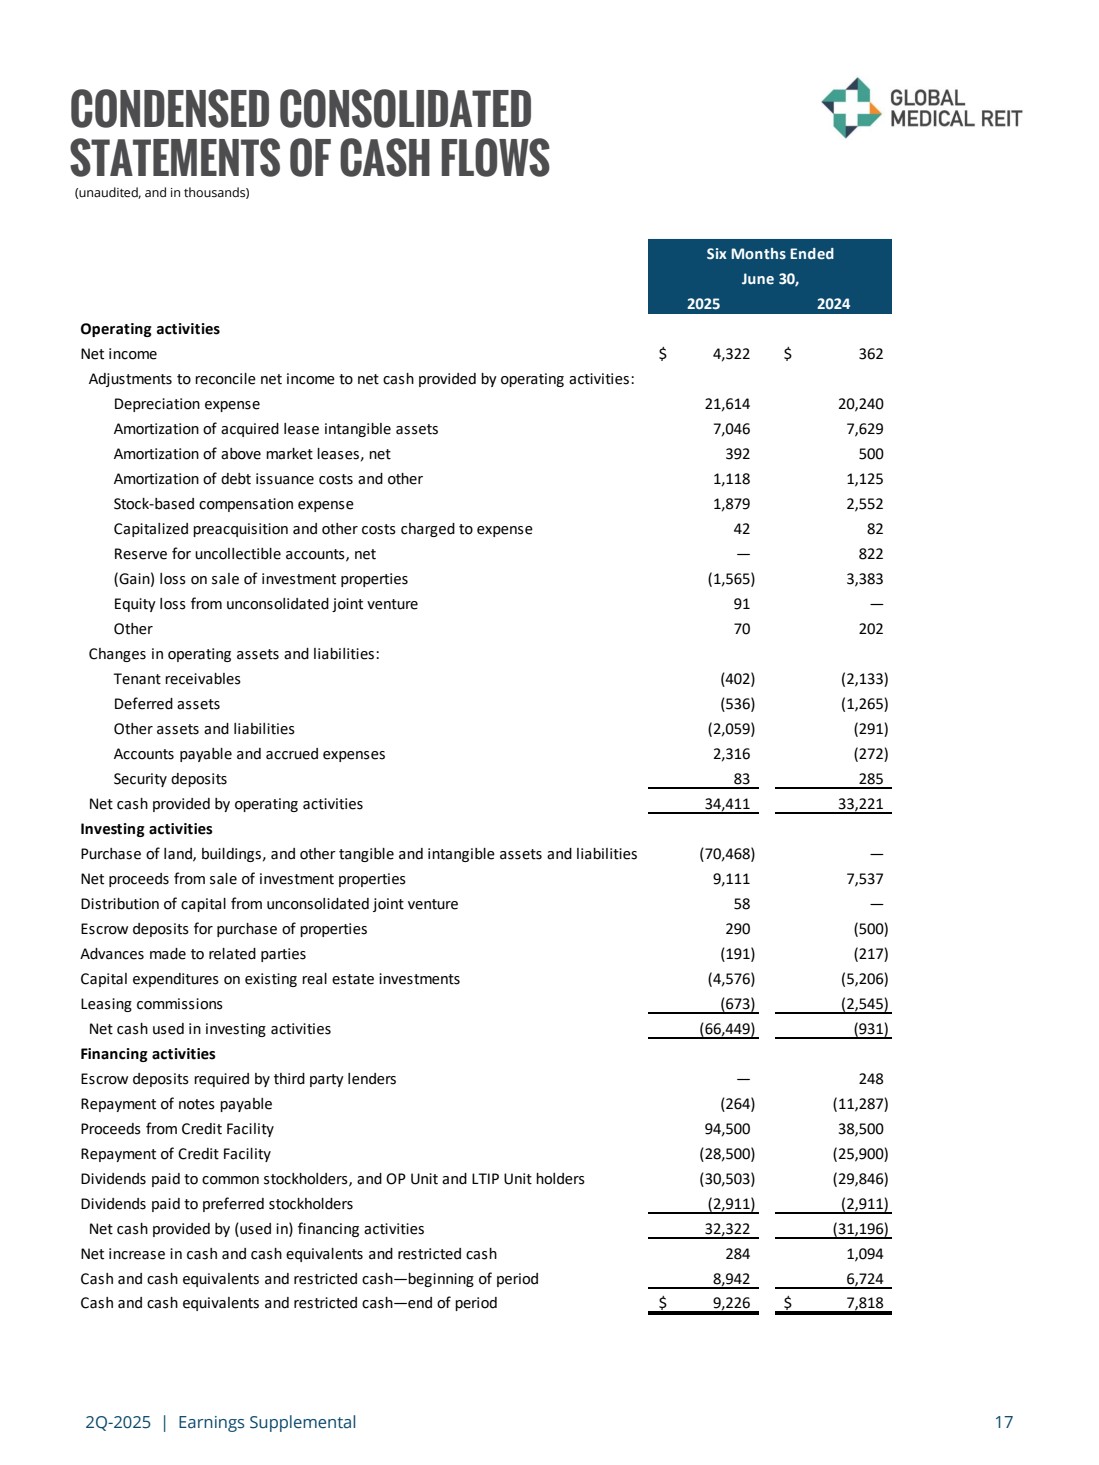
| 2Q-2025 | Earnings Supplemental 17 CONDENSED CONSOLIDATED STATEMENTS OF CASH FLOWS (unaudited, and in thousands) 2025 2024 Operating activities Net income $ 4,322 $ 362 Adjustments to reconcile net income to net cash provided by operating activities: Depreciation expense 21,614 20,240 Amortization of acquired lease intangible assets 7,046 7,629 Amortization of above market leases, net 392 500 Amortization of debt issuance costs and other 1,118 1,125 Stock-based compensation expense 1,879 2,552 Capitalized preacquisition and other costs charged to expense 42 82 Reserve for uncollectible accounts, net — 822 (Gain) loss on sale of investment properties (1,565) 3,383 Equity loss from unconsolidated joint venture 91 — Other 70 202 Changes in operating assets and liabilities: Tenant receivables (402) (2,133) Deferred assets (536) (1,265) Other assets and liabilities (2,059) (291) Accounts payable and accrued expenses 2,316 (272) Security deposits 83 285 Net cash provided by operating activities 34,411 33,221 Investing activities Purchase of land, buildings, and other tangible and intangible assets and liabilities (70,468) — Net proceeds from sale of investment properties 9,111 7,537 Distribution of capital from unconsolidated joint venture 58 — Escrow deposits for purchase of properties 290 (500) Advances made to related parties (191) (217) Capital expenditures on existing real estate investments (4,576) (5,206) Leasing commissions (673) (2,545) Net cash used in investing activities (66,449) (931) Financing activities Escrow deposits required by third party lenders — 248 Repayment of notes payable (264) (11,287) Proceeds from Credit Facility 94,500 38,500 Repayment of Credit Facility (28,500) (25,900) Dividends paid to common stockholders, and OP Unit and LTIP Unit holders (30,503) (29,846) Dividends paid to preferred stockholders (2,911) (2,911) Net cash provided by (used in) financing activities 32,322 (31,196) Net increase in cash and cash equivalents and restricted cash 284 1,094 Cash and cash equivalents and restricted cash—beginning of period 8,942 6,724 Cash and cash equivalents and restricted cash—end of period $ 9,226 $ 7,818 Six Months Ended June 30, |
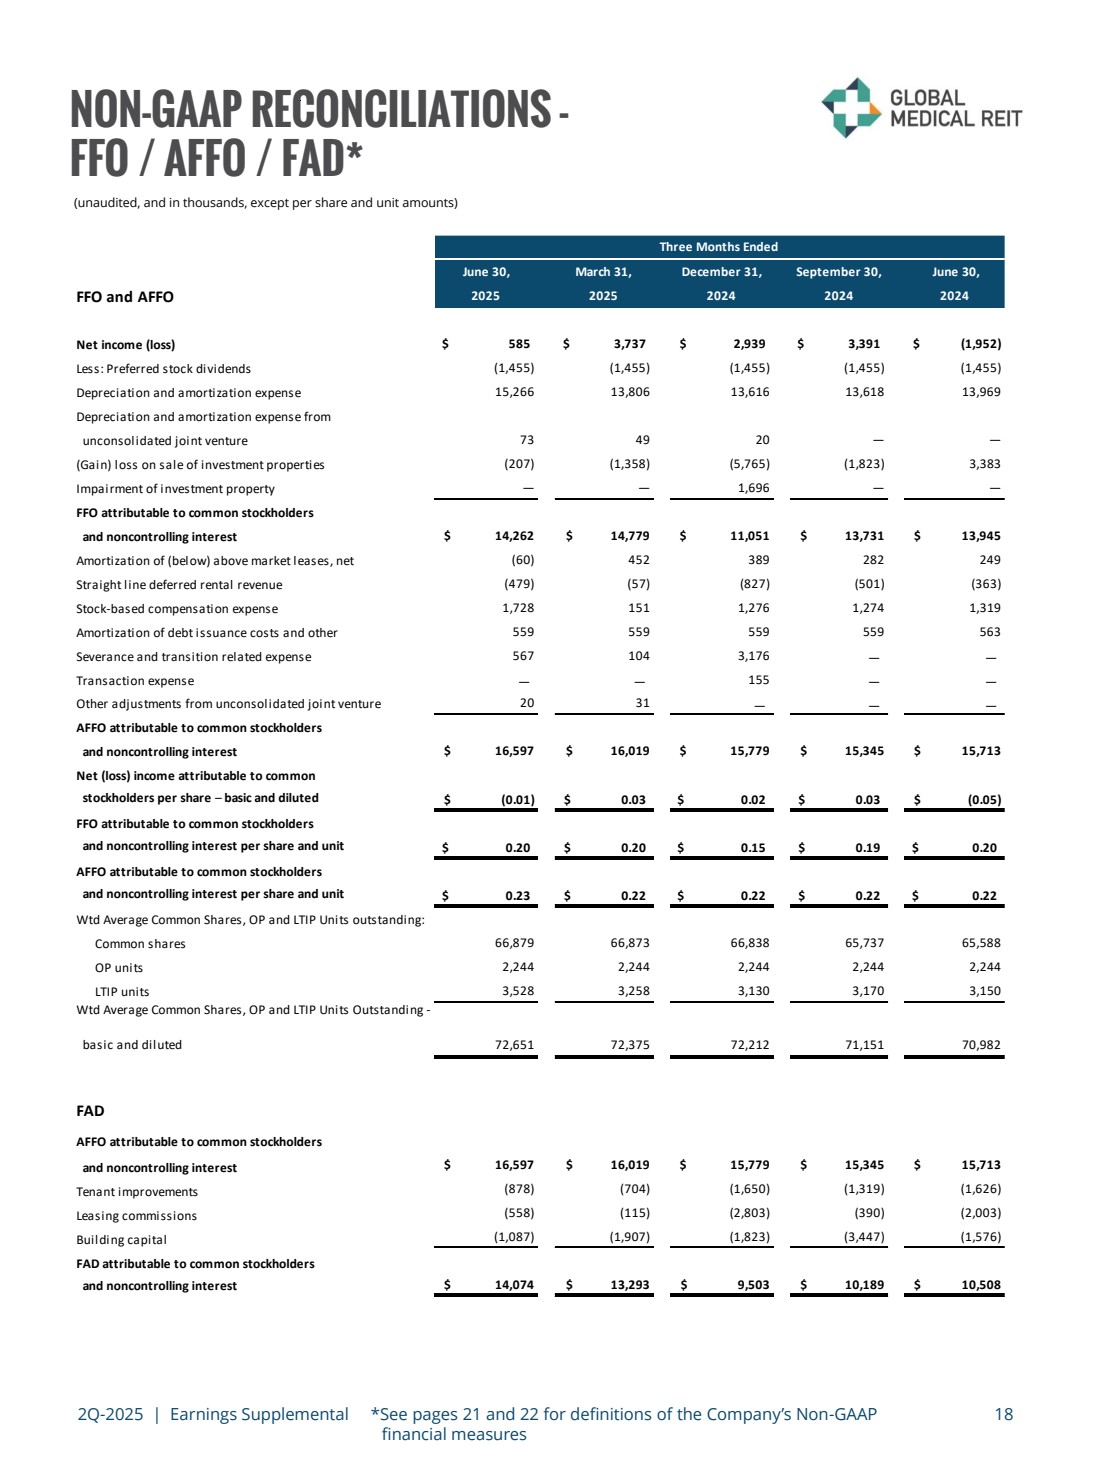
| NON-GAAP RECONCILIATIONS - FFO / AFFO / FAD* 18 (unaudited, and in thousands, except per share and unit amounts) 2Q-2025 | Earnings Supplemental *See pages 21 and 22 for definitions of the Company’s Non-GAAP financial measures June 30, March 31, December 31, September 30, June 30, 2025 2025 2024 2024 2024 Net income (loss) $ 585 $ 3,737 $ 2,939 $ 3,391 $ (1,952) Less: Preferred stock dividends (1,455) (1,455) (1,455) (1,455) (1,455) Depreciation and amortization expense 15,266 13,806 13,616 13,618 13,969 Depreciation and amortization expense from unconsolidated joint venture 73 49 20 — — (Gain) loss on sale of investment properties (207) (1,358) (5,765) (1,823) 3,383 Impairment of investment property — — 1,696 — — FFO attributable to common stockholders and noncontrolling interest $ 14,262 $ 14,779 $ 11,051 $ 13,731 $ 13,945 Amortization of (below) above market leases, net (60) 452 389 282 249 Straight line deferred rental revenue (479) (57) (827) (501) (363) Stock-based compensation expense 1,728 151 1,276 1,274 1,319 Amortization of debt issuance costs and other 559 559 559 559 563 Severance and transition related expense 567 104 3,176 — — Transaction expense — — 155 — — Other adjustments from unconsolidated joint venture 20 31 — — — AFFO attributable to common stockholders and noncontrolling interest $ 16,597 $ 16,019 $ 15,779 $ 15,345 $ 15,713 Net (loss) income attributable to common stockholders per share – basic and diluted $ (0.01) $ 0.03 $ 0.02 $ 0.03 $ (0.05) FFO attributable to common stockholders and noncontrolling interest per share and unit $ 0.20 $ 0.20 $ 0.15 $ 0.19 $ 0.20 AFFO attributable to common stockholders and noncontrolling interest per share and unit $ 0.23 $ 0.22 $ 0.22 $ 0.22 $ 0.22 Wtd Average Common Shares, OP and LTIP Units outstanding: Common shares 66,879 66,873 66,838 65,737 65,588 OP units 2,244 2,244 2,244 2,244 2,244 LTIP units 3,528 3,258 3,130 3,170 3,150 Wtd Average Common Shares, OP and LTIP Units Outstanding - basic and diluted 72,651 72,375 72,212 71,151 70,982 FAD AFFO attributable to common stockholders and noncontrolling interest $ 16,597 $ 16,019 $ 15,779 $ 15,345 $ 15,713 Tenant improvements (878) (704) (1,650) (1,319) (1,626) Leasing commissions (558) (115) (2,803) (390) (2,003) Building capital (1,087) (1,907) (1,823) (3,447) (1,576) FAD attributable to common stockholders and noncontrolling interest $ 14,074 $ 13,293 $ 9,503 $ 10,189 $ 10,508 Three Months Ended FFO and AFFO |
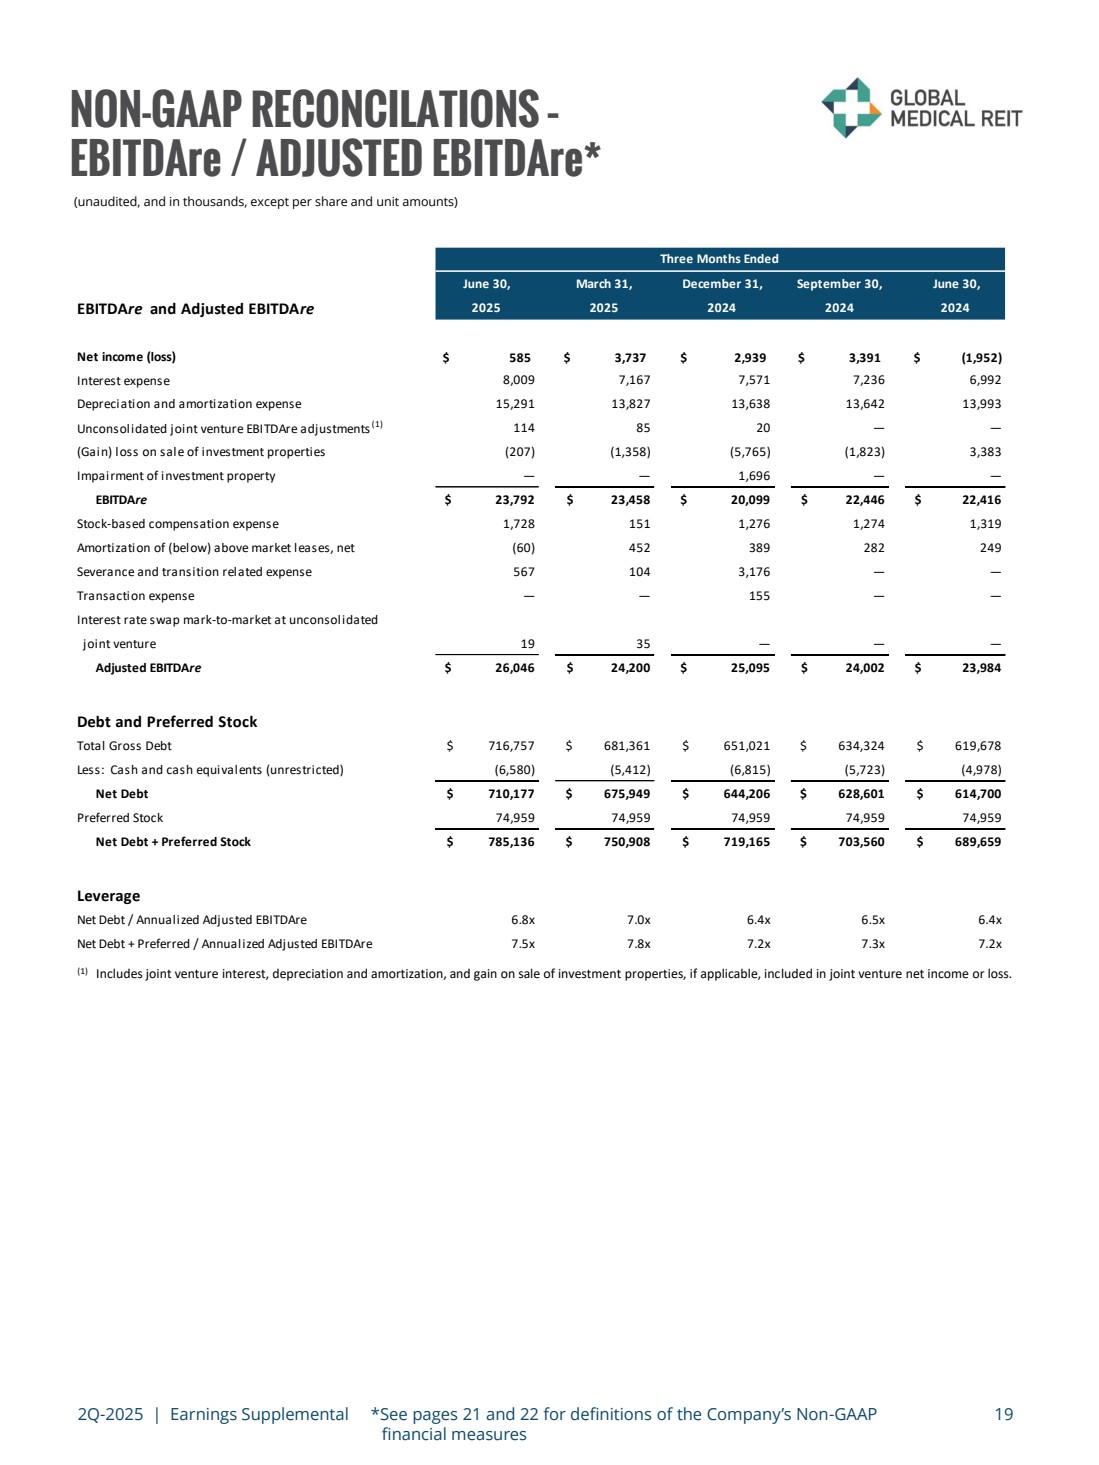
| 19 NON-GAAP RECONCILATIONS – EBITDAre / ADJUSTED EBITDAre* (unaudited, and in thousands, except per share and unit amounts) (1) Includes joint venture interest, depreciation and amortization, and gain on sale of investment properties, if applicable, included in joint venture net income or loss. 2Q-2025 | Earnings Supplemental *See pages 21 and 22 for definitions of the Company’s Non-GAAP financial measures June 30, March 31, December 31, September 30, June 30, EBITDAr e and Adjusted EBITDAr e 2025 2025 2024 2024 2024 Net income (loss) $ 585 $ 3,737 $ 2,939 $ 3,391 $ (1,952) Interest expense 8,009 7,167 7,571 7,236 6,992 Depreciation and amortization expense 15,291 13,827 13,638 13,642 13,993 Unconsolidated joint venture EBITDAre adjustments(1) 114 85 20 — — (Gain) loss on sale of investment properties (207) (1,358) (5,765) (1,823) 3,383 Impairment of investment property — — 1,696 — — EBITDAr e $ 23,792 $ 23,458 $ 20,099 $ 22,446 $ 22,416 Stock-based compensation expense 1,728 151 1,276 1,274 1,319 Amortization of (below) above market leases, net (60) 452 389 282 249 Severance and transition related expense 567 104 3,176 — — Transaction expense — — 155 — — Interest rate swap mark-to-market at unconsolidated joint venture 19 35 — — — Adjusted EBITDAr e $ 26,046 $ 24,200 $ 25,095 $ 24,002 $ 23,984 Debt and Preferred Stock Total Gross Debt $ 716,757 $ 681,361 $ 651,021 $ 634,324 $ 619,678 Less: Cash and cash equivalents (unrestricted) (6,580) (5,412) (6,815) (5,723) (4,978) Net Debt $ 710,177 $ 675,949 $ 644,206 $ 628,601 $ 614,700 Preferred Stock 74,959 74,959 74,959 74,959 74,959 Net Debt + Preferred Stock $ 785,136 $ 750,908 $ 719,165 $ 703,560 $ 689,659 Leverage Net Debt / Annualized Adjusted EBITDAre 6.8x 7.0x 6.4x 6.5x 6.4x Net Debt + Preferred / Annualized Adjusted EBITDAre 7.5x 7.8x 7.2x 7.3x 7.2x Three Months Ended |
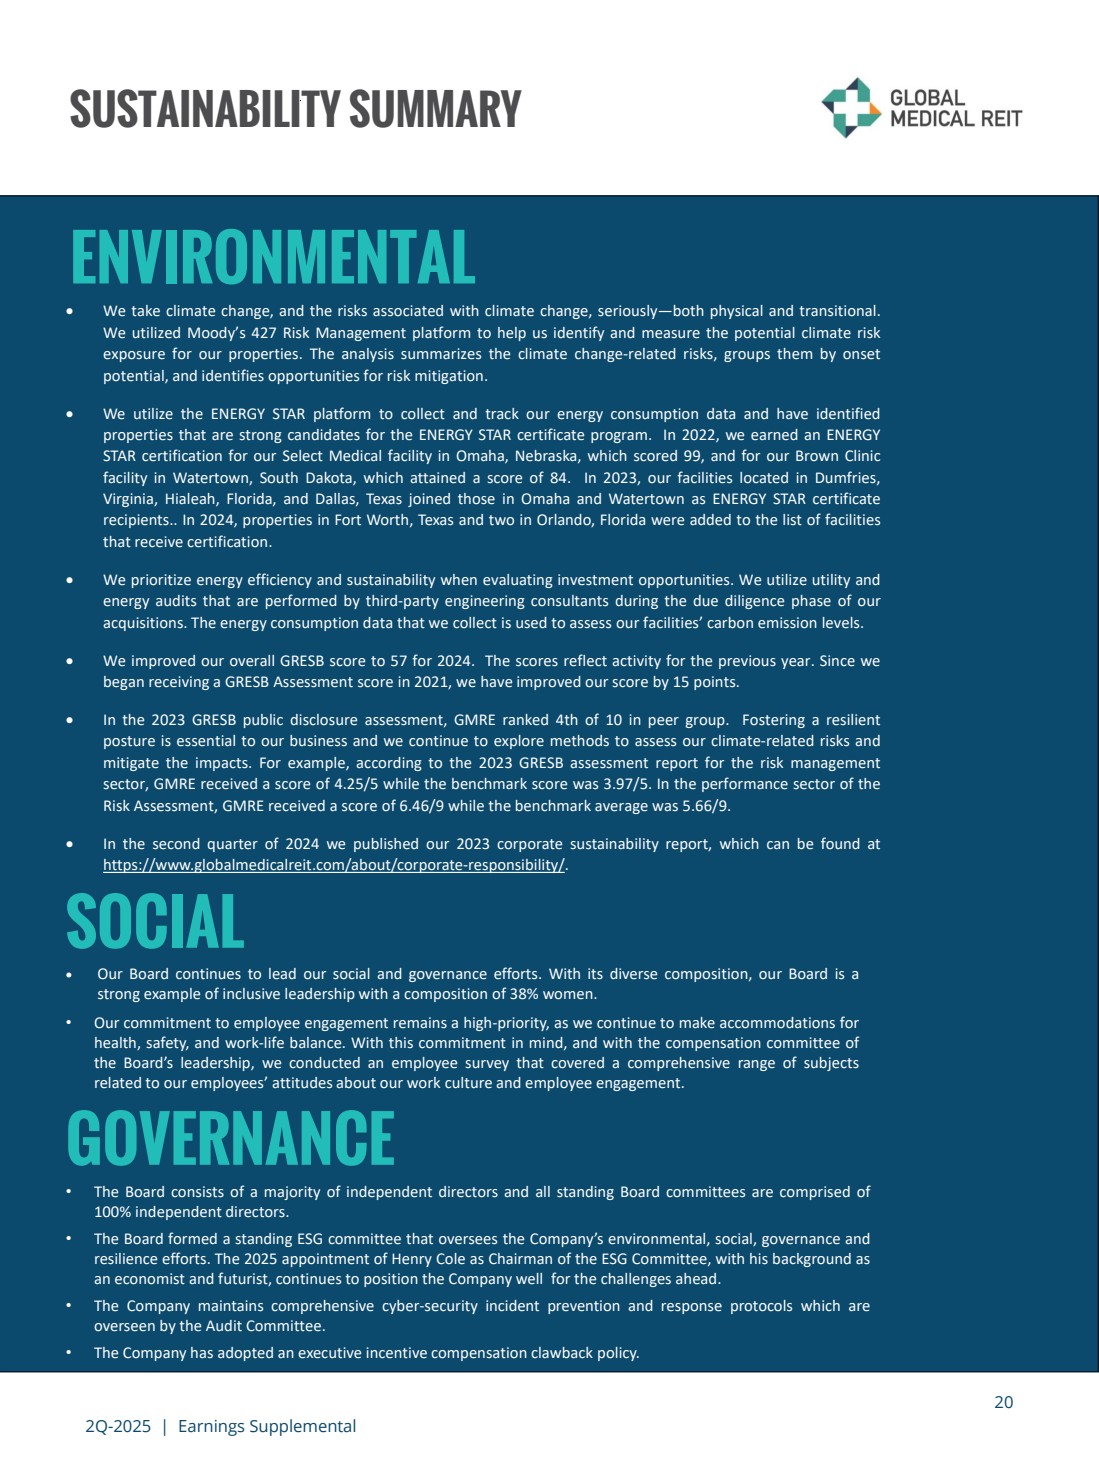
| 2Q-2025 | Earnings Supplemental 20 SUSTAINABILITY SUMMARY • We take climate change, and the risks associated with climate change, seriously—both physical and transitional. We utilized Moody’s 427 Risk Management platform to help us identify and measure the potential climate risk exposure for our properties. The analysis summarizes the climate change-related risks, groups them by onset potential, and identifies opportunities for risk mitigation. • We utilize the ENERGY STAR platform to collect and track our energy consumption data and have identified properties that are strong candidates for the ENERGY STAR certificate program. In 2022, we earned an ENERGY STAR certification for our Select Medical facility in Omaha, Nebraska, which scored 99, and for our Brown Clinic facility in Watertown, South Dakota, which attained a score of 84. In 2023, our facilities located in Dumfries, Virginia, Hialeah, Florida, and Dallas, Texas joined those in Omaha and Watertown as ENERGY STAR certificate recipients.. In 2024, properties in Fort Worth, Texas and two in Orlando, Florida were added to the list of facilities that receive certification. • We prioritize energy efficiency and sustainability when evaluating investment opportunities. We utilize utility and energy audits that are performed by third-party engineering consultants during the due diligence phase of our acquisitions. The energy consumption data that we collect is used to assess our facilities’ carbon emission levels. • We improved our overall GRESB score to 57 for 2024. The scores reflect activity for the previous year. Since we began receiving a GRESB Assessment score in 2021, we have improved our score by 15 points. • In the 2023 GRESB public disclosure assessment, GMRE ranked 4th of 10 in peer group. Fostering a resilient posture is essential to our business and we continue to explore methods to assess our climate-related risks and mitigate the impacts. For example, according to the 2023 GRESB assessment report for the risk management sector, GMRE received a score of 4.25/5 while the benchmark score was 3.97/5. In the performance sector of the Risk Assessment, GMRE received a score of 6.46/9 while the benchmark average was 5.66/9. • In the second quarter of 2024 we published our 2023 corporate sustainability report, which can be found at https://www.globalmedicalreit.com/about/corporate-responsibility/. ENVIRONMENTAL SOCIAL • Our Board continues to lead our social and governance efforts. With its diverse composition, our Board is a strong example of inclusive leadership with a composition of 38% women. • Our commitment to employee engagement remains a high-priority, as we continue to make accommodations for health, safety, and work-life balance. With this commitment in mind, and with the compensation committee of the Board’s leadership, we conducted an employee survey that covered a comprehensive range of subjects related to our employees’ attitudes about our work culture and employee engagement. GOVERNANCE • The Board consists of a majority of independent directors and all standing Board committees are comprised of 100% independent directors. • The Board formed a standing ESG committee that oversees the Company’s environmental, social, governance and resilience efforts. The 2025 appointment of Henry Cole as Chairman of the ESG Committee, with his background as an economist and futurist, continues to position the Company well for the challenges ahead. • The Company maintains comprehensive cyber-security incident prevention and response protocols which are overseen by the Audit Committee. • The Company has adopted an executive incentive compensation clawback policy. • GMRE is a member of the National Association of Corporate Directors. |
| 2Q-2025 | Earnings Supplemental 21 REPORTING DEFINITIONS AND OTHER DISCLOSURES Annualized Base Rent Annualized base rent represents monthly base rent for June 2025 (or, for recent acquisitions, monthly base rent for the month of acquisition), multiplied by 12 (or base rent net of annualized expenses for properties with gross leases). Accordingly, this methodology produces an annualized amount as of a point in time but does not take into account future (i) contractual rental rate increases, (ii) leasing activity or (iii) lease expirations. Additionally, leases that are accounted for on a cash-collected basis, or that are in a free rent period, are not included in annualized base rent. Capitalization Rate The capitalization rate (“Cap Rate”) for an acquisition is calculated by dividing current Annualized Base Rent by contractual purchase price. For the portfolio cap rate, certain adjustments, including for subsequent capital invested, are made to the contractual purchase price. Funds from Operations Attributable to Common Stockholders and Noncontrolling Interest and Adjusted Funds from Operations Attributable to Common Stockholders and Noncontrolling Interest Funds from operations attributable to common stockholders and noncontrolling interest (“FFO”) and adjusted funds from operations attributable to common stockholders and noncontrolling interest (“AFFO”) are non-GAAP financial measures within the meaning of the rules of the SEC. The Company considers FFO and AFFO to be important supplemental measures of its operating performance and believes FFO is frequently used by securities analysts, investors, and other interested parties in the evaluation of REITs, many of which present FFO when reporting their results. In accordance with the National Association of Real Estate Investment Trusts’ (“NAREIT”) definition, FFO means net income or loss computed in accordance with GAAP before noncontrolling interests of holders of OP units and LTIP units, excluding gains (or losses) from sales of property and extraordinary items, property impairment losses, less preferred stock dividends, plus real estate-related depreciation and amortization (excluding amortization of debt issuance costs and the amortization of above and below market leases), and after adjustments for unconsolidated partnerships and joint ventures calculated to reflect FFO on the same basis. Because FFO excludes real estate-related depreciation and amortization (other than amortization of debt issuance costs and above and below market lease amortization expense), the Company believes that FFO provides a performance measure that, when compared period-over-period, reflects the impact to operations from trends in occupancy rates, rental rates, operating costs, development activities and interest costs, providing perspective not immediately apparent from the closest GAAP measurement, net income or loss. AFFO is a non-GAAP measure used by many investors and analysts to measure a real estate company’s operating performance by removing the effect of items that do not reflect ongoing property operations. Management calculates AFFO by modifying the NAREIT computation of FFO by adjusting it for certain cash and non-cash items and certain recurring and non-recurring items. For the Company these items include: (a) recurring acquisition and disposition costs, (b) loss on the extinguishment of debt, (c) recurring straight line deferred rental revenue, (d) recurring stock-based compensation expense, (e) recurring amortization of above and below market leases, (f) recurring amortization of debt issuance costs, (g) severance and transition related expense and (h) other items related to unconsolidated partnerships and joint ventures. Management believes that reporting AFFO in addition to FFO is a useful supplemental measure for the investment community to use when evaluating the operating performance of the Company on a comparative basis. Funds Available for Distribution Attributable to Common Stockholders and Noncontrolling Interest We calculate funds available for distribution attributable to common stockholders and noncontrolling interest (“FAD”) by subtracting from AFFO capital expenditures, including tenant improvements, and leasing commissions. Management believes FAD is useful in analyzing the portion of cash flow that is available for distribution to stockholders and unitholders. Investors, analysts and the Company utilize FAD as an indicator of common dividend potential. |
| 2Q-2025 | Earnings Supplemental 22 REPORTING DEFINITIONS AND OTHER DISCLOSURES Earnings Before Interest, Taxes, Depreciation and Amortization for Real Estate (“EBITDAre” and “Adjusted EBITDAre”) We calculate EBITDAre in accordance with standards established by NAREIT and define EBITDAre as net income or loss computed in accordance with GAAP plus depreciation and amortization, interest expense, gain or loss on the sale of investment properties, property impairment losses, and adjustments for unconsolidated partnerships and joint ventures, to reflect EBITDAre on the same basis, as applicable. We define Adjusted EBITDAre as EBITDAre plus loss on extinguishment of debt, non-cash stock compensation expense, non-cash intangible amortization related to above and below market leases, severance and transition related expense, transaction expense, adjustments related to our investment in unconsolidated joint ventures, and other normalizing items. Management considers EBITDAre and Adjusted EBITDAre important measures because they provide additional information to allow management, investors, and our current and potential creditors to evaluate and compare our core operating results and our ability to service debt. Other Disclosures Non-GAAP Financial Measures Management considers certain non-GAAP financial measures to be useful supplemental measures of the Company's operating performance. For the Company, non-GAAP measures consist of FFO attributable to common stockholders and noncontrolling interest, AFFO attributable to common stockholders and noncontrolling interest, FAD attributable to common stockholders and noncontrolling interest, EBITDAre and Adjusted EBITDAre. A non-GAAP financial measure is generally defined as one that purports to measure financial performance, financial position or cash flows, but excludes or includes amounts that would not be so adjusted in the most comparable measure determined in accordance with GAAP. The Company reports non-GAAP financial measures because these measures are observed by management to also be among the most predominant measures used by the REIT industry and by industry analysts to evaluate REITs. For these reasons, management deems it appropriate to disclose and discuss these non-GAAP financial measures. The non-GAAP financial measures presented herein are not necessarily identical to those presented by other real estate companies due to the fact that not all real estate companies use the same definitions. These measures should not be considered as alternatives to net income, as indicators of the Company's financial performance, or as alternatives to cash flow from operating activities as measures of the Company's liquidity, nor are these measures necessarily indicative of sufficient cash flow to fund all of the Company's needs. Management believes that in order to facilitate a clear understanding of the Company's historical consolidated operating results, these measures should be examined in conjunction with net income and cash flows from operations as presented elsewhere herein. Additional Information The information in this document should be read in conjunction with the Company’s Annual Report on Form 10-K, Quarterly Reports on Form 10-Q, Current Reports on Form 8-K, and other information filed with, or furnished to, the SEC. You can access the Company’s reports and amendments to those reports filed or furnished to the SEC pursuant to Section 13(a) or 15(d) of the Exchange Act in the “Investor Relations” section on the Company’s website (www.globalmedicalreit.com) under “SEC Filings” as soon as reasonably practicable after they are filed with, or furnished to, the SEC. The information on or connected to the Company’s website is not, and shall not be deemed to be, a part of, or incorporated into, this Earnings Supplemental. You also can review these SEC filings and other information by accessing the SEC’s website at http://www.sec.gov. Certain information contained in this package, including, but not limited to, information contained in our key tenants profiles is derived from publicly-available third-party sources. The Company has not independently verified this information and there can be no assurance that such information is accurate or complete. |
| INVESTOR RELATIONS globalmedicalreit.com NYSE: GMRE Contact: investors@globalmedicalreit.com 202.524.6869 |