Shareholder Report
|
12 Months Ended |
|
May 31, 2025
USD ($)
Holding
|
|---|
| Shareholder Report [Line Items] |
|
| Document Type |
N-CSR
|
| Amendment Flag |
false
|
| Registrant Name |
VALUED ADVISERS TRUST
|
| Entity Central Index Key |
0001437249
|
| Entity Investment Company Type |
N-1A
|
| Document Period End Date |
May 31, 2025
|
| C000245604 |
|
| Shareholder Report [Line Items] |
|
| Fund Name |
BFS Equity Fund
|
| Class Name |
Institutional Class
|
| Trading Symbol |
BFSIX
|
| Shareholder Report Annual or Semi-Annual |
Annual Shareholder Report
|
| Additional Information Phone Number |
(855) 575-2430
|
| Expenses [Text Block] |
What were the Fund’s costs for the last year?(based on a hypothetical $10,000 investment) Class Name | Costs of a $10,000 investment | Costs paid as a percentage of a $10,000 investment |
|---|
Institutional | $104 | 0.99% |
|---|
|
| Expenses Paid, Amount |
$ 104
|
| Expense Ratio, Percent |
0.99%
|
| Performance Past Does Not Indicate Future [Text] |
The Fund's past performance is not a good predictor of how the Fund will perform in the future.
|
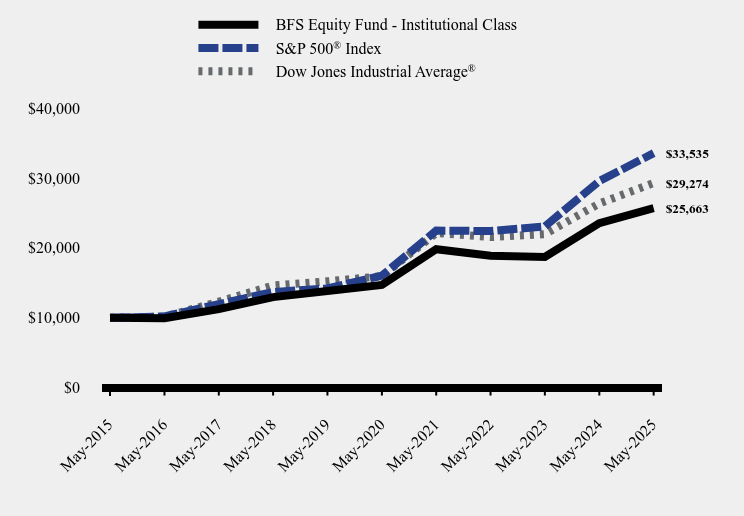
| Line Graph [Table Text Block] |
| BFS Equity Fund - Institutional Class | S&P 500® Index | Dow Jones Industrial Average® |
|---|
May-2015 | $10,000 | $10,000 | $10,000 |
|---|
May-2016 | $9,909 | $10,172 | $10,139 |
|---|
May-2017 | $11,212 | $11,948 | $12,284 |
|---|
May-2018 | $12,935 | $13,667 | $14,607 |
|---|
May-2019 | $13,819 | $14,184 | $15,198 |
|---|
May-2020 | $14,693 | $16,005 | $15,932 |
|---|
May-2021 | $19,789 | $22,458 | $22,113 |
|---|
May-2022 | $18,857 | $22,391 | $21,527 |
|---|
May-2023 | $18,680 | $23,045 | $21,950 |
|---|
May-2024 | $23,513 | $29,540 | $26,334 |
|---|
May-2025 | $25,663 | $33,535 | $29,274 |
|---|
|
| Average Annual Return [Table Text Block] |
| 1 Year | 5 Years | 10 Years |
|---|
BFS Equity Fund - Institutional Class | 9.14% | 11.80% | 9.88% |
|---|
S&P 500® Index | 13.52% | 15.94% | 12.86% |
|---|
Dow Jones Industrial Average® | 11.16% | 12.94% | 11.34% |
|---|
|
| No Deduction of Taxes [Text Block] |
The graph and table do not reflect the deduction of taxes that a shareholder would pay on fund distributions or redemption of fund shares.
|
| AssetsNet |
$ 58,343,984
|
| Holdings Count | Holding |
41
|
| Advisory Fees Paid, Amount |
$ 333,067
|
| InvestmentCompanyPortfolioTurnover |
16.00%
|
| Additional Fund Statistics [Text Block] |
- Net Assets$58,343,984
- Number of Portfolio Holdings41
- Advisory Fee (net of waivers)$333,067
- Portfolio Turnover16%
|
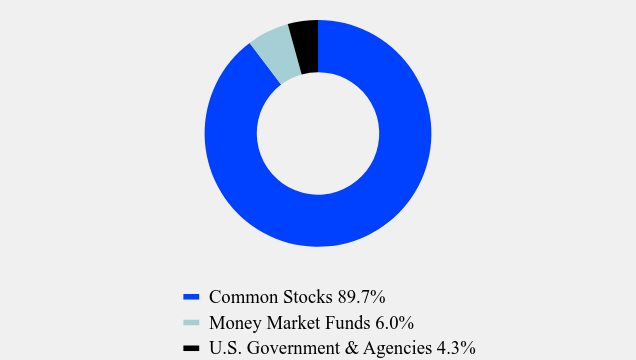
| Holdings [Text Block] |
Asset Weighting (% of total investments)Value | Value |
|---|
Common Stocks | 89.7% | Money Market Funds | 6.0% | U.S. Government & Agencies | 4.3% |
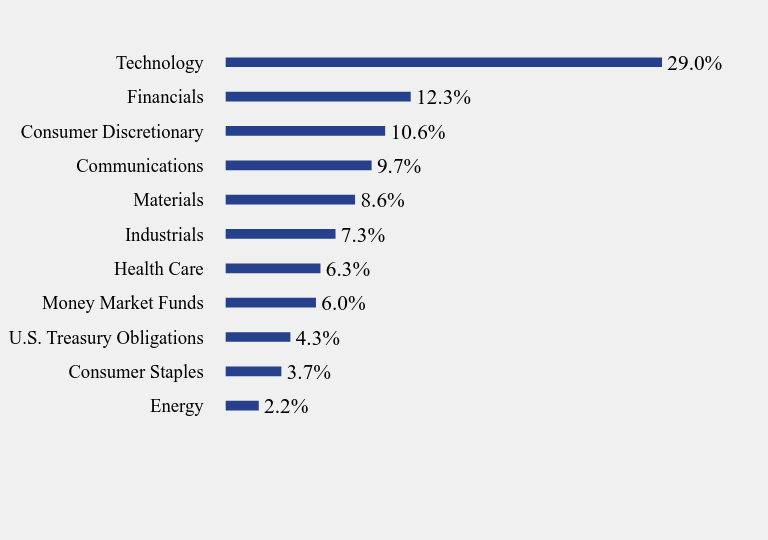
Sector Weighting (% of net assets)Value | Value |
|---|
Energy | 2.2% | Consumer Staples | 3.7% | U.S. Treasury Obligations | 4.3% | Money Market Funds | 6.0% | Health Care | 6.3% | Industrials | 7.3% | Materials | 8.6% | Communications | 9.7% | Consumer Discretionary | 10.6% | Financials | 12.3% | Technology | 29.0% |
|
| Largest Holdings [Text Block] |
Top 10 Holdings (% of net assets)Holding Name | % of Net Assets |
|---|
Microsoft Corp. | 6.7% |
|---|
Fidelity Investments Money Market Government Portfolio, Institutional Class | 6.0% |
|---|
NVIDIA Corp. | 5.8% |
|---|
Meta Platforms, Inc., Class A | 5.0% |
|---|
Alphabet, Inc., Class A | 4.7% |
|---|
JPMorgan Chase & Co. | 4.5% |
|---|
Amazon.com, Inc. | 4.2% |
|---|
Apple, Inc. | 3.8% |
|---|
Broadcom, Inc. | 3.1% |
|---|
MasterCard, Inc., Class A | 3.0% |
|---|
|
| Material Fund Change [Text Block] |
No material changes occurred during the year ended May 31, 2025. |
| C000089323 |
|
| Shareholder Report [Line Items] |
|
| Fund Name |
LS Opportunity Fund
|
| Class Name |
Institutional Class
|
| Trading Symbol |
LSOFX
|
| Shareholder Report Annual or Semi-Annual |
Annual Shareholder Report
|
| Additional Information Phone Number |
(877) 336-6763
|
| Expenses [Text Block] |
What were the Fund’s costs for the last year?(based on a hypothetical $10,000 investment) Class Name | Costs of a $10,000 investment | Costs paid as a percentage of a $10,000 investment |
|---|
Institutional | $272 | 2.67% |
|---|
|
| Expenses Paid, Amount |
$ 272
|
| Expense Ratio, Percent |
2.67%
|
| Performance Past Does Not Indicate Future [Text] |
The Fund's past performance is not a good predictor of how the Fund will perform in the future.
|
| Average Annual Return [Table Text Block] |
Average Annual Total Returns | 1 Year | 5 years | 10 Years |
|---|
LS Opportunity Fund - I | 3.49% | 8.12% | 6.60% |
|---|
S&P 500® Index | 13.52% | 15.94% | 12.86% |
|---|
The Fund's past performance is not a good predictor of how the Fund will perform in the future. The graph and table do not reflect the deduction of taxes that a shareholder would pay on fund distributions or redemption of fund shares. |
| No Deduction of Taxes [Text Block] |
The graph and table do not reflect the deduction of taxes that a shareholder would pay on fund distributions or redemption of fund shares.
|
| AssetsNet |
$ 191,460,045
|
| Holdings Count | Holding |
96
|
| Advisory Fees Paid, Amount |
$ 3,417,428
|
| InvestmentCompanyPortfolioTurnover |
66.00%
|
| Additional Fund Statistics [Text Block] |
- Net Assets$191,460,045
- Number of Portfolio Holdings96
- Advisory Fee (net of waivers)$3,417,428
- Portfolio Turnover66%
|
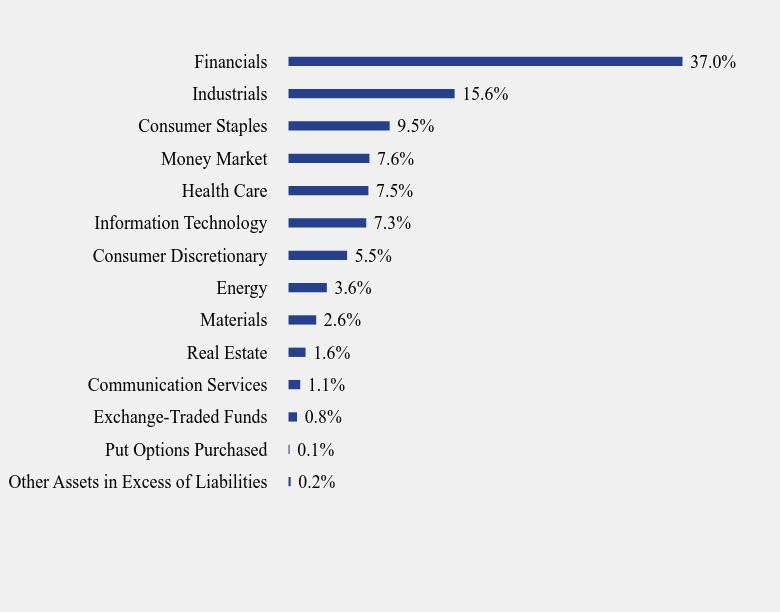
| Holdings [Text Block] |
Long Sector Weighting (% of net assets)Value | Value |
|---|
Other Assets in Excess of Liabilities | 0.2% | Put Options Purchased | 0.1% | Exchange-Traded Funds | 0.8% | Communication Services | 1.1% | Real Estate | 1.6% | Materials | 2.6% | Energy | 3.6% | Consumer Discretionary | 5.5% | Information Technology | 7.3% | Health Care | 7.5% | Money Market | 7.6% | Consumer Staples | 9.5% | Industrials | 15.6% | Financials | 37.0% |
Top 10 Holdings (% of net assets)Holding Name | % of Net Assets |
|---|
Invesco Treasury Portfolio, Institutional Class | 7.6% |
|---|
Brown & Brown, Inc. | 3.7% |
|---|
PNC Financial Services Group, Inc. (The) | 3.3% |
|---|
Fairfax Financial Holdings Ltd. | 3.3% |
|---|
Eaton Corp. PLC | 3.3% |
|---|
Progressive Corp. (The) | 3.1% |
|---|
Arthur J. Gallagher & Co. | 2.9% |
|---|
Globe Life, Inc. | 2.8% |
|---|
Abbott Laboratories | 2.6% |
|---|
Everest Re Group, Ltd. | 2.5% |
|---|
|