Shareholder Report
|
6 Months Ended |
7 Months Ended |
|
May 31, 2025
USD ($)
Holding
|
Jul. 01, 2025 |
| Shareholder Report [Line Items] |
|
|
| Document Type |
N-CSRS
|
|
| Amendment Flag |
false
|
|
| Registrant Name |
Natixis Funds Trust II
|
|
| Entity Central Index Key |
0000052136
|
|
| Entity Investment Company Type |
N-1A
|
|
| Document Period End Date |
May 31, 2025
|
|
| C000167848 |
|
|
| Shareholder Report [Line Items] |
|
|
| Fund Name |
Loomis Sayles Global Growth Fund
|
|
| Class Name |
Class A
|
|
| Trading Symbol |
LSAGX
|
|
| Annual or Semi-Annual Statement [Text Block] |
This semi-annual shareholder report contains important information about Loomis Sayles Global Growth Fund for the period of December 1, 2024 to May 31, 2025.
|
|
| Shareholder Report Annual or Semi-Annual |
Semi-annual Shareholder Report
|
|
| Additional Information [Text Block] |
You can find additional information (including tax information) about the Fund at im.natixis.com/funddocuments. You can also request the information by contacting us at (800) 225-5478 or by contacting your financial intermediary directly.
|
|
| Additional Information Phone Number |
(800) 225-5478
|
|
| Additional Information Website |
<span style="box-sizing: border-box; color: rgb(0, 0, 0); display: inline; flex-wrap: nowrap; font-size: 12px; font-weight: 400; grid-area: auto; line-height: 18px; margin: 0px; overflow: visible; text-align: left; text-align-last: auto; white-space-collapse: preserve-breaks;">im.natixis.com/funddocuments</span>
|
|
| Expenses [Text Block] |
What were the fund costs for the last six months? (based on a hypothetical $10,000 investment)
Class Name |
Costs of a $10,000 investment |
Costs paid as a percentage of a $10,000 investmentFootnote Reference† |
Class A |
$61 |
1.20% |
| Footnote |
Description |
Footnote† |
Annualized for periods less than one year (if applicable). | |
|
| Expenses Paid, Amount |
$ 61
|
|
| Expense Ratio, Percent |
1.20%
|
|
| AssetsNet |
$ 128,359,774
|
|
| Holdings Count | Holding |
45
|
|
| Advisory Fees Paid, Amount |
$ 319,085
|
|
| InvestmentCompanyPortfolioTurnover |
2.00%
|
|
| Additional Fund Statistics [Text Block] |
- Total Net Assets$128,359,774
- # of Portfolio Holdings (including overnight repurchase agreements)45
- Portfolio Turnover Rate2%
- Total Advisory Fees Paid (after waiver/reimbursement, if applicable)$319,085
|
|
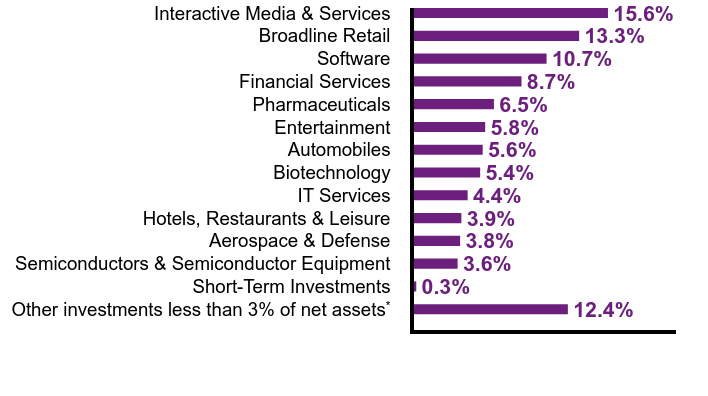
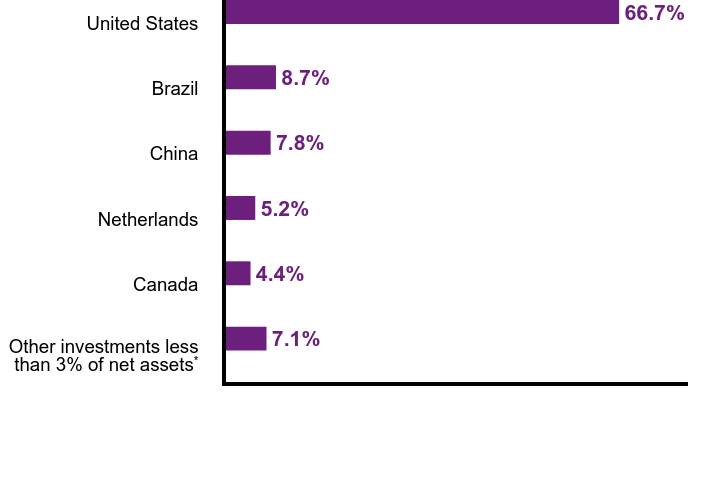
| Holdings [Text Block] |
Value |
Value |
Other investments less than 3% of net assetsFootnote Reference* |
12.4% |
Short-Term Investments |
0.3% |
Semiconductors & Semiconductor Equipment |
3.6% |
Aerospace & Defense |
3.8% |
Hotels, Restaurants & Leisure |
3.9% |
IT Services |
4.4% |
Biotechnology |
5.4% |
Automobiles |
5.6% |
Entertainment |
5.8% |
Pharmaceuticals |
6.5% |
Financial Services |
8.7% |
Software |
10.7% |
Broadline Retail |
13.3% |
Interactive Media & Services |
15.6% |
| Footnote |
Description |
Footnote* |
Net of other assets less liabilities |
Value |
Value |
Other investments less than 3% of net assetsFootnote Reference* |
7.1% |
Canada |
4.4% |
Netherlands |
5.2% |
China |
7.8% |
Brazil |
8.7% |
United States |
66.7% |
| Footnote |
Description |
Footnote* |
Net of other assets less liabilities | |
|
| Largest Holdings [Text Block] |
MercadoLibre, Inc. |
7.1% |
Meta Platforms, Inc., Class A |
7.1% |
Netflix, Inc. |
5.8% |
Tesla, Inc. |
5.6% |
Amazon.com, Inc. |
5.3% |
Alphabet, Inc., Class A |
4.7% |
Shopify, Inc., Class A |
4.4% |
Oracle Corp. |
4.1% |
Visa, Inc., Class A |
4.0% |
Adyen NV |
4.0% | |
|
| Material Fund Change [Text Block] |
There were no material fund changes during the period. |
|
| C000167849 |
|
|
| Shareholder Report [Line Items] |
|
|
| Fund Name |
Loomis Sayles Global Growth Fund
|
|
| Class Name |
Class C
|
|
| Trading Symbol |
LSCGX
|
|
| Annual or Semi-Annual Statement [Text Block] |
This semi-annual shareholder report contains important information about Loomis Sayles Global Growth Fund for the period of December 1, 2024 to May 31, 2025.
|
|
| Shareholder Report Annual or Semi-Annual |
Semi-annual Shareholder Report
|
|
| Additional Information [Text Block] |
You can find additional information (including tax information) about the Fund at im.natixis.com/funddocuments. You can also request the information by contacting us at (800) 225-5478 or by contacting your financial intermediary directly.
|
|
| Additional Information Phone Number |
(800) 225-5478
|
|
| Additional Information Website |
<span style="box-sizing: border-box; color: rgb(0, 0, 0); display: inline; flex-wrap: nowrap; font-size: 12px; font-weight: 400; grid-area: auto; line-height: 18px; margin: 0px; overflow: visible; text-align: left; text-align-last: auto; white-space-collapse: preserve-breaks;">im.natixis.com/funddocuments</span>
|
|
| Expenses [Text Block] |
What were the fund costs for the last six months? (based on a hypothetical $10,000 investment)
Class Name |
Costs of a $10,000 investment |
Costs paid as a percentage of a $10,000 investmentFootnote Reference† |
Class C |
$100 |
1.95% |
| Footnote |
Description |
Footnote† |
Annualized for periods less than one year (if applicable). | |
|
| Expenses Paid, Amount |
$ 100
|
|
| Expense Ratio, Percent |
1.95%
|
|
| AssetsNet |
$ 128,359,774
|
|
| Holdings Count | Holding |
45
|
|
| Advisory Fees Paid, Amount |
$ 319,085
|
|
| InvestmentCompanyPortfolioTurnover |
2.00%
|
|
| Additional Fund Statistics [Text Block] |
- Total Net Assets$128,359,774
- # of Portfolio Holdings (including overnight repurchase agreements)45
- Portfolio Turnover Rate2%
- Total Advisory Fees Paid (after waiver/reimbursement, if applicable)$319,085
|
|
| Holdings [Text Block] |
Value |
Value |
Other investments less than 3% of net assetsFootnote Reference* |
12.4% |
Short-Term Investments |
0.3% |
Semiconductors & Semiconductor Equipment |
3.6% |
Aerospace & Defense |
3.8% |
Hotels, Restaurants & Leisure |
3.9% |
IT Services |
4.4% |
Biotechnology |
5.4% |
Automobiles |
5.6% |
Entertainment |
5.8% |
Pharmaceuticals |
6.5% |
Financial Services |
8.7% |
Software |
10.7% |
Broadline Retail |
13.3% |
Interactive Media & Services |
15.6% |
| Footnote |
Description |
Footnote* |
Net of other assets less liabilities |
Value |
Value |
Other investments less than 3% of net assetsFootnote Reference* |
7.1% |
Canada |
4.4% |
Netherlands |
5.2% |
China |
7.8% |
Brazil |
8.7% |
United States |
66.7% |
| Footnote |
Description |
Footnote* |
Net of other assets less liabilities | |
|
| Largest Holdings [Text Block] |
MercadoLibre, Inc. |
7.1% |
Meta Platforms, Inc., Class A |
7.1% |
Netflix, Inc. |
5.8% |
Tesla, Inc. |
5.6% |
Amazon.com, Inc. |
5.3% |
Alphabet, Inc., Class A |
4.7% |
Shopify, Inc., Class A |
4.4% |
Oracle Corp. |
4.1% |
Visa, Inc., Class A |
4.0% |
Adyen NV |
4.0% | |
|
| Material Fund Change [Text Block] |
There were no material fund changes during the period. |
|
| C000188122 |
|
|
| Shareholder Report [Line Items] |
|
|
| Fund Name |
Loomis Sayles Global Growth Fund
|
|
| Class Name |
Class N
|
|
| Trading Symbol |
LSNGX
|
|
| Annual or Semi-Annual Statement [Text Block] |
This semi-annual shareholder report contains important information about Loomis Sayles Global Growth Fund for the period of December 1, 2024 to May 31, 2025.
|
|
| Shareholder Report Annual or Semi-Annual |
Semi-annual Shareholder Report
|
|
| Additional Information [Text Block] |
You can find additional information (including tax information) about the Fund at im.natixis.com/funddocuments. You can also request the information by contacting us at (800) 225-5478 or by contacting your financial intermediary directly.
|
|
| Additional Information Phone Number |
(800) 225-5478
|
|
| Additional Information Website |
<span style="box-sizing: border-box; color: rgb(0, 0, 0); display: inline; flex-wrap: nowrap; font-size: 12px; font-weight: 400; grid-area: auto; line-height: 18px; margin: 0px; overflow: visible; text-align: left; text-align-last: auto; white-space-collapse: preserve-breaks;">im.natixis.com/funddocuments</span>
|
|
| Expenses [Text Block] |
What were the fund costs for the last six months? (based on a hypothetical $10,000 investment)
Class Name |
Costs of a $10,000 investment |
Costs paid as a percentage of a $10,000 investmentFootnote Reference† |
Class N |
$46 |
0.90% |
| Footnote |
Description |
Footnote† |
Annualized for periods less than one year (if applicable). | |
|
| Expenses Paid, Amount |
$ 46
|
|
| Expense Ratio, Percent |
0.90%
|
|
| AssetsNet |
$ 128,359,774
|
|
| Holdings Count | Holding |
45
|
|
| Advisory Fees Paid, Amount |
$ 319,085
|
|
| InvestmentCompanyPortfolioTurnover |
2.00%
|
|
| Additional Fund Statistics [Text Block] |
- Total Net Assets$128,359,774
- # of Portfolio Holdings (including overnight repurchase agreements)45
- Portfolio Turnover Rate2%
- Total Advisory Fees Paid (after waiver/reimbursement, if applicable)$319,085
|
|
| Holdings [Text Block] |
Value |
Value |
Other investments less than 3% of net assetsFootnote Reference* |
12.4% |
Short-Term Investments |
0.3% |
Semiconductors & Semiconductor Equipment |
3.6% |
Aerospace & Defense |
3.8% |
Hotels, Restaurants & Leisure |
3.9% |
IT Services |
4.4% |
Biotechnology |
5.4% |
Automobiles |
5.6% |
Entertainment |
5.8% |
Pharmaceuticals |
6.5% |
Financial Services |
8.7% |
Software |
10.7% |
Broadline Retail |
13.3% |
Interactive Media & Services |
15.6% |
| Footnote |
Description |
Footnote* |
Net of other assets less liabilities |
Value |
Value |
Other investments less than 3% of net assetsFootnote Reference* |
7.1% |
Canada |
4.4% |
Netherlands |
5.2% |
China |
7.8% |
Brazil |
8.7% |
United States |
66.7% |
| Footnote |
Description |
Footnote* |
Net of other assets less liabilities | |
|
| Largest Holdings [Text Block] |
MercadoLibre, Inc. |
7.1% |
Meta Platforms, Inc., Class A |
7.1% |
Netflix, Inc. |
5.8% |
Tesla, Inc. |
5.6% |
Amazon.com, Inc. |
5.3% |
Alphabet, Inc., Class A |
4.7% |
Shopify, Inc., Class A |
4.4% |
Oracle Corp. |
4.1% |
Visa, Inc., Class A |
4.0% |
Adyen NV |
4.0% | |
|
| Material Fund Change [Text Block] |
There were no material fund changes during the period. |
|
| C000167850 |
|
|
| Shareholder Report [Line Items] |
|
|
| Fund Name |
Loomis Sayles Global Growth Fund
|
|
| Class Name |
Class Y
|
|
| Trading Symbol |
LSGGX
|
|
| Annual or Semi-Annual Statement [Text Block] |
This semi-annual shareholder report contains important information about Loomis Sayles Global Growth Fund for the period of December 1, 2024 to May 31, 2025.
|
|
| Shareholder Report Annual or Semi-Annual |
Semi-annual Shareholder Report
|
|
| Additional Information [Text Block] |
You can find additional information (including tax information) about the Fund at im.natixis.com/funddocuments. You can also request the information by contacting us at (800) 225-5478 or by contacting your financial intermediary directly.
|
|
| Additional Information Phone Number |
(800) 225-5478
|
|
| Additional Information Website |
<span style="box-sizing: border-box; color: rgb(0, 0, 0); display: inline; flex-wrap: nowrap; font-size: 12px; font-weight: 400; grid-area: auto; line-height: 18px; margin: 0px; overflow: visible; text-align: left; text-align-last: auto; white-space-collapse: preserve-breaks;">im.natixis.com/funddocuments</span>
|
|
| Expenses [Text Block] |
What were the fund costs for the last six months? (based on a hypothetical $10,000 investment)
Class Name |
Costs of a $10,000 investment |
Costs paid as a percentage of a $10,000 investmentFootnote Reference† |
Class Y |
$49 |
0.95% |
| Footnote |
Description |
Footnote† |
Annualized for periods less than one year (if applicable). | |
|
| Expenses Paid, Amount |
$ 49
|
|
| Expense Ratio, Percent |
0.95%
|
|
| AssetsNet |
$ 128,359,774
|
|
| Holdings Count | Holding |
45
|
|
| Advisory Fees Paid, Amount |
$ 319,085
|
|
| InvestmentCompanyPortfolioTurnover |
2.00%
|
|
| Additional Fund Statistics [Text Block] |
- Total Net Assets$128,359,774
- # of Portfolio Holdings (including overnight repurchase agreements)45
- Portfolio Turnover Rate2%
- Total Advisory Fees Paid (after waiver/reimbursement, if applicable)$319,085
|
|
| Holdings [Text Block] |
Value |
Value |
Other investments less than 3% of net assetsFootnote Reference* |
12.4% |
Short-Term Investments |
0.3% |
Semiconductors & Semiconductor Equipment |
3.6% |
Aerospace & Defense |
3.8% |
Hotels, Restaurants & Leisure |
3.9% |
IT Services |
4.4% |
Biotechnology |
5.4% |
Automobiles |
5.6% |
Entertainment |
5.8% |
Pharmaceuticals |
6.5% |
Financial Services |
8.7% |
Software |
10.7% |
Broadline Retail |
13.3% |
Interactive Media & Services |
15.6% |
| Footnote |
Description |
Footnote* |
Net of other assets less liabilities |
Value |
Value |
Other investments less than 3% of net assetsFootnote Reference* |
7.1% |
Canada |
4.4% |
Netherlands |
5.2% |
China |
7.8% |
Brazil |
8.7% |
United States |
66.7% |
| Footnote |
Description |
Footnote* |
Net of other assets less liabilities | |
|
| Largest Holdings [Text Block] |
MercadoLibre, Inc. |
7.1% |
Meta Platforms, Inc., Class A |
7.1% |
Netflix, Inc. |
5.8% |
Tesla, Inc. |
5.6% |
Amazon.com, Inc. |
5.3% |
Alphabet, Inc., Class A |
4.7% |
Shopify, Inc., Class A |
4.4% |
Oracle Corp. |
4.1% |
Visa, Inc., Class A |
4.0% |
Adyen NV |
4.0% | |
|
| Material Fund Change [Text Block] |
There were no material fund changes during the period. |
|
| C000105118 |
|
|
| Shareholder Report [Line Items] |
|
|
| Fund Name |
Loomis Sayles Senior Floating Rate and Fixed Income Fund
|
|
| Class Name |
Class A
|
|
| Trading Symbol |
LSFAX
|
|
| Annual or Semi-Annual Statement [Text Block] |
This semi-annual shareholder report contains important information about Loomis Sayles Senior Floating Rate and Fixed Income Fund for the period of December 1, 2024 to May 31, 2025.
|
|
| Shareholder Report Annual or Semi-Annual |
Semi-annual Shareholder Report
|
|
| Additional Information [Text Block] |
You can find additional information (including tax information) about the Fund at im.natixis.com/funddocuments. You can also request the information by contacting us at (800) 225-5478 or by contacting your financial intermediary directly.
|
|
| Additional Information Phone Number |
(800) 225-5478
|
|
| Additional Information Website |
<span style="box-sizing: border-box; color: rgb(0, 0, 0); display: inline; flex-wrap: nowrap; font-size: 12px; font-weight: 400; grid-area: auto; line-height: 18px; margin: 0px; overflow: visible; text-align: left; text-align-last: auto; white-space-collapse: preserve-breaks;">im.natixis.com/funddocuments</span>
|
|
| Expenses [Text Block] |
What were the fund costs for the last six months? (based on a hypothetical $10,000 investment)
Class Name |
Costs of a $10,000 investment |
Costs paid as a percentage of a $10,000 investmentFootnote Reference† |
Class A |
$50 |
0.99% |
| Footnote |
Description |
Footnote† |
Annualized for periods less than one year (if applicable). | |
|
| Expenses Paid, Amount |
$ 50
|
|
| Expense Ratio, Percent |
0.99%
|
|
| AssetsNet |
$ 629,533,739
|
|
| Holdings Count | Holding |
257
|
|
| Advisory Fees Paid, Amount |
$ 2,087,106
|
|
| InvestmentCompanyPortfolioTurnover |
53.00%
|
|
| Additional Fund Statistics [Text Block] |
- Total Net Assets$629,533,739
- # of Portfolio Holdings (including overnight repurchase agreements and derivatives)257
- Portfolio Turnover Rate53%
- Total Advisory Fees Paid (after waiver/reimbursement, if applicable)$2,087,106
|
|
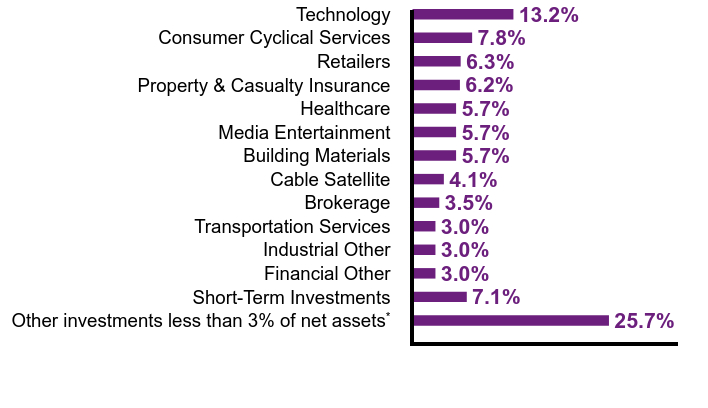
| Holdings [Text Block] |
Value |
Value |
Other investments less than 3% of net assetsFootnote Reference* |
25.7% |
Short-Term Investments |
7.1% |
Financial Other |
3.0% |
Industrial Other |
3.0% |
Transportation Services |
3.0% |
Brokerage |
3.5% |
Cable Satellite |
4.1% |
Building Materials |
5.7% |
Media Entertainment |
5.7% |
Healthcare |
5.7% |
Property & Casualty Insurance |
6.2% |
Retailers |
6.3% |
Consumer Cyclical Services |
7.8% |
Technology |
13.2% |
| Footnote |
Description |
Footnote* |
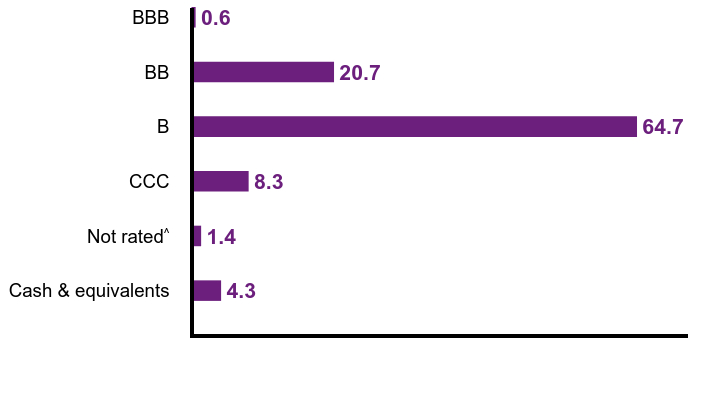
Net of other assets less liabilities (including futures contracts) | Credit QualityFootnote Reference†
Value |
Value |
Cash & equivalents |
4.3 |
Not ratedFootnote Reference^ |
1.4 |
CCC |
8.3 |
B |
64.7 |
BB |
20.7 |
BBB |
0.6 |
| Footnote |
Description |
Footnote† |
Credit ratings are by S&P Global Ratings. A credit rating is an assessment provided by a nationally recognized statistical rating organization (NRSRO) of the creditworthiness of an issuer with respect to debt obligations except for those debt obligations that are only privately rated. Ratings are measured on a scale that generally ranges from AAA (highest) to D (lowest). The credit ratings shown relate to the creditworthiness of the issuers of the underlying securities in the Fund, and not to the Fund or its shares. Credit ratings are subject to change. |
Footnote^ |
Not Rated category represents only those securities not rated by S&P Global Ratings. Such securities may be rated by other NRSROs not shown here. | |
|
| Credit Quality Explanation [Text Block] |
Credit ratings are by S&P Global Ratings. A credit rating is an assessment provided by a nationally recognized statistical rating organization (NRSRO) of the creditworthiness of an issuer with respect to debt obligations except for those debt obligations that are only privately rated. Ratings are measured on a scale that generally ranges from AAA (highest) to D (lowest). The credit ratings shown relate to the creditworthiness of the issuers of the underlying securities in the Fund, and not to the Fund or its shares. Credit ratings are subject to change.
|
|
| Material Fund Change [Text Block] |
There were no material fund changes during the period. |
|
| C000105119 |
|
|
| Shareholder Report [Line Items] |
|
|
| Fund Name |
Loomis Sayles Senior Floating Rate and Fixed Income Fund
|
|
| Class Name |
Class C
|
|
| Trading Symbol |
LSFCX
|
|
| Annual or Semi-Annual Statement [Text Block] |
This semi-annual shareholder report contains important information about Loomis Sayles Senior Floating Rate and Fixed Income Fund for the period of December 1, 2024 to May 31, 2025.
|
|
| Shareholder Report Annual or Semi-Annual |
Semi-annual Shareholder Report
|
|
| Additional Information [Text Block] |
You can find additional information (including tax information) about the Fund at im.natixis.com/funddocuments. You can also request the information by contacting us at (800) 225-5478 or by contacting your financial intermediary directly.
|
|
| Additional Information Phone Number |
(800) 225-5478
|
|
| Additional Information Website |
<span style="box-sizing: border-box; color: rgb(0, 0, 0); display: inline; flex-wrap: nowrap; font-size: 12px; font-weight: 400; grid-area: auto; line-height: 18px; margin: 0px; overflow: visible; text-align: left; text-align-last: auto; white-space-collapse: preserve-breaks;">im.natixis.com/funddocuments</span>
|
|
| Expenses [Text Block] |
What were the fund costs for the last six months? (based on a hypothetical $10,000 investment)
Class Name |
Costs of a $10,000 investment |
Costs paid as a percentage of a $10,000 investmentFootnote Reference† |
Class C |
$88 |
1.74% |
| Footnote |
Description |
Footnote† |
Annualized for periods less than one year (if applicable). | |
|
| Expenses Paid, Amount |
$ 88
|
|
| Expense Ratio, Percent |
1.74%
|
|
| AssetsNet |
$ 629,533,739
|
|
| Holdings Count | Holding |
257
|
|
| Advisory Fees Paid, Amount |
$ 2,087,106
|
|
| InvestmentCompanyPortfolioTurnover |
53.00%
|
|
| Additional Fund Statistics [Text Block] |
- Total Net Assets$629,533,739
- # of Portfolio Holdings (including overnight repurchase agreements and derivatives)257
- Portfolio Turnover Rate53%
- Total Advisory Fees Paid (after waiver/reimbursement, if applicable)$2,087,106
|
|
| Holdings [Text Block] |
Value |
Value |
Other investments less than 3% of net assetsFootnote Reference* |
25.7% |
Short-Term Investments |
7.1% |
Financial Other |
3.0% |
Industrial Other |
3.0% |
Transportation Services |
3.0% |
Brokerage |
3.5% |
Cable Satellite |
4.1% |
Building Materials |
5.7% |
Media Entertainment |
5.7% |
Healthcare |
5.7% |
Property & Casualty Insurance |
6.2% |
Retailers |
6.3% |
Consumer Cyclical Services |
7.8% |
Technology |
13.2% |
| Footnote |
Description |
Footnote* |
Net of other assets less liabilities (including futures contracts) | Credit QualityFootnote Reference†
Value |
Value |
Cash & equivalents |
4.3 |
Not ratedFootnote Reference^ |
1.4 |
CCC |
8.3 |
B |
64.7 |
BB |
20.7 |
BBB |
0.6 |
| Footnote |
Description |
Footnote† |
Credit ratings are by S&P Global Ratings. A credit rating is an assessment provided by a nationally recognized statistical rating organization (NRSRO) of the creditworthiness of an issuer with respect to debt obligations except for those debt obligations that are only privately rated. Ratings are measured on a scale that generally ranges from AAA (highest) to D (lowest). The credit ratings shown relate to the creditworthiness of the issuers of the underlying securities in the Fund, and not to the Fund or its shares. Credit ratings are subject to change. |
Footnote^ |
Not Rated category represents only those securities not rated by S&P Global Ratings. Such securities may be rated by other NRSROs not shown here. | |
|
| Credit Quality Explanation [Text Block] |
Credit ratings are by S&P Global Ratings. A credit rating is an assessment provided by a nationally recognized statistical rating organization (NRSRO) of the creditworthiness of an issuer with respect to debt obligations except for those debt obligations that are only privately rated. Ratings are measured on a scale that generally ranges from AAA (highest) to D (lowest). The credit ratings shown relate to the creditworthiness of the issuers of the underlying securities in the Fund, and not to the Fund or its shares. Credit ratings are subject to change.
|
|
| Material Fund Change [Text Block] |
There were no material fund changes during the period. |
|
| C000188118 |
|
|
| Shareholder Report [Line Items] |
|
|
| Fund Name |
Loomis Sayles Senior Floating Rate and Fixed Income Fund
|
|
| Class Name |
Class N
|
|
| Trading Symbol |
LSFNX
|
|
| Annual or Semi-Annual Statement [Text Block] |
This semi-annual shareholder report contains important information about Loomis Sayles Senior Floating Rate and Fixed Income Fund for the period of December 1, 2024 to May 31, 2025.
|
|
| Shareholder Report Annual or Semi-Annual |
Semi-annual Shareholder Report
|
|
| Additional Information [Text Block] |
You can find additional information (including tax information) about the Fund at im.natixis.com/funddocuments. You can also request the information by contacting us at (800) 225-5478 or by contacting your financial intermediary directly.
|
|
| Additional Information Phone Number |
(800) 225-5478
|
|
| Additional Information Website |
<span style="box-sizing: border-box; color: rgb(0, 0, 0); display: inline; flex-wrap: nowrap; font-size: 12px; font-weight: 400; grid-area: auto; line-height: 18px; margin: 0px; overflow: visible; text-align: left; text-align-last: auto; white-space-collapse: preserve-breaks;">im.natixis.com/funddocuments</span>
|
|
| Expenses [Text Block] |
What were the fund costs for the last six months? (based on a hypothetical $10,000 investment)
Class Name |
Costs of a $10,000 investment |
Costs paid as a percentage of a $10,000 investmentFootnote Reference† |
Class N |
$35 |
0.69% |
| Footnote |
Description |
Footnote† |
Annualized for periods less than one year (if applicable). | |
|
| Expenses Paid, Amount |
$ 35
|
|
| Expense Ratio, Percent |
0.69%
|
|
| AssetsNet |
$ 629,533,739
|
|
| Holdings Count | Holding |
257
|
|
| Advisory Fees Paid, Amount |
$ 2,087,106
|
|
| InvestmentCompanyPortfolioTurnover |
53.00%
|
|
| Additional Fund Statistics [Text Block] |
- Total Net Assets$629,533,739
- # of Portfolio Holdings (including overnight repurchase agreements and derivatives)257
- Portfolio Turnover Rate53%
- Total Advisory Fees Paid (after waiver/reimbursement, if applicable)$2,087,106
|
|
| Holdings [Text Block] |
Value |
Value |
Other investments less than 3% of net assetsFootnote Reference* |
25.7% |
Short-Term Investments |
7.1% |
Financial Other |
3.0% |
Industrial Other |
3.0% |
Transportation Services |
3.0% |
Brokerage |
3.5% |
Cable Satellite |
4.1% |
Building Materials |
5.7% |
Media Entertainment |
5.7% |
Healthcare |
5.7% |
Property & Casualty Insurance |
6.2% |
Retailers |
6.3% |
Consumer Cyclical Services |
7.8% |
Technology |
13.2% |
| Footnote |
Description |
Footnote* |
Net of other assets less liabilities (including futures contracts) | Credit QualityFootnote Reference†
Value |
Value |
Cash & equivalents |
4.3 |
Not ratedFootnote Reference^ |
1.4 |
CCC |
8.3 |
B |
64.7 |
BB |
20.7 |
BBB |
0.6 |
| Footnote |
Description |
Footnote† |
Credit ratings are by S&P Global Ratings. A credit rating is an assessment provided by a nationally recognized statistical rating organization (NRSRO) of the creditworthiness of an issuer with respect to debt obligations except for those debt obligations that are only privately rated. Ratings are measured on a scale that generally ranges from AAA (highest) to D (lowest). The credit ratings shown relate to the creditworthiness of the issuers of the underlying securities in the Fund, and not to the Fund or its shares. Credit ratings are subject to change. |
Footnote^ |
Not Rated category represents only those securities not rated by S&P Global Ratings. Such securities may be rated by other NRSROs not shown here. | |
|
| Credit Quality Explanation [Text Block] |
Credit ratings are by S&P Global Ratings. A credit rating is an assessment provided by a nationally recognized statistical rating organization (NRSRO) of the creditworthiness of an issuer with respect to debt obligations except for those debt obligations that are only privately rated. Ratings are measured on a scale that generally ranges from AAA (highest) to D (lowest). The credit ratings shown relate to the creditworthiness of the issuers of the underlying securities in the Fund, and not to the Fund or its shares. Credit ratings are subject to change.
|
|
| Material Fund Change [Text Block] |
There were no material fund changes during the period. |
|
| C000105120 |
|
|
| Shareholder Report [Line Items] |
|
|
| Fund Name |
Loomis Sayles Senior Floating Rate and Fixed Income Fund
|
|
| Class Name |
Class Y
|
|
| Trading Symbol |
LSFYX
|
|
| Annual or Semi-Annual Statement [Text Block] |
This semi-annual shareholder report contains important information about Loomis Sayles Senior Floating Rate and Fixed Income Fund for the period of December 1, 2024 to May 31, 2025.
|
|
| Shareholder Report Annual or Semi-Annual |
Semi-annual Shareholder Report
|
|
| Additional Information [Text Block] |
You can find additional information (including tax information) about the Fund at im.natixis.com/funddocuments. You can also request the information by contacting us at (800) 225-5478 or by contacting your financial intermediary directly.
|
|
| Additional Information Phone Number |
(800) 225-5478
|
|
| Additional Information Website |
<span style="box-sizing: border-box; color: rgb(0, 0, 0); display: inline; flex-wrap: nowrap; font-size: 12px; font-weight: 400; grid-area: auto; line-height: 18px; margin: 0px; overflow: visible; text-align: left; text-align-last: auto; white-space-collapse: preserve-breaks;">im.natixis.com/funddocuments</span>
|
|
| Expenses [Text Block] |
What were the fund costs for the last six months? (based on a hypothetical $10,000 investment)
Class Name |
Costs of a $10,000 investment |
Costs paid as a percentage of a $10,000 investmentFootnote Reference† |
Class Y |
$37 |
0.74% |
| Footnote |
Description |
Footnote† |
Annualized for periods less than one year (if applicable). | |
|
| Expenses Paid, Amount |
$ 37
|
|
| Expense Ratio, Percent |
0.74%
|
|
| AssetsNet |
$ 629,533,739
|
|
| Holdings Count | Holding |
257
|
|
| Advisory Fees Paid, Amount |
$ 2,087,106
|
|
| InvestmentCompanyPortfolioTurnover |
53.00%
|
|
| Additional Fund Statistics [Text Block] |
- Total Net Assets$629,533,739
- # of Portfolio Holdings (including overnight repurchase agreements and derivatives)257
- Portfolio Turnover Rate53%
- Total Advisory Fees Paid (after waiver/reimbursement, if applicable)$2,087,106
|
|
| Holdings [Text Block] |
Value |
Value |
Other investments less than 3% of net assetsFootnote Reference* |
25.7% |
Short-Term Investments |
7.1% |
Financial Other |
3.0% |
Industrial Other |
3.0% |
Transportation Services |
3.0% |
Brokerage |
3.5% |
Cable Satellite |
4.1% |
Building Materials |
5.7% |
Media Entertainment |
5.7% |
Healthcare |
5.7% |
Property & Casualty Insurance |
6.2% |
Retailers |
6.3% |
Consumer Cyclical Services |
7.8% |
Technology |
13.2% |
| Footnote |
Description |
Footnote* |
Net of other assets less liabilities (including futures contracts) | Credit QualityFootnote Reference†
Value |
Value |
Cash & equivalents |
4.3 |
Not ratedFootnote Reference^ |
1.4 |
CCC |
8.3 |
B |
64.7 |
BB |
20.7 |
BBB |
0.6 |
| Footnote |
Description |
Footnote† |
Credit ratings are by S&P Global Ratings. A credit rating is an assessment provided by a nationally recognized statistical rating organization (NRSRO) of the creditworthiness of an issuer with respect to debt obligations except for those debt obligations that are only privately rated. Ratings are measured on a scale that generally ranges from AAA (highest) to D (lowest). The credit ratings shown relate to the creditworthiness of the issuers of the underlying securities in the Fund, and not to the Fund or its shares. Credit ratings are subject to change. |
Footnote^ |
Not Rated category represents only those securities not rated by S&P Global Ratings. Such securities may be rated by other NRSROs not shown here. | |
|
| Credit Quality Explanation [Text Block] |
Credit ratings are by S&P Global Ratings. A credit rating is an assessment provided by a nationally recognized statistical rating organization (NRSRO) of the creditworthiness of an issuer with respect to debt obligations except for those debt obligations that are only privately rated. Ratings are measured on a scale that generally ranges from AAA (highest) to D (lowest). The credit ratings shown relate to the creditworthiness of the issuers of the underlying securities in the Fund, and not to the Fund or its shares. Credit ratings are subject to change.
|
|
| Material Fund Change [Text Block] |
There were no material fund changes during the period. |
|
| C000115831 |
|
|
| Shareholder Report [Line Items] |
|
|
| Fund Name |
Vaughan Nelson Select Fund
|
|
| Class Name |
Class A
|
|
| Trading Symbol |
VNSAX
|
|
| Annual or Semi-Annual Statement [Text Block] |
This semi-annual shareholder report contains important information about Vaughan Nelson Select Fund for the period of December 1, 2024 to May 31, 2025.
|
|
| Shareholder Report Annual or Semi-Annual |
Semi-annual Shareholder Report
|
|
| Additional Information [Text Block] |
You can find additional information (including tax information) about the Fund at im.natixis.com/funddocuments. You can also request the information by contacting us at (800) 225-5478 or by contacting your financial intermediary directly.
|
|
| Material Fund Change Notice [Text Block] |
This report describes changes to the Fund that occurred during the reporting period.
|
|
| Additional Information Phone Number |
(800) 225-5478
|
|
| Additional Information Website |
<span style="box-sizing: border-box; color: rgb(0, 0, 0); display: inline; flex-wrap: nowrap; font-size: 12px; font-weight: 400; grid-area: auto; line-height: 18px; margin: 0px; overflow: visible; text-align: left; text-align-last: auto; white-space-collapse: preserve-breaks;">im.natixis.com/funddocuments</span>
|
|
| Expenses [Text Block] |
What were the fund costs for the last six months? (based on a hypothetical $10,000 investment)
Class Name |
Costs of a $10,000 investment |
Costs paid as a percentage of a $10,000 investmentFootnote Reference† |
Class A |
$54 |
1.10% |
| Footnote |
Description |
Footnote† |
Annualized for periods less than one year (if applicable). | |
|
| Expenses Paid, Amount |
$ 54
|
|
| Expense Ratio, Percent |
1.10%
|
|
| Material Change Date |
|
Jul. 01, 2025
|
| AssetsNet |
$ 551,060,839
|
|
| Holdings Count | Holding |
27
|
|
| Advisory Fees Paid, Amount |
$ 2,255,971
|
|
| InvestmentCompanyPortfolioTurnover |
44.00%
|
|
| Additional Fund Statistics [Text Block] |
- Total Net Assets$551,060,839
- # of Portfolio Holdings (including overnight repurchase agreements)27
- Portfolio Turnover Rate44%
- Total Advisory Fees Paid (after waiver/reimbursement, if applicable)$2,255,971
|
|
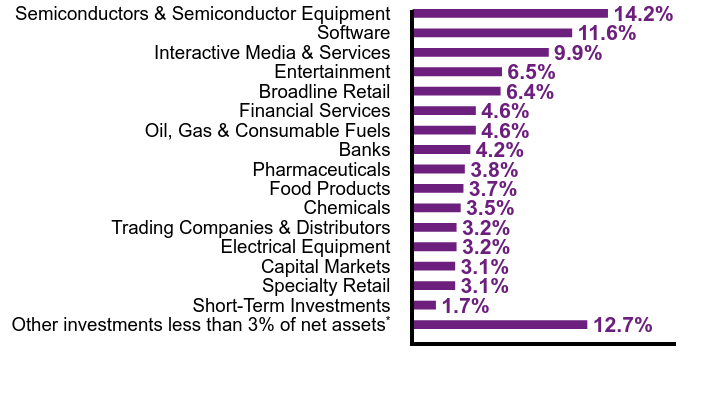
| Holdings [Text Block] |
Value |
Value |
Other investments less than 3% of net assetsFootnote Reference* |
12.7% |
Short-Term Investments |
1.7% |
Specialty Retail |
3.1% |
Capital Markets |
3.1% |
Electrical Equipment |
3.2% |
Trading Companies & Distributors |
3.2% |
Chemicals |
3.5% |
Food Products |
3.7% |
Pharmaceuticals |
3.8% |
Banks |
4.2% |
Oil, Gas & Consumable Fuels |
4.6% |
Financial Services |
4.6% |
Broadline Retail |
6.4% |
Entertainment |
6.5% |
Interactive Media & Services |
9.9% |
Software |
11.6% |
Semiconductors & Semiconductor Equipment |
14.2% |
| Footnote |
Description |
Footnote* |
Net of other assets less liabilities | |
|
| Largest Holdings [Text Block] |
Microsoft Corp. |
7.6% |
Amazon.com, Inc. |
6.4% |
NVIDIA Corp. |
6.1% |
Meta Platforms, Inc., Class A |
5.2% |
Taiwan Semiconductor Manufacturing Co. Ltd. |
5.2% |
Alphabet, Inc., Class A |
4.7% |
Berkshire Hathaway, Inc., Class B |
4.6% |
JPMorgan Chase & Co. |
4.2% |
Spotify Technology SA |
4.1% |
ServiceNow, Inc. |
4.0% | |
|
| Material Fund Change [Text Block] |
Effective July 1, 2025, the Fund had the following material changes, which were reported in a supplement to the Fund's prospectus. For more information, you may review the Fund's prospectus at im.natixis.com/funddocuments or upon request at (800) 225-5478 or through your financial intermediary. Fees: The advisory fee rate was reduced from 0.70% to 0.66% and the sub-advisory fee rate was reduced from 0.47% to 0.4425%. |
|
| Material Fund Change Expenses [Text Block] |
Fees: The advisory fee rate was reduced from 0.70% to 0.66% and the sub-advisory fee rate was reduced from 0.47% to 0.4425%.
|
|
| Summary of Change Legend [Text Block] |
Effective July 1, 2025, the Fund had the following material changes, which were reported in a supplement to the Fund's prospectus. For more information, you may review the Fund's prospectus at im.natixis.com/funddocuments or upon request at (800) 225-5478 or through your financial intermediary.
|
|
| Updated Prospectus Phone Number |
(800) 225-5478
|
|
| Updated Prospectus Web Address |
<span style="box-sizing: border-box; color: rgb(0, 0, 0); display: inline; flex-wrap: nowrap; font-size: 10.6667px; font-weight: 400; grid-area: auto; line-height: 16px; margin: 0px; overflow: visible; text-align: left; text-align-last: auto; white-space-collapse: preserve-breaks;">im.natixis.com/funddocuments</span>
|
|
| C000115832 |
|
|
| Shareholder Report [Line Items] |
|
|
| Fund Name |
Vaughan Nelson Select Fund
|
|
| Class Name |
Class C
|
|
| Trading Symbol |
VNSCX
|
|
| Annual or Semi-Annual Statement [Text Block] |
This semi-annual shareholder report contains important information about Vaughan Nelson Select Fund for the period of December 1, 2024 to May 31, 2025.
|
|
| Shareholder Report Annual or Semi-Annual |
Semi-annual Shareholder Report
|
|
| Additional Information [Text Block] |
You can find additional information (including tax information) about the Fund at im.natixis.com/funddocuments. You can also request the information by contacting us at (800) 225-5478 or by contacting your financial intermediary directly.
|
|
| Material Fund Change Notice [Text Block] |
This report describes changes to the Fund that occurred during the reporting period.
|
|
| Additional Information Phone Number |
(800) 225-5478
|
|
| Additional Information Website |
<span style="box-sizing: border-box; color: rgb(0, 0, 0); display: inline; flex-wrap: nowrap; font-size: 12px; font-weight: 400; grid-area: auto; line-height: 18px; margin: 0px; overflow: visible; text-align: left; text-align-last: auto; white-space-collapse: preserve-breaks;">im.natixis.com/funddocuments</span>
|
|
| Expenses [Text Block] |
What were the fund costs for the last six months? (based on a hypothetical $10,000 investment)
Class Name |
Costs of a $10,000 investment |
Costs paid as a percentage of a $10,000 investmentFootnote Reference† |
Class C |
$90 |
1.85% |
| Footnote |
Description |
Footnote† |
Annualized for periods less than one year (if applicable). | |
|
| Expenses Paid, Amount |
$ 90
|
|
| Expense Ratio, Percent |
1.85%
|
|
| Material Change Date |
|
Jul. 01, 2025
|
| AssetsNet |
$ 551,060,839
|
|
| Holdings Count | Holding |
27
|
|
| Advisory Fees Paid, Amount |
$ 2,255,971
|
|
| InvestmentCompanyPortfolioTurnover |
44.00%
|
|
| Additional Fund Statistics [Text Block] |
- Total Net Assets$551,060,839
- # of Portfolio Holdings (including overnight repurchase agreements)27
- Portfolio Turnover Rate44%
- Total Advisory Fees Paid (after waiver/reimbursement, if applicable)$2,255,971
|
|
| Holdings [Text Block] |
Value |
Value |
Other investments less than 3% of net assetsFootnote Reference* |
12.7% |
Short-Term Investments |
1.7% |
Specialty Retail |
3.1% |
Capital Markets |
3.1% |
Electrical Equipment |
3.2% |
Trading Companies & Distributors |
3.2% |
Chemicals |
3.5% |
Food Products |
3.7% |
Pharmaceuticals |
3.8% |
Banks |
4.2% |
Oil, Gas & Consumable Fuels |
4.6% |
Financial Services |
4.6% |
Broadline Retail |
6.4% |
Entertainment |
6.5% |
Interactive Media & Services |
9.9% |
Software |
11.6% |
Semiconductors & Semiconductor Equipment |
14.2% |
| Footnote |
Description |
Footnote* |
Net of other assets less liabilities | |
|
| Largest Holdings [Text Block] |
Microsoft Corp. |
7.6% |
Amazon.com, Inc. |
6.4% |
NVIDIA Corp. |
6.1% |
Meta Platforms, Inc., Class A |
5.2% |
Taiwan Semiconductor Manufacturing Co. Ltd. |
5.2% |
Alphabet, Inc., Class A |
4.7% |
Berkshire Hathaway, Inc., Class B |
4.6% |
JPMorgan Chase & Co. |
4.2% |
Spotify Technology SA |
4.1% |
ServiceNow, Inc. |
4.0% | |
|
| Material Fund Change [Text Block] |
Effective July 1, 2025, the Fund had the following material changes, which were reported in a supplement to the Fund's prospectus. For more information, you may review the Fund's prospectus at im.natixis.com/funddocuments or upon request at (800) 225-5478 or through your financial intermediary. Fees: The advisory fee rate was reduced from 0.70% to 0.66% and the sub-advisory fee rate was reduced from 0.47% to 0.4425%. |
|
| Material Fund Change Expenses [Text Block] |
Fees: The advisory fee rate was reduced from 0.70% to 0.66% and the sub-advisory fee rate was reduced from 0.47% to 0.4425%.
|
|
| Summary of Change Legend [Text Block] |
Effective July 1, 2025, the Fund had the following material changes, which were reported in a supplement to the Fund's prospectus. For more information, you may review the Fund's prospectus at im.natixis.com/funddocuments or upon request at (800) 225-5478 or through your financial intermediary.
|
|
| Updated Prospectus Phone Number |
(800) 225-5478
|
|
| Updated Prospectus Web Address |
<span style="box-sizing: border-box; color: rgb(0, 0, 0); display: inline; flex-wrap: nowrap; font-size: 10.6667px; font-weight: 400; grid-area: auto; line-height: 16px; margin: 0px; overflow: visible; text-align: left; text-align-last: auto; white-space-collapse: preserve-breaks;">im.natixis.com/funddocuments</span>
|
|
| C000188120 |
|
|
| Shareholder Report [Line Items] |
|
|
| Fund Name |
Vaughan Nelson Select Fund
|
|
| Class Name |
Class N
|
|
| Trading Symbol |
VNSNX
|
|
| Annual or Semi-Annual Statement [Text Block] |
This semi-annual shareholder report contains important information about Vaughan Nelson Select Fund for the period of December 1, 2024 to May 31, 2025.
|
|
| Shareholder Report Annual or Semi-Annual |
Semi-annual Shareholder Report
|
|
| Additional Information [Text Block] |
You can find additional information (including tax information) about the Fund at im.natixis.com/funddocuments. You can also request the information by contacting us at (800) 225-5478 or by contacting your financial intermediary directly.
|
|
| Material Fund Change Notice [Text Block] |
This report describes changes to the Fund that occurred during the reporting period.
|
|
| Additional Information Phone Number |
(800) 225-5478
|
|
| Additional Information Website |
<span style="box-sizing: border-box; color: rgb(0, 0, 0); display: inline; flex-wrap: nowrap; font-size: 12px; font-weight: 400; grid-area: auto; line-height: 18px; margin: 0px; overflow: visible; text-align: left; text-align-last: auto; white-space-collapse: preserve-breaks;">im.natixis.com/funddocuments</span>
|
|
| Expenses [Text Block] |
What were the fund costs for the last six months? (based on a hypothetical $10,000 investment)
Class Name |
Costs of a $10,000 investment |
Costs paid as a percentage of a $10,000 investmentFootnote Reference† |
Class N |
$36 |
0.73% |
| Footnote |
Description |
Footnote† |
Annualized for periods less than one year (if applicable). | |
|
| Expenses Paid, Amount |
$ 36
|
|
| Expense Ratio, Percent |
0.73%
|
|
| Material Change Date |
|
Jul. 01, 2025
|
| AssetsNet |
$ 551,060,839
|
|
| Holdings Count | Holding |
27
|
|
| Advisory Fees Paid, Amount |
$ 2,255,971
|
|
| InvestmentCompanyPortfolioTurnover |
44.00%
|
|
| Additional Fund Statistics [Text Block] |
- Total Net Assets$551,060,839
- # of Portfolio Holdings (including overnight repurchase agreements)27
- Portfolio Turnover Rate44%
- Total Advisory Fees Paid (after waiver/reimbursement, if applicable)$2,255,971
|
|
| Holdings [Text Block] |
Value |
Value |
Other investments less than 3% of net assetsFootnote Reference* |
12.7% |
Short-Term Investments |
1.7% |
Specialty Retail |
3.1% |
Capital Markets |
3.1% |
Electrical Equipment |
3.2% |
Trading Companies & Distributors |
3.2% |
Chemicals |
3.5% |
Food Products |
3.7% |
Pharmaceuticals |
3.8% |
Banks |
4.2% |
Oil, Gas & Consumable Fuels |
4.6% |
Financial Services |
4.6% |
Broadline Retail |
6.4% |
Entertainment |
6.5% |
Interactive Media & Services |
9.9% |
Software |
11.6% |
Semiconductors & Semiconductor Equipment |
14.2% |
| Footnote |
Description |
Footnote* |
Net of other assets less liabilities | |
|
| Largest Holdings [Text Block] |
Microsoft Corp. |
7.6% |
Amazon.com, Inc. |
6.4% |
NVIDIA Corp. |
6.1% |
Meta Platforms, Inc., Class A |
5.2% |
Taiwan Semiconductor Manufacturing Co. Ltd. |
5.2% |
Alphabet, Inc., Class A |
4.7% |
Berkshire Hathaway, Inc., Class B |
4.6% |
JPMorgan Chase & Co. |
4.2% |
Spotify Technology SA |
4.1% |
ServiceNow, Inc. |
4.0% | |
|
| Material Fund Change [Text Block] |
Effective July 1, 2025, the Fund had the following material changes, which were reported in a supplement to the Fund's prospectus. For more information, you may review the Fund's prospectus at im.natixis.com/funddocuments or upon request at (800) 225-5478 or through your financial intermediary. Fees: The advisory fee rate was reduced from 0.70% to 0.66% and the sub-advisory fee rate was reduced from 0.47% to 0.4425%. |
|
| Material Fund Change Expenses [Text Block] |
Fees: The advisory fee rate was reduced from 0.70% to 0.66% and the sub-advisory fee rate was reduced from 0.47% to 0.4425%.
|
|
| Summary of Change Legend [Text Block] |
Effective July 1, 2025, the Fund had the following material changes, which were reported in a supplement to the Fund's prospectus. For more information, you may review the Fund's prospectus at im.natixis.com/funddocuments or upon request at (800) 225-5478 or through your financial intermediary.
|
|
| Updated Prospectus Phone Number |
(800) 225-5478
|
|
| Updated Prospectus Web Address |
<span style="box-sizing: border-box; color: rgb(0, 0, 0); display: inline; flex-wrap: nowrap; font-size: 10.6667px; font-weight: 400; grid-area: auto; line-height: 16px; margin: 0px; overflow: visible; text-align: left; text-align-last: auto; white-space-collapse: preserve-breaks;">im.natixis.com/funddocuments</span>
|
|
| C000115833 |
|
|
| Shareholder Report [Line Items] |
|
|
| Fund Name |
Vaughan Nelson Select Fund
|
|
| Class Name |
Class Y
|
|
| Trading Symbol |
VNSYX
|
|
| Annual or Semi-Annual Statement [Text Block] |
This semi-annual shareholder report contains important information about Vaughan Nelson Select Fund for the period of December 1, 2024 to May 31, 2025.
|
|
| Shareholder Report Annual or Semi-Annual |
Semi-annual Shareholder Report
|
|
| Additional Information [Text Block] |
You can find additional information (including tax information) about the Fund at im.natixis.com/funddocuments. You can also request the information by contacting us at (800) 225-5478 or by contacting your financial intermediary directly.
|
|
| Material Fund Change Notice [Text Block] |
This report describes changes to the Fund that occurred during the reporting period.
|
|
| Additional Information Phone Number |
(800) 225-5478
|
|
| Additional Information Website |
<span style="box-sizing: border-box; color: rgb(0, 0, 0); display: inline; flex-wrap: nowrap; font-size: 12px; font-weight: 400; grid-area: auto; line-height: 18px; margin: 0px; overflow: visible; text-align: left; text-align-last: auto; white-space-collapse: preserve-breaks;">im.natixis.com/funddocuments</span>
|
|
| Expenses [Text Block] |
What were the fund costs for the last six months? (based on a hypothetical $10,000 investment)
Class Name |
Costs of a $10,000 investment |
Costs paid as a percentage of a $10,000 investmentFootnote Reference† |
Class Y |
$41 |
0.85% |
| Footnote |
Description |
Footnote† |
Annualized for periods less than one year (if applicable). | |
|
| Expenses Paid, Amount |
$ 41
|
|
| Expense Ratio, Percent |
0.85%
|
|
| Material Change Date |
|
Jul. 01, 2025
|
| AssetsNet |
$ 551,060,839
|
|
| Holdings Count | Holding |
27
|
|
| Advisory Fees Paid, Amount |
$ 2,255,971
|
|
| InvestmentCompanyPortfolioTurnover |
44.00%
|
|
| Additional Fund Statistics [Text Block] |
- Total Net Assets$551,060,839
- # of Portfolio Holdings (including overnight repurchase agreements)27
- Portfolio Turnover Rate44%
- Total Advisory Fees Paid (after waiver/reimbursement, if applicable)$2,255,971
|
|
| Holdings [Text Block] |
Value |
Value |
Other investments less than 3% of net assetsFootnote Reference* |
12.7% |
Short-Term Investments |
1.7% |
Specialty Retail |
3.1% |
Capital Markets |
3.1% |
Electrical Equipment |
3.2% |
Trading Companies & Distributors |
3.2% |
Chemicals |
3.5% |
Food Products |
3.7% |
Pharmaceuticals |
3.8% |
Banks |
4.2% |
Oil, Gas & Consumable Fuels |
4.6% |
Financial Services |
4.6% |
Broadline Retail |
6.4% |
Entertainment |
6.5% |
Interactive Media & Services |
9.9% |
Software |
11.6% |
Semiconductors & Semiconductor Equipment |
14.2% |
| Footnote |
Description |
Footnote* |
Net of other assets less liabilities | |
|
| Largest Holdings [Text Block] |
Microsoft Corp. |
7.6% |
Amazon.com, Inc. |
6.4% |
NVIDIA Corp. |
6.1% |
Meta Platforms, Inc., Class A |
5.2% |
Taiwan Semiconductor Manufacturing Co. Ltd. |
5.2% |
Alphabet, Inc., Class A |
4.7% |
Berkshire Hathaway, Inc., Class B |
4.6% |
JPMorgan Chase & Co. |
4.2% |
Spotify Technology SA |
4.1% |
ServiceNow, Inc. |
4.0% | |
|
| Material Fund Change [Text Block] |
Effective July 1, 2025, the Fund had the following material changes, which were reported in a supplement to the Fund's prospectus. For more information, you may review the Fund's prospectus at im.natixis.com/funddocuments or upon request at (800) 225-5478 or through your financial intermediary. Fees: The advisory fee rate was reduced from 0.70% to 0.66% and the sub-advisory fee rate was reduced from 0.47% to 0.4425%. |
|
| Material Fund Change Expenses [Text Block] |
Fees: The advisory fee rate was reduced from 0.70% to 0.66% and the sub-advisory fee rate was reduced from 0.47% to 0.4425%.
|
|
| Summary of Change Legend [Text Block] |
Effective July 1, 2025, the Fund had the following material changes, which were reported in a supplement to the Fund's prospectus. For more information, you may review the Fund's prospectus at im.natixis.com/funddocuments or upon request at (800) 225-5478 or through your financial intermediary.
|
|
| Updated Prospectus Phone Number |
(800) 225-5478
|
|
| Updated Prospectus Web Address |
<span style="box-sizing: border-box; color: rgb(0, 0, 0); display: inline; flex-wrap: nowrap; font-size: 10.6667px; font-weight: 400; grid-area: auto; line-height: 16px; margin: 0px; overflow: visible; text-align: left; text-align-last: auto; white-space-collapse: preserve-breaks;">im.natixis.com/funddocuments</span>
|
|