As the Fund is new and has not commenced operations as of the date of this prospectus, performance information for the Fund is not available. For updated performance information, please visit www.aberdeeninvestments.com/usa/etf or call 844-383-7289.
The bar chart and table below can help you evaluate potential risks of the Fund. It is currently contemplated that before the Fund commences operations, all of the assets of another investment company advised by abrdn Inc. and sub-advised by abrdn Investments Limited, abrdn International Small Cap Fund (the "Predecessor Fund"), will be transferred to the Fund in a tax-free reorganization. It is currently contemplated that the reorganization, which does not require the approval of shareholders of the Fund or the Predecessor Fund, will occur on or around October 17, 2025. The Fund has the same investment objective and strategies as those of the Predecessor Fund.
The bar chart shows how the performance of the Fund’s Shares (represented by the performance of the Predecessor Fund’s Institutional Class Shares) has varied from year to year. The table compares the Fund’s average annual total returns (represented by the performance of the Predecessor Fund’s Institutional Class Shares) to the returns of the MSCI AC World ex-USA Index (Net Total Return (“Net TR”)), a broad-based securities index, and the MSCI All Country World ex-USA Small Cap Index (Net TR). Remember, however, that past performance (before and after taxes) is not necessarily indicative of how the Fund will perform in the future. For updated performance information, please visit www.aberdeeninvestments.com/usa/etf or call 844-383-7289.
The Predecessor Fund changed its investment strategy effective February 29, 2016. Performance information for periods prior to February 29, 2016 does not reflect the current investment strategy. In connection with the change in investment strategy, the Predecessor Fund changed its name from Aberdeen Global Small Cap Fund to Aberdeen International Small Cap Fund.
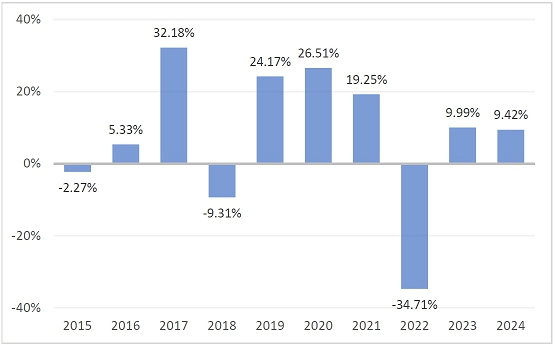
Calendar Year-to-Date Total Return as of June 30, 2025: 18.19%
Highest Return: 26.58% – 2nd quarter 2020
Lowest Return: -25.77% – 1st quarter 2020
After-tax returns are shown in the following table for Institutional Class Shares. After-tax returns are calculated using the historical highest individual federal marginal income tax rates in effect and do not reflect the impact of state and local taxes. Your actual after-tax return depends on your personal tax situation and may differ from what is shown here. After-tax returns are not relevant to investors in tax-deferred arrangements, such as individual retirement accounts, 401(k) plans or certain other employer-sponsored retirement plans.
| 1 Year | 5 Years | 10 Years | ||||||||||
| Institutional Class Shares – Before Taxes | 9.42 | % | 3.46 | % | 6.15 | % | ||||||
| Institutional Class Shares – After Taxes on Distributions | 8.88 | % | 2.75 | % | 4.68 | % | ||||||
| Institutional Class Shares – After Taxes on Distributions and Sales of Shares | 6.12 | % | 2.61 | % | 4.49 | % | ||||||
| MSCI AC World ex-USA Index (Net TR) (reflects deductions for expenses and taxes)(1) | 7.50 | % | 1.70 | % | 3.64 | % | ||||||
MSCI AC World ex-USA Small Cap Index (Net TR) (reflects deductions for expenses and taxes)(2) | 3.36 | % | 4.30 | % | 5.66 | % | ||||||
(1) MSCI AC World ex-USA Index (Net TR) is an index that is designed to measure large and mid cap representation across developed markets countries (excluding the US) and emerging markets countries.
(2) MSCI AC World ex-USA Small Cap Index (Net TR) is an index that is designed to measure small cap representation across developed markets countries (excluding the United States).