The abrdn International Small Cap Active ETF (the “International Small Cap Active ETF” or the “Fund”) seeks long-term growth of capital.
The following table describes the fees and expenses you may pay if you buy, hold and sell shares of the Fund (“Shares”). You may pay other fees, such as brokerage commissions and other fees to financial intermediaries, which are not reflected in the table and example below.
| Annual Fund Operating Expenses (expenses that you pay each year as a percentage of the value of your investment) | ||||
| Management Fees | 0.70 | % | ||
| Distribution Fees | None | |||
| Other Expenses(1) | 0.31 | % | ||
| Acquired Fund Fees and Expenses(2) | 0.04 | % | ||
| Total Annual Fund Operating Expenses | 1.05 | % | ||
| Less: Amount of Fee Limitations/Expense Reimbursements(3) | 0.35 | % | ||
| Total Annual Fund Operating Expenses After Fee Limitations/Expense Reimbursements | 0.70 | % | ||
| (1) | “Other Expenses” have been estimated to reflect expenses expected to be incurred by the Fund for the current fiscal year. |
| (2) | Acquired fund fees and expenses are indirect fees and expenses that the Fund incurs from investing in the shares of other mutual funds, including money market funds and exchange traded funds. |
| (3) | The Trust and the Adviser have entered into a written contract limiting total annual fund operating expenses of the Fund to 0.70%, except for certain expenses as described below. This contractual limitation may not be terminated before February 28, 2028 without the approval of the Independent Trustees of the Board. This limit excludes (i) interest, taxes, brokerage fees and short sale dividend expenses; (ii) expenses incurred indirectly by the Fund as a result of investments in short term investment vehicles such as money market funds that do not exceed 0.005% of a Fund’s average net assets (“acquired fund fees and expenses” or “AFFE”) (but includes AFFE for other investment companies and pooled investment vehicles); and (iii) extraordinary expenses, if any. The Trust is authorized to reimburse the Adviser for management fees previously limited and/or for expenses previously paid by the Adviser, provided, however, that any reimbursements must be paid at a date not more than three years after the date when the Adviser limited the fees or reimbursed the expenses and the reimbursements do not cause the Fund to exceed the lesser of the applicable expense limitation in the contract at the time the fees were limited or expenses are paid or the applicable expense limitation in effect at the time the expenses are being recouped by the Adviser. |
This Example is intended to help you compare the cost of investing in the International Small Cap Active ETF with the cost of investing in other funds.
The Example assumes that you invest $10,000 in the Fund for the time periods indicated and then sell all of your Shares at the end of those periods. The Example also assumes that your investment has a 5% return each year and that the Fund’s operating expenses remain the same each year (taking into account the contractual fee limitation until its expiration). Although your actual costs may be higher or lower, based on these assumptions your costs would be:
| 1 Year | 3 Years | 5 Years | 10 Years | |||||||||||
| $ | 72 | $ | 249 | $ | 496 | $ | 1,208 | |||||||
The Fund pays transaction costs, such as commissions, when it buys and sells securities (or “turns over” its portfolio). A higher portfolio turnover rate may indicate higher transaction costs and may result in higher taxes when Shares are held in a taxable account. These costs, which are not reflected in annual fund operating expenses or in the Example, affect the Fund’s performance. During the most recent fiscal year of Predecessor Fund (as defined below), the Predecessor Fund’s portfolio turnover rate was 32% of the average value of its portfolio.
The International Small Cap Active ETF seeks to achieve its objective by investing primarily in equity securities of small non-U.S. companies. Equity securities include, but are not limited to, common stock, preferred stock and depositary receipts. As a nonfundamental policy, under normal market conditions, the Fund will invest at least 80% of the value of its net assets, plus any borrowings for investment purposes, in equity securities of non-U.S. small companies. For purposes of the Fund’s 80% policy, a company is considered to be a non-U.S. company if Fund management determines that the company meets one or more of the following criteria:
| ● | the company is organized under the laws of a country outside the U.S.; |
| ● | the company has its principal office in, or management is located in, a country outside the U.S.; and/or | |
| ● | the company has its principal securities trading market in a country outside the U.S. |
The Fund considers a “small” company to be one whose market capitalization is within the range of capitalizations of companies in the MSCI All Country World ex-USA Small Cap Index at the time of purchase. As of May 31, 2025, the MSCI All Country World ex-USA Small Cap Index included companies with market capitalizations up to $14.99 billion.
The Fund may invest in companies of any size provided the Fund’s 80% policy is met. As a result, the Fund’s average market capitalization may sometimes exceed that of the largest company in the MSCI All Country World ex-USA Small Cap Index.
Under normal circumstances, a number of countries around the world will be represented in the Fund’s portfolio, some of which may be considered to be emerging market countries. At times, the Fund may have a significant amount of its assets invested in a country or geographic region, including through an exchange-traded fund. The Fund currently anticipates that it will invest a significant amount of its assets in securities economically tied to the United Kingdom and Japan.
The Fund may invest in securities denominated in U.S. Dollars and the currencies of the foreign countries in which it may invest. The Fund typically has full currency exposure to those markets in which it invests.
The Fund may invest in securities of any market sector and may hold a significant amount of securities of companies, from time to time, within a single sector. The Fund currently anticipates that it will have significant exposure to the industrials and information technology sectors.
The Fund may invest:
| ● | up to 20% of net assets in debt securities; | |
| ● | up to 10% of net assets in private funds that invest in private equity and in venture-capital companies; | |
| ● | up to 35% of net assets in emerging markets securities; and | |
| ● | without limit in foreign securities. |
In seeking to achieve the Fund’s investment objective, the Adviser and Sub-adviser (together, the “Advisers”) select stocks for the Fund using the portfolio management team’s quality, growth and momentum approach, which aims to identify companies that, in the Advisers’ view, exhibit a range of high-quality characteristics, the ability to deliver sustainable, multiyear growth and upwards momentum. When assessing quality, the Adviser and Sub-adviser evaluate every company against quality criteria and build conviction using a team-based approach and peer review process. The quality assessment covers five key factors: 1) the durability of the business model, 2) the attractiveness of the industry, 3) the strength of financials, 4) the capability of management, and 5) the most material environmental, social and governance (“ESG”) factors impacting a company. Not every ESG factor may be identified or evaluated for every investment. ESG characteristics are not the only factors considered and, as a result, the issuers in which the Fund invests may not be issuers with favorable ESG characteristics or high ESG ratings. As ESG information is just one investment consideration, ESG considerations generally are not solely determinative in any investment decision made by the Advisers. In assessing the growth outlook for stocks, the Advisers consider the industry backdrop, as well as management’s strategy to drive sales and profitability over the medium to long term. When looking at momentum, the Advisers consider both price momentum and earnings momentum. The investment team generally allows the weight of stocks with positive price and earnings momentum, which also meet its quality and growth criteria, to increase.
The bar chart and table below can help you evaluate potential risks of the Fund. It is currently contemplated that before the Fund commences operations, all of the assets of another investment company advised by abrdn Inc. and sub-advised by abrdn Investments Limited, abrdn International Small Cap Fund (the "Predecessor Fund"), will be transferred to the Fund in a tax-free reorganization. It is currently contemplated that the reorganization, which does not require the approval of shareholders of the Fund or the Predecessor Fund, will occur on or around October 17, 2025. The Fund has the same investment objective and strategies as those of the Predecessor Fund.
The bar chart shows how the performance of the Fund’s Shares (represented by the performance of the Predecessor Fund’s Institutional Class Shares) has varied from year to year. The table compares the Fund’s average annual total returns (represented by the performance of the Predecessor Fund’s Institutional Class Shares) to the returns of the MSCI AC World ex-USA Index (Net Total Return (“Net TR”)), a broad-based securities index, and the MSCI All Country World ex-USA Small Cap Index (Net TR). Remember, however, that past performance (before and after taxes) is not necessarily indicative of how the Fund will perform in the future. For updated performance information, please visit www.aberdeeninvestments.com/usa/etf or call 844-383-7289.
The Predecessor Fund changed its investment strategy effective February 29, 2016. Performance information for periods prior to February 29, 2016 does not reflect the current investment strategy. In connection with the change in investment strategy, the Predecessor Fund changed its name from Aberdeen Global Small Cap Fund to Aberdeen International Small Cap Fund.
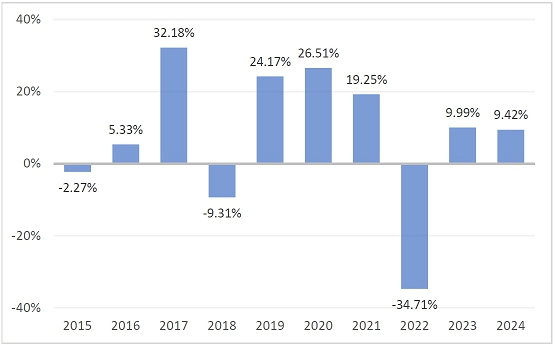
Calendar Year-to-Date Total Return as of June 30, 2025: 18.19%
Highest Return: 26.58% – 2nd quarter 2020
Lowest Return: -25.77% – 1st quarter 2020
After-tax returns are shown in the following table for Institutional Class Shares. After-tax returns are calculated using the historical highest individual federal marginal income tax rates in effect and do not reflect the impact of state and local taxes. Your actual after-tax return depends on your personal tax situation and may differ from what is shown here. After-tax returns are not relevant to investors in tax-deferred arrangements, such as individual retirement accounts, 401(k) plans or certain other employer-sponsored retirement plans.
| 1 Year | 5 Years | 10 Years | ||||||||||
| Institutional Class Shares – Before Taxes | 9.42 | % | 3.46 | % | 6.15 | % | ||||||
| Institutional Class Shares – After Taxes on Distributions | 8.88 | % | 2.75 | % | 4.68 | % | ||||||
| Institutional Class Shares – After Taxes on Distributions and Sales of Shares | 6.12 | % | 2.61 | % | 4.49 | % | ||||||
| MSCI AC World ex-USA Index (Net TR) (reflects deductions for expenses and taxes)(1) | 7.50 | % | 1.70 | % | 3.64 | % | ||||||
MSCI AC World ex-USA Small Cap Index (Net TR) (reflects deductions for expenses and taxes)(2) | 3.36 | % | 4.30 | % | 5.66 | % | ||||||
(1) MSCI AC World ex-USA Index (Net TR) is an index that is designed to measure large and mid cap representation across developed markets countries (excluding the US) and emerging markets countries.
(2) MSCI AC World ex-USA Small Cap Index (Net TR) is an index that is designed to measure small cap representation across developed markets countries (excluding the United States).