| | | | | | | | |
Dear
Shareholders, | | Philip Moyer, CEO . |
At the halfway mark of 2025, I am pleased to report that Vimeo is delivering on the promise of turning towards profitable, accelerating revenue growth. We delivered strong results in Q2, and are entering the second half of the year with momentum. We are in two of the fastest growing technology markets, video and AI, and we have an exciting product roadmap and an inspiring customer base. Our team is as excited as ever about Vimeo’s future and potential to deliver for our shareholders.
Q2 2025 Highlights:
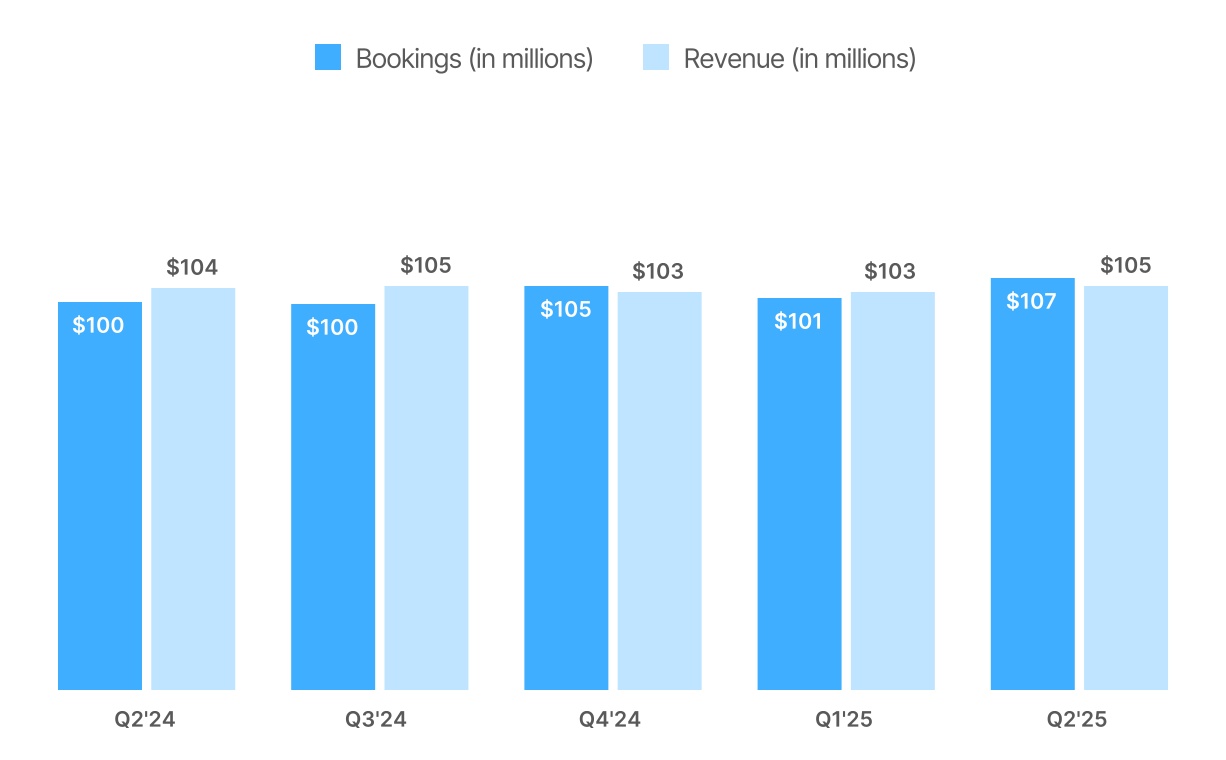
–Total Revenue was Flat Year-Over-Year, Up 2% Excluding Other - Vimeo Enterprise revenue rose 25% and Self-Serve revenue was down 1% year–over-year. We expect revenue growth for the rest of 2025 for both Self-Serve and Vimeo overall.
–Total Bookings Grew 6% - This was the highest growth in 3 years, the fourth sequential quarter of year-over-year growth in a row, and the third highest dollar value of bookings in Vimeo’s history (highest if you exclude Other).
–Self-Serve Bookings Increased 11% - This was also the highest growth rate in 3 years. Our pricing work continued to pay off, retention was stable, and AOV increased.
–Vimeo Enterprise Bookings Expanded 9% - A couple factors including one large customer churning out impacted this growth rate. Excluding those items, we estimate year-over-year bookings growth would have been in the mid teens.
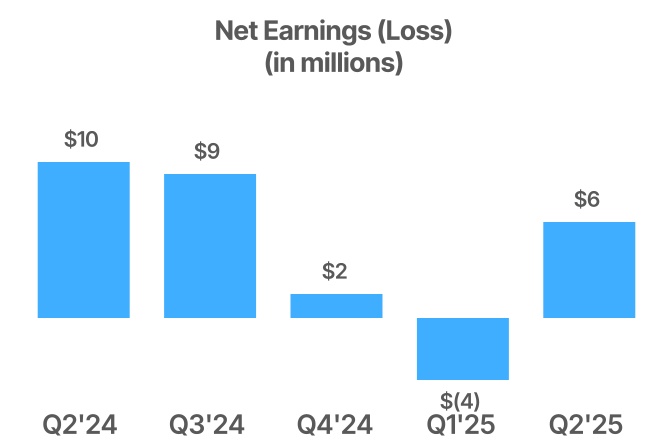
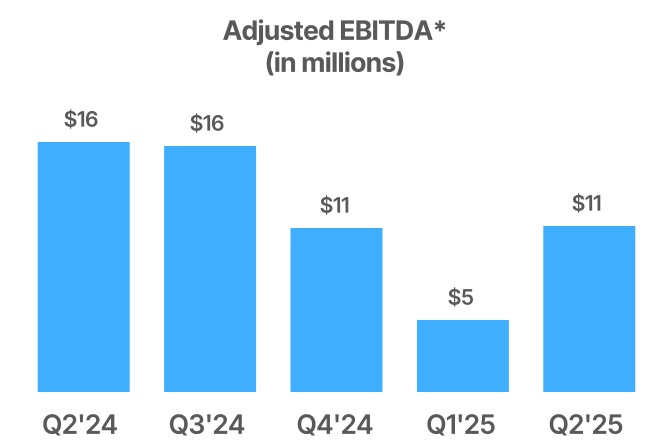
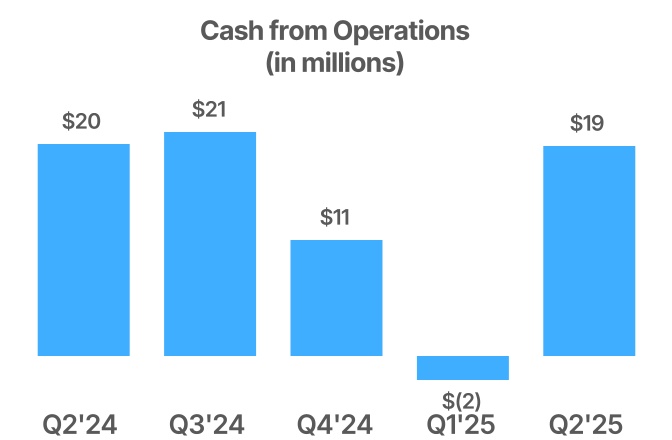
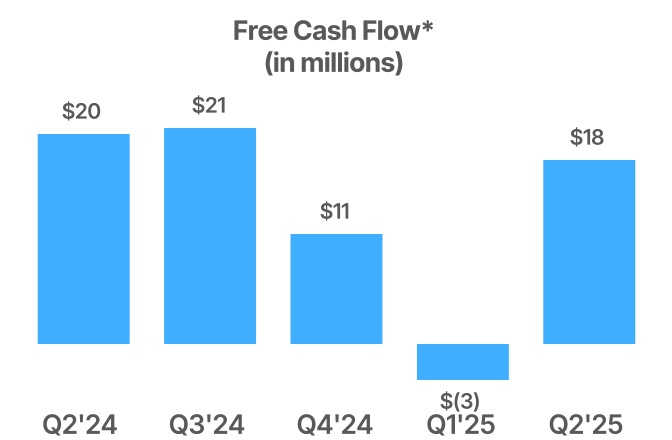
–Bottom Line Metrics Improved Sequentially - We have been more efficient with our investments than we forecasted, which improved all of our bottom line metrics sequentially - Net Income $6M, Adjusted EBITDA* $11M, Cash from Operations $19M and Free Cash Flow* $18M.
–The Pace of Innovation Accelerated - We released 35% of our 2025 product roadmap during Q2 and new product releases accelerated. We started to generate revenue and new pipeline from our discrete investments, including AI translations.
We are pleased with Q2 results. In the second half of 2025, we expect to continue to grow Self-Serve, re-accelerate Vimeo Enterprise bookings and continue to be efficient with our investments. Our enthusiasm for Self-Serve has increased and for Vimeo Enterprise it is unchanged. Vimeo Enterprise revenue grew 25% year-over-year in Q2 and our goal is to sustain 20%+ growth in this product, as we believe this slower period of bookings growth is temporary.
Our 2025 plan has been to accelerate revenue growth profitably, and we believe we are well on our way. We continue to hope to end the year with a line of sight to double-digit growth.
Thank you for your continued support and belief in Vimeo.
Sincerely,
Philip Moyer
Chief Executive Officer
*Please refer to the reconciliations of GAAP to non-GAAP measures starting on page 16.
2
Q2 Financial
Overview
Disclosure Update
Vimeo's operational changes have, and will likely continue to lead to adjustments in its disclosure framework, including the disaggregation of certain data and key operating metrics and our use of bookings as the only disclosed operating metric. Further reporting adjustments may be considered to align our disclosures to our core operating processes as they evolve, including changes involving merging OTT and Vimeo Enterprise operations, introducing consumption based revenue related to AI, and focusing the sales force on Revenue and Remaining Performance Obligation (“RPO”) metrics. We appreciate your understanding as we endeavor to properly align our disclosures to our core operating processes.
*Please refer to the reconciliations of GAAP to non-GAAP measures starting on page 16.
3
Total Bookings & Revenue
| | | | | | | | | | | | | | |
| Bookings year-over-year Change |
| (4)% | —% | 3% | 3% | 6% |
| Revenue year-over-year Change |
| 2% | (2)% | (2)% | (2)% | —% |
| | | | |
| | |
| | | | |
*Please refer to the reconciliations of GAAP to non-GAAP measures starting on page 16.
4
Vimeo
Enterprise
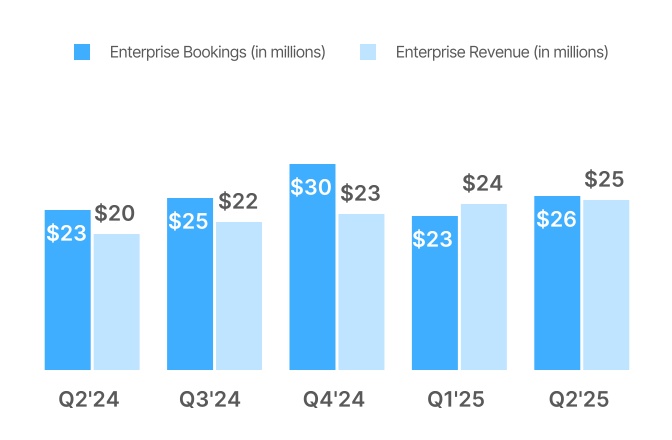
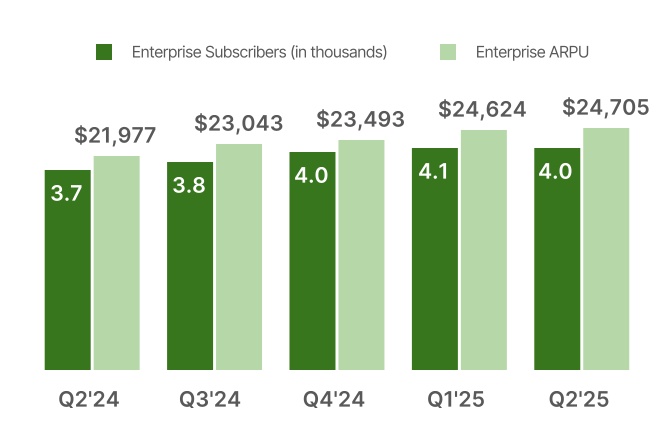
In Q2, Vimeo Enterprise revenue grew 25% year-over-year and bookings grew 9%, with a 10% increase in Subscribers and a 12% increase in ARPU. New bookings gained momentum in the quarter and were higher than expansion bookings, and overall renewal bookings grew year-over-year.
Notable new customers in the quarter included Jaguar Land Rover Limited, Spotify, and FanDuel.
We believe that Q2’s level of bookings growth can be improved and does not fully reflect the opportunity for bookings and revenue growth ahead. During Q2, we continued to work through changes to our sales approach and we have built a healthy H2 pipeline. We are also building better processes to retain and expand our customers.
We believe in this product as a growth driver for Vimeo because of the caliber of strategic conversations we are having with some of the world's largest brands, the number of deals we have won against our competitors, and our product velocity. In Q3 we are delivering some of our most important 2025 investments focused on enterprise customers. These enhancements already have a meaningful pipeline of customers. Additionally, in 2025 we have continued to sign some contracts with future revenue that are reflected in our RPO tracking but not in our quarterly bookings.
| | | | | | | | | | | | | | | | | | | | | | | | | | | | | | | | |
| Bookings year-over-year Change | | Subscribers year-over-year Change |
| 29% | 39% | 39% | 13% | 9% | | 33% | 26% | 19% | 11% | 10% |
| Revenue year-over-year Change | | ARPU year-over-year Change |
| 55% | 42% | 37% | 32% | 25% | | 12% | 11% | 12% | 16% | 12% |
| | | | | | | | | | |
| | | | | | | | |
| | | | | | | | | | |
*Please refer to the reconciliations of GAAP to non-GAAP measures starting on page 16.
5
Self-Serve
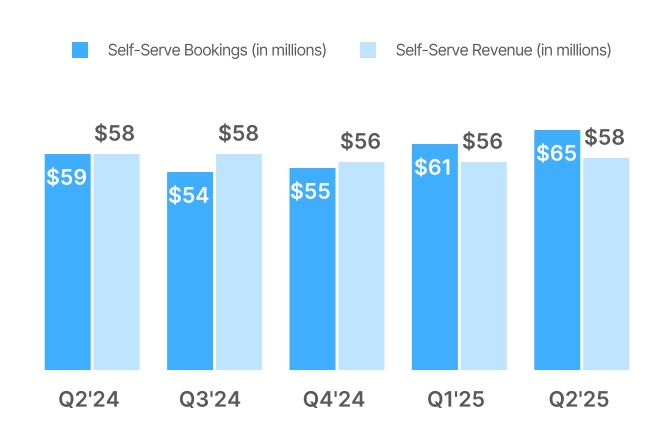
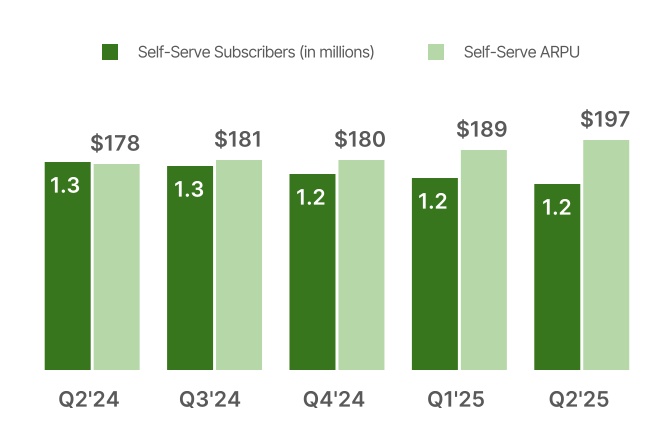
Momentum continued to build for Self-Serve in Q2 as we cut our rate of revenue decline to 1% from a peak decline of 9% in Q3 2023 and delivered 11% year-over-year growth in bookings. This was the second consecutive quarter of year-over-year bookings growth and the highest rate of growth in 14 quarters. This momentum was driven by successful price increases, improvements in new bookings growth rates, stable unit renewal rates and an ARPU increase of 11%.
As we enter Q3, we are prioritizing continued improvements with initiatives around new subscriber additions and bookings as well as increasing product engagement.
Our second-half roadmap includes modernizing video discovery with updated feeds and new community features to help users find relevant, inspiring content and connect with other creators. We are also simplifying professional workflows through enhanced video collaboration, improving efficiency and reducing friction in content creation, and introducing AI-driven search capabilities that understand video context for precise content discovery. Additionally, we are applying product-led growth best practices across all user flows to drive deeper engagement from the moment new users join the platform.
Our roadmap is designed to drive free-to-paid upgrades, grow our subscriber base, expand platform utility, and increase long-term user engagement and retention.
| | | | | | | | | | | | | | | | | | | | | | | | | | | | | | | | |
| Bookings year-over-year Change | | Subscribers year-over-year Change |
| (7)% | (5)% | (4)% | 6% | 11% | | (9)% | (9)% | (11)% | (11)% | (11)% |
| Revenue year-over-year Change | | ARPU year-over-year Change |
| (4)% | (4)% | (7)% | (5)% | (1)% | | 5% | 6% | 4% | 8% | 11% |
| | | | | | | | | | |
| | | | | | | | |
| | | | | | | | | | |
*Please refer to the reconciliations of GAAP to non-GAAP measures starting on page 16.
6
OTT, Add-Ons, & Other
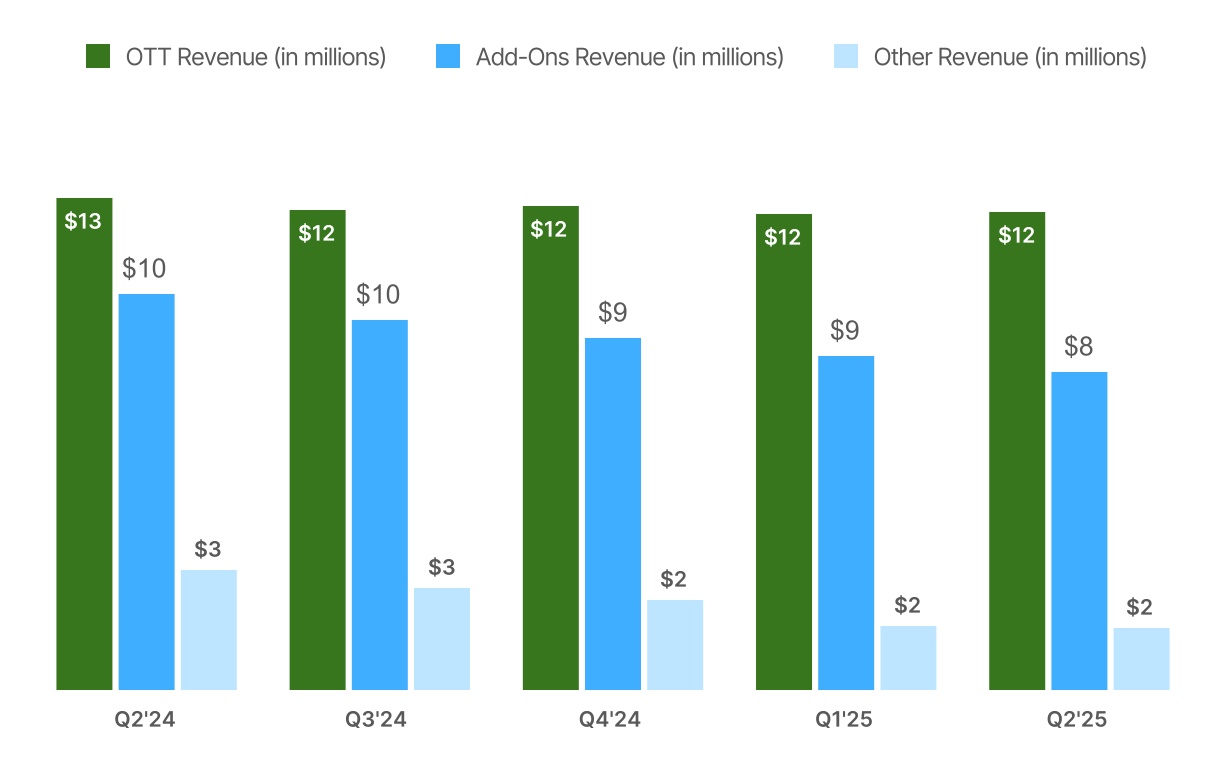
In Q2, OTT revenue fell 3% and bookings declined 2% year-over-year. We are optimistic about OTT's growth potential as we believe Vimeo is uniquely positioned to help creators grow their businesses. Q2 Add-Ons revenue declined 20% year-over-year. We expect that over time this product line will include meaningful contributions from our consumables innovations such as sales of AI credits and potentially other pay-as-you-go options for primitives like storage and bandwidth. Q2 Other revenue declined year-over-year, largely due to product deprecations.
| | | | | | | | | | | | | | |
| OTT Revenue year-over-year Change |
| (1)% | (13)% | (8)% | (6)% | (3)% |
| Add-Ons Revenue year-over-year Change |
| 5% | (17)% | (17)% | (21)% | (20)% |
| Other Revenue year-over-year Change |
| (41)% | (46)% | (41)% | (52)% | (48)% |
| | | | |
| | |
| | | | |
*Please refer to the reconciliations of GAAP to non-GAAP measures starting on page 16.
7
Expenses & Profitability
In Q2, we increased net income, Adjusted EBITDA*, cash from operations and Free Cash Flow* quarter-over-quarter. All measures were down year-over-year largely due to our growth investments.
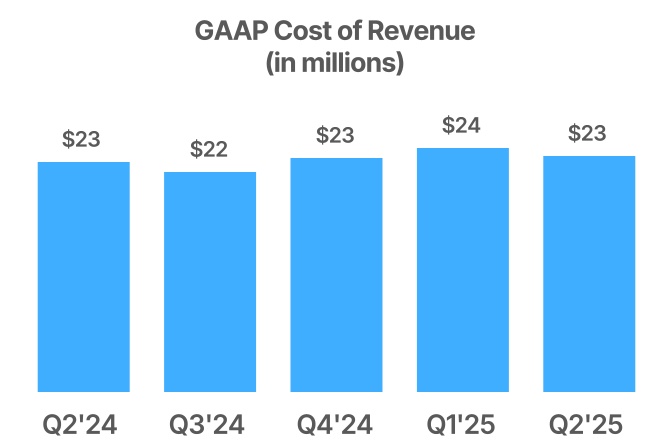
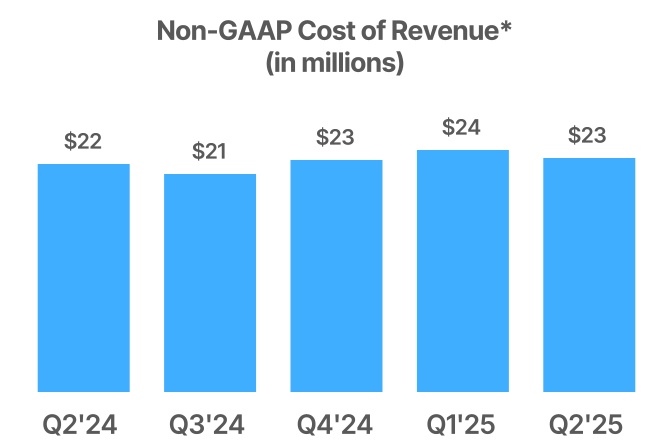
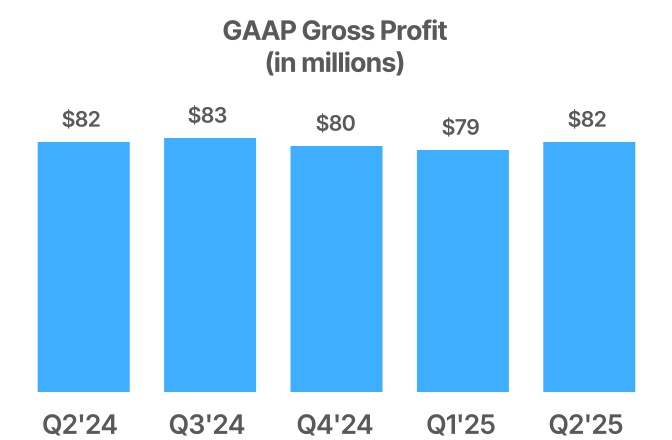
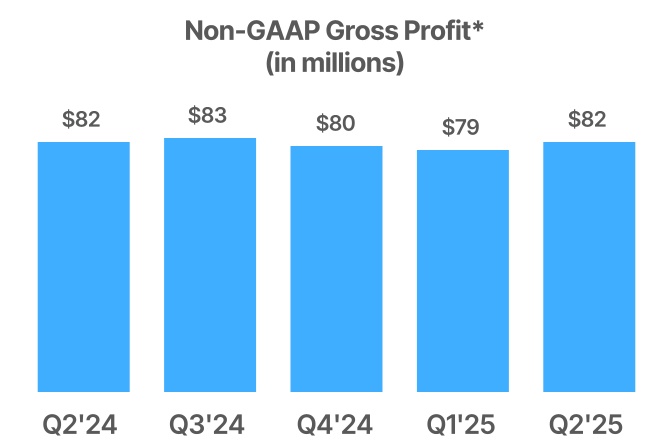
Vimeo’s gross profit margin remained strong at 78% on both a GAAP and non-GAAP* basis as hosting and credit card fees were essentially flat with the year ago period.
We continued to execute on our plan to invest in growth and innovation in Q2. That said, we have moderated the overall level of investment from our beginning of the year plans as we have fine-tuned expected returns and continued to scrutinize spend levels overall. Key areas of investment included payment infrastructure, AI, enterprise security, and innovative video formats. We saw solid initial indications of returns on our investments, especially in quick return areas like payment upgrades which have a direct and immediate impact on renewal rates.
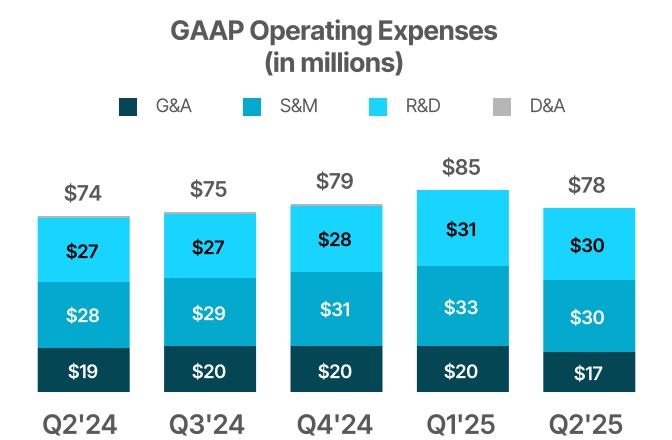
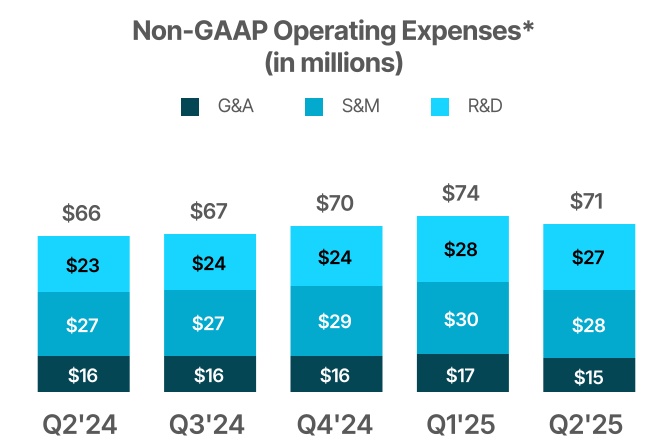
In Q2, GAAP and non-GAAP operating expenses* rose roughly 5% and 8%, respectively, year-over-year, led by R&D which grew 10% and 17% on a GAAP and non-GAAP* basis, respectively, largely due to growth investments. Sales and Marketing, spending growth was 9% and 6% on a GAAP and non-GAAP* basis, respectively, and General & Administrative spend was down 10% on a GAAP basis and down 2% on a non-GAAP* basis.
In the quarter, our GAAP operating expenses included restructuring costs of $1.5 million for adjustments as new leaders aligned and upgraded teams. Stock-based compensation expense was $5 million in Q2 down 39% year-over-year, reflecting our diligence on limiting dilution.
| | | | | | | | | | | | | | | | | | | | | | | | | | | | | | | | |
| Year-over-year Change | | Year-over-year Change |
| (1)% | —% | (2)% | 3% | 2% | | —% | —% | (1)% | 3% | 2% |
| | | | | | | | | | |
| | | | | | | | |
| | | | | | | | | | |
*Please refer to the reconciliations of GAAP to non-GAAP measures starting on page 16.
8
| | | | | | | | | | | | | | | | | | | | | | | | | | | | | | | | |
| Year-over-year Change | | Year-over-year Change |
| 3% | (2)% | (2)% | (3)% | —% | | 3% | (2)% | (3)% | (3)% | —% |
| | | | | | | | | | |
| | | | | | | | |
| | | | | | | | | | |
| | | | | | | | | | | | | | | | | | | | | | | | | | | | | | | | |
| Gross Margin | | Non-GAAP Gross Margin* |
| 78% | 79% | 78% | 77% | 78% | | 78% | 79% | 78% | 77% | 78% |
| | | | | | | | | | |
| | | | | | | | |
| | | | | | | | | | |
| | | | | | | | | | | | | | | | | | | | | | | | | | | | | | | | |
| Year-over-year Change | | Year-over-year Change |
| —% | (4)% | 3% | 8% | 5% | | (12)% | (7)% | 1% | 7% | 8% |
| | | | | | | | | | |
| | | | | | | | |
| | | | | | | | | | |
| | | | | | | | | | | | | | | | | | | | | | | | | | | | | | | | |
| Year-over-year Change | | Year-over-year Change |
| 72% | 10% | (82)% | (164)% | (38)% | | 225% | 25% | (19)% | (61)% | (33)% |
| | | | | | | | | | |
| | | | | | | | |
| | | | | | | | | | |
| | | | | | | | | | | | | | | | | | | | | | | | | | | | | | | | |
| Net Earnings (Loss) as a % of Revenue | | Adjusted EBITDA Margin* |
| 10% | 9% | 1% | (4)% | 6% | | 16% | 15% | 10% | 5% | 10% |
| | | | | | | | | | |
| | | | | | | | |
| | | | | | | | | | |
*Please refer to the reconciliations of GAAP to non-GAAP measures starting on page 16.
9
Balance Sheet &
Cash Flow Highlights
We ended Q2 with $303 million in cash and cash equivalents, up from the end of Q1 due to strong Self-Serve bookings, solid collections and lower operating expenses. Cash provided by operations was $19 million, and Free Cash Flow* was $18 million.
On April 29, 2025, our Board authorized an additional $50 million share repurchase program relating to our common stock (the “2025 Repurchase Program”). Under the 2025 Repurchase Program, our shares of common stock may be repurchased at any time or from time to time, without prior notice, subject to market conditions and other considerations. Such repurchases may be made through 10b5-1 plans, open market purchases, privately-negotiated transactions, block purchases or other transactions. We have no obligation to repurchase any shares under the 2025 Repurchase Program. The 2025 Repurchase Program does not have an expiration date and may be commenced, suspended, revoked or modified at any time.
Our shares outstanding as of the end of Q2 were 165.4 million, down from 166.6 million a year earlier.
| | | | | | | | | | | | | | | | | | | | | | | | | | | | | | | | |
| Year-over-year Change | | Year-over-year Change |
| 58% | 25% | 8% | (137)% | (2)% | | 55% | 26% | 8% | (149)% | (12)% |
| | | | | | | | | | |
| | | | | | | | |
| | | | | | | | | | |
Guidance
While the current economic environment requires vigilance, we continue to strive to deliver our 2025 guidance including:
•Acceleration of growth in 2025 with full year revenue growth in the low single digits, in line with previous guidance
•Full-year 2025 Operating income to be approximately $6 million, and
•Full year 2025 Adjusted EBITDA* of approximately $35 million, increased from a range of $25 million - $30 million previously
Additionally, we anticipate the following for the third quarter of 2025:
•Revenue of close to $106 million, Operating income approximately $2 million, and Adjusted EBITDA* of approximately $9 million.
*Please refer to the reconciliations of GAAP to non-GAAP measures starting on page 16.
10
Video Conference Call
Vimeo will live stream a video conference to answer questions regarding its second quarter results on Monday, August 4, 2025, at 5:00 p.m. Eastern Time. This live stream will include disclosure of certain information, including forward-looking information, which may be material to an investor’s understanding of Vimeo’s business. The live stream will be open to the public at https://www.vimeo.com/investors.
*Please refer to the reconciliations of GAAP to non-GAAP measures starting on page 16.
11
| | | | | | | | | | | | | | | | | | | | | | | |
| GAAP FINANCIAL STATEMENTS |
| VIMEO, INC. CONSOLIDATED STATEMENT OF OPERATIONS |
| ($ in thousands except per share data) |
| (Unaudited) |
| | | | | | | |
| Three Months Ended June 30, | | Six Months Ended June 30, |
| 2025 | | 2024 | | 2025 | | 2024 |
| Revenue | $ | 104,650 | | | $ | 104,376 | | | $ | 207,684 | | | $ | 209,286 | |
| Cost of revenue (exclusive of depreciation shown separately below) | 23,147 | | | 22,678 | | | 47,201 | | | 46,121 | |
| Gross profit | 81,503 | | | 81,698 | | | 160,483 | | | 163,165 | |
| Operating expenses: | | | | | | | |
| Research and development expense | 29,789 | | | 26,972 | | | 60,975 | | | 55,107 | |
| Sales and marketing expense | 30,260 | | | 27,676 | | | 63,618 | | | 59,981 | |
| General and administrative expense | 17,194 | | | 19,087 | | | 37,331 | | | 37,121 | |
| Depreciation | 47 | | | 154 | | | 91 | | | 211 | |
| Amortization of intangibles | 489 | | | 348 | | | 836 | | | 695 | |
| Total operating expenses | 77,779 | | | 74,237 | | | 162,851 | | | 153,115 | |
| Operating income (loss) | 3,724 | | | 7,461 | | | (2,368) | | | 10,050 | |
| | | | | | | |
| | | | | | | |
| Other income, net | 2,513 | | | 3,881 | | | 5,094 | | | 7,697 | |
| Earnings before income taxes | 6,237 | | | 11,342 | | | 2,726 | | | 17,747 | |
| Income tax benefit (provision) | 48 | | | (1,221) | | | (357) | | | (1,553) | |
| Net earnings | $ | 6,285 | | | $ | 10,121 | | | $ | 2,369 | | | $ | 16,194 | |
| | | | | | | |
| Per share information: | | | | | | | |
| Basic earnings per share | $ | 0.04 | | | $ | 0.06 | | | $ | 0.01 | | | $ | 0.10 | |
| Diluted earnings per share | $ | 0.04 | | | $ | 0.06 | | | $ | 0.01 | | | $ | 0.09 | |
| Weighted average shares outstanding used in the computation of net earnings per share: |
| Basic | 161,675 | | | 165,295 | | | 161,502 | | | 165,164 | |
| Diluted | 165,011 | | | 168,648 | | | 167,219 | | | 168,822 | |
| | | | | | | |
| Stock-based compensation expense by function: | | | | | | | |
| Cost of revenue | $ | 177 | | | $ | 198 | | | $ | 354 | | | $ | 345 | |
| Research and development expense | 2,271 | | | 3,895 | | | 5,613 | | | 7,718 | |
| Sales and marketing expense | 1,487 | | | 824 | | | 3,814 | | | 2,645 | |
| General and administrative expense | 1,211 | | | 3,463 | | | 4,353 | | | 4,644 | |
| Total stock-based compensation expense | $ | 5,146 | | | $ | 8,380 | | | $ | 14,134 | | | $ | 15,352 | |
| | | | | | | |
| | | | | | | | | | | | | | | |
| VIMEO, INC. CONSOLIDATED BALANCE SHEET | | | | |
| ($ in thousands) | | | | |
| (Unaudited) | | | | |
| June 30,
2025 | | December 31,
2024 | | | | |
| ASSETS | | | | | | | |
| Cash and cash equivalents | $ | 302,956 | | | $ | 325,276 | | | | | |
| Accounts receivable, net | 24,439 | | | 24,648 | | | | | |
| Prepaid expenses and other current assets | 22,969 | | | 24,732 | | | | | |
| Total current assets | 350,364 | | | 374,656 | | | | | |
| | | | | | | |
| Leasehold improvements and equipment, net | 513 | | | 456 | | | | | |
| Goodwill | 245,406 | | | 245,406 | | | | | |
| Intangible assets with definite lives, net | 5,048 | | | 1,239 | | | | | |
| Other non-current assets | 19,307 | | | 21,064 | | | | | |
| TOTAL ASSETS | $ | 620,638 | | | $ | 642,821 | | | | | |
| | | | | | | |
| LIABILITIES AND SHAREHOLDERS' EQUITY | | | | | | | |
| LIABILITIES: | | | | | | | |
| Accounts payable, trade | $ | 3,215 | | | $ | 4,473 | | | | | |
| | | | | | | |
| Deferred revenue | 170,724 | | | 161,923 | | | | | |
| Accrued expenses and other current liabilities | 46,047 | | | 56,027 | | | | | |
| Total current liabilities | 219,986 | | | 222,423 | | | | | |
| | | | | | | |
| | | | | | | |
| Other long-term liabilities | 9,560 | | | 11,601 | | | | | |
| | | | | | | |
| Commitments and contingencies | | | | | | | |
| | | | | | | |
| SHAREHOLDERS' EQUITY: | | | | | | | |
| Common stock | 1,658 | | | 1,620 | | | | | |
| Class B common stock | 94 | | | 94 | | | | | |
| | | | | | | |
| | | | | | | |
| Preferred stock | — | | | — | | | | | |
| Additional paid-in capital | 803,691 | | | 801,367 | | | | | |
| Accumulated deficit | (363,954) | | | (366,323) | | | | | |
| Accumulated other comprehensive loss | (124) | | | (1,180) | | | | | |
| Treasury stock | (50,273) | | | (26,781) | | | | | |
| Total shareholders' equity | 391,092 | | | 408,797 | | | | | |
| TOTAL LIABILITIES AND SHAREHOLDERS' EQUITY | $ | 620,638 | | | $ | 642,821 | | | | | |
| | | | | | | | | | | | | | | | | | | | | | | |
| VIMEO, INC. CONSOLIDATED STATEMENT OF CASH FLOWS |
| ($ in thousands) |
| (Unaudited) |
| Three Months Ended June 30, | | Six Months Ended June 30, |
| 2025 | | 2024 | | 2025 | | 2024 |
| Cash flows from operating activities: | | | | | | | |
| Net earnings | $ | 6,285 | | $ | 10,121 | | | $ | 2,369 | | $ | 16,194 | |
| Adjustments to reconcile net earnings to net cash provided by operating activities: | | | | | | | |
| Stock-based compensation expense | 5,146 | | | 8,380 | | | 14,134 | | | 15,352 | |
| Amortization of intangibles | 489 | | | 348 | | | 836 | | | 695 | |
| Depreciation | 47 | | | 154 | | | 91 | | | 211 | |
| Provision for credit losses | 215 | | | 111 | | | 535 | | | 30 | |
| | | | | | | |
| | | | | | | |
| Non-cash lease expense | 1,046 | | | 1,087 | | | 2,091 | | | 2,269 | |
| Other adjustments, net | (321) | | | 83 | | | (8) | | | 25 | |
| Changes in assets and liabilities: |
| Accounts receivable | (1,311) | | | (1,344) | | | (1,368) | | | 414 | |
| Prepaid expenses and other assets | 2,874 | | | 784 | | | 4,884 | | | 2,929 | |
| Accounts payable and other liabilities | (1,368) | | | (2,639) | | | (15,751) | | | (13,022) | |
| Deferred revenue | 6,267 | | | 2,613 | | | 9,461 | | | 191 | |
| Net cash provided by operating activities | 19,369 | | | 19,698 | | | 17,274 | | | 25,288 | |
| Cash flows from investing activities: | | | | | | | |
| | | | | | | |
| Capital expenditures | — | | | — | | | (142) | | | (160) | |
| | | | | | | |
| Capitalized internal-use software development costs | (2,449) | | | — | | | (4,421) | | | — | |
| | | | | | | |
| Net cash used in investing activities | (2,449) | | | — | | | (4,563) | | | (160) | |
| Cash flows from financing activities: | | | | | | | |
| | | | | | | |
| | | | | | | |
| | | | | | | |
| | | | | | | |
| | | | | | | |
| Amounts related to settlement of equity awards | (3,835) | | | (1,730) | | | (12,396) | | | (3,935) | |
| Proceeds from exercise of stock options | 5 | | | 10 | | | 252 | | | 22 | |
| Purchases of treasury stock | — | | | (11,495) | | | (23,791) | | | (11,495) | |
| | | | | | | |
| | | | | | | |
| Net cash used in financing activities | (3,830) | | | (13,215) | | | (35,935) | | | (15,408) | |
| Total cash provided (used) | 13,090 | | | 6,483 | | | (23,224) | | | 9,720 | |
| Effect of exchange rate changes on cash and cash equivalents and restricted cash | 855 | | | (196) | | | 915 | | | (337) | |
| Net increase (decrease) in cash and cash equivalents and restricted cash | 13,945 | | | 6,287 | | | (22,309) | | | 9,383 | |
| Cash and cash equivalents and restricted cash at beginning of period | 289,239 | | | 304,532 | | | 325,493 | | | 301,436 | |
| Cash and cash equivalents and restricted cash at end of period | $ | 303,184 | | | $ | 310,819 | | | $ | 303,184 | | | $ | 310,819 | |
| | | | | | | |
| | | | | | | | | | | | | | | | | | | | | | | | | | | | | | | | | | | |
| | | | | | | | |
| VIMEO, INC. DISAGGREGATED REVENUE AND OPERATING METRICS |
| (In thousands except ARPU) |
| | | | | | | | | | | | | | | |
| | | | | | | | | | | | | |
| | | | | | | Q2'24 | | Q3'24 | | Q4'24 | | Q1'25 | | Q2'25 |
| | | | | | | | | | | | | | | |
| Disaggregated Revenue | | | | | | | | | | | | | | | |
| | | | | | | | | | | | | | | |
| | | | | | | | | | | | | | | |
| | | | | | | | | | | | | | | |
| | | | | | | | | | | | | | | |
| | | | | | | | | | | | | | | |
| Self-Serve | | | | | | | $ | 58,374 | | | $ | 58,356 | | | $ | 56,296 | | | $ | 56,112 | | | $ | 57,555 | |
| Vimeo Enterprise | | | | | | | 20,051 | | | 21,675 | | | 22,998 | | | 24,424 | | | 24,997 | |
| OTT | | | | | | | 12,641 | | | 12,358 | | | 12,432 | | | 12,243 | | | 12,268 | |
| Add-Ons | | | | | | | 10,190 | | | 9,508 | | | 9,055 | | | 8,582 | | | 8,197 | |
| Other | | | | | | | 3,120 | | | 2,667 | | | 2,375 | | | 1,673 | | | 1,633 | |
| Total revenue | | | | | | | $ | 104,376 | | | $ | 104,564 | | | $ | 103,156 | | | $ | 103,034 | | | $ | 104,650 | |
| | | | | | | | | | | | | | | |
| | | | | | | | | | | | | | | |
| Operating Metrics | | | | | | | | | | | | | | | |
| | | | | | | | | | | | | | | |
| | | | | | | | | | | | | | | |
| | | | | | | | | | | | | | | |
| | | | | | | | | | | | | | | |
| | | | | | | | | | | | | | | |
| | | | | | | | | | | | | | | |
| | | | | | | | | | | | | | | |
| | | | | | | | | | | | | | | |
| | | | | | | | | | | | | | | |
| | | | | | | | | | | | | | | |
| | | | | | | | | | | | | | | |
| | | | | | | | | | | | | | | |
| | | | | | | | | | | | | | | |
| | | | | | | | | | | | | | | |
| | | | | | | | | | | | | | | |
| | | | | | | | | | | | | | | |
| | | | | | | | | | | | | | | |
| | | | | | | | | | | | | | | |
| Self-Serve: | | | | | | | | | | | | | | | |
| Subscribers | | | | | | | 1,298.1 | | | 1,269.1 | | | 1,221.5 | | | 1,189.3 | | | 1,156.5 | |
| Average Subscribers | | | | | | | 1,319.8 | | | 1,283.6 | | | 1,245.3 | | | 1,205.4 | | | 1,172.9 | |
| ARPU | | | | | | | $ | 178 | | | $ | 181 | | | $ | 180 | | | $ | 189 | | | $ | 197 | |
| Bookings | | | | | | | $ | 58,644 | | | $ | 53,583 | | | $ | 54,709 | | | $ | 61,113 | | | $ | 64,972 | |
| | | | | | | | | | | | | | | |
| Vimeo Enterprise: | | | | | | | | | | | | | | | |
| Subscribers | | | | | | | 3.7 | | | 3.8 | | | 4.0 | | | 4.1 | | | 4.0 | |
| Average Subscribers | | | | | | | 3.7 | | | 3.7 | | | 3.9 | | | 4.0 | | | 4.1 | |
| ARPU | | | | | | | $ | 21,977 | | | $ | 23,043 | | | $ | 23,493 | | | $ | 24,624 | | | $ | 24,705 | |
| Bookings | | | | | | | $ | 23,433 | | | $ | 25,092 | | | $ | 30,180 | | | $ | 22,620 | | | $ | 25,595 | |
| | | | | | | | | | | | | | | |
| OTT: | | | | | | | | | | | | | | | |
| Subscribers | | | | | | | 2.9 | | | 3.1 | | | 3.1 | | | 3.2 | | | 3.1 | |
| Average Subscribers | | | | | | | 3.0 | | | 3.0 | | | 3.1 | | | 3.2 | | | 3.1 | |
| ARPU | | | | | | | $ | 17,107 | | | $ | 16,363 | | | $ | 15,814 | | | $ | 15,696 | | | $ | 15,720 | |
| Bookings | | | | | | | $ | 7,492 | | | $ | 11,092 | | | $ | 9,208 | | | $ | 9,066 | | | $ | 7,364 | |
RECONCILIATIONS OF GAAP TO NON-GAAP MEASURES
($ in millions; rounding differences may occur)
| | | | | | | | | | | | | | | | | | | | | | | | | | | | | | | | | | | | | |
| | | | | | | | | | | | | |
| | | Q2'24 | | | | | | | | Q3'24 | | Q4'24 | | Q1'25 | | Q2'25 |
| | | | | | | | | | | | | | | | | |
| Reconciliation of non-GAAP cost of revenue: | | | | | | | | | | | | | | | | | |
GAAP Cost of revenue | | | $ | 22.7 | | | | | | | | | $ | 21.7 | | | $ | 22.9 | | | $ | 24.1 | | | $ | 23.1 | |
| % of Revenue | | | 22% | | | | | | | | 21% | | 22% | | 23% | | 22% |
| Less: Stock-based compensation expense | | | 0.2 | | | | | | | | | 0.2 | | | 0.2 | | | 0.2 | | | 0.2 | |
| Less: Restructuring costs | | | — | | | | | | | | | — | | | — | | | — | | | — | |
| Non-GAAP Cost of revenue | | | $ | 22.5 | | | | | | | | | $ | 21.5 | | | $ | 22.7 | | | $ | 23.8 | | | $ | 22.9 | |
| % of Revenue | | | 22% | | | | | | | | 21% | | 22% | | 23% | | 22% |
| | | | | | | | | | | | | | | | | |
| Reconciliation of non-GAAP gross profit and margin: | | | | | | | | | | | | | | | | | |
GAAP Gross profit | | | $ | 81.7 | | | | | | | | | $ | 82.9 | | | $ | 80.3 | | | $ | 79.0 | | | $ | 81.5 | |
| Gross Margin | | | 78% | | | | | | | | 79% | | 78% | | 77% | | 78% |
| Add back: Stock-based compensation expense | | | 0.2 | | | | | | | | | 0.2 | | | 0.2 | | | 0.2 | | | 0.2 | |
| Add back: Restructuring costs | | | — | | | | | | | | | — | | | — | | | — | | | — | |
| Non-GAAP Gross Profit | | | $ | 81.9 | | | | | | | | | $ | 83.1 | | | $ | 80.4 | | | $ | 79.2 | | | $ | 81.7 | |
| Non-GAAP Gross Margin | | | 78% | | | | | | | | 79% | | 78% | | 77% | | 78% |
| | | | | | | | | | | | | | | | | |
| Reconciliation of non-GAAP operating expenses: | | | | | | | | | | | | | | | | | |
GAAP Research and development expense | | | $ | 27.0 | | | | | | | | | $ | 26.6 | | | $ | 27.7 | | | $ | 31.2 | | | $ | 29.8 | |
| % of Revenue | | | 26% | | | | | | | | 25% | | 27% | | 30% | | 28% |
| Less: Stock-based compensation expense | | | 3.9 | | | | | | | | | 2.8 | | | 3.2 | | | 3.3 | | | 2.3 | |
| Less: Restructuring costs | | | — | | | | | | | | | — | | | — | | | 0.2 | | | 0.5 | |
| Non-GAAP Research and development expense | | | $ | 23.1 | | | | | | | | | $ | 23.8 | | | $ | 24.5 | | | $ | 27.6 | | | $ | 27.0 | |
| % of Revenue | | | 22% | | | | | | | | 23% | | 24% | | 27% | | 26% |
| | | | | | | | | | | | | | | | | |
GAAP Sales and marketing expense | | | $ | 27.7 | | | | | | | | | $ | 28.8 | | | $ | 31.1 | | | $ | 33.4 | | | $ | 30.3 | |
| % of Revenue | | | 27% | | | | | | | | 28% | | 30% | | 32% | | 29% |
| Less: Stock-based compensation expense | | | 0.8 | | | | | | | | | 1.5 | | | 1.8 | | | 2.3 | | | 1.5 | |
| Less: Restructuring costs | | | — | | | | | | | | | — | | | — | | | 0.7 | | | 0.3 | |
| Non-GAAP Sales and marketing expense | | | $ | 26.9 | | | | | | | | | $ | 27.3 | | | $ | 29.3 | | | $ | 30.3 | | | $ | 28.5 | |
| % of Revenue | | | 26% | | | | | | | | 26% | | 28% | | 29% | | 27% |
| | | | | | | | | | | | | | | | | |
GAAP General and administrative expense | | | $ | 19.1 | | | | | | | | | $ | 19.7 | | | $ | 19.8 | | | $ | 20.1 | | | $ | 17.2 | |
| % of Revenue | | | 18% | | | | | | | | 19% | | 19% | | 20% | | 16% |
| Less: Stock-based compensation expense | | | 3.5 | | | | | | | | | 3.7 | | | 3.9 | | | 3.1 | | | 1.2 | |
| | | | | | | | | | | | | | | | | |
| Less: Restructuring costs | | | — | | | | | | | | | — | | | — | | | 0.5 | | | 0.7 | |
| Non-GAAP General and administrative expense | | | $ | 15.6 | | | | | | | | | $ | 15.9 | | | $ | 15.9 | | | $ | 16.5 | | | $ | 15.3 | |
| % of Revenue | | | 15% | | | | | | | | 15% | | 15% | | 16% | | 15% |
| | | | | | | | | | | | | | | | | |
| | | | | | | | | | | | | | | | | |
| | | | | | | | | | | | | | | | | |
| | | | | | | | | | | | | | | | | |
| | | | | | | | | | | | | | | | | |
| | | | | | | | | | | | | | | | | |
| | | | | | | | | | | | | | | | | |
| | | | | | | | | | | | | | | | | |
| | | | | | | | | | | | | | | | | |
| | | | | | | | | | | | | | | | | |
| | | | | | | | | | | | | | | | | |
| | | | | | | | | | | | | | | | | |
| | | | | | | | | | | | | | | | | |
| | | | | | | | | | | | | | | | | |
| | | | | | | | | | | | | | | | | |
| | | | | | | | | | | | | | | | | |
| | | | | | | | | | | | | | | | | |
| | | | | | | | | | | | | | | | | |
RECONCILIATIONS OF GAAP TO NON-GAAP MEASURES
($ in millions; rounding differences may occur)
| | | | | | | | | | | | | | | | | | | | | | | | | | | | | | | | | | | | |
| | | | | | | | | | | | |
| | | Q2'24 | | | | | | | Q3'24 | | Q4'24 | | Q1'25 | | Q2'25 |
| | | | | | | | | | | | | | | | |
| | | | | | | | | | | | | |
| | | | | | | | | | | | | | | | |
| | | | | | | | | | | | | | | | |
| | | | | | | | | | | | | | | | |
| | | | | | | | | | | | | | | | |
| | | | | | | | | | | | | | | | |
| | | | | | | | | | | | | | | | |
| | | | | | | | | | | | | | | | |
| | | | | | | | | | | | | | | | |
| | | | | | | | | | | | | | | | |
| | | | | | | | | | | | | | | | |
| | | | | | | | | | | | | | | | |
| | | | | | | | | | | | | | | | |
| | | | | | | | | | | | | |
| | | | | | | | | | | | | | | | |
| | | | | | | | | | | | | | | | |
| | | | | | | | | | | | | | | | |
| | | | | | | | | | | | | | | | |
| | | | | | | | | | | | | | | | |
| | | | | | | | | | | | | | | | |
| | | | | | | | | | | | | | | | |
| | | | | | | | | | | | | | | | |
| | | | | | | | | | | | | | | | |
| | | | | | | | | | | | | | | | |
| | | | | | | | | | | | | | | | |
| Reconciliation of net earnings (loss) to Adjusted EBITDA: | | | | | | | | | | | | | | | | |
| Net earnings (loss) | | | $ | 10.1 | | | | | | | | $ | 9.3 | | | $ | 1.5 | | | $ | (3.9) | | | $ | 6.3 | |
| Add back: | | | | | | | | | | | | | | | | |
| Income tax (benefit) provision | | | 1.2 | | | | | | | | 1.7 | | | 3.5 | | | 0.4 | | | — | |
| Other income, net | | | (3.9) | | | | | | | | (3.6) | | | (3.7) | | | (2.6) | | | (2.5) | |
| | | | | | | | | | | | | | | | |
| | | | | | | | | | | | | | | | |
| Operating income (loss) | | | 7.5 | | | | | | | | 7.4 | | | 1.3 | | | (6.1) | | | 3.7 | |
| Operating Income (loss) Margin | | | 7% | | | | | | | 7% | | 1% | | (6)% | | 4% |
| Add back: | | | | | | | | | | | | | | | | |
| Stock-based compensation expense | | | 8.4 | | | | | | | | 8.3 | | | 9.1 | | | 9.0 | | | 5.1 | |
| Depreciation | | | 0.2 | | | | | | | | 0.1 | | | — | | | — | | | — | |
| Amortization of intangibles | | | 0.3 | | | | | | | | 0.3 | | | 0.3 | | | 0.3 | | | 0.5 | |
| | | | | | | | | | | | | | | | |
| Restructuring costs | | | — | | | | | | | | — | | | — | | | 1.5 | | | 1.5 | |
| Adjusted EBITDA | | | $ | 16.3 | | | | | | | | $ | 16.1 | | | $ | 10.7 | | | $ | 4.8 | | | $ | 10.9 | |
| Adjusted EBITDA Margin | | | 16% | | | | | | | 15% | | 10% | | 5% | | 10% |
| | | | | | | | | | | | | | | | |
| Computation of Free Cash Flow: | | | | | | | | | | | | | | | | |
| Net cash provided by (used in) operating activities | | | $ | 19.7 | | | | | | | | $ | 20.8 | | | $ | 10.8 | | | $ | (2.1) | | | $ | 19.4 | |
| Add: Restructuring costs | | | 0.6 | | | | | | | | 0.2 | | | — | | | 0.9 | | | 0.8 | |
| | | | | | | | | | | | | | | | |
| Less: Capital expenditures | | | — | | | | | | | | — | | | — | | | (0.1) | | | — | |
| Less: Internal-use software development costs | | | — | | | | | | | | — | | | — | | | (2.0) | | | (2.4) | |
| Free Cash Flow | | | $ | 20.3 | | | | | | | | $ | 21.0 | | | $ | 10.8 | | | $ | (3.4) | | | $ | 17.8 | |
RECONCILIATION OF GAAP TO NON-GAAP FINANCIAL OUTLOOK
($ in millions; rounding differences may occur)
| | | | | | | | | | | | | | | | | | | |
| | Three Months Ended September 30, 2025 | | | | Twelve Months Ended December 31, 2025 |
| Operating income to Adjusted EBITDA: | | | | | | | | | | | |
| Operating income | | $ | 2.2 | | | | | | | | $ | 6.2 | | | |
| Add back: | | | | | | | | | | | |
| Stock-based compensation expense | | 6.3 | | | | | | | | 26.8 | | | |
| Depreciation | | — | | | | | | | | 0.2 | | | |
| Amortization of intangibles | | 0.5 | | | | | | | | 1.8 | | | |
| | | | | | | | | | | |
| | | | | | | | | | | |
| Adjusted EBITDA | | $ | 9.0 | | | | | | | | $ | 35.0 | | | |
PRINCIPLES OF FINANCIAL REPORTING
We have provided in this press release certain non-GAAP financial measures, including Adjusted EBITDA, non-GAAP gross profit, non-GAAP operating expenses, and free cash flow, to supplement our financial information presented in accordance with GAAP. We use these non-GAAP financial measures internally in analyzing our financial results and believe that they are useful to investors as an additional tool to evaluate ongoing operating results and trends and in comparing our financial results with other companies in our industry, many of which present similar non-GAAP financial measures. However, our presentation of these non-GAAP financial measures may differ from the presentation of similarly titled measures by other companies. Adjusted EBITDA is one of the metrics on which our internal budgets are based and also one of the metrics by which management is compensated. We believe that investors should have access to, and we are obligated to provide, the same set of tools that we use in analyzing our results. These non-GAAP financial measures should be considered in addition to results prepared in accordance with GAAP, but should not be considered a substitute for or superior to GAAP results. We endeavor to compensate for the limitations of the non-GAAP measures presented by providing the comparable GAAP measure with equal or greater prominence and descriptions of the reconciling items, including quantifying such items, to derive the non-GAAP measure. We encourage investors to examine the reconciling adjustments between the GAAP and corresponding non-GAAP measure.
From time to time, we provide forward-looking outlook information, including for Adjusted EBITDA. Adjusted EBITDA used in our outlook will differ from net earnings and operating income (loss) in ways similar to the reconciliations provided above and the definitions of Adjusted EBITDA provided below.
Definitions of Non-GAAP Measures
Adjusted Earnings Before Interest, Taxes, Depreciation and Amortization ("Adjusted EBITDA") is defined as operating income (loss) excluding: (1) stock-based compensation expense; (2) depreciation; (3) amortization of intangible assets; (4) gains and losses recognized on changes in the fair value of contingent consideration arrangements; and (5) restructuring costs associated with exit or disposal activities such as a reduction in force or reorganization. We believe this measure is useful for analysts and investors as this measure allows a more meaningful comparison between our performance and that of our competitors. The above items are excluded from our Adjusted EBITDA measure because these items are either non-cash or non-recurring in nature and are collectively referred to as "Adjusted EBITDA Non-GAAP Adjustments." Adjusted EBITDA has certain limitations because it excludes the impact of these expenses.
Adjusted EBITDA Margin is Adjusted EBITDA, divided by revenue.
Non-GAAP Cost of Revenue excludes stock-based compensation expense and restructuring costs.
Non-GAAP Gross Profit excludes stock-based compensation expense and restructuring costs included in Cost of revenue.
Non-GAAP Gross Margin is Non-GAAP Gross Profit, divided by revenue.
Non-GAAP Operating Expenses include Non-GAAP Research and development expense, Non-GAAP Sales and marketing expense, and Non-GAAP General and administrative expense. These Non-GAAP operating expenses exclude Adjusted EBITDA Non-GAAP Adjustments in their respective expense items.
Free Cash Flow is defined as net cash provided by, or used in, operating activities excluding restructuring costs and contingent consideration payments included in operating activities, less cash used for capitalized software development costs and capital expenditures. We believe Free Cash Flow is useful to investors as a liquidity measure because it measures our ability to generate or use cash.
Items That Are Excluded From Non-GAAP Measures
Stock-based compensation expense consists of expense associated with the grants of Vimeo stock-based awards. These expenses are not paid in cash and we view the economic costs of stock-based awards to be the dilution to our share base. We also consider the dilutive impact of stock-based awards in GAAP diluted earnings per share, to the extent such impact is dilutive.
Depreciation is a non-cash expense relating to our leasehold improvements and equipment and is computed using the straight-line method to allocate the cost of depreciable assets to operations over their estimated useful lives, or, in the case of leasehold improvements, the lease term, if shorter.
Amortization of intangible assets are non-cash expenses related to capitalized internal-use software development costs or acquisitions. Amortization of capitalized internal-use software development costs is computed using the straight-line method to allocate
the cost of such assets to operations over their estimated useful lives. At the time of an acquisition, the identifiable definite-lived intangible assets of the acquired company are valued and amortized over their estimated useful lives. We believe that acquired intangible assets represent costs incurred by the acquired company to build value prior to acquisition and the related amortization is not an ongoing cost of doing business.
Gains and losses recognized on changes in the fair value of contingent consideration arrangements are accounting adjustments to report contingent consideration liabilities at fair value. These adjustments can be highly variable and are excluded from our assessment of performance because they are considered non-operational in nature and, therefore, are not indicative of current or future performance or the ongoing cost of doing business.
Restructuring costs consist of costs associated with exit or disposal activities such as severance and other post-employment benefits paid in connection with a reduction-in-force or reorganization. We consider these costs to be non-recurring in nature and therefore, are not indicative of current or future performance or the ongoing cost of doing business.
Operating Metrics and Key Terms
Self-Serve relates to our subscription plans sold directly online through our website or apps, which include features such as video creation, collaboration, distribution, hosting, marketing, monetization, and analytics. Subscribers pay subscription fees with a credit card or an in-app purchase mechanism.
Vimeo Enterprise relates to our video offering designed for teams and organizations, which includes the same capabilities of Self-Serve plus enterprise-grade features such as advanced security, custom user permissions, single-sign on for employees, interactive video tools, and marketing software integrations. Vimeo Enterprise is sold through our sales force and is often an upgrade from Vimeo's Self-Serve as the number of users or use cases in an organization grows.
OTT relates to our over-the-top ("OTT") video monetization solution that allows customers to launch and run their own video streaming channel directly to their audience through a branded web portal, mobile apps, and Internet-enabled TV apps. Revenue and operating metrics derived from OTT had previously been included in Other.
Add-Ons relates to add-on services tied to our online subscriptions such as bandwidth charges, which are sold through our sales force to subscribers of one of our plans if they exceed a certain threshold of bandwidth. Revenue derived from Add-Ons had previously been included in Self-Serve & Add-Ons.
Other primarily includes Magisto and Livestream.
Subscribers is the number of users who have an active subscription to one of Vimeo's paid plans measured at the end of the relevant period. Vimeo counts each customer with a subscription plan as a subscriber regardless of the number of users. In the case of customers who maintain subscriptions across Self-Serve, Vimeo Enterprise, and OTT, Vimeo counts one subscriber for each of the components in which they maintain one or more subscriptions. Vimeo does not count users or team members who have access to a subscriber's account as additional subscribers.
Average Subscribers is the sum of the number of Subscribers at the beginning and at the end of the relevant measurement period divided by two.
Average Revenue per User ("ARPU") is the annualized revenue for the relevant period divided by Average Subscribers. For periods that are less than a full year, annualized revenue is calculated by dividing the revenue for that particular period by the number of calendar days in the period and multiplying this value by the number of calendar days in that year.
Bookings consist of fixed fees for software-as-a-service (“SaaS”) services, measured at the end of the relevant period, that subscribers have committed to pay during their subscription period, which is generally 12 months, less refunds and chargebacks during the same period.
Gross Margin is revenue less cost of revenue, divided by revenue.
Operating Income (Loss) Margin is Operating income (loss), divided by revenue.
DILUTIVE SECURITIES
Vimeo has various dilutive securities. The table below details these securities as well as estimated dilution at various stock prices (shares in millions; rounding differences may occur).
| | | | | | | | | | | | | | | | | | | | | | | | | | | | | |
| Shares | | Avg. Exercise Price | | As of 7/31/2025 | Dilution at: |
| | | | | | | | | |
| Share Price | | | | | $ | 3.79 | | $ | 4.00 | | $ | 6.00 | | $ | 8.00 | | $ | 10.00 | |
| | | | | | | | | |
| Common Stock Outstanding as of 7/31/2025 | 165.7 | | | | | 165.7 | | 165.7 | | 165.7 | | 165.7 | | 165.7 | |
| | | | | | | | | |
| SARs and Stock Options | 6.3 | | | $ | 5.41 | | | — | | — | | 0.1 | | 0.9 | | 1.5 | |
| RSUs | 9.6 | | | | | 5.1 | | 5.1 | | 5.1 | | 5.1 | | 5.1 | |
| Total Estimated Dilution | | | | | 5.1 | | 5.1 | | 5.2 | | 6.0 | | 6.6 | |
| % Dilution | | | | | 3.1 | % | 3.1 | % | 3.1 | % | 3.6 | % | 4.0 | % |
| Total Estimated Diluted Shares Outstanding | | | | | 170.8 | | 170.8 | | 170.9 | | 171.7 | | 172.3 | |
The dilutive securities presentation is calculated using the methods and assumptions described below, which are different than those prescribed by GAAP.
The estimated dilutive effect was calculated assuming the Company settles equity awards on a net basis; therefore, the dilutive effect is presented as the net number of shares expected to be issued upon vesting or exercise, adjusted for (i) the estimated income tax benefit from the tax deduction received upon the vesting or exercise of awards held in the U.S., as such tax benefit is assumed to be used to repurchase shares of Vimeo common stock and (ii) in the case of stock options, the strike price proceeds that are received by the Company and assumed to be used to repurchase shares of Vimeo common stock. The number of shares required to settle stock appreciation rights will be impacted by movement in the stock price of Vimeo.
OTHER INFORMATION
Cautionary Statement Regarding Forward-Looking Information
This press release and the Vimeo livestream which will be held at 5 p.m. Eastern Time on August 4, 2025, contain "forward-looking statements" within the meaning of the Private Securities Litigation Reform Act of 1995. Words such as "will," "may," "could," "should," "would," "anticipates," "estimates," "expects," "plans," "projects," "forecasts," "intends," "targets," "seeks" and "believes," as well as variations of these words or comparable words, among others, generally identify forward-looking statements. These forward-looking statements include, among others, statements relating to Vimeo's expectations regarding future results of operations and financial condition, business strategy, and plans and objectives of management for future operations, including our plans with respect to our share repurchase authorization. Forward-looking statements are based on our management’s beliefs and assumptions and on information currently available. These forward-looking statements are subject to a number of known and unknown risks, uncertainties and assumptions. Actual results could differ materially from those contained in or implied by these forward-looking statements. Factors that could cause or contribute to such differences include, but are not limited to: adverse changes in economic conditions, changes in the regulatory landscape, including, in particular, changes in laws that might increase the liability of online intermediaries for user-generated content and developments in AI laws, reputational damage caused by problematic user content or our decisions to remove (or not remove) it; changes in policies implemented by third party platforms upon which we rely for traffic and distribution of mobile apps, increased competition in the online video category, our ability to convert visitors into uploaders and uploaders into paying subscribers, our ability to retain paying subscribers by maintaining and improving our value proposition, our ability to provide video storage and streaming in a cost-effective manner, our ability to successfully attract customers through our sales force, our ability to protect sensitive data from unauthorized access, the integrity, quality, scalability and redundancy of our systems, technology and infrastructure (and those of third parties with which we do business), our ability to repurchase shares of the Company's common stock according to our announced intent or at all, subject to risks such as adverse developments or changes in market conditions or fluctuations in the trading volume and market price of our common stock, our ability to successfully operate in and expand into additional international markets, our ability to adequately protect our intellectual property rights and not infringe the intellectual property rights of third parties, foreign exchange currency rate fluctuations, the impact of geopolitical events on our business, the possibility that our historical consolidated and combined results may not be indicative of our future results and the other factors set forth in the section titled "Risk Factors" in our Annual Report on Form 10-K for the fiscal year ended December 31, 2024 filed with the Securities and Exchange Commission ("SEC") on February 19, 2025, as they may be updated by our periodic reports subsequently filed with the SEC, including our Quarterly Report on Form 10-Q to be filed with the SEC on August 4, 2025. Other unknown or unpredictable factors that could also adversely affect Vimeo’s business, financial condition and results of operations may arise from time to time. In light of these risks and uncertainties, these forward-looking statements may not prove to be accurate. Accordingly, you should not place undue reliance on these forward-looking statements, which only reflect the views of Vimeo’s management as of the date of this communication. Vimeo does not undertake to update these forward-looking statements.
About Vimeo
Vimeo (NASDAQ: VMEO) is the world's most innovative video experience platform. We enable anyone to create high-quality video experiences to better connect and bring ideas to life. We proudly serve our community of millions of users – from creative storytellers to globally distributed teams at the world's largest companies – whose videos receive billions of views each month. Learn more at www.vimeo.com.
Contact Us
Vimeo Investor Relations
ir@vimeo.com
Vimeo Communications
Frank Filiatrault
press@vimeo.com