

Second Quarter 2025 Financial Results CRD-A & CRD-B (NYSE) ® Crawford & Company
Forward-Looking Statements & Additional Information Q2 2025 FINANCIAL RESULTS Forward-Looking Statements This presentation contains forward-looking statements, including statements about the expected future financial condition, results of operations and earnings outlook of Crawford & Company. Statements, both qualitative and quantitative, that are not statements of historical fact may be "forward-looking statements" as defined in the Private Securities Litigation Reform Act of 1995 and other securities laws. Forward-looking statements involve a number of risks and uncertainties that could cause actual results to differ materially from historical experience or Crawford & Company's present expectations. Accordingly, no one should place undue reliance on forward-looking statements, which speak only as of the date on which they are made. Crawford & Company does not undertake to update forward-looking statements to reflect the impact of circumstances or events that may arise or not arise after the date the forward-looking statements are made. Results for any interim period presented herein are not necessarily indicative of results to be expected for the full year or for any other future period. For further information regarding Crawford & Company, and the risks and uncertainties involved in forward-looking statements, please read Crawford & Company's reports filed with the Securities and Exchange Commission and available at www.sec.gov or in the Investor Relations portion of Crawford & Company's website at https://ir.crawco.com. Crawford's business is dependent, to a significant extent, on case volumes. The Company cannot predict the future trend of case volumes for a number of reasons, including the fact that the frequency and severity of weather-related claims and the occurrence of natural and man-made disasters, which are a significant source of cases and revenue for the Company, are generally not subject to accurate forecasting. Revenues Before Reimbursements ("Revenues") Revenues Before Reimbursements are referred to as "Revenues" in both consolidated and segment charts, bullets and tables throughout this presentation. Segment and Consolidated Operating Earnings Under the Financial Accounting Standards Board's Accounting Standards Codification ("ASC") Topic 280, "Segment Reporting," the Company has defined segment operating earnings as the primary measure used by the Company to evaluate the results of each of its four operating segments. Segment operating earnings represent segment earnings, including the direct and indirect costs of certain administrative functions required to operate our business, but excludes unallocated corporate and shared costs and credits, net corporate interest expense, stock option expense, amortization of acquisition-related intangible assets, contingent earnout adjustments, non-service pension costs, income taxes and net income or loss attributable to noncontrolling interests. Earnings Per Share The Company's two classes of stock are substantially identical, except with respect to voting rights for the Class B Common Stock (CRD-B) and protections for the non-voting Class A Common Stock (CRD-A). More information available on the Company’s website. The two-class method is an earnings allocation method under which earnings per share ("EPS") is calculated for each class of common stock considering both dividends declared and participation rights in undistributed earnings as if all such earnings had been distributed during the period. As a result, the Company may report different EPS for each class of stock due to the two-class method of computing EPS as required by ASC Topic 260 - "Earnings Per Share". Segment Gross Profit Segment gross profit is defined as revenues, less direct costs, which exclude indirect centralized administrative support costs allocated to the business. Indirect expenses consist of centralized administrative support costs, regional and local shared services that are allocated to each segment based on usage. Non-GAAP Financial Information For additional information about certain non-GAAP financial information presented herein, see the Appendix following this presentation.

STRATEGIC UPDATE Rohit Verma President & Chief Executive Officer 3 Q2 2025 FINANCIAL RESULTS
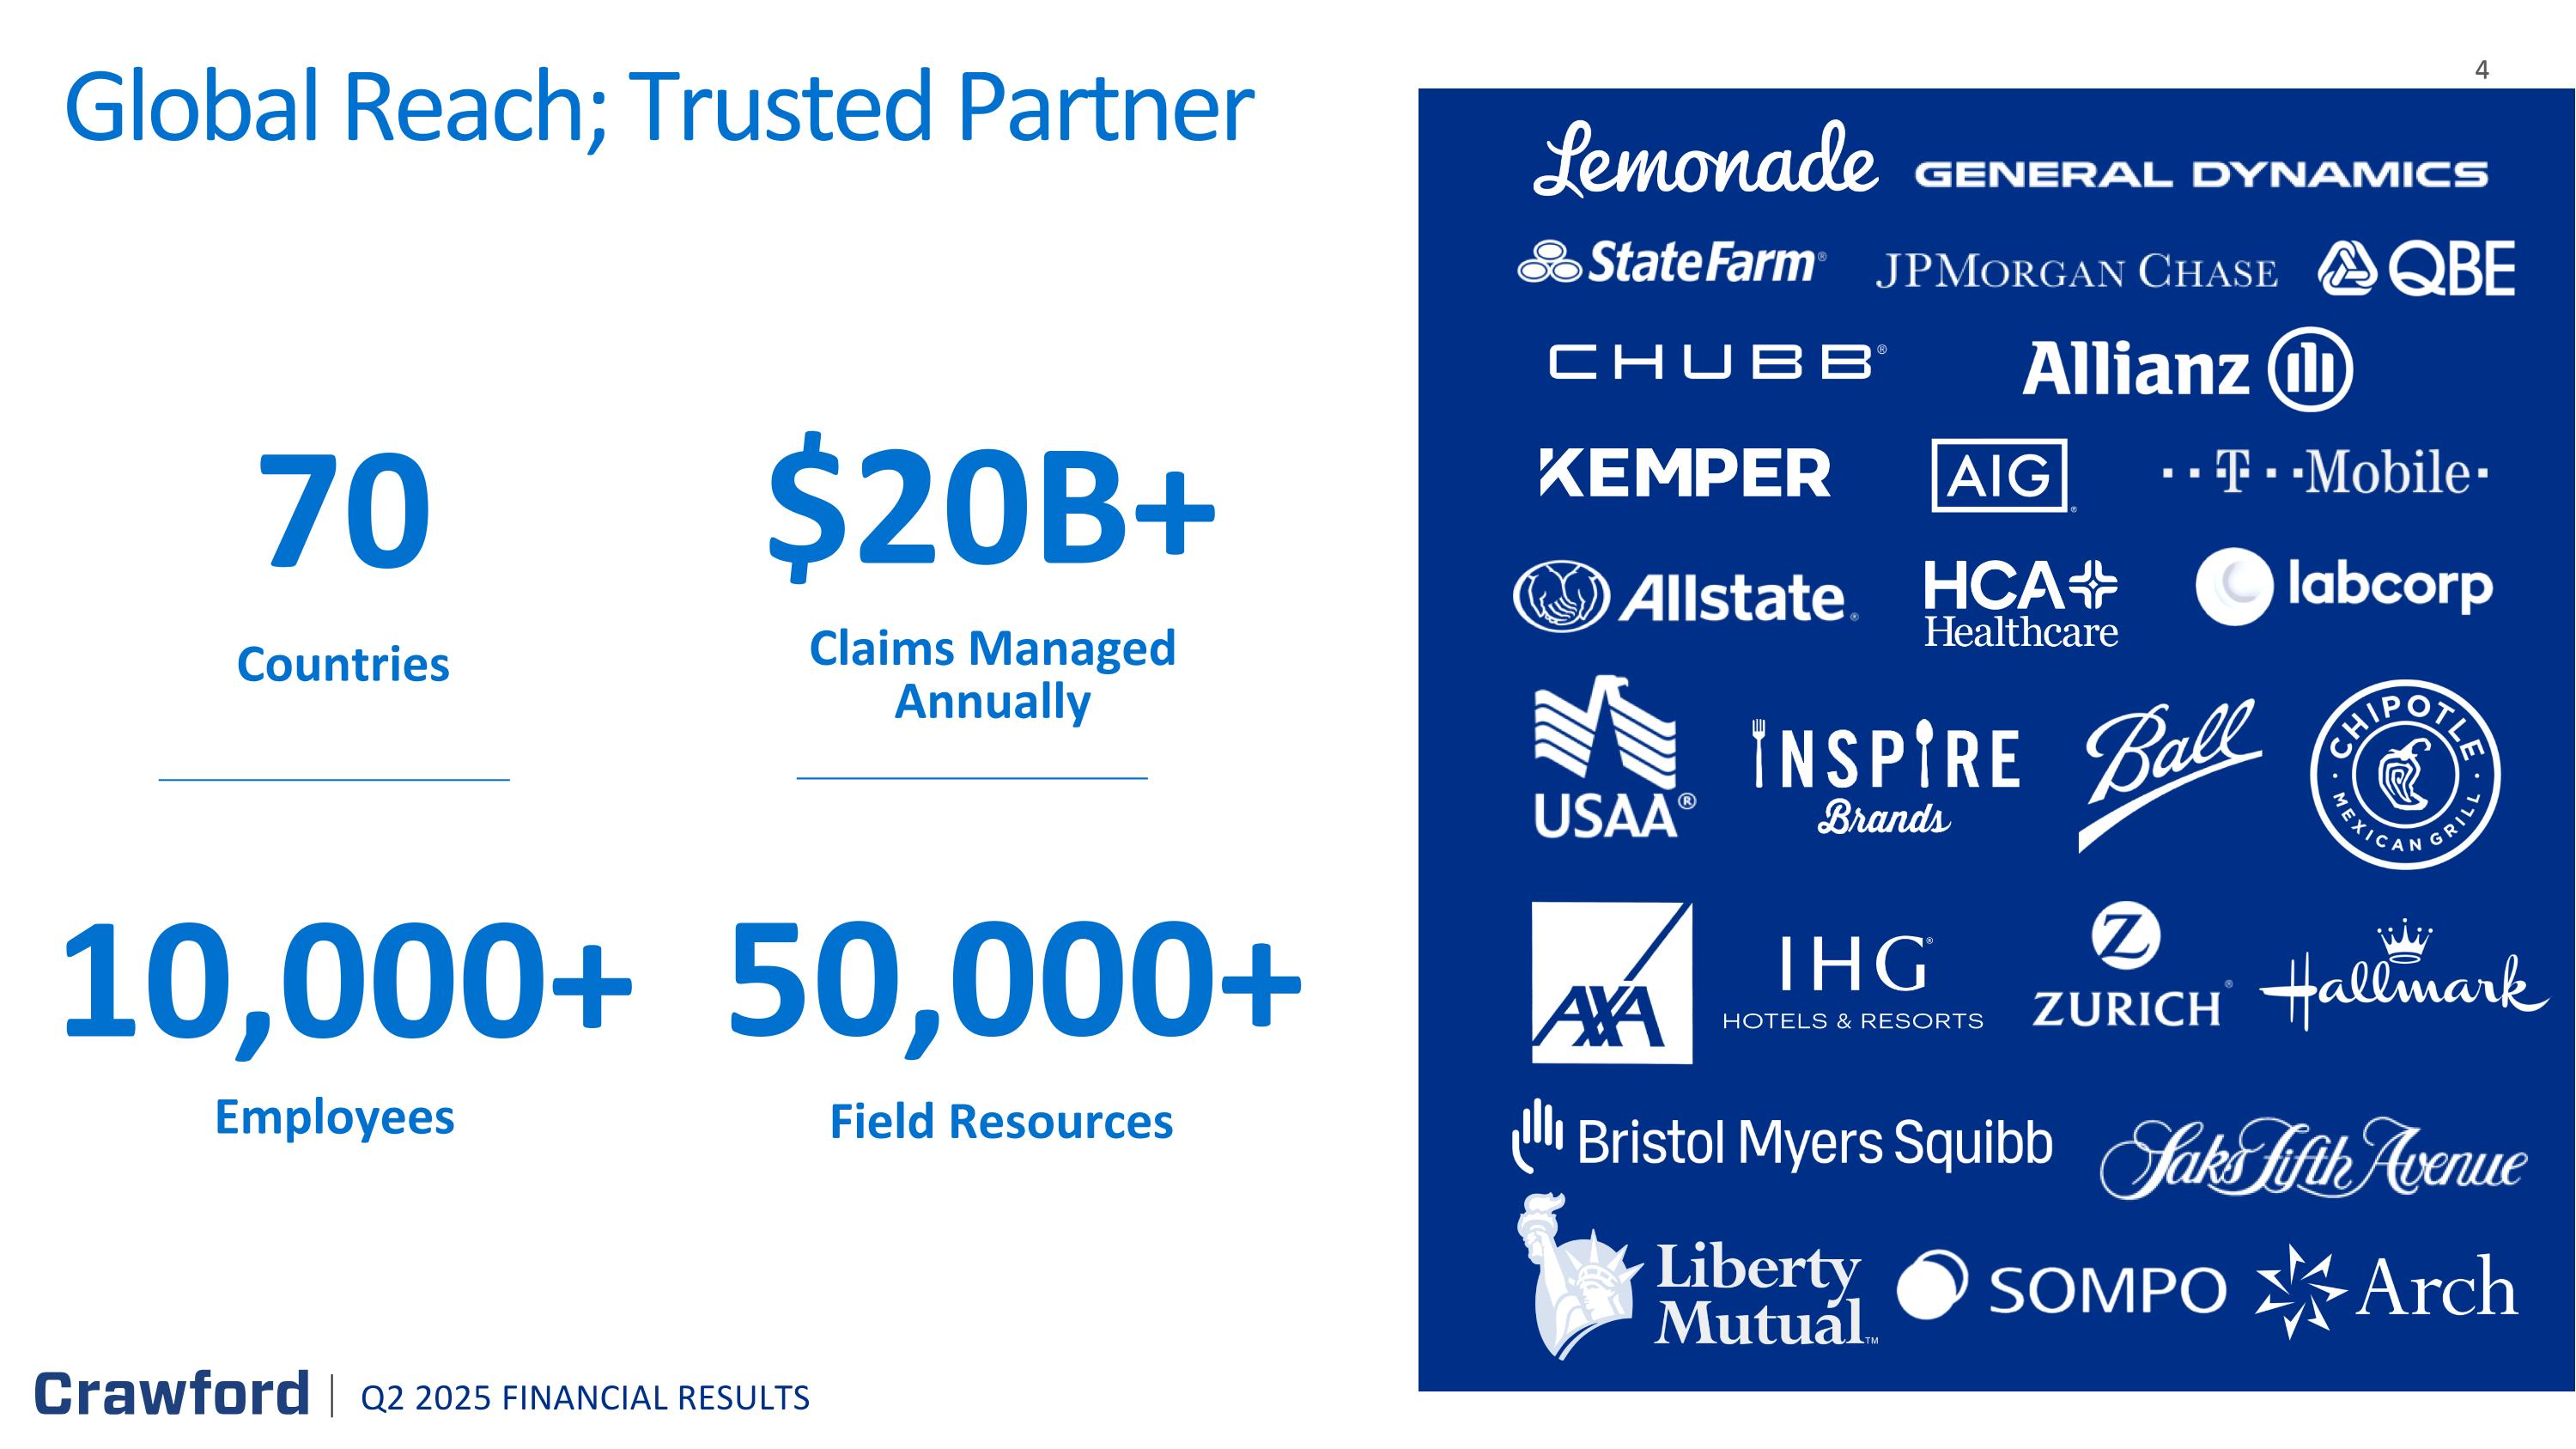
Countries 70 Employees 10,000+ 50,000+ Field Resources $20B+ Claims Managed Annually Global Reach; Trusted Partner Q2 2025 FINANCIAL RESULTS
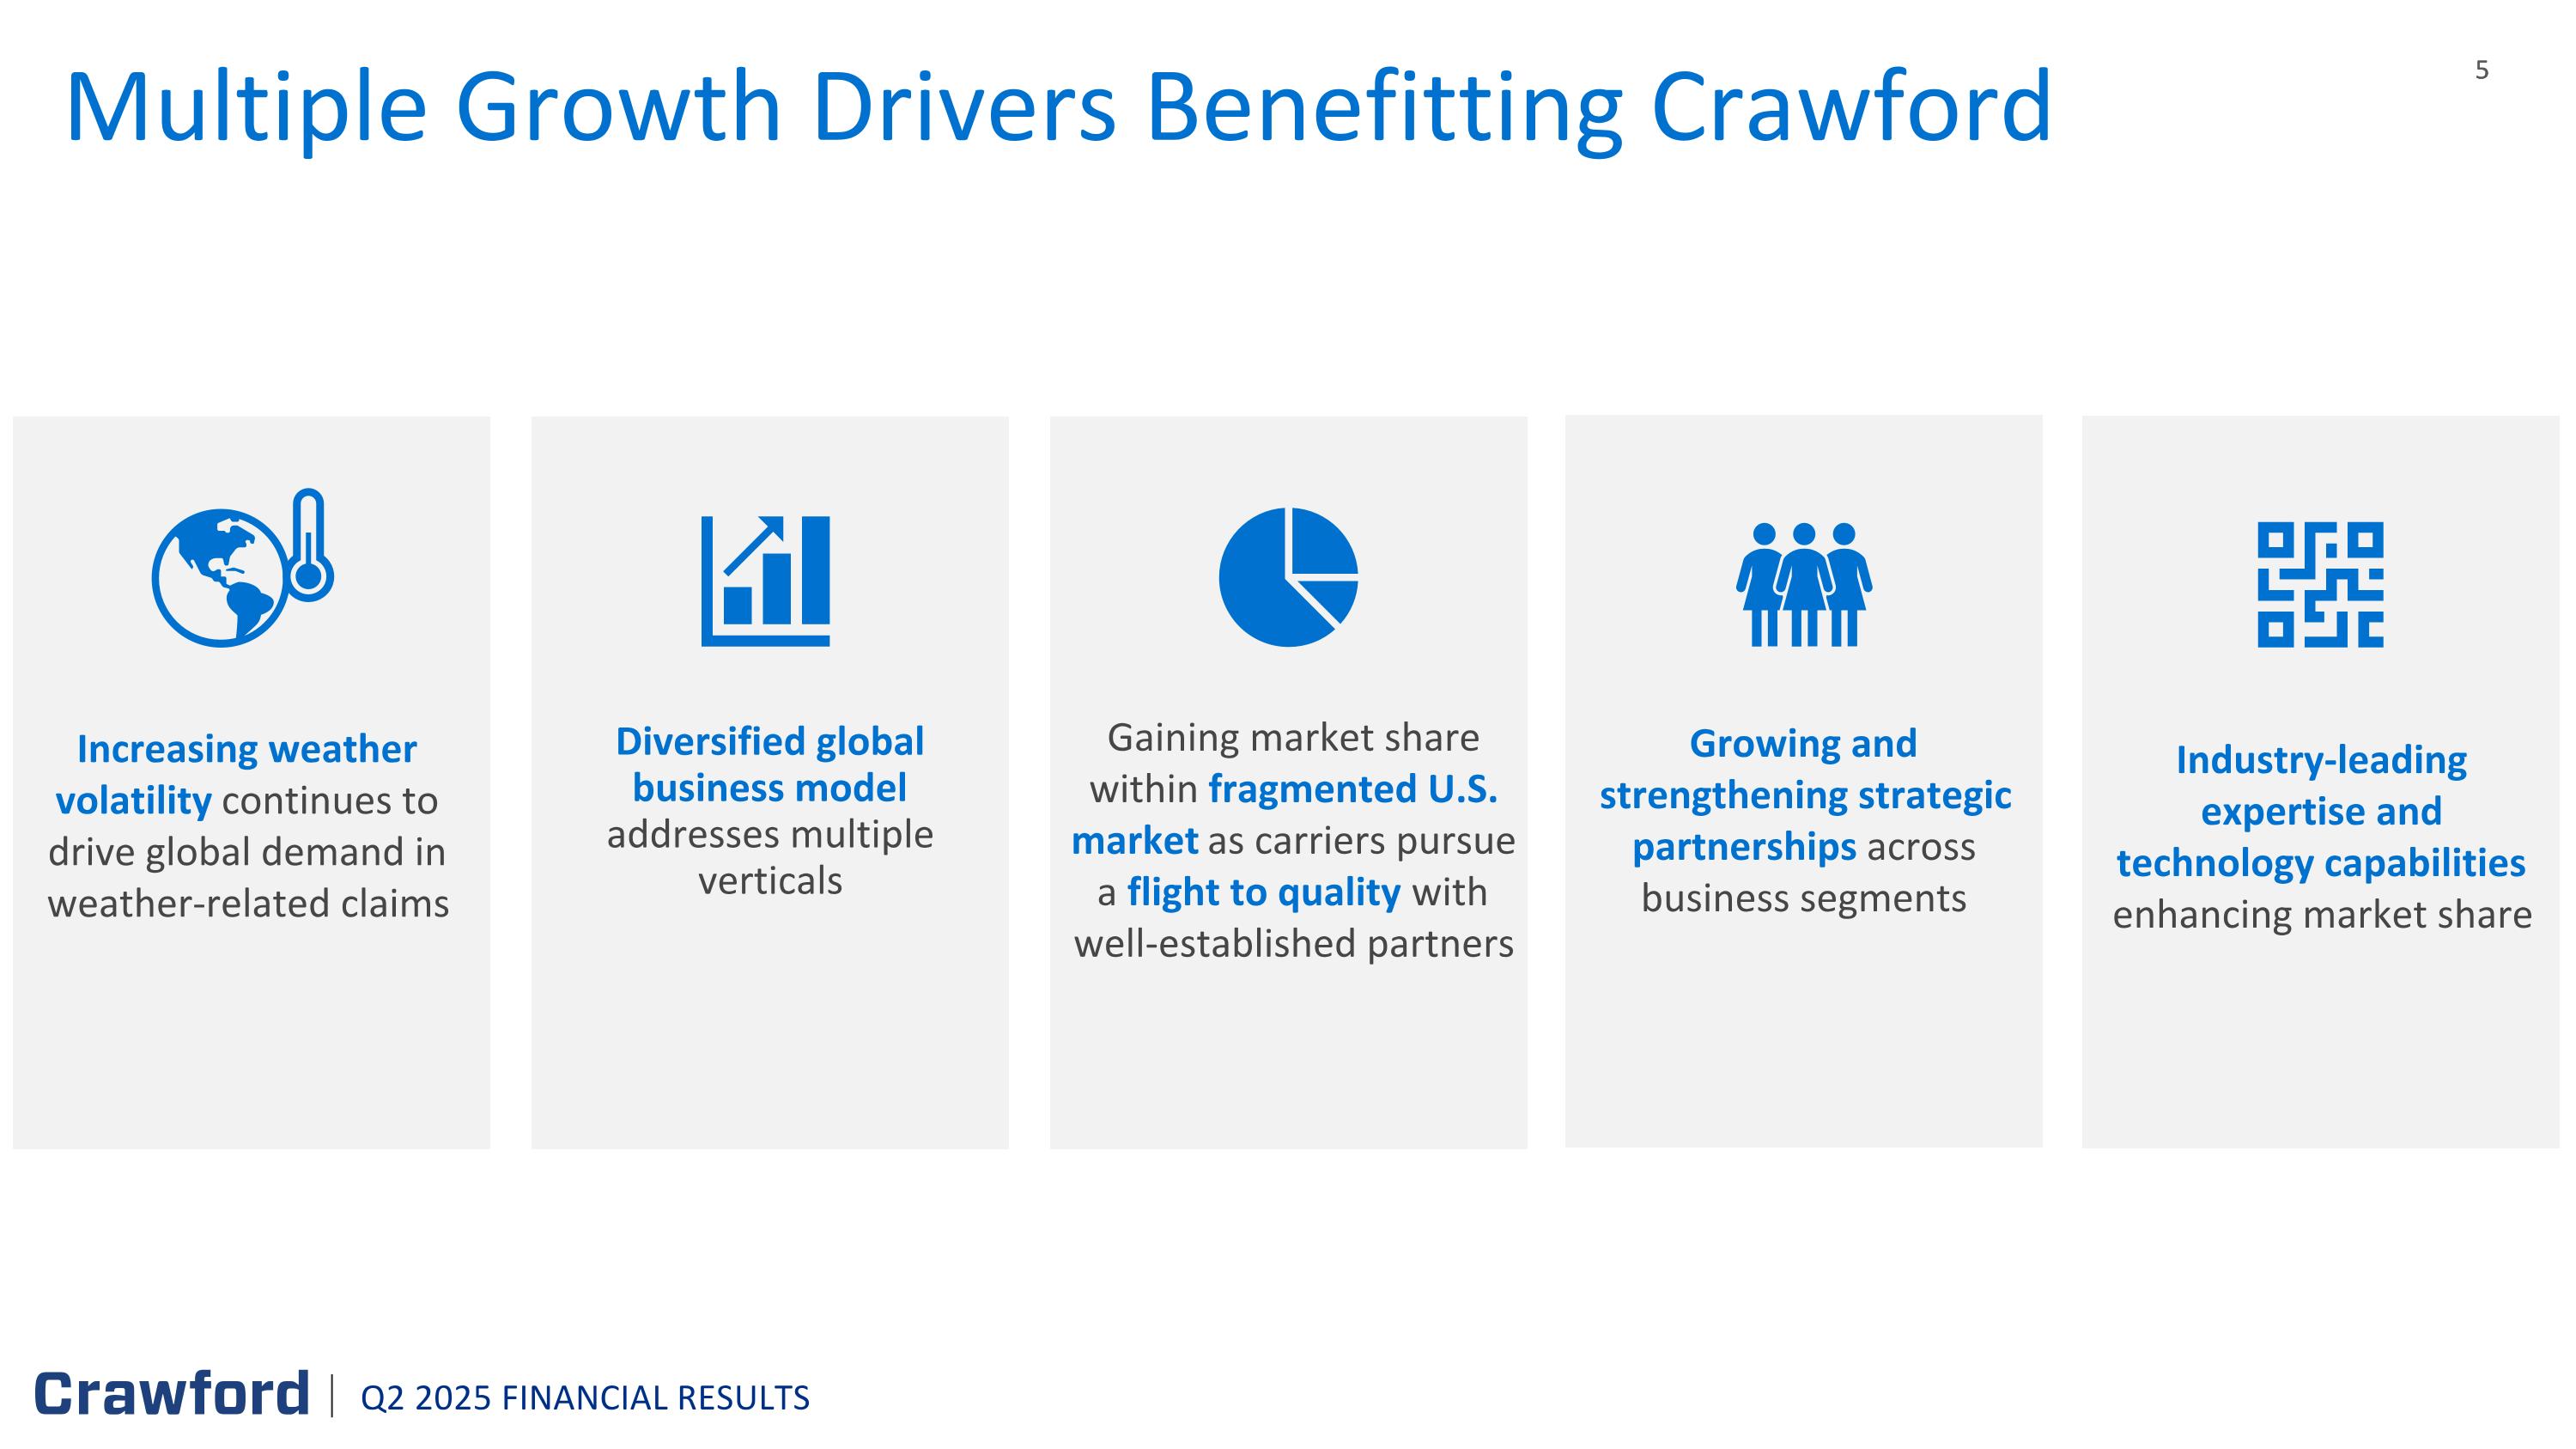
Increasing weather volatility continues to drive global demand in weather-related claims Gaining market share within fragmented U.S. market as carriers pursue a flight to quality with well-established partners Industry-leading expertise and technology capabilities enhancing market share Growing and strengthening strategic partnerships across business segments Diversified global business model addresses multiple verticals Multiple Growth Drivers Benefitting Crawford Q2 2025 FINANCIAL RESULTS
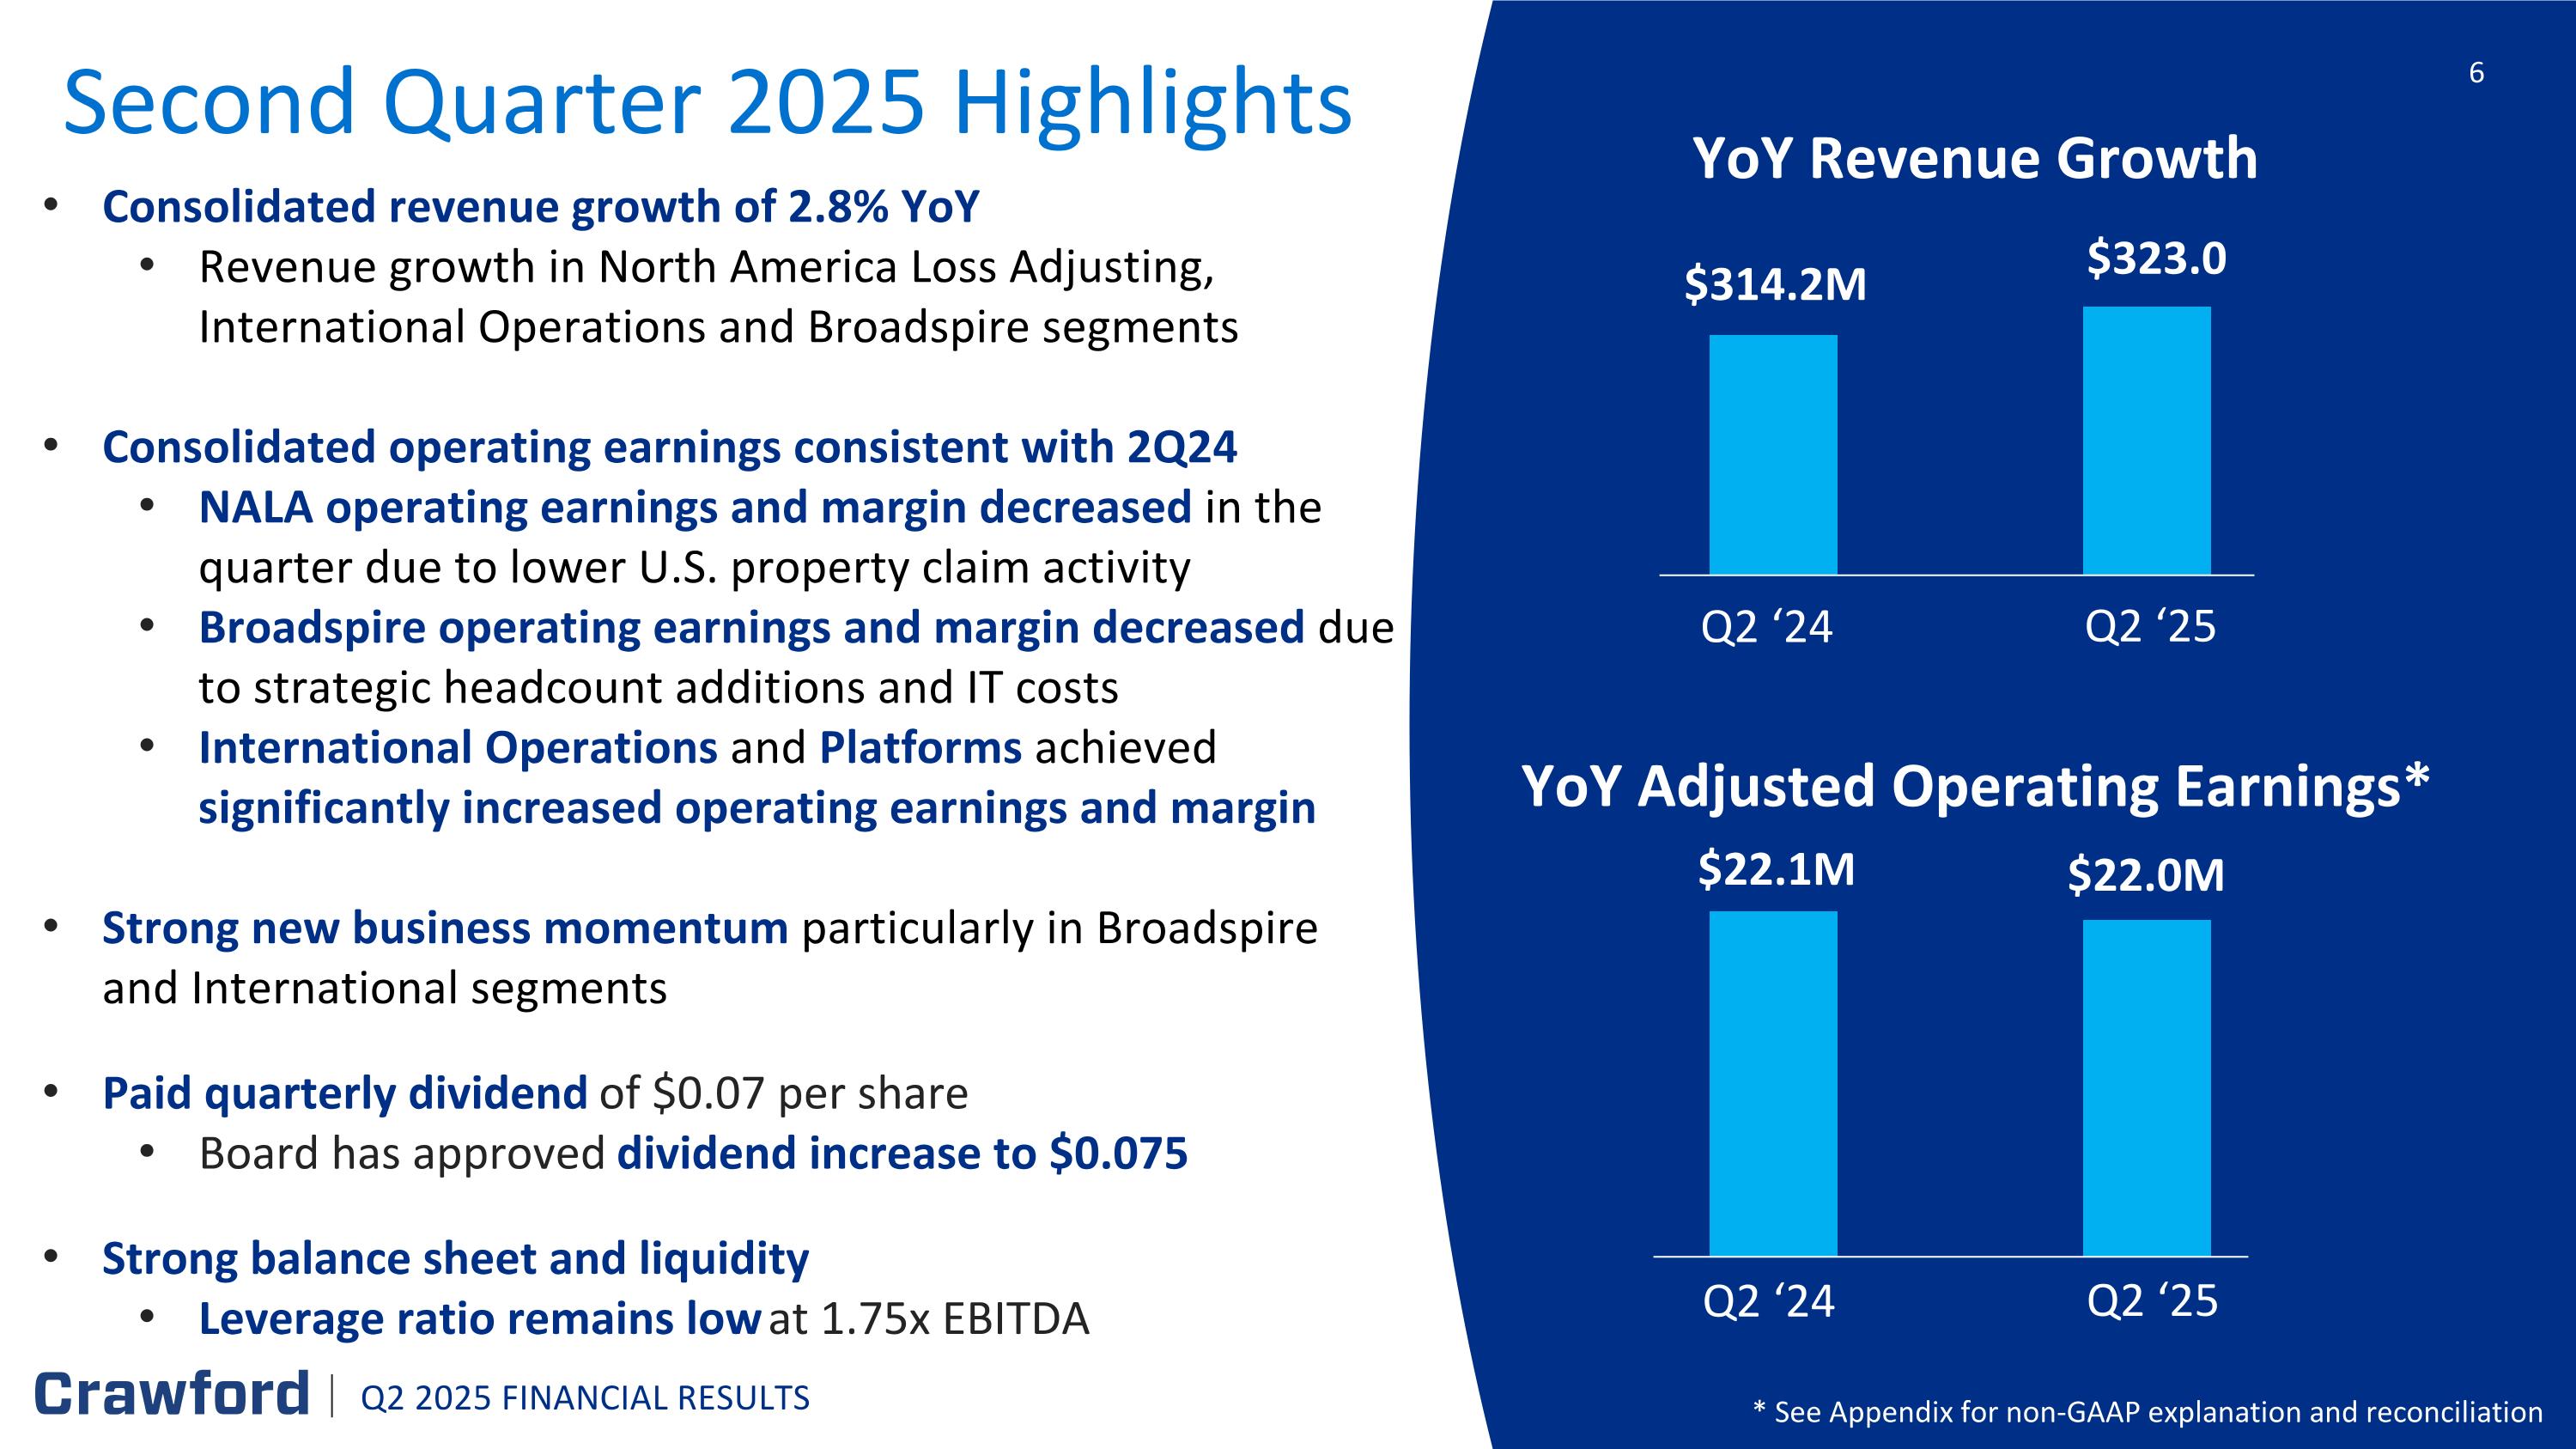
Second Quarter 2025 Highlights Consolidated revenue growth of 2.8% YoY Revenue growth in North America Loss Adjusting, International Operations and Broadspire segments Consolidated operating earnings consistent with 2Q24 NALA operating earnings and margin decreased in the quarter due to lower U.S. property claim activity Broadspire operating earnings and margin decreased due to strategic headcount additions and IT costs International Operations and Platforms achieved significantly increased operating earnings and margin Strong new business momentum particularly in Broadspire and International segments Paid quarterly dividend of $0.07 per share Board has approved dividend increase to $0.075 Strong balance sheet and liquidity Leverage ratio remains low at 1.75x EBITDA YoY Revenue Growth YoY Adjusted Operating Earnings* $314.2M $22.1M 6 * See Appendix for non-GAAP explanation and reconciliation Q2 ‘24 Q2 ‘25 Q2 ‘24 Q2 ‘25 Q2 2025 FINANCIAL RESULTS $323.0 $22.0M
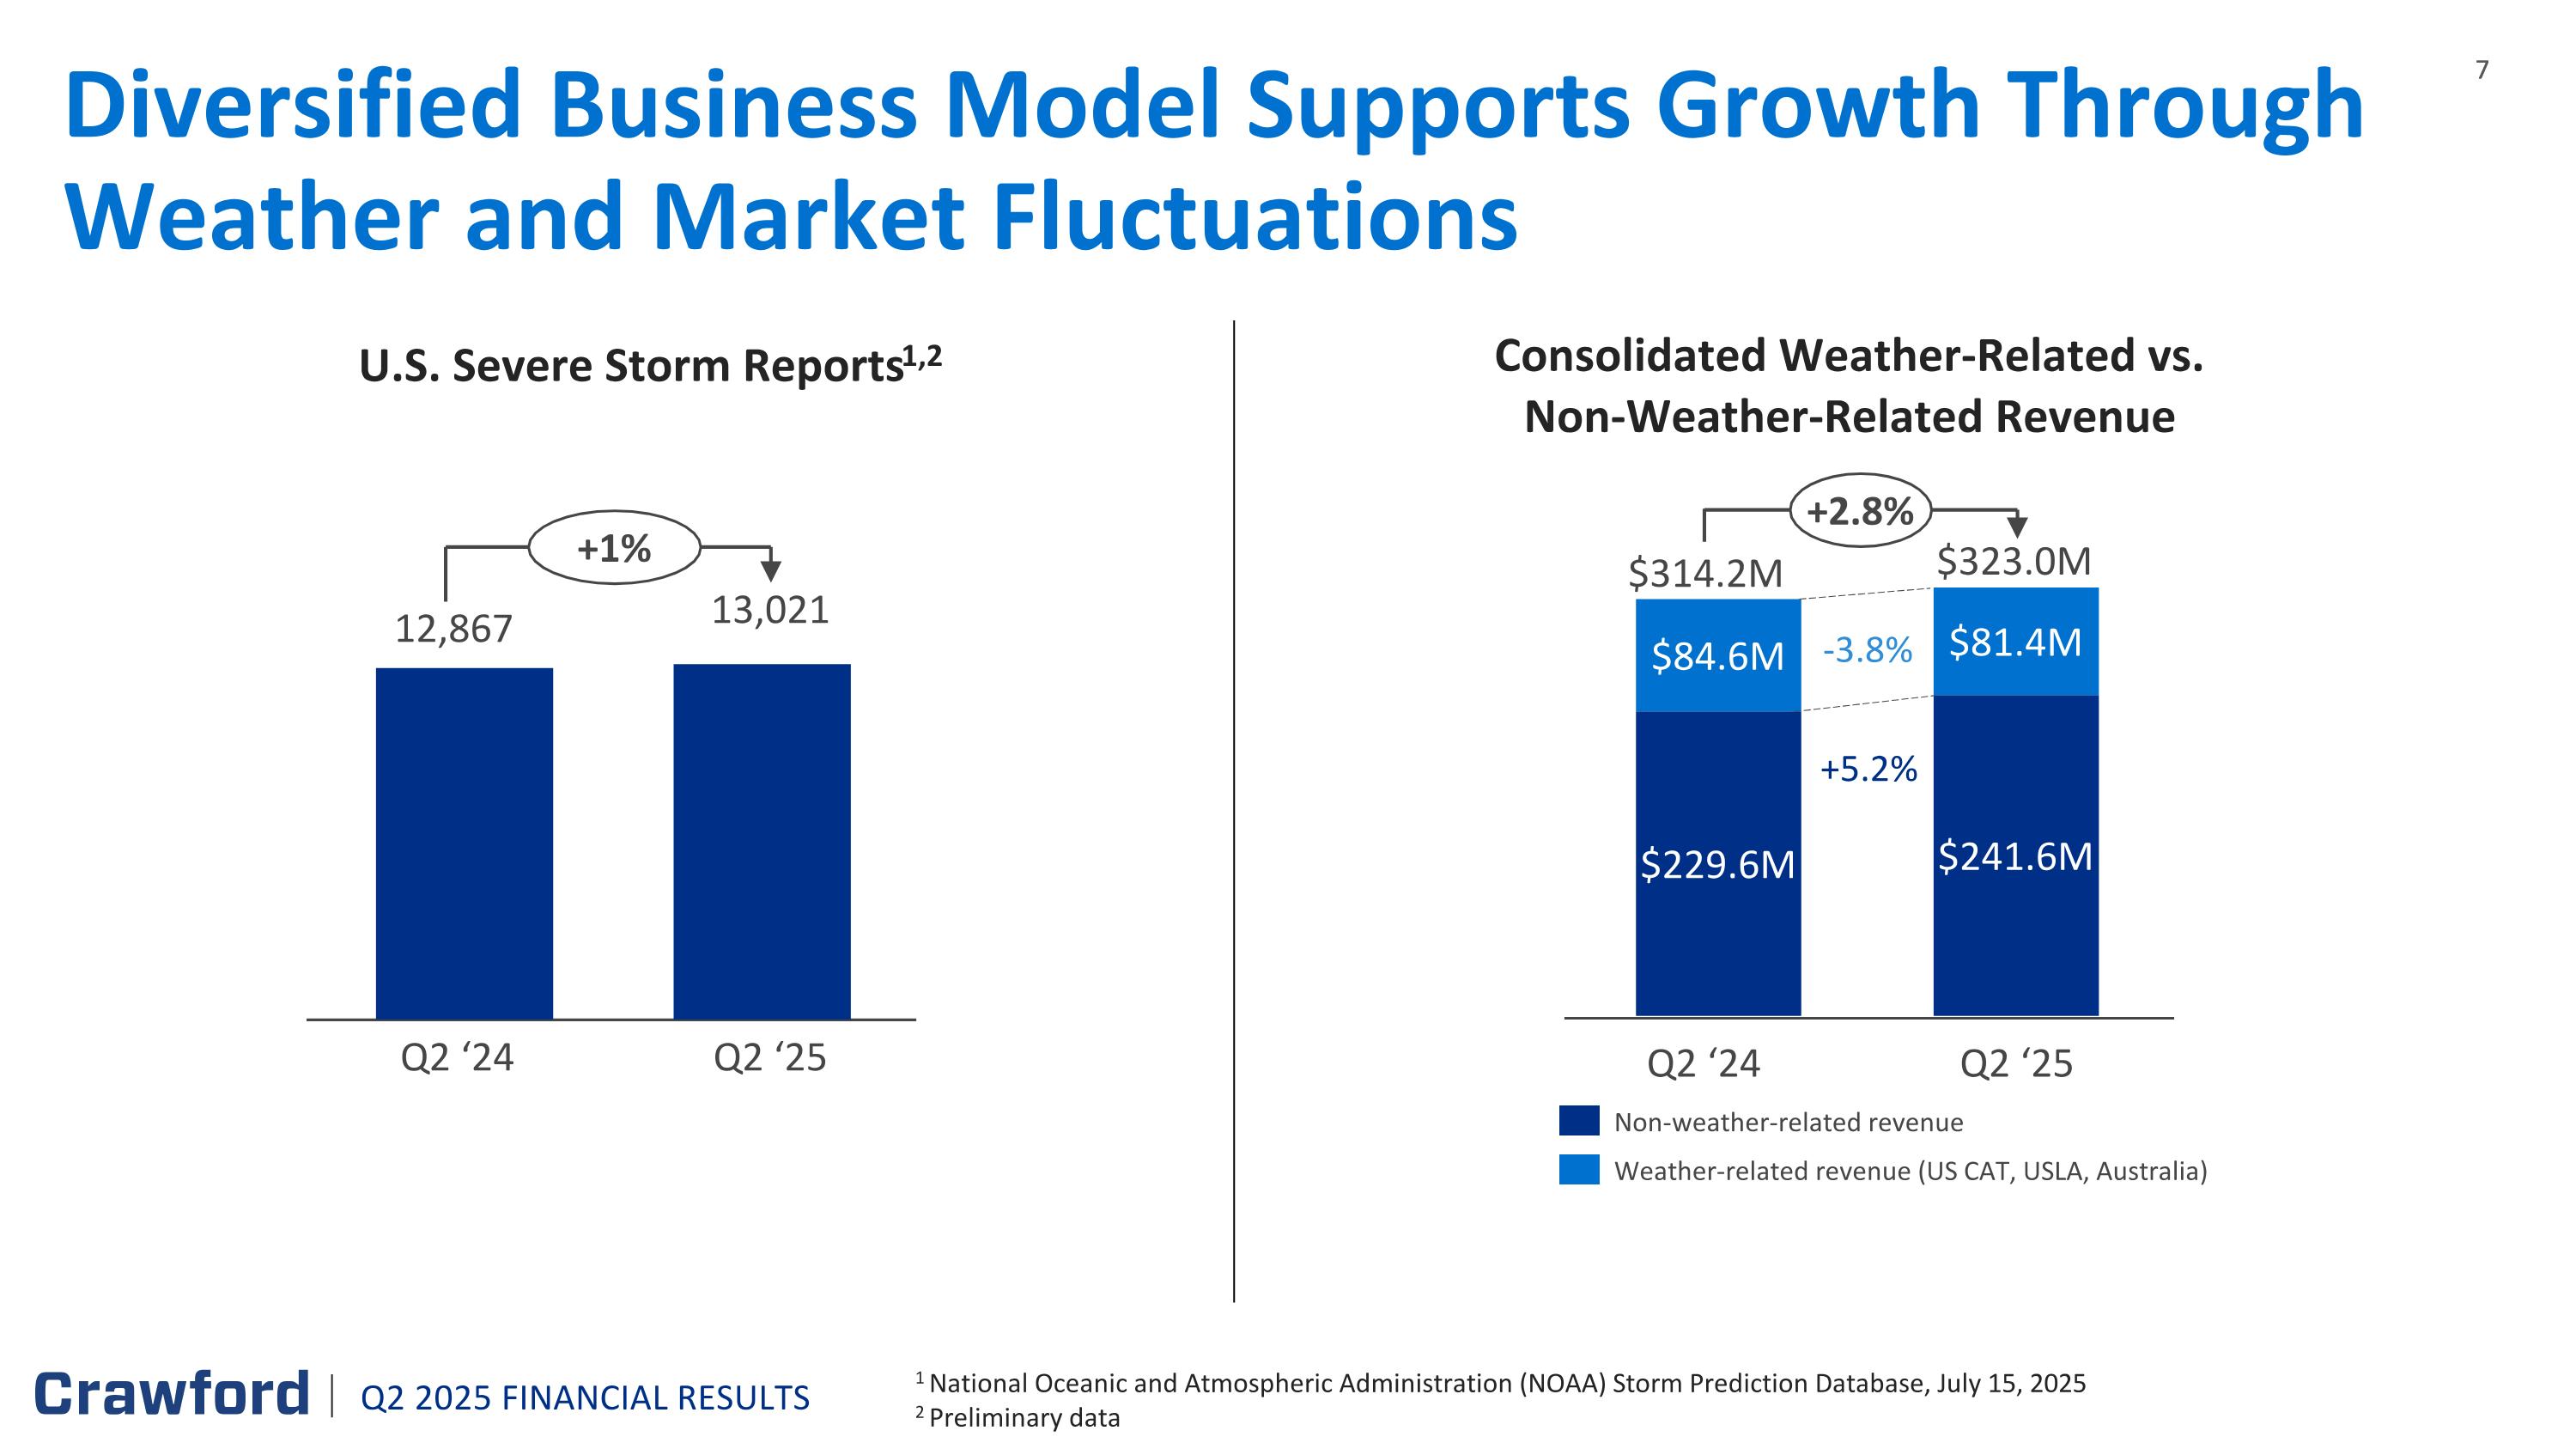
Q2 ‘24 Q2 ‘25 Non-weather-related revenue Weather-related revenue (US CAT, USLA, Australia) Diversified Business Model Supports Growth Through Weather and Market Fluctuations U.S. Severe Storm Reports1,2 1 National Oceanic and Atmospheric Administration (NOAA) Storm Prediction Database, July 15, 2025 2 Preliminary data Q2 2025 FINANCIAL RESULTS Q2 ‘24 Q2 ‘25 +1% 12,867 13,021 Consolidated Weather-Related vs. Non-Weather-Related Revenue $314.2M $323.0M +2.8% +5.2% -3.8%
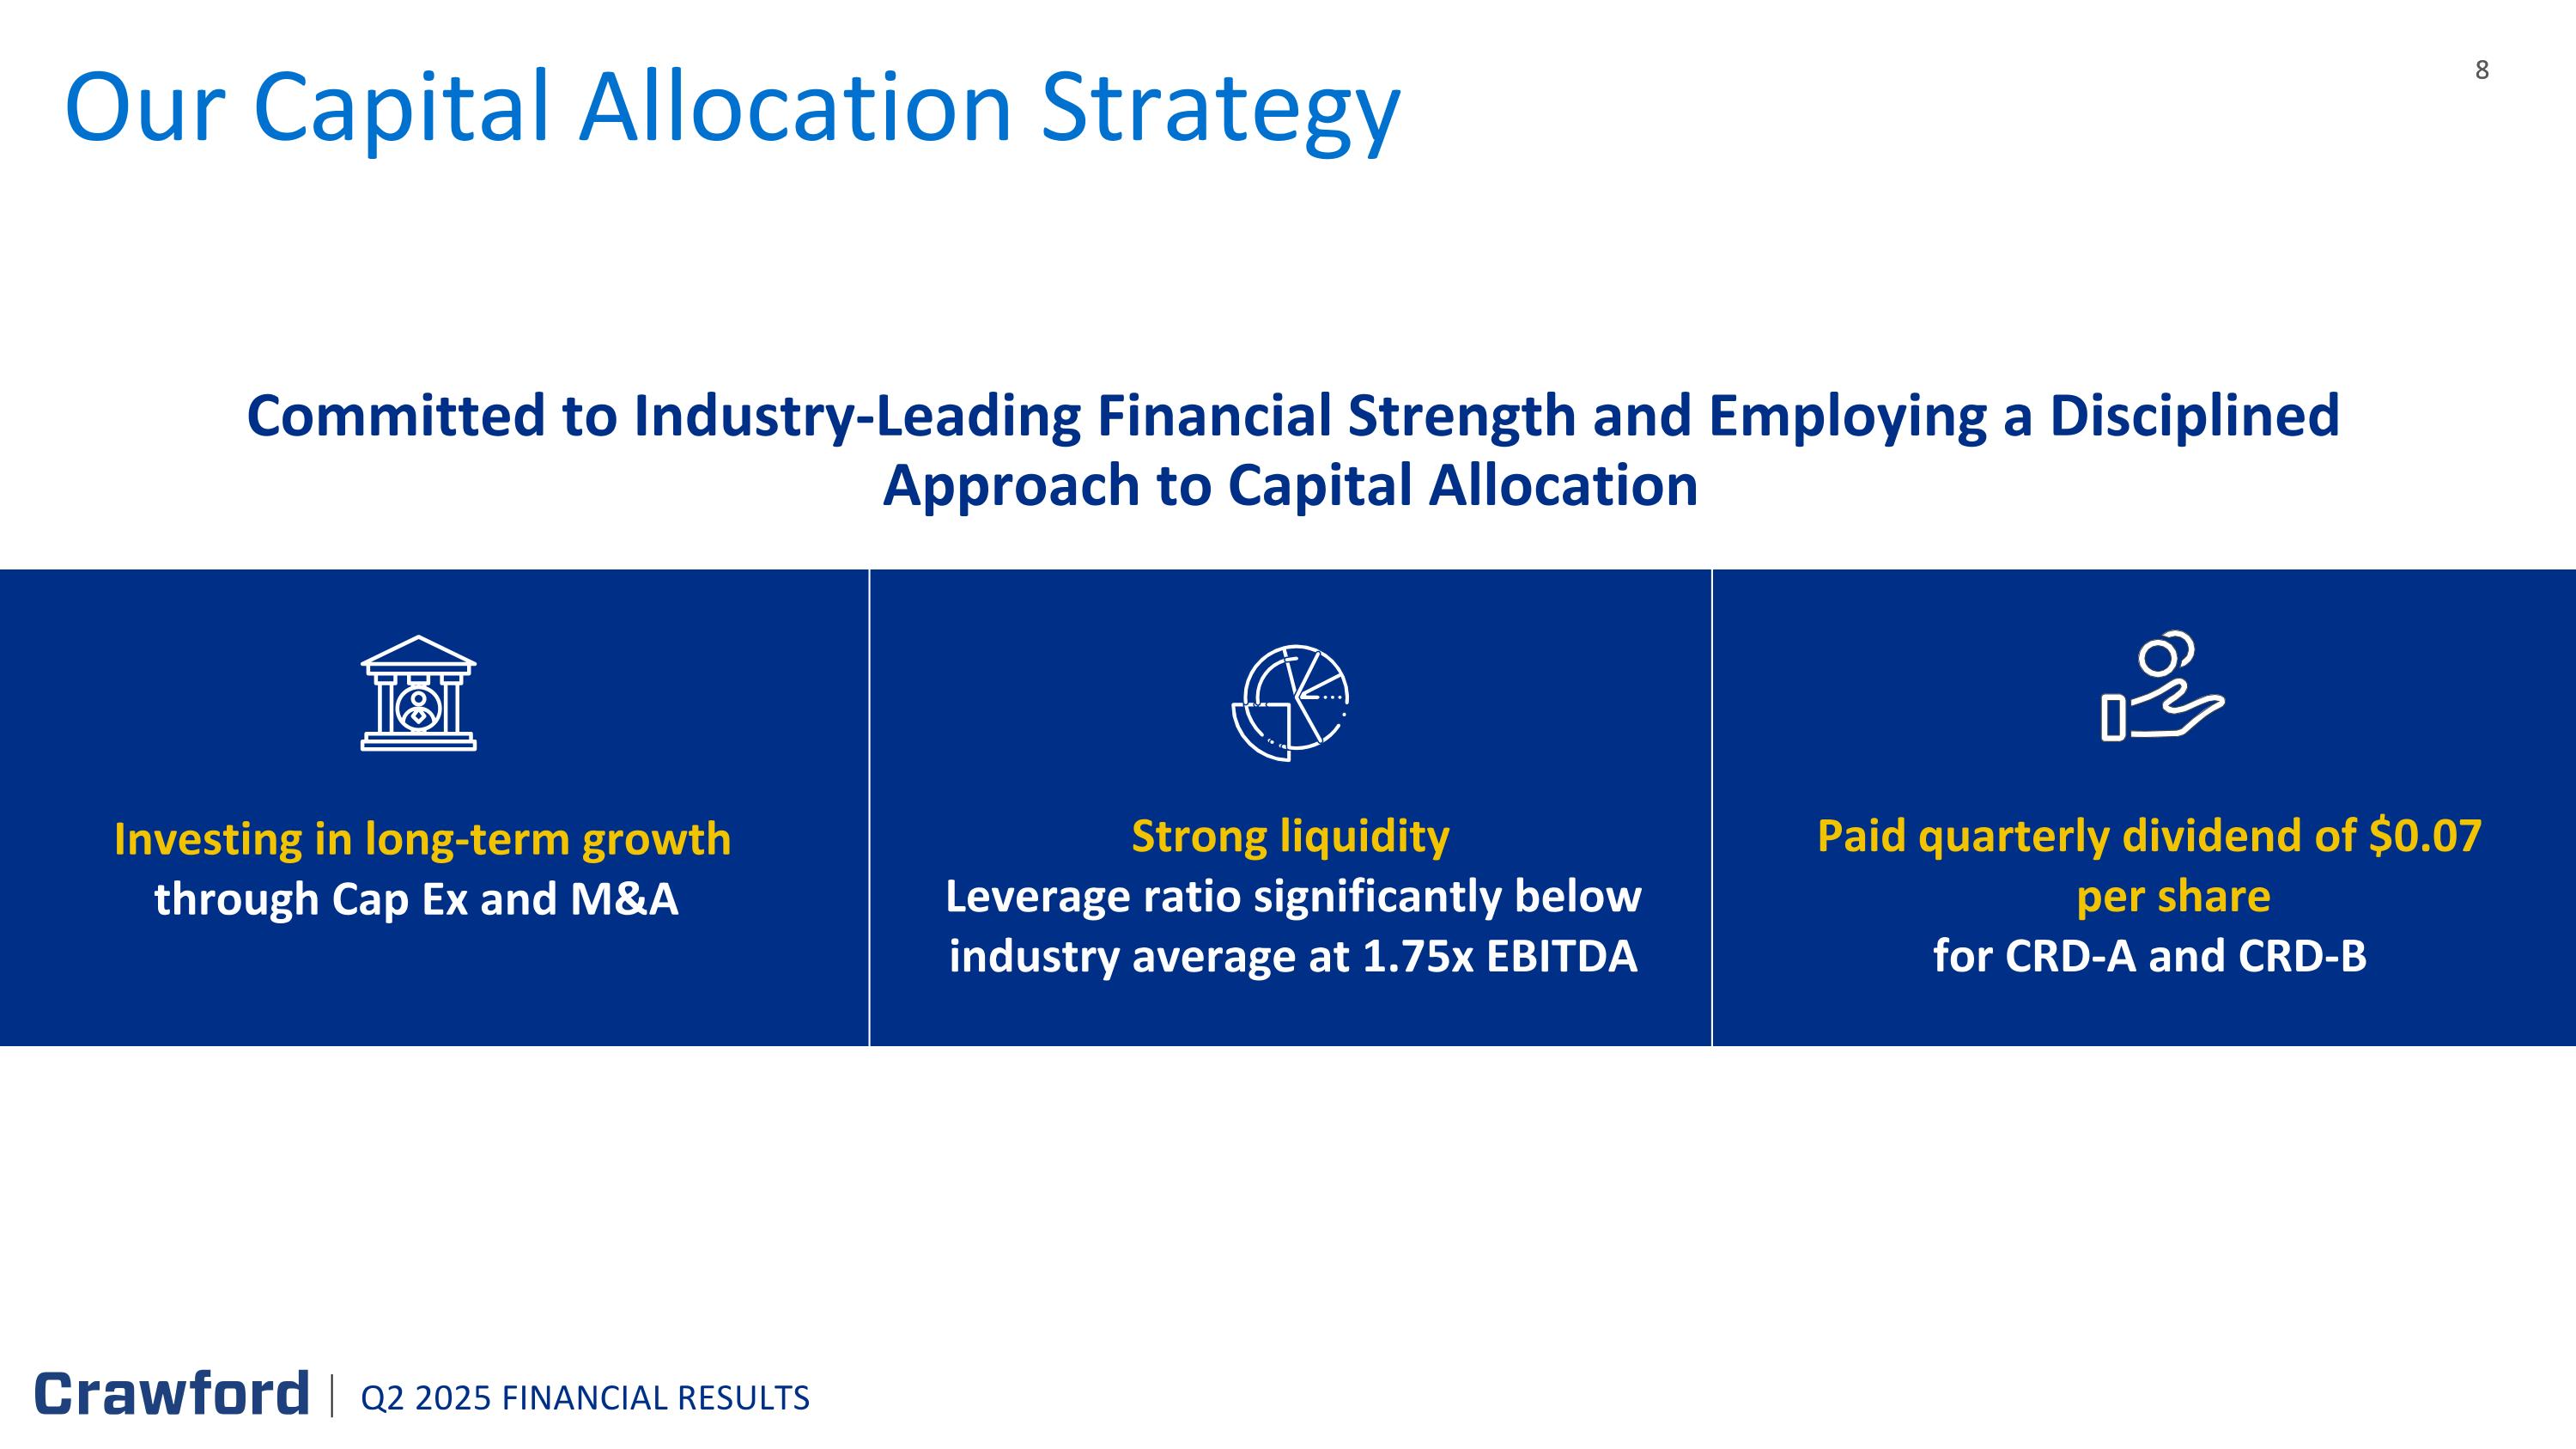
Our Capital Allocation Strategy Investing in long-term growth through Cap Ex and M&A Strong liquidity Leverage ratio significantly below industry average at 1.75x EBITDA Paid quarterly dividend of $0.07 per share for CRD-A and CRD-B Q2 2025 FINANCIAL RESULTS Committed to Industry-Leading Financial Strength and Employing a Disciplined Approach to Capital Allocation

OPERATIONAL UPDATE Bruce Swain, Chief Financial Officer Q2 2025 FINANCIAL RESULTS 9
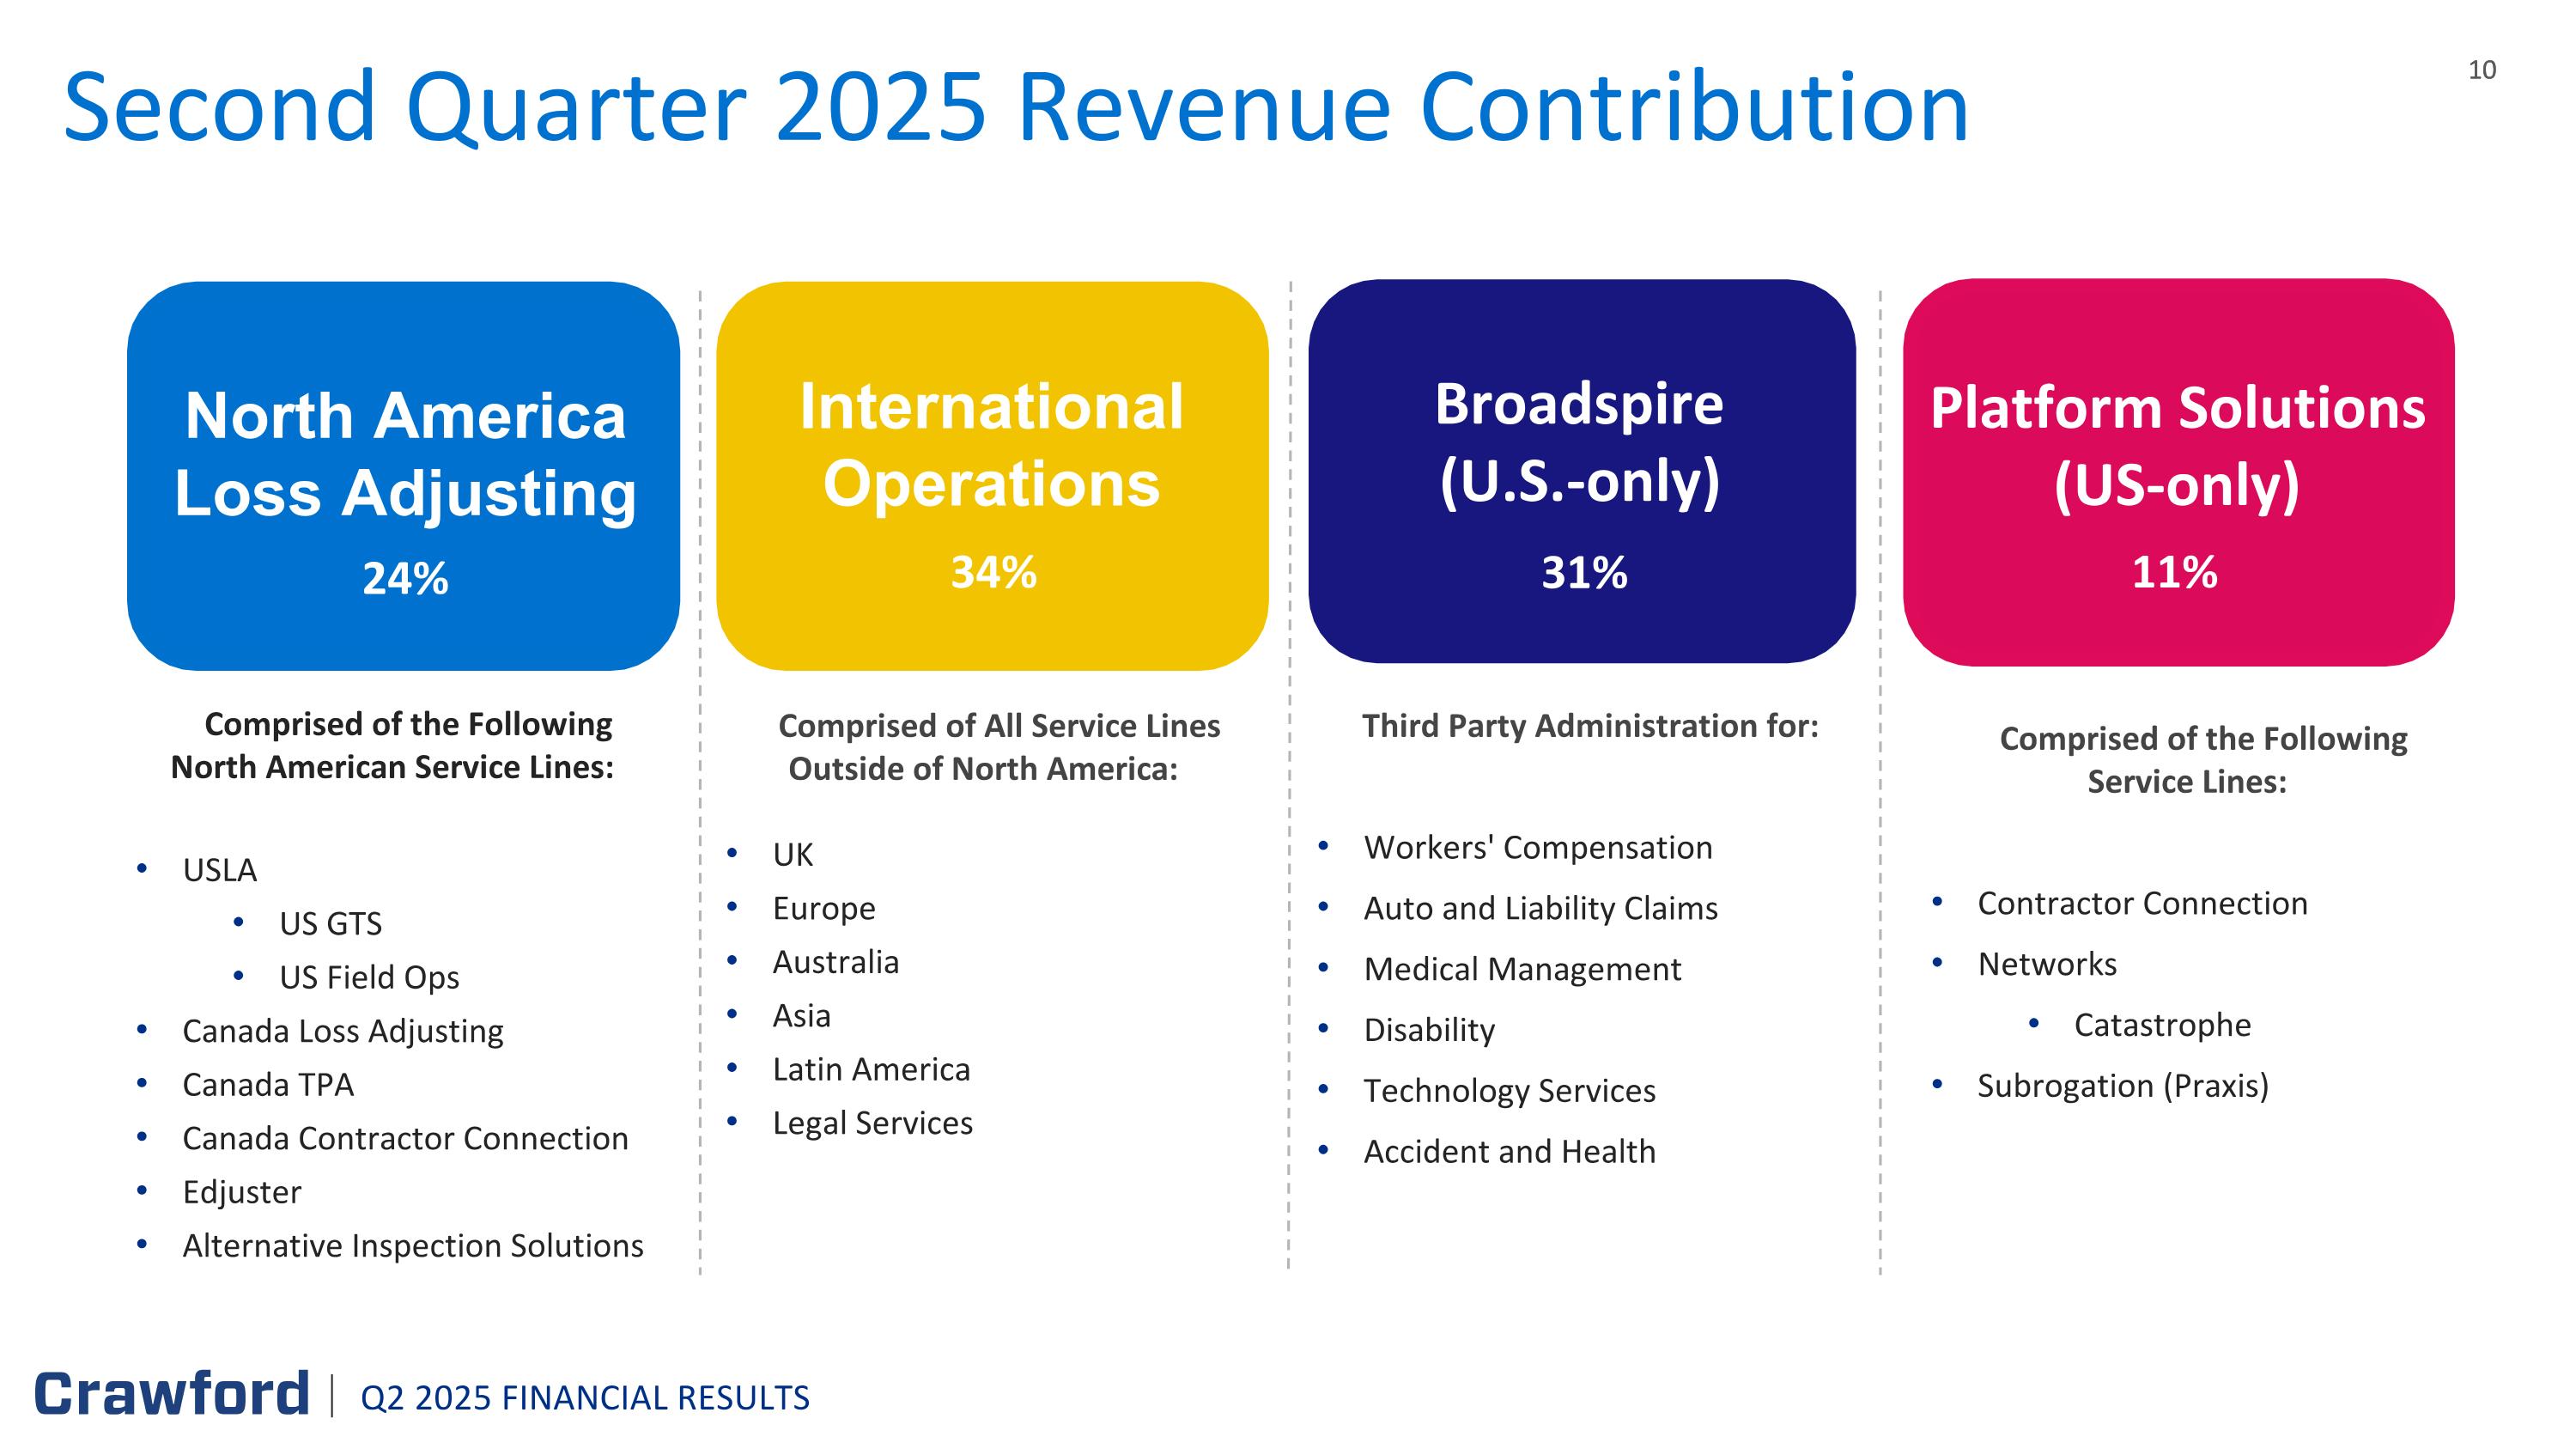
Comprised of All Service Lines Outside of North America: UK Europe Australia Asia Latin America Legal Services International Operations 34% Third Party Administration for: Workers' Compensation Auto and Liability Claims Medical Management Disability Technology Services Accident and Health Comprised of the Following Service Lines: Contractor Connection Networks Catastrophe Subrogation (Praxis) Comprised of the Following North American Service Lines: USLA US GTS US Field Ops Canada Loss Adjusting Canada TPA Canada Contractor Connection Edjuster Alternative Inspection Solutions North America Loss Adjusting 24% Broadspire (U.S.-only) 31% Platform Solutions (US-only) 11% Second Quarter 2025 Revenue Contribution Q2 2025 FINANCIAL RESULTS
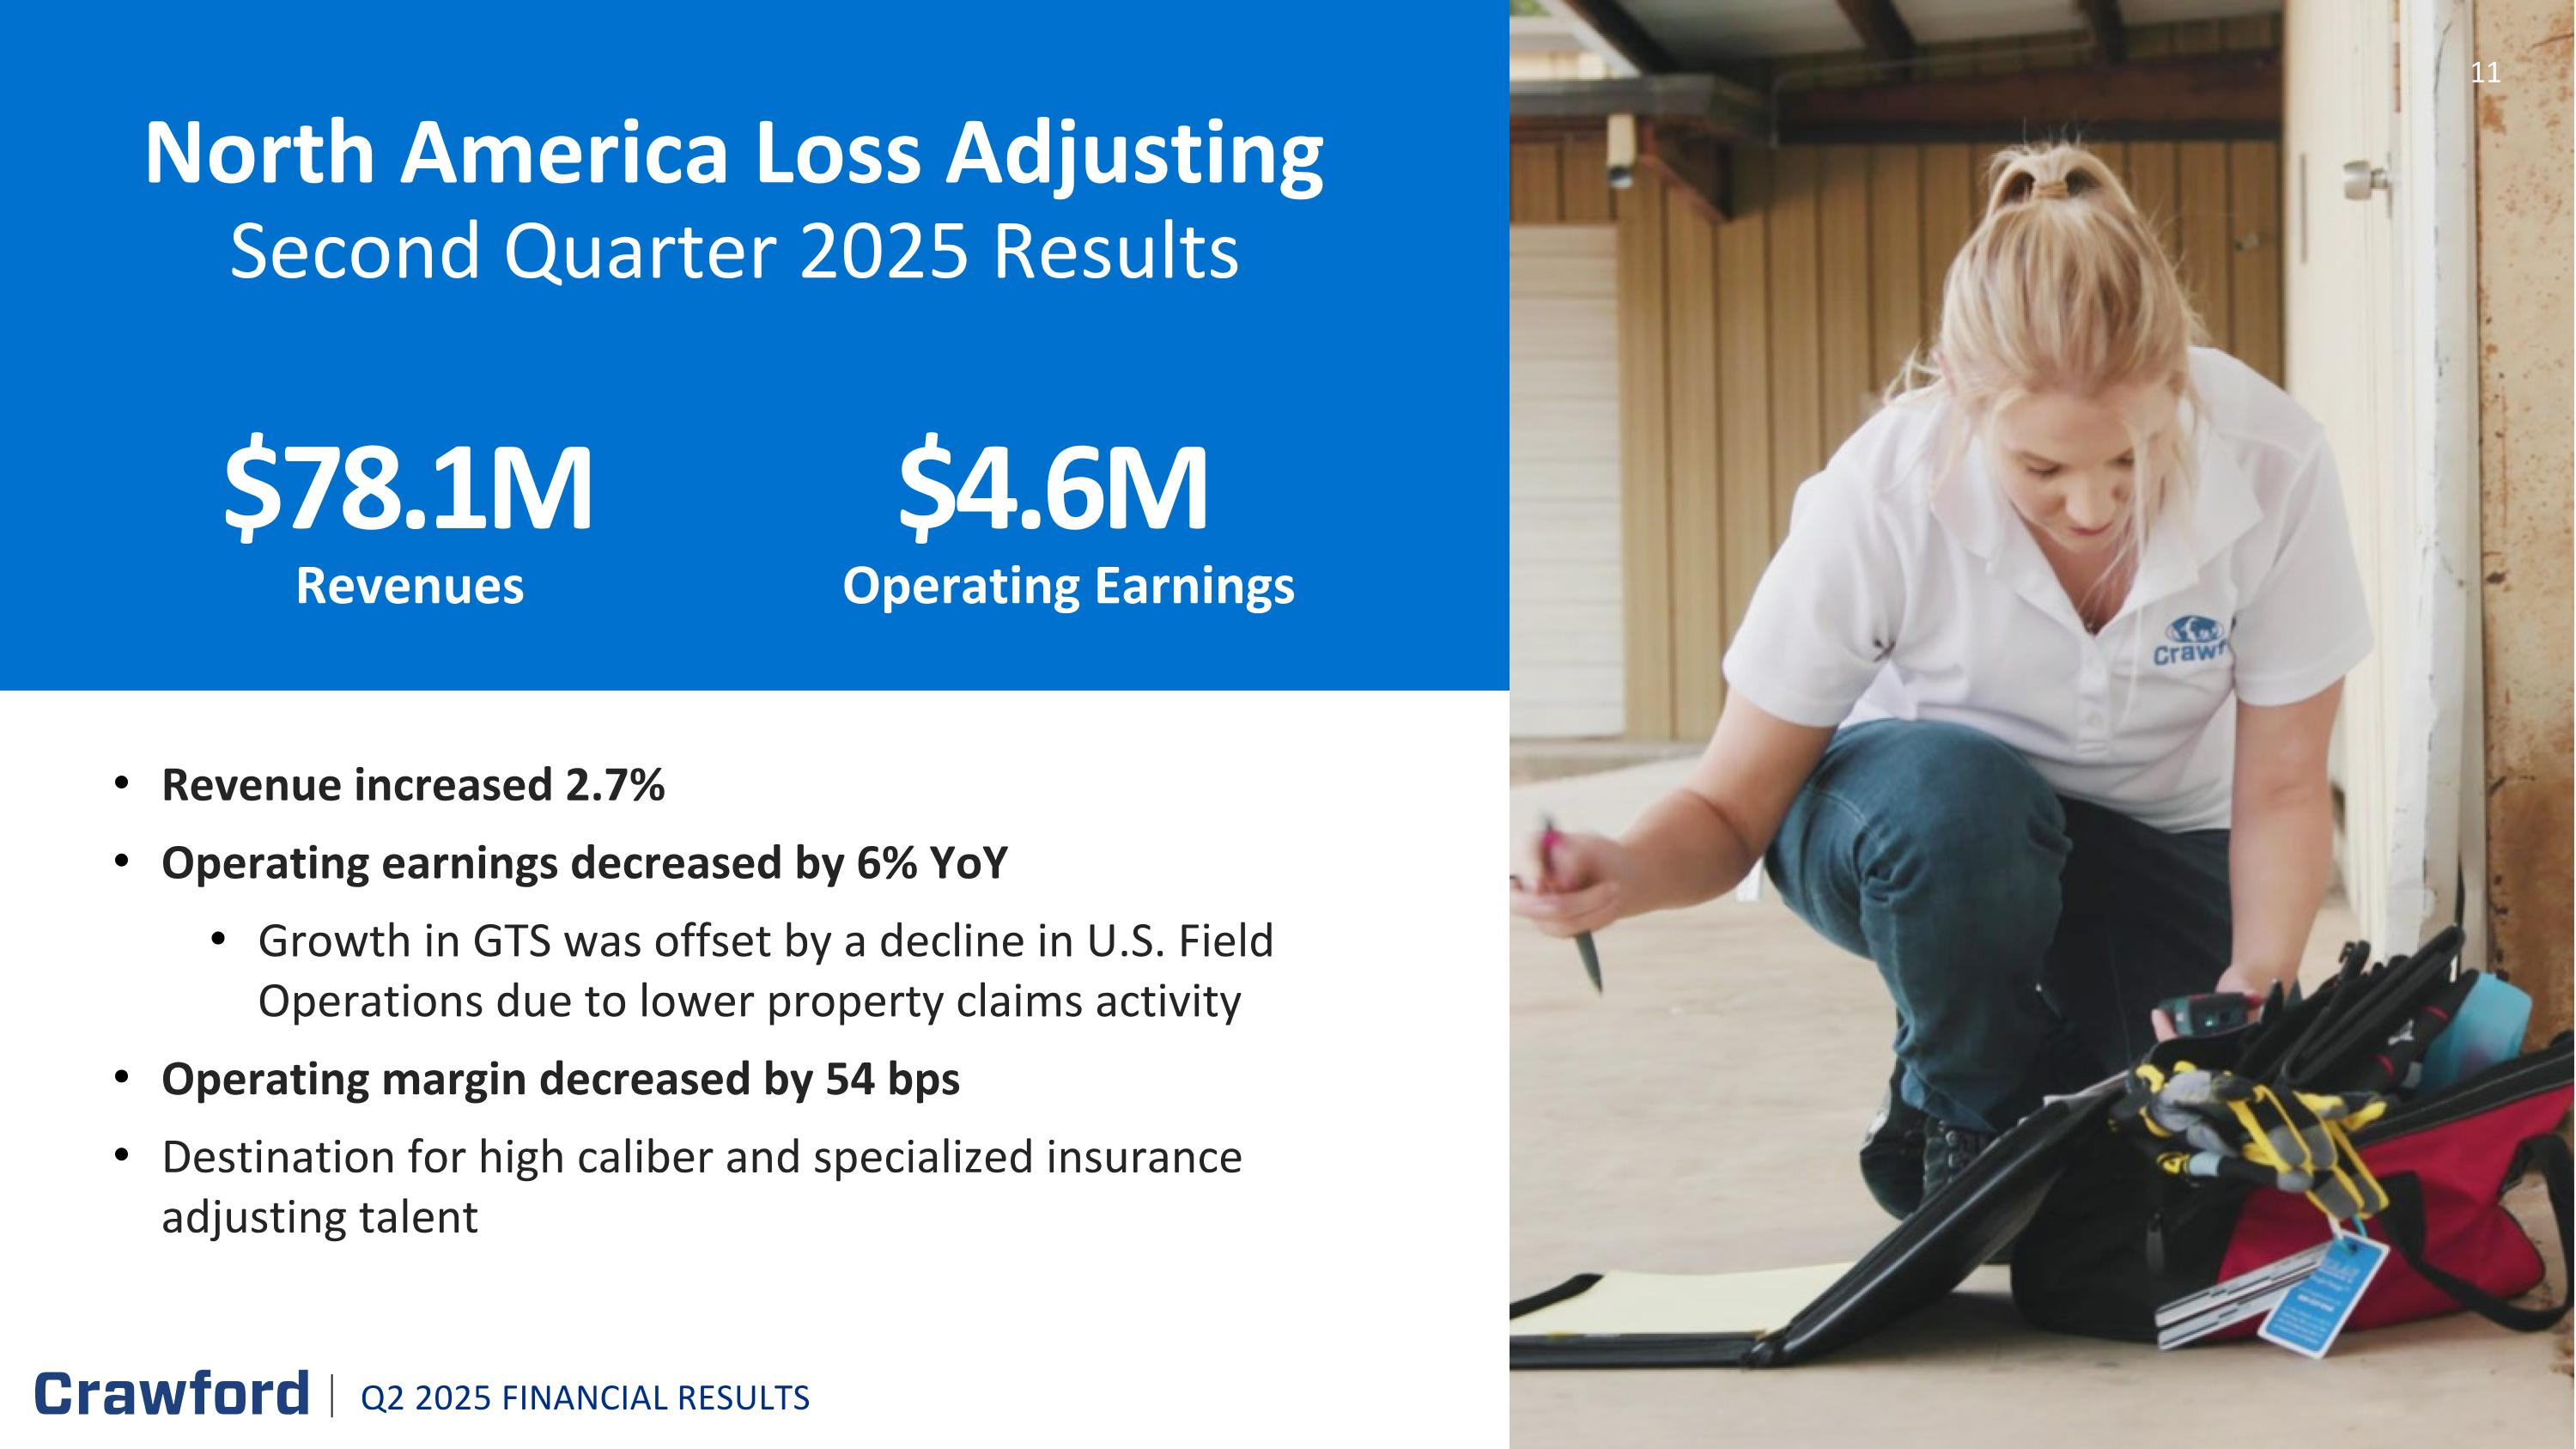
Revenue increased 2.7% Operating earnings decreased by 6% YoY Growth in GTS was offset by a decline in U.S. Field Operations due to lower property claims activity Operating margin decreased by 54 bps Destination for high caliber and specialized insurance adjusting talent North America Loss Adjusting Second Quarter 2025 Results Revenues $78.1M Operating Earnings $4.6M 11 Q2 2025 FINANCIAL RESULTS
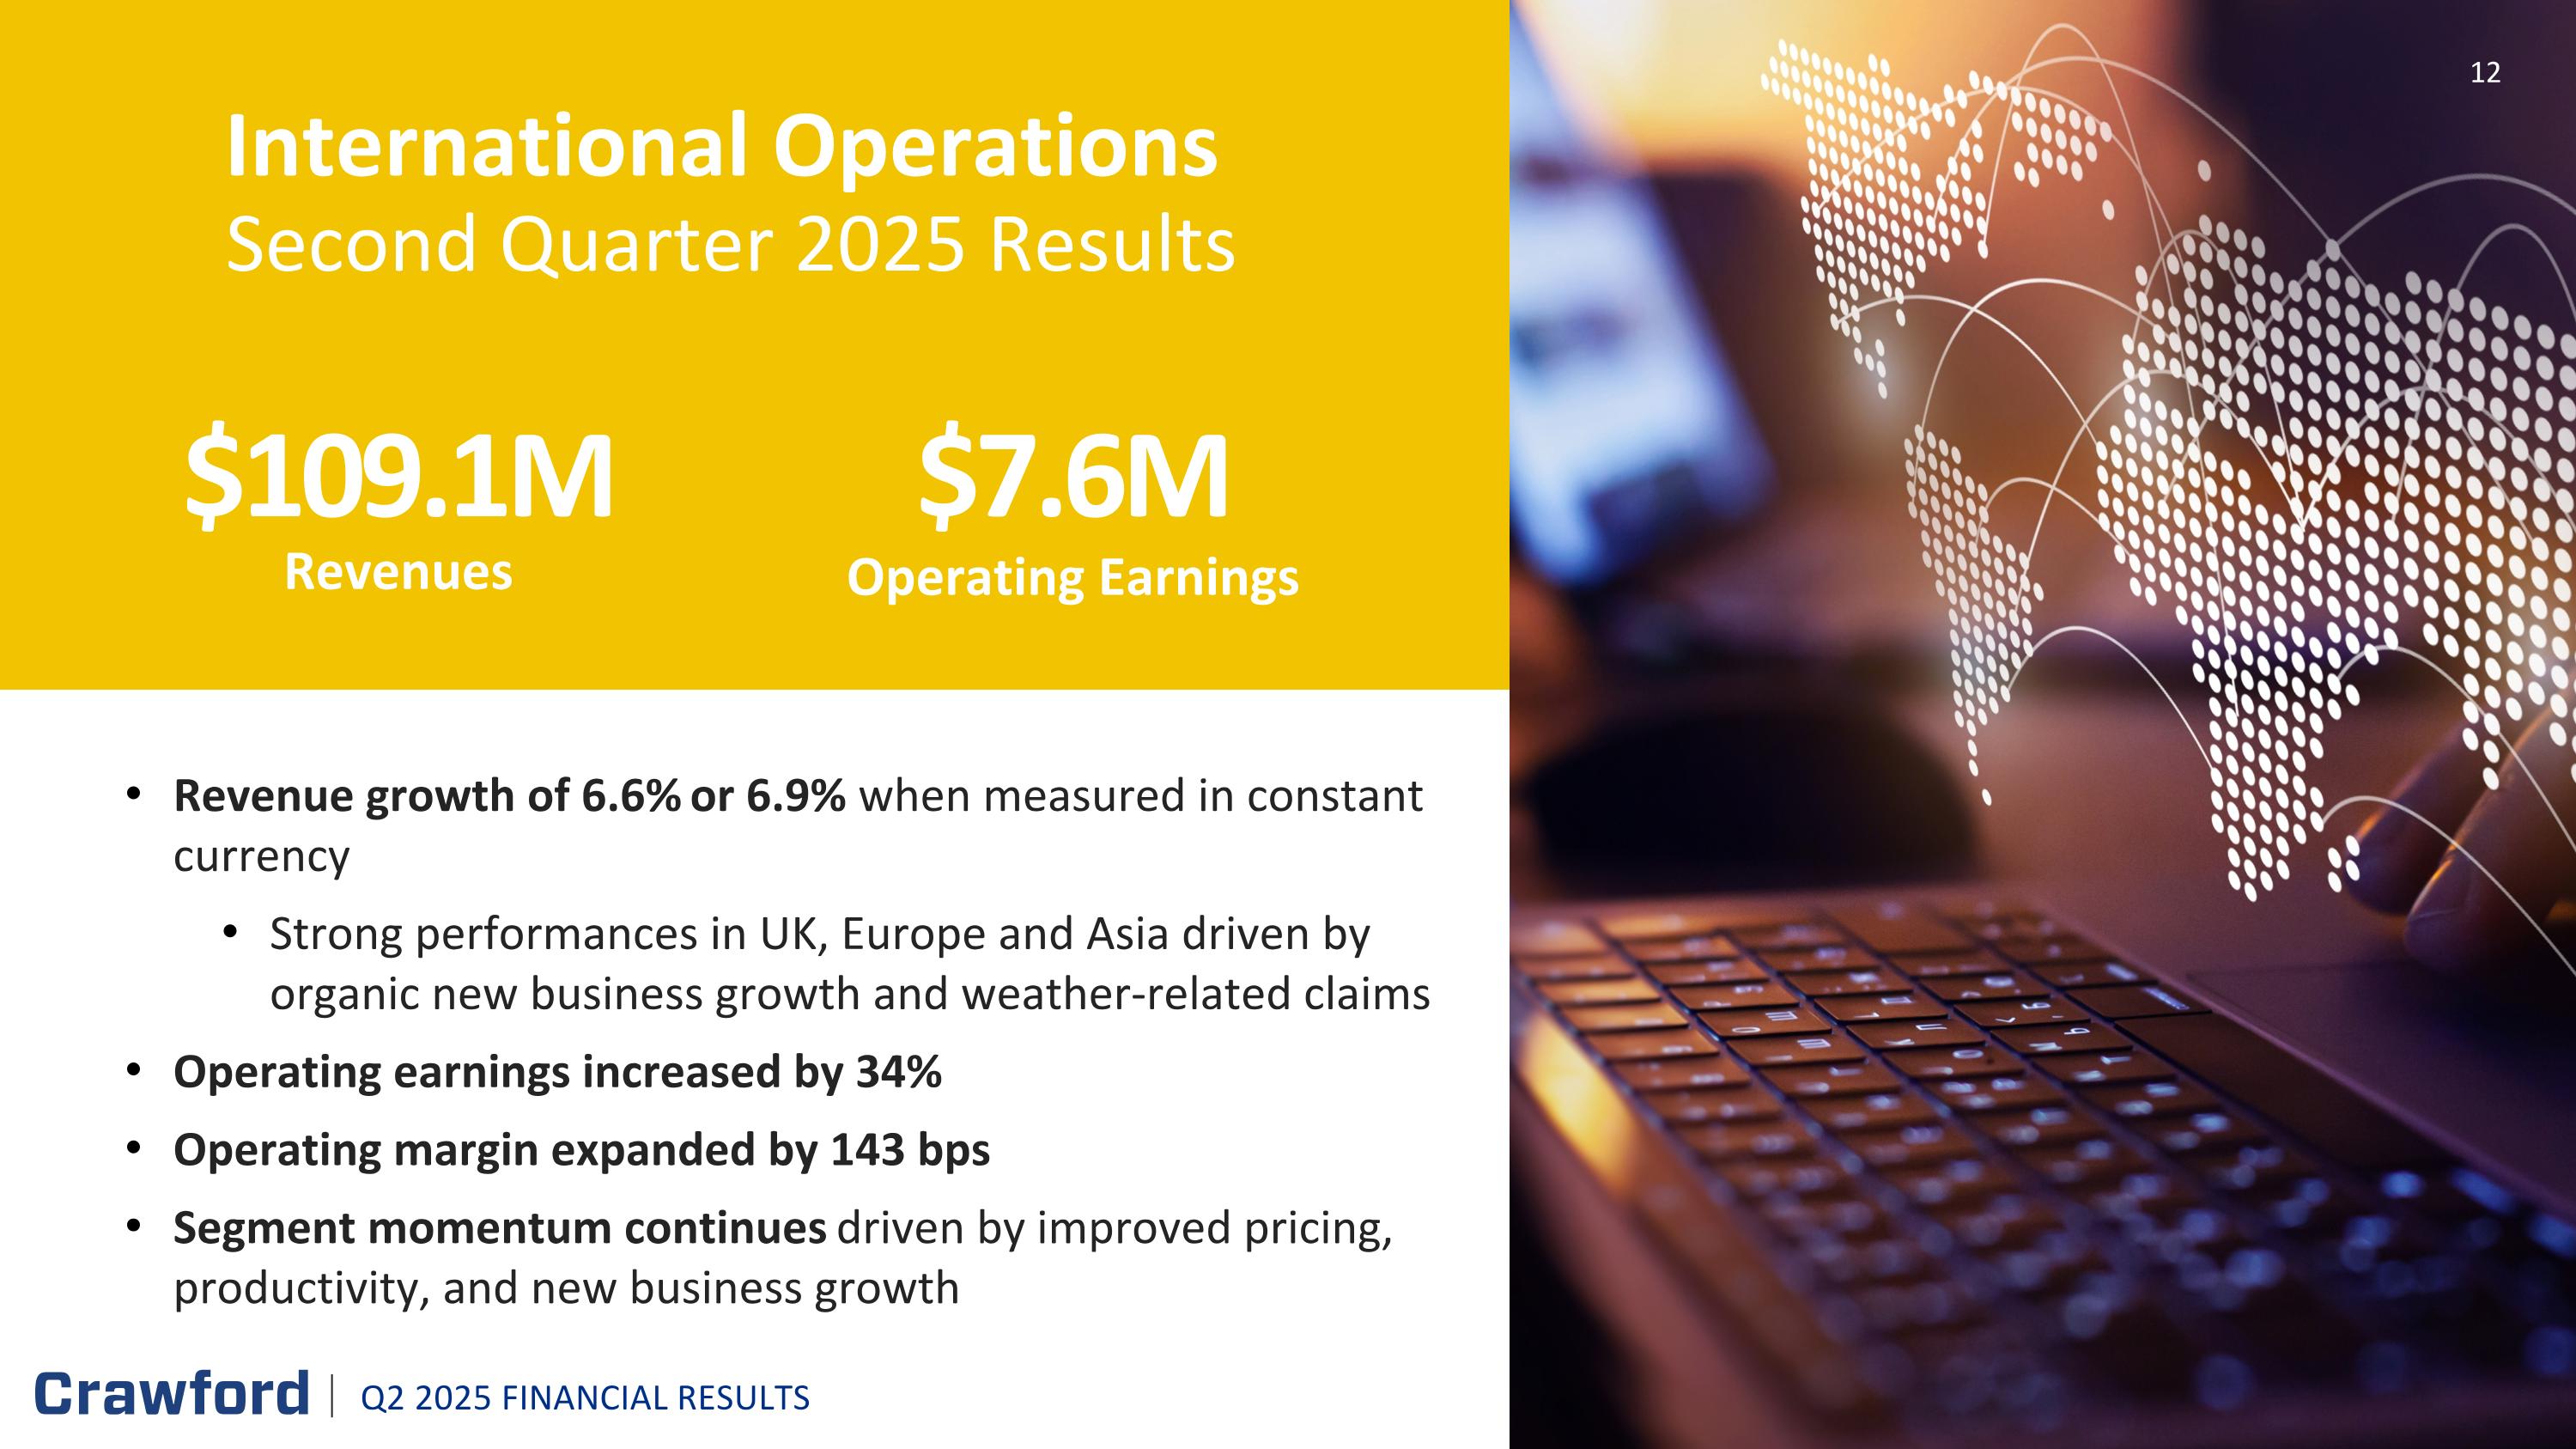
Revenue growth of 6.6% or 6.9% when measured in constant currency Strong performances in UK, Europe and Asia driven by organic new business growth and weather-related claims Operating earnings increased by 34% Operating margin expanded by 143 bps Segment momentum continues driven by improved pricing, productivity, and new business growth International Operations Second Quarter 2025 Results Revenues $109.1M Operating Earnings $7.6M 12 Q2 2025 FINANCIAL RESULTS

Broadspire Second Quarter 2025 Results Revenues $100.6M $13.7M Operating Earnings 13 Q2 2025 FINANCIAL RESULTS Record quarterly revenues YoY growth of 3.6% with growth across all service lines driven by new business wins Operating earnings and margin impacted by strategic headcount additions related to new client wins and higher investments in technology Continued new client wins Retention rate of 95.4%
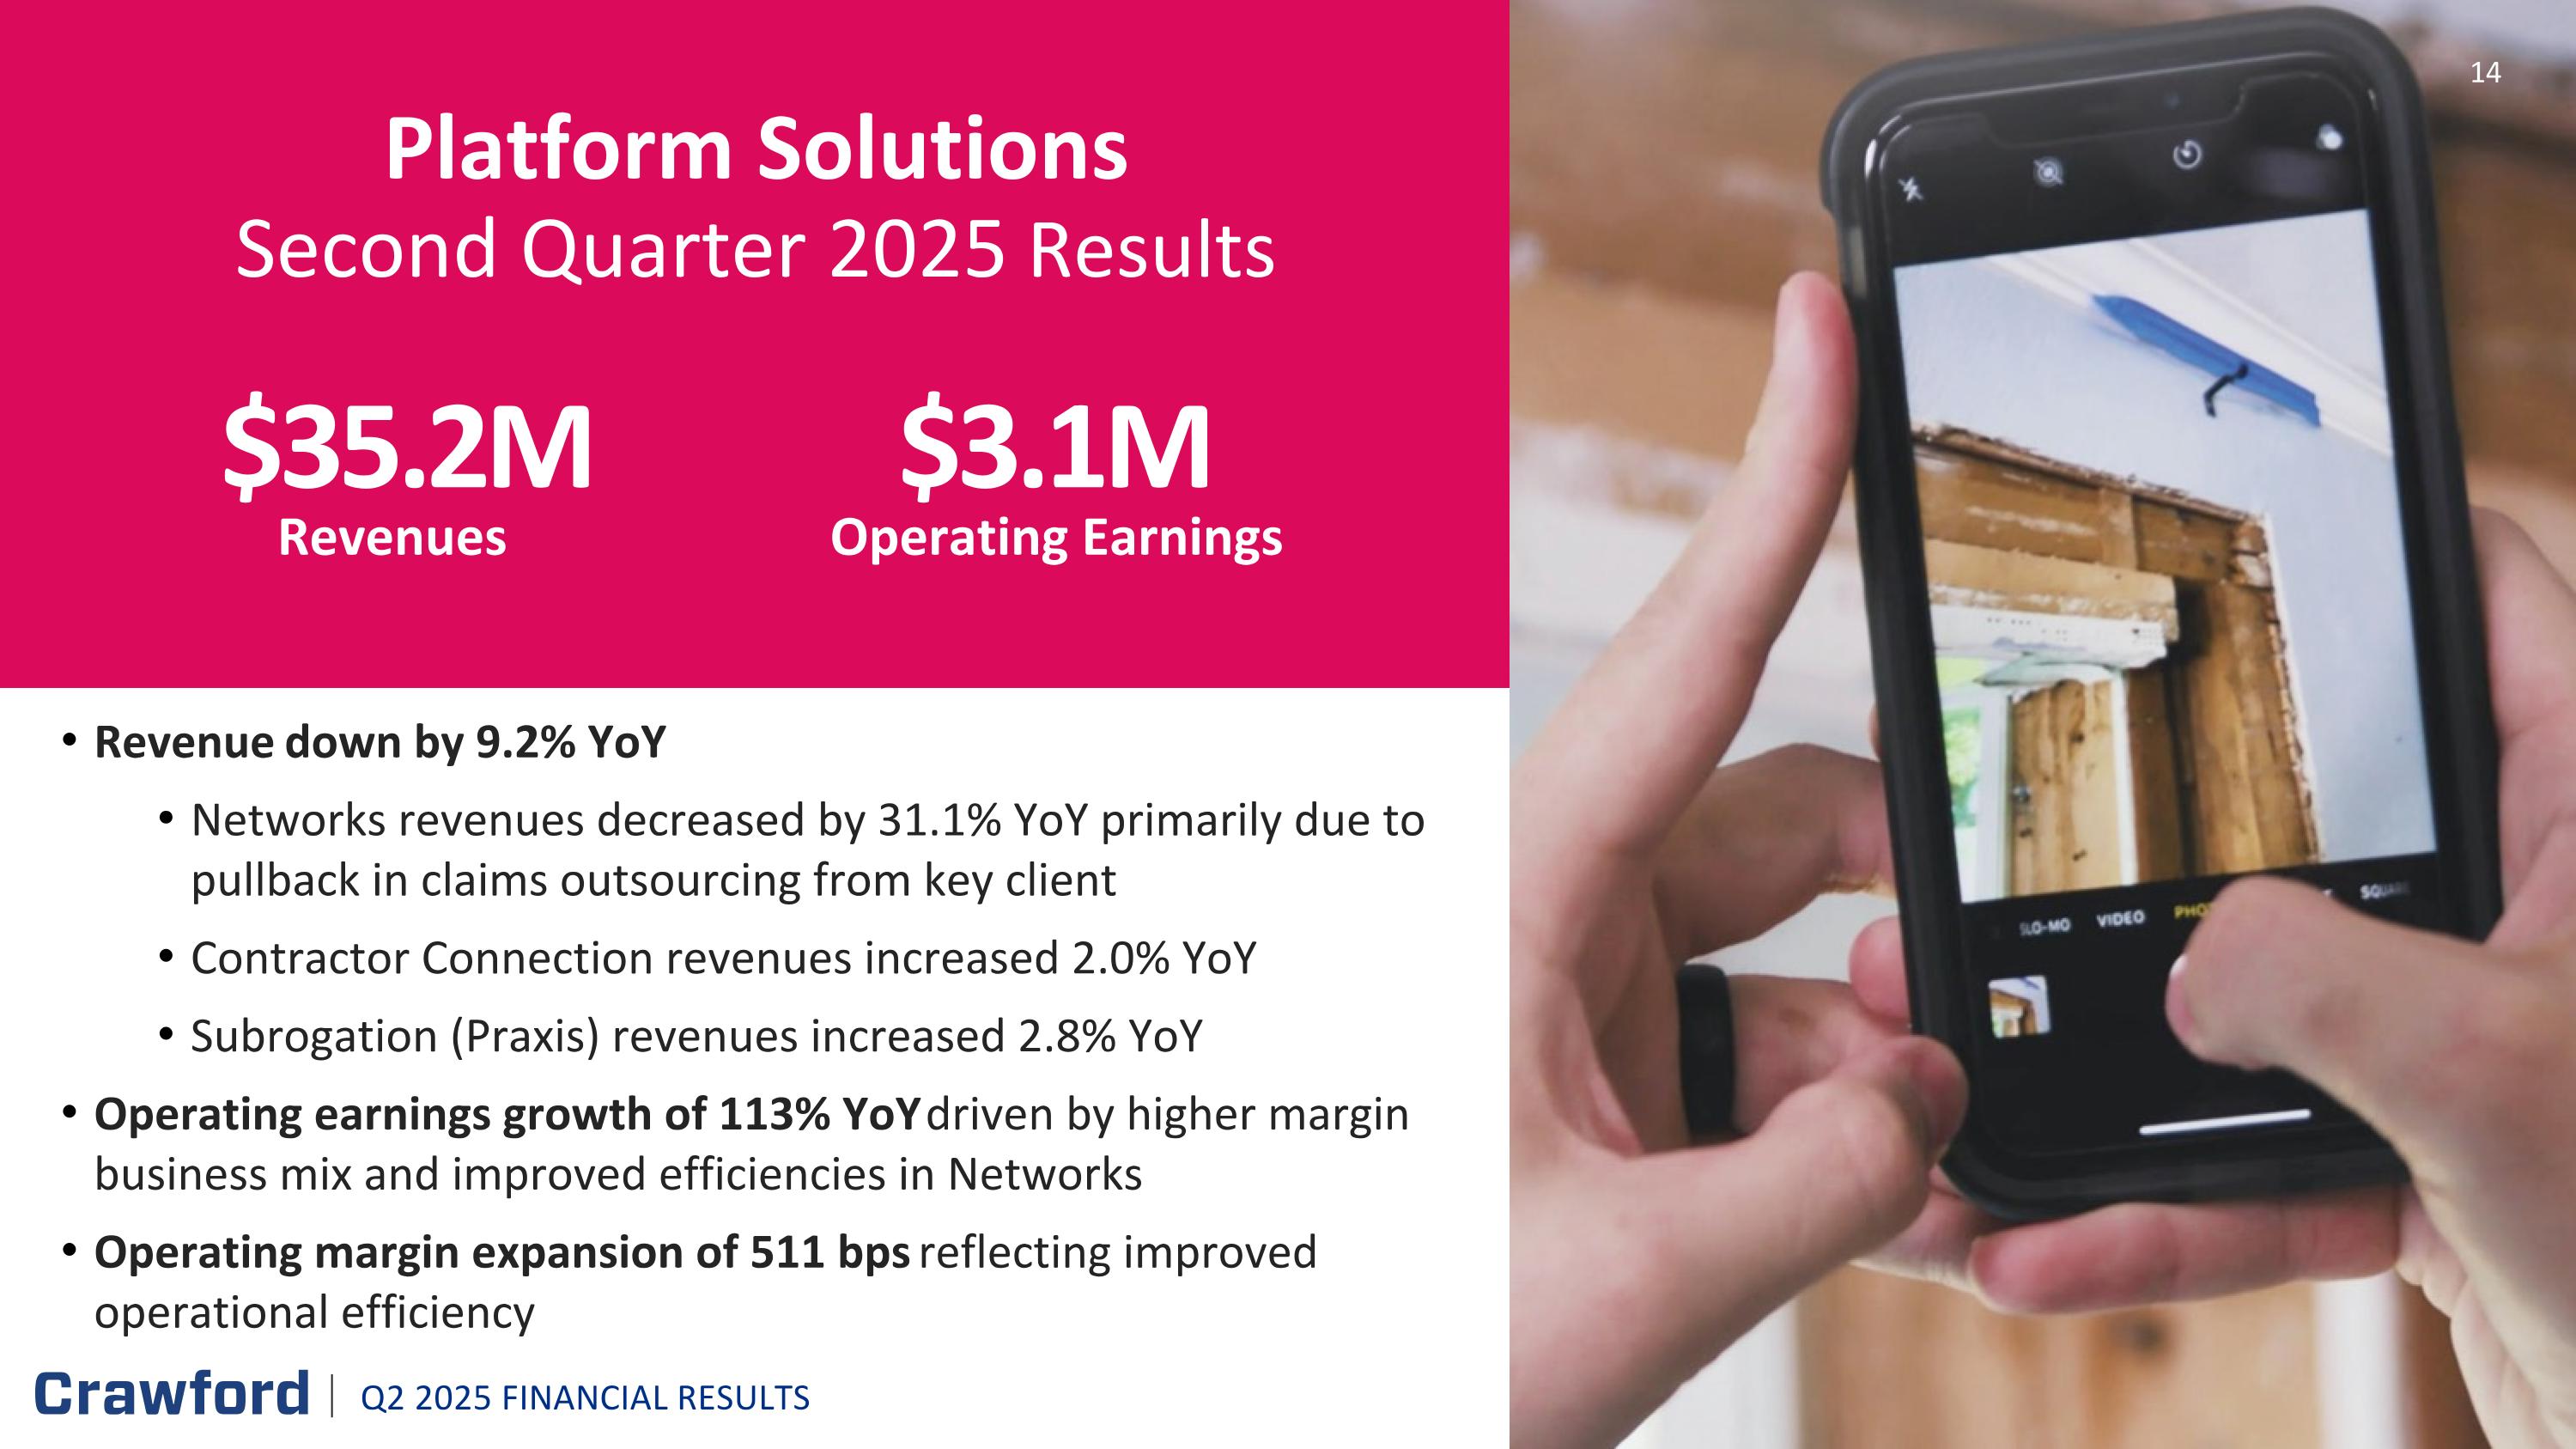
Platform Solutions Second Quarter 2025 Results Revenues $35.2M Operating Earnings $3.1M 14 Q2 2025 FINANCIAL RESULTS Revenue down by 9.2% YoY Networks revenues decreased by 31.1% YoY primarily due to pullback in claims outsourcing from key client Contractor Connection revenues increased 2.0% YoY Subrogation (Praxis) revenues increased 2.8% YoY Operating earnings growth of 113% YoY driven by higher margin business mix and improved efficiencies in Networks Operating margin expansion of 511 bps reflecting improved operational efficiency

FINANCIAL UPDATE Bruce Swain, Chief Financial Officer Q2 2025 FINANCIAL RESULTS 15
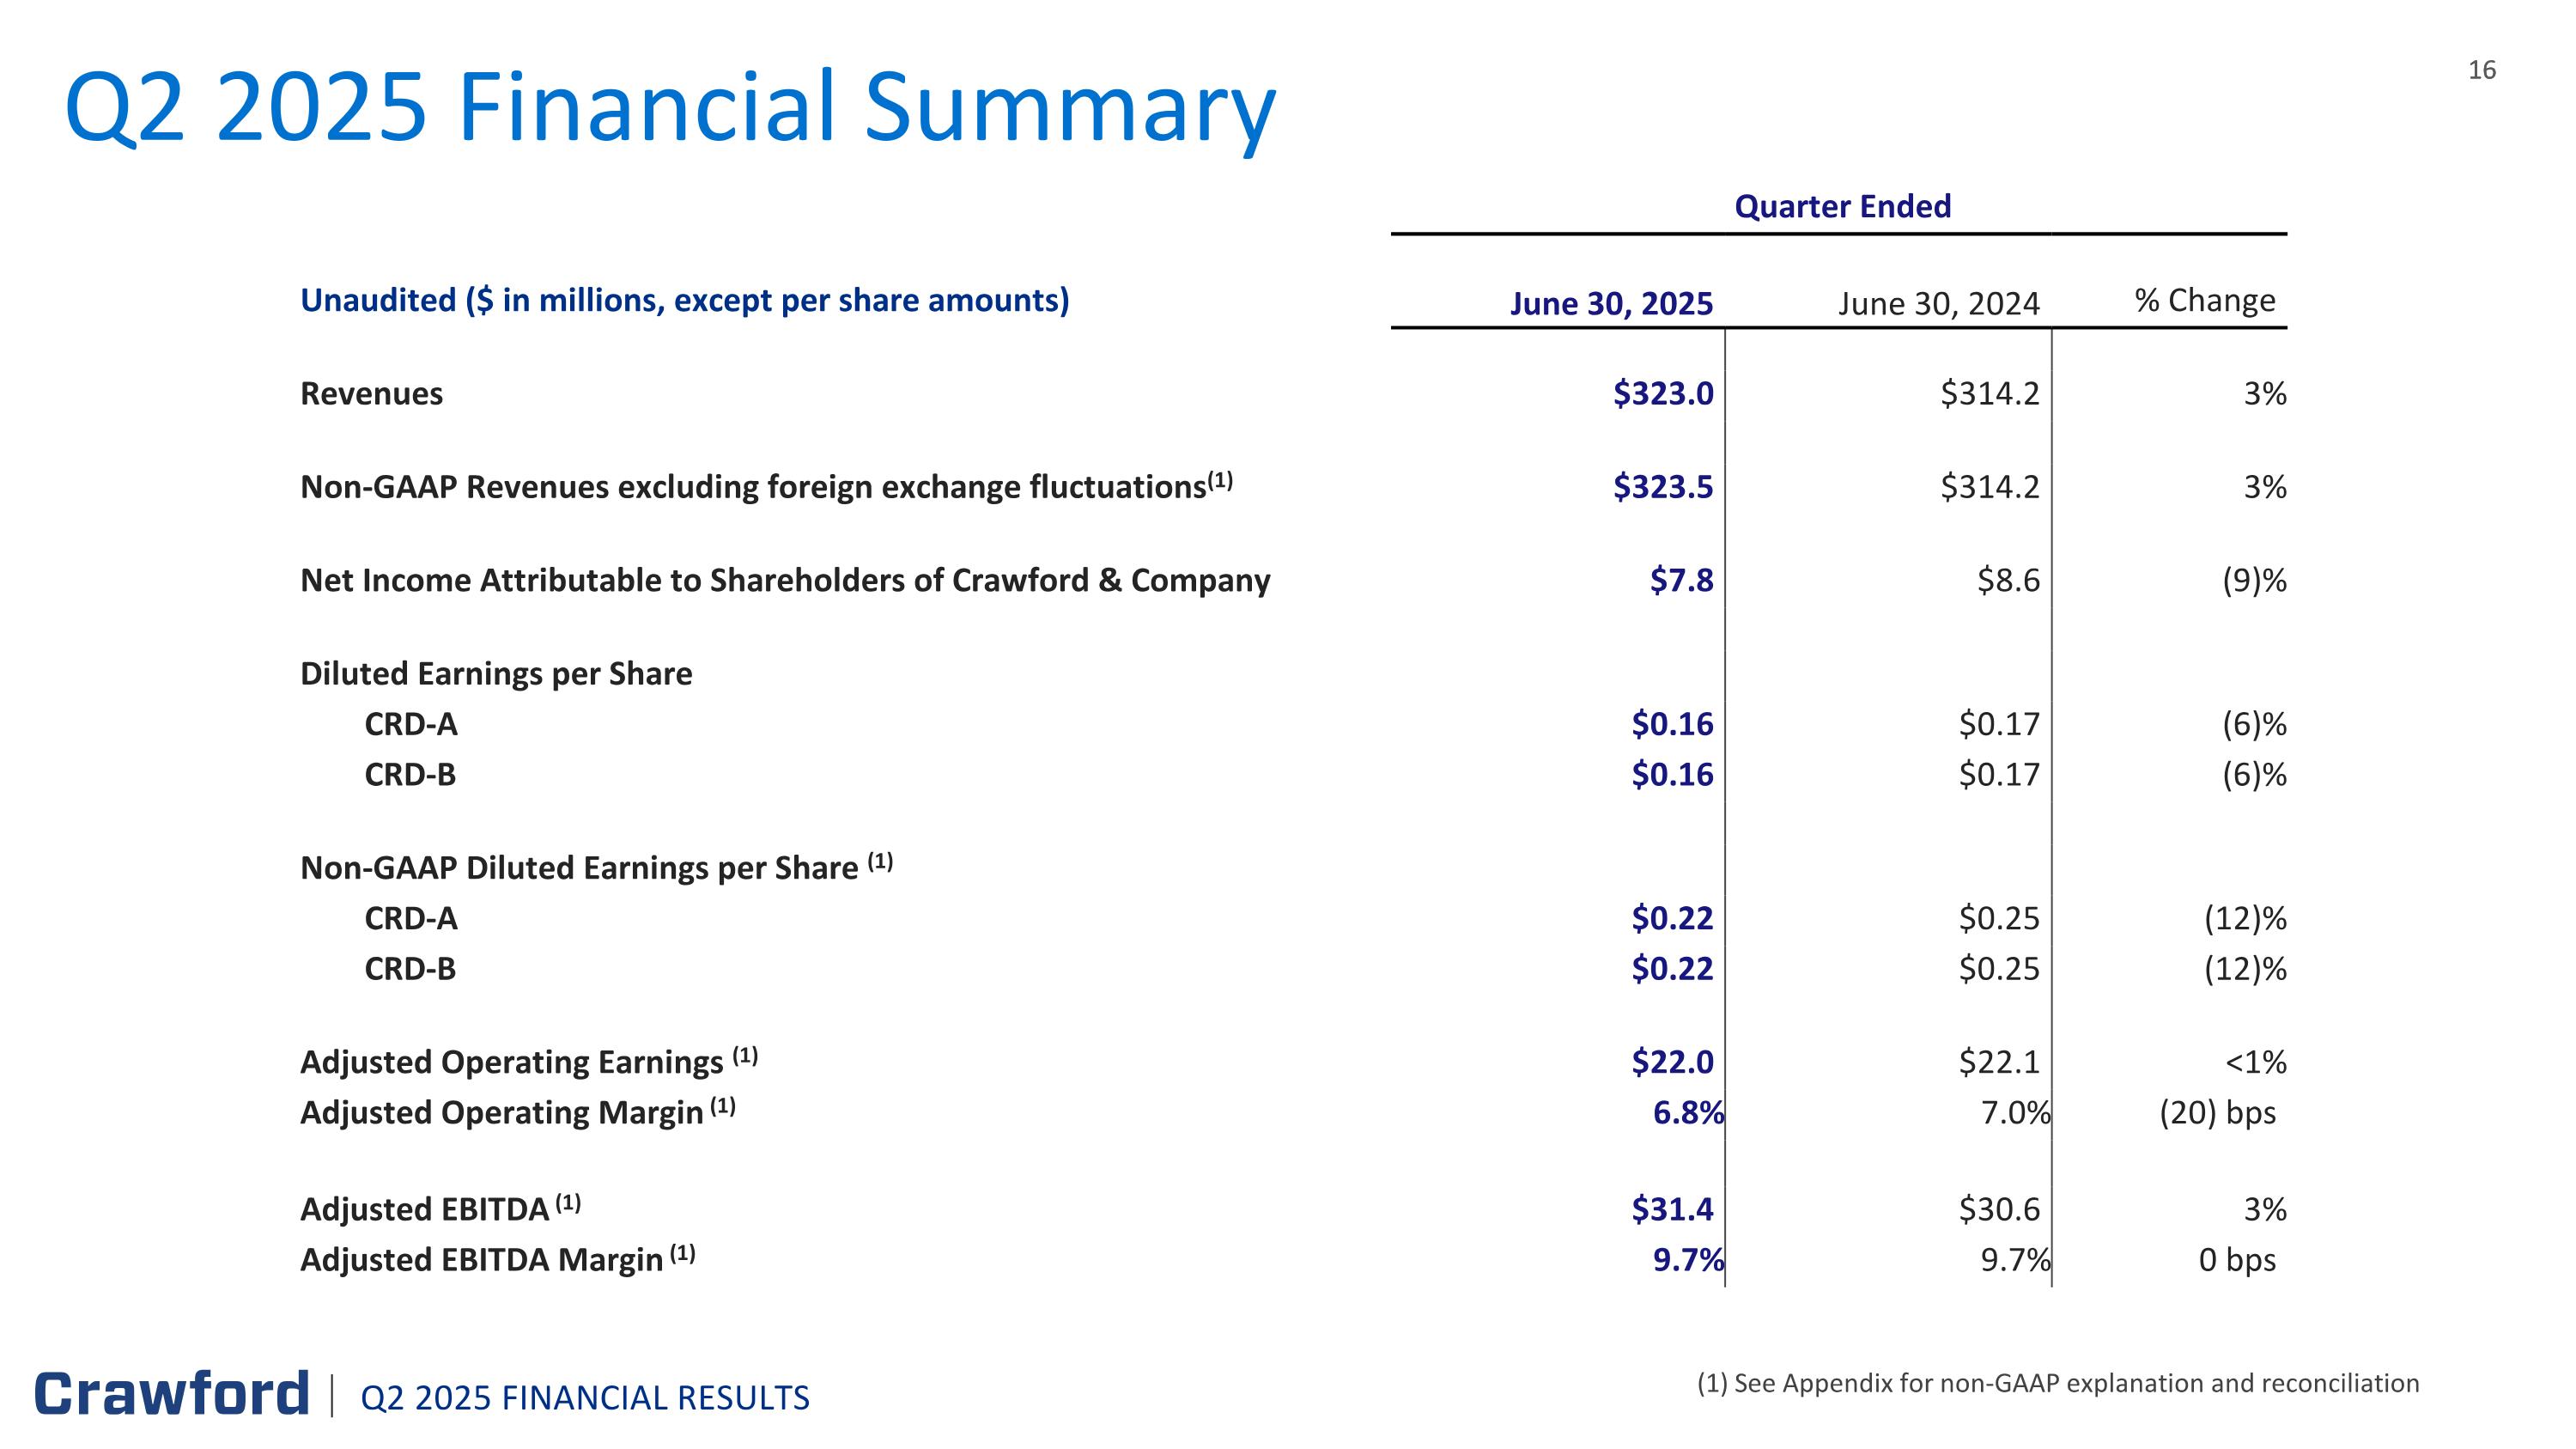
Q2 2025 Financial Summary (1) See Appendix for non-GAAP explanation and reconciliation Quarter Ended Unaudited ($ in millions, except per share amounts) June 30, 2025 June 30, 2024 % Change Revenues $323.0 $314.2 3% Non-GAAP Revenues excluding foreign exchange fluctuations(1) $323.5 $314.2 3% Net Income Attributable to Shareholders of Crawford & Company $7.8 $8.6 (9)% Diluted Earnings per Share CRD-A $0.16 $0.17 (6)% CRD-B $0.16 $0.17 (6)% Non-GAAP Diluted Earnings per Share (1) CRD-A $0.22 $0.25 (12)% CRD-B $0.22 $0.25 (12)% Adjusted Operating Earnings (1) $22.0 $22.1 <1% Adjusted Operating Margin (1) 6.8% 7.0% (20) bps Adjusted EBITDA (1) $31.4 $30.6 3% Adjusted EBITDA Margin (1) 9.7% 9.7% 0 bps Q2 2025 FINANCIAL RESULTS
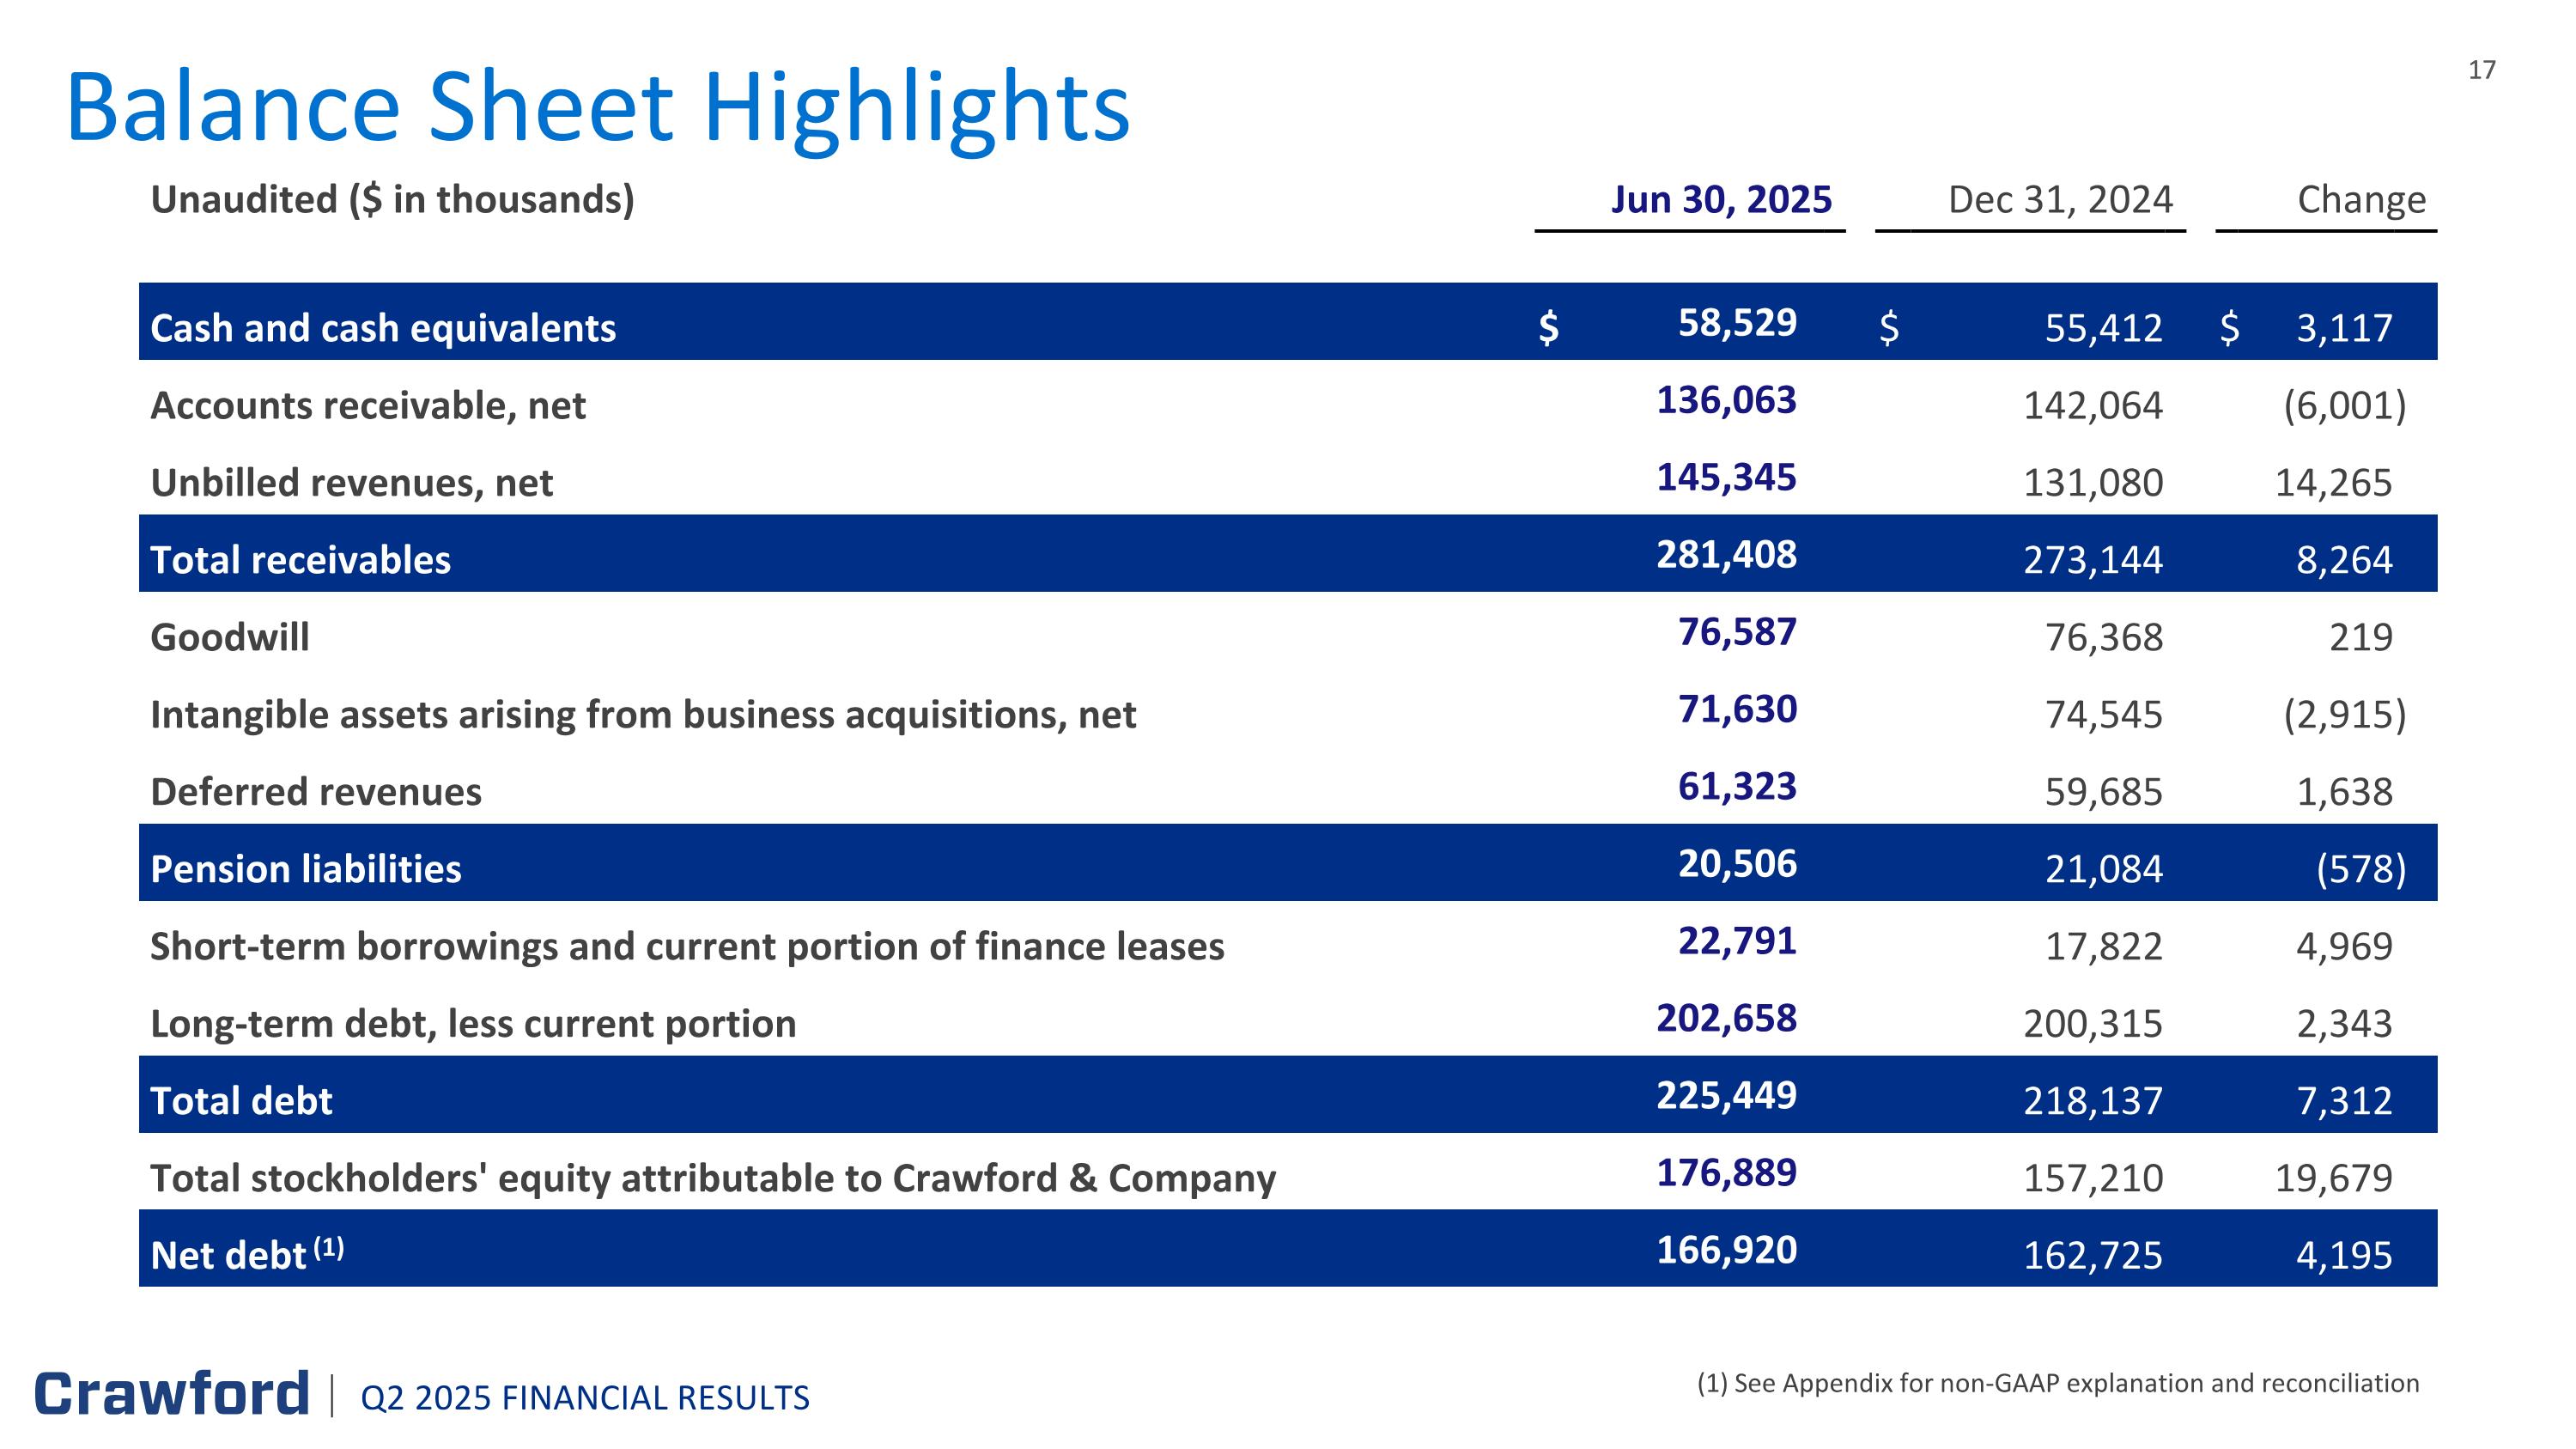
Balance Sheet Highlights (1) See Appendix for non-GAAP explanation and reconciliation Unaudited ($ in thousands) Jun 30, 2025 December 31, 2019 Dec 31, 2024 December 31, 2018 Change Change Cash and cash equivalents $ 58,529 $ 55,412 $ 3,117 Accounts receivable, net 136,063 142,064 (6,001 ) Unbilled revenues, net 145,345 131,080 14,265 Total receivables 281,408 273,144 8,264 Goodwill 76,587 76,368 219 Intangible assets arising from business acquisitions, net 71,630 74,545 (2,915 ) Deferred revenues 61,323 59,685 1,638 Pension liabilities 20,506 21,084 (578 ) Short-term borrowings and current portion of finance leases 22,791 17,822 4,969 Long-term debt, less current portion 202,658 200,315 2,343 Total debt 225,449 218,137 7,312 Total stockholders' equity attributable to Crawford & Company 176,889 157,210 19,679 Net debt (1) 166,920 162,725 4,195 Q2 2025 FINANCIAL RESULTS
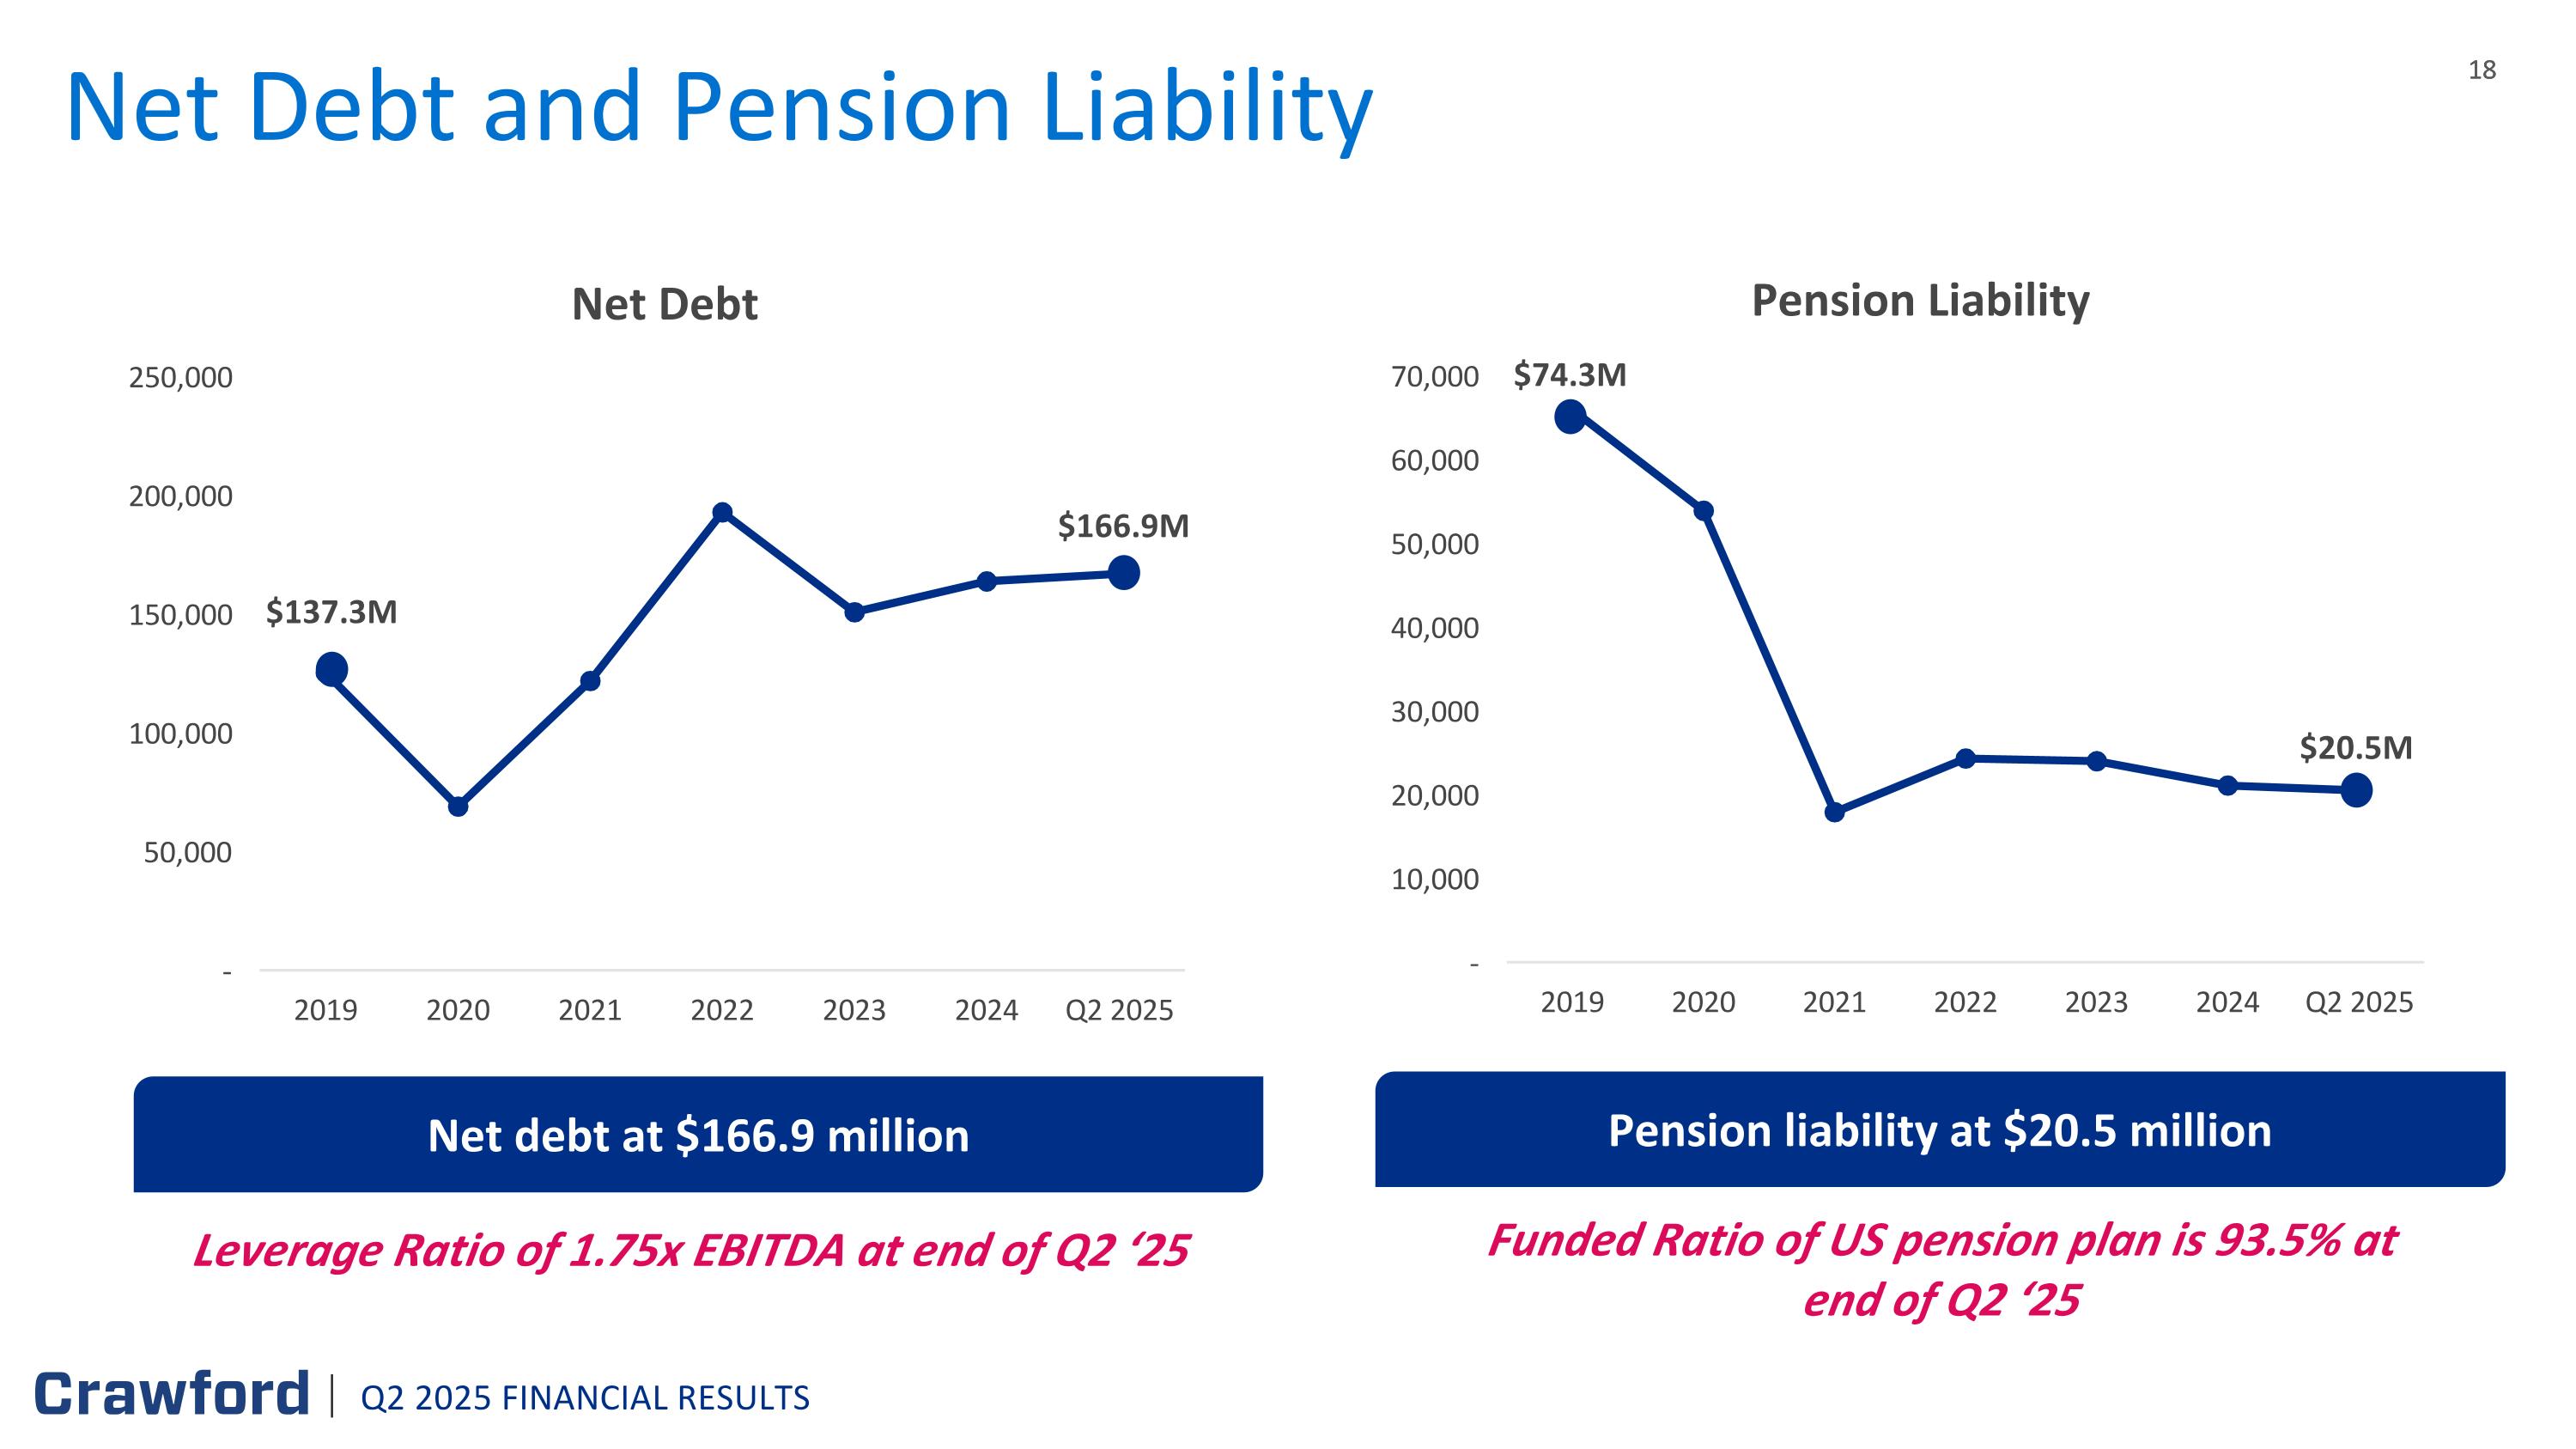
Net Debt and Pension Liability $166.9M Net debt at $166.9 million $137.3M Leverage Ratio of 1.75x EBITDA at end of Q2 ‘25 $20.5M Pension liability at $20.5 million $74.3M Funded Ratio of US pension plan is 93.5% at end of Q2 ‘25 Q2 2025 FINANCIAL RESULTS
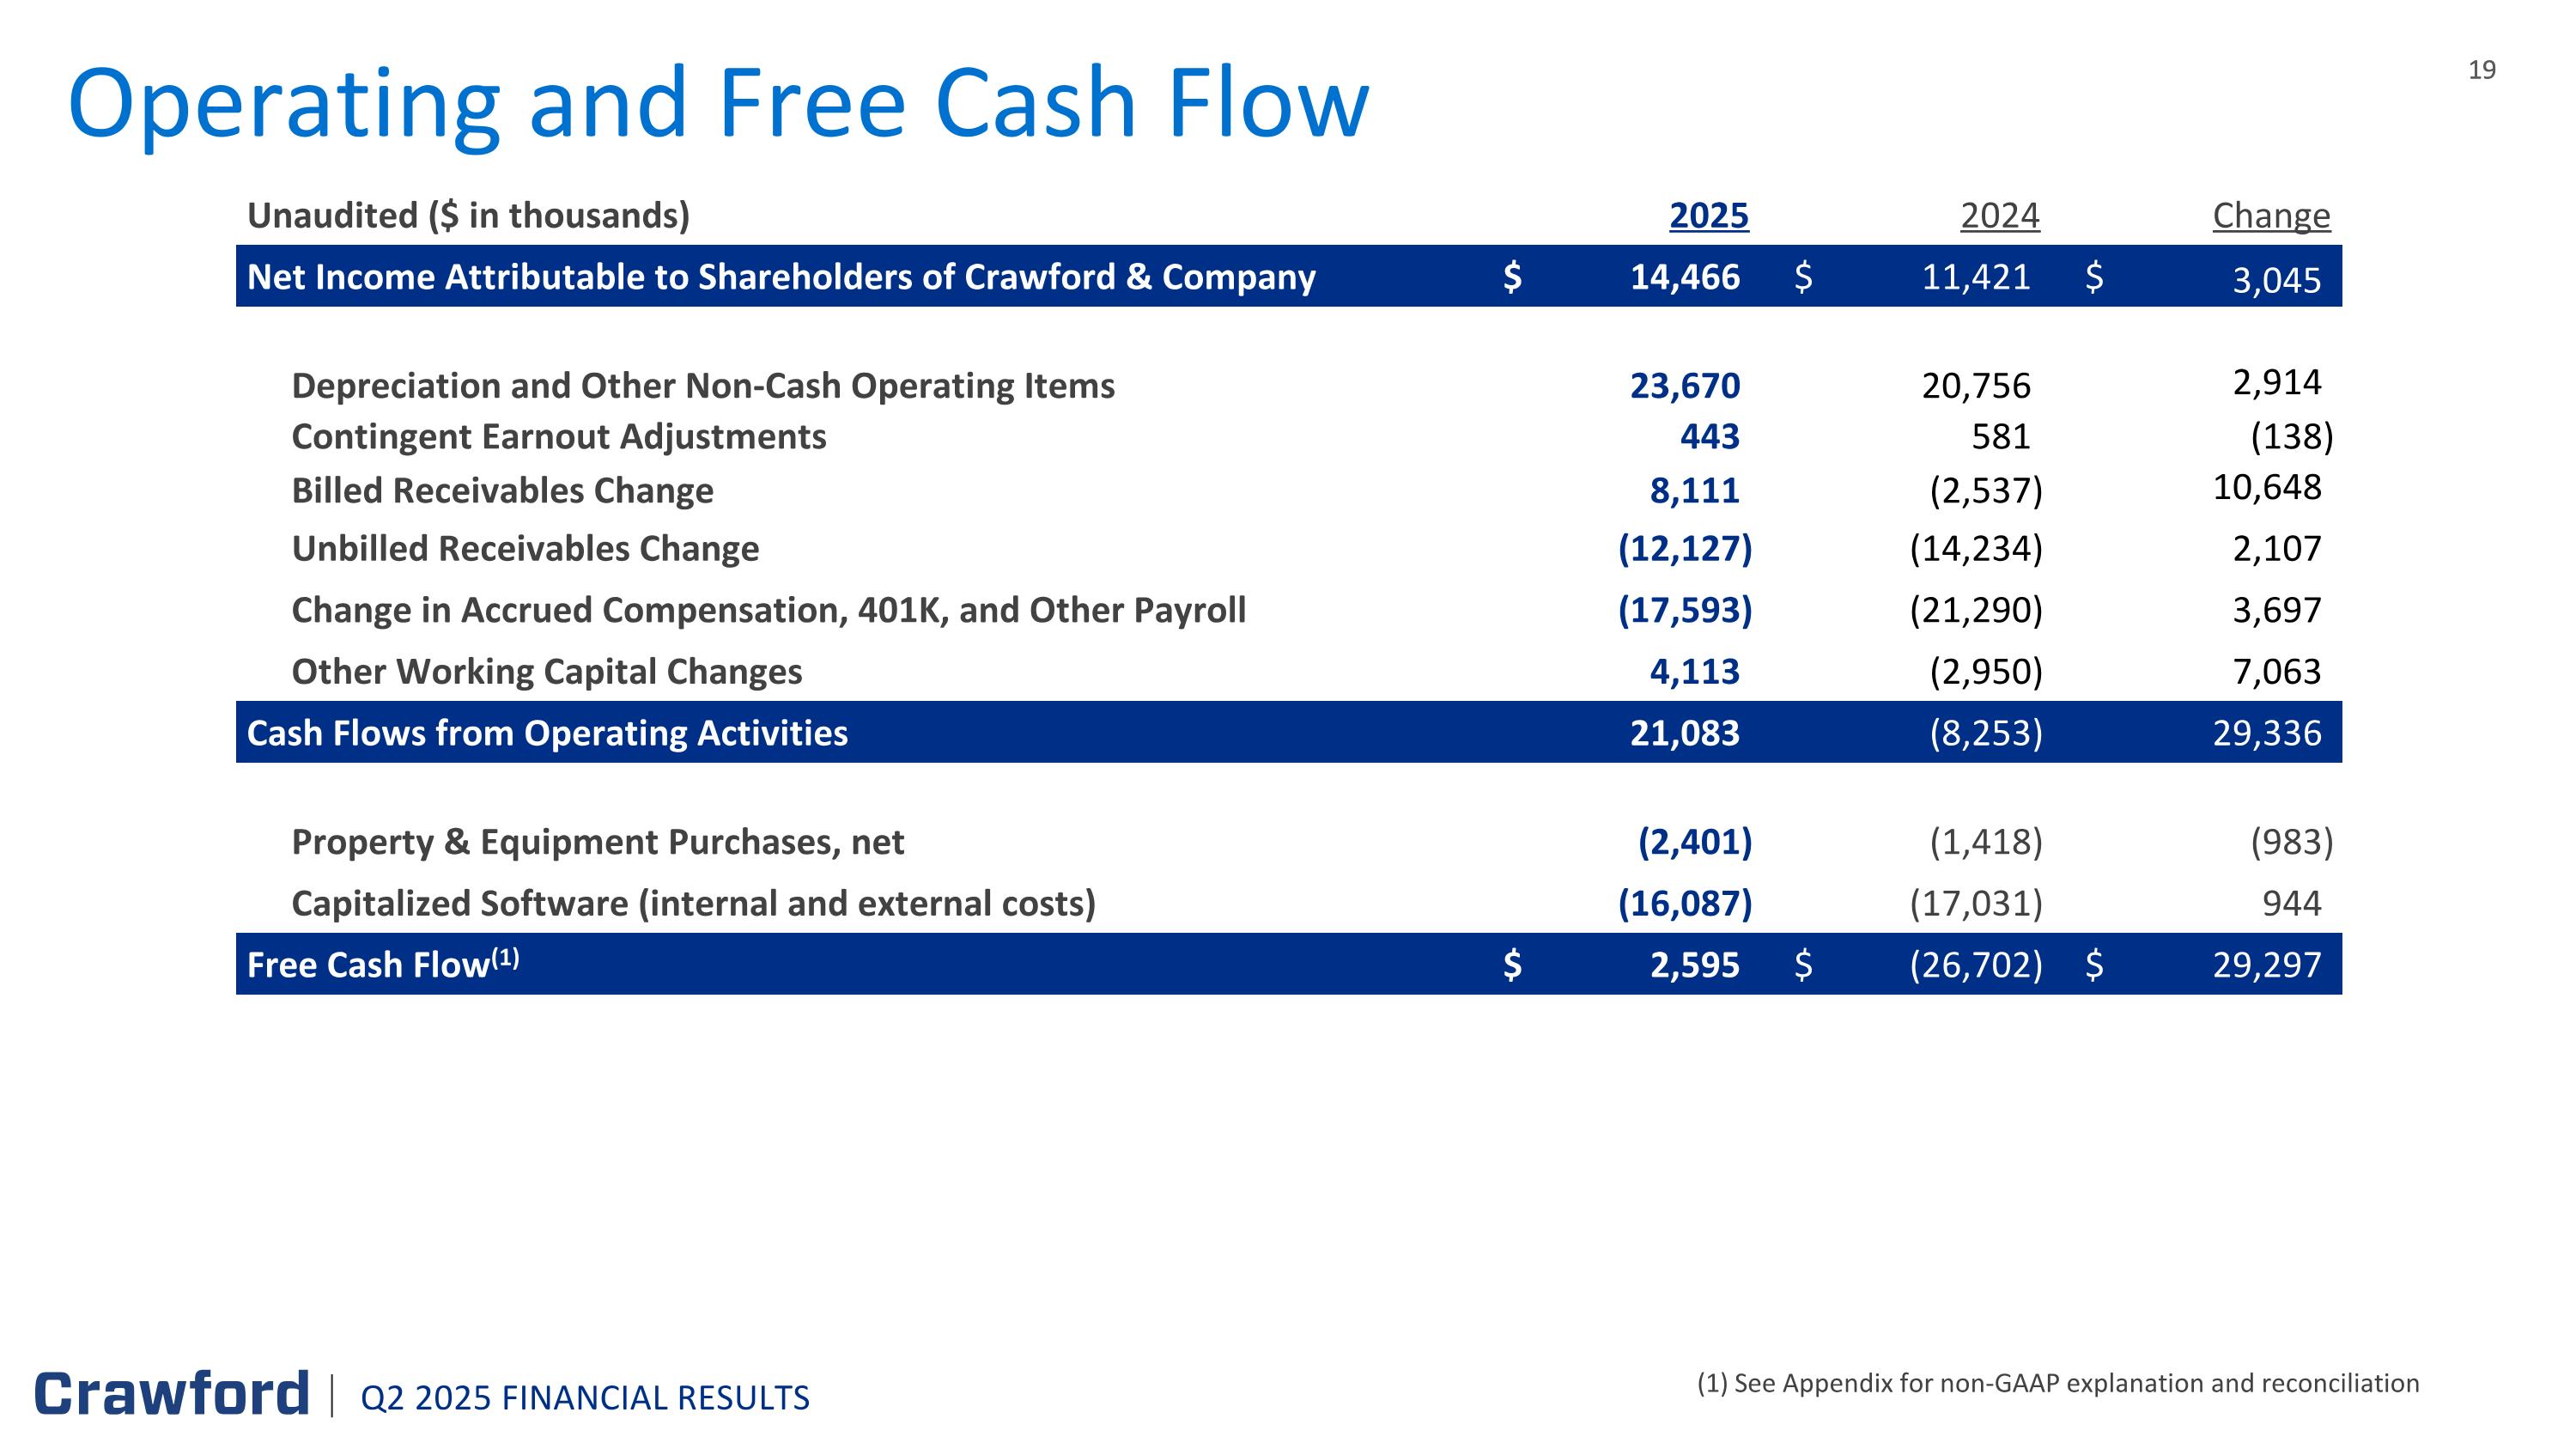
Operating and Free Cash Flow (1) See Appendix for non-GAAP explanation and reconciliation Unaudited ($ in thousands) 2025 2019 2024 2018 Change Change Net Income Attributable to Shareholders of Crawford & Company $ 14,466 $ 11,421 $ 3,045 Depreciation and Other Non-Cash Operating Items 23,670 20,756 2,914 Contingent Earnout Adjustments 443 581 (138 ) Billed Receivables Change 8,111 (2,537 ) 10,648 Unbilled Receivables Change (12,127 ) (14,234 ) 2,107 Change in Accrued Compensation, 401K, and Other Payroll (17,593 ) (21,290 ) 3,697 Other Working Capital Changes 4,113 (2,950 ) 7,063 Cash Flows from Operating Activities 21,083 (8,253 ) 29,336 Property & Equipment Purchases, net (2,401 ) (1,418 ) (983 ) Capitalized Software (internal and external costs) (16,087 ) (17,031 ) 944 Free Cash Flow(1) $ 2,595 $ (26,702 ) $ 29,297 Q2 2025 FINANCIAL RESULTS
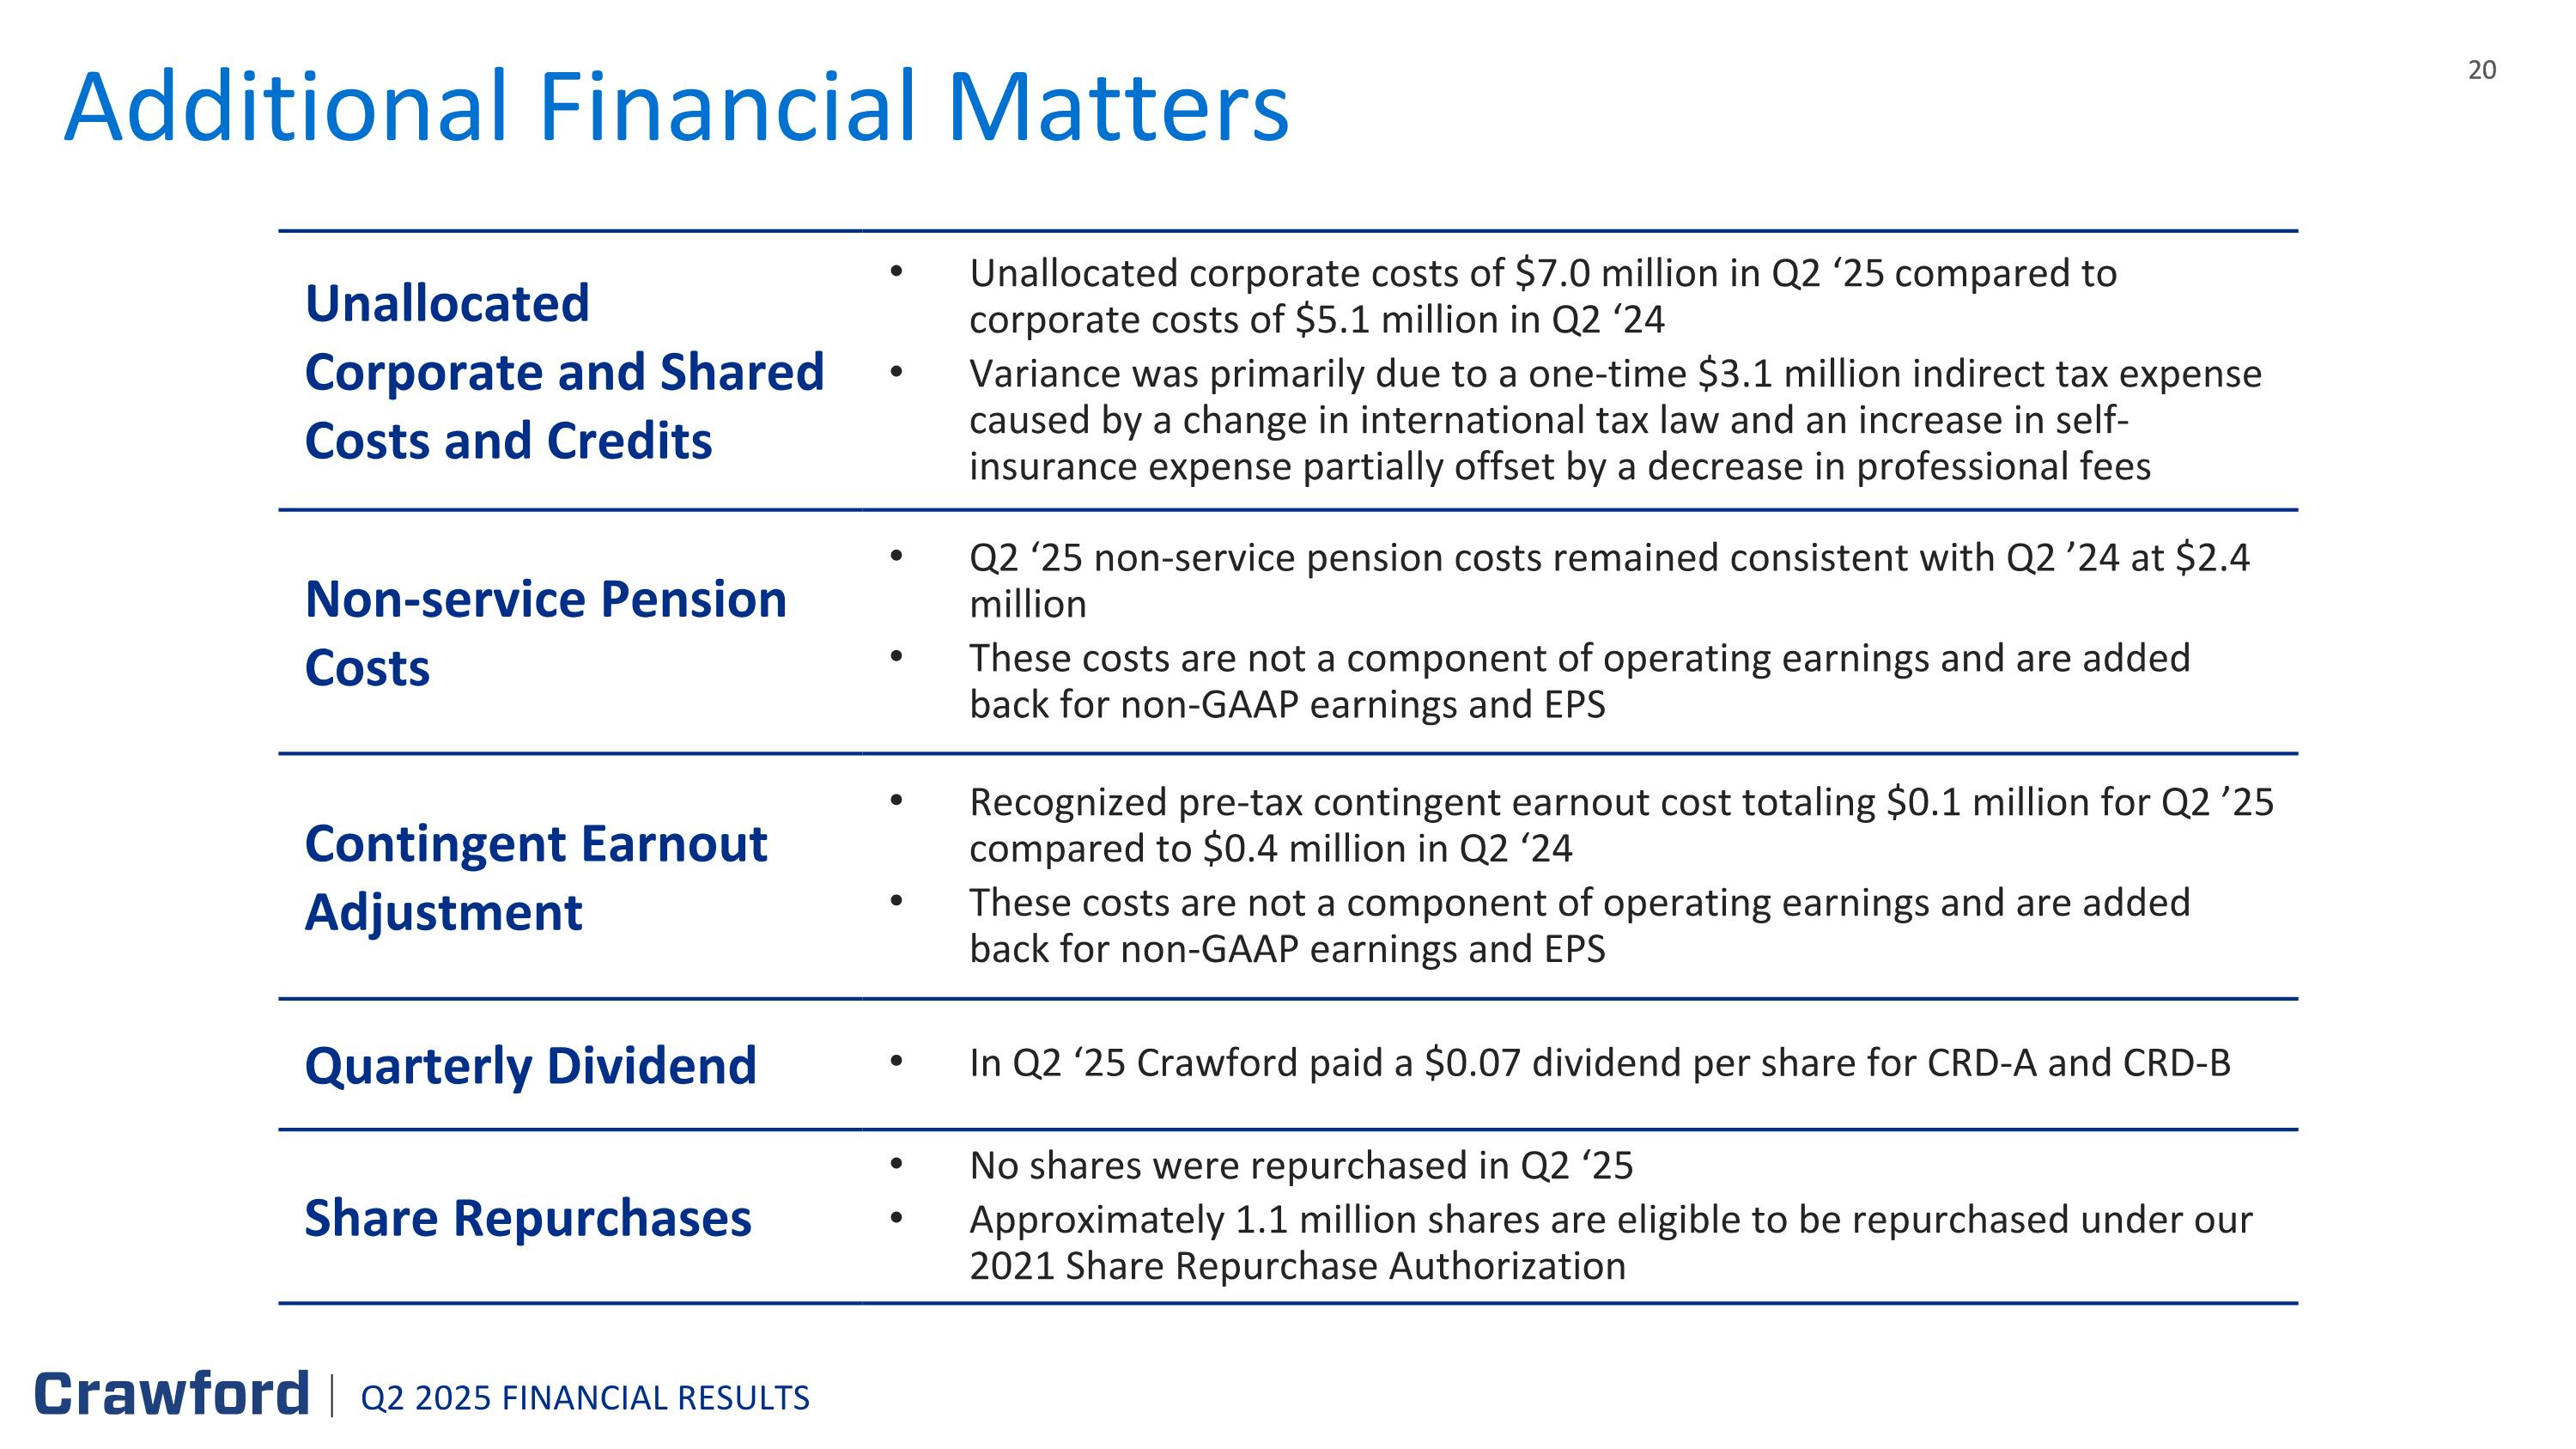
Additional Financial Matters Unallocated Corporate and Shared Costs and Credits Unallocated corporate costs of $7.0 million in Q2 ‘25 compared to corporate costs of $5.1 million in Q2 ‘24 Variance was primarily due to a one-time $3.1 million indirect tax expense caused by a change in international tax law and an increase in self-insurance expense partially offset by a decrease in professional fees Non-service Pension Costs Q2 ‘25 non-service pension costs remained consistent with Q2 ’24 at $2.4 million These costs are not a component of operating earnings and are added back for non-GAAP earnings and EPS Contingent Earnout Adjustment Recognized pre-tax contingent earnout cost totaling $0.1 million for Q2 ’25 compared to $0.4 million in Q2 ‘24 These costs are not a component of operating earnings and are added back for non-GAAP earnings and EPS Quarterly Dividend In Q2 ‘25 Crawford paid a $0.07 dividend per share for CRD-A and CRD-B Share Repurchases No shares were repurchased in Q2 ‘25 Approximately 1.1 million shares are eligible to be repurchased under our 2021 Share Repurchase Authorization Q2 2025 FINANCIAL RESULTS
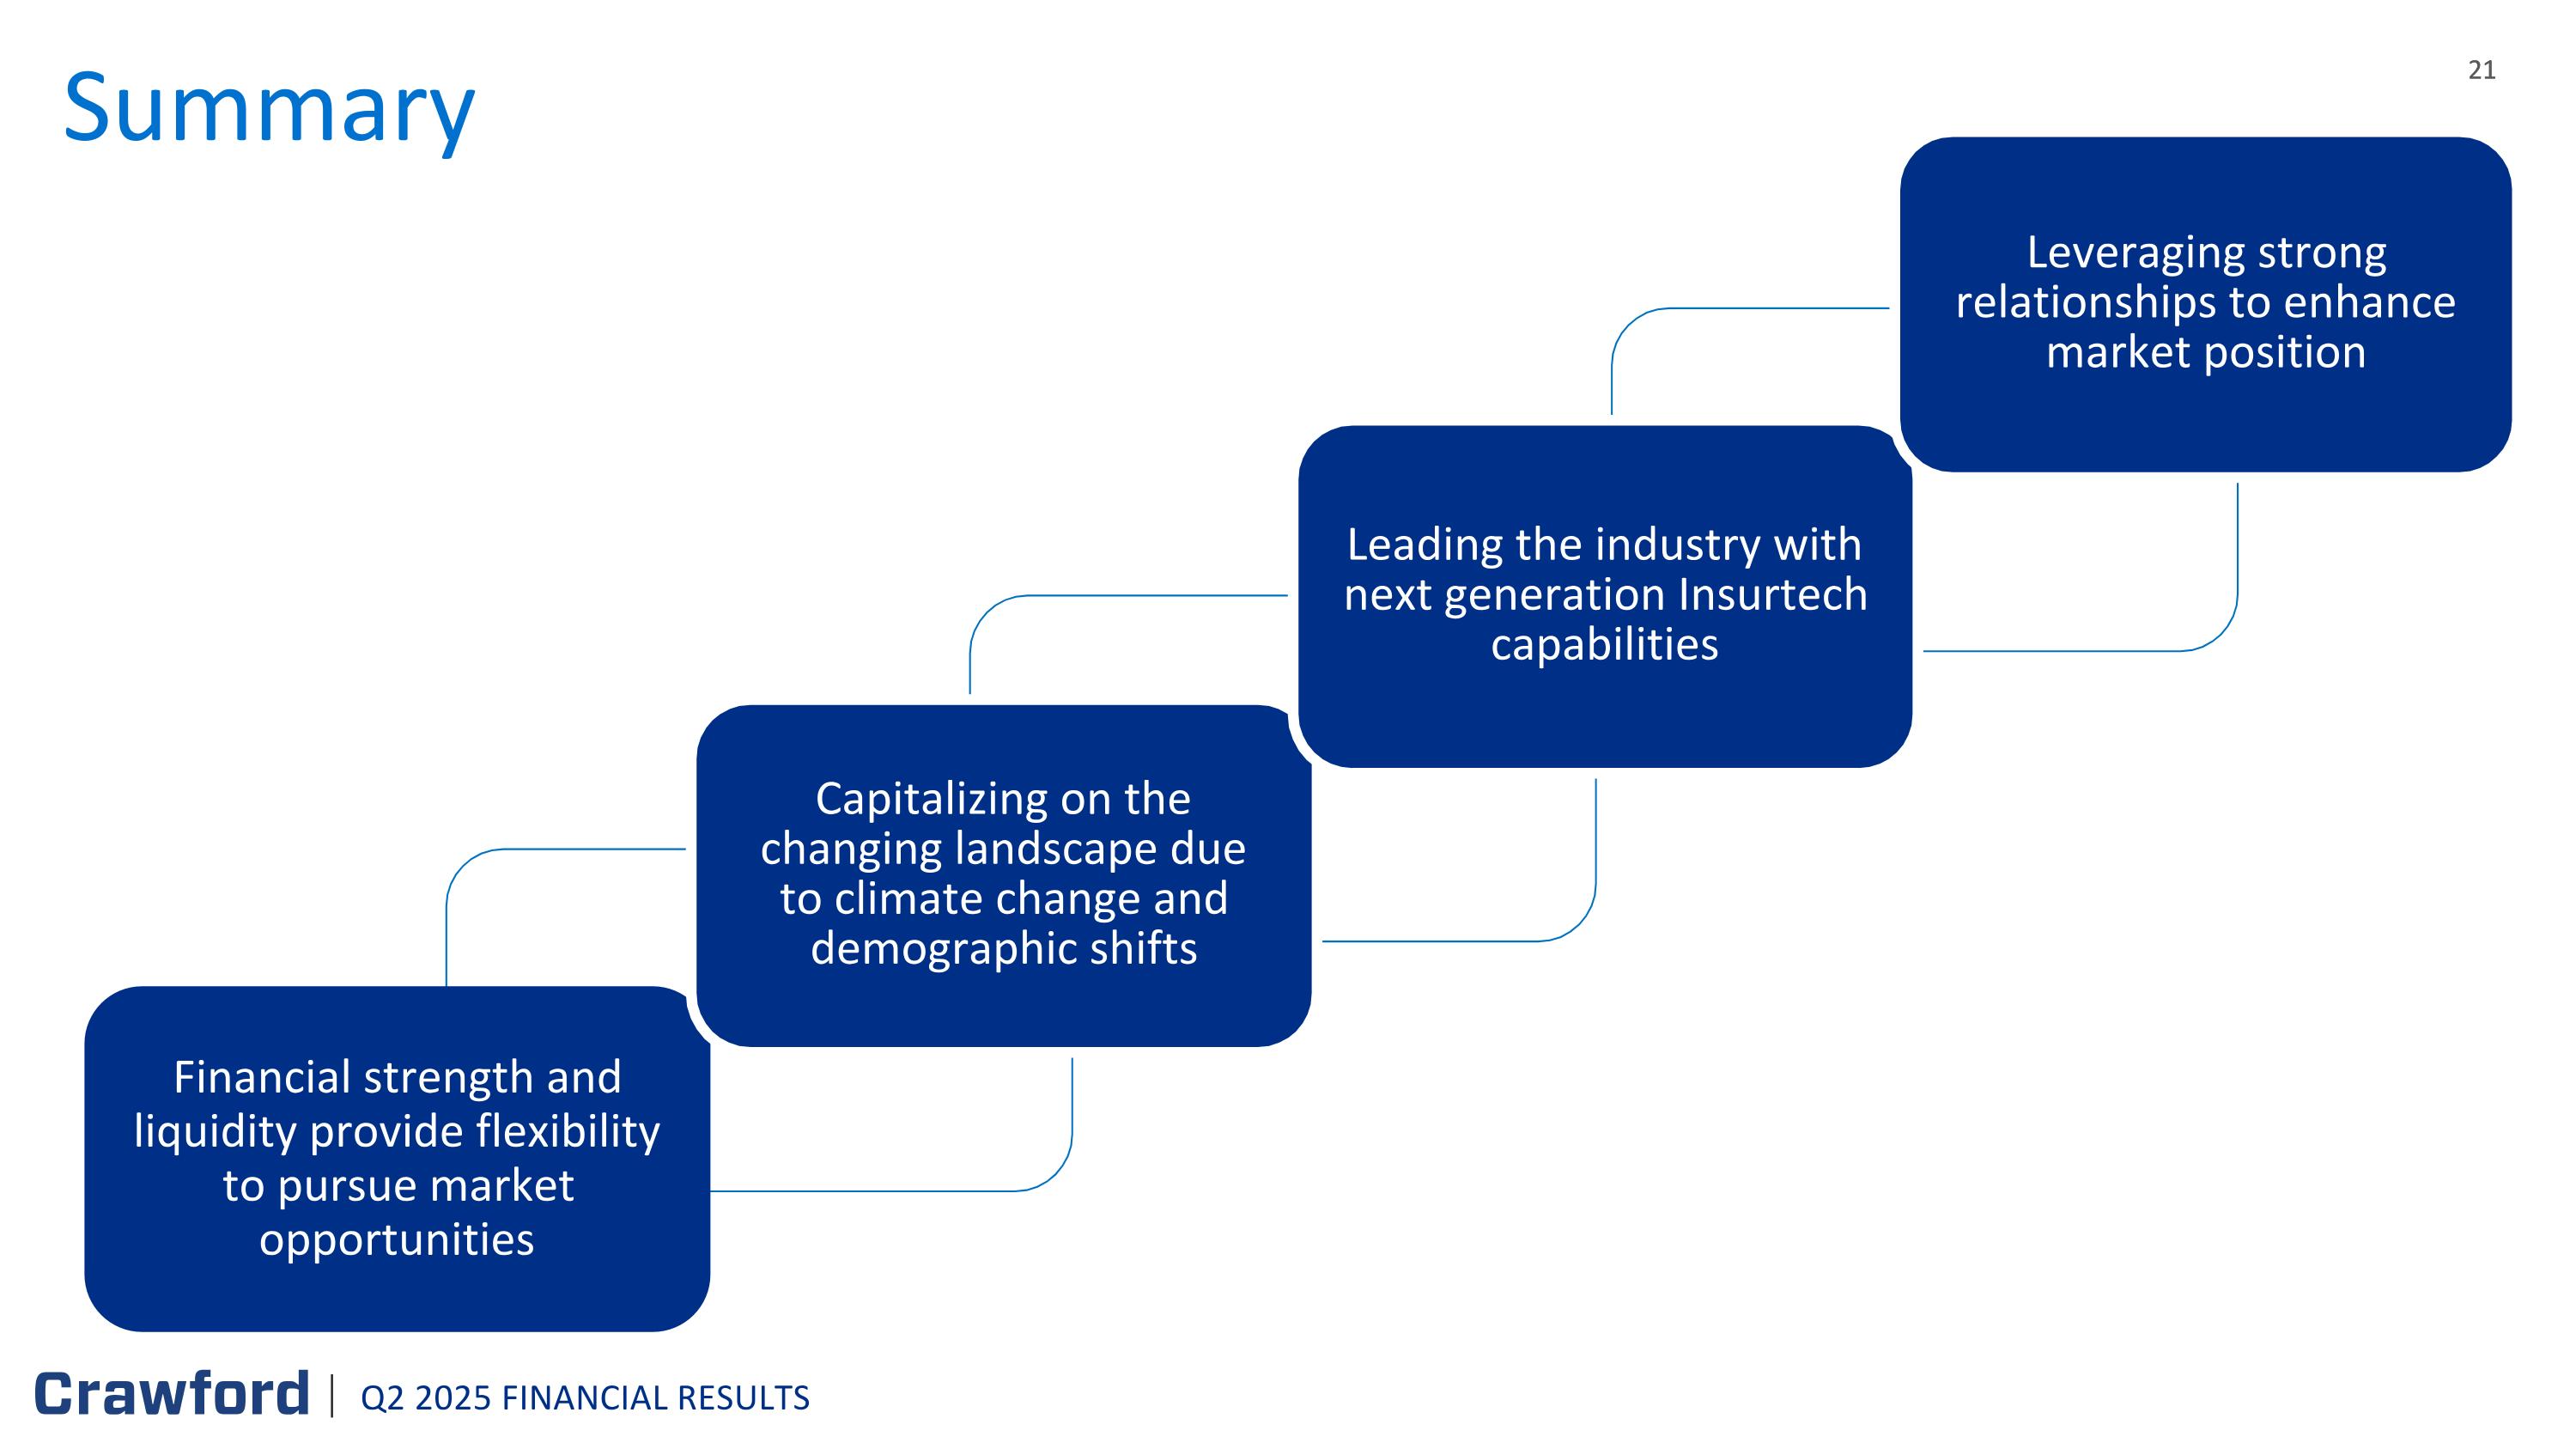
Financial strength and liquidity provide flexibility to pursue market opportunities Capitalizing on the changing landscape due to climate change and demographic shifts Leading the industry with next generation Insurtech capabilities Leveraging strong relationships to enhance market position Summary Q2 2025 FINANCIAL RESULTS

Appendix: Segment Results and Non-GAAP Financial Information Q2 2025 FINANCIAL RESULTS 22
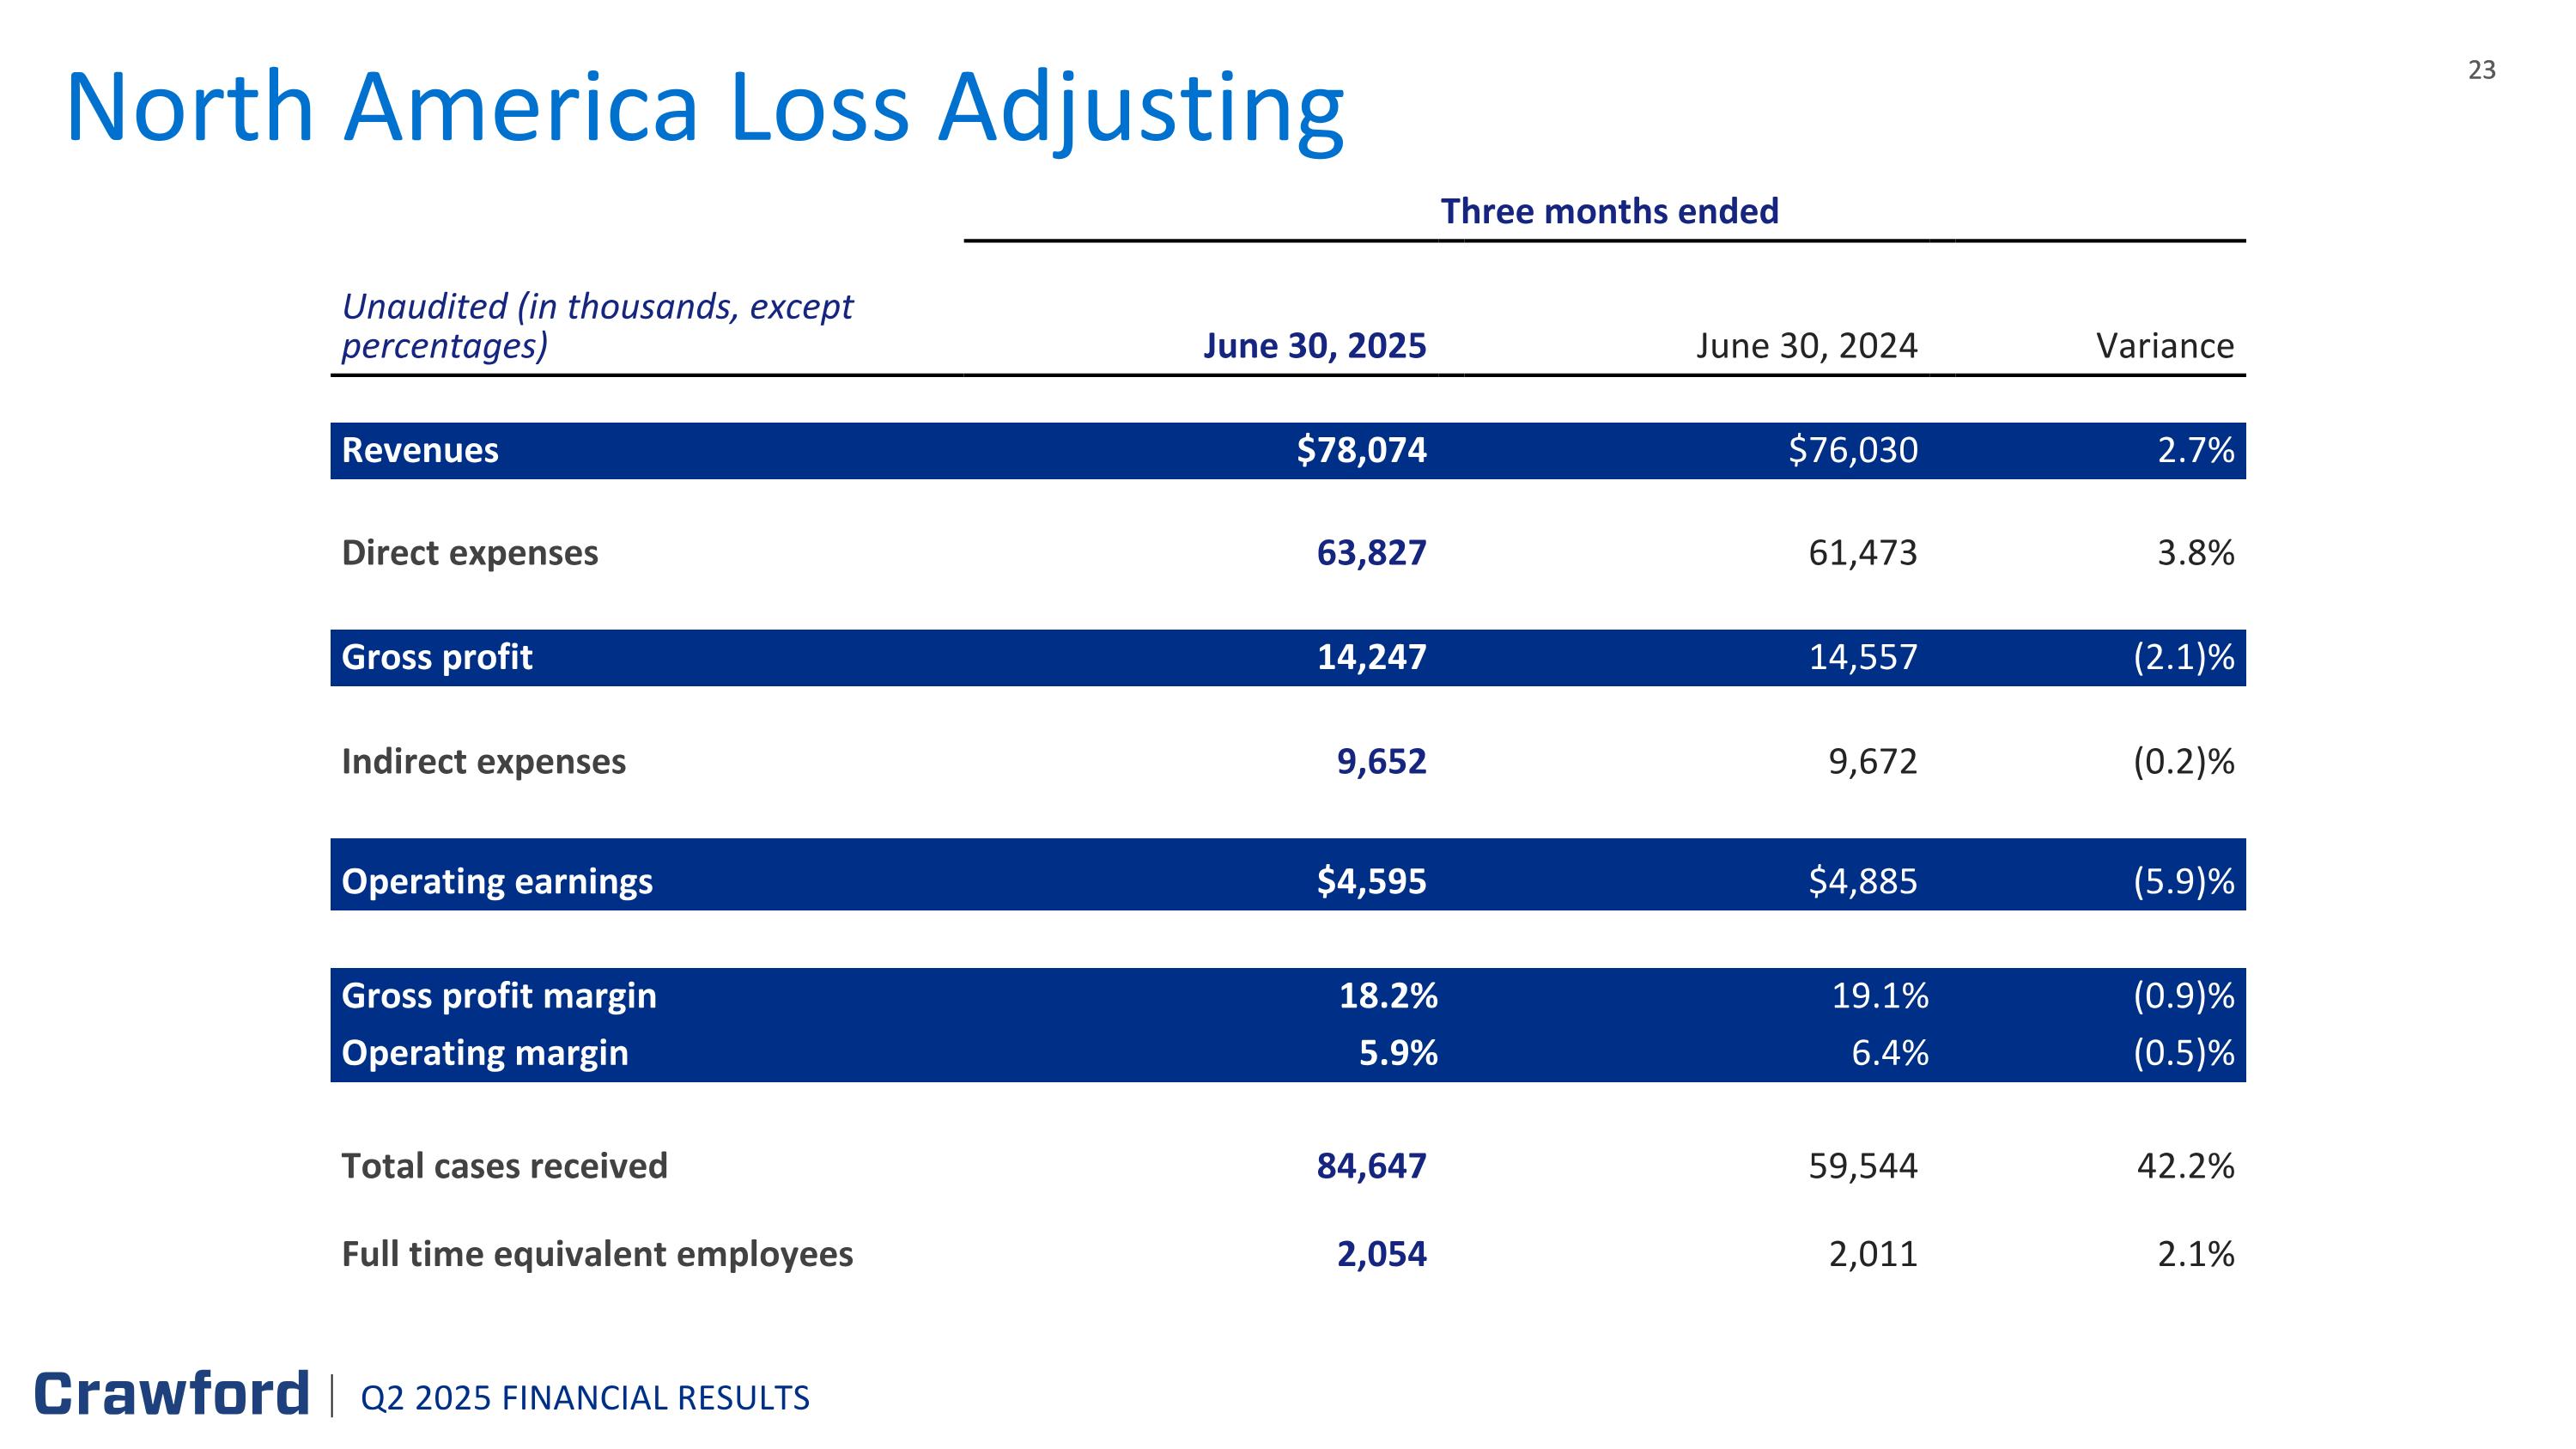
North America Loss Adjusting Three months ended Unaudited (in thousands, except percentages) June 30, 2025 June 30, 2024 Variance Revenues $78,074 $76,030 2.7% Direct expenses 63,827 61,473 3.8% Gross profit 14,247 14,557 (2.1)% Indirect expenses 9,652 9,672 (0.2)% Operating earnings $4,595 $4,885 (5.9)% Gross profit margin 18.2% 19.1% (0.9)% Operating margin 5.9% 6.4% (0.5)% Total cases received 84,647 59,544 42.2% Full time equivalent employees 2,054 2,011 2.1% Q2 2025 FINANCIAL RESULTS
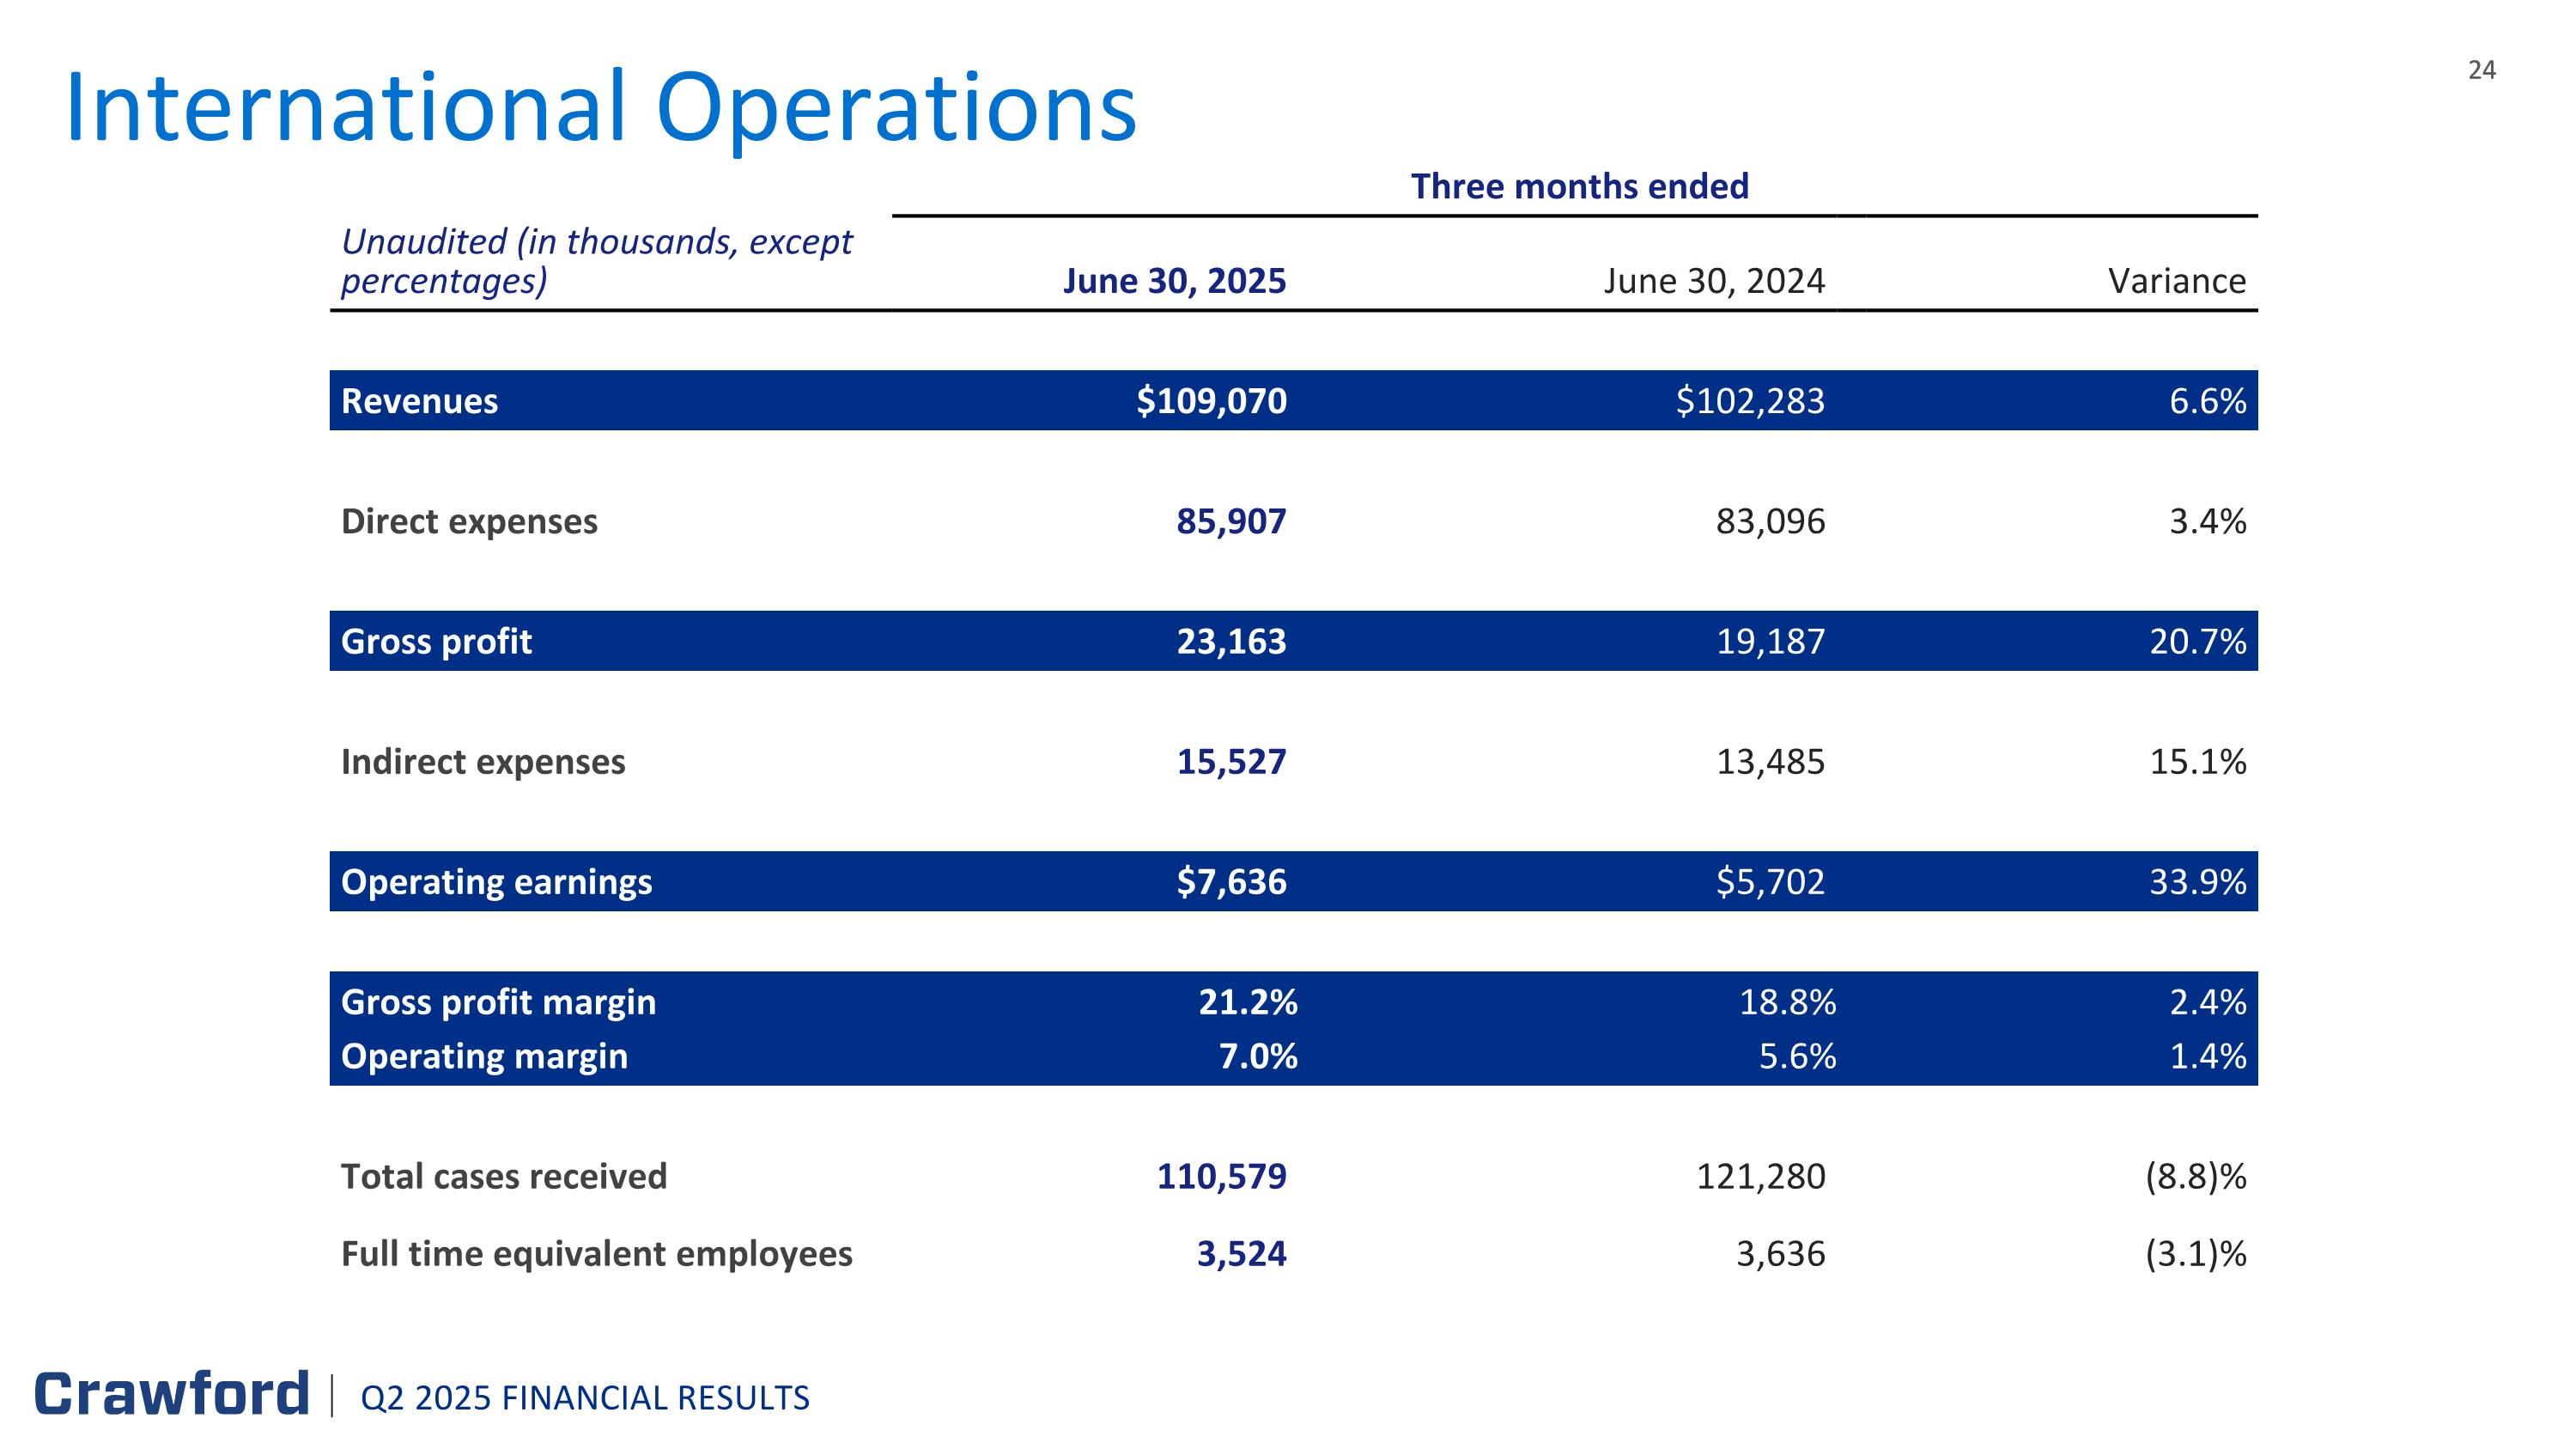
International Operations Three months ended Unaudited (in thousands, except percentages) June 30, 2025 June 30, 2024 Variance Revenues $109,070 $102,283 6.6% Direct expenses 85,907 83,096 3.4% Gross profit 23,163 19,187 20.7% Indirect expenses 15,527 13,485 15.1% Operating earnings $7,636 $5,702 33.9% Gross profit margin 21.2% 18.8% 2.4% Operating margin 7.0% 5.6% 1.4% Total cases received 110,579 121,280 (8.8)% Full time equivalent employees 3,524 3,636 (3.1)% Q2 2025 FINANCIAL RESULTS
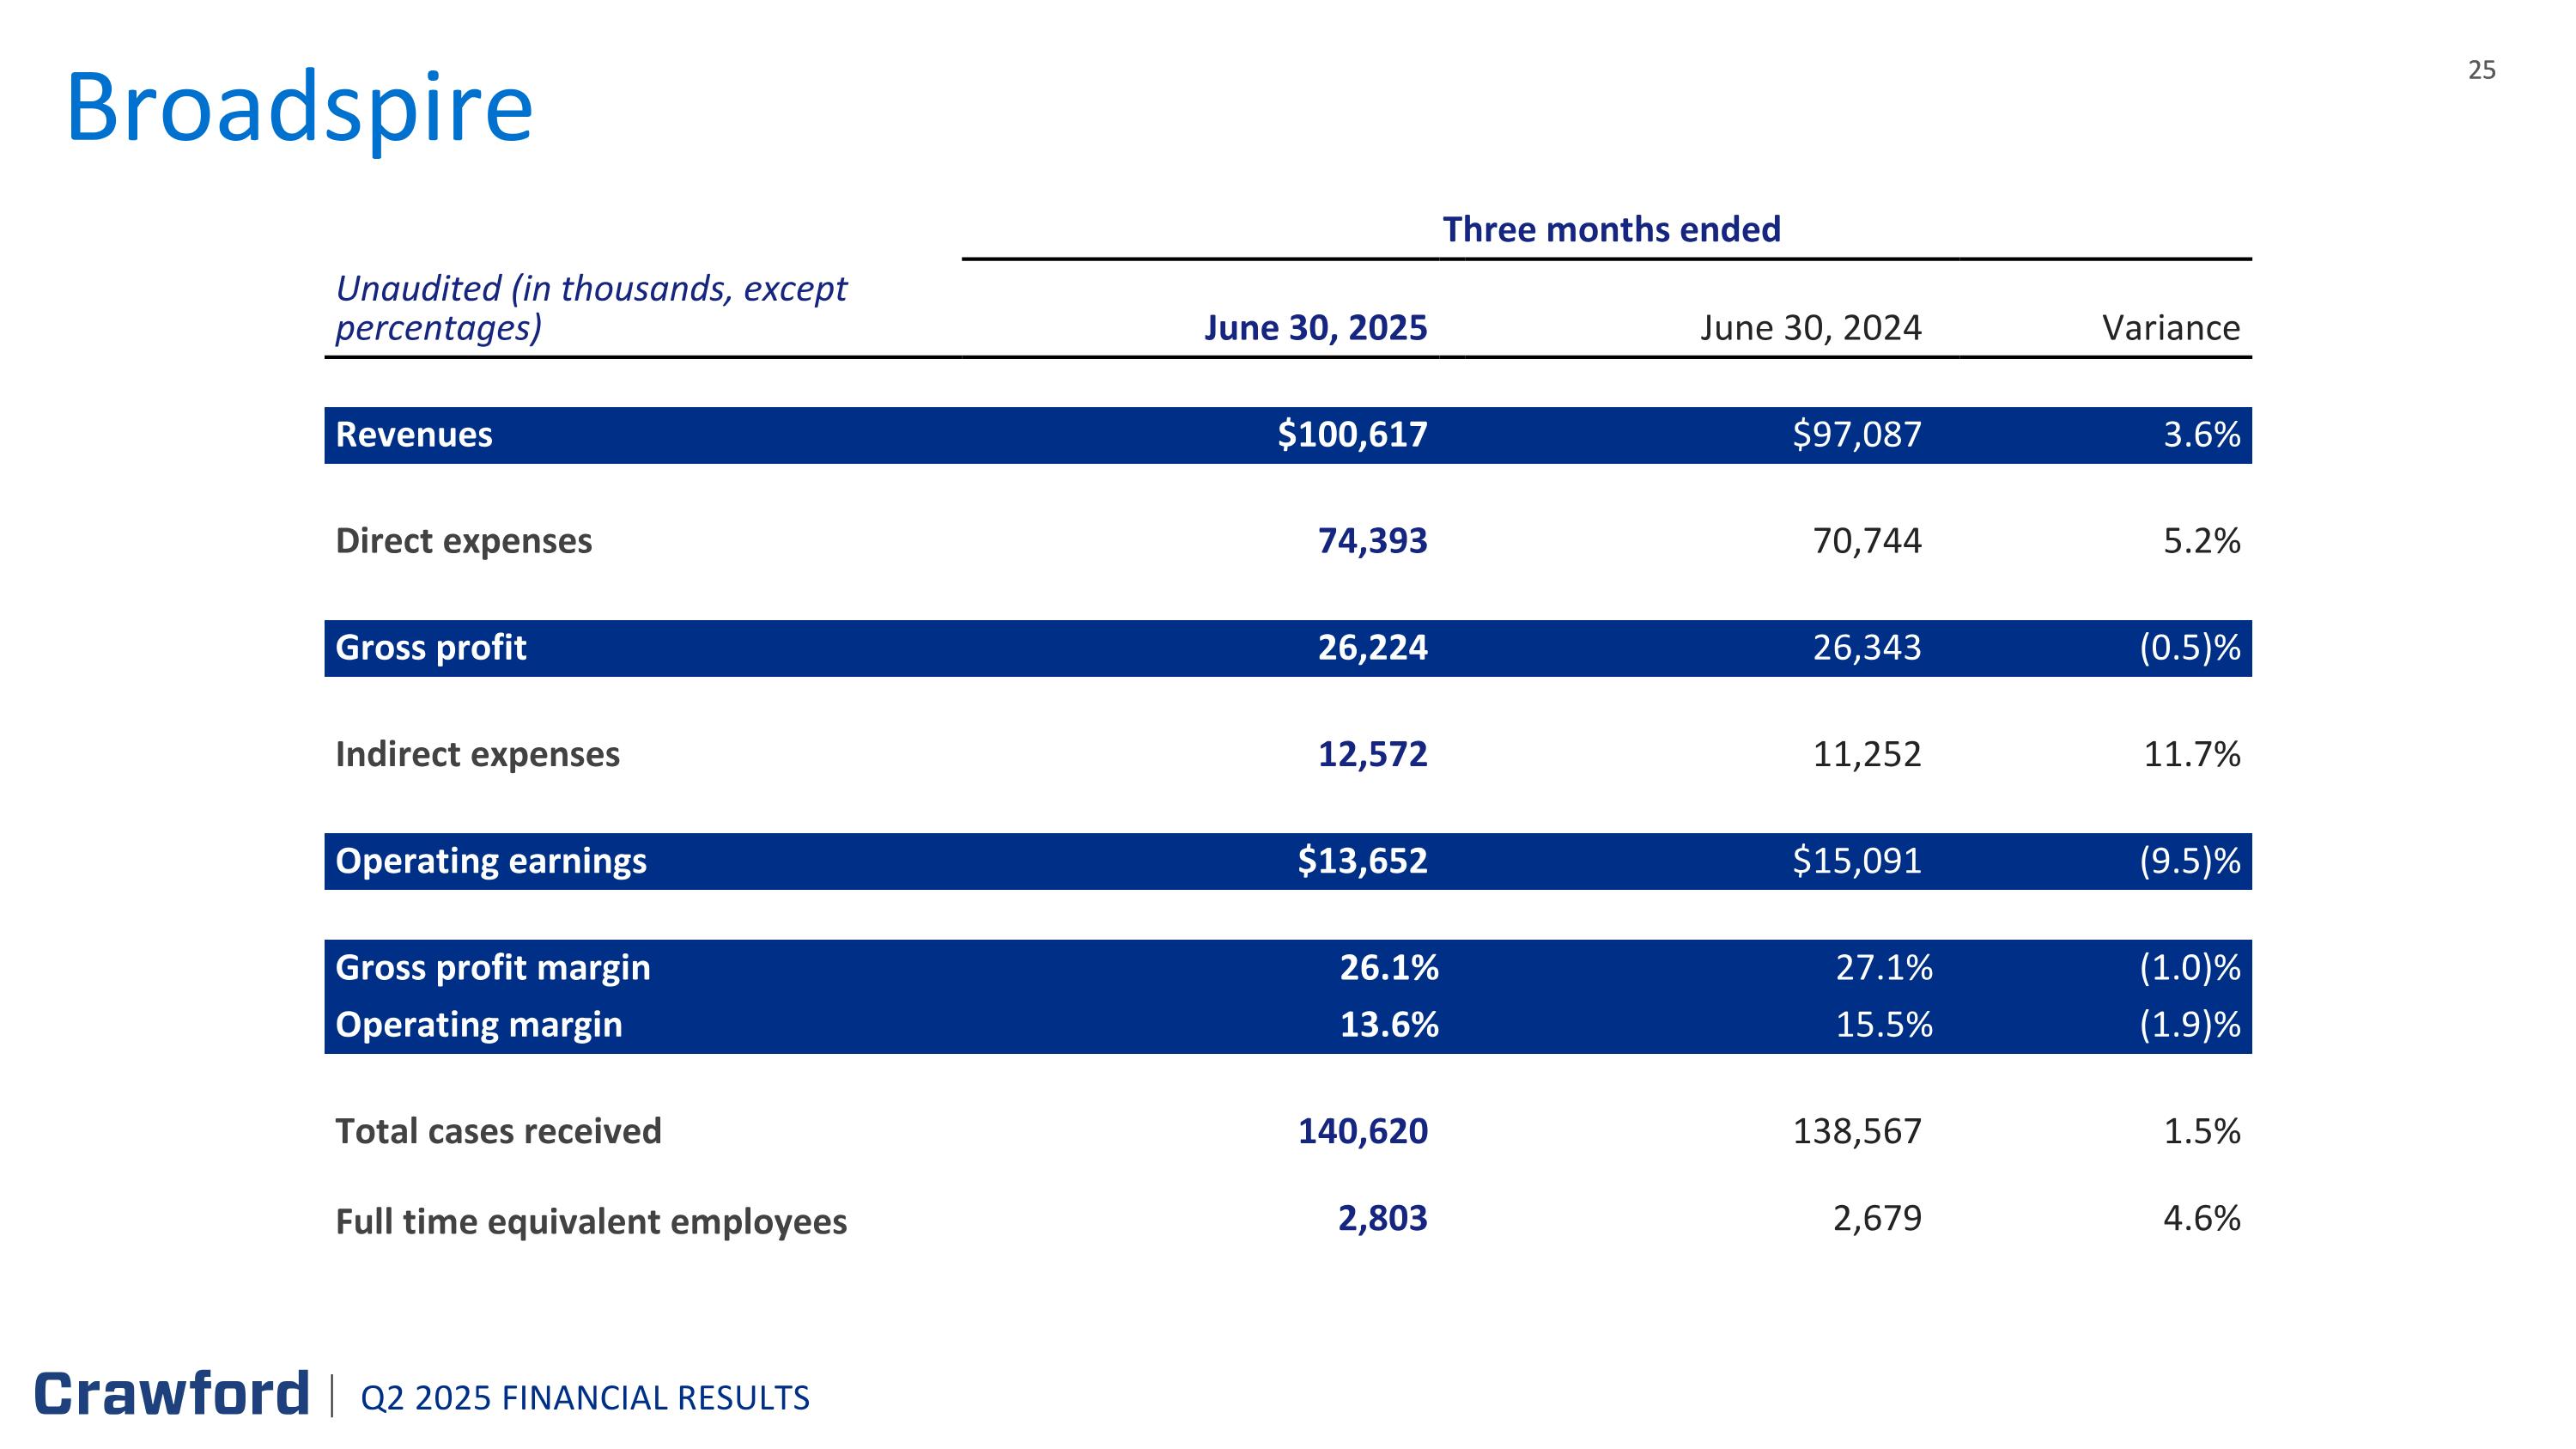
Broadspire Three months ended Unaudited (in thousands, except percentages) June 30, 2025 June 30, 2024 Variance Revenues $100,617 $97,087 3.6% Direct expenses 74,393 70,744 5.2% Gross profit 26,224 26,343 (0.5)% Indirect expenses 12,572 11,252 11.7% Operating earnings $13,652 $15,091 (9.5)% Gross profit margin 26.1% 27.1% (1.0)% Operating margin 13.6% 15.5% (1.9)% Total cases received 140,620 138,567 1.5% Full time equivalent employees 2,803 2,679 4.6% Q2 2025 FINANCIAL RESULTS
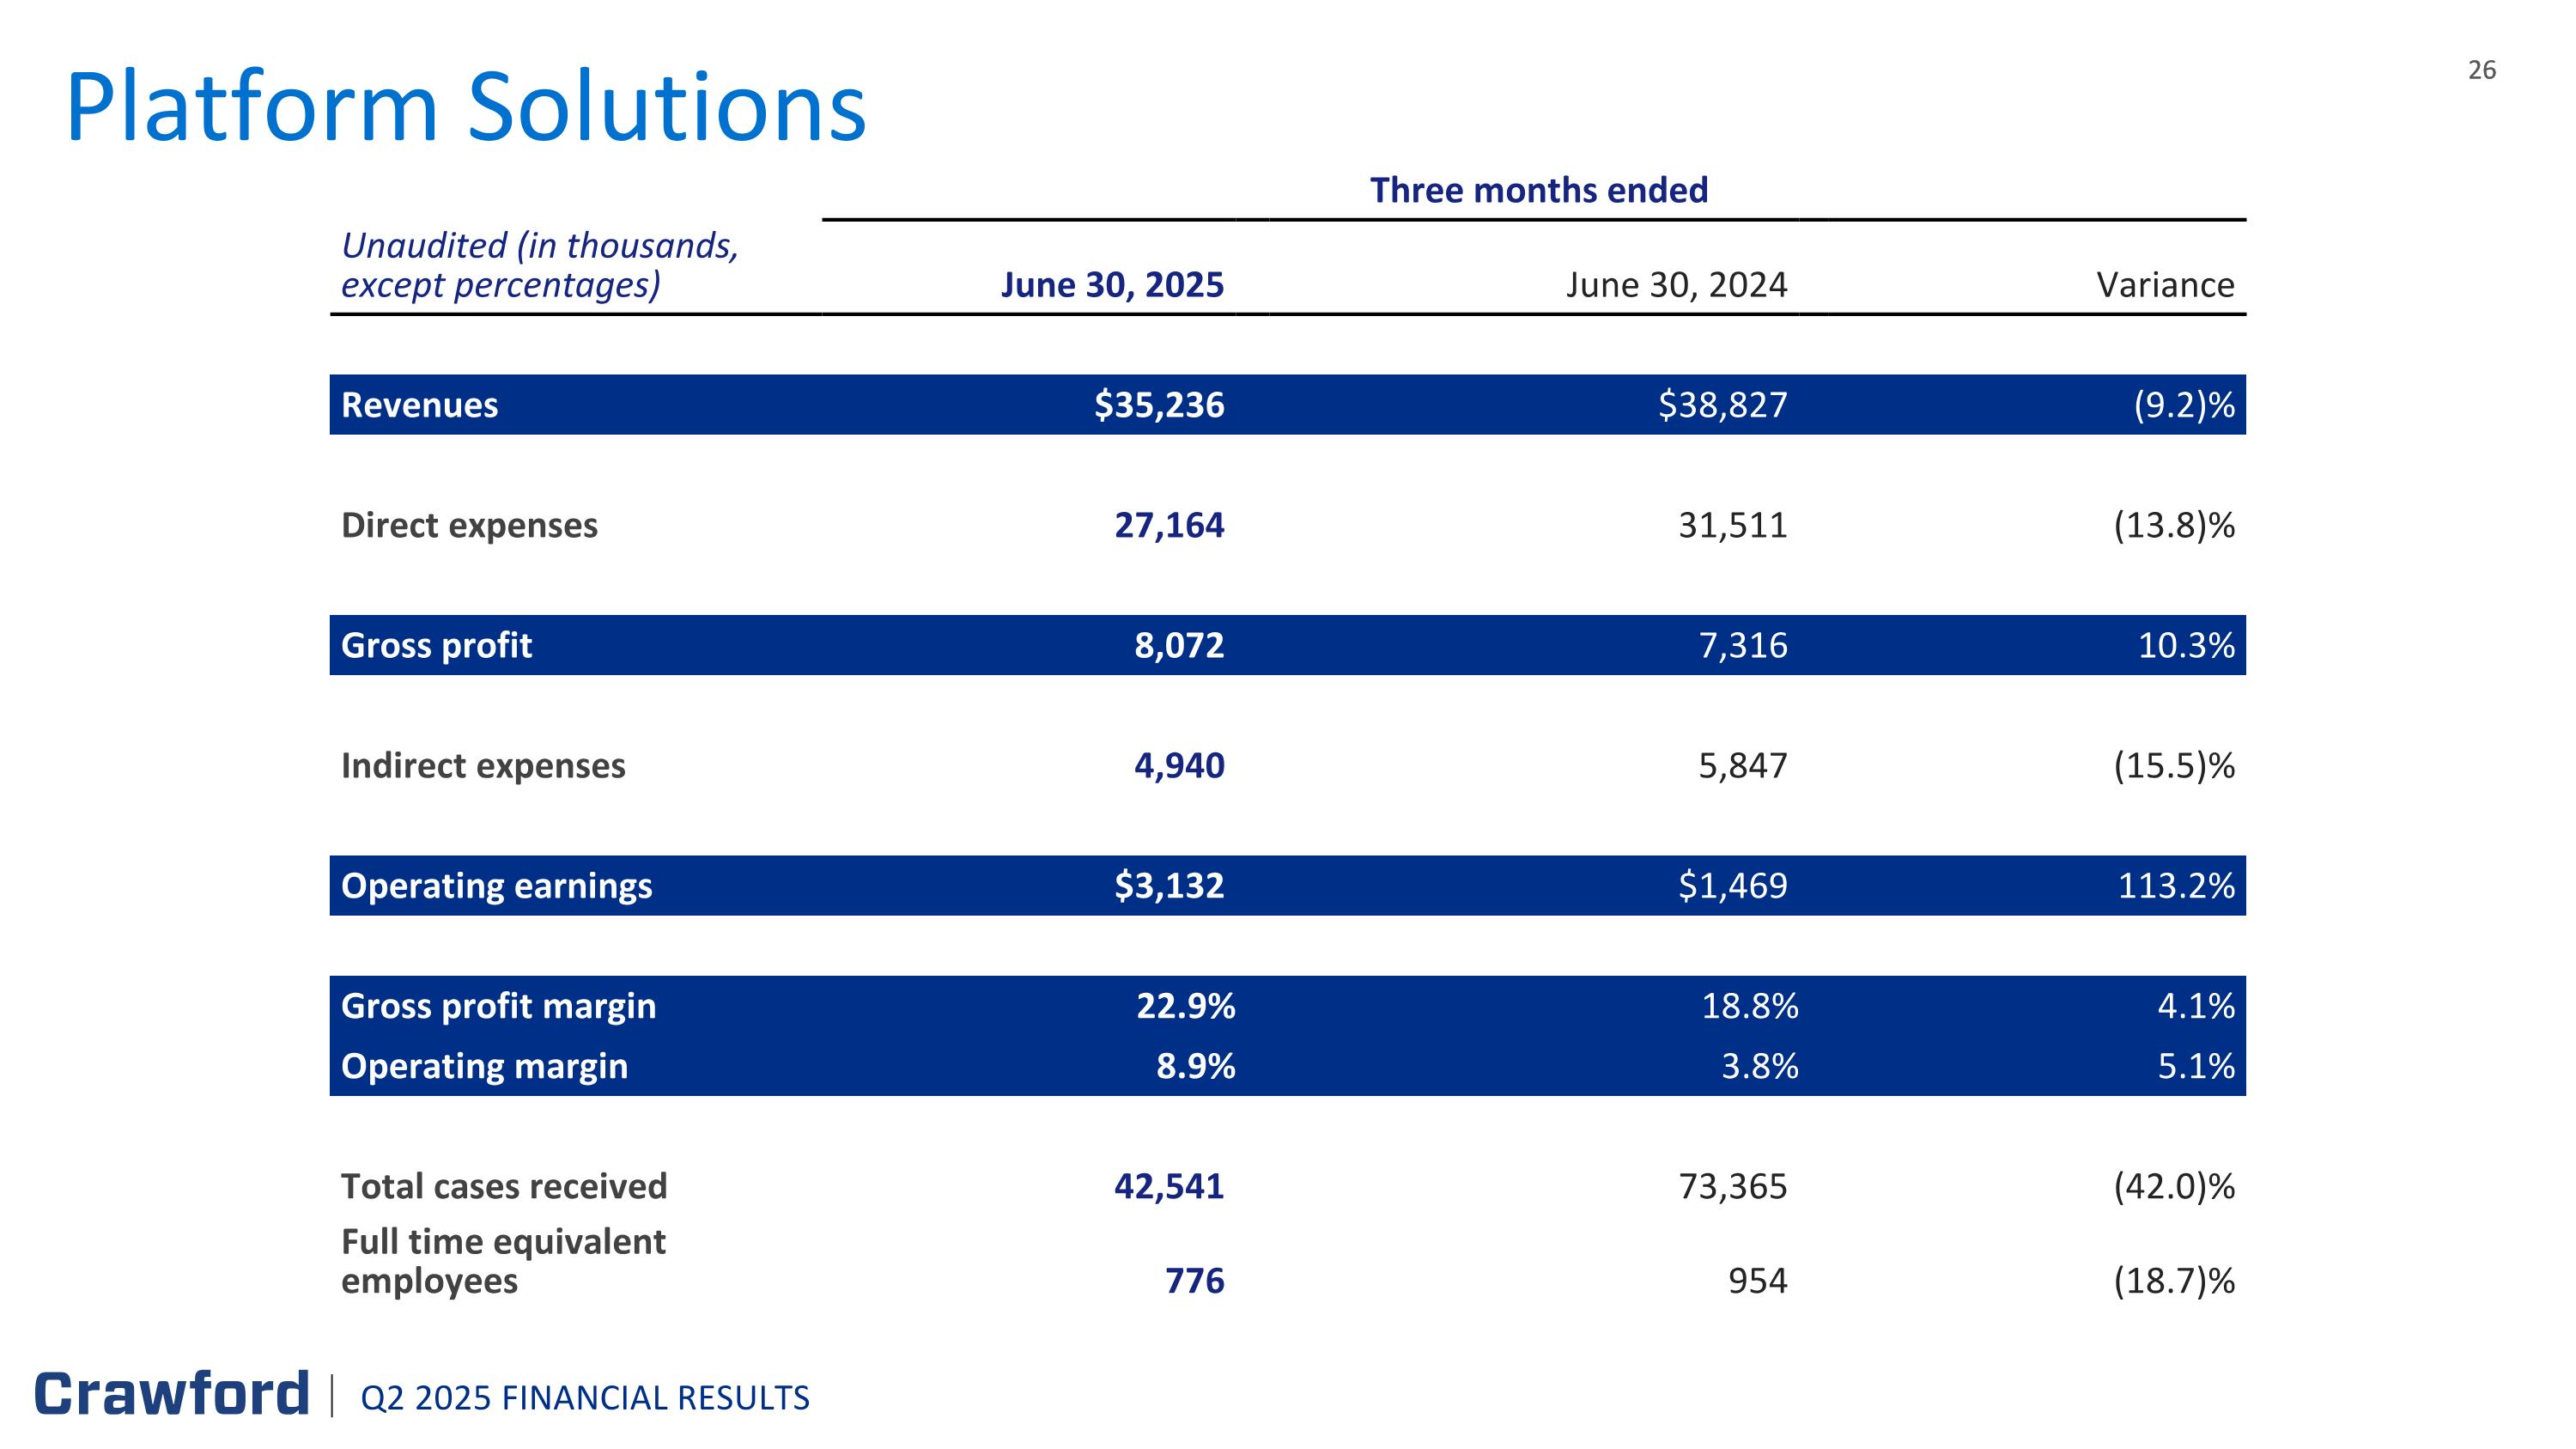
Platform Solutions Three months ended Unaudited (in thousands, except percentages) June 30, 2025 June 30, 2024 Variance Revenues $35,236 $38,827 (9.2)% Direct expenses 27,164 31,511 (13.8)% Gross profit 8,072 7,316 10.3% Indirect expenses 4,940 5,847 (15.5)% Operating earnings $3,132 $1,469 113.2% Gross profit margin 22.9% 18.8% 4.1% Operating margin 8.9% 3.8% 5.1% Total cases received 42,541 73,365 (42.0)% Full time equivalent employees 776 954 (18.7)% Q2 2025 FINANCIAL RESULTS
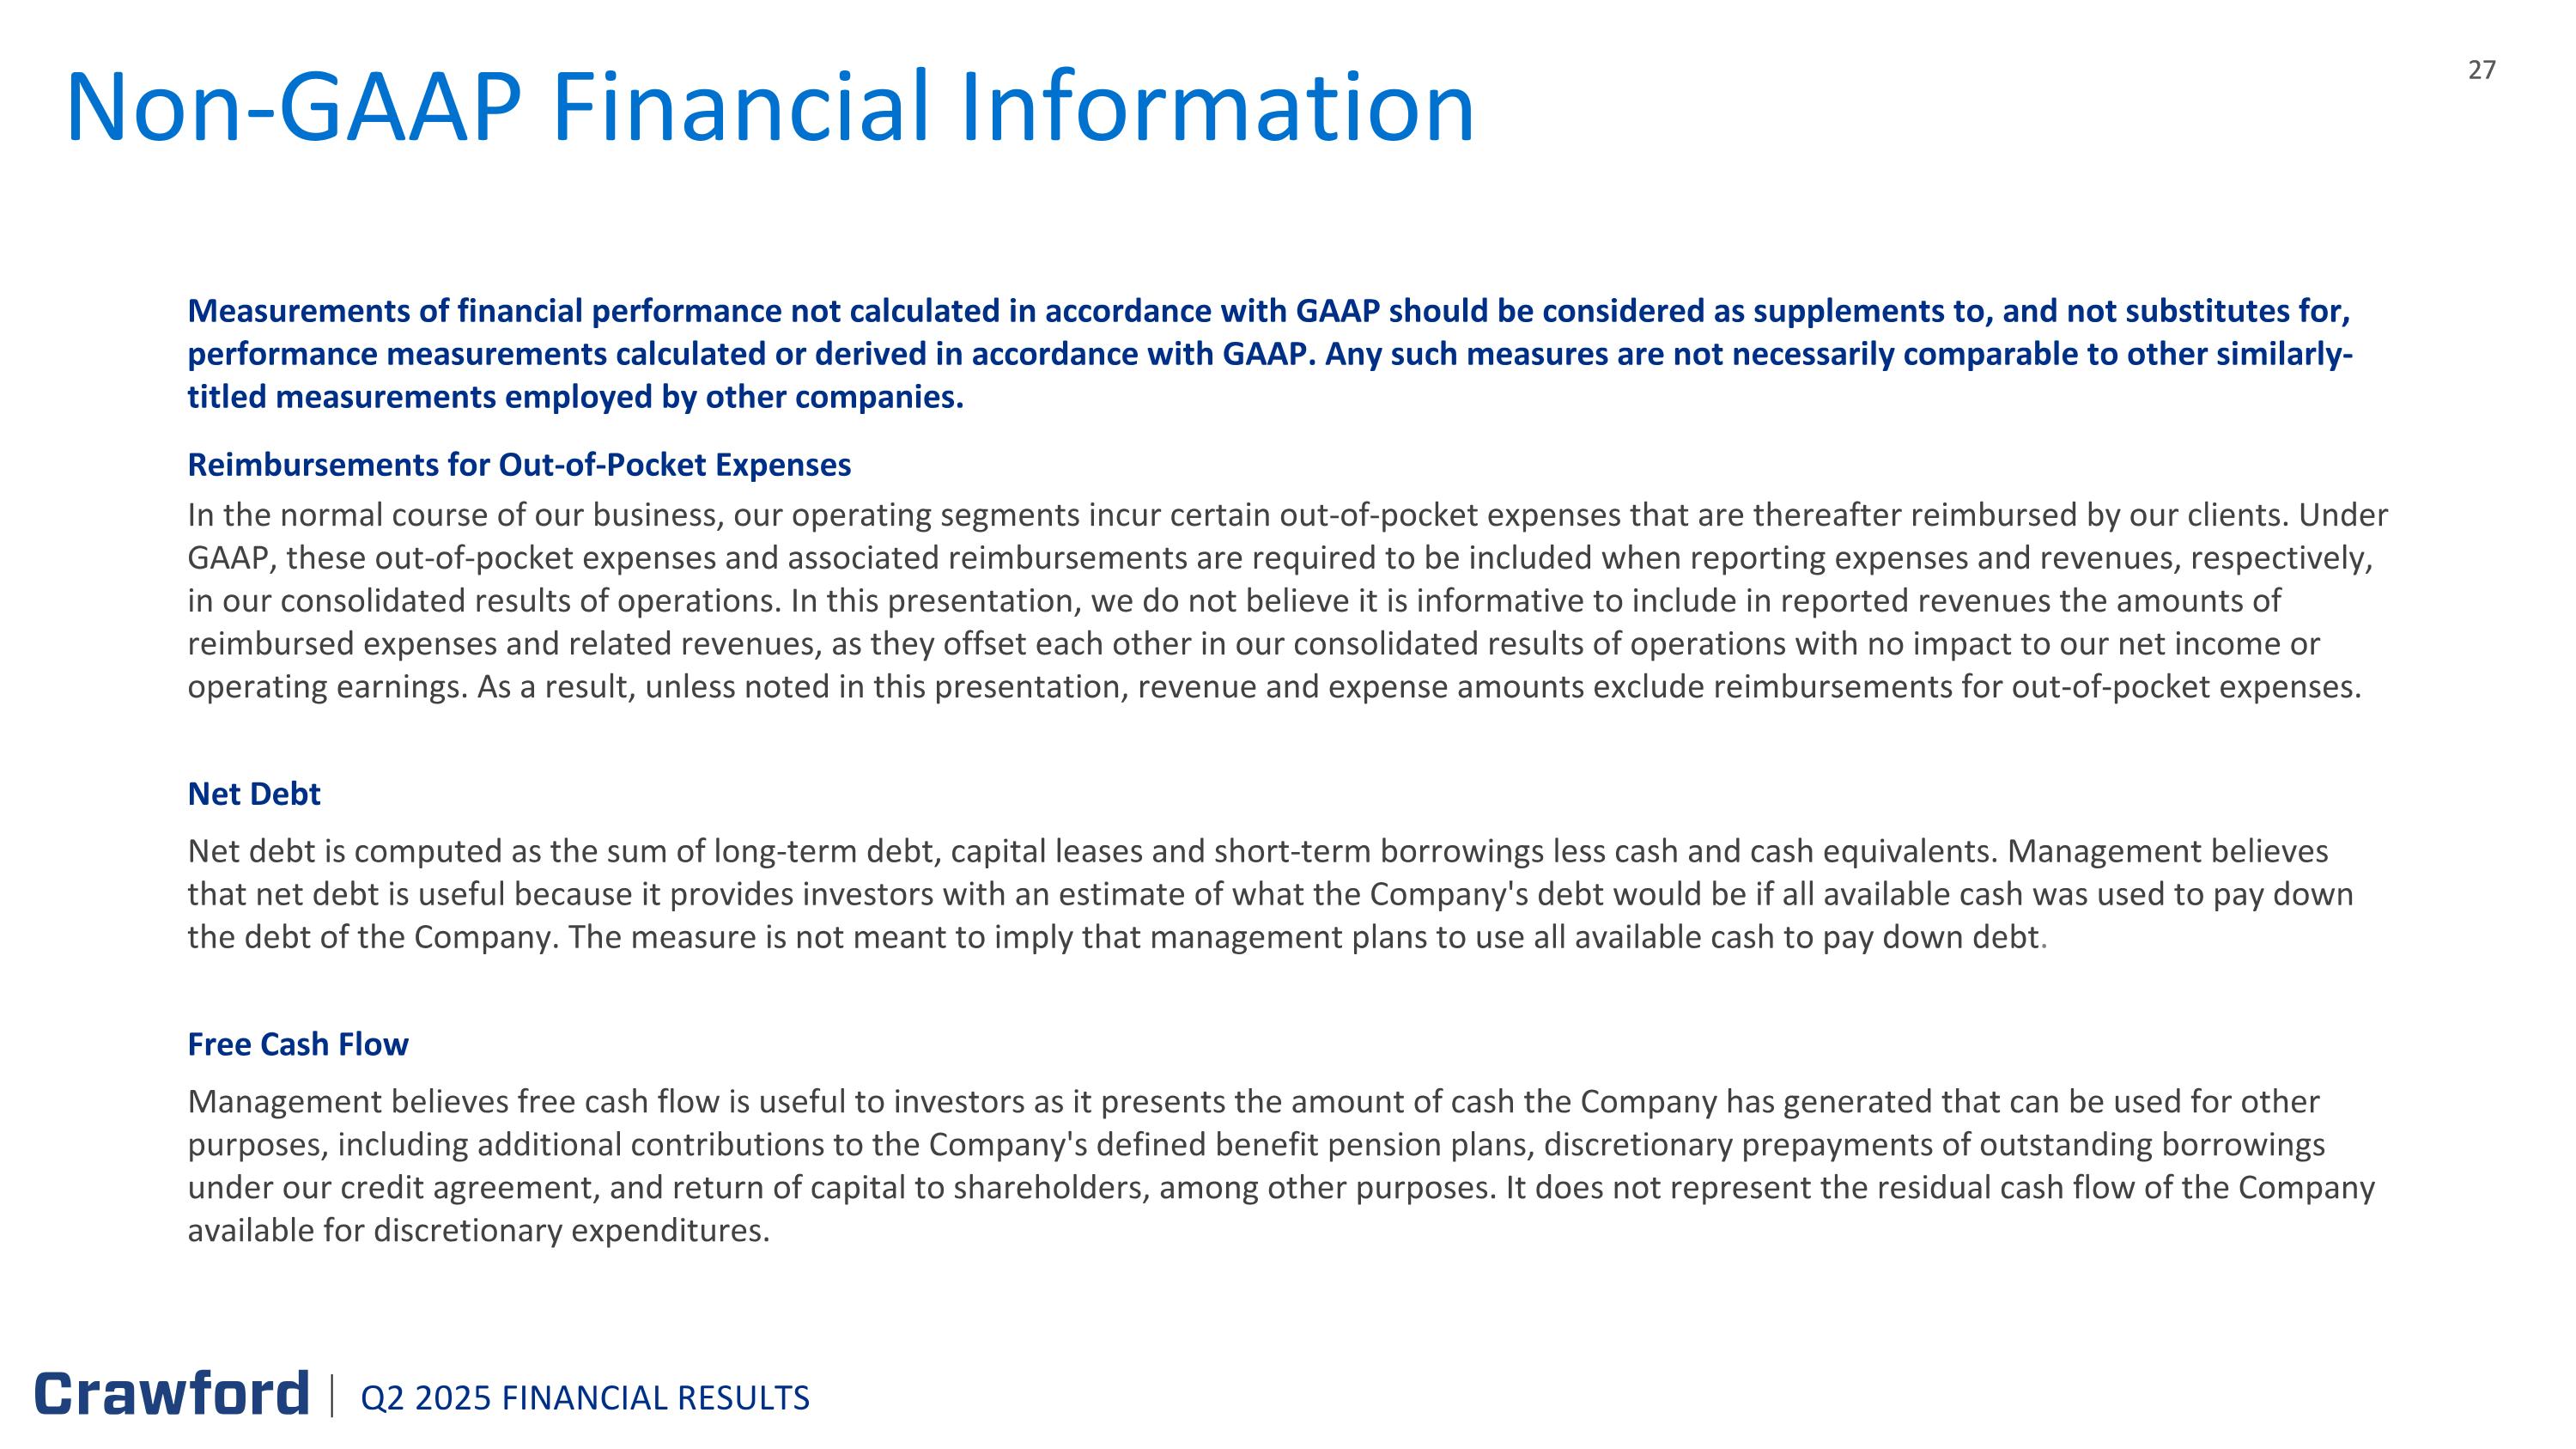
Non-GAAP Financial Information Measurements of financial performance not calculated in accordance with GAAP should be considered as supplements to, and not substitutes for, performance measurements calculated or derived in accordance with GAAP. Any such measures are not necessarily comparable to other similarly-titled measurements employed by other companies. Reimbursements for Out-of-Pocket Expenses In the normal course of our business, our operating segments incur certain out-of-pocket expenses that are thereafter reimbursed by our clients. Under GAAP, these out-of-pocket expenses and associated reimbursements are required to be included when reporting expenses and revenues, respectively, in our consolidated results of operations. In this presentation, we do not believe it is informative to include in reported revenues the amounts of reimbursed expenses and related revenues, as they offset each other in our consolidated results of operations with no impact to our net income or operating earnings. As a result, unless noted in this presentation, revenue and expense amounts exclude reimbursements for out-of-pocket expenses. Net Debt Net debt is computed as the sum of long-term debt, capital leases and short-term borrowings less cash and cash equivalents. Management believes that net debt is useful because it provides investors with an estimate of what the Company's debt would be if all available cash was used to pay down the debt of the Company. The measure is not meant to imply that management plans to use all available cash to pay down debt. Free Cash Flow Management believes free cash flow is useful to investors as it presents the amount of cash the Company has generated that can be used for other purposes, including additional contributions to the Company's defined benefit pension plans, discretionary prepayments of outstanding borrowings under our credit agreement, and return of capital to shareholders, among other purposes. It does not represent the residual cash flow of the Company available for discretionary expenditures. Q2 2025 FINANCIAL RESULTS
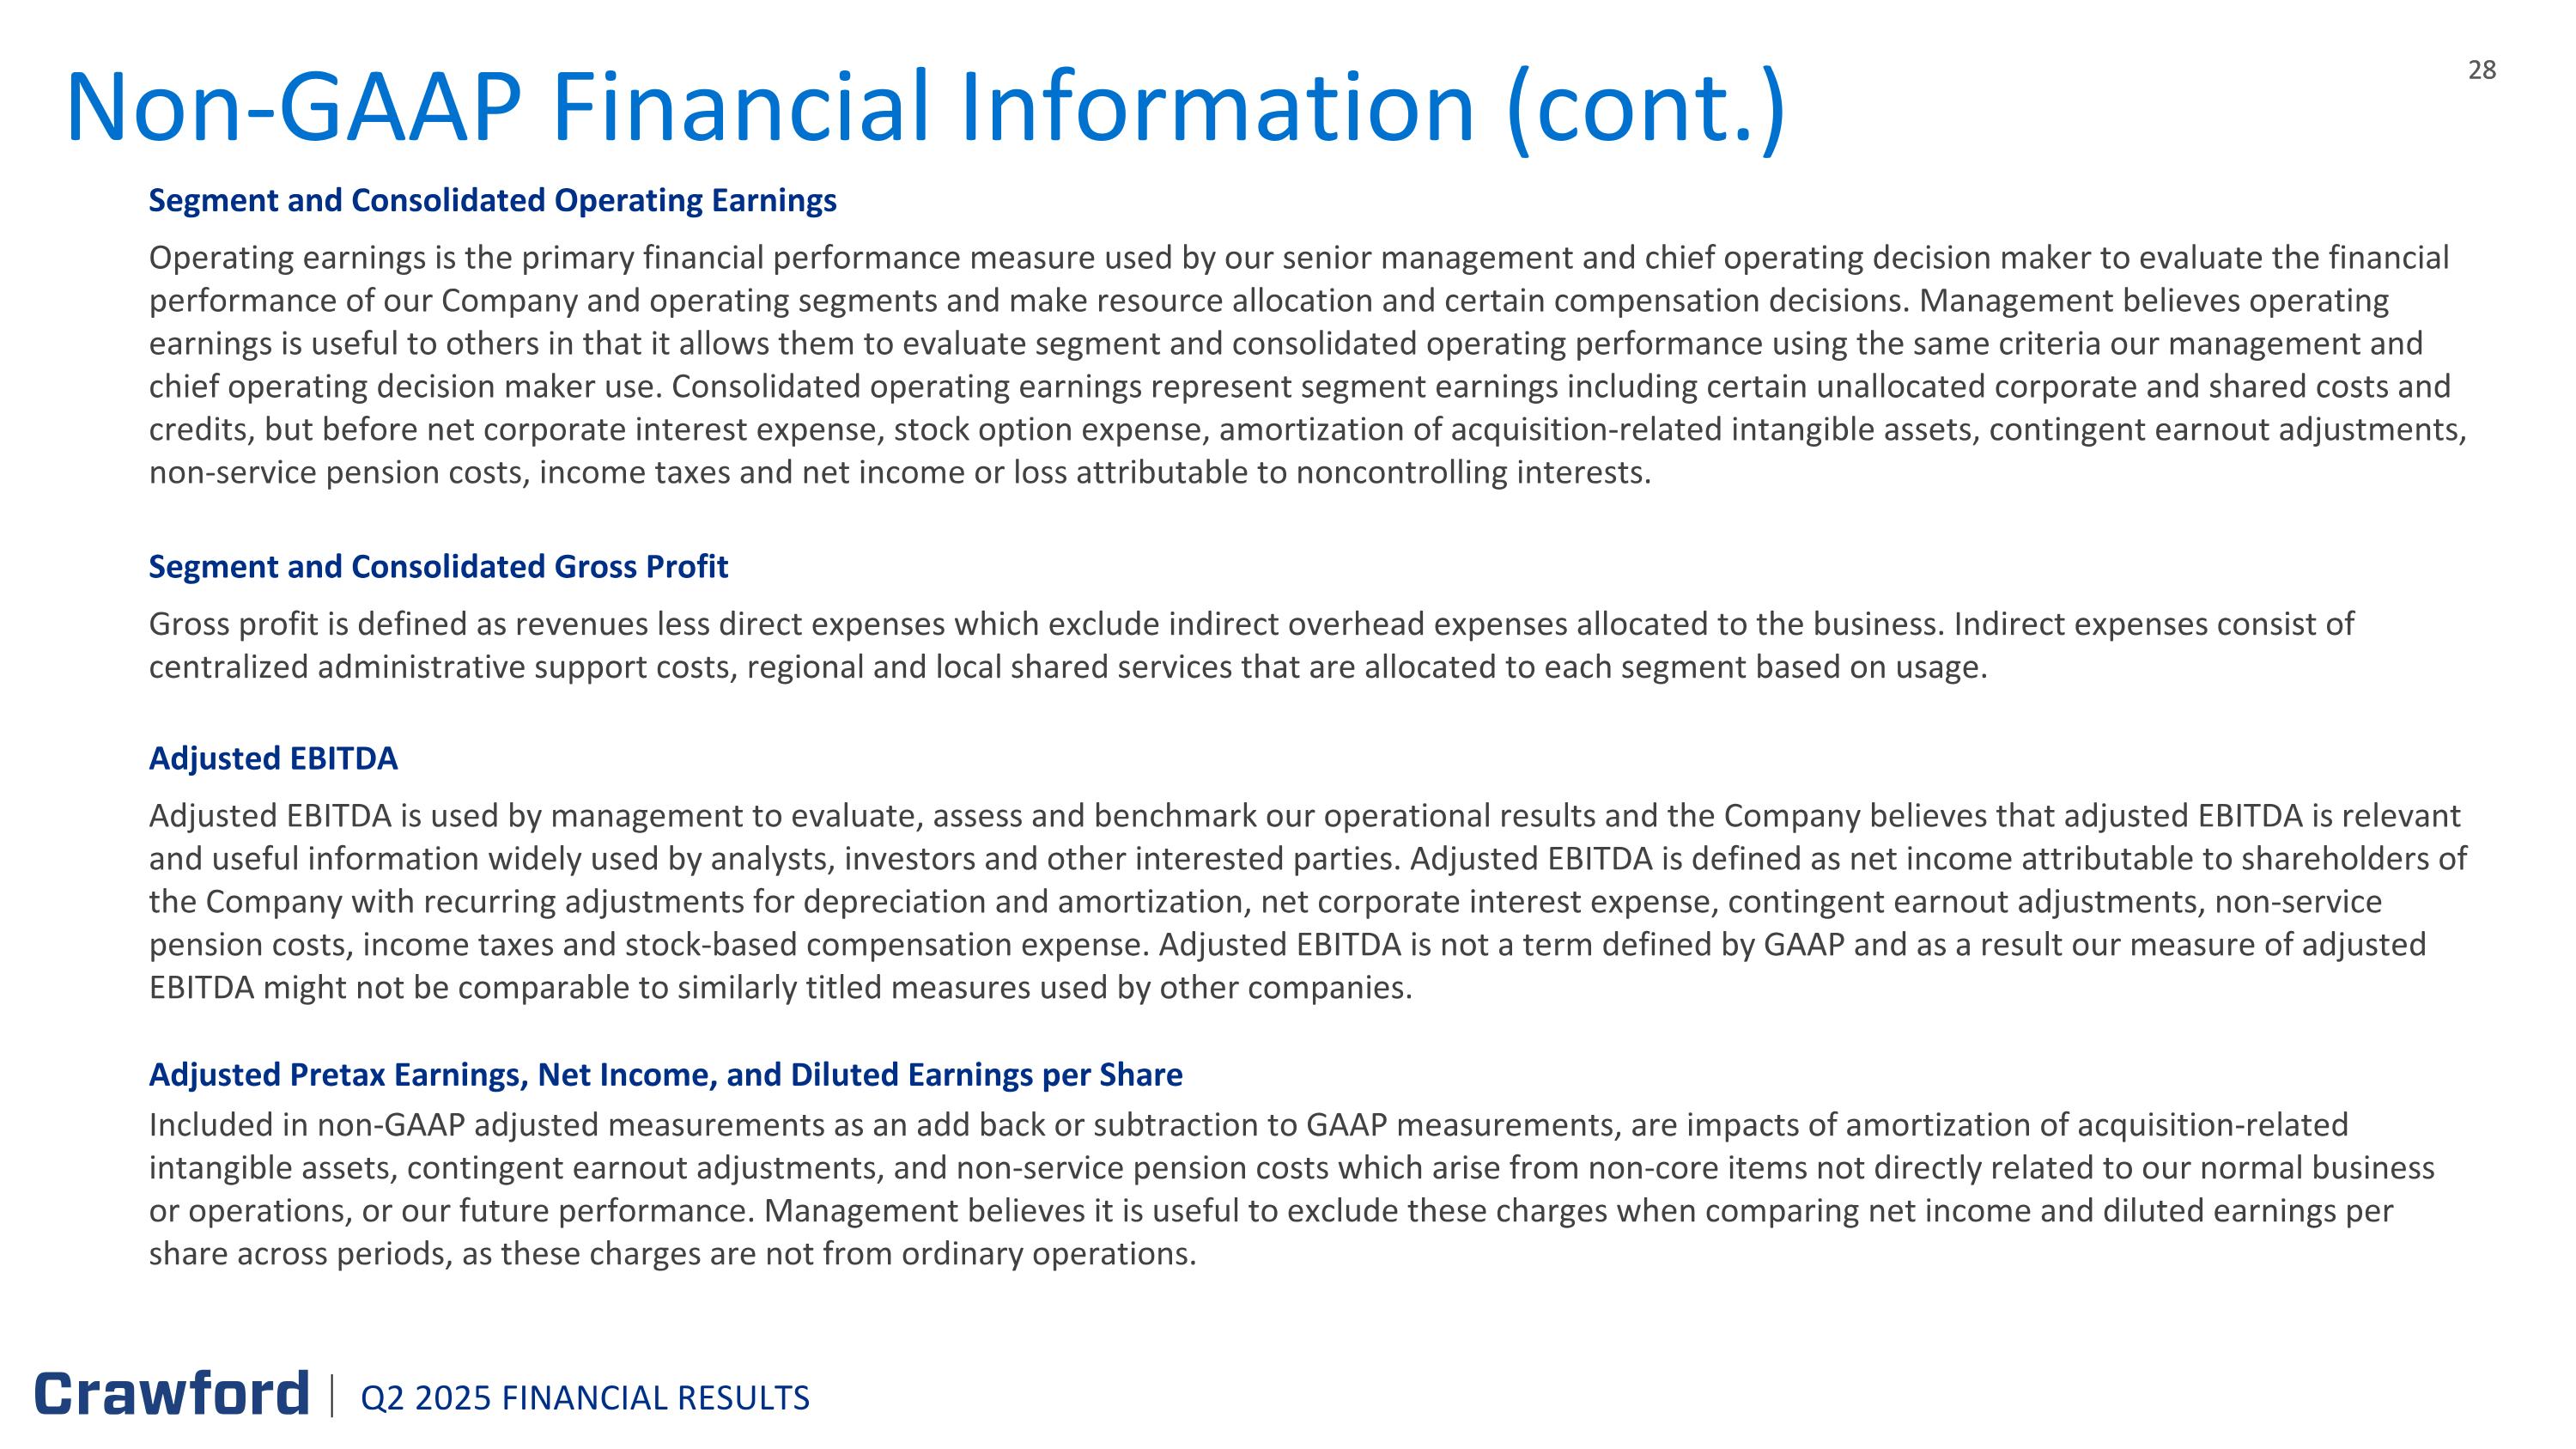
Non-GAAP Financial Information (cont.) Segment and Consolidated Operating Earnings Operating earnings is the primary financial performance measure used by our senior management and chief operating decision maker to evaluate the financial performance of our Company and operating segments and make resource allocation and certain compensation decisions. Management believes operating earnings is useful to others in that it allows them to evaluate segment and consolidated operating performance using the same criteria our management and chief operating decision maker use. Consolidated operating earnings represent segment earnings including certain unallocated corporate and shared costs and credits, but before net corporate interest expense, stock option expense, amortization of acquisition-related intangible assets, contingent earnout adjustments, non-service pension costs, income taxes and net income or loss attributable to noncontrolling interests. Segment and Consolidated Gross Profit Gross profit is defined as revenues less direct expenses which exclude indirect overhead expenses allocated to the business. Indirect expenses consist of centralized administrative support costs, regional and local shared services that are allocated to each segment based on usage. Adjusted EBITDA Adjusted EBITDA is used by management to evaluate, assess and benchmark our operational results and the Company believes that adjusted EBITDA is relevant and useful information widely used by analysts, investors and other interested parties. Adjusted EBITDA is defined as net income attributable to shareholders of the Company with recurring adjustments for depreciation and amortization, net corporate interest expense, contingent earnout adjustments, non-service pension costs, income taxes and stock-based compensation expense. Adjusted EBITDA is not a term defined by GAAP and as a result our measure of adjusted EBITDA might not be comparable to similarly titled measures used by other companies. Adjusted Pretax Earnings, Net Income, and Diluted Earnings per Share Included in non-GAAP adjusted measurements as an add back or subtraction to GAAP measurements, are impacts of amortization of acquisition-related intangible assets, contingent earnout adjustments, and non-service pension costs which arise from non-core items not directly related to our normal business or operations, or our future performance. Management believes it is useful to exclude these charges when comparing net income and diluted earnings per share across periods, as these charges are not from ordinary operations. Q2 2025 FINANCIAL RESULTS
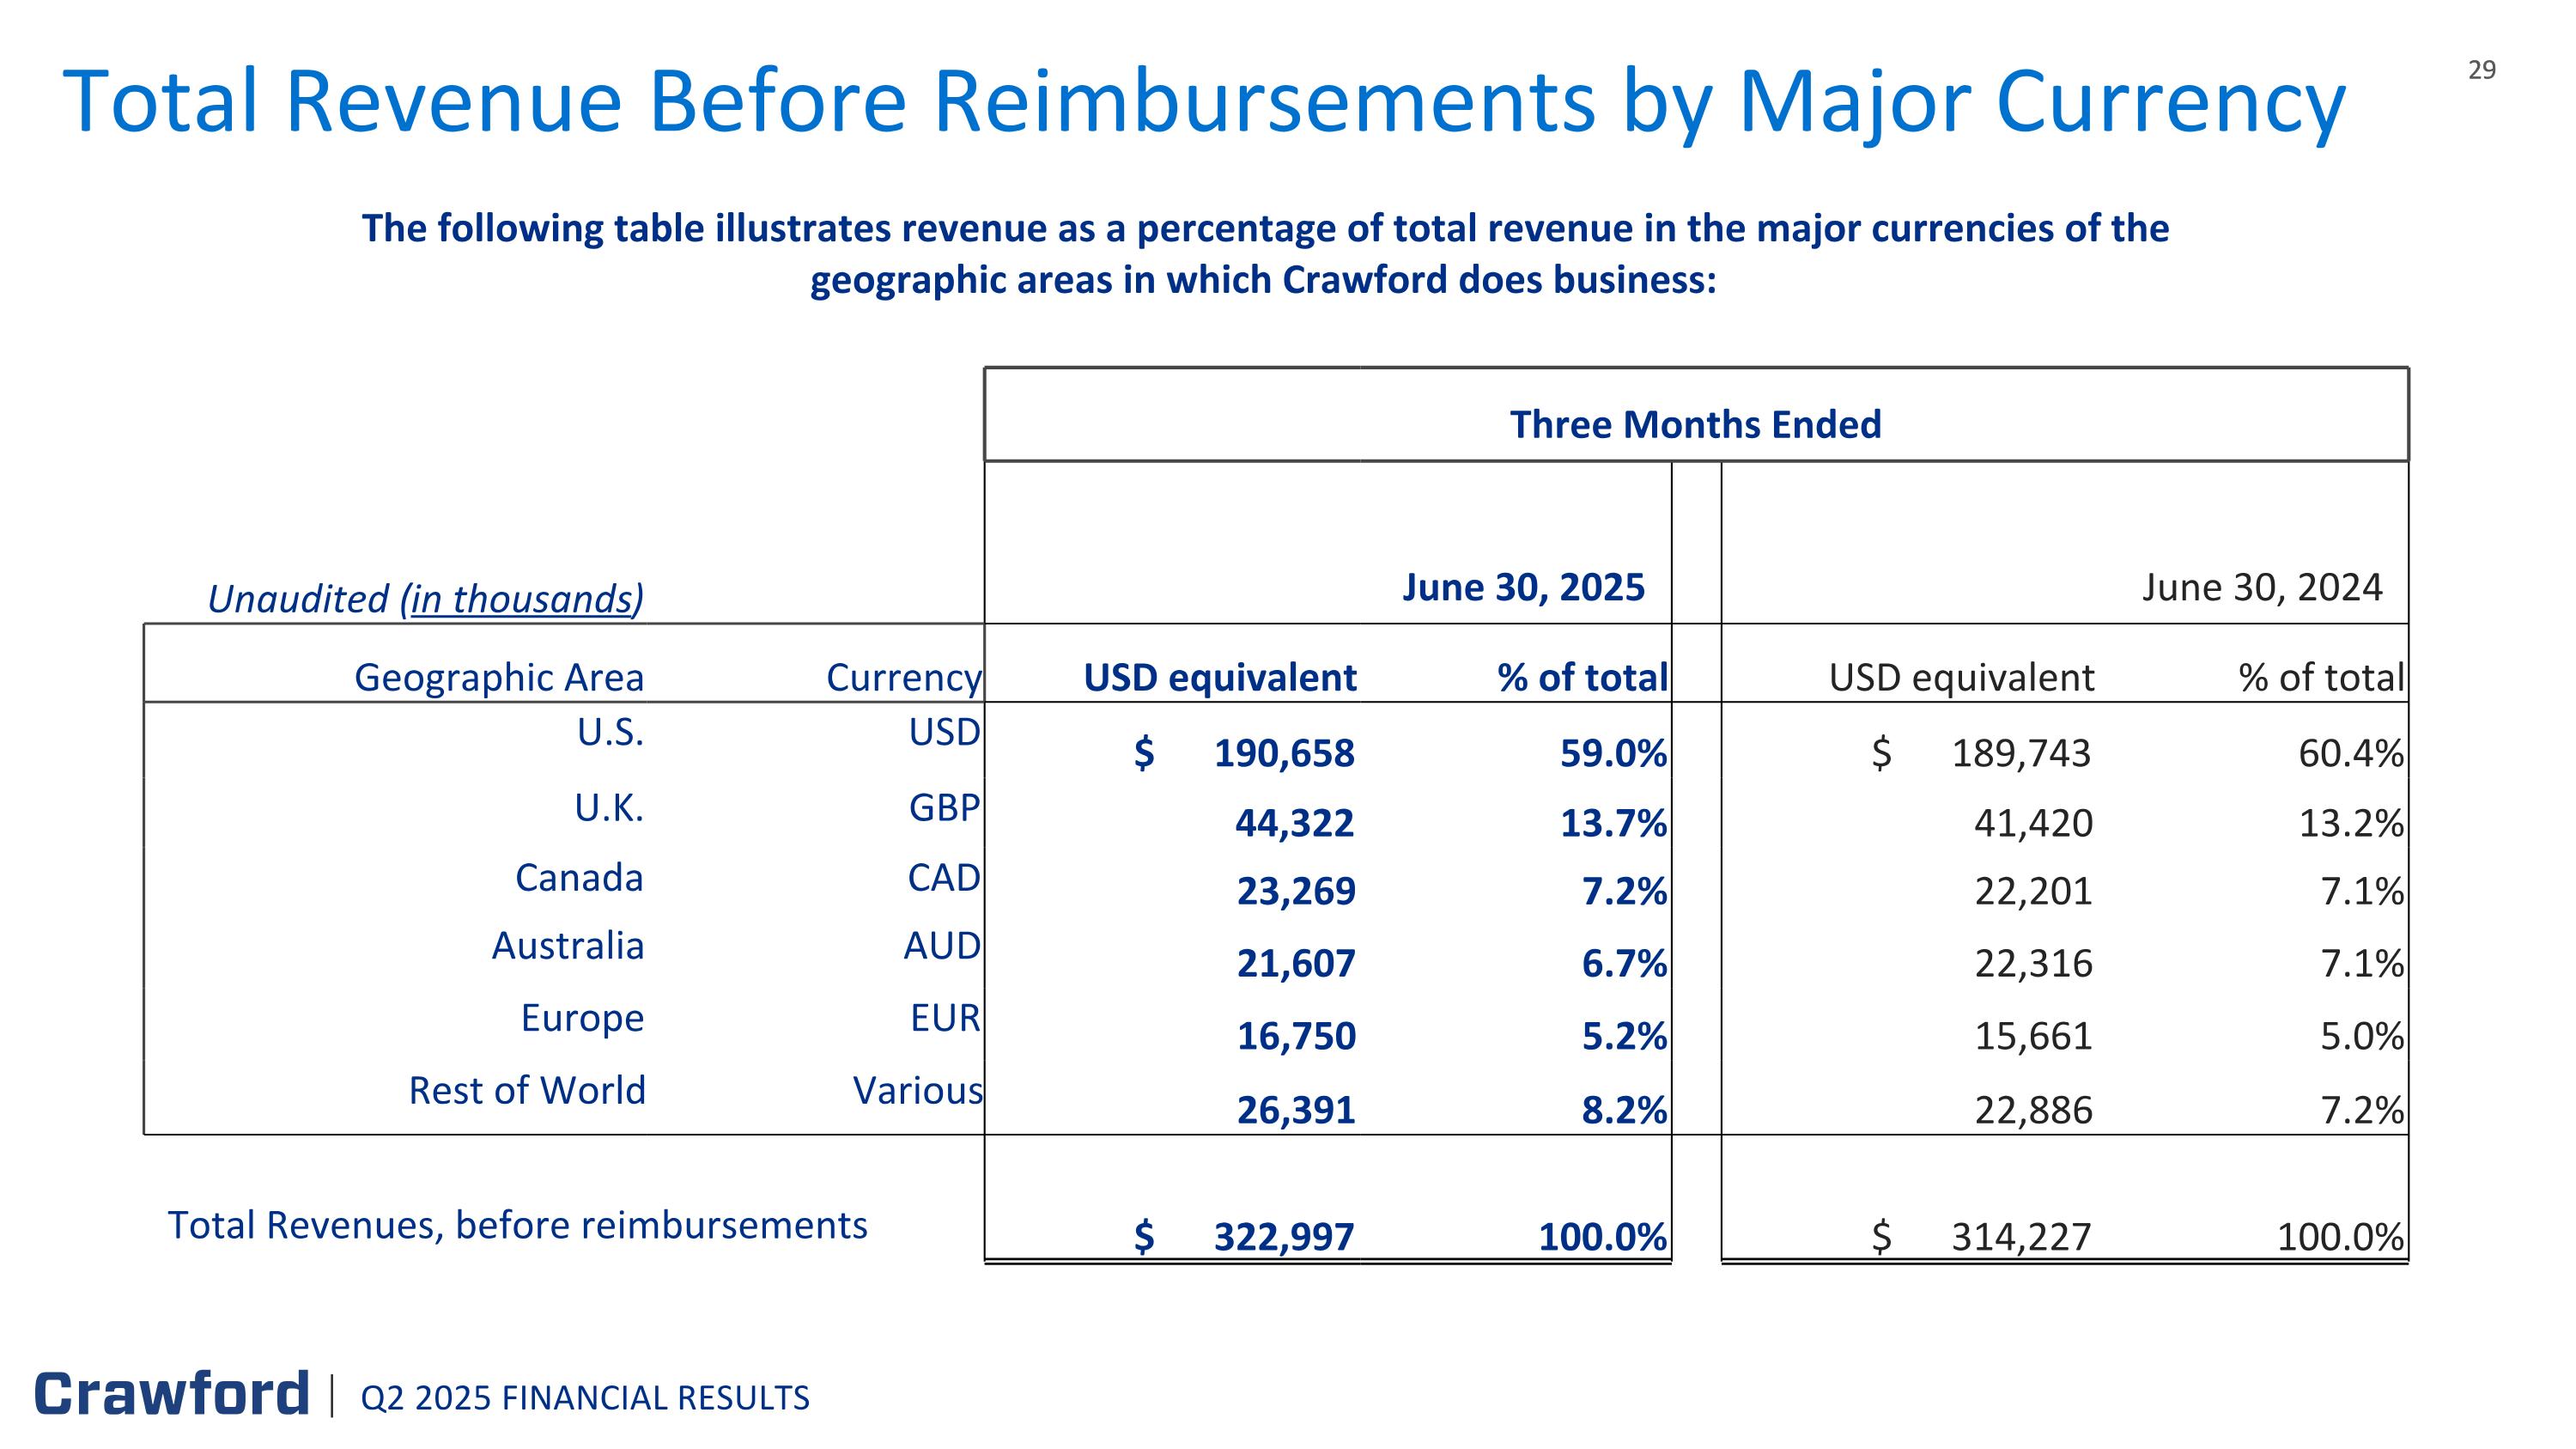
The following table illustrates revenue as a percentage of total revenue in the major currencies of the geographic areas in which Crawford does business: Total Revenue Before Reimbursements by Major Currency Three Months Ended Unaudited (in thousands) June 30, 2025 June 30, 2024 Geographic Area Currency USD equivalent % of total USD equivalent % of total U.S. USD $ 190,658 59.0% $ 189,743 60.4% U.K. GBP 44,322 13.7% 41,420 13.2% Canada CAD 23,269 7.2% 22,201 7.1% Australia AUD 21,607 6.7% 22,316 7.1% Europe EUR 16,750 5.2% 15,661 5.0% Rest of World Various 26,391 8.2% 22,886 7.2% Total Revenues, before reimbursements $ 322,997 100.0% $ 314,227 100.0% Q2 2025 FINANCIAL RESULTS
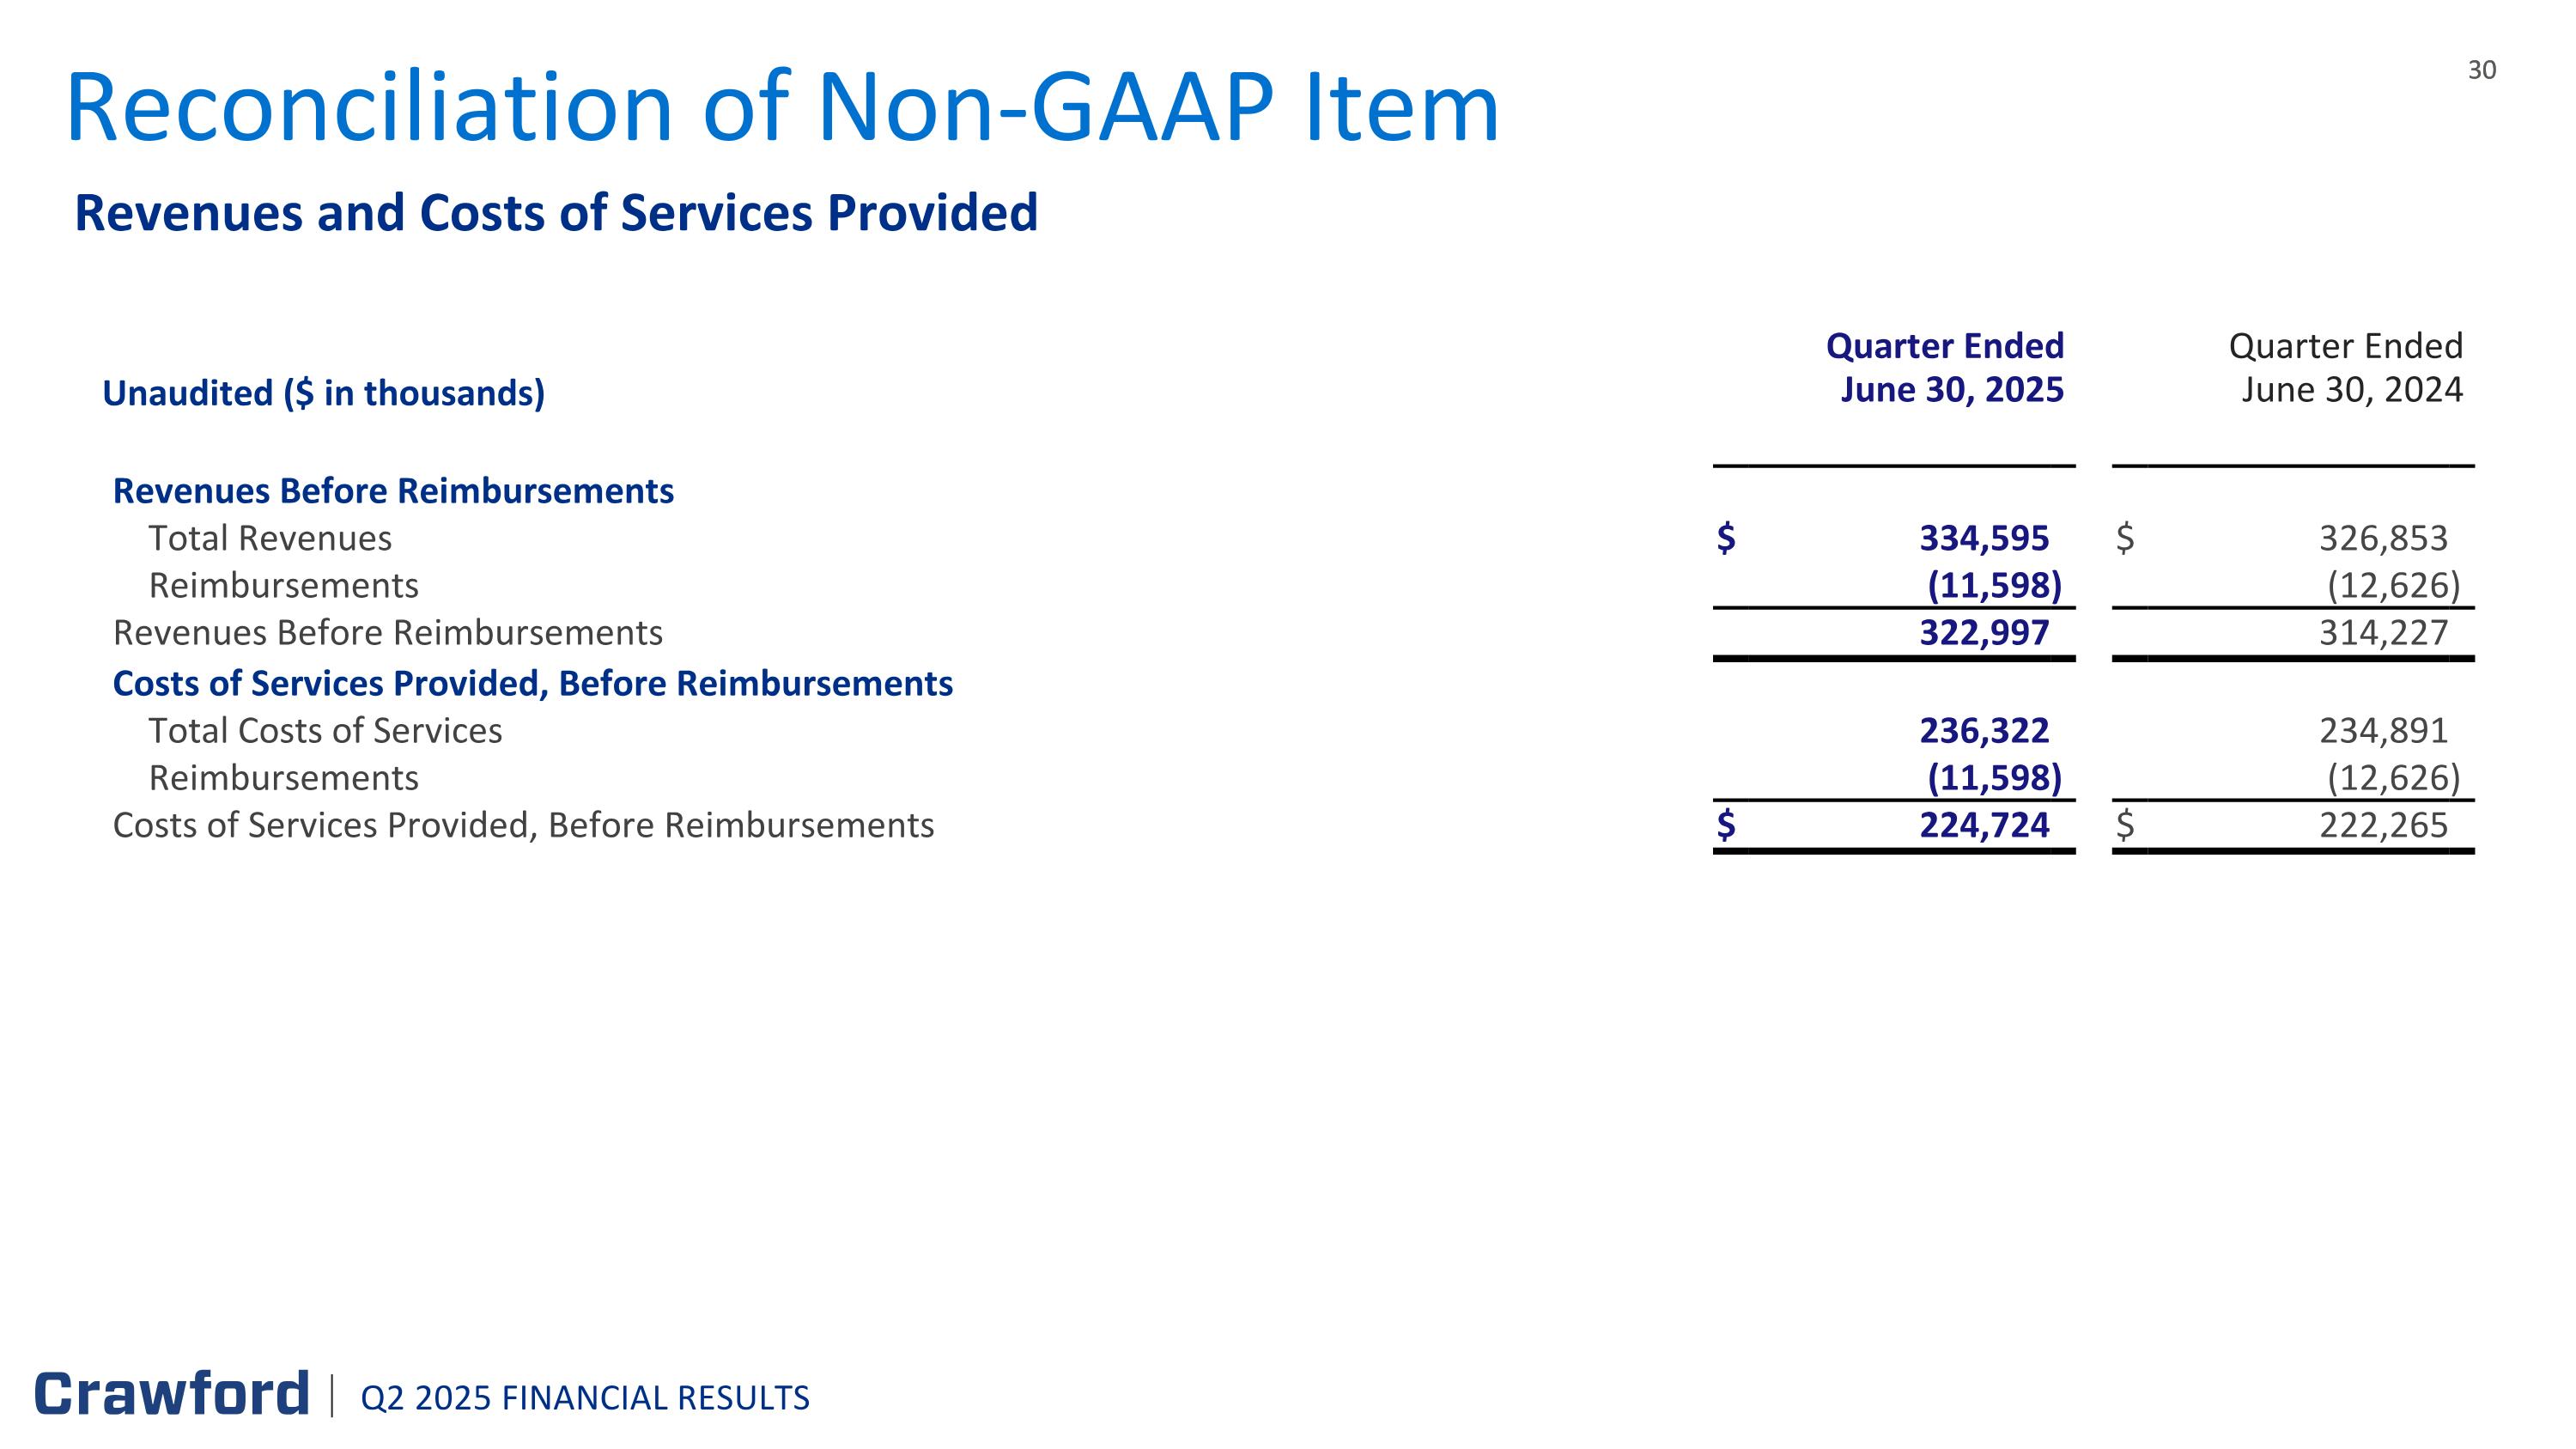
Revenues and Costs of Services Provided Reconciliation of Non-GAAP Item Quarter Ended Quarter Ended Quarter Ended Quarter Ended Unaudited ($ in thousands) June 30, 2025 December 31, June 30, 2024 December 31, 2019 2018 Revenues Before Reimbursements Total Revenues $ 334,595 $ 326,853 Reimbursements (11,598 ) (12,626 ) Revenues Before Reimbursements 322,997 314,227 Costs of Services Provided, Before Reimbursements Total Costs of Services 236,322 234,891 Reimbursements (11,598 ) (12,626 ) Costs of Services Provided, Before Reimbursements $ 224,724 $ 222,265 Q2 2025 FINANCIAL RESULTS
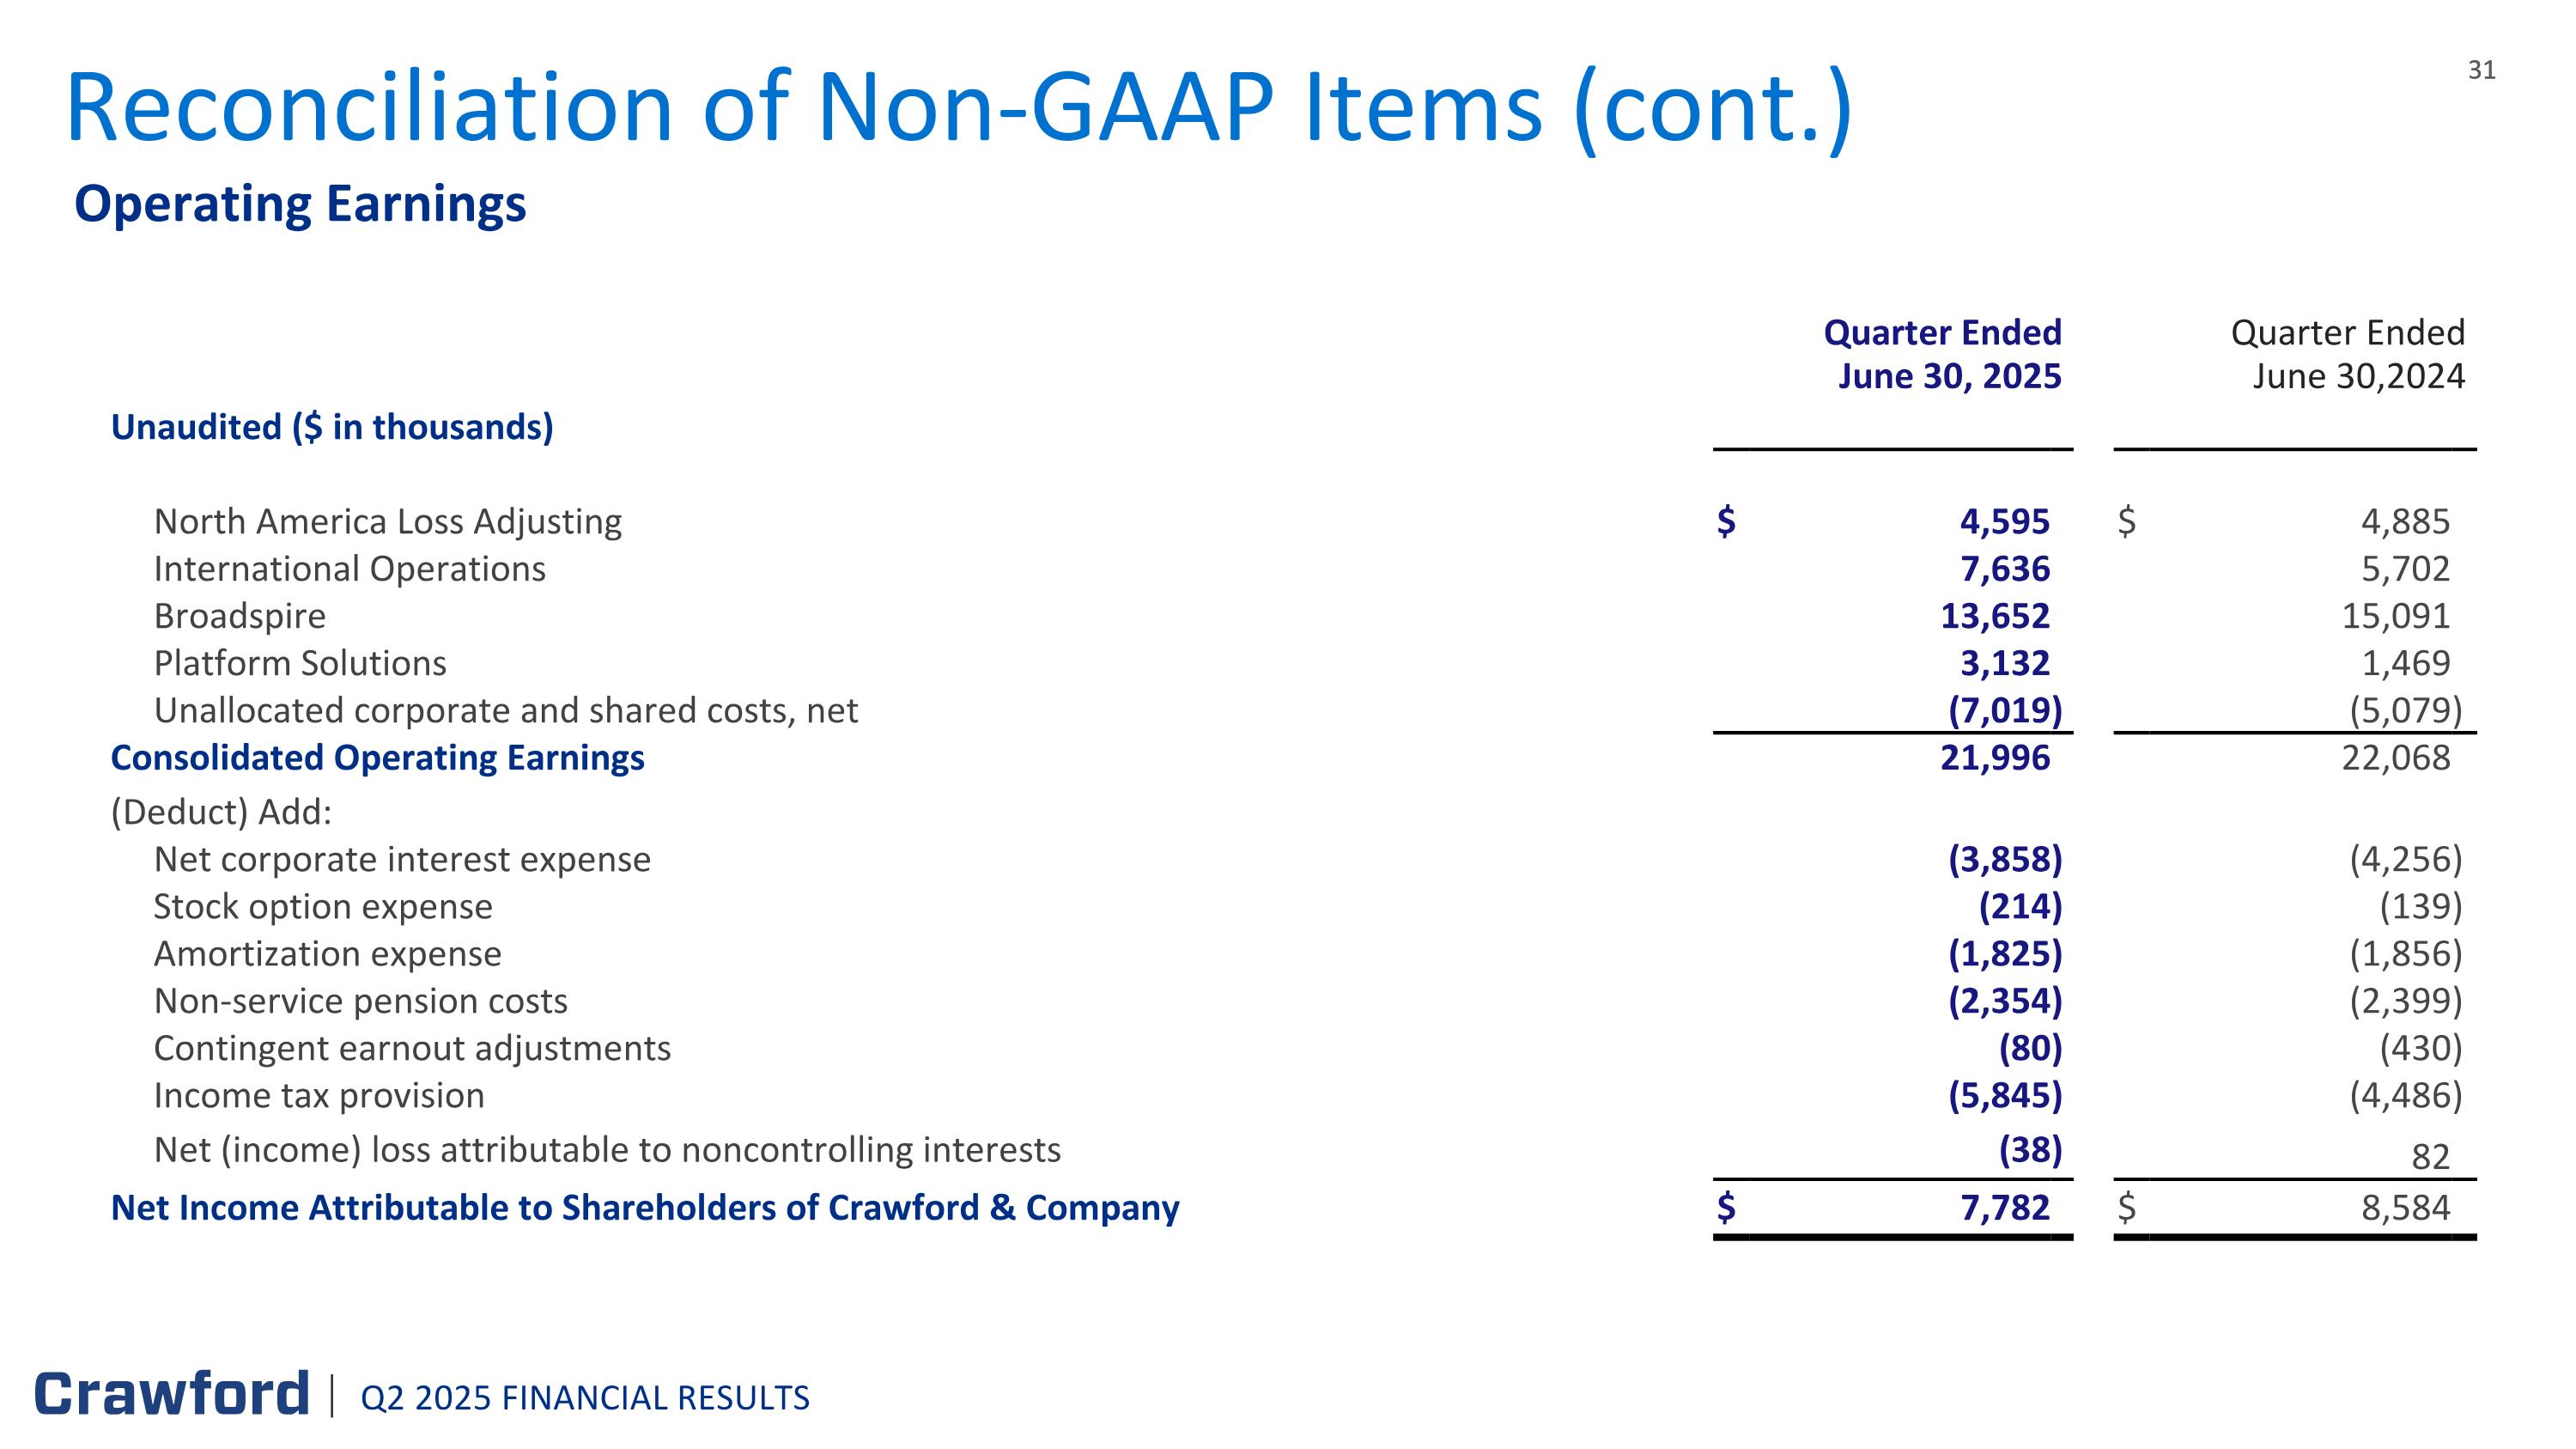
Operating Earnings Reconciliation of Non-GAAP Items (cont.) Quarter Ended Quarter Ended Quarter Ended Quarter Ended June 30, 2025 December 31, June 30,2024 December 31, Unaudited ($ in thousands) 2019 2018 North America Loss Adjusting $ 4,595 $ 4,885 International Operations 7,636 5,702 Broadspire 13,652 15,091 Platform Solutions 3,132 1,469 Unallocated corporate and shared costs, net (7,019 ) (5,079 ) Consolidated Operating Earnings 21,996 22,068 (Deduct) Add: Net corporate interest expense (3,858 ) (4,256 ) Stock option expense (214 ) (139 ) Amortization expense (1,825 ) (1,856 ) Non-service pension costs (2,354 ) (2,399 ) Contingent earnout adjustments (80 ) (430 ) Income tax provision (5,845 ) (4,486 ) Net (income) loss attributable to noncontrolling interests (38 ) 82 Net Income Attributable to Shareholders of Crawford & Company $ 7,782 $ 8,584 Q2 2025 FINANCIAL RESULTS
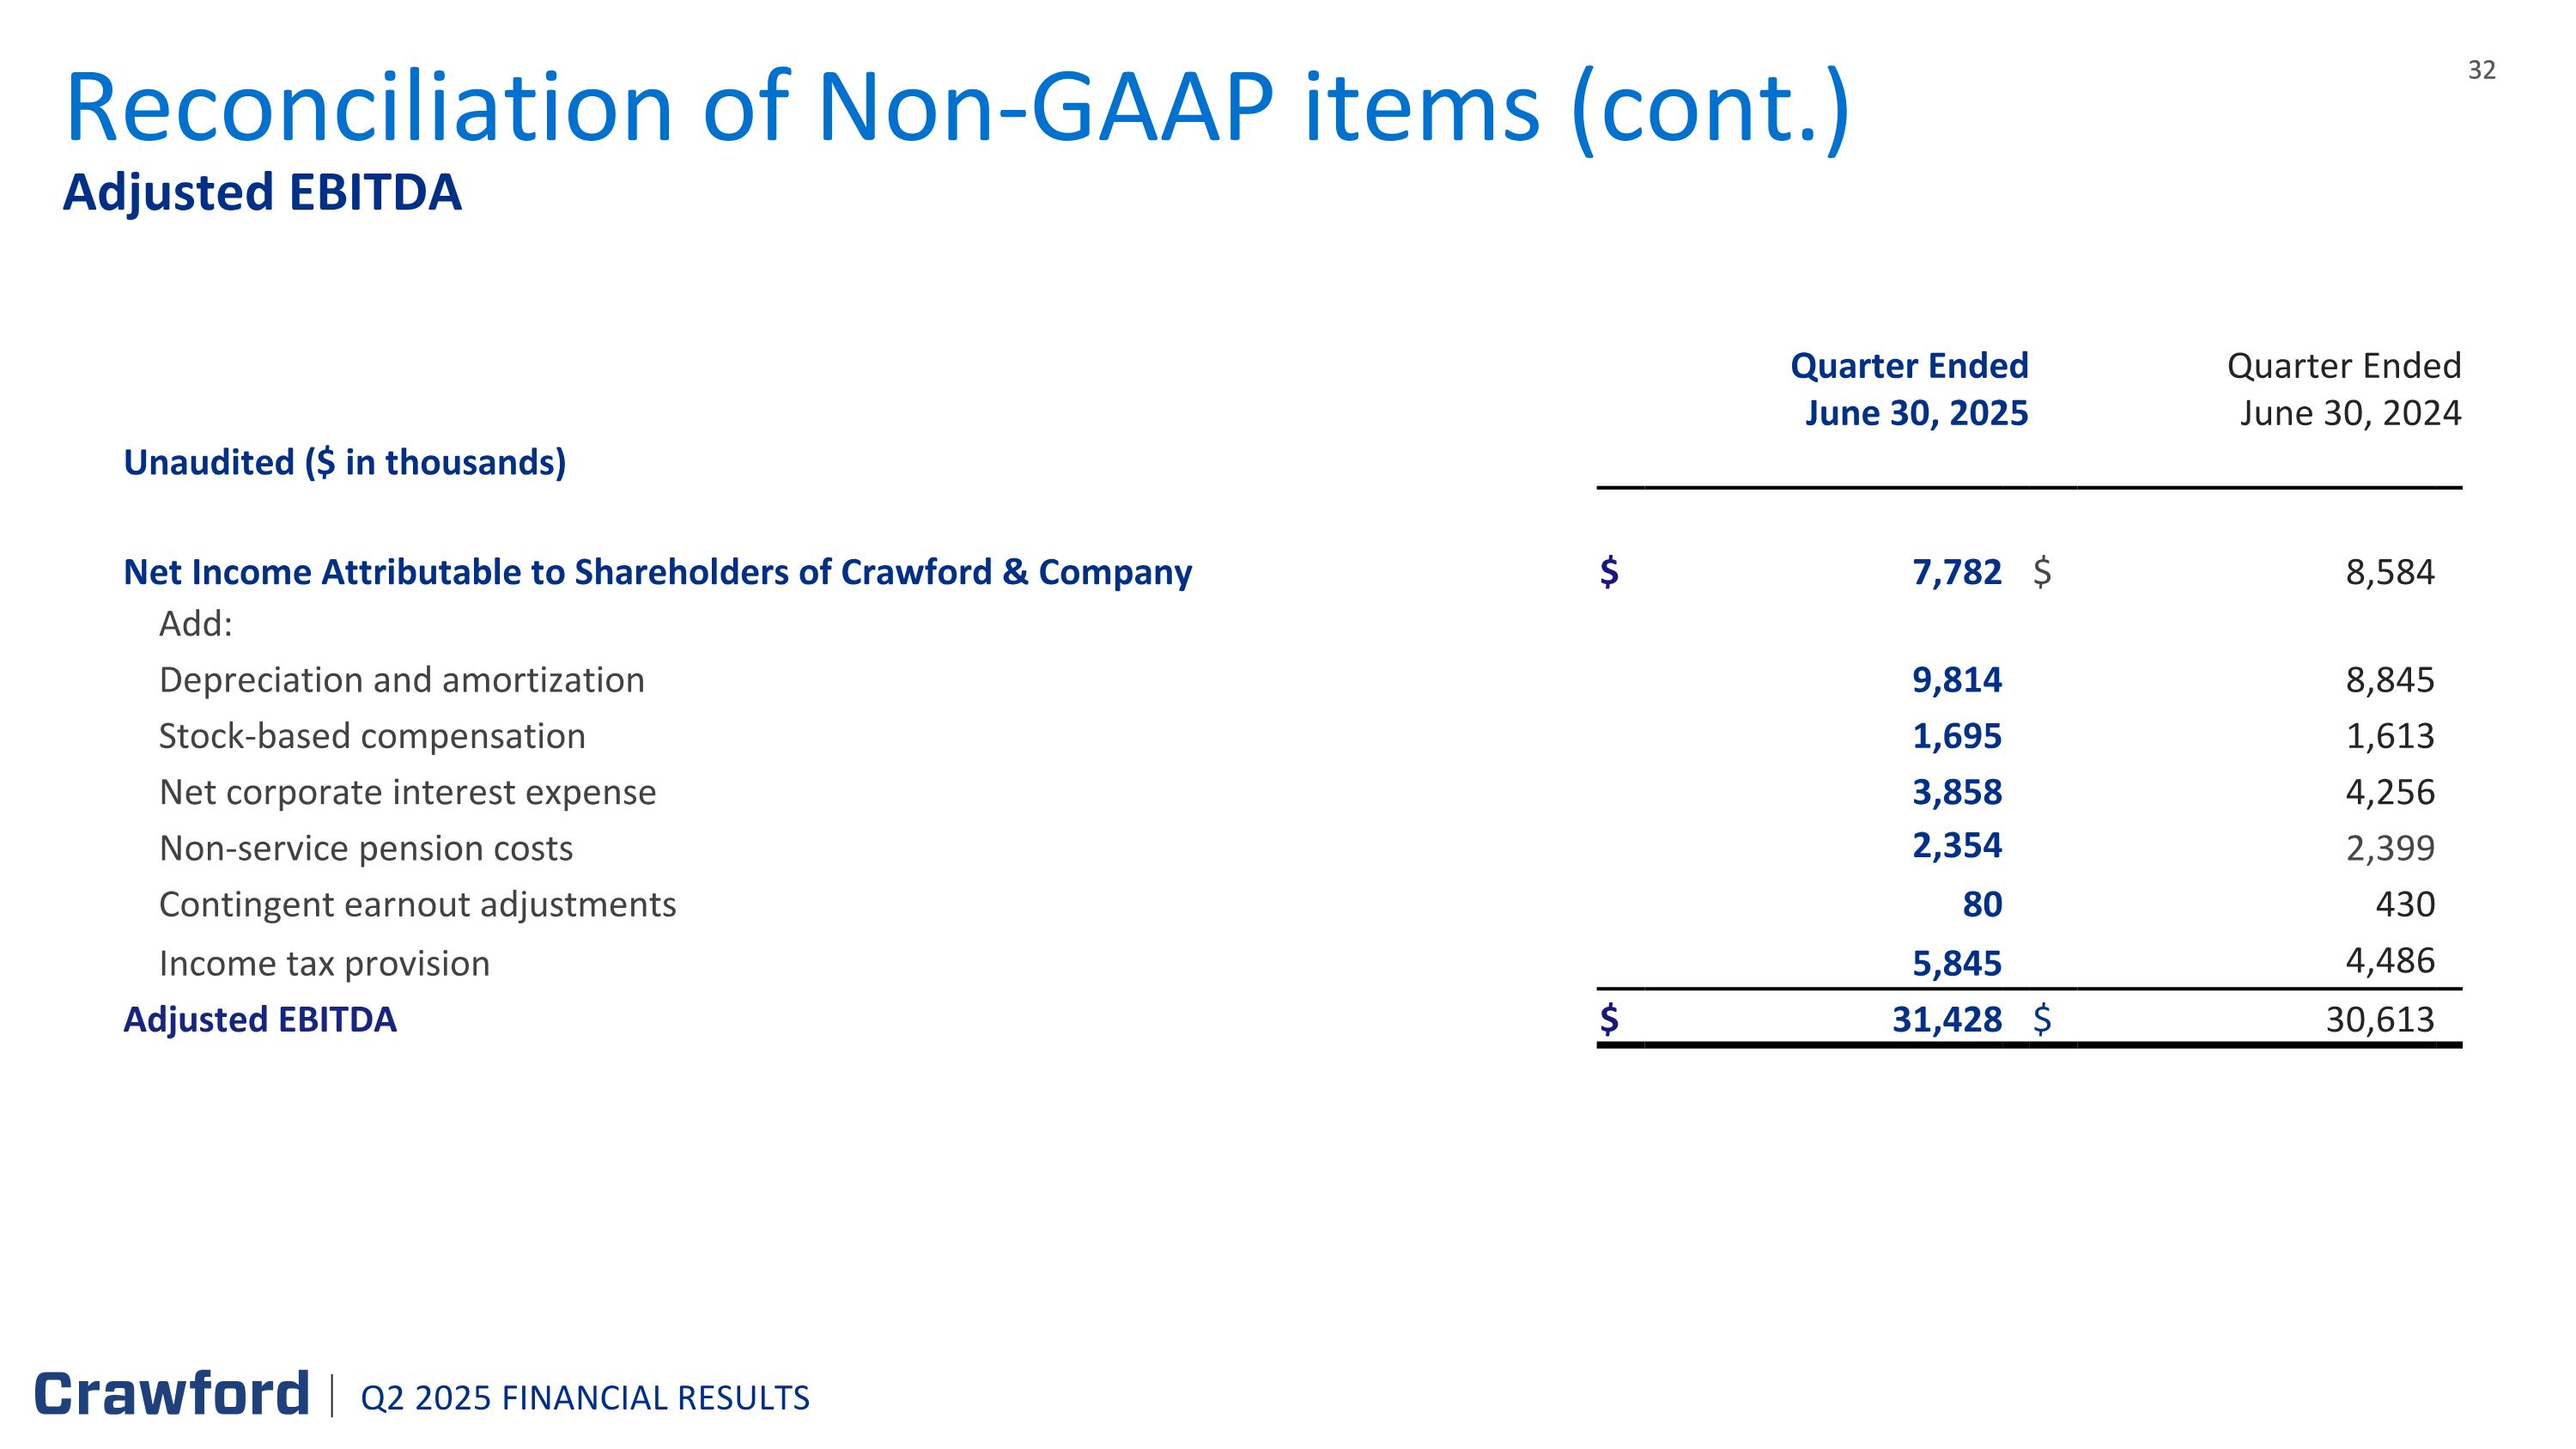
Adjusted EBITDA Reconciliation of Non-GAAP items (cont.) Quarter Ended December 31, Quarter Ended December 31, June 30, 2025 December 31, June 30, 2024 December 31, Unaudited ($ in thousands) 2019 2018 Net Income Attributable to Shareholders of Crawford & Company $ 7,782 $ 8,584 Add: Depreciation and amortization 9,814 8,845 Stock-based compensation 1,695 1,613 Net corporate interest expense 3,858 4,256 Non-service pension costs 2,354 2,399 Contingent earnout adjustments 80 430 Income tax provision 5,845 4,486 Adjusted EBITDA $ 31,428 $ 30,613 Q2 2025 FINANCIAL RESULTS
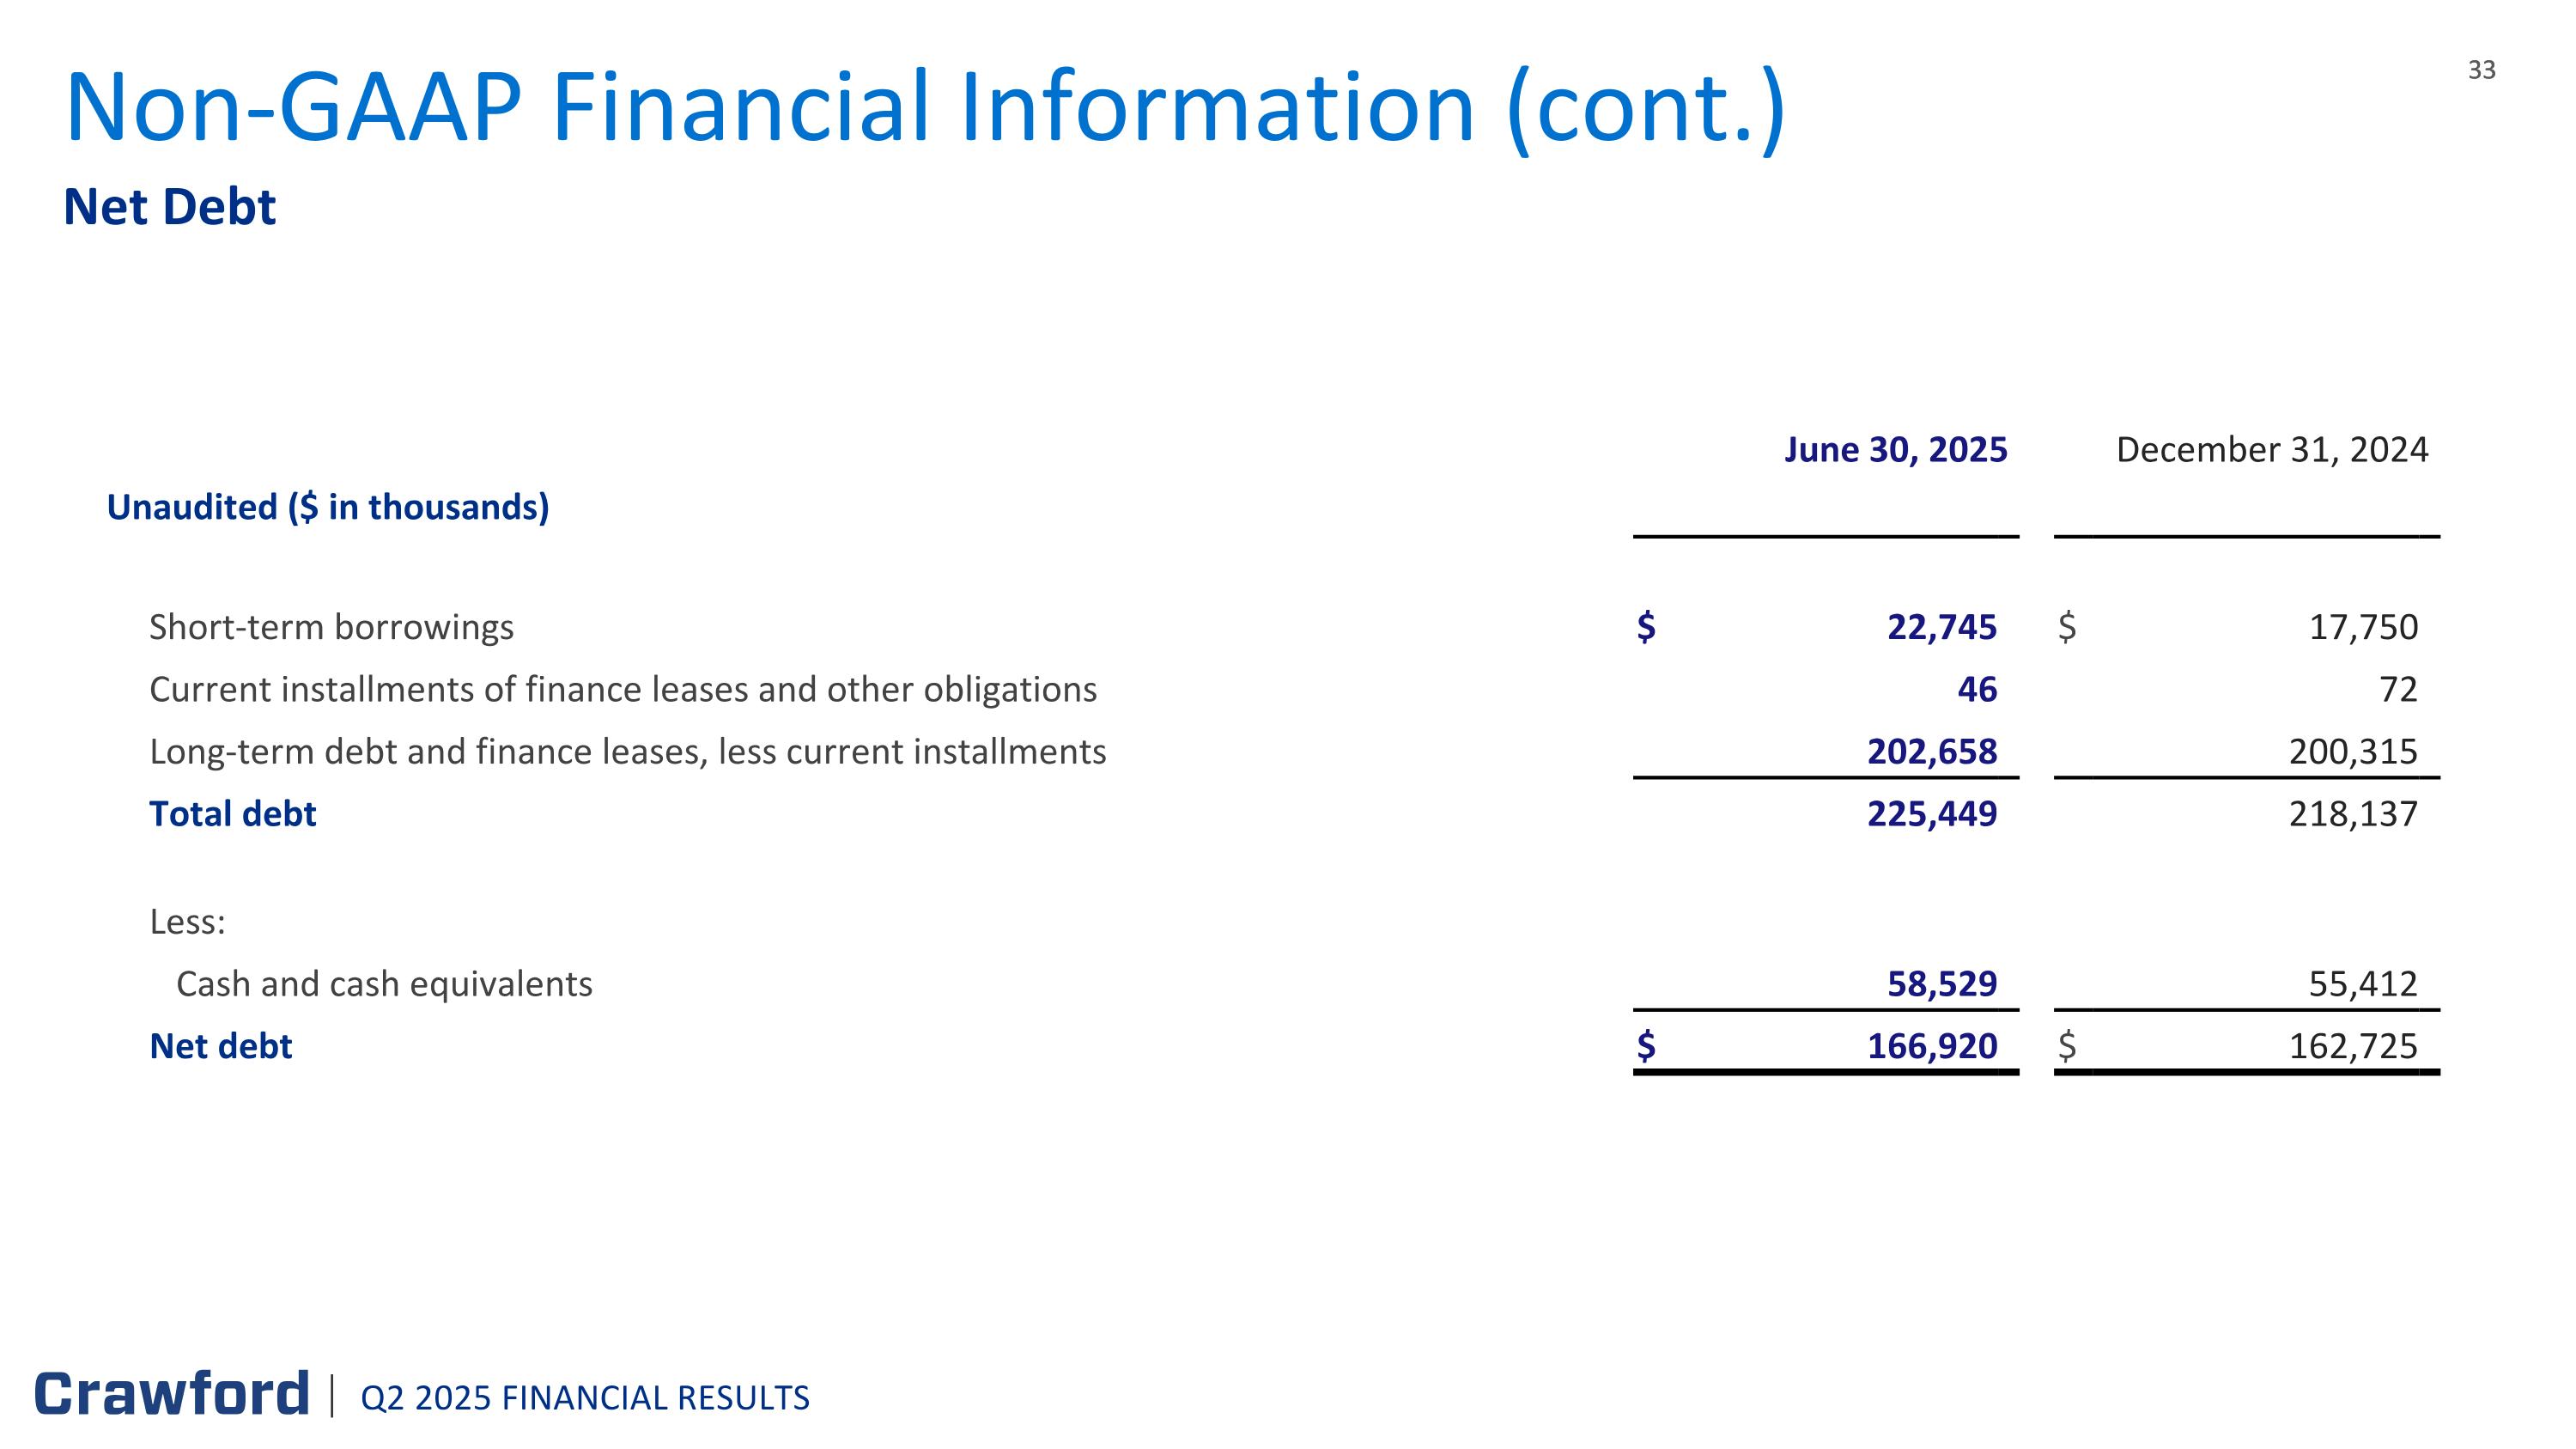
Net Debt Non-GAAP Financial Information (cont.) June 30, 2025 December 31, December 31, 2024 December 31, Unaudited ($ in thousands) 2019 2018 Short-term borrowings $ 22,745 $ 17,750 Current installments of finance leases and other obligations 46 72 Long-term debt and finance leases, less current installments 202,658 200,315 Total debt 225,449 218,137 Less: Cash and cash equivalents 58,529 55,412 Net debt $ 166,920 $ 162,725 Q2 2025 FINANCIAL RESULTS
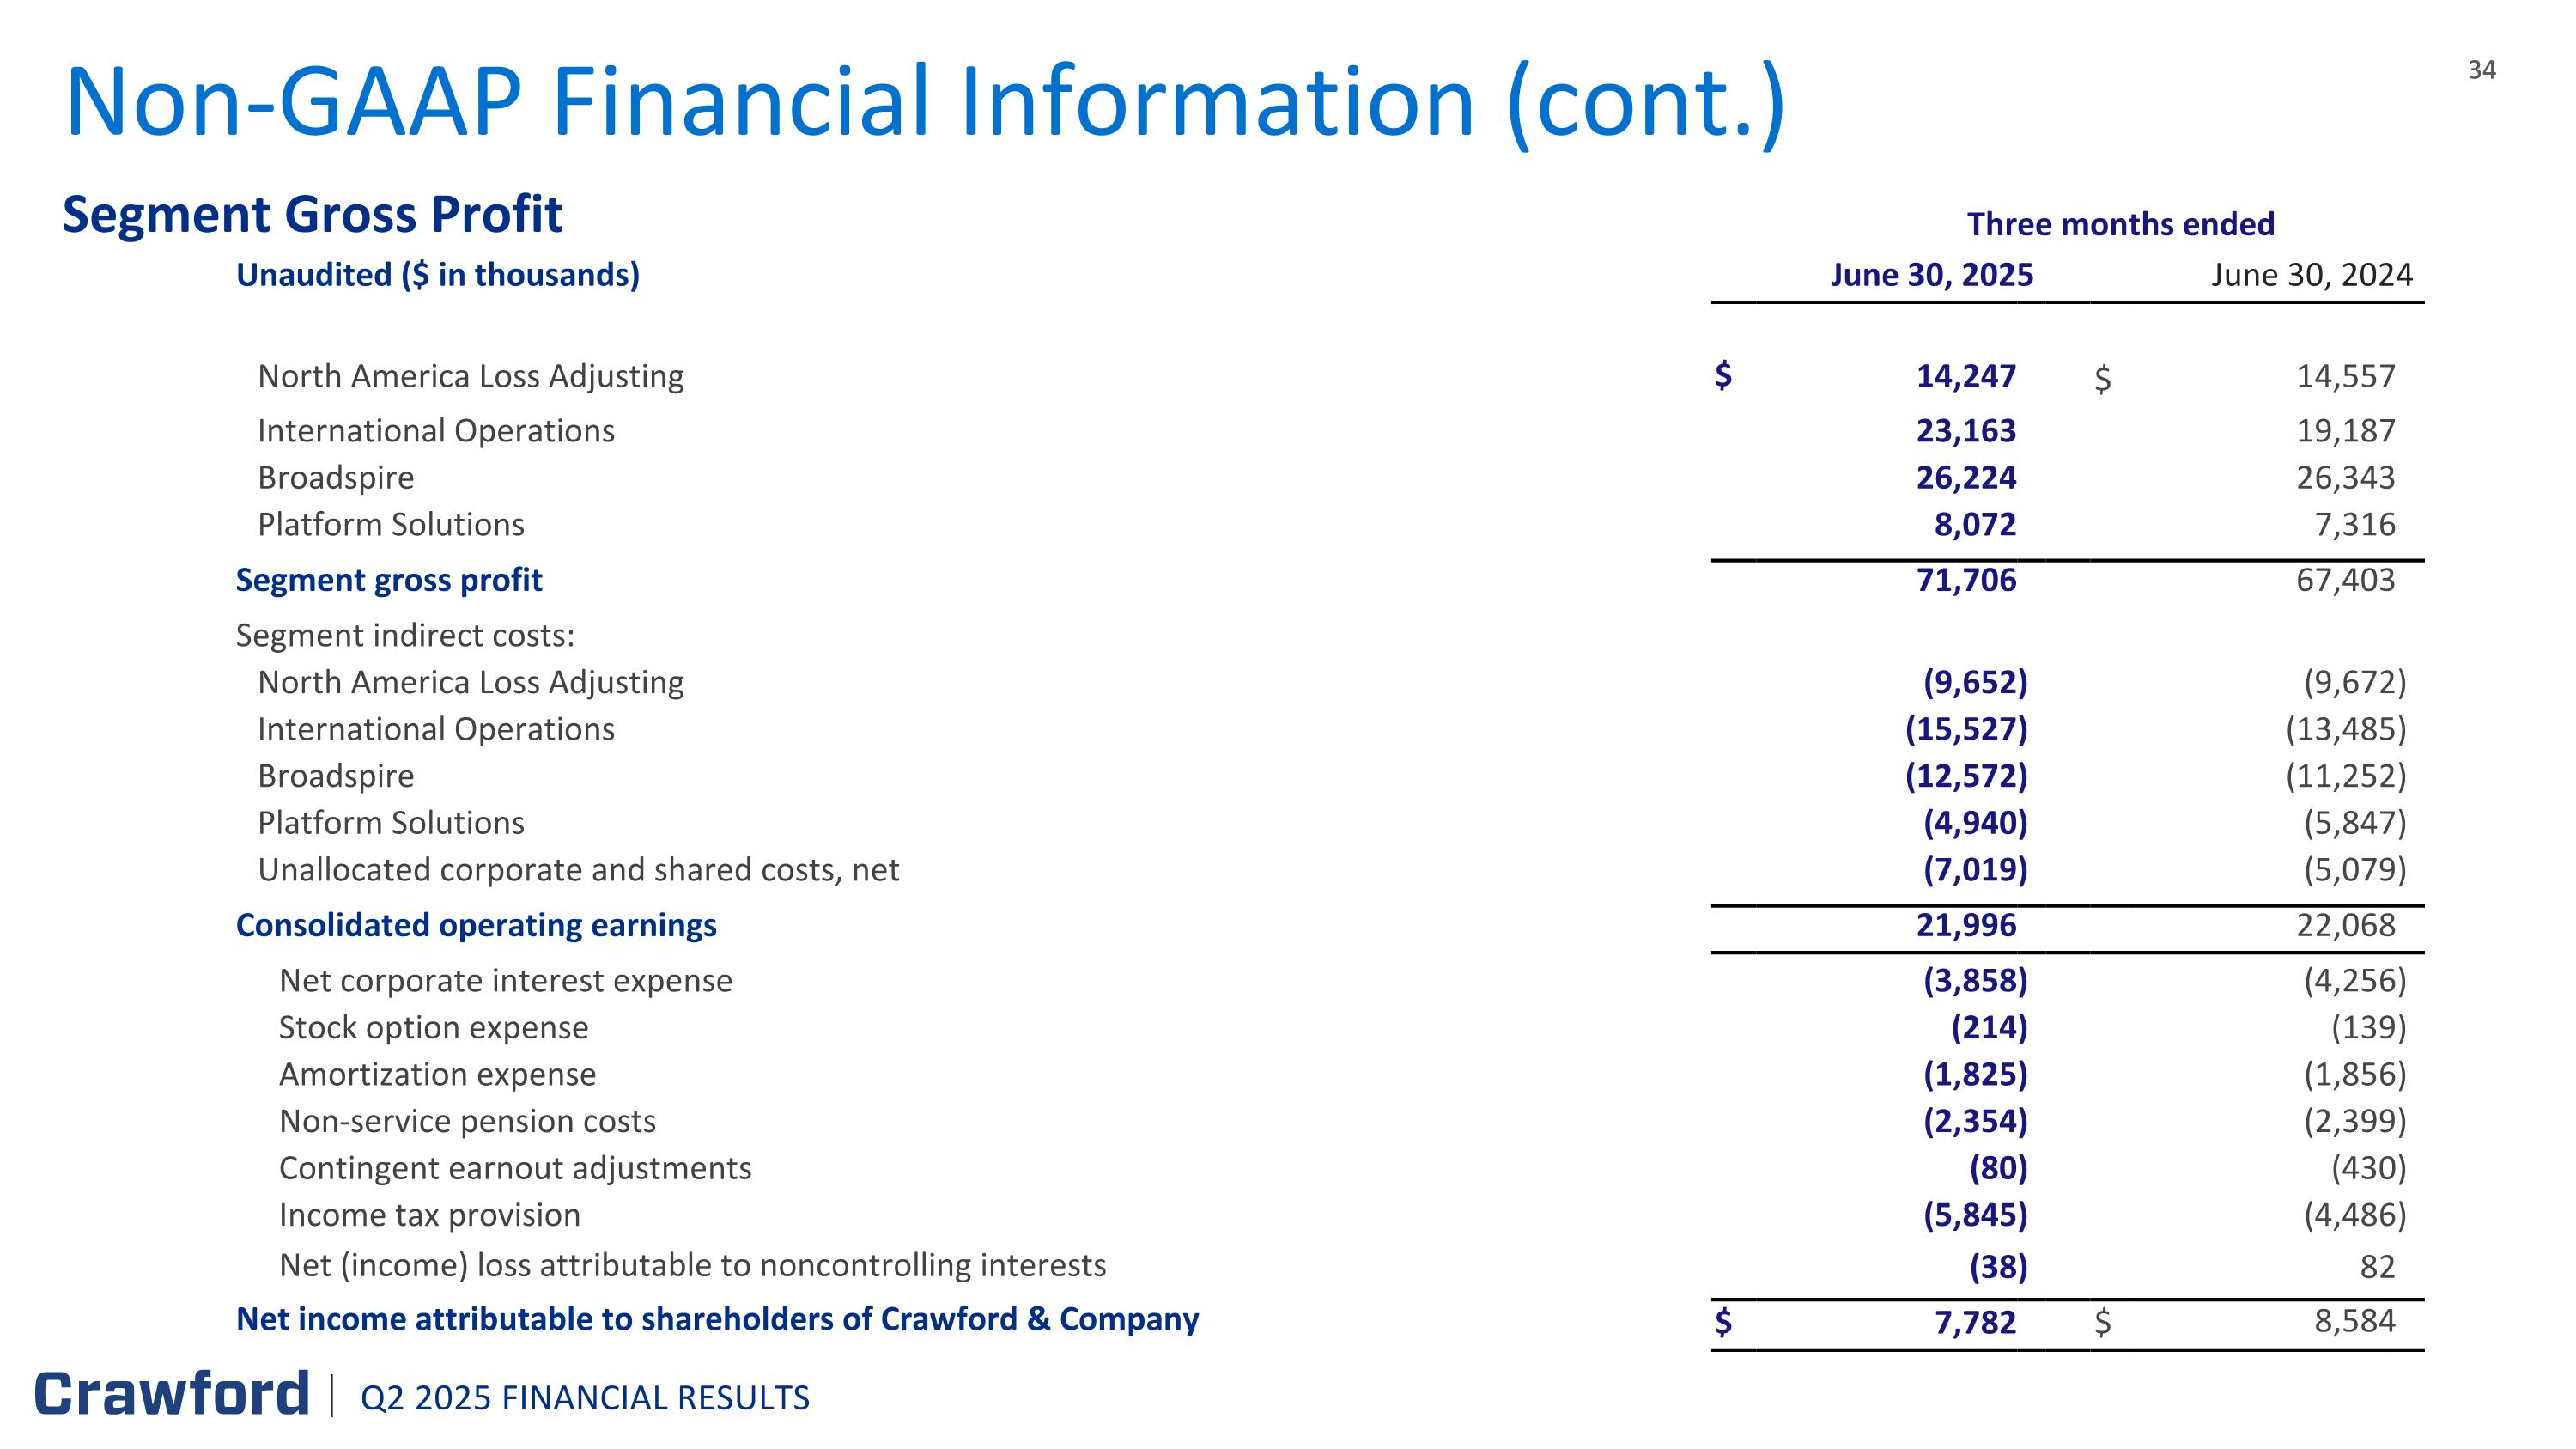
Segment Gross Profit Non-GAAP Financial Information (cont.) Three months ended Three months ended Unaudited ($ in thousands) June 30, 2025 December 31, 2019 June 30, 2024 December 31, 2018 North America Loss Adjusting $ 14,247 $ 14,557 International Operations 23,163 19,187 Broadspire 26,224 26,343 Platform Solutions 8,072 7,316 Segment gross profit 71,706 67,403 Segment indirect costs: North America Loss Adjusting (9,652 ) (9,672 ) International Operations (15,527 ) (13,485 ) Broadspire (12,572 ) (11,252 ) Platform Solutions (4,940 ) (5,847 ) Unallocated corporate and shared costs, net (7,019 ) (5,079 ) Consolidated operating earnings 21,996 22,068 Net corporate interest expense (3,858 ) (4,256 ) Stock option expense (214 ) (139 ) Amortization expense (1,825 ) (1,856 ) Non-service pension costs (2,354 ) (2,399 ) Contingent earnout adjustments (80 ) (430 ) Income tax provision (5,845 ) (4,486 ) Net (income) loss attributable to noncontrolling interests (38 ) 82 Net income attributable to shareholders of Crawford & Company $ 7,782 $ 8,584 Q2 2025 FINANCIAL RESULTS
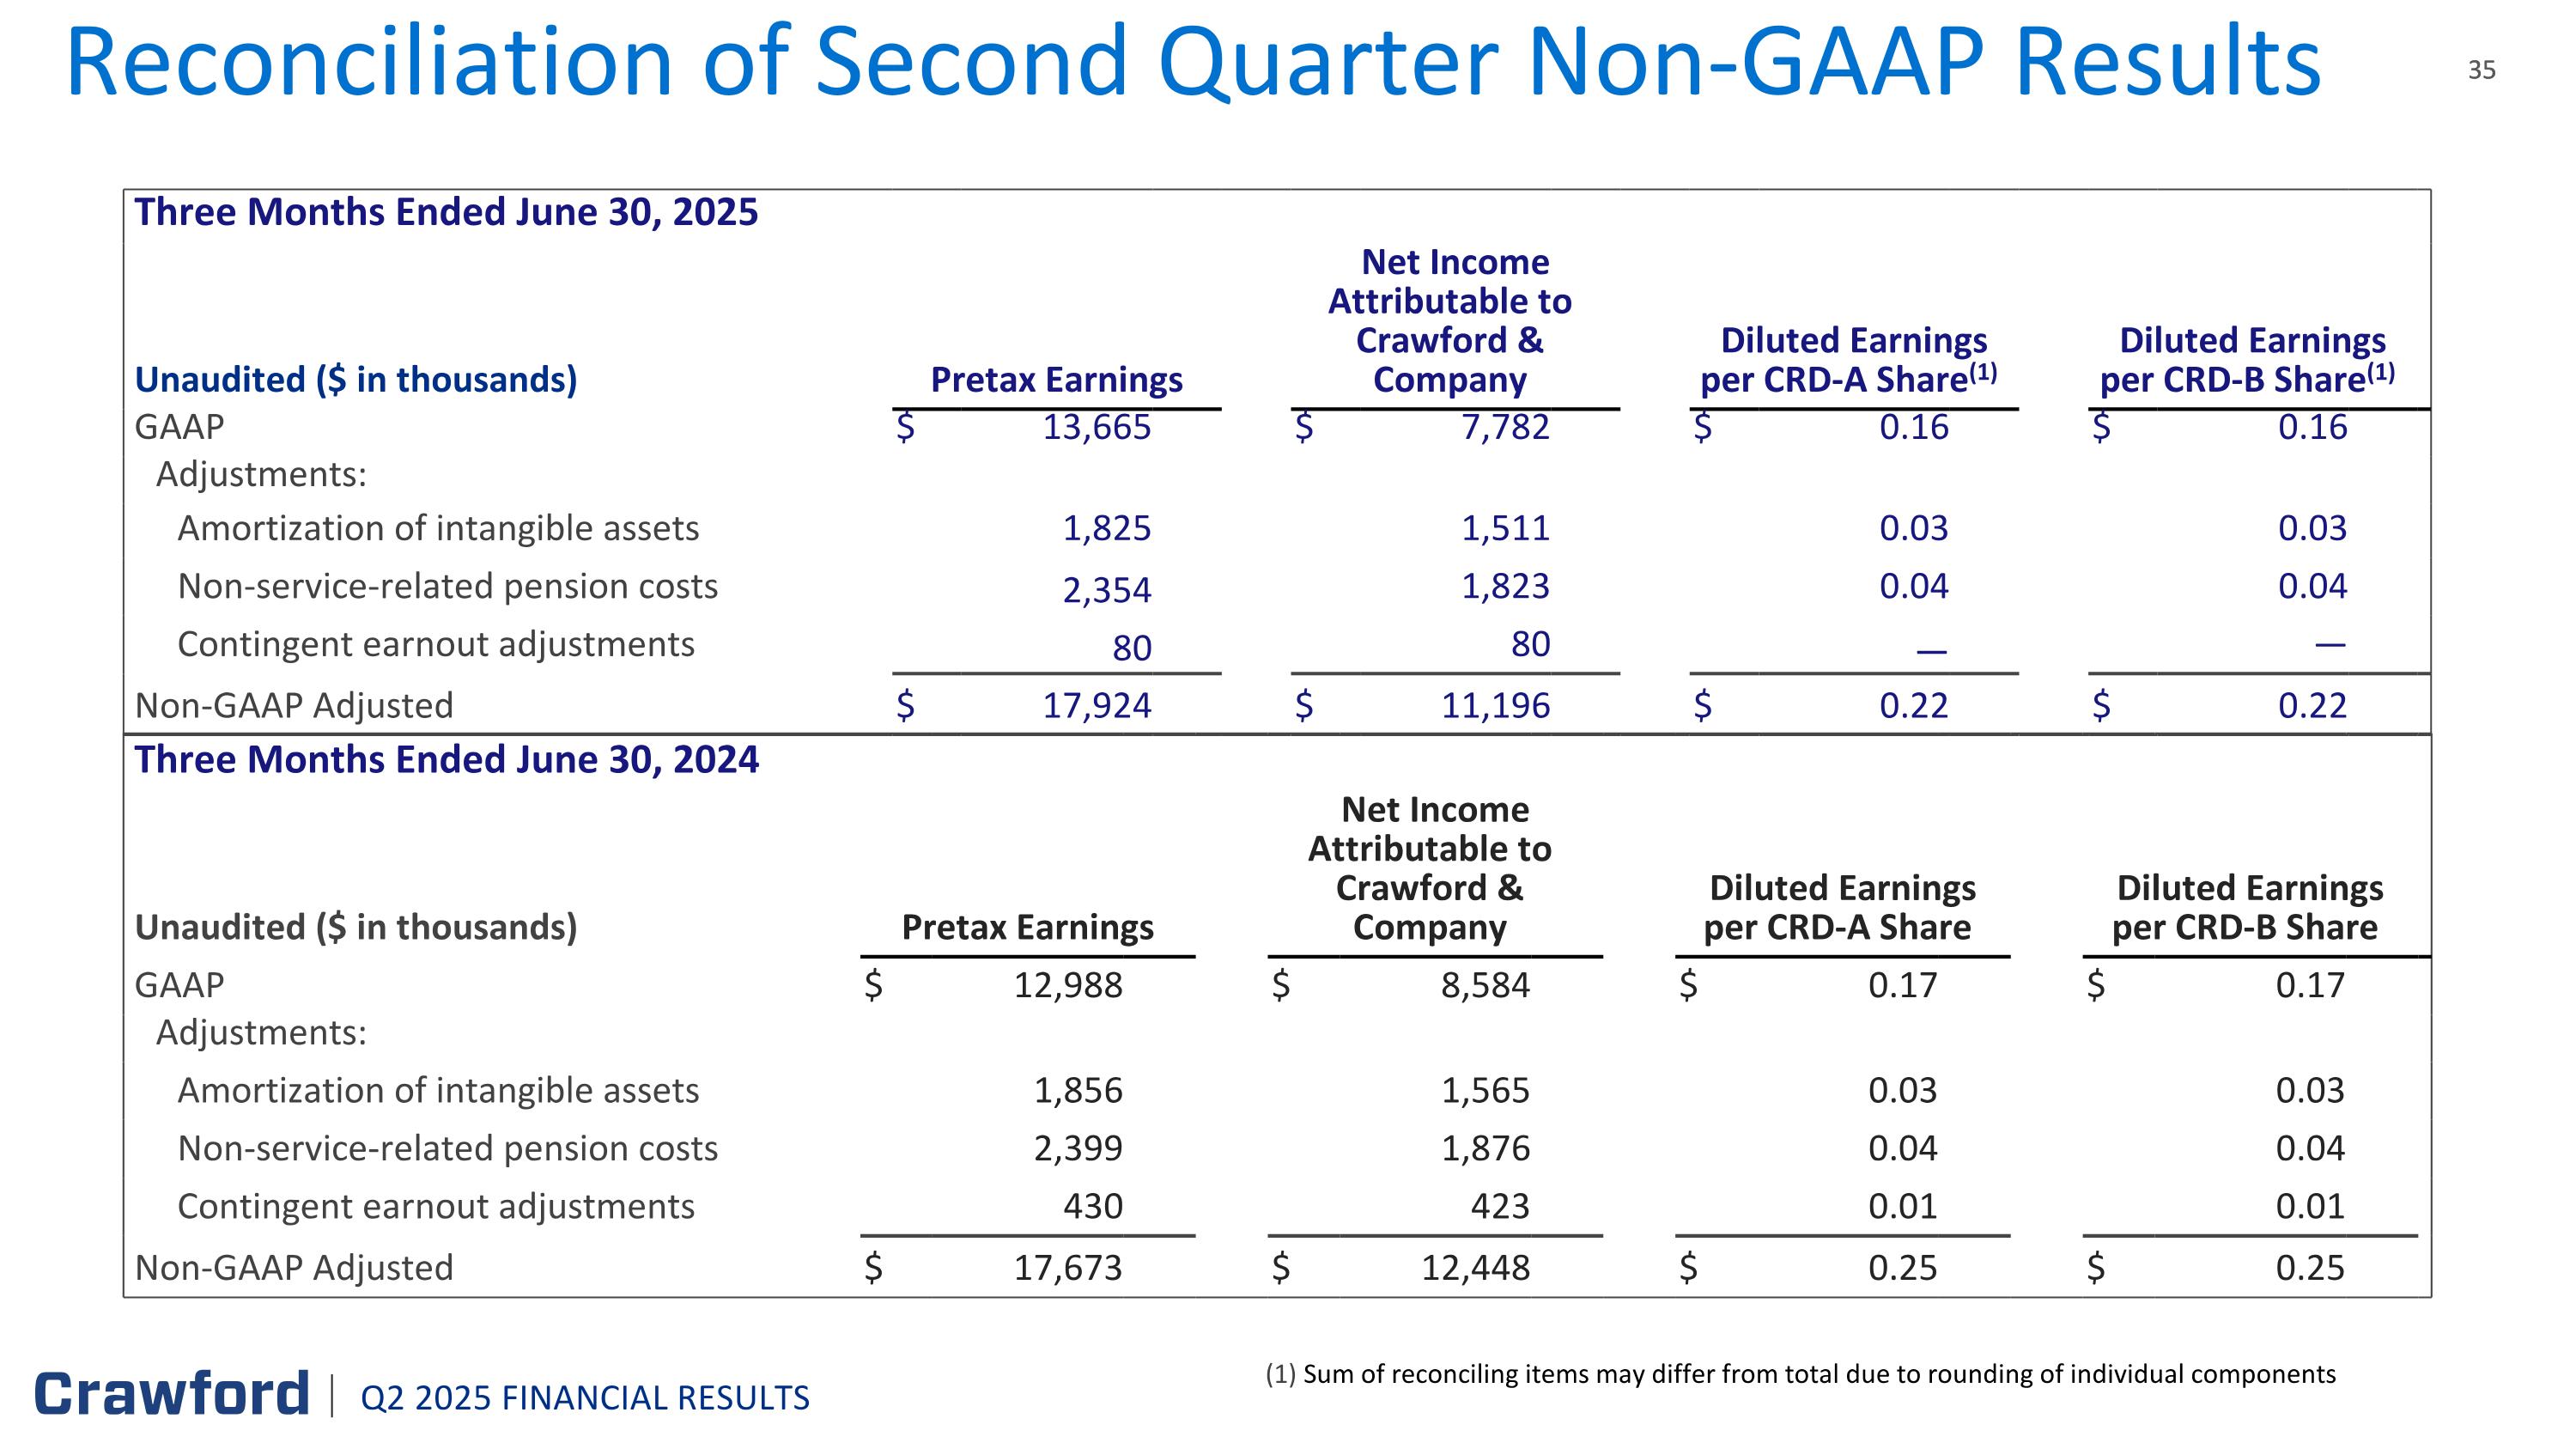
Reconciliation of Second Quarter Non-GAAP Results Three Months Ended June 30, 2025 Unaudited ($ in thousands) Pretax Earnings Pretax (Loss) Earnings Net Income Attributable to Crawford & Company Net (Loss) Income Attributable to Crawford & Company Diluted Earnings per CRD-A Share(1) Diluted (Loss) Earnings per CRD-A Share Diluted Earnings per CRD-B Share(1) Diluted (Loss) Earnings per CRD-B Share GAAP $ 13,665 $ 7,782 $ 0.16 $ 0.16 Adjustments: Amortization of intangible assets 1,825 1,511 0.03 0.03 Non-service-related pension costs 2,354 1,823 0.04 0.04 Contingent earnout adjustments 80 80 — — Non-GAAP Adjusted $ 17,924 $ 11,196 $ 0.22 $ 0.22 Three Months Ended June 30, 2024 Unaudited ($ in thousands) Pretax Earnings Pretax Earnings Net Income Attributable to Crawford & Company Net Income Attributable to Crawford & Company Diluted Earnings per CRD-A Share Diluted Earnings per CRD-A Share Diluted Earnings per CRD-B Share Diluted Earnings per CRD-B Share GAAP $ 12,988 $ 8,584 $ 0.17 $ 0.17 Adjustments: Amortization of intangible assets 1,856 1,565 0.03 0.03 Non-service-related pension costs 2,399 1,876 0.04 0.04 Contingent earnout adjustments 430 423 0.01 0.01 Non-GAAP Adjusted $ 17,673 $ 12,448 $ 0.25 $ 0.25 Q2 2025 FINANCIAL RESULTS (1) Sum of reconciling items may differ from total due to rounding of individual components