| 1 NYSE: SBSI Fixed Income Investor Presentation August 2025 |
| Disclaimers 2 Safe Harbor Disclosure and Forward-Looking Statements Certain statements in this presentation other than historical data and information may constitute “forward-looking statements” within the meaning of and subject to the safe harbor protections of the Private Securities Litigation Reform Act of 1995. These forward-looking statements are not guarantees of future performance, nor should they be relied upon as representing management’s views as of any subsequent date. These statements may include words such as “expect,” “estimate,” “project,” “anticipate,” “appear,” “believe,” “could,” “should,” “may,” “might,” “will,” “would,” “seek,” “intend,” “probability,” “risk,” “goal,” “target,” “objective,” “plans,” “potential,” and similar expressions that predict or indicate future events or trends that are not statements of historical matters. Forward-looking statements are statements with respect to the beliefs, plans, expectations, objectives, goals, anticipations, assumptions, estimates, intentions and future performance of Southside Bancshares, Inc. (the “Company” or “Southside”) and are subject to significant known and unknown risks and uncertainties, which could cause the Company's actual results to differ materially from the results discussed in the forward-looking statements. For example, trends in asset quality, capital, liquidity, the Company's ability to sell nonperforming assets, expense reductions, planned operational efficiencies and earnings from growth and certain market risk disclosures, including the impact of interest rates and our expectations regarding rate changes, tax reform, inflation, tariffs, the impacts related to or resulting from other economic factors are based upon information presently available to management and are dependent on choices about key model characteristics and assumptions and are subject to various limitations. By their nature, certain of the market risk disclosures are only estimates and could be materially different from what actually occurs in the future. Accordingly, the Company cautions readers not to place undue reliance on any such forward-looking statements, as the risks and factors listed herein could cause the Company’s actual results for future periods to differ materially from any opinions or statements expressed with respect to future periods in any current statements. The most significant factors that could cause future results to differ materially from those anticipated by our forward-looking statements include the ongoing impact of higher inflation levels, interest rate fluctuations including the impact of changes in interest rates on our financial projections, models and guidance, and general economic and recessionary concerns, as well as the effects of declines in the real estate market, tariffs or trade wars (including reduced consumer spending, lower economic growth or recession, reduced demand for U.S. exports, disruptions to supply chains, and decreased demand for other banking products and services), high unemployment and increasing insurance costs, as well as the financial stress to borrowers as a result of the foregoing, all of which could impact economic growth and could cause a reduction in financial transactions and business activities including decreased deposits and reduced loan originations, and our ability to manage liquidity in a rapidly changing and unpredictable market. Additional factors which may cause actual results to differ materially from those contained in such forward-looking statements include those contained in the Company’s Annual Report on Form 10-K for the year ended December 31, 2024, under “Part I - Item 1. Forward Looking Information” and “Part I - Item 1A. Risk Factors” and in the Company’s other filings with the U.S. Securities and Exchange Commission. Forward-looking statements speak only as of the date they are made. The Company disclaims any obligation to update any factors or to announce publicly the result of revisions to any of the forward-looking statements included herein to reflect future events or developments, except as required by law. |
| Disclaimers (continued) 3 Industry and Market Data This presentation includes estimates regarding market and industry data. Unless otherwise indicated, information concerning our industry and the markets in which we operate, including our general expectations, market position, market opportunity, and market size, are based on our management’s knowledge and experience in the markets in which we operate, together with currently available information obtained from various sources, including publicly available information, industry reports and publications, surveys, our clients, trade and business organizations and other contacts in the markets in which we operate. While we believe the estimated market and industry data included in this presentation are generally reliable, such information, which is derived in part from management’s estimates and beliefs, is inherently uncertain and imprecise. Trademarks and Trade Names The Company owns or has rights to various trademarks, service marks and trade names that it uses in connection with the operation of its business. Solely for convenience, the trademarks, service marks and trade names referred to in this presentation may appear without the ®, TM or SM symbols, but such references are not intended to indicate, in any way, that the Company will not assert, to the fullest extent under applicable law, its rights to these trademarks, service marks and trade names under applicable law. Other service marks, trademarks and trade names referred to in this presentation, if any, are the property of their respective owners. |
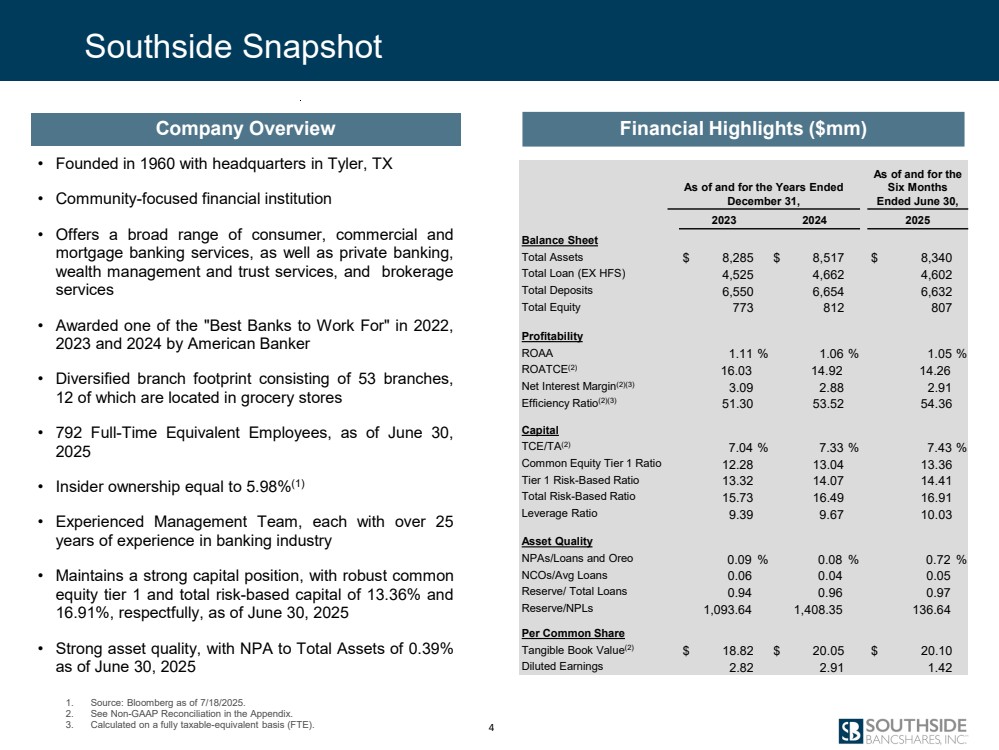
| Southside Snapshot • Founded in 1960 with headquarters in Tyler, TX • Community-focused financial institution • Offers a broad range of consumer, commercial and mortgage banking services, as well as private banking, wealth management and trust services, and brokerage services • Awarded one of the "Best Banks to Work For" in 2022, 2023 and 2024 by American Banker • Diversified branch footprint consisting of 53 branches, 12 of which are located in grocery stores • 792 Full-Time Equivalent Employees, as of June 30, 2025 • Insider ownership equal to 5.98%(1) • Experienced Management Team, each with over 25 years of experience in banking industry • Maintains a strong capital position, with robust common equity tier 1 and total risk-based capital of 13.36% and 16.91%, respectfully, as of June 30, 2025 • Strong asset quality, with NPA to Total Assets of 0.39% as of June 30, 2025 Company Overview Financial Highlights ($mm) As of and for the Years Ended December 31, As of and for the Six Months Ended June 30, 2023 2024 2025 Balance Sheet Total Assets $ 8,285 $ 8,517 $ 8,340 Total Loan (EX HFS) 4,525 4,662 4,602 Total Deposits 6,550 6,654 6,632 Total Equity 773 812 807 Profitability ROAA 1.11 % 1.06 % 1.05 % ROATCE(2) 16.03 14.92 14.26 Net Interest Margin(2)(3) 3.09 2.88 2.91 Efficiency Ratio(2)(3) 51.30 53.52 54.36 Capital TCE/TA(2) 7.04 % 7.33 % 7.43 % Common Equity Tier 1 Ratio 12.28 13.04 13.36 Tier 1 Risk-Based Ratio 13.32 14.07 14.41 Total Risk-Based Ratio 15.73 16.49 16.91 Leverage Ratio 9.39 9.67 10.03 Asset Quality NPAs/Loans and Oreo 0.09 % 0.08 % 0.72 % NCOs/Avg Loans 0.06 0.04 0.05 Reserve/ Total Loans 0.94 0.96 0.97 Reserve/NPLs 1,093.64 1,408.35 136.64 Per Common Share Tangible Book Value(2) $ 18.82 $ 20.05 $ 20.10 Diluted Earnings 2.82 2.91 1.42 4 1. Source: Bloomberg as of 7/18/2025. 2. See Non-GAAP Reconciliation in the Appendix. 3. Calculated on a fully taxable-equivalent basis (FTE). |
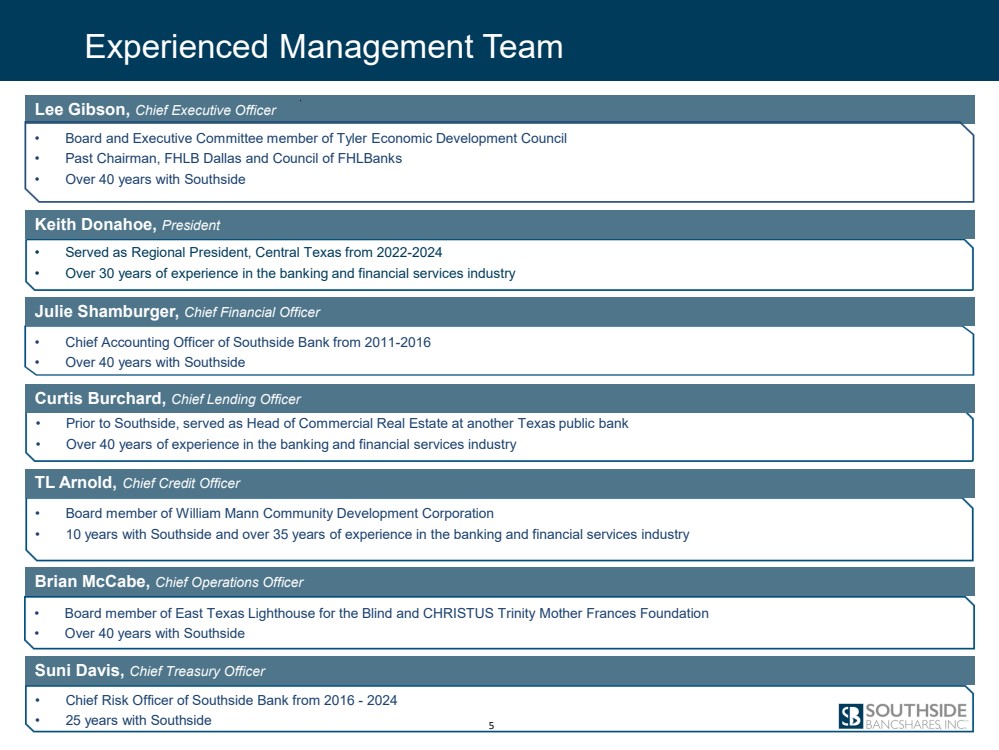
| • Chief Accounting Officer of Southside Bank from 2011-2016 • Over 40 years with Southside Lee Gibson, Chief Executive Officer • Board member of William Mann Community Development Corporation • 10 years with Southside and over 35 years of experience in the banking and financial services industry • Board member of East Texas Lighthouse for the Blind and CHRISTUS Trinity Mother Frances Foundation • Over 40 years with Southside • Prior to Southside, served as Head of Commercial Real Estate at another Texas public bank • Over 40 years of experience in the banking and financial services industry Julie Shamburger, Chief Financial Officer TL Arnold, Chief Credit Officer Curtis Burchard, Chief Lending Officer Brian McCabe, Chief Operations Officer Suni Davis, Chief Treasury Officer • Chief Risk Officer of Southside Bank from 2016 - 2024 • 25 years with Southside Experienced Management Team • Board and Executive Committee member of Tyler Economic Development Council • Past Chairman, FHLB Dallas and Council of FHLBanks • Over 40 years with Southside Keith Donahoe, President • Served as Regional President, Central Texas from 2022-2024 • Over 30 years of experience in the banking and financial services industry 5 |
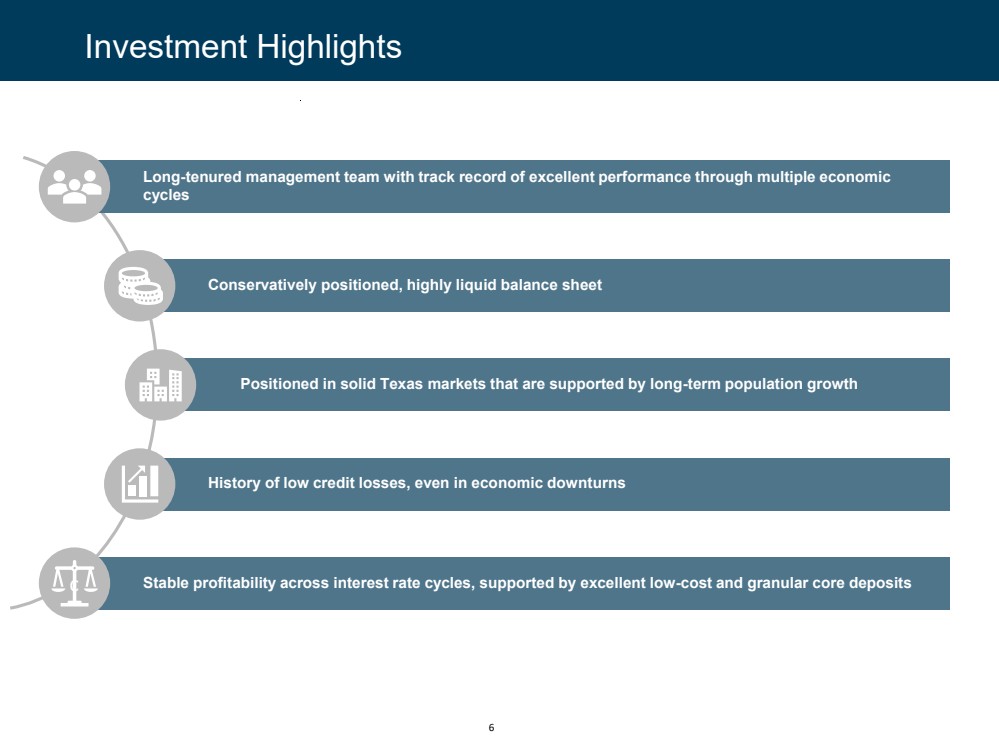
| Conservatively positioned, highly liquid balance sheet History of low credit losses, even in economic downturns Investment Highlights Positioned in solid Texas markets that are supported by long-term population growth 6 c Stable profitability across interest rate cycles, supported by excellent low-cost and granular core deposits Long-tenured management team with track record of excellent performance through multiple economic cycles |
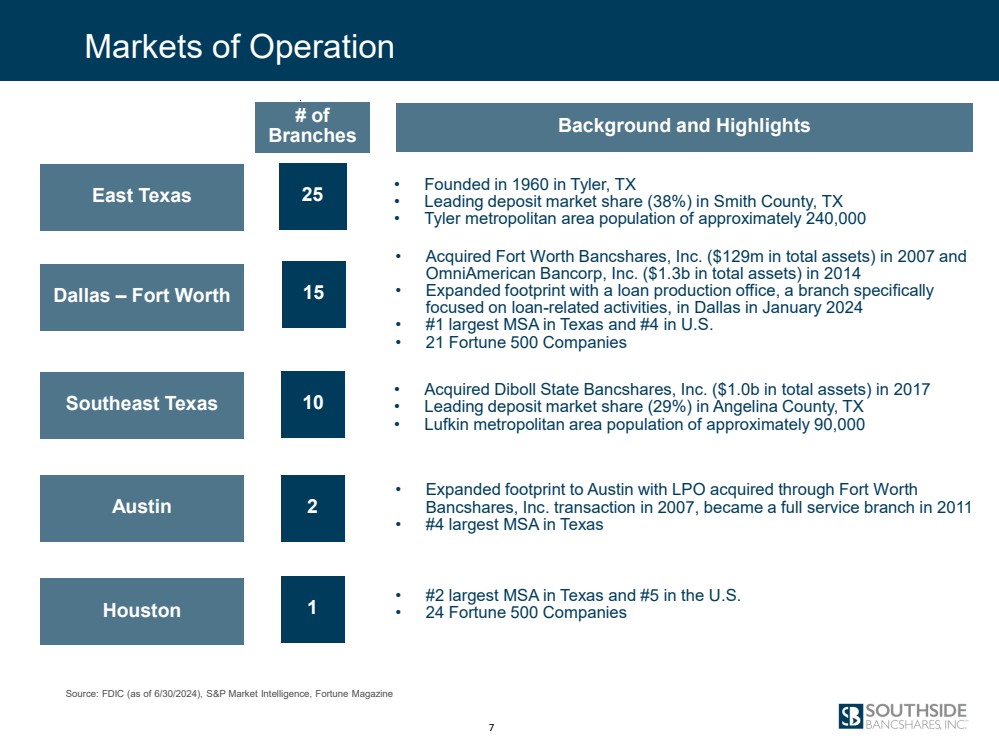
| Source: FDIC (as of 6/30/2024), S&P Market Intelligence, Fortune Magazine Markets of Operation Background and Highlights East Texas 25 • Founded in 1960 in Tyler, TX • Leading deposit market share (38%) in Smith County, TX • Tyler metropolitan area population of approximately 240,000 Dallas – Fort Worth 15 • Acquired Fort Worth Bancshares, Inc. ($129m in total assets) in 2007 and OmniAmerican Bancorp, Inc. ($1.3b in total assets) in 2014 • Expanded footprint with a loan production office, a branch specifically focused on loan-related activities, in Dallas in January 2024 • #1 largest MSA in Texas and #4 in U.S. • 21 Fortune 500 Companies Southeast Texas 10 Austin Houston 2 1 • Acquired Diboll State Bancshares, Inc. ($1.0b in total assets) in 2017 • Leading deposit market share (29%) in Angelina County, TX • Lufkin metropolitan area population of approximately 90,000 • Expanded footprint to Austin with LPO acquired through Fort Worth Bancshares, Inc. transaction in 2007, became a full service branch in 2011 • #4 largest MSA in Texas # of Branches • #2 largest MSA in Texas and #5 in the U.S. • 24 Fortune 500 Companies 7 |
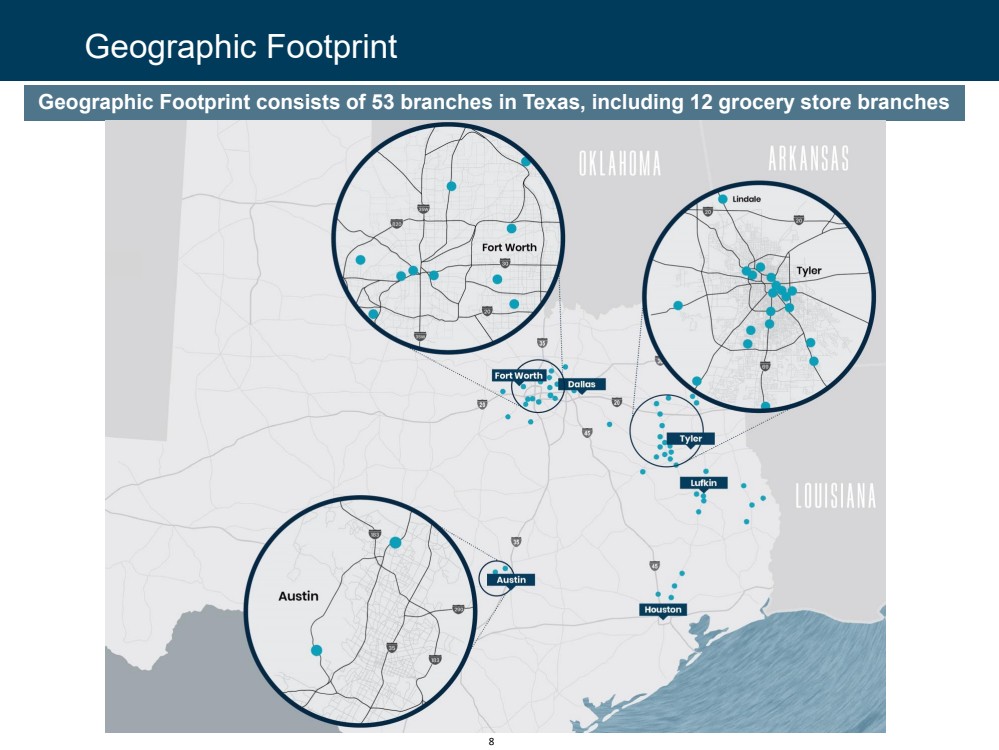
| Geographic Footprint Geographic Footprint consists of 53 branches in Texas, including 12 grocery store branches 8 |
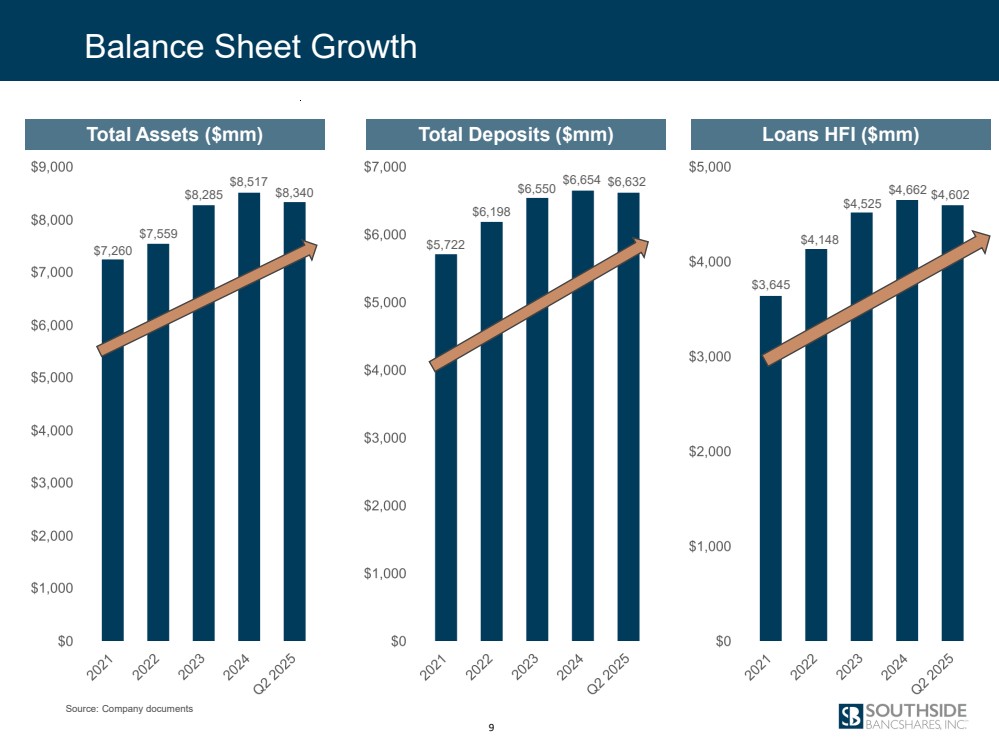
| Total Assets ($mm) Total Deposits ($mm) Loans HFI ($mm) Balance Sheet Growth 9 $6,550 $6,198 $5,722 $6,654 $6,632 $3,645 $7,260 $7,559 $8,285 $8,517 $8,340 $4,602 $4,662 $4,525 $4,148 Source: Company documents |
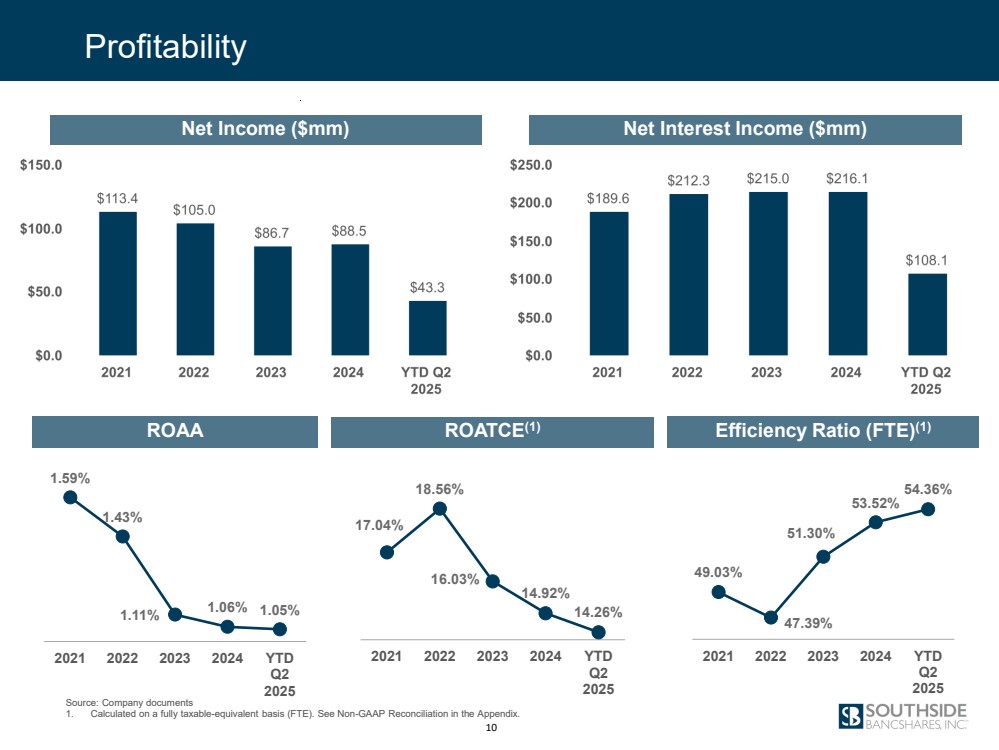
| Profitability Net Income ($mm) Net Interest Income ($mm) ROAA ROATCE(1) Efficiency Ratio (FTE)(1) 1.59% 1.43% 1.11% 1.06% 1.05% 2021 2022 2023 2024 YTD Q2 2025 17.04% 18.56% 16.03% 14.92% 14.26% 2021 2022 2023 2024 YTD Q2 2025 49.03% 47.39% 51.30% 53.52% 54.36% 2021 2022 2023 2024 YTD Q2 2025 10 Source: Company documents 1. Calculated on a fully taxable-equivalent basis (FTE). See Non-GAAP Reconciliation in the Appendix. |
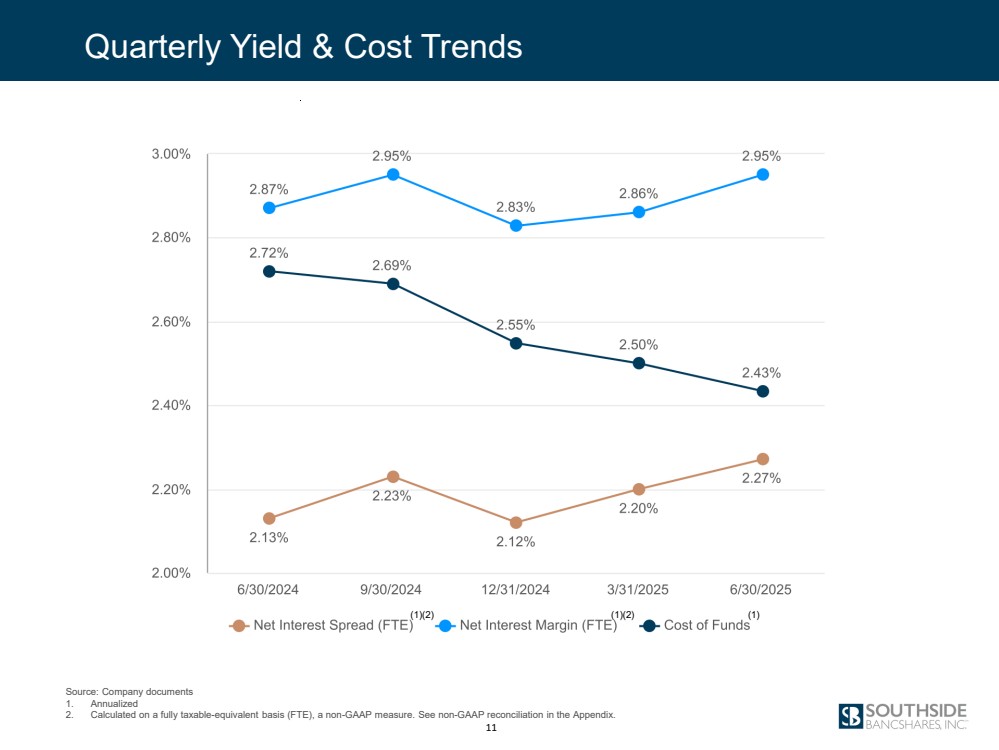
| Source: Company documents 1. Annualized 2. Calculated on a fully taxable-equivalent basis (FTE), a non-GAAP measure. See non-GAAP reconciliation in the Appendix. Quarterly Yield & Cost Trends (1)(2) (1)(2) (1) 11 |
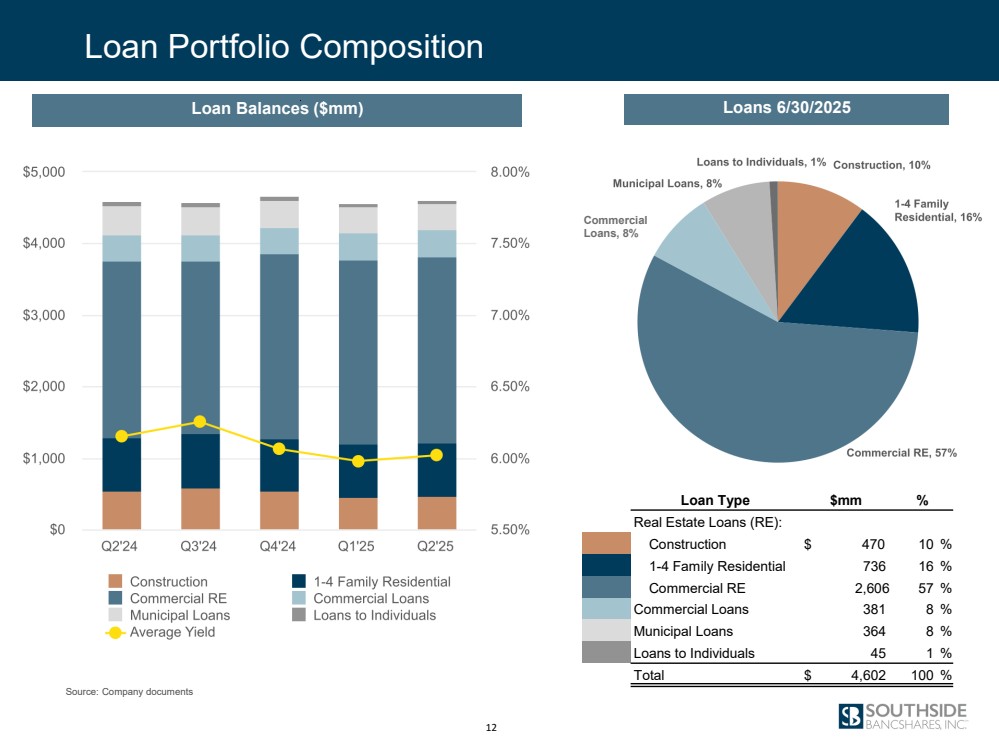
| Loan Portfolio Composition Loan Balances ($mm) Loans 6/30/2025 Loan Type $mm % Real Estate Loans (RE): Construction $ 470 10 % 1-4 Family Residential 736 16 % Commercial RE 2,606 57 % Commercial Loans 381 8 % Municipal Loans 364 8 % Loans to Individuals 45 1 % Total $ 4,602 100 % Commercial Loans, 8% 12 Source: Company documents |
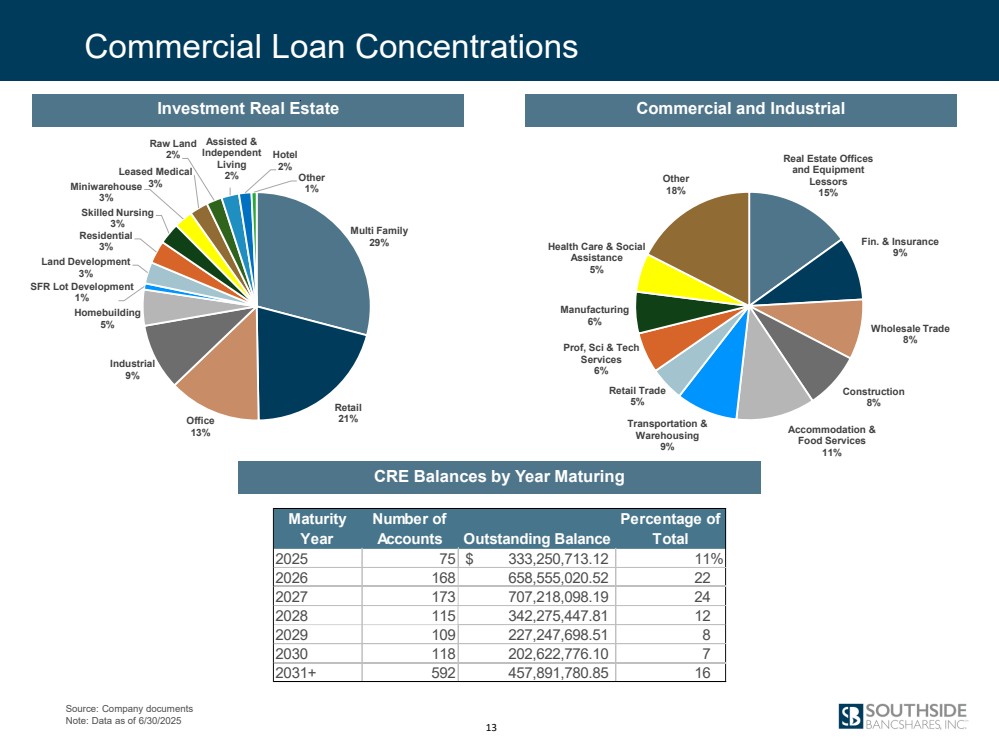
| Multi Family 29% Retail Office 21% 13% Industrial 9% Homebuilding 5% SFR Lot Development 1% Land Development 3% Residential 3% Skilled Nursing 3% Miniwarehouse 3% Leased Medical 3% Raw Land 2% Assisted & Independent Living 2% Hotel 2% Other 1% Commercial Loan Concentrations 13 Investment Real Estate Commercial and Industrial CRE Balances by Year Maturing Maturity Year Number of Accounts Outstanding Balance Percentage of Total 2025 75 $ 333,250,713.12 11% 2026 168 658,555,020.52 22 2027 173 707,218,098.19 24 2028 115 342,275,447.81 12 2029 109 227,247,698.51 8 2030 118 202,622,776.10 7 2031+ 592 457,891,780.85 16 Source: Company documents Note: Data as of 6/30/2025 Real Estate Offices and Equipment Lessors 15% Fin. & Insurance 9% Wholesale Trade 8% Construction 8% Accommodation & Food Services 11% Transportation & Warehousing 9% Retail Trade 5% Prof, Sci & Tech Services 6% Manufacturing 6% Health Care & Social Assistance 5% Other 18% |
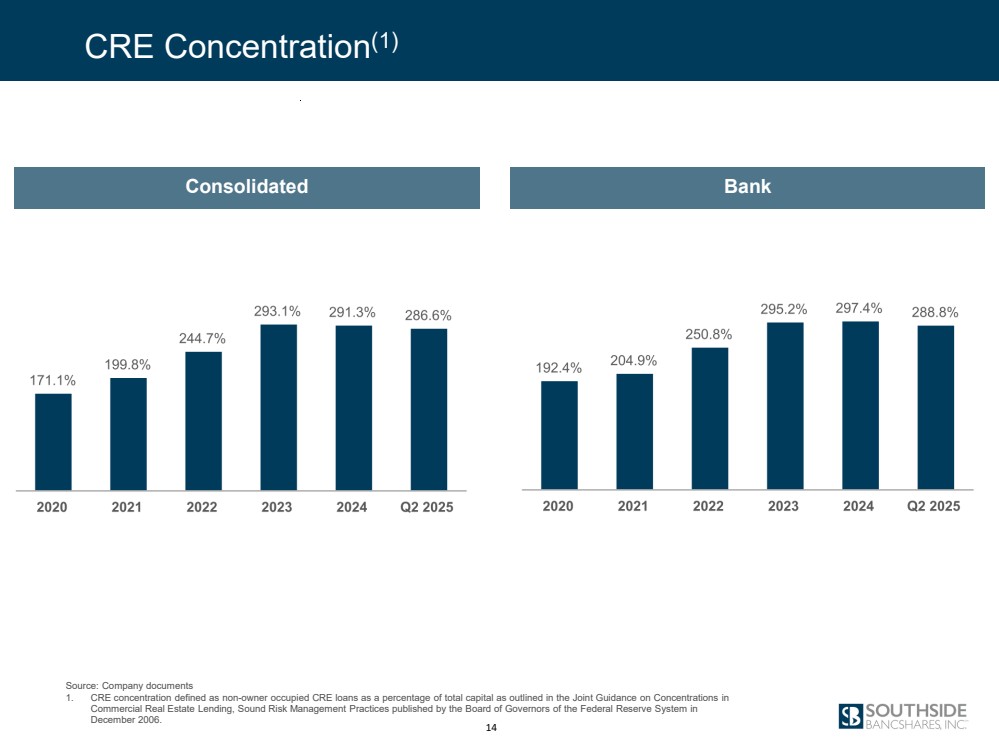
| CRE Concentration(1) Consolidated Bank 14 Source: Company documents 1. CRE concentration defined as non-owner occupied CRE loans as a percentage of total capital as outlined in the Joint Guidance on Concentrations in Commercial Real Estate Lending, Sound Risk Management Practices published by the Board of Governors of the Federal Reserve System in December 2006. |
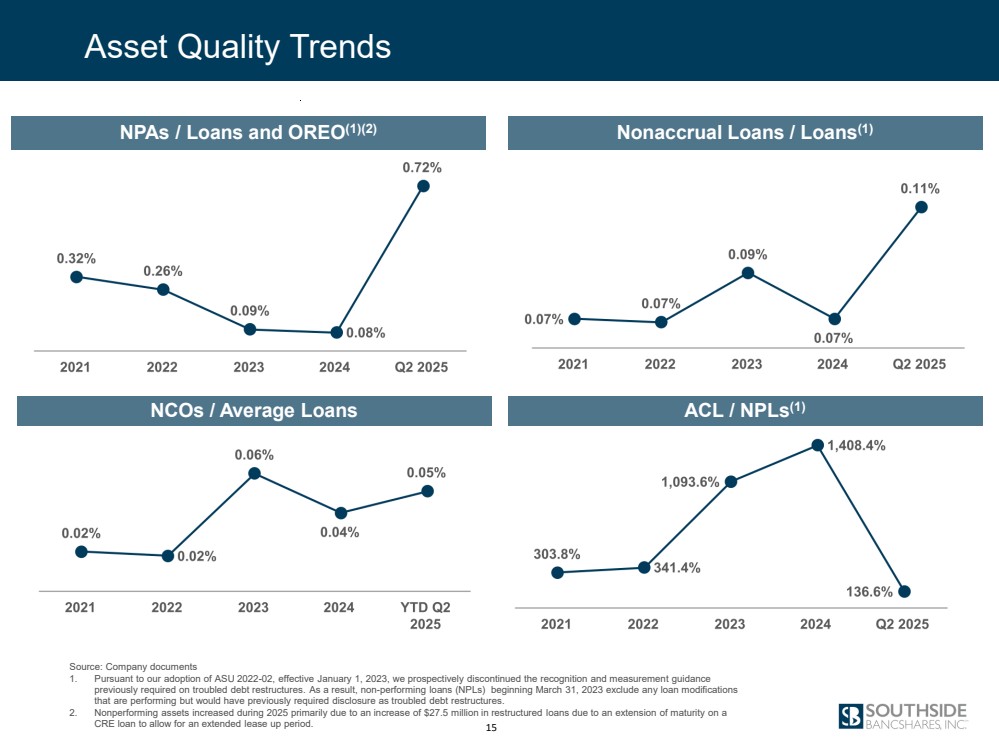
| Asset Quality Trends NPAs / Loans and OREO(1)(2) Nonaccrual Loans / Loans(1) NCOs / Average Loans ACL / NPLs(1) 15 Source: Company documents 1. Pursuant to our adoption of ASU 2022-02, effective January 1, 2023, we prospectively discontinued the recognition and measurement guidance previously required on troubled debt restructures. As a result, non-performing loans (NPLs) beginning March 31, 2023 exclude any loan modifications that are performing but would have previously required disclosure as troubled debt restructures. 2. Nonperforming assets increased during 2025 primarily due to an increase of $27.5 million in restructured loans due to an extension of maturity on a CRE loan to allow for an extended lease up period. |
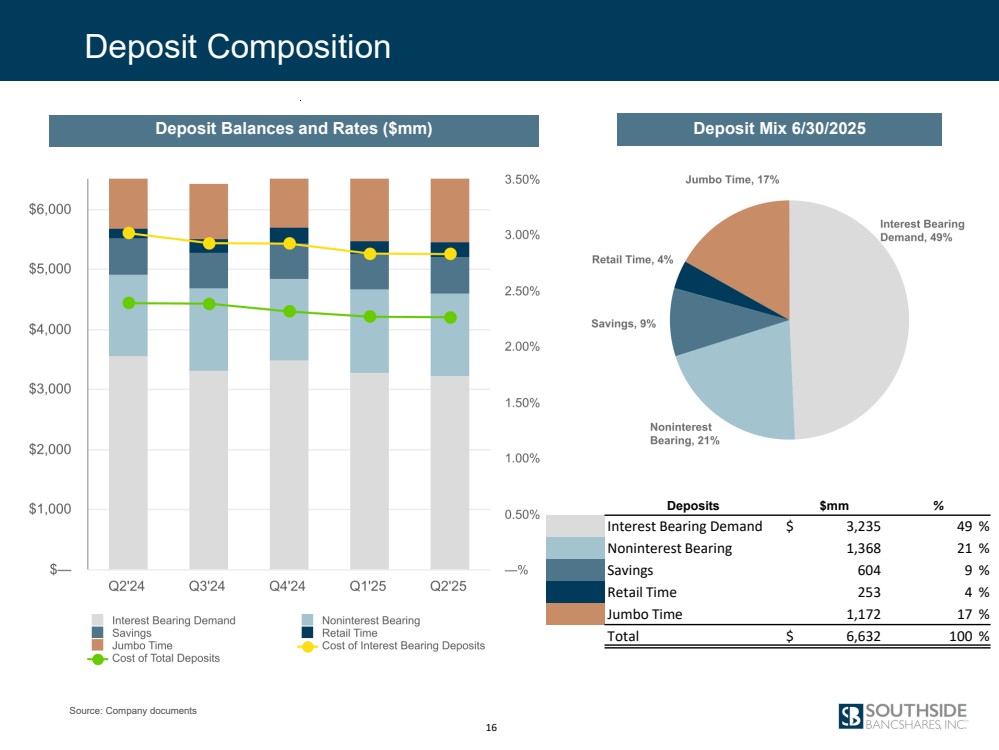
| Deposit Composition Deposit Balances and Rates ($mm) Deposit Mix 6/30/2025 16 Deposits $mm % Interest Bearing Demand $ 3,235 49 % Noninterest Bearing 1,368 21 % Savings 604 9 % Retail Time 253 4 % Jumbo Time 1,172 17 % Total $ 6,632 100 % Source: Company documents |
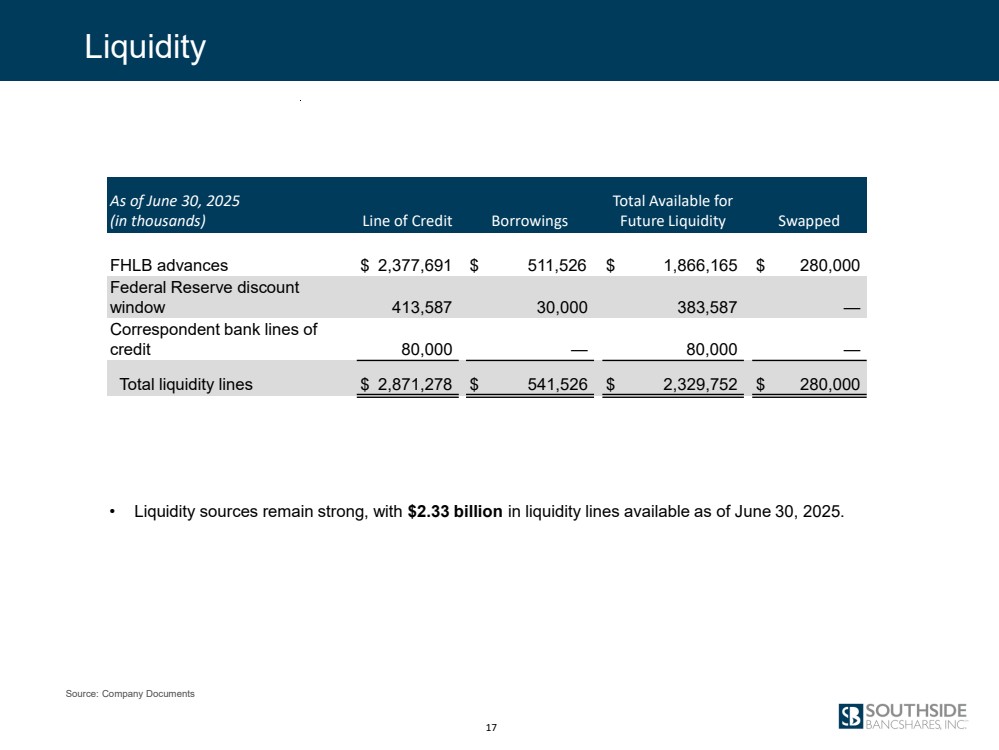
| Liquidity 17 • Liquidity sources remain strong, with $2.33 billion in liquidity lines available as of June 30, 2025. As of June 30, 2025 (in thousands) Line of Credit Borrowings Total Available for Future Liquidity Swapped FHLB advances $ 2,377,691 $ 511,526 $ 1,866,165 $ 280,000 Federal Reserve discount window 413,587 30,000 383,587 — Correspondent bank lines of credit 80,000 — 80,000 — Total liquidity lines $ 2,871,278 $ 541,526 $ 2,329,752 $ 280,000 Source: Company Documents |
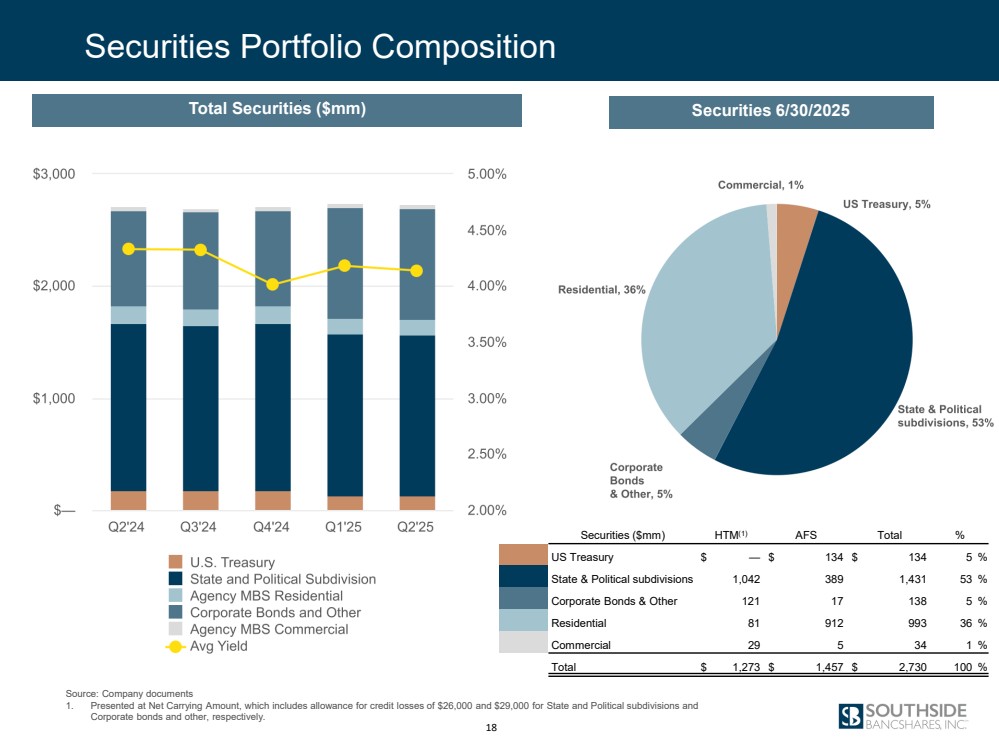
| Securities Portfolio Composition Total Securities ($mm) Securities 6/30/2025 Securities ($mm) HTM(1) AFS Total % US Treasury $ — $ 134 $ 134 5 % State & Political subdivisions 1,042 389 1,431 53 % Corporate Bonds & Other 121 17 138 5 % Residential 81 912 993 36 % Commercial 29 5 34 1 % Total $ 1,273 $ 1,457 $ 2,730 100 % 18 Source: Company documents 1. Presented at Net Carrying Amount, which includes allowance for credit losses of $26,000 and $29,000 for State and Political subdivisions and Corporate bonds and other, respectively. |
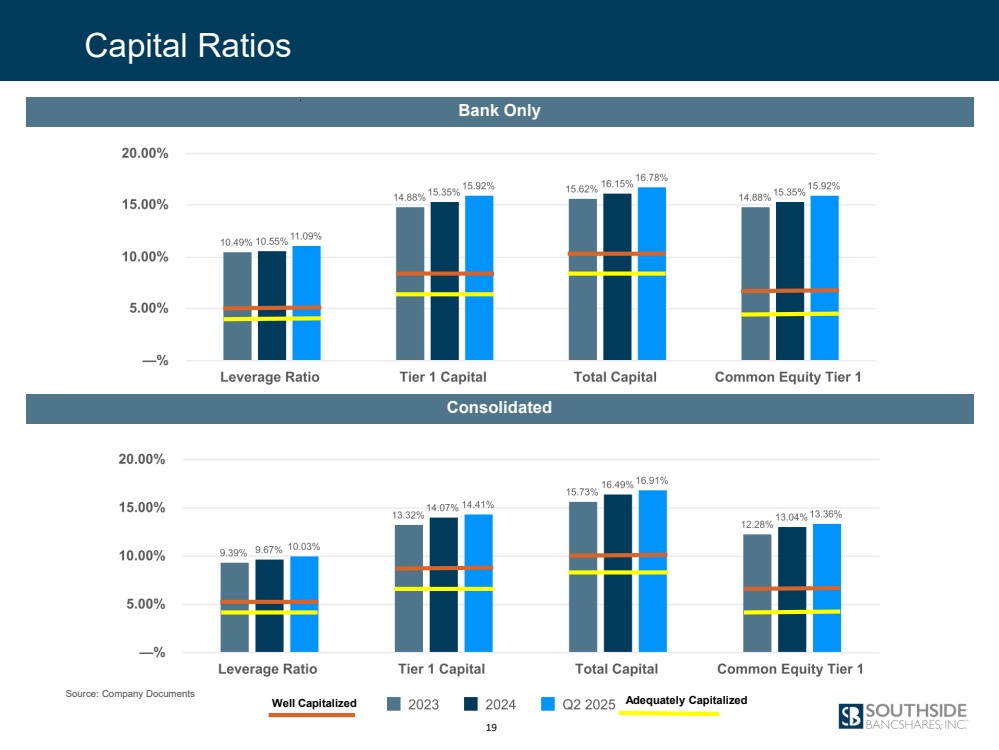
| Capital Ratios 19 8.0% 10.0% Bank Only Consolidated Well Capitalized Adequately Capitalized Source: Company Documents |
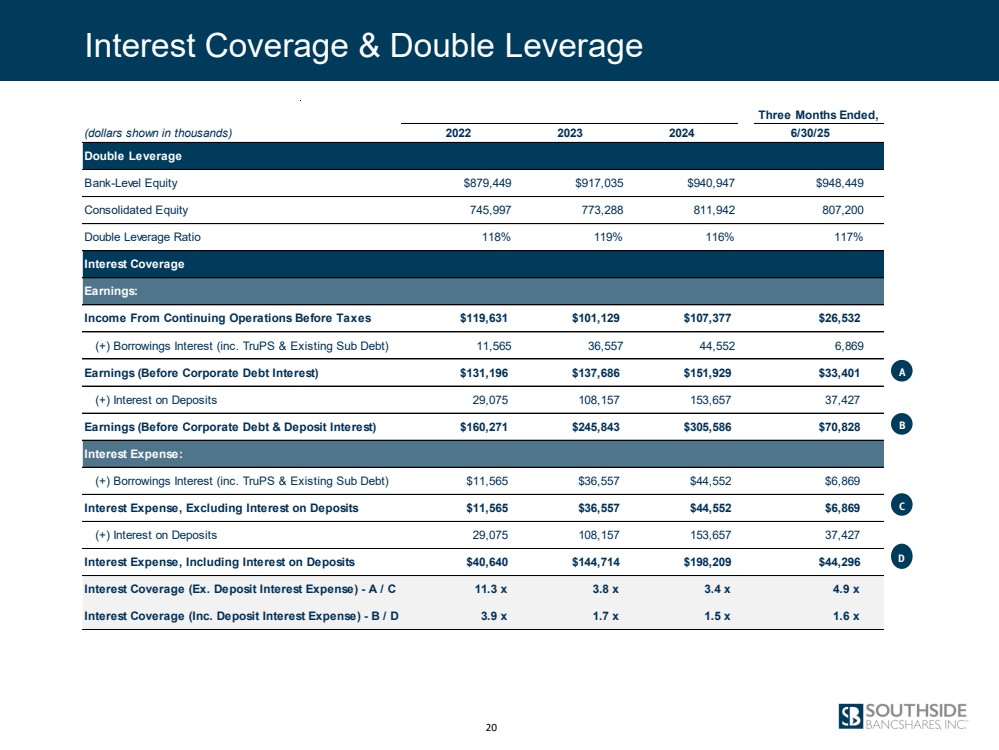
| Interest Coverage & Double Leverage 20 Three Months Ended, (dollars shown in thousands) 2022 2023 2024 6/30/25 Double Leverage Bank-Level Equity $879,449 $917,035 $940,947 $948,449 Consolidated Equity 745,997 773,288 811,942 807,200 Double Leverage Ratio 118% 119% 116% 117% Interest Coverage Earnings: Income From Continuing Operations Before Taxes $119,631 $101,129 $107,377 $26,532 (+) Borrowings Interest (inc. TruPS & Existing Sub Debt) 11,565 36,557 44,552 6,869 Earnings (Before Corporate Debt Interest) $131,196 $137,686 $151,929 $33,401 (+) Interest on Deposits 29,075 108,157 153,657 37,427 Earnings (Before Corporate Debt & Deposit Interest) $160,271 $245,843 $305,586 $70,828 Interest Expense: (+) Borrowings Interest (inc. TruPS & Existing Sub Debt) $11,565 $36,557 $44,552 $6,869 Interest Expense, Excluding Interest on Deposits $11,565 $36,557 $44,552 $6,869 (+) Interest on Deposits 29,075 108,157 153,657 37,427 Interest Expense, Including Interest on Deposits $40,640 $144,714 $198,209 $44,296 Interest Coverage (Ex. Deposit Interest Expense) - A / C 11.3 x 3.8 x 3.4 x 4.9 x Interest Coverage (Inc. Deposit Interest Expense) - B / D 3.9 x 1.7 x 1.5 x 1.6 x A B C D |
| Appendix 21 21 |
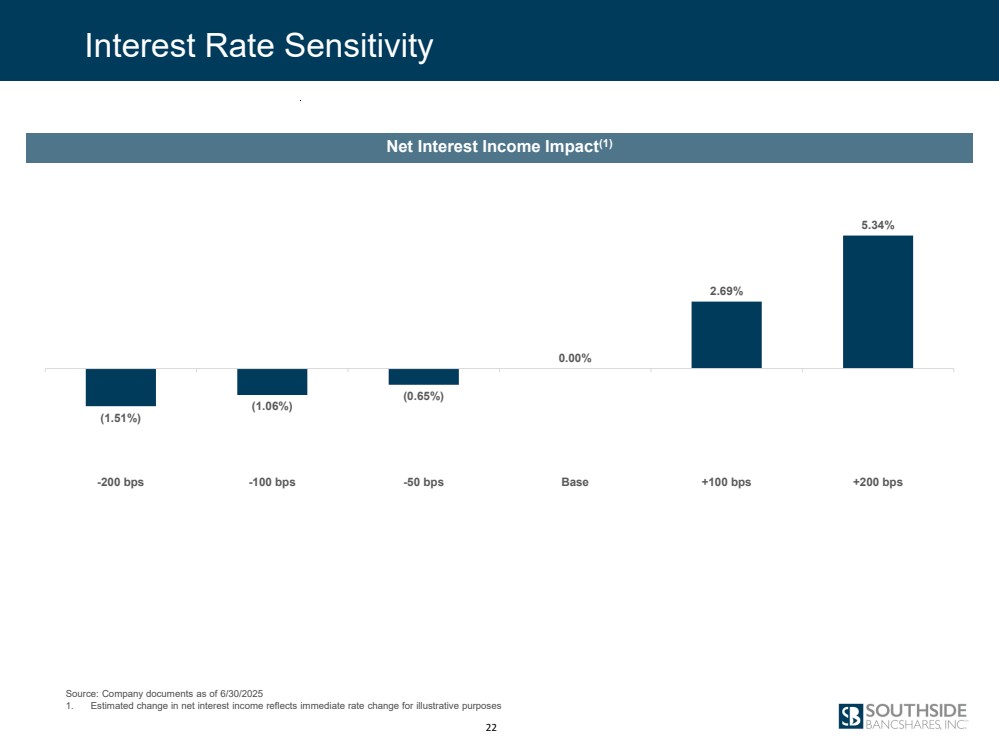
| 22 Net Interest Income Impact(1) Interest Rate Sensitivity (1.51%) (1.06%) (0.65%) 0.00% 2.69% 5.34% -200 bps -100 bps -50 bps Base +100 bps +200 bps Source: Company documents as of 6/30/2025 1. Estimated change in net interest income reflects immediate rate change for illustrative purposes |
| This presentation contains certain financial information determined by methods other than in accordance with accounting principles generally accepted in the United States (GAAP). These non-GAAP financial measures include return on average tangible common equity, tangible book value per common share, tangible common equity to tangible assets, efficiency ratio on a fully taxable-equivalent (FTE) basis, net interest income (FTE), net interest margin (FTE) and net interest spread (FTE). In calculating return on average tangible common equity, Southside (i) adds back the after tax amortization expense to net income available to common shareholders and (ii) subtracts average intangible assets for the period from average shareholders’ equity. In calculating tangible book value per common share, Southside subtracts intangible assets for the period from shareholders’ equity. In calculating the ratio of tangible common equity to tangible assets, Southside subtracts intangible assets both from shareholders’ equity and total assets at the end of the period. Management believes that the presentation of these measures excluding the impact of intangible assets provides useful supplemental information that is helpful in understanding Southside’s financial condition and results of operations, as they provide a method to assess management’s success in utilizing Southside’s tangible capital as well as its capital strength. Management also believes that providing measures that exclude balances of intangible assets, which are subjective components of valuation, facilitates the comparison of Southside’s performance with the performance of its peers. In addition, management believes that these are standard financial measures used in the banking industry to evaluate performance. The efficiency ratio (FTE) is a non-GAAP measure that provides a measure of productivity in the banking industry. This ratio is calculated to measure the cost of generating one dollar of revenue. The ratio is designed to reflect the percentage of one dollar which must be expended to generate that dollar of revenue. We calculate this ratio by dividing noninterest expense, excluding amortization expense on intangibles and certain nonrecurring expense by the sum of net interest income (FTE) and noninterest income, excluding net gain (loss) on sale of securities available for sale and certain nonrecurring impairments. The most directly comparable financial measure calculated in accordance with GAAP is our efficiency ratio. Net interest income (FTE) is a non-GAAP measure that adjusts for the tax-favored status of net interest income from certain loans and investments. We believe this measure to be the preferred industry measurement of net interest income and it enhances comparability of net interest income arising from taxable and tax-exempt sources. The most directly comparable financial measure calculated in accordance with GAAP is our net interest income. Net interest margin (FTE) is the ratio of net interest income (FTE) to average earning assets. The most directly comparable financial measure calculated in accordance with GAAP is our net interest margin. Net interest spread (FTE) is the difference in the average yield on average earning assets on a tax-equivalent basis and the average rate paid on average interest bearing liabilities. The most directly comparable financial measure calculated in accordance with GAAP is our net interest spread. These non-GAAP financial measures are supplemental and are not a substitute for any analysis based on GAAP financial measures. Because not all companies use the same calculation of non-GAAP financial measures, this presentation may not be comparable to other similarly titled measures as calculated by other companies. Non-GAAP Reconciliation 23 |
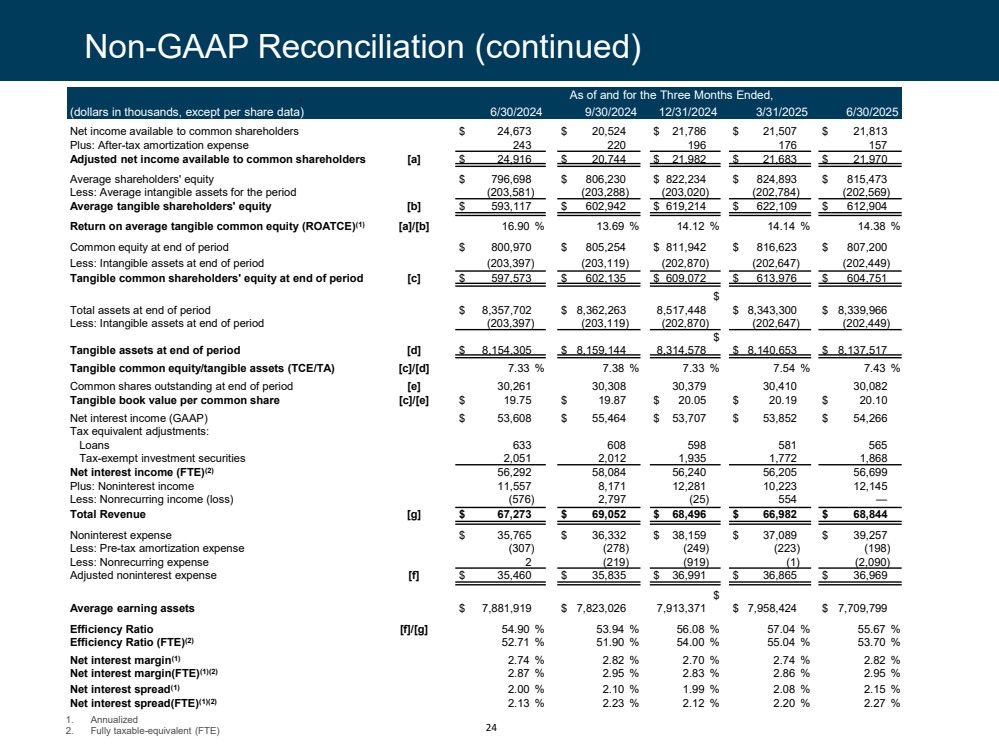
| As of and for the Three Months Ended, (dollars in thousands, except per share data) 6/30/2024 9/30/2024 12/31/2024 3/31/2025 6/30/2025 Net income available to common shareholders $ 24,673 $ 20,524 $ 21,786 $ 21,507 $ 21,813 Plus: After-tax amortization expense 243 220 196 176 157 Adjusted net income available to common shareholders [a] $ 24,916 $ 20,744 $ 21,982 $ 21,683 $ 21,970 Average shareholders' equity $ 796,698 $ 806,230 $ 822,234 $ 824,893 $ 815,473 Less: Average intangible assets for the period (203,581) (203,288) (203,020) (202,784) (202,569) Average tangible shareholders' equity [b] $ 593,117 $ 602,942 $ 619,214 $ 622,109 $ 612,904 Return on average tangible common equity (ROATCE)(1) [a]/[b] 16.90 % 13.69 % 14.12 % 14.14 % 14.38 % Common equity at end of period $ 800,970 $ 805,254 $ 811,942 $ 816,623 $ 807,200 Less: Intangible assets at end of period (203,397) (203,119) (202,870) (202,647) (202,449) Tangible common shareholders' equity at end of period [c] $ 597,573 $ 602,135 $ 609,072 $ 613,976 $ 604,751 Total assets at end of period $ 8,357,702 $ 8,362,263 $ 8,517,448 $ 8,343,300 $ 8,339,966 Less: Intangible assets at end of period (203,397) (203,119) (202,870) (202,647) (202,449) Tangible assets at end of period [d] $ 8,154,305 $ 8,159,144 $ 8,314,578 $ 8,140,653 $ 8,137,517 Tangible common equity/tangible assets (TCE/TA) [c]/[d] 7.33 % 7.38 % 7.33 % 7.54 % 7.43 % Common shares outstanding at end of period [e] 30,261 30,308 30,379 30,410 30,082 Tangible book value per common share [c]/[e] $ 19.75 $ 19.87 $ 20.05 $ 20.19 $ 20.10 Net interest income (GAAP) $ 53,608 $ 55,464 $ 53,707 $ 53,852 $ 54,266 Tax equivalent adjustments: Loans 633 608 598 581 565 Tax-exempt investment securities 2,051 2,012 1,935 1,772 1,868 Net interest income (FTE)(2) 56,292 58,084 56,240 56,205 56,699 Plus: Noninterest income 11,557 8,171 12,281 10,223 12,145 Less: Nonrecurring income (loss) (576) 2,797 (25) 554 — Total Revenue [g] $ 67,273 $ 69,052 $ 68,496 $ 66,982 $ 68,844 Noninterest expense $ 35,765 $ 36,332 $ 38,159 $ 37,089 $ 39,257 Less: Pre-tax amortization expense (307) (278) (249) (223) (198) Less: Nonrecurring expense 2 (219) (919) (1) (2,090) Adjusted noninterest expense [f] $ 35,460 $ 35,835 $ 36,991 $ 36,865 $ 36,969 Average earning assets $ 7,881,919 $ 7,823,026 $ 7,913,371 $ 7,958,424 $ 7,709,799 Efficiency Ratio [f]/[g] 54.90 % 53.94 % 56.08 % 57.04 % 55.67 % Efficiency Ratio (FTE)(2) 52.71 % 51.90 % 54.00 % 55.04 % 53.70 % Net interest margin(1) 2.74 % 2.82 % 2.70 % 2.74 % 2.82 % Net interest margin(FTE)(1)(2) 2.87 % 2.95 % 2.83 % 2.86 % 2.95 % Net interest spread(1) 2.00 % 2.10 % 1.99 % 2.08 % 2.15 % Net interest spread(FTE)(1)(2) 2.13 % 2.23 % 2.12 % 2.20 % 2.27 % 24 Non-GAAP Reconciliation (continued) 1. Annualized 2. Fully taxable-equivalent (FTE) |
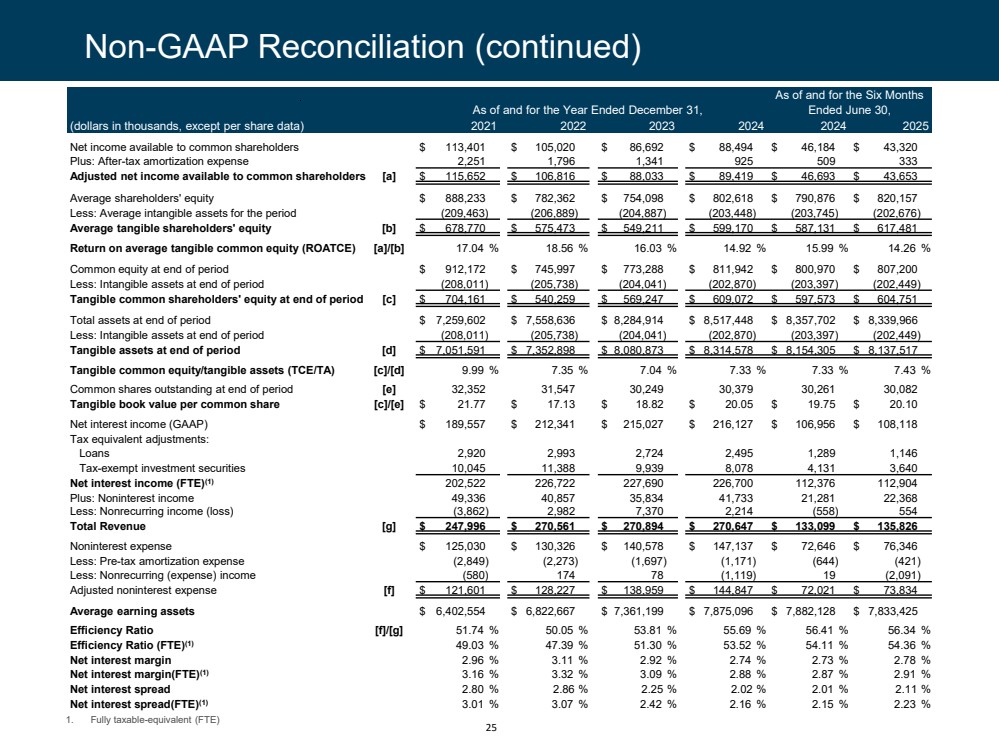
| As of and for the Year Ended December 31, As of and for the Six Months Ended June 30, (dollars in thousands, except per share data) 2021 2022 2023 2024 2024 2025 Net income available to common shareholders $ 113,401 $ 105,020 $ 86,692 $ 88,494 $ 46,184 $ 43,320 Plus: After-tax amortization expense 2,251 1,796 1,341 925 509 333 Adjusted net income available to common shareholders [a] $ 115,652 $ 106,816 $ 88,033 $ 89,419 $ 46,693 $ 43,653 Average shareholders' equity $ 888,233 $ 782,362 $ 754,098 $ 802,618 $ 790,876 $ 820,157 Less: Average intangible assets for the period (209,463) (206,889) (204,887) (203,448) (203,745) (202,676) Average tangible shareholders' equity [b] $ 678,770 $ 575,473 $ 549,211 $ 599,170 $ 587,131 $ 617,481 Return on average tangible common equity (ROATCE) [a]/[b] 17.04 % 18.56 % 16.03 % 14.92 % 15.99 % 14.26 % Common equity at end of period $ 912,172 $ 745,997 $ 773,288 $ 811,942 $ 800,970 $ 807,200 Less: Intangible assets at end of period (208,011) (205,738) (204,041) (202,870) (203,397) (202,449) Tangible common shareholders' equity at end of period [c] $ 704,161 $ 540,259 $ 569,247 $ 609,072 $ 597,573 $ 604,751 Total assets at end of period $ 7,259,602 $ 7,558,636 $ 8,284,914 $ 8,517,448 $ 8,357,702 $ 8,339,966 Less: Intangible assets at end of period (208,011) (205,738) (204,041) (202,870) (203,397) (202,449) Tangible assets at end of period [d] $ 7,051,591 $ 7,352,898 $ 8,080,873 $ 8,314,578 $ 8,154,305 $ 8,137,517 Tangible common equity/tangible assets (TCE/TA) [c]/[d] 9.99 % 7.35 % 7.04 % 7.33 % 7.33 % 7.43 % Common shares outstanding at end of period [e] 32,352 31,547 30,249 30,379 30,261 30,082 Tangible book value per common share [c]/[e] $ 21.77 $ 17.13 $ 18.82 $ 20.05 $ 19.75 $ 20.10 Net interest income (GAAP) $ 189,557 $ 212,341 $ 215,027 $ 216,127 $ 106,956 $ 108,118 Tax equivalent adjustments: Loans 2,920 2,993 2,724 2,495 1,289 1,146 Tax-exempt investment securities 10,045 11,388 9,939 8,078 4,131 3,640 Net interest income (FTE)(1) 202,522 226,722 227,690 226,700 112,376 112,904 Plus: Noninterest income 49,336 40,857 35,834 41,733 21,281 22,368 Less: Nonrecurring income (loss) (3,862) 2,982 7,370 2,214 (558) 554 Total Revenue [g] $ 247,996 $ 270,561 $ 270,894 $ 270,647 $ 133,099 $ 135,826 Noninterest expense $ 125,030 $ 130,326 $ 140,578 $ 147,137 $ 72,646 $ 76,346 Less: Pre-tax amortization expense (2,849) (2,273) (1,697) (1,171) (644) (421) Less: Nonrecurring (expense) income (580) 174 78 (1,119) 19 (2,091) Adjusted noninterest expense [f] $ 121,601 $ 128,227 $ 138,959 $ 144,847 $ 72,021 $ 73,834 Average earning assets $ 6,402,554 $ 6,822,667 $ 7,361,199 $ 7,875,096 $ 7,882,128 $ 7,833,425 Efficiency Ratio [f]/[g] 51.74 % 50.05 % 53.81 % 55.69 % 56.41 % 56.34 % Efficiency Ratio (FTE)(1) 49.03 % 47.39 % 51.30 % 53.52 % 54.11 % 54.36 % Net interest margin 2.96 % 3.11 % 2.92 % 2.74 % 2.73 % 2.78 % Net interest margin(FTE)(1) 3.16 % 3.32 % 3.09 % 2.88 % 2.87 % 2.91 % Net interest spread 2.80 % 2.86 % 2.25 % 2.02 % 2.01 % 2.11 % Net interest spread(FTE)(1) 3.01 % 3.07 % 2.42 % 2.16 % 2.15 % 2.23 % 25 Non-GAAP Reconciliation (continued) 1. Fully taxable-equivalent (FTE) |
| 26 Thank you NYSE: SBSI |