Shareholder Report
May 31, 2025
USD ($)
HOLDING
columbiathreadneedleus.com/resources/literature
. You can also request more information by contacting us at 1-800-345-6611.
What were the Fund costs for the reporting period?
(Based on a hypothetical $10,000 investment)
| Class | Cost of a $10,000 investment | Cost paid as a percentage of a $10,000 investment |
| Class A | $ 83 | 0.80 % |
Management's Discussion of Fund Performance
The performance of Class A shares for the period presented is shown in the Average Annual Total Returns table.
Top Performance Contributors
Stock selection
| Selections in the energy, health care and consumer staples sectors boosted the Fund’s relative results most during the annual period.Allocations
| A smaller allocation to the health care sector and larger allocations to the communication services and utilities sectors buoyed the Fund’s relative results during the annual period.Individual holdings
| Positions in Philip Morris International, Inc., a tobacco and nicotine products company; Tenet Healthcare Corp., a hospital operator and healthcare services company; Williams Companies, Inc., a natural gas pipeline operator; UnitedHealth Group, a health insurance and healthcare services company; and Corning, Inc., a technology company specializing in glass, ceramics and related materials, were among the top relative contributors to Fund performance.Top Performance Detractors
Stock selection
Allocations
| A larger weighting to the energy sector and smaller weightings to the financials and consumer staples sectors detracted from relative results.Individual holdings
| Fund positions in AES Corp., an independent power provider; Freeport-McMoRan, Inc., a copper mining company; Qualcomm, Inc., a semiconductor company that provides chips and software for mobile phones and other devices; Applied Materials, Inc., a semiconductor fabrication equipment supplier; and Humana, Inc., a health insurance company, were among the top relative detractors during the period.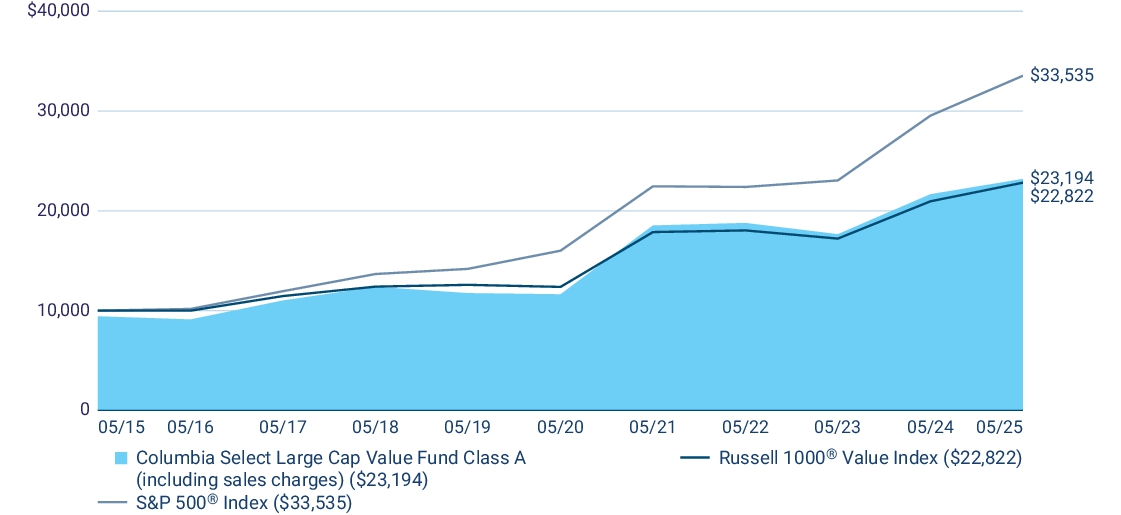
| Average Annual Total Returns (%) | 1 year | 5 years | 10 years |
| Class A (excluding sales charges) | 7.08 | 14.80 | 9.42 |
| Class A (including sales charges) | 0.92 | 13.45 | 8.78 |
| Russell 1000 ® Value Index | 8.91 | 13.02 | 8.60 |
| S&P 500 ® Index | 13.52 | 15.94 | 12.86 |
columbiathreadneedleus.com/investment-products/mutual-funds
for more recent performance information.
Key Fund Statistics
Fund net assets | $ 2,345,660,346 |
Total number of portfolio holdings | 38 |
Management services fees (represents 0.67% of Fund average net assets) | $ 16,008,828 |
Portfolio turnover for the reporting period | 28% |
Graphical Representation of Fund Holdings
The tables below show the investment makeup of the Fu
nd
represented
as a percentage of
Fund ne
t assets. Derivatives are excluded from the tables unless otherwise noted. The Fund's portfolio composition is subject to change.Top Holdings
| Verizon Communications, Inc. | 3.8 % |
| Corning, Inc. | 3.7 % |
| Boeing Co. (The) | 3.4 % |
| Applied Materials, Inc. | 3.4 % |
| Freeport-McMoRan, Inc. | 3.4 % |
| Tenet Healthcare Corp. | 3.4 % |
| PG&E Corp. | 3.1 % |
| Lowe's Companies, Inc. | 3.1 % |
| EPAM Systems, Inc. | 3.1 % |
| Citigroup, Inc. | 3.1 % |
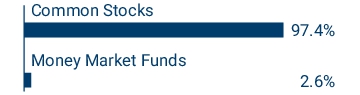
Asset Categories

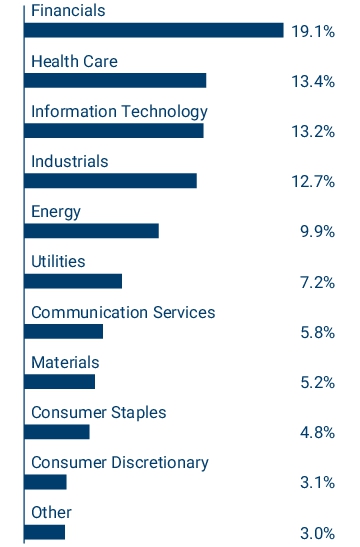
Equity Sector Allocation

Top Holdings
| Verizon Communications, Inc. | 3.8 % |
| Corning, Inc. | 3.7 % |
| Boeing Co. (The) | 3.4 % |
| Applied Materials, Inc. | 3.4 % |
| Freeport-McMoRan, Inc. | 3.4 % |
| Tenet Healthcare Corp. | 3.4 % |
| PG&E Corp. | 3.1 % |
| Lowe's Companies, Inc. | 3.1 % |
| EPAM Systems, Inc. | 3.1 % |
| Citigroup, Inc. | 3.1 % |
columbiathreadneedleus.com/resources/literature
. You can also request more information by contacting us at 1-800-345-6611.
What were the Fund costs for the reporting period?
(Based on a hypothetical $10,000 investment)
| Class | Cost of a $10,000 investment | Cost paid as a percentage of a $10,000 investment |
| Class C | $ 159 | 1.55 % |
Management's Discussion of Fund Performance
The performance of Class C shares for the period presented is shown in the Average Annual Total Returns table.
Top Performance Contributors
Stock selection
| Selections in the energy, health care and consumer staples sectors boosted the Fund’s relative results most during the annual period.Allocations
| A smaller allocation to the health care sector and larger allocations to the communication services and utilities sectors buoyed the Fund’s relative results during the annual period.Individual holdings
| Positions in Philip Morris International, Inc., a tobacco and nicotine products company; Tenet Healthcare Corp., a hospital operator and healthcare services company; Williams Companies, Inc., a natural gas pipeline operator; UnitedHealth Group, a health insurance and healthcare services company; and Corning, Inc., a technology company specializing in glass, ceramics and related materials, were among the top relative contributors to Fund performance.Top Performance Detractors
Stock selection
Allocations
| A larger weighting to the energy sector and smaller weightings to the financials and consumer staples sectors detracted from relative results.Individual holdings
| Fund positions in AES Corp., an independent power provider; Freeport-McMoRan, Inc., a copper mining company; Qualcomm, Inc., a semiconductor company that provides chips and software for mobile phones and other devices; Applied Materials, Inc., a semiconductor fabrication equipment supplier; and Humana, Inc., a health insurance company, were among the top relative detractors during the period.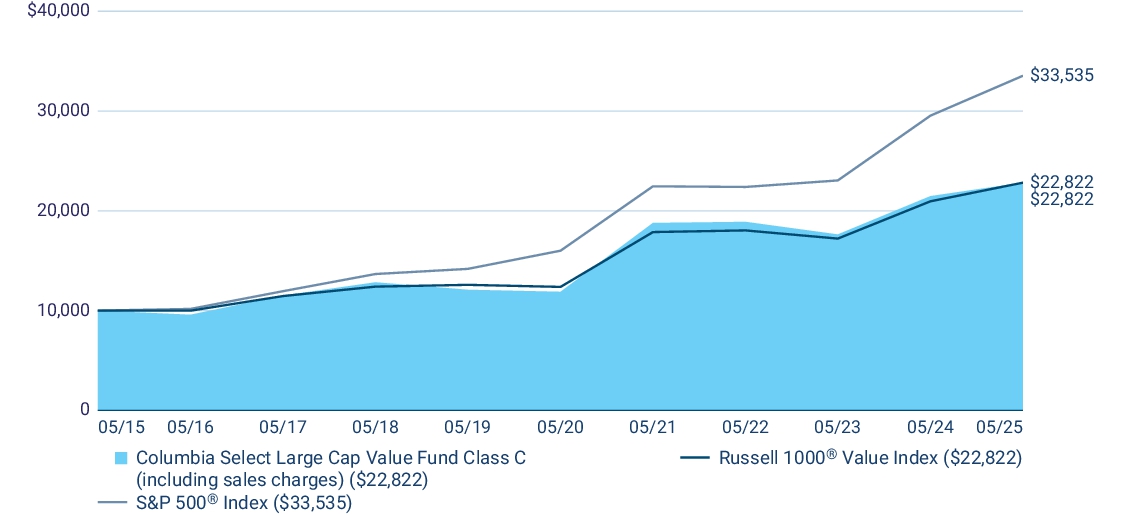
| Average Annual Total Returns (%) | 1 year | 5 years | 10 years |
| Class C (excluding sales charges) | 6.28 | 13.94 | 8.60 |
| Class C (including sales charges) | 5.28 | 13.94 | 8.60 |
| Russell 1000 ® Value Index | 8.91 | 13.02 | 8.60 |
| S&P 500 ® Index | 13.52 | 15.94 | 12.86 |
columbiathreadneedleus.com/investment-products/mutual-funds
for more recent performance information.
Key Fund Statistics
Fund net assets | $ 2,345,660,346 |
Total number of portfolio holdings | 38 |
Management services fees (represents 0.67% of Fund average net assets) | $ 16,008,828 |
Portfolio turnover for the reporting period | 28% |
Graphical Representation of Fund Holdings
The tables below show the investment makeup of the Fund represented as a percentage of Fund net assets. Derivatives are excluded from the tables unless otherwise noted. The Fund's portfolio composition is subject to change.
Top Holdings
| Verizon Communications, Inc. | 3.8 % |
| Corning, Inc. | 3.7 % |
| Boeing Co. (The) | 3.4 % |
| Applied Materials, Inc. | 3.4 % |
| Freeport-McMoRan, Inc. | 3.4 % |
| Tenet Healthcare Corp. | 3.4 % |
| PG&E Corp. | 3.1 % |
| Lowe's Companies, Inc. | 3.1 % |
| EPAM Systems, Inc. | 3.1 % |
| Citigroup, Inc. | 3.1 % |
Asset Categories

Equity Sector Allocation

Top Holdings
| Verizon Communications, Inc. | 3.8 % |
| Corning, Inc. | 3.7 % |
| Boeing Co. (The) | 3.4 % |
| Applied Materials, Inc. | 3.4 % |
| Freeport-McMoRan, Inc. | 3.4 % |
| Tenet Healthcare Corp. | 3.4 % |
| PG&E Corp. | 3.1 % |
| Lowe's Companies, Inc. | 3.1 % |
| EPAM Systems, Inc. | 3.1 % |
| Citigroup, Inc. | 3.1 % |
columbiathreadneedleus.com/resources/literature
. You can also request more information by contacting us at 1-800-345-6611.
What were the Fund costs for the reporting period?
(Based on a hypothetical $10,000 investment)
| Class | Cost of a $10,000 investment | Cost paid as a percentage of a $10,000 investment |
| Institutional Class | $ 57 | 0.55 % |
Management's Discussion of Fund Performance
The performance of Institutional Class shares for the period presented is shown in the Average Annual Total Returns table.
Top Performance Contributors
Stock selection
| Selections in the energy, health care and consumer staples sectors boosted the Fund’s relative results most during the annual period.Allocations
| A smaller allocation to the health care sector and larger allocations to the communication services and utilities sectors buoyed the Fund’s relative results during the annual period.Individual holdings
| Positions in Philip Morris International, Inc., a tobacco and nicotine products company; Tenet Healthcare Corp., a hospital operator and healthcare services company; Williams Companies, Inc., a natural gas pipeline operator; UnitedHealth Group, a health insurance and healthcare services company; and Corning, Inc., a technology company specializing in glass, ceramics and related materials, were among the top relative contributors to Fund performance.Top Performance Detractors
Stock selection
Allocations
| A larger weighting to the energy sector and smaller weightings to the financials and consumer staples sectors detracted from relative results.Individual holdings
| Fund positions in AES Corp., an independent power provider; Freeport-McMoRan, Inc., a copper mining company; Qualcomm, Inc., a semiconductor company that provides chips and software for mobile phones and other devices; Applied Materials, Inc., a semiconductor fabrication equipment supplier; and Humana, Inc., a health insurance company, were among the top relative detractors during the period.
| Average Annual Total Returns (%) | 1 year | 5 years | 10 years |
| Institutional Class | 7.36 | 15.09 | 9.70 |
| Russell 1000 ® Value Index | 8.91 | 13.02 | 8.60 |
| S&P 500 ® Index | 13.52 | 15.94 | 12.86 |
columbiathreadneedleus.com/investment-products/mutual-funds
for more recent performance information.
Key Fund Statistics
Fund net assets | $ 2,345,660,346 |
Total number of portfolio holdings | 38 |
Management services fees (represents 0.67% of Fund average net assets) | $ 16,008,828 |
Portfolio turnover for the reporting period | 28% |
Graphical Representation of Fund Holdings
The tables below show the investment makeup o
f the
Fund repr
esented as a percentage of Fund net assets. Derivatives are excluded from the tables unless otherwise noted. The Fund's portfolio composition is subject to change.Top Holdings
| Verizon Communications, Inc. | 3.8 % |
| Corning, Inc. | 3.7 % |
| Boeing Co. (The) | 3.4 % |
| Applied Materials, Inc. | 3.4 % |
| Freeport-McMoRan, Inc. | 3.4 % |
| Tenet Healthcare Corp. | 3.4 % |
| PG&E Corp. | 3.1 % |
| Lowe's Companies, Inc. | 3.1 % |
| EPAM Systems, Inc. | 3.1 % |
| Citigroup, Inc. | 3.1 % |
Asset Categories

Equity Sector Allocation

Top Holdings
| Verizon Communications, Inc. | 3.8 % |
| Corning, Inc. | 3.7 % |
| Boeing Co. (The) | 3.4 % |
| Applied Materials, Inc. | 3.4 % |
| Freeport-McMoRan, Inc. | 3.4 % |
| Tenet Healthcare Corp. | 3.4 % |
| PG&E Corp. | 3.1 % |
| Lowe's Companies, Inc. | 3.1 % |
| EPAM Systems, Inc. | 3.1 % |
| Citigroup, Inc. | 3.1 % |
columbiathreadneedleus.com/resources/literature
. You can also request more information by contacting us at 1-800-345-6611.
What were the Fund costs for the reporting period?
(Based on a hypothetical $10,000 investment)
| Class | Cost of a $10,000 investment | Cost paid as a percentage of a $10,000 investment |
| Institutional 2 Class | $ 48 | 0.46 % |
Management's Discussion of Fund Performance
The performance of Institutional 2 Class shares for the period presented is shown in the Average Annual Total Returns table.
Top Performance Contributors
Stock selection
| Selections in the energy, health care and consumer staples sectors boosted the Fund’s relative results most during the annual period.Allocations
| A smaller allocation to the health care sector and larger allocations to the communication services and utilities sectors buoyed the Fund’s relative results during the annual period.Individual holdings
| Positions in Philip Morris International, Inc., a tobacco and nicotine products company; Tenet Healthcare Corp., a hospital operator and healthcare services company; Williams Companies, Inc., a natural gas pipeline operator; UnitedHealth Group, a health insurance and healthcare services company; and Corning, Inc., a technology company specializing in glass, ceramics and related materials, were among the top relative contributors to Fund performance.Top Performance Detractors
Stock selection
Allocations
| A larger weighting to the energy sector and smaller weightings to the financials and consumer staples sectors detracted from relative results.Individual holdings
| Fund positions in AES Corp., an independent power provider; Freeport-McMoRan, Inc., a copper mining company; Qualcomm, Inc., a semiconductor company that provides chips and software for mobile phones and other devices; Applied Materials, Inc., a semiconductor fabrication equipment supplier; and Humana, Inc., a health insurance company, were among the top relative detractors during the period.
| Average Annual Total Returns (%) | 1 year | 5 years | 10 years |
| Institutional 2 Class | 7.47 | 15.17 | 9.77 |
| Russell 1000 ® Value Index | 8.91 | 13.02 | 8.60 |
| S&P 500 ® Index | 13.52 | 15.94 | 12.86 |
columbiathreadneedleus.com/investment-products/mutual-funds
for more recent performance information.
Key Fund Statistics
Fund net assets | $ 2,345,660,346 |
Total number of portfolio holdings | 38 |
Management services fees (represents 0.67% of Fund average net assets) | $ 16,008,828 |
Portfolio turnover for the reporting period | 28% |
Graphical Representation of Fund Holdings
The tables below show the investment makeup
of t
he Fund represented as a percentage of Fund net assets. Derivatives are excluded from the tables unless otherwise noted. The Fund's portfolio composition is subject to change.Top Holdings
| Verizon Communications, Inc. | 3.8 % |
| Corning, Inc. | 3.7 % |
| Boeing Co. (The) | 3.4 % |
| Applied Materials, Inc. | 3.4 % |
| Freeport-McMoRan, Inc. | 3.4 % |
| Tenet Healthcare Corp. | 3.4 % |
| PG&E Corp. | 3.1 % |
| Lowe's Companies, Inc. | 3.1 % |
| EPAM Systems, Inc. | 3.1 % |
| Citigroup, Inc. | 3.1 % |
Asset Categories

Equity Sector Allocation

Top Holdings
| Verizon Communications, Inc. | 3.8 % |
| Corning, Inc. | 3.7 % |
| Boeing Co. (The) | 3.4 % |
| Applied Materials, Inc. | 3.4 % |
| Freeport-McMoRan, Inc. | 3.4 % |
| Tenet Healthcare Corp. | 3.4 % |
| PG&E Corp. | 3.1 % |
| Lowe's Companies, Inc. | 3.1 % |
| EPAM Systems, Inc. | 3.1 % |
| Citigroup, Inc. | 3.1 % |
columbiathreadneedleus.com/resources/literature
. You can also request more information by contacting us at 1-800-345-6611.
What were the Fund costs for the reporting period?
(Based on a hypothetical $10,000 investment)
| Class | Cost of a $10,000 investment | Cost paid as a percentage of a $10,000 investment |
| Institutional 3 Class | $ 43 | 0.42 % |
Management's Discussion of Fund Performance
The performance of Institutional 3 Class shares for the period presented is shown in the Average Annual Total Returns table.
Top Performance Contributors
Stock selection
| Selections in the energy, health care and consumer staples sectors boosted the Fund’s relative results most during the annual period.Allocations
| A smaller allocation to the health care sector and larger allocations to the communication services and utilities sectors buoyed the Fund’s relative results during the annual period.Individual holdings
| Positions in Philip Morris International, Inc., a tobacco and nicotine products company; Tenet Healthcare Corp., a hospital operator and healthcare services company; Williams Companies, Inc., a natural gas pipeline operator; UnitedHealth Group, a health insurance and healthcare services company; and Corning, Inc., a technology company specializing in glass, ceramics and related materials, were among the top relative contributors to Fund performance.Top Performance Detractors
Stock selection
Allocations
| A larger weighting to the energy sector and smaller weightings to the financials and consumer staples sectors detracted from relative results.Individual holdings
| Fund positions in AES Corp., an independent power provider; Freeport-McMoRan, Inc., a copper mining company; Qualcomm, Inc., a semiconductor company that provides chips and software for mobile phones and other devices; Applied Materials, Inc., a semiconductor fabrication equipment supplier; and Humana, Inc., a health insurance company, were among the top relative detractors during the period.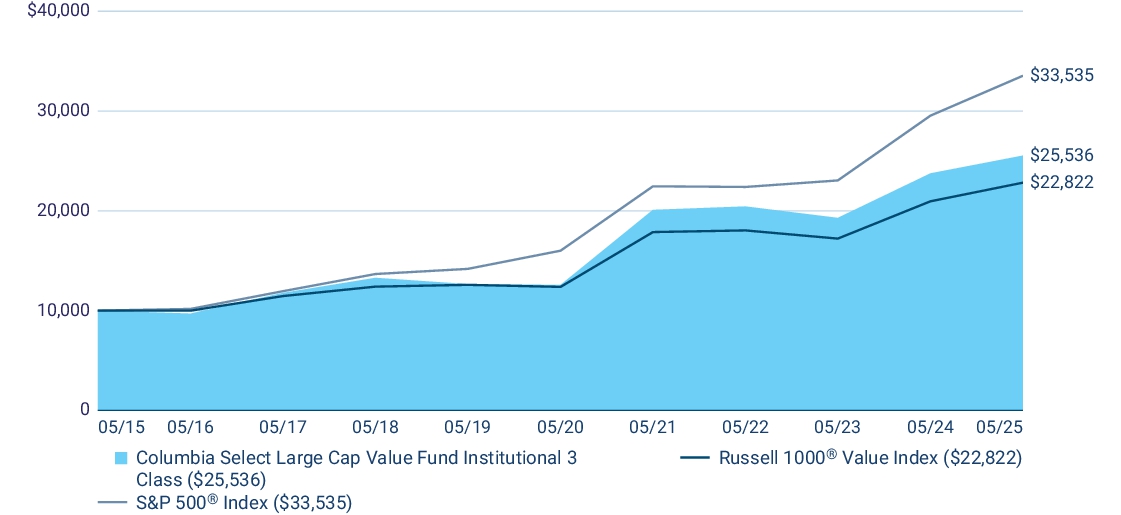
| Average Annual Total Returns (%) | 1 year | 5 years | 10 years |
| Institutional 3 Class | 7.50 | 15.22 | 9.83 |
| Russell 1000 ® Value Index | 8.91 | 13.02 | 8.60 |
| S&P 500 ® Index | 13.52 | 15.94 | 12.86 |
columbiathreadneedleus.com/investment-products/mutual-funds
for more recent performance information.
Key Fund Statistics
Fund net assets | $ 2,345,660,346 |
Total number of portfolio holdings | 38 |
Management services fees (represents 0.67% of Fund average net assets) | $ 16,008,828 |
Portfolio turnover for the reporting period | 28% |
Graphical Representation of Fund Holdings
The tables below show the investment makeup of the Fund represented as a percentage of Fund net assets. Derivatives are excluded from the tables unless otherwise noted. The Fund's portfolio composition is subject to change.
Top Holdings
| Verizon Communications, Inc. | 3.8 % |
| Corning, Inc. | 3.7 % |
| Boeing Co. (The) | 3.4 % |
| Applied Materials, Inc. | 3.4 % |
| Freeport-McMoRan, Inc. | 3.4 % |
| Tenet Healthcare Corp. | 3.4 % |
| PG&E Corp. | 3.1 % |
| Lowe's Companies, Inc. | 3.1 % |
| EPAM Systems, Inc. | 3.1 % |
| Citigroup, Inc. | 3.1 % |
Asset Categories

Equity Sector Allocation

Top Holdings
| Verizon Communications, Inc. | 3.8 % |
| Corning, Inc. | 3.7 % |
| Boeing Co. (The) | 3.4 % |
| Applied Materials, Inc. | 3.4 % |
| Freeport-McMoRan, Inc. | 3.4 % |
| Tenet Healthcare Corp. | 3.4 % |
| PG&E Corp. | 3.1 % |
| Lowe's Companies, Inc. | 3.1 % |
| EPAM Systems, Inc. | 3.1 % |
| Citigroup, Inc. | 3.1 % |
columbiathreadneedleus.com/resources/literature
. You can also request more information by contacting us at 1-800-345-6611.
What were the Fund costs for the reporting period?
(Based on a hypothetical $10,000 investment)
| Class | Cost of a $10,000 investment | Cost paid as a percentage of a $10,000 investment |
| Class R | $ 108 | 1.05 % |
Management's Discussion of Fund Performance
The performance of Class R shares for the period presented is shown in the Average Annual Total Returns table.
Top Performance Contributors
Stock selection
| Selections in the energy, health care and consumer staples sectors boosted the Fund’s relative results most during the annual period.Allocations
| A smaller allocation to the health care sector and larger allocations to the communication services and utilities sectors buoyed the Fund’s relative results during the annual period.Individual holdings
| Positions in Philip Morris International, Inc., a tobacco and nicotine products company; Tenet Healthcare Corp., a hospital operator and healthcare services company; Williams Companies, Inc., a natural gas pipeline operator; UnitedHealth Group, a health insurance and healthcare services company; and Corning, Inc., a technology company specializing in glass, ceramics and related materials, were among the top relative contributors to Fund performance.Top Performance Detractors
Stock selection
Allocations
| A larger weighting to the energy sector and smaller weightings to the financials and consumer staples sectors detracted from relative results.Individual holdings
| Fund positions in AES Corp., an independent power provider; Freeport-McMoRan, Inc., a copper mining company; Qualcomm, Inc., a semiconductor company that provides chips and software for mobile phones and other devices; Applied Materials, Inc., a semiconductor fabrication equipment supplier; and Humana, Inc., a health insurance company, were among the top relative detractors during the period.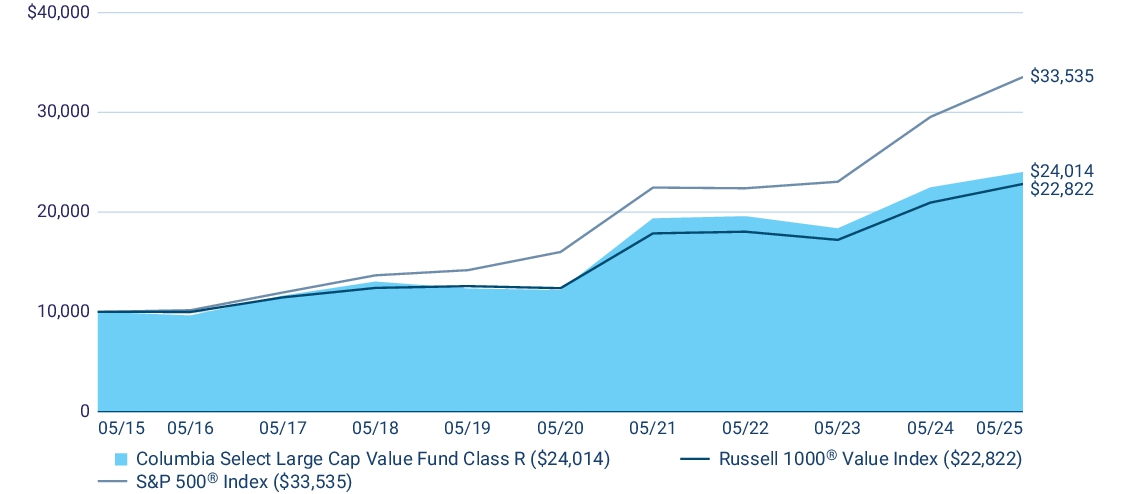
| Average Annual Total Returns (%) | 1 year | 5 years | 10 years |
| Class R | 6.84 | 14.53 | 9.16 |
| Russell 1000 ® Value Index | 8.91 | 13.02 | 8.60 |
| S&P 500 ® Index | 13.52 | 15.94 | 12.86 |
columbiathreadneedleus.com/investment-products/mutual-funds
for more recent performance information.
Key Fund Statistics
Fund net assets | $ 2,345,660,346 |
Total number of portfolio holdings | 38 |
Management services fees (represents 0.67% of Fund average net assets) | $ 16,008,828 |
Portfolio turnover for the reporting period | 28% |
Graphical Represen Holdings
ta
tion of FundThe tables below show the investment makeup of the Fund represented as a percentage of Fund net assets. Derivatives are excluded from the tables unless otherwise noted. The Fund's portfolio composition is subject to change.
Top Holdings
| Verizon Communications, Inc. | 3.8 % |
| Corning, Inc. | 3.7 % |
| Boeing Co. (The) | 3.4 % |
| Applied Materials, Inc. | 3.4 % |
| Freeport-McMoRan, Inc. | 3.4 % |
| Tenet Healthcare Corp. | 3.4 % |
| PG&E Corp. | 3.1 % |
| Lowe's Companies, Inc. | 3.1 % |
| EPAM Systems, Inc. | 3.1 % |
| Citigroup, Inc. | 3.1 % |
Asset Categories
Equity Sector Allocation

Top Holdings
| Verizon Communications, Inc. | 3.8 % |
| Corning, Inc. | 3.7 % |
| Boeing Co. (The) | 3.4 % |
| Applied Materials, Inc. | 3.4 % |
| Freeport-McMoRan, Inc. | 3.4 % |
| Tenet Healthcare Corp. | 3.4 % |
| PG&E Corp. | 3.1 % |
| Lowe's Companies, Inc. | 3.1 % |
| EPAM Systems, Inc. | 3.1 % |
| Citigroup, Inc. | 3.1 % |
columbiathreadneedleus.com/resources/literature
. You can also request more information by contacting us at 1-800-345-6611.
What were the Fund costs for the reporting period?
(Based on a hypothetical $10,000 investment)
| Class | Cost of a $10,000 investment | Cost paid as a percentage of a $10,000 investment |
| Class S | $ 36(a) | 0.55 % (b) |
| (a) | Based on operations from October 2, 2024 (commencement of operations) through the stated period end. Had the class been open for the entire reporting period, expenses shown in the table above would have been higher. |
| (b) | Annualized. |
Management's Discussion of Fund Performance
The performance of Class S shares for the period presented is shown in the Average Annual Total Returns table.
Top Performance Contributors
Stock selection
| Selections in the energy, health care and consumer staples sectors boosted the Fund’s relative results most during the annual period.Allocations
| A smaller allocation to the health care sector and larger allocations to the communication services and utilities sectors buoyed the Fund’s relative results during the annual period.Individual holdings
| Positions in Philip Morris International, Inc., a tobacco and nicotine products company; Tenet Healthcare Corp., a hospital operator and healthcare services company; Williams Companies, Inc., a natural gas pipeline operator; UnitedHealth Group, a health insurance and healthcare services company; and Corning, Inc., a technology company specializing in glass, ceramics and related materials, were among the top relative contributors to Fund performance.Top Performance Detractors
Stock selection
Allocations
| A larger weighting to the energy sector and smaller weightings to the financials and consumer staples sectors detracted from relative results.Individual holdings
| Fund positions in AES Corp., an independent power provider; Freeport-McMoRan, Inc., a copper mining company; Qualcomm, Inc., a semiconductor company that provides chips and software for mobile phones and other devices; Applied Materials, Inc., a semiconductor fabrication equipment supplier; and Humana, Inc., a health insurance company, were among the top relative detractors during the period.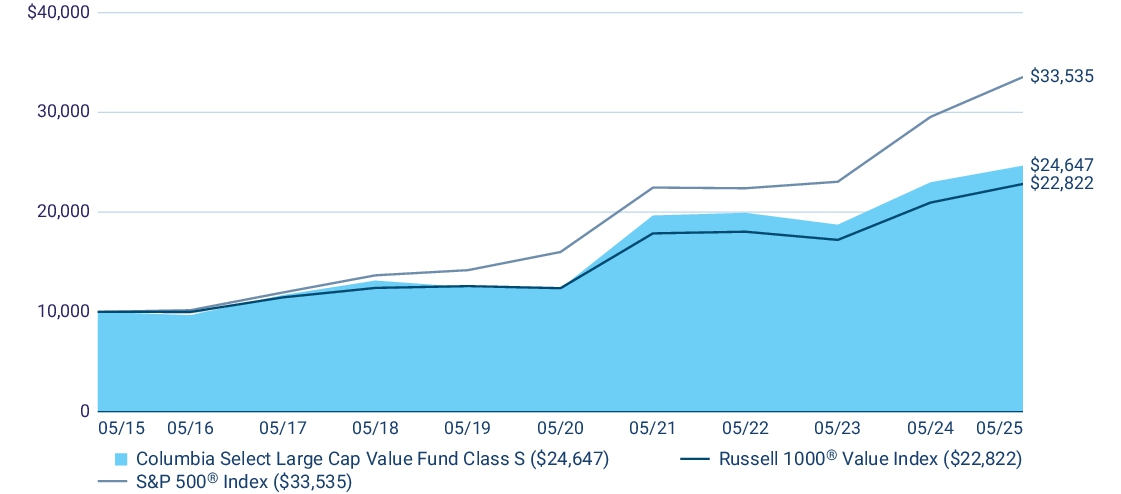
| Average Annual Total Returns (%) | 1 year | 5 years | 10 years |
| Class S (a) | 7.27 | 14.84 | 9.44 |
| Russell 1000 ® Value Index | 8.91 | 13.02 | 8.60 |
| S&P 500 ® Index | 13.52 | 15.94 | 12.86 |
(a) | The returns shown for periods prior to October 2, 2024 (including Since Fund Inception returns, if shown) include the returns of Class A. These returns are adjusted to reflect any higher class-related operating expenses of the newer share classes, as applicable. Please visit columbiathreadneedleus.com/investment-products/mutual-funds/appended-performance for more information. |
columbiathreadneedleus.com/investment-products/mutual-funds/appended-performance
for more information.
columbiathreadneedleus.com/investment-products/mutual-funds
for more recent performance information.
Key Fund Statistics
Fund net assets | $ 2,345,660,346 |
Total number of portfolio holdings | 38 |
Management services fees (represents 0.67% of Fund average net assets) | $ 16,008,828 |
Portfolio turnover for the reporting period | 28% |
Graphical Representation of Fund Holdings
The tables below show the investment makeup of the Fund repr
esent
ed as a percentage of Fund net assets. Derivatives are excluded from the tables unless otherwise noted. The Fund's portfolio composition is subject to change.Top Holdings
| Verizon Communications, Inc. | 3.8 % |
| Corning, Inc. | 3.7 % |
| Boeing Co. (The) | 3.4 % |
| Applied Materials, Inc. | 3.4 % |
| Freeport-McMoRan, Inc. | 3.4 % |
| Tenet Healthcare Corp. | 3.4 % |
| PG&E Corp. | 3.1 % |
| Lowe's Companies, Inc. | 3.1 % |
| EPAM Systems, Inc. | 3.1 % |
| Citigroup, Inc. | 3.1 % |
Asset Categories

Equity Sector Allocation
Top Holdings
| Verizon Communications, Inc. | 3.8 % |
| Corning, Inc. | 3.7 % |
| Boeing Co. (The) | 3.4 % |
| Applied Materials, Inc. | 3.4 % |
| Freeport-McMoRan, Inc. | 3.4 % |
| Tenet Healthcare Corp. | 3.4 % |
| PG&E Corp. | 3.1 % |
| Lowe's Companies, Inc. | 3.1 % |
| EPAM Systems, Inc. | 3.1 % |
| Citigroup, Inc. | 3.1 % |
| [1] | Based on operations from October 2, 2024 (commencement of operations) through the stated period end. Had the class been open for the entire reporting period, expenses shown in the table above would have been higher. |
| [2] | Annualized. |