Shareholder Report
May 31, 2025
USD ($)
Holding
columbiathreadneedleus.com/resources/literature
. You can also request more information by contacting us at 1-800-345-6611.
What were the Fund costs for the reporting period?
(Based on a hypothetical $10,000 investment)
| Class | Cost of a $10,000 investment | Cost paid as a percentage of a $10,000 investment |
| Class A | $ 119 | 1.16 % |
Management's Discussion of Fund Performance
The performance of Class A shares for the period presented is shown in the Average Annual Total Returns table.
Top Performance Contributors
Stock selection
| Selections in the consumer discretionary sector, communications equipment and media industries contributed to the Fund’s results most during the annual period.Allocations
| Allocations to technology hardware storage & peripherals, electronic equipment instruments & components, industrials, broadline retail and communications equipment all contributed to relative performance.Individual holdings
| Positions in Broadcom, Inc., a semiconductor chip manufacturer; eBay, Inc., an online retailer; F5, Inc., an application security and cloud management company; GoDaddy, Inc., an internet domain registry company; and Visa, Inc., a digital payment processor, all contributed to relative performance versus the benchmark.Top Performance Detractors
Stock selection
Allocations
| Underweight allocations to the software and IT services industries as well as an overweight allocation to the semiconductors & semiconductor equipment and financial services industries detracted from relative performance.Individual holdings
| Fund positions in Teradyne, Inc., a semiconductor test equipment company; Meta Platforms, Inc., a multinational technology company; Synaptics, Inc., a neural network and computer to human interface company; Global Payments, Inc., a merchant payment processing company; and Lam Research Corp., a supplier of semiconductor manufacturing equipment, all detracted from relative performance during the year.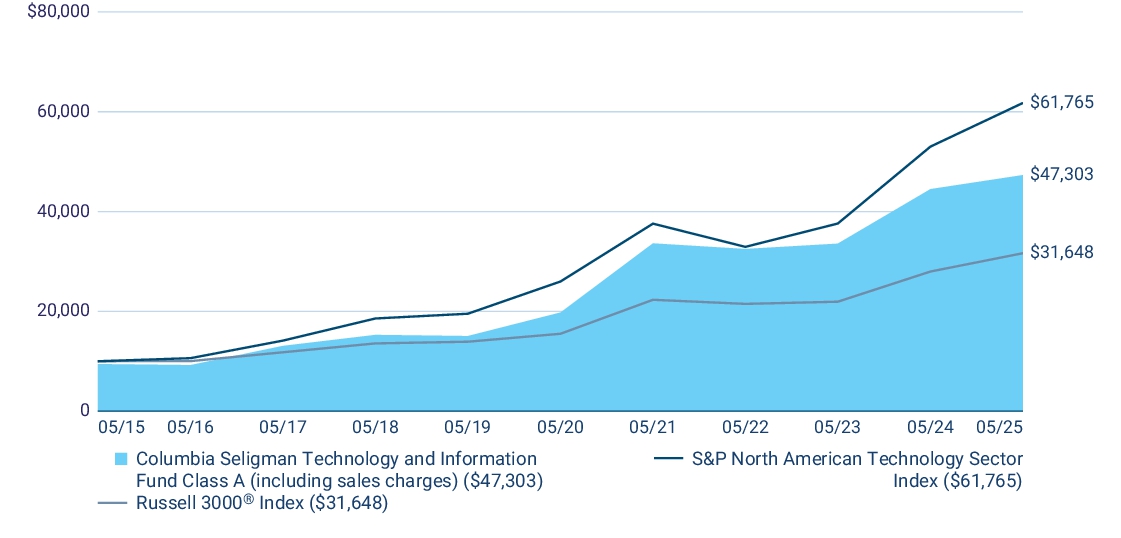
| Average Annual Total Returns (%) | 1 year | 5 years | 10 years |
| Class A (excluding sales charges) | 6.33 | 19.07 | 17.51 |
| Class A (including sales charges) | 0.22 | 17.67 | 16.81 |
| S&P North American Technology Sector Index | 16.50 | 18.91 | 19.97 |
| Russell 3000 ® Index | 13.12 | 15.34 | 12.21 |
columbiathreadneedleus.com/investment-products/mutual-funds
for more recent performance information.
Key Fund Statistics
Fund net assets | $ 12,975,092,985 |
Total number of portfolio holdings | 64 |
Management services fees (represents 0.81% of Fund average net assets) | $ 108,081,392 |
Portfolio turnover for the reporting period | 33% |
Graphical Representation of Fund Holdings
The tables below show the investment makeup of the Fund represented as a percentage of Fund net assets. Derivatives are excluded from the tables unless otherwise noted. The Fund's portfolio composition is subject to change.
Top Holdings
| Broadcom, Inc. | 6.8 % |
| NVIDIA Corp. | 5.8 % |
| Lam Research Corp. | 5.6 % |
| Microsoft Corp. | 5.6 % |
| Alphabet, Inc., Class A | 4.3 % |
| Bloom Energy Corp., Class A | 3.9 % |
| Apple, Inc. | 3.5 % |
| Visa, Inc., Class A | 3.3 % |
| Applied Materials, Inc. | 3.0 % |
| Meta Platforms, Inc., Class A | 2.8 % |
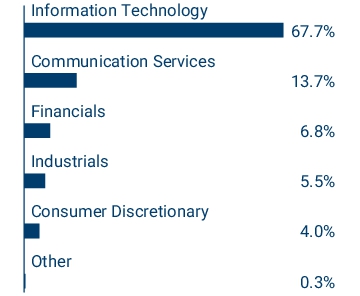
Equity Sector Allocation

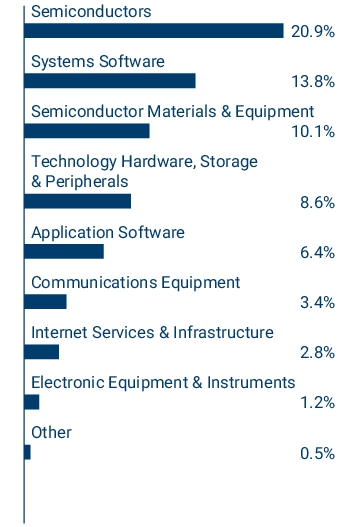
Information Technology Sub-industry Allocation

Top Holdings
| Broadcom, Inc. | 6.8 % |
| NVIDIA Corp. | 5.8 % |
| Lam Research Corp. | 5.6 % |
| Microsoft Corp. | 5.6 % |
| Alphabet, Inc., Class A | 4.3 % |
| Bloom Energy Corp., Class A | 3.9 % |
| Apple, Inc. | 3.5 % |
| Visa, Inc., Class A | 3.3 % |
| Applied Materials, Inc. | 3.0 % |
| Meta Platforms, Inc., Class A | 2.8 % |
columbiathreadneedleus.com/resources/literature
. You can also request more information by contacting us at 1-800-345-6611.
What were the Fund costs for the reporting period?
(Based on a hypothetical $10,000 investment)
| Class | Cost of a $10,000 investment | Cost paid as a percentage of a $10,000 investment |
| Class C | $ 196 | 1.91 % |
Management's Discussion of Fund Performance
The performance of Class C shares for the period presented is shown in the Average Annual Total Returns table.
Top Performance Contributors
Stock selection
| Selections in the consumer discretionary sector, communications equipment and media industries contributed to the Fund’s results most during the annual period.Allocations
| Allocations to technology hardware storage & peripherals, electronic equipment instruments & components, industrials, broadline retail and communications equipment all contributed to relative performance.Individual holdings
| Positions in Broadcom, Inc., a semiconductor chip manufacturer; eBay, Inc., an online retailer; F5, Inc., an application security and cloud management company; GoDaddy, Inc., an internet domain registry company; and Visa, Inc., a digital payment processor, all contributed to relative performance versus the benchmark.Top Performance Detractors
Stock selection
Allocations
| Underweight allocations to the software and IT services industries as well as an overweight allocation to the semiconductors & semiconductor equipment and financial services industries detracted from relative performance.Individual holdings
| Fund positions in Teradyne, Inc., a semiconductor test equipment company; Meta Platforms, Inc., a multinational technology company; Synaptics, Inc., a neural network and computer to human interface company; Global Payments, Inc., a merchant payment processing company; and Lam Research Corp., a supplier of semiconductor manufacturing equipment, all detracted from relative performance during the year.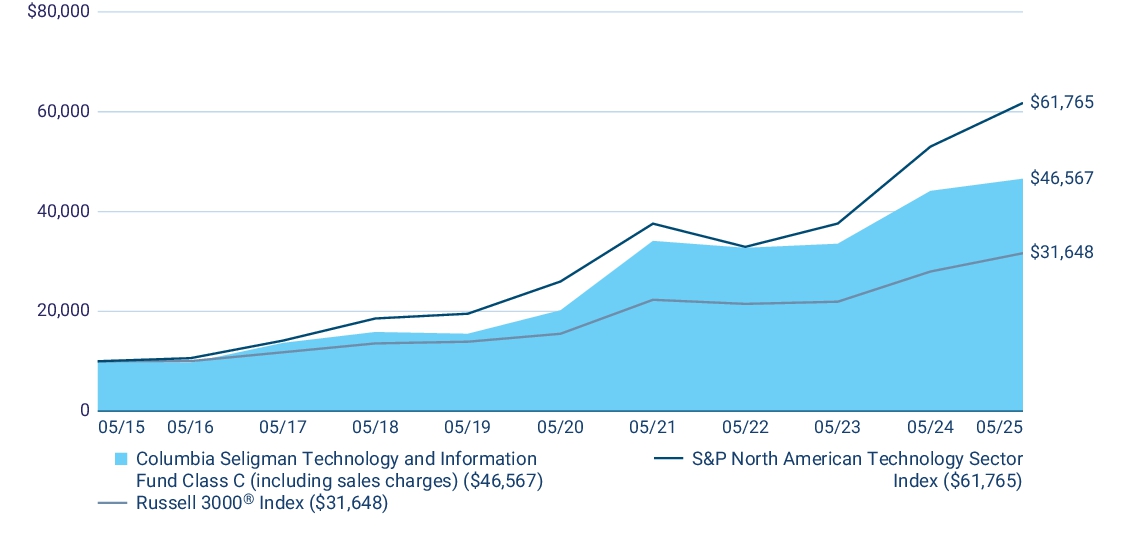
| Average Annual Total Returns (%) | 1 year | 5 years | 10 years |
| Class C (excluding sales charges) | 5.54 | 18.19 | 16.63 |
| Class C (including sales charges) | 4.76 | 18.19 | 16.63 |
| S&P North American Technology Sector Index | 16.50 | 18.91 | 19.97 |
| Russell 3000 ® Index | 13.12 | 15.34 | 12.21 |
columbiathreadneedleus.com/investment-products/mutual-funds
for more recent performance information.
Key Fund Statistics
Fund net assets | $ 12,975,092,985 |
Total number of portfolio holdings | 64 |
Management services fees (represents 0.81% of Fund average net assets) | $ 108,081,392 |
Portfolio turnover for the reporting period | 33% |
Graphical Representation of Fund Holdings
The tables below show the investment makeup of the Fund represented as a percentage of Fund net assets. Derivatives are excluded from the tables unless otherwise noted. The Fund's portfolio composition is subject to change.
Top Holdings
| Broadcom, Inc. | 6.8 % |
| NVIDIA Corp. | 5.8 % |
| Lam Research Corp. | 5.6 % |
| Microsoft Corp. | 5.6 % |
| Alphabet, Inc., Class A | 4.3 % |
| Bloom Energy Corp., Class A | 3.9 % |
| Apple, Inc. | 3.5 % |
| Visa, Inc., Class A | 3.3 % |
| Applied Materials, Inc. | 3.0 % |
| Meta Platforms, Inc., Class A | 2.8 % |
Equity Sector Allocation

Information Technology Sub-industry Allocation

Top Holdings
| Broadcom, Inc. | 6.8 % |
| NVIDIA Corp. | 5.8 % |
| Lam Research Corp. | 5.6 % |
| Microsoft Corp. | 5.6 % |
| Alphabet, Inc., Class A | 4.3 % |
| Bloom Energy Corp., Class A | 3.9 % |
| Apple, Inc. | 3.5 % |
| Visa, Inc., Class A | 3.3 % |
| Applied Materials, Inc. | 3.0 % |
| Meta Platforms, Inc., Class A | 2.8 % |
columbiathreadneedleus.com/resources/literature
. You can also request more information by contacting us at 1-800-345-6611.
What were the Fund costs for the reporting period?
(Based on a hypothetical $10,000 investment)
| Class | Cost of a $10,000 investment | Cost paid as a percentage of a $10,000 investment |
| Institutional Class | $ 94 | 0.91 % |
Management's Discussion of Fund Performance
The performance of Institutional Class shares for the period presented is shown in the Average Annual Total Returns table.
Top Performance Contributors
Stock selection
| Selections in the consumer discretionary sector, communications equipment and media industries contributed to the Fund’s results most during the annual period.Allocations
| Allocations to technology hardware storage & peripherals, electronic equipment instruments & components, industrials, broadline retail and communications equipment all contributed to relative performance.Individual holdings
| Positions in Broadcom, Inc., a semiconductor chip manufacturer; eBay, Inc., an online retailer; F5, Inc., an application security and cloud management company; GoDaddy, Inc., an internet domain registry company; and Visa, Inc., a digital payment processor, all contributed to relative performance versus the benchmark.Top Performance Detractors
Stock selection
Allocations
| Underweight allocations to the software and IT services industries as well as an overweight allocation to the semiconductors & semiconductor equipment and financial services industries detracted from relative performance.Individual holdings
| Fund positions in Teradyne, Inc., a semiconductor test equipment company; Meta Platforms, Inc., a multinational technology company; Synaptics, Inc., a neural network and computer to human interface company; Global Payments, Inc., a merchant payment processing company; and Lam Research Corp., a supplier of semiconductor manufacturing equipment, all detracted from relative performance during the year.
| Average Annual Total Returns (%) | 1 year | 5 years | 10 years |
| Institutional Class | 6.60 | 19.37 | 17.80 |
| S&P North American Technology Sector Index | 16.50 | 18.91 | 19.97 |
| Russell 3000 ® Index | 13.12 | 15.34 | 12.21 |
columbiathreadneedleus.com/investment-products/mutual-funds
for more recent performance information.
Key Fund Statistics
Fund net assets | $ 12,975,092,985 |
Total number of portfolio holdings | 64 |
Management services fees (represents 0.81% of Fund average net assets) | $ 108,081,392 |
Portfolio turnover for the reporting period | 33% |
Graphical Representation of Fund Holdings
The tables below show the investment makeup of the Fund represented as a percentage of Fund net assets. Derivatives are excluded from the tables unless otherwise noted. The Fund's portfolio composition is subject to change.
Top Holdings
| Broadcom, Inc. | 6.8 % |
| NVIDIA Corp. | 5.8 % |
| Lam Research Corp. | 5.6 % |
| Microsoft Corp. | 5.6 % |
| Alphabet, Inc., Class A | 4.3 % |
| Bloom Energy Corp., Class A | 3.9 % |
| Apple, Inc. | 3.5 % |
| Visa, Inc., Class A | 3.3 % |
| Applied Materials, Inc. | 3.0 % |
| Meta Platforms, Inc., Class A | 2.8 % |
Equity Sector Allocation

Information Technology Sub-industry Allocation
Top Holdings
| Broadcom, Inc. | 6.8 % |
| NVIDIA Corp. | 5.8 % |
| Lam Research Corp. | 5.6 % |
| Microsoft Corp. | 5.6 % |
| Alphabet, Inc., Class A | 4.3 % |
| Bloom Energy Corp., Class A | 3.9 % |
| Apple, Inc. | 3.5 % |
| Visa, Inc., Class A | 3.3 % |
| Applied Materials, Inc. | 3.0 % |
| Meta Platforms, Inc., Class A | 2.8 % |
columbiathreadneedleus.com/resources/literature
. You can also request more information by contacting us at 1-800-345-6611.
What were the Fund costs for the reporting period?
(Based on a hypothetical $10,000 investment)
| Class | Cost of a $10,000 investment | Cost paid as a percentage of a $10,000 investment |
| Institutional 2 Class | $ 90 | 0.87 % |
Management's Discussion of Fund Performance
The performance of Institutional 2 Class shares for the period presented is shown in the Average Annual Total Returns table.
Top Performance Contributors
Stock selection
| Selections in the consumer discretionary sector, communications equipment and media industries contributed to the Fund’s results most during the annual period.Allocations
| Allocations to technology hardware storage & peripherals, electronic equipment instruments & components, industrials, broadline retail and communications equipment all contributed to relative performance.Individual holdings
| Positions in Broadcom, Inc., a semiconductor chip manufacturer; eBay, Inc., an online retailer; F5, Inc., an application security and cloud management company; GoDaddy, Inc., an internet domain registry company; and Visa, Inc., a digital payment processor, all contributed to relative performance versus the benchmark.Top Performance Detractors
Stock selection
Allocations
| Underweight allocations to the software and IT services industries as well as an overweight allocation to the semiconductors & semiconductor equipment and financial services industries detracted from relative performance.Individual holdings
| Fund positions in Teradyne, Inc., a semiconductor test equipment company; Meta Platforms, Inc., a multinational technology company; Synaptics, Inc., a neural network and computer to human interface company; Global Payments, Inc., a merchant payment processing company; and Lam Research Corp., a supplier of semiconductor manufacturing equipment, all detracted from relative performance during the year.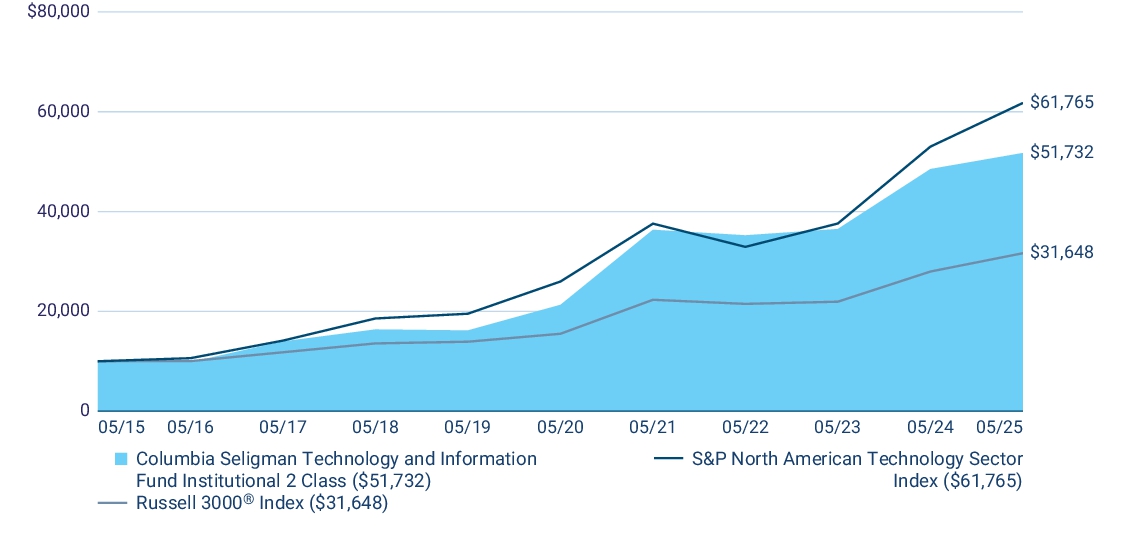
| Average Annual Total Returns (%) | 1 year | 5 years | 10 years |
| Institutional 2 Class | 6.63 | 19.41 | 17.86 |
| S&P North American Technology Sector Index | 16.50 | 18.91 | 19.97 |
| Russell 3000 ® Index | 13.12 | 15.34 | 12.21 |
columbiathreadneedleus.com/investment-products/mutual-funds
for more recent perform
ance information.
Key Fund Statistics
Fund net assets | $ 12,975,092,985 |
Total number of portfolio holdings | 64 |
Management services fees (represents 0.81% of Fund average net assets) | $ 108,081,392 |
Portfolio turnover for the reporting period | 33% |
Graphical Representation of Fund Holdings
The tables below show the investment makeup of the Fund represented as a percentage of Fund net assets. Derivatives are excluded from the tables unless otherwise noted. The Fund's portfolio composition is subject to change.
Top Holdings
| Broadcom, Inc. | 6.8 % |
| NVIDIA Corp. | 5.8 % |
| Lam Research Corp. | 5.6 % |
| Microsoft Corp. | 5.6 % |
| Alphabet, Inc., Class A | 4.3 % |
| Bloom Energy Corp., Class A | 3.9 % |
| Apple, Inc. | 3.5 % |
| Visa, Inc., Class A | 3.3 % |
| Applied Materials, Inc. | 3.0 % |
| Meta Platforms, Inc., Class A | 2.8 % |
Equity Sector Allocation

Information Technology Sub-industry Allocation

Top Holdings
| Broadcom, Inc. | 6.8 % |
| NVIDIA Corp. | 5.8 % |
| Lam Research Corp. | 5.6 % |
| Microsoft Corp. | 5.6 % |
| Alphabet, Inc., Class A | 4.3 % |
| Bloom Energy Corp., Class A | 3.9 % |
| Apple, Inc. | 3.5 % |
| Visa, Inc., Class A | 3.3 % |
| Applied Materials, Inc. | 3.0 % |
| Meta Platforms, Inc., Class A | 2.8 % |
annual shareholder report
contains important information about Columbia Seligman Technology and Information Fund (the Fund) for the period of June 1, 2024 to May 31, 2025.
columbiathreadneedleus
.com/resources/literature1-800-345-6611.
What were the Fund costs for the reporting period?
(Based on a hypothetical $10,000 investment)
| Class | Cost of a $10,000 investment | Cost paid as a percentage of a $10,000 investment |
| Institutional 3 Class | $ 86 | 0.83 % |
Management's Discussion of Fund Performance
The performance of Institutional 3 Class shares for the period presented is shown in the Average Annual Total Returns table.
Top Performance Contributors
Stock selection
| Selections in the consumer discretionary sector, communications equipment and media industries contributed to the Fund’s results most during the annual period.Allocations
| Allocations to technology hardware storage & peripherals, electronic equipment instruments & components, industrials, broadline retail and communications equipment all contributed to relative performance.Individual holdings
| Positions in Broadcom, Inc., a semiconductor chip manufacturer; eBay, Inc., an online retailer; F5, Inc., an application security and cloud management company; GoDaddy, Inc., an internet domain registry company; and Visa, Inc., a digital payment processor, all contributed to relative performance versus the benchmark.Top Performance Detractors
Stock selection
Allocations
| Underweight allocations to the software and IT services industries as well as an overweight allocation to the semiconductors & semiconductor equipment and financial services industries detracted from relative performance.Individual holdings
| Fund positions in Teradyne, Inc., a semiconductor test equipment company; Meta Platforms, Inc., a multinational technology company; Synaptics, Inc., a neural network and computer to human interface company; Global Payments, Inc., a merchant payment processing company; and Lam Research Corp., a supplier of semiconductor manufacturing equipment, all detracted from relative performance during the year.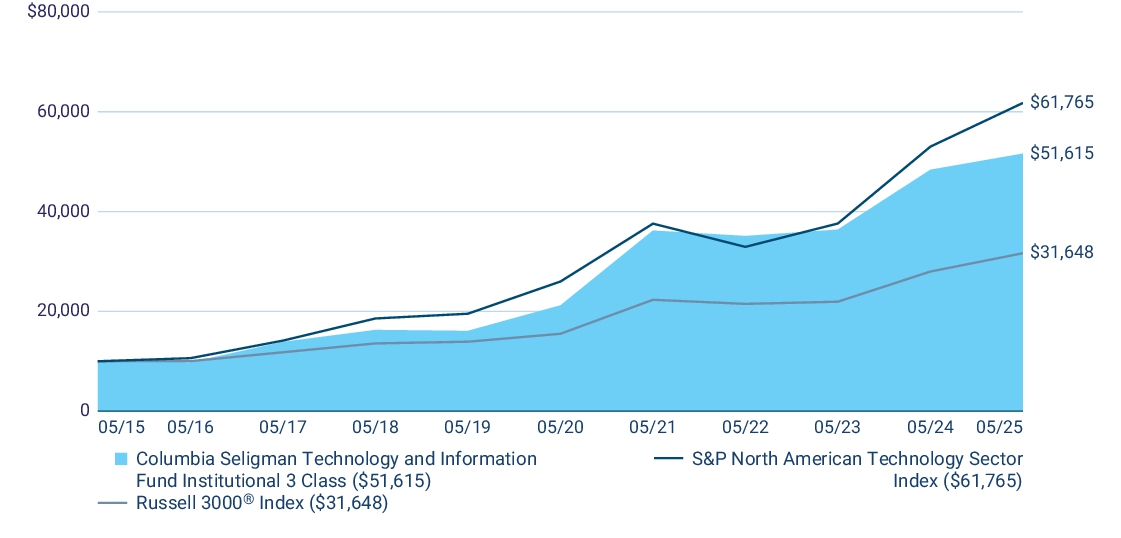
| Average Annual Total Returns (%) | 1 year | 5 years | 10 years |
| Institutional 3 Class (a) | 6.68 | 19.47 | 17.84 |
| S&P North American Technology Sector Index | 16.50 | 18.91 | 19.97 |
| Russell 3000 ® Index | 13.12 | 15.34 | 12.21 |
(a) | The returns shown for periods prior to March 1, 2017 (including Since Fund Inception returns, if shown) include the returns of Class A. These returns are adjusted to reflect any higher class-related operating expenses of the newer share classes, as applicable. Please visit columbiathreadneedleus.com/investment-products/mutual-funds/appended-performance for more information. |
columbiathreadneedleus.com/investment-products/mutual-funds
for more recent performance information.
Key Fund Statistics
Fund net a sset s | $ 12,975,092,985 |
Total number of portfolio holdings | 64 |
Management services fees (represents 0.81% of Fund average net assets) | $ 108,081,392 |
Portfolio turnover for the reporting period | 33% |
Graphical Representation of Fund Holdings
The tables below show the inve
stment m
akeup of the Fund represented as a percentage of Fund net assets. Derivatives are excluded from the tables unless otherwise noted. The
Fund's portfolio composition is subject to change.Top Holdings
| Broadcom, Inc. | 6.8 % |
| NVIDIA Corp. | 5.8 % |
| Lam Research Corp. | 5.6 % |
| Microsoft Corp. | 5.6 % |
| Alphabet, Inc., Class A | 4.3 % |
| Bloom Energy Corp., Class A | 3.9 % |
| Apple, Inc. | 3.5 % |
| Visa, Inc., Class A | 3.3 % |
| Applied Materials, Inc. | 3.0 % |
| Meta Platforms, Inc., Class A | 2.8 % |
Equity Sector Allocation
Information Technology Sub-industry Allocation

Top Holdings
| Broadcom, Inc. | 6.8 % |
| NVIDIA Corp. | 5.8 % |
| Lam Research Corp. | 5.6 % |
| Microsoft Corp. | 5.6 % |
| Alphabet, Inc., Class A | 4.3 % |
| Bloom Energy Corp., Class A | 3.9 % |
| Apple, Inc. | 3.5 % |
| Visa, Inc., Class A | 3.3 % |
| Applied Materials, Inc. | 3.0 % |
| Meta Platforms, Inc., Class A | 2.8 % |
columbiathreadneedleus.com/resources/literature
. You can also request more information by contacting us at 1-800-345-6611.
What were the Fund costs for the reporting period?
(Based on a hypothetical $10,000 investment)
| Class | Cost of a $10,000 investment | Cost paid as a percentage of a $10,000 investment |
| Class R | $ 145 | 1.41 % |
Management's Discussion of Fund Performance
The performance of Class R shares for the period presented is shown in the Average Annual Total Returns table.
Top Performance Contributors
Stock selection
| Selections in the consumer discretionary sector, communications equipment and media industries contributed to the Fund’s results most during the annual period.Allocations
| Allocations to technology hardware storage & peripherals, electronic equipment instruments & components, industrials, broadline retail and communications equipment all contributed to relative performance.Individual holdings
| Positions in Broadcom, Inc., a semiconductor chip manufacturer; eBay, Inc., an online retailer; F5, Inc., an application security and cloud management company; GoDaddy, Inc., an internet domain registry company; and Visa, Inc., a digital payment processor, all contributed to relative performance versus the benchmark.Top Performance Detractors
Stock selection
Allocations
| Underweight allocations to the software and IT services industries as well as an overweight allocation to the semiconductors & semiconductor equipment and financial services industries detracted from relative performance.Individual holdings
| Fund positions in Teradyne, Inc., a semiconductor test equipment company; Meta Platforms, Inc., a multinational technology company; Synaptics, Inc., a neural network and computer to human interface company; Global Payments, Inc., a merchant payment processing company; and Lam Research Corp., a supplier of semiconductor manufacturing equipment, all detracted from relative performance during the year.
| Average Annual Total Returns (%) | 1 year | 5 years | 10 years |
| Class R | 6.06 | 18.78 | 17.21 |
| S&P North American Technology Sector Index | 16.50 | 18.91 | 19.97 |
| Russell 3000 ® Index | 13.12 | 15.34 | 12.21 |
columbiathreadneedleus.com/investment-products/mutual-funds
for more recent performance information.
Fund net assets | $ 12,975,092,985 |
Total number of portfolio holdings | 64 |
Management services fees (represents 0.81% of Fund average net assets) | $ 108,081,392 |
Portfolio turnover for the reporting period | 33% |
Graphical Representation of Fund Holdings
The tables below show the investment makeup of the Fu
nd repre
sented as a percentage of Fund net assets. Derivatives are excluded from the tables unless otherwise noted. The Fund's portfolio co
mposition is subject to change.Top Holdings
| Broadcom, Inc. | 6.8 % |
| NVIDIA Corp. | 5.8 % |
| Lam Research Corp. | 5.6 % |
| Microsoft Corp. | 5.6 % |
| Alphabet, Inc., Class A | 4.3 % |
| Bloom Energy Corp., Class A | 3.9 % |
| Apple, Inc. | 3.5 % |
| Visa, Inc., Class A | 3.3 % |
| Applied Materials, Inc. | 3.0 % |
| Meta Platforms, Inc., Class A | 2.8 % |
Equity Sector Allocation

Information Technology Sub-industry Allocation

Top Holdings
| Broadcom, Inc. | 6.8 % |
| NVIDIA Corp. | 5.8 % |
| Lam Research Corp. | 5.6 % |
| Microsoft Corp. | 5.6 % |
| Alphabet, Inc., Class A | 4.3 % |
| Bloom Energy Corp., Class A | 3.9 % |
| Apple, Inc. | 3.5 % |
| Visa, Inc., Class A | 3.3 % |
| Applied Materials, Inc. | 3.0 % |
| Meta Platforms, Inc., Class A | 2.8 % |
columbiathreadneedleus.com/resources/literature
. You can also request more information by contacting us at 1-800-345-6611.
What were the Fund costs for the reporting period?
(Based on a hypothetical $10,000 investment)
| Class | Cost of a $10,000 investment | Cost paid as a percentage of a $10,000 investment |
| Class S | $ 61(a) | 0.92 % (b) |
| (a) | Based on operations from October 2, 2024 (commencement of operations) through the stated period end. Had the class been open for the entire reporting period, expenses shown in the table above would have been higher. |
| (b) | Annualized. |
Management's Discussion of Fund Performance
The performance of Class S shares for the period presented is shown in the Average Annual Total Returns table.
Top Performance Contributors
Stock selection
| Selections in the consumer discretionary sector, communications equipment and media industries contributed to the Fund’s results most during the annual period.Allocations
| Allocations to technology hardware storage & peripherals, electronic equipment instruments & components, industrials, broadline retail and communications equipment all contributed to relative performance.Individual holdings
| Positions in Broadcom, Inc., a semiconductor chip manufacturer; eBay, Inc., an online retailer; F5, Inc., an application security and cloud management company; GoDaddy, Inc., an internet domain registry company; and Visa, Inc., a digital payment processor, all contributed to relative performance versus the benchmark.Top Performance Detractors
Stock selection
Allocations
| Underweight allocations to the software and IT services industries as well as an overweight allocation to the semiconductors & semiconductor equipment and financial services industries detracted from relative performance.Individual holdings
| Fund positions in Teradyne, Inc., a semiconductor test equipment company; Meta Platforms, Inc., a multinational technology company; Synaptics, Inc., a neural network and computer to human interface company; Global Payments, Inc., a merchant payment processing company; and Lam Research Corp., a supplier of semiconductor manufacturing equipment, all detracted from relative performance during the year.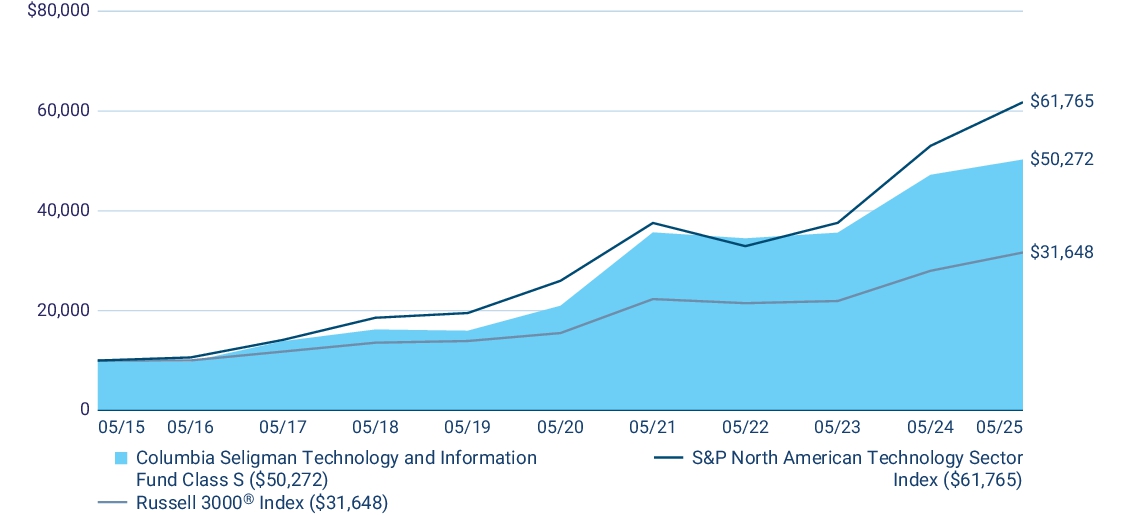
| Average Annual Total Returns (%) | 1 year | 5 years | 10 years |
| Class S (a) | 6.50 | 19.11 | 17.53 |
| S&P North American Technology Sector Index | 16.50 | 18.91 | 19.97 |
| Russell 3000 ® Index | 13.12 | 15.34 | 12.21 |
(a) | The returns shown for periods prior to October 2, 2024 (including Since Fund Inception returns, if shown) include the returns of Class A. These returns are adjusted to reflect any higher class-related operating expenses of the newer share classes, as applicable. Please visit columbiathreadneedleus.com/investment-products/mutual-funds/appended-performance for more information. |
columbiathreadneedleus.com/investment-products/mutual-funds
for more recent performance information.
Key Fund Statistics
Fund net assets | $ 12,975,092,985 |
Total number of portfolio holdings | 64 |
Management services fees (represents 0.81% of Fund average net assets) | $ 108,081,392 |
Portfolio turnover for the reporting period | 33% |
Graphical Representation of Fund Holdings
The tables below show the investment makeup of the Fund represented as a percentage of Fund net assets. Derivatives are excluded from the tables unless ot
herwise not
ed. The Fund's portfolio composition is subject to change.Top Holdings
| Broadcom, Inc. | 6.8 % |
| NVIDIA Corp. | 5.8 % |
| Lam Research Corp. | 5.6 % |
| Microsoft Corp. | 5.6 % |
| Alphabet, Inc., Class A | 4.3 % |
| Bloom Energy Corp., Class A | 3.9 % |
| Apple, Inc. | 3.5 % |
| Visa, Inc., Class A | 3.3 % |
| Applied Materials, Inc. | 3.0 % |
| Meta Platforms, Inc., Class A | 2.8 % |
Equity Sector Allocation

Information Technology Sub-industry Allocation

Top Holdings
| Broadcom, Inc. | 6.8 % |
| NVIDIA Corp. | 5.8 % |
| Lam Research Corp. | 5.6 % |
| Microsoft Corp. | 5.6 % |
| Alphabet, Inc., Class A | 4.3 % |
| Bloom Energy Corp., Class A | 3.9 % |
| Apple, Inc. | 3.5 % |
| Visa, Inc., Class A | 3.3 % |
| Applied Materials, Inc. | 3.0 % |
| Meta Platforms, Inc., Class A | 2.8 % |
| [1] | Based on operations from October 2, 2024 (commencement of operations) through the stated period end. Had the class been open for the entire reporting period, expenses shown in the table above would have been higher. |
| [2] | Annualized. |